understanding and applying nutrition concepts · understanding and applying nutrition concepts to...
TRANSCRIPT

NC STATE UNIVERSITY COLLEGE OF AGRICULTURE & LIFE SCIENCES
Understandingand Applying
NutritionConcepts
TO REDUCENUTRIENT EXCRETION
IN SWINE
Understandingand Applying
NutritionConcepts

Understanding and Applying Nutrition Concepts to Reduce Nutrient Excretion in Swine
22
3
Understanding and Applying Nutrition Concepts to Reduce Nutrient Excretion in Swine
Swine production in the United States haschanged dramatically over the last 50 years.
Specifically, the industry has shifted toward ahighly specialized systems approach, which hasresulted in the concentration of production incertain areas of the country. The disposal ofanimal waste becomes a challenge in the inten-sive production of swine because the amount andnutrient composition of the manure may exceedthe capacity of the land to accept it as a fertilizer.Therefore, alternative methods of animal manuredisposal are needed urgently.
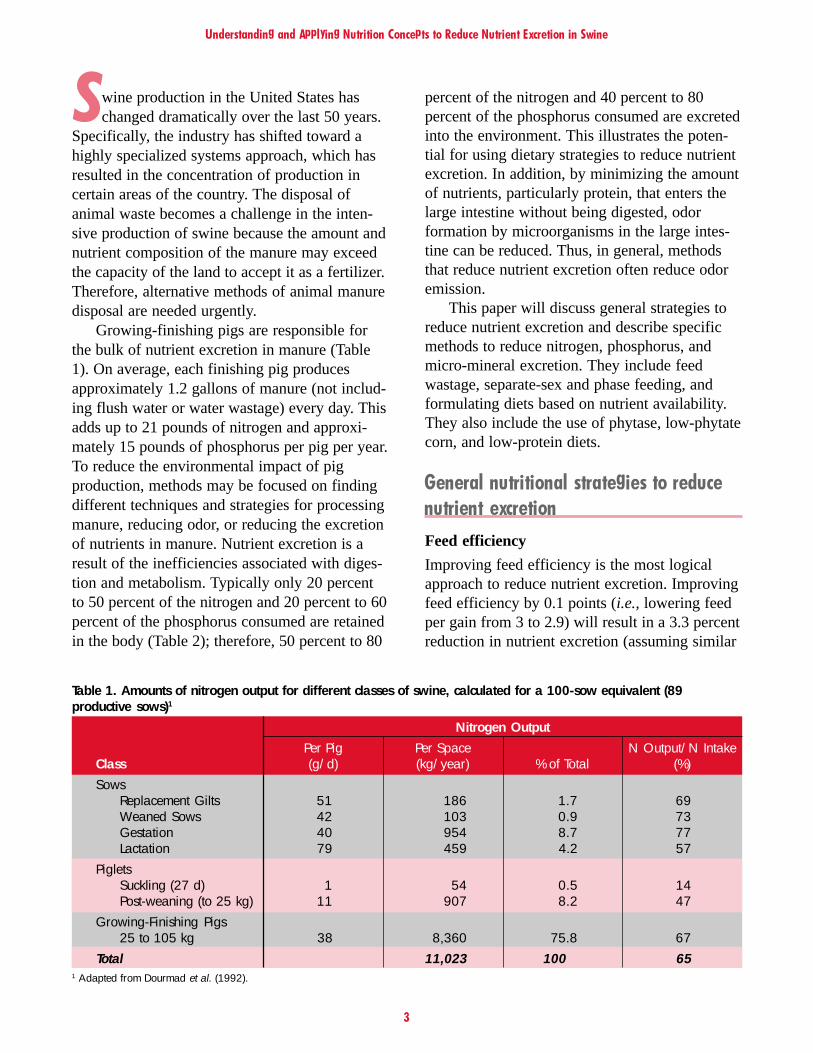
Growing-finishing pigs are responsible forthe bulk of nutrient excretion in manure (Table1). On average, each finishing pig producesapproximately 1.2 gallons of manure (not includ-ing flush water or water wastage) every day. Thisadds up to 21 pounds of nitrogen and approxi-mately 15 pounds of phosphorus per pig per year.To reduce the environmental impact of pigproduction, methods may be focused on findingdifferent techniques and strategies for processingmanure, reducing odor, or reducing the excretionof nutrients in manure. Nutrient excretion is aresult of the inefficiencies associated with diges-tion and metabolism. Typically only 20 percentto 50 percent of the nitrogen and 20 percent to 60percent of the phosphorus consumed are retainedin the body (Table 2); therefore, 50 percent to 80
percent of the nitrogen and 40 percent to 80percent of the phosphorus consumed are excretedinto the environment. This illustrates the poten-tial for using dietary strategies to reduce nutrientexcretion. In addition, by minimizing the amountof nutrients, particularly protein, that enters thelarge intestine without being digested, odorformation by microorganisms in the large intes-tine can be reduced. Thus, in general, methodsthat reduce nutrient excretion often reduce odoremission.
This paper will discuss general strategies toreduce nutrient excretion and describe specificmethods to reduce nitrogen, phosphorus, andmicro-mineral excretion. They include feedwastage, separate-sex and phase feeding, andformulating diets based on nutrient availability.They also include the use of phytase, low-phytatecorn, and low-protein diets.
General nutritional strategies to reducenutrient excretionFeed efficiency
Improving feed efficiency is the most logicalapproach to reduce nutrient excretion. Improvingfeed efficiency by 0.1 points (i.e., lowering feedper gain from 3 to 2.9) will result in a 3.3 percentreduction in nutrient excretion (assuming similar
Table 1. Amounts of nitrogen output for different classes of swine, calculated for a 100-sow equivalent (89productive sows)1
Nitrogen OutputPer Pig Per Space N Output/N Intake
Class (g/d) (kg/year) % of Total (%)Sows
Replacement Gilts 51 186 1.7 69Weaned Sows 42 103 0.9 73Gestation 40 954 8.7 77Lactation 79 459 4.2 57
PigletsSuckling (27 d) 1 54 0.5 14Post-weaning (to 25 kg) 11 907 8.2 47
Growing-Finishing Pigs25 to 105 kg 38 8,360 75.8 67
Total 11,023 100.0 651 Adapted from Dourmad et al. (1992).

Understanding and Applying Nutrition Concepts to Reduce Nutrient Excretion in Swine
4
Table 2. Digestion and retention of nitrogen, phosphorus, copper, and zinc by different classes of swine1
Mineral Nursery Finishing Gestating LactatingNitrogen
Digested, % 75 to 88 75 to 88 88 —Retained, % 40 to 50 30 to 50 35 to 45 20 to 40
PhosphorusDigested, % 20 to 70 20 to 50 30 to 45 10 to 35Retained, % 20 to 60 20 to 45 20 to 45 20
ZincDigested, % 20 to 45 10 to 20 — —
CopperDigested, % 18 to 25 10 to 20 — —
1Adapted from Kornegay and Harper (1997).
growth and nutrient retention). Coffey (1996)stated that feed efficiency for growing-finishingpigs (from 50 pounds to 250 pounds) has im-proved from 4 to less than 2.85 in top-producingherds over the past 20 years. This change can beattributed largely to improvements in geneticsand increased knowledge of nutrition. Thedeposition of lean tissue is more efficient than fatdeposition. Therefore, selection for lean willresult in improved feed efficiency. Using thenumbers mentioned earlier, nutrient excretioncan be reduced by more than 35 percent due toimproving feed efficiency over time. This prob-ably overestimates the impact that the improve-ment in feed efficiency had on nutrient excretionbecause nutrient density of the diets also hasincreased over time. Pelleting of feeds has thepotential to improve feed efficiency and reducenutrient excretion. Wondra et al. (1995) reportedthat pelleting decreased dry matter and nitrogenexcretion in the feces by 23 and 22 percent,respectively. Considering that approximately 20percent to 25 percent of the nitrogen in waste isexcreted in the feces (Figure 1), the overallreduction in nitrogen excretion using pelleteddiets is about 5 percent. Feed efficiency wasimproved by 6.6 percent in that study. Summariz-ing eight trials on pelleting diets for swine,Hancock et al. (1996) concluded that pelletingimproved average daily gain by 6 percent andfeed efficiency by 6 to 7 percent.
Feed wastage
Proper feeder management may be an easy wayto reduce feed wastage and therefore improve
efficiency of feed utilization. First, the type offeeder can affect feed wastage. For example, IanTaylor and Stan Curtis at the University ofIllinois studied 11 self-feeders for pigs thatweighed 50 to 125 pounds. They measured howmuch feed fell on and through the floor andfound that feed wastage ranged from 2.1 to 7.7percent. Researchers in several countries haveestimated feed wastage and have quoted valuesof 4 percent in the United States (with a rangefrom 2 to 12 percent), 6 percent in Great Britain(with a range of 1.5 to 20 percent), and 3 to 5percent in Denmark. Reducing feed wastage by 2percent can save $0.84 per pig marketed (assum-ing a feed efficiency of 3 and a feed cost of $0.07per pound). In addition, a 2 percent reduction infeed wastage can lower the nitrogen and phos-phorus in manure by approximately 3 percent(based on a nitrogen and phosphorus retention of35 percent). For proper feeder adjustment, therule of thumb is that about 50 percent of thebottom of the trough needs to be covered withfeed and the rest needs to be visible.
Matching nutrient requirements
Animals require fewer nutrients as they growheavier due to changes in the maintenancerequirement and the composition of growth (lesslean and more fat). In addition, animals consumemore feed as they grow heavier; therefore, thenutrient composition of their diet can be de-creased as they gain weight. For example, ac-cording to the National Research Council (NRC,1998), a 140-pound pig requires 19.7 grams oftotal lysine compared to a 220-pound pig, which
5
Understanding and Applying Nutrition Concepts to Reduce Nutrient Excretion in Swine
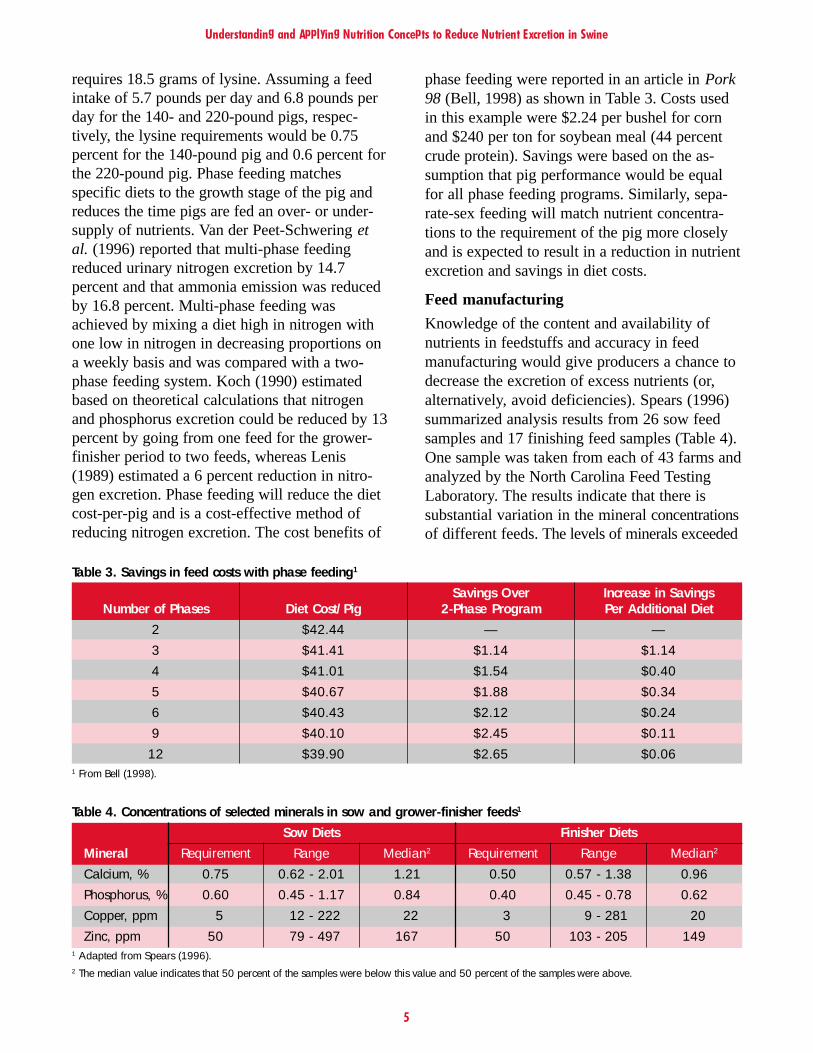
phase feeding were reported in an article in Pork98 (Bell, 1998) as shown in Table 3. Costs usedin this example were $2.24 per bushel for cornand $240 per ton for soybean meal (44 percentcrude protein). Savings were based on the as-sumption that pig performance would be equalfor all phase feeding programs. Similarly, sepa-rate-sex feeding will match nutrient concentra-tions to the requirement of the pig more closelyand is expected to result in a reduction in nutrientexcretion and savings in diet costs.
Feed manufacturing
Knowledge of the content and availability ofnutrients in feedstuffs and accuracy in feedmanufacturing would give producers a chance todecrease the excretion of excess nutrients (or,alternatively, avoid deficiencies). Spears (1996)summarized analysis results from 26 sow feedsamples and 17 finishing feed samples (Table 4).One sample was taken from each of 43 farms andanalyzed by the North Carolina Feed TestingLaboratory. The results indicate that there issubstantial variation in the mineral concentrationsof different feeds. The levels of minerals exceeded
Table 4. Concentrations of selected minerals in sow and grower-finisher feeds1
Sow Diets Finisher DietsMineral Requirement Range Median2 Requirement Range Median2
Calcium, % 0.75 0.62 - 2.01 1.21 0.50 0.57 - 1.38 0.96Phosphorus, % 0.60 0.45 - 1.17 0.84 0.40 0.45 - 0.78 0.62Copper, ppm 05 012 - 222 022 03 109 - 281 020Zinc, ppm 50 079 - 497 167 50 103 - 205 149
1 Adapted from Spears (1996).2 The median value indicates that 50 percent of the samples were below this value and 50 percent of the samples were above.
Table 3. Savings in feed costs with phase feeding1
Savings Over Increase in SavingsNumber of Phases Diet Cost/Pig 2-Phase Program Per Additional Diet
2 $42.44 — —3 $41.41 $1.14 $1.144 $41.01 $1.54 $0.405 $40.67 $1.88 $0.346 $40.43 $2.12 $0.249 $40.10 $2.45 $0.1112 $39.90 $2.65 $0.06
1 From Bell (1998).
requires 18.5 grams of lysine. Assuming a feedintake of 5.7 pounds per day and 6.8 pounds perday for the 140- and 220-pound pigs, respec-tively, the lysine requirements would be 0.75percent for the 140-pound pig and 0.6 percent forthe 220-pound pig. Phase feeding matchesspecific diets to the growth stage of the pig andreduces the time pigs are fed an over- or under-supply of nutrients. Van der Peet-Schwering etal. (1996) reported that multi-phase feedingreduced urinary nitrogen excretion by 14.7percent and that ammonia emission was reducedby 16.8 percent. Multi-phase feeding wasachieved by mixing a diet high in nitrogen withone low in nitrogen in decreasing proportions ona weekly basis and was compared with a two-phase feeding system. Koch (1990) estimatedbased on theoretical calculations that nitrogenand phosphorus excretion could be reduced by 13percent by going from one feed for the grower-finisher period to two feeds, whereas Lenis(1989) estimated a 6 percent reduction in nitro-gen excretion. Phase feeding will reduce the dietcost-per-pig and is a cost-effective method ofreducing nitrogen excretion. The cost benefits of

Understanding and Applying Nutrition Concepts to Reduce Nutrient Excretion in Swine
6
the requirements suggested by the NRC. Thedifference is likely due, in part, to variation inrequirement estimates among nutritionists, but isalso probably related to the lack of analyzednutrient profiles of the ingredients used to formu-late the feed and to errors in mixing. Addingexcess nutrients to diets to account for variabilityin composition and accuracy in mixing can beused to avoid nutrient deficiencies, but it alsowill increase nutrient excretion and diet cost.
Methods to reduce nitrogen excretion andammonia emissionAs stated previously, pigs retain a relatively lowpercentage of the nitrogen they consume. Lossesassociated with nitrogen metabolism can be seenin Figure 1 and can be studied in detail usingmetabolism crates (Figure 2). Most of the nitro-gen entering the pig’s body is in the form ofprotein and amino acids. Digestion of protein toamino acids is initiated in the stomach by thecombined action of hydrochloric acid and pepsinand is completed in the small intestine by pro-teases such as trypsin and chymotrypsin. Theseenzymes are proteins themselves and will con-tribute to the fecal excretion of nitrogen. Inaddition, other secretions from the intestine andsloughed-off cells are part of the nitrogen excre-tion in the feces and together are referred to asendogenous secretions. Part of the endogenoussecretions are reabsorbed, but approximately 25percent are passed into the large intestine(Souffrant et al., 1993). Feeding tables typicallylist the amino acid digestibility values for ingre-dients as apparent ileal digestible values.
Figure 1. Nitrogen flow in swine
These values take into account the losses fromendogenous secretions because the digestibilitycalculations are based on the amount of aminoacids at the end of the ileum (small intestine)compared to the intake of amino acids.
Therefore, selecting ingredients with a highlydigestible amino acid content will reduce thefecal loss of nitrogen (Figure 1). The FederationEuropeenne des Fabricants d’Adjuvants pour laNutrition Animale (1992) estimated that nutrientexcretion in waste could be reduced by approxi-mately 5 percent by selecting highly digestibleingredients. However, cost effectiveness, ingredi-ent storage capacity, and quality control becomeissues in adapting this method.
Figure 2. Metabolism crates are used to study nutrientdigestion, metabolism, and excretion.
Front and side view of a swine metabolism crate.
The metabolism crates used at North Carolina StateUniversity are designed to hold pigs weighing between50 and 350 pounds. The sides of the crates can be adjustedto make sure the pig cannot turn around. This is necessaryto ensure that feces and urine are deposited in one area,facilitating complete collection.

7
Understanding and Applying Nutrition Concepts to Reduce Nutrient Excretion in Swine
Inside view of a metabolism crate with feeder in front.The pig stands on a slotted floor that has been coated withplastic. Underneath the floor is a screen that will collect allthe fecal material voided by the pig. Under the screen is astainless steel tray that drains into the center and collectsall the urine produced during the day.Knowing the amount and the nutrient composition of thefeed given each day, we can calculate total nutrient intake.We also can measure the amount of feces and urineproduced per day and determine the chemical compositionof each. From these data, we can calculate the digestibilityof the feed and the efficiency with which it is metabolized.Then we can estimate the total nutrient excretion in fecesand urine and study several nutritional strategies aimed atminimizing this excretion.
Low-protein diets
Following digestion of proteins, amino acids areabsorbed and used for muscle protein synthesisand other physiological functions. The idealprotein concept, introduced by the AgriculturalResearch Council (ARC, 1981), proposes thatideal protein consists of amino acids in exactlythe right proportions for maintenance and leantissue growth. According to this concept, eachamino acid is equally limiting and, per definition,excretion of nitrogen is minimized. Require-ments of all essential amino acids are expressedas a percentage of lysine (the first amino acidthat would limit pig growth in practical swinediets). From a practical standpoint, the idealprotein concept allows for a quick calculation ofamino acid requirements as long as the lysinerequirement of the pig is defined. However, theexact ideal protein may be variable, dependingon the physiological state of the animal. Thismay explain the different ideal protein or aminoacid patterns that have been proposed. Baker(1996) calculated ideal amino acid patterns forpigs in different weight categories (Table 5).Others (Fuller et al. 1989) studied optimumamino acid patterns for maintenance and growth.Because the maintenance component increasesrelative to protein deposition, the combined idealpattern of amino acids will change with increas-ing body weight. Similarly, the amino acidrequirements for swine as calculated in the newNRC publication (1998) are based on differentpatterns for maintenance and growth.
Table 5. Ileal true digestible amino acid patterns for pigs in three different weight classes1
Ideal Pattern, % of LysineAmino Acid 10 to 45 lbs 45 to 110 lbs 110 to 240 lbsLysine 100 100 100Threonine 65 67 70Tryptophan 17 18 19Methionine + Cystine 60 62 65Isoleucine 60 60 60Valine 68 68 68Leucine 100 100 100Phenylalanine + Tyrosine 95 95 95Arginine 42 36 30Histidine 32 32 32
1Adapted from Baker (1996).

Understanding and Applying Nutrition Concepts to Reduce Nutrient Excretion in Swine
8
Chung and Baker (1991) used this concept tothe extreme and fed 20-pound pigs either a corn-soybean meal-whey diet or a purified diet con-taining corn starch, lactose, and sucrose as thecarbohydrate sources and individual amino acidsat the ideal ratios as the only nitrogen source.The results demonstrated that equal performancecould be obtained with the low-nitrogen, purifieddiets (1.1 pounds per day on average for the 14-day feeding period). However, nitrogen excretionwas substantially different. Pigs fed the corn-soybean meal-whey diet excreted 44 percent ofnitrogen in feces and urine, compared to 32percent for pigs fed the purified diet. Therefore,by applying the ideal protein concept, nitrogenexcretion could be reduced by up to 30 percent.However, under practical conditions, least-costformulation of diets would allow only for a smallreduction in the protein content of the diet. Thecost associated with reducing the crude proteincontent of a corn-soybean meal diet is shown inFigure 3. These calculations were made using a16 percent crude protein diet without addedsynthetic amino acids (containing 0.82 percenttotal lysine), and minimum amino acid levelswere set using the ratios presented in Table 5.Although only added lysine per ton of feed isshown in this graph, other amino acids (threo-nine, methionine, and tryptophan) needed to beincluded to maintain the proper amino acidpattern. This occurred with the 14.5 percentcrude protein diet, which resulted in an increaseof $0.70 feed cost per ton compared to the 16percent crude protein diet. The reduction innitrogen excretion was not given a value in thisexample, but will become a factor of increasingimportance in the future.
Nitrogen content of swine feeds can bereduced cost effectively by formulating dietsbased on amino acids, rather than protein. Basedon the prices used in this example, the nitrogencontent of the diet can be reduced by 0.16 per-cent (1 percent crude protein) without increasingdiet cost. Kerr (1995) concluded from a summaryof 28 experiments that for each 1 percent reduc-tion in crude protein, nitrogen excretion wasreduced by 8.4 percent. In addition to a reductionin nitrogen excretion, the feeding of low-proteindiets also can affect ammonia levels in the airand odor. Latimier (1993) reported a reduction ofnitrogen in the air of approximately 15 percentby feeding low-protein diets (Table 6). Note thatnitrogen excretion was reduced by 16 percent bylowering the protein content of grower diets andfinisher diets by 1.6 percent (from 17.8 percent to16.2 percent) and 1.9 percent (from 15.4 percentto 13.5 percent), respectively.
Figure 3. Cost or value of reducing crude protein (CP)in a corn-soybean meal diet*
7
6
5
4
3
2
1
0
16 15.5 15 14.5 14 13.5 13CP%
Added Lysine, lb/ton Cost, $/ton
* Relevant ingredient prices used were as follows: corn, $90/ton;dehulled soybean meal, $180/ton; Lysine-HCl, $2,400/ton; DL-Methionine, $2,700/ton, Threonine, $2.63/lb; and Tryptophan, $15.80/lb.
Table 6. Effect of low-protein diets on nitrogen excretion and ammonia emission1
Grower and Finisher Protein Level, %2
Item 17.8% and 15.4%, resp. 16.2% and 13.5%, resp.N Intake, lbs 2.43 2.17N Retention, lbs 0.79 0.79N excretion
Total excretion, lbs 1.64 1.38N in manure, lbs 1.20 1.00N in air, lbs 0.44 0.38
1 Adapted from Latimier, 1993.2 The grower and finisher periods covered the weight ranges of 68 to 139 lbs. and 139 to 223 lbs., respectively.
Add
ed L
ysin
e
Cost
138136134132130128126124122120118

9
Understanding and Applying Nutrition Concepts to Reduce Nutrient Excretion in Swine
Figure 4. The Swine Malodor Emission Laboratory at North Carolina State University
Odor chamber Chamber, inside FTIR equipment
On average from this study, nitrogen excre-tion was reduced by 9 percent and ammoniaemission by 8.6 percent per 1 percent reductionin crude protein. Hobbs et al. (1996) observed areduction in odor compounds when pigs were feddiets low in protein. A comparison between dietshigh in protein (20.8 percent crude protein for thegrower and 18.9 percent crude protein for thefinisher; note that these levels of crude proteinare relatively high compared to practical swinediets in the United States) and diets low inprotein (16.1 percent crude protein for the growerand 13.8 percent crude protein for the finisher)revealed that the concentration of 5 out of 10odor compounds measured were lower in thelow-crude protein diets during the grower period.During the finisher period, 9 out of 10 odorouscompounds were lower for the low-crude proteindiets. Because of the importance of odor in theperception of swine production by the public,this area of research warrants further investiga-tion and is being studied at North Carolina StateUniversity (Figure 4).
Methods to reduce phosphorus excretionMost of the phosphorus in an animal is found inits bone. However, phosphorus also plays animportant role in a number of metabolic func-tions. Feedstuffs derived from grains and plantprotein contain significant amounts of phospho-rus. However, the phosphorus in plants is largelybound as phytate, which is unavailable to the pig.The bioavailability of phosphorus in feedstuffs ofvegetable origin ranges from 14 percent to 50percent (NRC, 1998). Because most of thephosphorus in these feedstuffs will be excreted,formulation of diets based on the availablephosphorus content and selection of ingredientswith a high phosphorus availability can lead to areduction in phosphorus excretion. Cromwell(1990) calculated total and available phosphoruslevels in diets formulated to contain 0.5 percenttotal phosphorus using different ingredients(Table 7). The corn-soybean meal diet contained0.23 percent available phosphorus, which was setas the requirement (NRC, 1998).
Dr. Theo van Kempen has initiated a research program on odor control in swine through nutritional means at NorthCarolina State University. He has developed the Swine Malodor Emission Laboratory (SMEL), which contains two chambersfor housing pigs. In each of these chambers, the amount and composition of the air going into and coming out of thechamber is measured. Thus, odor compounds can be identified and quantified through a technique called Fourier TransformInfrared Spectroscopy (FTIR), which measures these compounds based on their light-absorption characteristics. Studies arecurrently in progress to investigate nutritional effects on odor emission.

Understanding and Applying Nutrition Concepts to Reduce Nutrient Excretion in Swine
10
When wheat was used as the grain source,available phosphorus was greater than the re-quirement. In that case, phosphorus excretionwould have been increased because availablephosphorus exceeded what was needed. Fromextrapolations from the research of O’Quinn etal. (1997), it was calculated that for each 0.05percent absolute reduction in available phospho-rus in the diet, excretion of phosphorus wasreduced by approximately 8 percent. For both acanola meal diet and a diet with wheat middlings,the level of available phosphorus was calculatedto be below the requirement. This exampleillustrates that excesses and deficiencies ofphosphorus can be overcome by formulatingbased on available phosphorus. However, anaccurate knowledge of the available phosphorusrequirement for all classes of pigs is needed.
Digestibility of phosphorus in feedstuffs ofvegetable origin can be improved substantiallyby the use of phytase. Phytase is an enzyme thatcan break down the phytic acid molecule, releas-ing phosphorus and making it available to thepig. Kornegay (1996) estimated that phosphorus
excretion in the feces could be reduced by 25 to50 percent with the use of 200 to 1,000 units ofphytase. In a summary of the available literatureon phytase supplementation (Hoppe andSchwartz, 1993, as cited by Kornegay, 1996), itwas suggested that 432 units of phytase perkilogram were equivalent to 0.1 percent ofphosphorus. The economic value of usingphytase when following the common recommen-dation that 500 units per kilogram of phytase isequal to 0.1 percent of phosphorus can be calcu-lated (Table 8). The cost of phytase was $1.36per pound for a phytase premix containing 600units phytase per gram; the cost for dicalciumphosphate (18.5 percent phosphorus) was $245per ton, and the cost of other ingredients was thesame as listed in Figure 3. The calculation isbased purely on least-cost diet formulation anddoes not take into account the value of reducedphosphorus excretion due to improved phospho-rus digestibility with the addition of phytase. Inaddition, any potential value of phytase on aminoacid or energy digestibility was not taken intoaccount.
Table 7. Available phosphorus levels in diets formulated to contain 0.5 percent total phosphorus1
Diet Added Dical. P, % Total P, % Available P, %Corn-Soybean Meal 0.96 0.50 0.23Wheat-Soybean Meal 0.57 0.50 0.28Corn-Canola Meal 0.09 0.50 0.10Corn-Soybean Meal-Wheat Midds 0.68 0.50 0.20Growing Pig Requirement (NRC) 0.50 0.23
1Adapted from Cromwell (1990).
Table 8. Estimated cost of phytase supplementation using least-cost diet formulationDicalcium phosphate Diet cost above a standard
Level of Phytase Added removed (lb/ton) corn-soybean meal diet500 U per kg 10.9 $1.23250 U per kg* 10.9 $0.14
*The level of 250 U of phytase per kg is below the recommended inclusion level and may not liberate sufficient P to maintain pig performance.

11
Understanding and Applying Nutrition Concepts to Reduce Nutrient Excretion in Swine
Grain companies are developing corn variet-ies that contain less phytate-bound phosphorusand have identified the lpa1 gene, which causes alarge reduction in phytic acid production in cornseeds. Lines of hybrid corn containing this gene(low-phytate corn) have been tested in swineexperiments to determine the availability ofphosphorus. In addition, the effects of low-phytate corn on pig performance have beenevaluated. Low-phytate corn contains approxi-mately the same level of total phosphorus asregular corn (0.28 percent phosphorus in regularcorn, NRC, 1998). The pig can use thebioavailable portion, which is only 14 percent ofthe phosphorus in regular corn—86 percent isexcreted in the manure. The bioavailability oflow-phytate corn, on the other hand, is muchhigher as determined in recent experiments(Table 9). On average, phosphorus in regular
corn was 18 percent available, whereas phospho-rus in low-phytate corn was 73 percent available.
Pierce et al. (1998a) evaluated the effect ofreplacing regular corn with low-phytate cornbased on total phosphorus. The total phosphoruslevels in the final diets ranged from 0.33 percentto 0.59 percent, and two of those levels werebelow the total phosphorus requirement of 0.5percent suggested by the NRC (1998). However,as mentioned before, the amount of phosphorusavailable to the pig is higher for low-phytatecorn, and therefore, there was more availablephosphorus in the low-phytate corn diets (Table10). The NRC (1998) lists an available phospho-rus requirement for growing pigs of 0.23 percent,which means that the lowest phosphorus dietusing low-phytate corn was only marginallydeficient in phosphorus (it contained 0.2 percentavailable phosphorus).
Table 9. Bioavailability of regular and low-phytate corn in pigsStart weight Length of Number of Criteria of Availability Availability Standard
of pigs trial pigs used measurement of P in corn of P in LPC1 used2 Reference34 lb 40 days 35 Bone 22 77 MSP Cromwell
strength, Ash et al., 199820 lb 35 days 50 Bone 10 64 MSP Spencer
strength et al., 1998a40 lb 34 days 40 Bone 22 79 MSP Pierce and
strength, Ash Cromwell,1999a
1LPC is low-phytate corn.2MSP is monosodium phosphate. The availability of P in MSP is set at 100%.
Table 10. Effects of regular and low-phytate corn on performance of growing pigs1
Regular Corn Low-Phytate CornTotal P, % 0.59 0.50 0.42 0.33 0.59 0.50 0.42 0.33Available P, % 0.35 0.26 0.18 0.09 0.45 0.37 0.28 0.20Daily Gain, lb. 1.78 1.76 1.62 1.36 1.75 1.71 1.73 1.70Feed/Gain 2.37 2.37 2.44 2.79 2.39 2.54 2.38 2.35Bone Strength 90 86 66 41 87 89 85 64Bone Ash, % 50.6 50.6 48.7 45.2 51.0 50.9 50.4 46.9
1Each mean represents five pens of two pigs per pen. Initial and final pig weights were 50 and 112 lb., respectively, for the 37-day trial. Bonestrength and bone ash are average values for the metacarpals and metatarsals.

Understanding and Applying Nutrition Concepts to Reduce Nutrient Excretion in Swine
12
be reduced by 0.1 percent when low-phytatecorn is used and that phosphorus excretion can bereduced by approximately 40 percent.
An interesting question is what effect phytasewould have in diets that contain low-phytatecorn. There is still potential for phytase to im-prove phosphorus digestibility because othercomponents of pig diets, such as soybean meal,contain significant amounts of phytate-boundphosphorus. Cromwell (1999) reported thatphytase addition to diets with low-phytate corndecreased phosphorus excretion by 25 percent(Table 11). Using phytase and low-phytate corndiets reduced phosphorus excretion by 51 percentcompared to control diets with regular corn andwithout phytase.
There is great potential for using low-phytatecorn and phytase to reduce phosphorus excretionin swine. The feasibility of applying these tech-nologies in practice depends on the cost ofinclusion versus the economic benefits and theability to preserve the identity of different typesof corn.
In fact, the greater availability of phosphorusin low-phytate corn resulted in an improvementin daily gain of 25 percent compared to regularcorn-fed pigs whose diets had the lowest level ofphosphorus. Other studies have reported im-proved performance ranging from 8 to 23 percent(Pierce et al., 1998b; Spencer et al., 1998b). Themagnitude of performance improvement likelywould depend on the design of the trial, particu-larly the level of dietary phosphorus used andhow it compared to the pigs’ requirement. Be-cause more phosphorus from the low-phytatecorn is used by the pig, phosphorus excretion canbe reduced by feeding low-phytate corn. Re-search has demonstrated that phosphorus excre-tion can be reduced from 13 to 50 percent (Pierceet al., 1998a; Pierce and Cromwell, 1999b; Veumet al., 1998). When diets were formulated basedon available phosphorus (rather than total phos-phorus) using low-phytate corn, phosphorusexcretion was reduced by 35 to 40 percent(Pierce and Cromwell, 1999b). Collectively,these data show that total dietary phosphorus can
Table 11. Effects of low-phytate corn and supplemental phytase on phosphorus excretion of pigsRegular Corn Low-Phytate Corn
Control With Phytase Control With PhytaseTotal P, % 0.55 0.45 0.45 0.35Available P, % 0.29 0.19 0.29 0.19Bone Strength, kg 272 267 282 283P Excretion, g/day 6.80 5.24 4.43 3.34Reduction in P Excretion, % — 23 35 51
Table 12. Excretion of zinc and copper by different classes of swine1
Zinc CopperPhase Diet, ppm Excretion (grams/day) Diet, ppm Excretion (grams/day)Nursery
Prestarter 2,000 0.65 240 0.084Starter 125 0.08 240 0.186
Grower-Finisher 125 0.23 15 0.027Sows
Gestation 125 0.20 15 0.024Lactation 125 0.54 15 0.065
1Calculated on a daily basis.

13
Understanding and Applying Nutrition Concepts to Reduce Nutrient Excretion in Swine
respectively, in the nursery (note that zinc andcopper already were reduced from the growth-promoting level of 2,000 and 240 ppm, respec-tively, in these diets) and 15, 100, 100, and 40ppm, respectively, in the grower-finisher to 5, 25,25, and 10 ppm, respectively, in the low-mineraldiet. No effects on growth performance wereobserved during the nursery and grower-finisherperiods. However, concentrations of zinc andcopper in the feces were reduced by 50 percent.Effects of long-term feeding of reduced-mineraldiets on reproductive performance of pigs arebeing evaluated currently.
SummarySeveral nutritional strategies are available toreduce nutrient excretion. A summary of themethods discussed in this paper and their impacton nutrient excretion is provided in Table 13.
The most cost-effective methods that appearto be relatively easy to implement are reducingfeed wastage, separate-sex and phase feeding,and formulating diets based on nutrient availabil-ity. The use of phytase, low-phytate corn, andlow-protein diets could reduce nitrogen andphosphorus excretion substantially, but are likelyto add additional cost to the diet.
Table 13. Impact of nutritional strategies on nutrient excretionStrategy Employed Reduction in Nutrient ExcretionPelleting 5% for N and PReducing Feed Waste 1.5% for all nutrients for every 1% reductionMatching Nutrient Requirements 6 to 15% for all nutrients(Phase feeding or separate sex feeding)Formulation on availability 10% for N and PLow-protein diets 9% for N for every 1% reduction in dietary CPPhytase 25 to 50% for PLow-phytate corn 35 to 40% for PReducing micro-minerals Up to 50%
Methods to reduce the excretionof micro-mineralsThe excretion of the micro-minerals zinc andcopper from each of the classes of swine isshown in Table 12. Zinc and copper retentionwas assumed to be 20 percent (Table 2), exceptwhen growth-promoting levels of zinc andcopper were fed, in which case retention was setat 5 percent (NRC, 1998). The opportunity toreduce zinc and copper excretion by eliminatinghigh zinc and copper feeding in the nursery phaseis substantial. The practice of feeding approxi-mately 20 times the zinc and copper requirementto nursery pigs is common to increase the pigs’growth performance. Therefore, lowering thesegrowth-promoting levels to reduce excretion mayreduce pig performance. A better understandingis needed regarding the growth-promoting effectsof these minerals and the economics of eliminat-ing high levels from nursery diets.
Even if growth-promoting levels of zinc andcopper are eliminated, a further reduction ofmicro-minerals below levels that are commonlyfed in the industry can reduce mineral excretionsignificantly. Creech et al. (1998) reduced thelevels of copper, zinc, iron, and manganese from25, 150, 180, and 60 parts per million (ppm),

Understanding and Applying Nutrition Concepts to Reduce Nutrient Excretion in Swine
14
● Federation Europeenne des Fabricantsd’Adjuvants pour la Nutrition Animale, 1992.Improvements in the environment:Possibilities for the reduction of nitrogen andphosphorus pollution caused by animalproduction. FEFANA, Belgium.
● Fuller, M. F., R. McWilliam, T. C. Wang,and L. R. Giles. 1989. The optimum dietaryamino acid pattern for growing pigs. 2.Requirements for maintenance and for tissueprotein accretion. Brit. J. Nutr. 62, 255-267.
● Hancock, J. D., K. J. Wondra, S. L. Traylor,and I. Mavromichalis. 1996. Feed processingand diet modifications affect growthperformance and economics of swineproduction, Carolina Swine NutritionConference. Proceedings, November 1996,p. 90-109.
● Hobbs, P. J., B. F. Pain, R. M. Kay, and P. A.Lee. 1996. Reduction of odorous compoundsin fresh pig slurry by dietary control of crudeprotein. J. Sci. Food Agric. 71:508-514.
● Kerr, B. J. 1995. Nutritional strategies forwaste reduction management: Nitrogen. In:New Horizons in Animal Nutrition andHealth (Eds. J. B. Longenecker and J. W.Spears): p. 47-68.
● Koch, F. Amino acid formulation to improvecarcass quality and limit nitrogen load inwaste, Carolina Swine Nutrition Conference.Proceedings, November 1990, 76-95.
● Kornegay, E. T. 1996. Nutritional,environmental, and economic considerationsfor using phytase in pig and poultry diets. In:Nutrient Management of Food Animals toEnhance and Protect the Environment (Ed. E.T. Kornegay): p. 277-302.
● Kornegay, E. T., and A. F. Harper. 1997.Environmental nutrition: Nutrientmanagement strategies to reduce nutrientexcretion of swine. Prof. Anim. Sci. 13:99-111.
Literature Cited● ARC. 1981. The nutrient requirements of
pigs. Technical review. CommonwealthAgricultural Bureaux, Slough, England.
● Baker, D. H. 1996. Advances in amino acidnutrition and metabolism of swine andpoultry. In: Nutrient Management of FoodAnimals to Enhance and Protect theEnvironment (Ed. E. T. Kornegay): p. 41-53.
● Bell, A. 1998. How many phases should youfeed? Pork 98, May, pp. 34-38.
● Chung, T. K., and D. H. Baker. 1991. Achemically defined diet for maximal growthof pigs. J. Nutr. 121:979-984.
● Coffey, M. T. 1996. Environmentalchallenges as related to animal agriculture–Swine. In: Nutrient Management of FoodAnimals to Enhance and Protect theEnvironment (Ed. E. T. Kornegay): p. 29-39.
● Creech, B. L., J. W. Spears, W. L. Flowers,and G. M. Hill. 1998. Effects of dietary leveland source of zinc and copper onperformance and metal excretion in swine. J.Anim. Sci. 76 (Suppl. 1), 172(Abstr.).
● Cromwell, G. L. 1990. Application ofphosphorus availability data to practical dietformulation. Carolina Swine NutritionConference. Proceedings, November 7–8,1990, p. 55-75.
● Cromwell, G. L. 1999. Modifying manure bymodifying diets. Nebraska Pork Expo,February 3, 1999, Columbus, Neb.
● Cromwell, G. L., J. L. Pierce, T. E. Sauber,D. W. Rice, D. S. Ertl, and V. Raboy. 1998.Bioavailability of phosphorus in low-phyticacid corn for growing pigs. MidwesternSection Meeting of the American Society ofAnimal Science, Des Moines, Iowa:58.
● Dourmad, J. Y., D. Guillou, and J. Noblet.1992. Development of a calculation modelfor predicting the amount of N excreted bythe pig: Effect of feeding, physiologicalstage, and performance. Livest. Prod. Sci.311:95-107.
● Latimier, P., J. Y. Dourmad, A. Corlouer, J.Chauvel, J. Le Pan, M. Gautier, and D.Lesaicherre. 1993. Effect of three proteinfeeding strategies, for growing-finishing pigs,

15
Understanding and Applying Nutrition Concepts to Reduce Nutrient Excretion in Swine
● Spears, J. W. 1996. Optimizing mineral levelsand sources for farm animals. In: NutrientManagement of Food Animals to Enhanceand Protect the Environment (Ed. E. T.Kornegay): p. 259-275.
● Spencer, J. D., G. L. Allee, T. E. Sauber, D.S. Ertl, and V. Raboy. 1998a. Digestibilityand relative bioavailability of normal andgenetically modified low phytate corn (LP)for pigs. Midwestern Section Meeting of theAmerican Society of Animal Science, DesMoines, Iowa:58.
● Spencer, J. D., G. L. Allee, T. E. Sauber, D.S. Ertl, and V. Raboy. 1998b. Grow-finishperformance of high lean-growth pigs fednormal and genetically modified low phytate(LP) corn. Midwestern Section Meeting ofthe American Society of Animal Science,Des Moines, Iowa:58.
● van der Peet-Schwering, C., and M.Voermans. 1996. Effect of feeding andhousing on the ammonia emission of growingand finishing pig facilities (in Dutch). ReportExperimental Pig Station, Rosmalen, 10(2):17-19.
● Veum, T., V. Raboy, D. Ertl, and D. Ledoux.1998. Low phytic acid corn improvescalcium and phosphorus utilization forgrowing pigs. J. Anim. Sci. 76 (Suppl.1):177(Abstr.).
● Wondra, K. J., J. D. Hancock, K. C. Behnke,R. H. Hines, and C. R. Stark. 1995. Effects ofparticle size and pelleting on growthperformance, nutrient digestibility, andstomach morphology in finishing pigs. J.Anim. Sci. 73:757.
on growth performance and nitrogen outputin the slurry. J. Rech. Porc. France25:295.
● Lenis, N. P. 1989. Lower nitrogen excretionin pig husbandry by feeding: Current andfuture possibilities. Neth. J. Agric. Sci.37:61-70.
● National Research Council, 1998. Nutrientrequirements of swine (10th ed.). NationalAcademy Press. Washington, D.C.
● O’Quinn, P. R., D. A. Knabe, and E. J.Gregg. 1997. Digestible phosphorus needs ofterminal cross growing-finishing pigs. J.Anim. Sci. 75:1308-1318.
● Pierce, J. L., and G. L. Cromwell. 1999a.Effects of phytase on bioavailability ofphosphorus in normal and low-phytic acidcorn. Midwestern Section Meeting of theAmerican Society of Animal Science, DesMoines, Iowa:36.
● Pierce, J. L., and G. L. Cromwell. 1999b.Performance and phosphorus excretion ofgrowing-finishing pigs fed low-phytic acidcorn. Midwestern Section Meeting of theAmerican Society of Animal Science, DesMoines, Iowa:35
● Pierce, J. L., G. L. Cromwell, and V. Raboy.1998b. Nutritional value of low-phytic acidcorn for finishing pigs. J. Anim. Sci. 76(Suppl. 1):177(Abstr.).
● Pierce, J. L., G. L. Cromwell, T. E. Sauber,D. W. Rice, D. S. Ertl, and V. Raboy. 1998a.Phosphorus digestibility and nutritional valueof low-phytic acid corn for growing pigs.Midwestern Section Meeting of the AmericanSociety of Animal Science, Des Moines,Iowa:58.
● Souffrant, W. B., A. Rerat, J. P. Laplace, B.Darcy-Vrillon, R. Kohler, T. Corring, and C.Gebhardt. 1993. Exogenous and endogenouscontributions to nitrogen fluxes in thedigestive tract of pigs fed a casein diet. III.Recycling of endogenous nitrogen. Reprod.Nutr. Dev. 33:373-382.

750 copies of this public document were printed at a cost of$2,517, or $3.36 per copy.
Distributed in furtherance of the Acts of Congress of May 8 and June 30,1914. Employment and program opportunities are offered to all peopleregardless of race, color, national origin, sex, age, or disability. NorthCarolina State University, North Carolina A&T State University, U.S.Department of Agriculture, and local governments cooperating.
11/00—.75M—DSB/GKJ AG-608E00-38878
Prepared byEric van Heugten and Theo van Kempen
Swine Nutrition Extension Specialists
Published byNorth Carolina
Cooperative Extension Service