undefined
DESCRIPTION
Consolidated Summary: Revenues 47 Expenses 48 Departmental Operating Expenses 49-50 Departmental Margins 51 Five Year Trend 52-57 Reno Events Center: Reno Events Center Departmental Overview 109-110 Reno Events Center Consolidated Summary 111 Five Year Trend 112 Reno Events Center Administration 113-114TRANSCRIPT
Description Page (s)
Introduction: Management Letter 1-4 Five Year Strategic Plan 5-24 SWOT Analysis 25-30 Introduction and Summary 31-32 Document Presentation 33 The Budgetary Process 34 Financial Structure, Accounting System 35-36 Budget Calendar 37 Financial Policies 38-41 Beginning and Ending Fund Balances 42 Distinguished Budget Presentation Award 43-44
FISCAL YEAR 2008-2009INDEX
RENO - SPARKS CONVENTION & VISITORS AUTHORITYWASHOE COUNTY
ANNUAL FORECAST AND CAPITAL BUDGET
STATE OF NEVADA
g g Excellence in Financial Reporting Award 45
Consolidated Summary: Revenues 47 Expenses 48 Departmental Operating Expenses 49-50 Departmental Margins 51 Five Year Trend 52-57
Staffing Levels: Staffing Level Changes 59-60
Room Statistics: Summary 61 Cash Occupied Rooms - Cash Average Rates Trend 62 Taxable Revenues 63 Taxable Revenues By Market Segment 64 Taxable Room Revenues Trend 65 Occupied Rooms 66 Cash Occupied Room Nights Trend 67 Average Rates 68 Average Cash Rates Trend 69 Percentage of Occupancy 70 Percentage of Occupancy Trend 71 Hotels 72 Motels 73 28 Day Motels 74 R.V. Parks 75 Vacation Rentals 76 Time Shares 77
Contact: Tim D. Smith VP Finance - [email protected]

Description Page (s)
FISCAL YEAR 2008-2009INDEX
RENO - SPARKS CONVENTION & VISITORS AUTHORITYWASHOE COUNTY
ANNUAL FORECAST AND CAPITAL BUDGET
STATE OF NEVADA
Room Tax Collections: Gross Tax Collection by Jurisdictions and Distribution 78 RSCVA Tax Revenue Chart 79 Room Tax Collections Growth Trend 80 Five Year Trend Room Tax Collections and Room Statistics 81 Revenues Room Tax Fund 15999 82 Room Tax Rates and Collections by Location 83-87 Principal Room Taxpayers 88
Reno-Sparks Convention Center: Convention Center Departmental Overview 89-91p Convention Center Consolidated Summary 92-93 Five Year Trend 94 Convention Center Administration 95-96 Convention Center Maintenance 97 Convention Center Engineering 98-99 Convention Center Public Safety 100-101
National Bowling Stadium: National Bowling Stadium Departmental Overview 103-104 National Bowling Stadium Consolidated Summary 105 Five Year Trend 106 National Bowling Stadium Administration 107-108
Reno Events Center: Reno Events Center Departmental Overview 109-110 Reno Events Center Consolidated Summary 111 Five Year Trend 112 Reno Events Center Administration 113-114
Reno-Sparks Livestock Events Center: Reno-Sparks Livestock Events Center 115-116 Five Year Trend 117 Reno-Sparks Livestock Events Center 118-119
Contact: Tim D. Smith VP Finance - [email protected]
Description Page (s)
FISCAL YEAR 2008-2009INDEX
RENO - SPARKS CONVENTION & VISITORS AUTHORITYWASHOE COUNTY
ANNUAL FORECAST AND CAPITAL BUDGET
STATE OF NEVADA
Wildcreek Golf Course: Wildcreek Departmental Overview 121 Wildcreek Consolidated Summary 122-123 Five Year Trend 124 Wildcreek Golf Operations 125-126 Wildcreek Food & Beverage 127-128 Wildcreek Cart Facility and Driving Range 129
Northgate Golf Club: Northgate Departmental Overview 131 Northgate Consolidated Summary 132-466g y Five Year Trend 134 Northgate Golf Operations 135-136 Northgate Food & Beverage 137-138 Northgate Cart Facility and Driving Range 139
General and Administration: General and Administration Overview 141 General and Administration Consolidated Summary 142-143 Five Year Trend General and Administration 144-145 Executive Office Departmental Overview 146 Executive Office 147-148 Board of Directors Overview 149-150 Board of Directors 151-153 Finance & Purchasing Departmental Overview 154 Finance & Purchasing 155-156 Room Tax Departmental Overview 157 Room Tax 158-159 Human Resources Departmental Overview 160 Human Resources 161-162 Information Technology Departmental Overview 163 Information Technology 164-165 Mail Services Departmental Overview 166 Mail Services 167-168
Contact: Tim D. Smith VP Finance - [email protected]

Description Page (s)
FISCAL YEAR 2008-2009INDEX
RENO - SPARKS CONVENTION & VISITORS AUTHORITYWASHOE COUNTY
ANNUAL FORECAST AND CAPITAL BUDGET
STATE OF NEVADA
Convention Sales: Convention Sales Overview 169 Convention Sales Departmental Overview 170-172 Convention Sales Consolidated Summary 173 Five Year Trend 174-175 Convention Sales 176-177 Convention Services Departmental Overview 178-179 Convention Services 180-181
Tourism Sales: Tourism Sales Departmental Overview 183-188p Tourism Sales Consolidated Summary 189 Five Year Trend 190 Tourism Sales 191-192
Marketing: Marketing Departmental Overview 193-195 Marketing Consolidated Summary 196-197 Five Year Trend 198-199 Marketing 200-201 Visitor Services Departmental Overview 202 Visitor Services 203-204 Visitor Centers Departmental Overview 205 Visitor Centers 206-207
Capital and Other Expenses: Capital and Other Expenses Overview 209 Capital and Other Expenses Consolidated Summary 210 Five Year Trend Capital and Other Expenses 211-212 Debt Service Fund Overview 213 Debt Service Fund 214 Debt Schedule 215 Debt Administration 216 Grants Overview 217 Grants 218 Pioneer Center Overview 219 Pioneer Center 220
Contact: Tim D. Smith VP Finance - [email protected]

Description Page (s)
FISCAL YEAR 2008-2009INDEX
RENO - SPARKS CONVENTION & VISITORS AUTHORITYWASHOE COUNTY
ANNUAL FORECAST AND CAPITAL BUDGET
STATE OF NEVADA
Contingency Fund Overview 221 Contingency Fund 222 Capital Fund Overview 223 Capital Fund 224 Capital Expenditures 225 Capital Requirements Departmental Detail 226-228 Capital Effect on Operating Budget 229 Insurance Fund Overview 230 Insurance Fund 231
Executive Staff: Personnel 233 Organization Chart 234
Appendix: Changes in Net Assets 235 Net Asset by Component 236 Governmental Activities Tax Revenues 237 Fund Balances of Governmental Funds 238 Changes in Fund Balances of Governmental Funds 239 Room Tax Rates by Location 240 Principal Room Taxpayers 241 Outstanding Debt by Type 242 General Bonded Debt Outstanding 243 Computation of Direct and Overlapping Governmental Activities Debt 244 Legal Debt Margin Information 245 Pledged Revenue Coverage 246 Demographic Statistics Last Ten Fiscal Years 247 Principal Employers 248 Room Tax Collections by Month 249 Full-time Equivalent Employees by Function 250 Future Bookings and Projected Attendance 251
State of Nevada Budget Submission Financial Reports 253-276 Budget Resolution Approval 277-278 Proof of Publication 279
Glossary: Definitions 281-287
Contact: Tim D. Smith VP Finance - [email protected]


May 15, 2008 Board of Directors Reno-Sparks Convention and Visitors Authority 4001 South Virginia, Suite G Reno, Nevada 89502 Dear Board Members: Enclosed please find the Annual Forecast and Capital Budget of the Reno-Sparks Convention and Visitors Authority for the fiscal year ending June 30, 2009. RSCVA Mission Statement: The mission of the RSCVA is to attract overnight visitors to Reno-Tahoe lodging properties through marketing, convention sales and facility operations, featuring local amenities, attractions and events; thereby enhancing the economic benefit and quality of life for northern Nevada. RSCVA Vision Statement: The vision for Reno-Tahoe is to be a premier year-round, western destination for leisure and group/convention travelers. Five Year Strategic Plan The Plan was developed by the staff and Board of Directors with a tremendous amount of input from partner organizations, stakeholder groups and community members. The plan was adopted by the Board of Directors during the first quarter of 2007. There are six main components that we refer to as planks: Plank 1 - Increase Convention Sales and Marketing – Sell the destination as a place for conventions, tradeshows and meetings, while leveraging the group facility assets to book maximum lodging property room nights. Plank 2 - Increase Sales and Marketing – Increase individual traveler and group traveler business for Reno-Tahoe by marketing regionally, nationally and internationally. Plank 3 - Special Events Philosophy & Funding – Develop and implement a reasonable special events philosophy and funding system that ties to increasing room nights, ADR and/or measurable increased brand awareness and propensity to visit Reno-Tahoe.
Page 1

Plank 4 - Efficiently Manage Assets – Manage the RSCVA assets (primarily the public assembly facilities and golf courses) at maximum efficiency to free up additional funds to support RSCVA key priorities. Plank 5 - Develop Capital Improvement Program – Create a reasonably phased capital improvement plan for the RSCVA-owned facilities to ensure they remain safe and competitive with industry standards. Plank 6 - Address Average Daily Rate – Act as a catalyst to create and foster a destination-wide revenue management culture through providing our stakeholders with tools, education and incentives that promote the growth in Average Daily Rate, Revenue Per Available Room and RSCVA resources. Each plank contains initiatives and key measurements to evaluate progress, as shown in the strategic plan section. Fiscal 2008 – 2009 Annual Forecast and Capital Budget Revenue Assumptions: • Room Tax Collections: The FY 08-09 Budget assumes that the overall economic
growth that has been experienced during the first half of FY 07-08 will soften. Indicators are reflecting that the overall weak economic conditions relating to higher fuel prices and the housing market will have an impact in our market for FY 08-09. The budget reflects a modest growth of $11,922,045 (3.9%) in taxable room revenues. This increase is attributed to 19,785 of additional cash room nights. Historically we would anticipate a much larger growth given the fact that the FY 08-09 will see the return of the USBC-Women’s bowling congress representing 50,000 track-able additional room nights, as well as Hearth Patio & BBQ that accounts for approximately 15,000 room nights. The overall convention calendar and leisure market segments have decreased slightly. The market continues to see strong growth in our cash average rate as we are projecting an $81.08 average rate a 3.4% increase as we continue to out pace our strategic plan objectives. Total room tax collections are projected to increase $874,573 (3.3%). Occupancy levels are projected at 67.4% the same level as FY 07-08.
• Reno-Sparks Convention Center: Revenues are decreasing by $56,494 (-11.1%) as a result of a lower number of major conventions/trade shows. Concessions and catering revenue is projected to decrease by 33.1%. This is a result of the loss of major conventions such as American Legion, Supercomputing and AMS User Group as well as the potential restructuring of the commission structure with the food service provider as compared to the outlook.
• National Bowling Stadium: Revenues are projected to increase $860,199 (80.4%) as a result of USBC-Women’s tournament from March through July and anticipated attendance of 55,000 bowlers.
• Reno Events Center: Revenues are projected to increase $155,922 (6.8%). Revenue from Reno Events Center is based on “drop-in” business normally booked 90 -120 days out and includes facility rental, suite rental, food and beverage and ticket rebates.
• Reno-Sparks Livestock Events Center: Revenues are projected to increase $102,894 (6.2%) The increase reflects existing business, newly contracted business, and anticipated drop in business, as well a scheduled facility rate increase. The budget reflects a focus on new short term revenue producing events and an increase in parking rates.
Page 2
• Wildcreek Golf Course: Revenues are projected to increase $128,819 (6.2%) as a
result of 6,059 (10.2%) additional rounds. • Northgate Golf Club: Revenues are expected to increase $53,890 (6.5%), as a result
of 1,025 (5.6%) additional rounds and increased cart rental. The course is operated seasonally, being open from March through late November, given its location and elevation.
• General and Administrative: Revenues are projected to decrease $73,194 (-10.7%) as a result of decreased investment interest income.
• Convention Sales: Revenues are projected to increase $26,391 (19.5%) due to increased participation in industry events with our partners.
• Tourism Sales: Revenues are projected to decrease $2,945 (-4.5%) from previous year as a result of slightly less participation in industry events with our partners.
• Marketing: Revenues, consisting of sales of photos on our website, are projected to increase $890 (5.0%) from previous year.
• Investment Interest: Revenues are expected to decrease $80,974 (-12.6%) as a result of reduced interest rates.
• Insurance Contribution: Revenues are expected to increase $151,698 (8.0%) as a result of increased contributions for workers compensation and health insurance costs. In governmental accounting, employee group insurance withholdings along with RSCVA contributions are recorded as revenues to the insurance fund. As a result of the USBC-W tournament and assuming full staff, this accounts for the projected increase in revenues
Expenses: • Payroll and Related: Projected to increase $1,089,444 (7.4%). A merit pool of 4.0%
has been established for performance effective October, 2008. The budget assumes full staffing, with an allowance of 1.9% for vacancy savings, and a net reduction of two positions after adding two new positions: Event Services Manager at the Convention Center and a Tourism Sales Manager. Payroll and related expenses are projected to increase at the National Bowling Stadium due to the USBC-Women’s tournament in FY 08-09.
• Supplies and Services: Projected to increase $30,441 (0.4%) primarily at the National Bowling Stadium for costs associated with the USBC-Women’s tournament.
• Travel and Entertainment: Expenditures for the budget year are projected to increase $80,635 (13.0%) as a result of increased travel expenditures in Convention Sales and Tourism Sales as a result of full staffing and the additional sales manager in Tourism Sales.
• Promotion and Advertising: Expenditures are projected to decrease $428,694 (-9.2%). There will be a reduction in promotion and advertising expenses in Marketing and Sales as a result of not having the supplemental budget for FY 08-09 this is reflected in FY 07-08 outlook.
• Special Projects: Projected to increase $350,540 (23.4%). The budget reflects an increase of $173,321 in Marketing for the contractual obligations in the Special Events schedule. Convention Sales includes contractual obligations for scheduled groups. Tourism Sales includes $100,000 for the National Tour Association occurring in FY 09-10. At the National Bowling Stadium, decreased site fee payments for USBC-Women’s tournament of $134,000.
Page 3
• Capital Outlay: Reflects departmental increases of $4,019 (2.4%). Departmental
purchases for minor furniture, fixtures and equipment (FF&E) include ongoing desktop PC replacements, software upgrades, and server upgrades.
• Depreciation: Projected to increase $8,744 (1.6%) as a result of increased depreciation for golf course improvements.
• Insurance Fund: Projected to increase by $363,244 (19.2%) primarily as a result of increased health insurance costs as well as $150,000 set aside to begin funding our Other Post Employment Benefits (OPEB) liability.
• Capital Fund: Total capital expenditures within the FY 08-09 of $1,440,000 will be funded as follows:
$690,000 from bond proceeds remaining from the West Plaza Expansion; $325,000 from FY 07-08 capital reserve established per Strategic Plan Plank #5; $425,000 from FY 08-09 operations.
• Debt Service: Reflects a decrease of $1,159,798 (-11.2%) as a result of $225,000 in payments to service the medium term obligation, along with scheduled decreases in long-term debt payments.
• Contingency: The contingency fund, in the amount of $500,000 in the FY 08-09 budget, is a buffer in the event of downturns in economic conditions, allowing minimal or no adjustments to operating budgets. The FY 07-08 outlook reflects a carryover of $979,562:
$829,562 to fund FY 08-09 operations; Creation of a $150,000 operating (rainy day fund) reserve which is not
anticipated to be expended in FY 08-09. The carryover will be monitored closely in coming months, and if the anticipated carryover becomes unattainable, staff will present recommendations on FY 08-09 budget modifications to cover the shortfall.
The preparation of this budget is the result of the dedicated and efficient efforts of the entire staff. We would like to express our thanks to all in its preparation, and to the Board for their continued support and guidance. Respectfully submitted, Tim D. Smith Vice President - Finance attachments
Page 4

RENO-SPARKS CONVENTION AND VISITORS AUTHORITY FISCAL 2008-2009 ANNUAL FORECAST AND CAPITAL BUDGET
Five Year Strategic Plan
The Plan was developed by the staff and Board of Directors with a tremendous amount of input from partner organizations, stakeholder groups and community members. The plan was adopted by the Board of Directors during the first quarter of 2007. There are six main components that we refer to as planks:
Planks • Increase Convention Sales and Marketing • Increase Tourism Sales and Marketing • Special Events Philosophy and Funding • Efficiently Manage Assets • Develop Capital Improvement Program • Address Average Daily Rate
The plan is intended to serve as a guide for the organization for the next three to five years. Tactics to implement the plan will be incorporated into each upcoming RSCVA Annual Budget and Marketing & Sales Plan.
Plank 1 - Increase Convention Sales and Marketing
Increase Convention Sales and Marketing – Sell the destination as a place for conventions, tradeshows and meetings, while leveraging the group facility assets to book maximum lodging property room nights.
Background RSCVA owns and/or operates the Reno-Sparks Convention Center, Reno-Sparks Livestock Events Center, Reno Events Center and the National Bowling Stadium. Some of the visitor attraction assets are currently underutilized. RSCVA plans to increase utilization of these facilities and leverage them to better fill lodging property rooms in the region, bringing more visitors and ancillary revenue.
As Reno-Tahoe continues to evolve, one of the primary opportunities RSCVA will focus on is to bring meetings, conventions, and tradeshows to the destination. This market provides the opportunity to bring a visitor here who would not have normally visited. Once an individual, group or organization experiences Reno-Tahoe they are more likely to return. Using conventions and meetings to attract first-time visitors with the intent to get them to stay longer, or schedule a visit later with family or friends, will increase overnight visitation.
Page 5

RENO-SPARKS CONVENTION AND VISITORS AUTHORITY FISCAL 2008-2009 ANNUAL FORECAST AND CAPITAL BUDGET
Five Year Strategic Plan Continued
Examples of Initiatives • Increase convention citywide business (RSCC, REC) • Increase other business (Hotel, RSLEC, and NBS) • Extend your Stay
Key Measurements
• Achieve or exceed annual convention sales goals at the RSCC, REC, RSLEC and NBS • Have at least one major citywide convention a month (or the equivalent) within five
years • Build convention and tradeshow occupancy of the convention center to equal or exceed
the national average of facilities of comparable size within seven years
Page 6

9
Pro
pose
d am
endm
ent
rty
Key M
easu
rem
ent
302
311
2008
M
arke
ting
Com
mitt
ee to
Plan
k 1Ac
tual
Actu
alFo
reca
stYe
ar 1
Year
2Ye
ar 3
Year
4Ye
ar 5
2004
/2005
2005
/2006
2006
/2007
2007
/2008
2008
/200
2009
/2010
2010
/2011
2011
/2012
Incr
ease
Con
vent
ion
Sale
s &
Mar
ketin
g –
Tto
p pr
iorit
y is
to s
ell t
hede
stin
atio
n as
a p
lace
fco
nven
tions
, tra
desh
owan
d m
eetin
gs, w
hile
le
vera
ging
the
grou
p fa
cilit
y as
sets
to b
ook
max
imum
lodg
ing
prop
ero
om n
ight
s.
334,
002
355,
973
417,
500
450,
900
486,
970
525,
930
568,
000
1. A
chie
ve o
r exc
eed
our
annu
al c
onve
ntio
n sa
les
goal
s at
the
RS
CC
, RE
C, R
SLE
C
and
NB
S
Goa
l
417,
500
he
or
82%
ov
er p
s in
crea
se
revi
ous
year
inc
pre
6.5%
re
ase
over
vi
ous
year
i p
17.3
%
ncre
ase
ove
revi
ous
year r
8% in
crea
over
pre
vio
year
se
us
8% in
crov
er p
reye
aease
vi
ous
r
8% in
crea
se
over
pre
viou
s ye
ar
8% in
crea
se
over
pre
viou
s ye
ar
UP
DA
TE
Out
look
as
of
3-31
-08
302
311
,fro
mM
ayfro
m M
ay
364,
100
72%
of G
oal
19%
re
duct
ion
Page 7

RENO-SPARKS CONVENTION AND VISITORS AUTHORITY FISCAL 2008-2009 ANNUAL FORECAST AND CAPITAL BUDGET
Five Year Strategic Plan Continued
Plank 2 - Increase Tourism Sales and Marketing
Increase Tourism Sales and Marketing – Increase individual traveler and group traveler business for Reno-Tahoe by marketing regionally, nationally and internationally.
Background According to the 2007 Visitor Profile results, an estimated 48% of Reno-Tahoe leisure visitation is from California. Nearly four out of five (79%) of Reno-Tahoe visitors came from the west and mountain regions. Recognizing that northern California is a core market, programs targeting the area will continue. In addition, advertising in southern California is being done due to new and expanded air service. Another long-term consideration is the international market.
The Reno-Tahoe, America’s Adventure Place campaign will continue emphasizing that we are targeting the “young at heart” where YOU define the adventure, allowing the campaign to capitalize on the many destination offerings.
Examples of initiatives • Grow core products (i.e. Ski, Golf, Outdoor Adventures and Arts & Culture) • Increase individual and group business • Based on new air service in southern California, develop a consumer marketing
program to support visitation from that area (San Diego and/or Los Angeles) • Evaluate international market for Reno-Tahoe and develop a sales and marketing plan
for international tourism sales
Key Measurements • Achieve or exceed annual Tourism Sales goals
Page 8

Actu
alAc
tual
Fore
cast
Year
1Ye
ar 2
Year
3Ye
ar 4
Year
5Pl
ank
2K
ey M
easu
rem
ent
2004
/2005
2005
/2006
2006
/2007
2007
/2008
2008
/2009
2009
/2010
2010
/2011
2011
/2012
531,
349
571,
829
620,
534
651,
561
684,
139
718,
346
754,
263
Incr
ease
Tou
rism
Sal
es
1.A
chie
ve o
r exc
eed
and
Mar
ketin
g –
Incr
ease
an
nual
Tou
rism
Sal
es
3% In
crea
se
over
pre
viou
s ye
ar
8% In
crea
se
over
pre
viou
s ye
ar
9% In
crea
se
over
pre
viou
s ye
ar
5% In
crea
se
over
pre
viou
s ye
ar
5% In
crea
se
over
pre
viou
s ye
ar
5% In
crea
se
over
pre
viou
s ye
ar
5% In
crea
se
over
pre
viou
s ye
ar
indi
vidu
al tr
avel
er a
nd g
roup
tra
vele
r bus
ines
s fo
r Ren
o-Ta
hoe
by m
arke
ting
goal
s
regi
onal
ly, n
atio
nally
and
in
tern
atio
nally
.U
PD
ATE
Out
look
as
of
3-31
-08
Pro
pose
d am
endm
ent
495,
644
from
May
20
08
80%
of G
oal
Mar
ketin
g C
iC
omm
ittee
to
601,
152
7.7%
re
duct
ion
Page 9

RENO-SPARKS CONVENTION AND VISITORS AUTHORITY
FISCAL 2008-2009 ANNUAL FORECAST AND CAPITAL BUDGET
Five Year Strategic Plan Continued
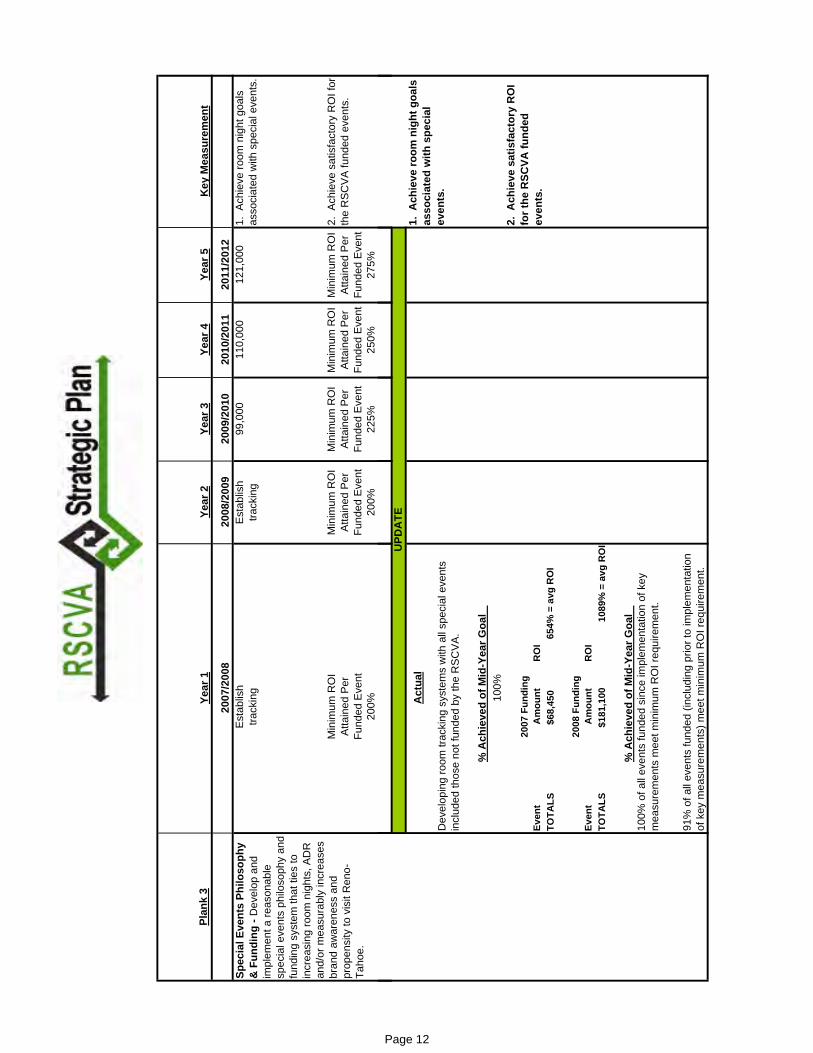
Plank 3 - Special Events Philosophy & Funding
Special Events Philosophy & Funding – Develop and implement a reasonable special events philosophy and funding system that ties to increasing room nights, ADR and/or measurable increased brand awareness and propensity to visit Reno-Tahoe.
Background The RSCVA vision for special events is to utilize new and existing special events to help brand the destination as America’s Adventure Place (AAP) via marketing opportunities, increased overnight visitation and book RSCVA-owned and operated facilities.
Special events in Reno-Tahoe help create a distinctive perception of the region and attract visitors to the area. With the success of special events in Reno-Tahoe and the destination’s unique ability to host large events, it is a natural fit for the RSCVA to be involved in the growth and future of special events in our community. The role that the RSCVA plays with regards to special events is very unique in comparison with other Convention and Visitors Authorities in cities of like size and budgets. The RSCVA’s mission is to market the destination with the ultimate goal to bring overnight visitors to Reno-Tahoe, while the City of Reno’s special event program purpose is to showcase the renaissance in our destination, stimulate interest in downtown and enhance the quality of life for residents and visitors to the Truckee Meadows. The RSCVA works with the Cities of Reno and Sparks to ensure we have complimentary special event programs.
In addition to the special events grants program the RSCVA has developed a variety of tools that special event organizers can utilize to be successful, ultimately contributing to the America’s Adventure Place branding and driving new room nights.
Examples of Initiatives • Adoption and implementation of new RSCVA special event philosophy • Implement new funding procedures including utilization of a panel of experts to help
evaluate all funding applications • Support networking to leverage knowledge and expertise • Roll out support services program including housing bureau, education component, and
buying power • Project brainstorm
Page 10

RENO-SPARKS CONVENTION AND VISITORS AUTHORITY FISCAL 2008-2009 ANNUAL FORECAST AND CAPITAL BUDGET
Five Year Strategic Plan Continued
Key Measurements
• Achieve room night goals associated with special events • Achieve satisfactory ROI for RSCVA funded events
Page 11
2008
/200
920
09/2
010
Est
ablis
h E
stab
lish
99,0
0012
1,00
0
275%
2007
/200
8hy
and
1. A
chie
ve ro
om n
ight
goa
ls
asso
ciat
ed w
ith s
peci
al e
vent
s.
Atta
ined
Per
Fu
nded
Eve
ntA
ttain
ed P
er
Fund
ed E
vent
Atta
ined
Per
Fu
nded
Eve
ntth
e R
SC
VA
fund
ed e
vent
s.
91%
of a
ll ev
ents
fund
ed (i
nclu
ding
prio
r to
impl
emen
tatio
n of
key
mea
sure
men
ts) m
eet m
inim
um R
OI r
equi
rem
ent.
% A
chie
ved
of M
id-Y
ear G
oal
10
0% o
f all
even
ts fu
nded
sin
ce im
plem
enta
tion
of k
ey
mea
sure
men
ts m
eet m
inim
um R
OI r
equi
rem
ent.
UPD
ATE
1. A
chie
ve ro
om n
ight
goa
ls
asso
ciat
ed w
ith s
peci
al
incl
uded
thos
e no
t fun
ded
by th
e R
SC
VA
.
Plan
k 3
Spec
ial E
vent
s Ph
iloso
p20
10/2
011
2011
/201
211
0,00
0
Year
1Ye
ar 2
Year
3Ye
ar 4
Year
5K
ey M
easu
rem
ent
& F
undi
ng -
Dev
elop
and
impl
emen
t a re
ason
able
sp
ecia
l eve
nts
philo
soph
yfu
ndin
g sy
stem
that
ties
tin
crea
sing
room
nig
hts,
Aan
d/or
mea
sura
bly
incr
eabr
and
awar
enes
s an
d pr
open
sity
to v
isit
Ren
o-Ta
hoe.
tra
ckin
gtra
ckin
g
250%
Atta
ined
Per
Fu
nded
Eve
ntA
ttain
ed P
er
Fund
ed E
vent
o DR
se
s M
inim
um R
OI
Min
imum
RO
I M
inim
um R
OI
Min
imum
RO
I 2.
Ach
ieve
sat
isfa
ctor
y R
OI f
or
Min
imum
RO
I
200%
200%
225%
Act
ual
even
ts.
Dev
elop
ing
room
trac
king
sys
tem
s w
ith a
ll sp
ecia
l eve
nts
2007
Fun
ding
2.
Ach
ieve
sat
isfa
ctor
y R
OI
for t
he R
SCVA
fund
ed
% A
chie
ved
of M
id-Y
ear G
oal
10
0%
Even
tA
mou
ntR
OI
even
ts.
TOTA
LS$6
8,45
065
4% =
avg
RO
I
Even
t20
08 F
undi
ng
Am
ount
RO
ITO
TALS
$181
,100
1089
% =
avg
RO
I
Page 12

RENO-SPARKS CONVENTION AND VISITORS AUTHORITY FISCAL 2008-2009 ANNUAL FORECAST AND CAPITAL BUDGET
Five Year Strategic Plan Continued
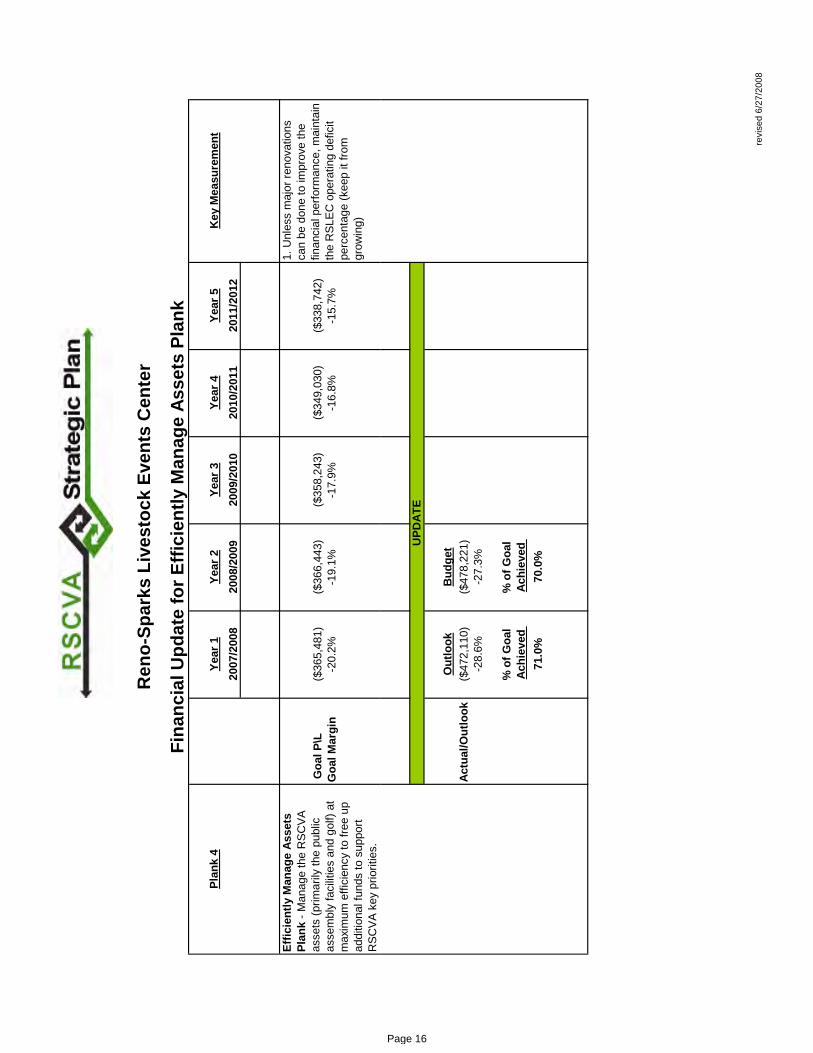
Plank 4 - Efficiently Manage Assets Efficiently Manage Assets – Manage the RSCVA assets (primarily the public assembly facilities and golf courses) at maximum efficiency to free up additional funds to support RSCVA key priorities.
Background RSCVA owns and/or operates the Reno-Sparks Convention Center, Reno-Sparks Livestock Events Center, National Bowling Stadium, Reno Events Center, Northgate and Wildcreek golf courses; and owns and leases the Pioneer Center for the Performing Arts and the IVCBVB visitor center facility. RSCVA needs to maximize the use of these valuable assets by maximizing revenues and managing expenses to reduce operating deficits. The Reno Events Center currently has an annual operating surplus, while the RSCC, RSLEC, NBS and both golf courses operate at a deficit, decreasing available funds for other priorities.
Examples of Initiatives Reno-Sparks Convention Center
• Increase RSCC occupancy and revenue produced • Implement cost-saving measures
Reno-Sparks Livestock Events Center • Continue and expand the existing efforts to recruit business with equestrian market
segment • Evaluate capital projects that could expend core business, increase revenue or reduce
expenses • Increase revenue generated at the RSLEC • Task Force formed in order to identify funding for needed improvements
Reno Events Center • Increase convention/tradeshow and other event occupancy and revenue to generate
additional funds to offset NBS operating deficit • Evaluate and recommend capital projects to the City of Reno that could increase
revenue or reduce expenses National Bowling Stadium
• Increase use of the National Bowling Stadium to increase revenue generated • Evaluate and recommend capital projects to the City of Reno that could increase
revenue or reduce expenses
Page 13

RENO-SPARKS CONVENTION AND VISITORS AUTHORITY
FISCAL 2008-2009 ANNUAL FORECAST AND CAPITAL BUDGET
Five Year Strategic Plan Continued
Northgate Golf Course • Re-analyze self operation potential by increasing use and/or prices, decreasing
expenses and/or making an investment that would allow a change in financial dynamics • Examine alternative golf operations • Evaluate alternative uses
Wildcreek Golf Course
• Increase rounds on executive course • Evaluate improvements necessary to allow revenue improvements and greater
competitiveness with newer public golf courses • Fine-tune to ensure continued break-even status
Key Measures
• Reduce the RSCC operating deficit percentage by half within five years • Unless major renovations can be done to improve the financial performance, maintain
the RSLEC operating deficit percentage • Improve REC operating surplus by 10% within five years • Keep NBS operating deficit percentage from growing • Eliminate operating deficit for Northgate Golf Course within two years and Wildcreek
Golf Course within three years • Achieve consistent positive customer satisfaction ratings for each facility
Page 14

Plan
k 4
Year
1Ye
ar 2
Year
3Ye
ar 4
Year
5K
ey M
easu
rem
ent
2007
/200
820
08/2
009
2009
/201
020
10/2
011
2011
/201
2
Goa
l P\L
($72
1,46
3)($
690,
839)
($65
8,26
1)($
623,
640)
($58
6,89
3)G
oal M
argi
n-1
6.0%
-14.
9%-1
3.8%
-12.
0%-1
1.6%
Effic
ient
ly M
anag
e As
sets
Pla
nk
- Man
age
the
RSC
VA a
sset
s (p
rimar
ily th
e pu
blic
ass
embl
y fa
cilit
ies
and
golf)
at m
axim
um
effic
ienc
y to
free
up
addi
tiona
l fu
nds
to s
uppo
rt R
SCVA
key
pr
iorit
ies.
1. R
educ
e th
e R
SCC
ope
ratin
g de
ficit
perc
enta
ge b
y ha
lf w
ithin
fiv
e ye
ars.
Ren
o-Sp
arks
Con
vent
ion
Cen
ter
Fina
ncia
l Upd
ate
for E
ffici
ently
Man
age
Asse
ts P
lank
Out
look
Bud
get
Actu
al/O
utlo
ok($
393,
450)
($75
5,63
5)-7
.8%
-16.
9%
% o
f Goa
l Ac
hiev
ed
% o
f Goa
l Ac
hiev
ed
205.
0%88
.0%
p
UPD
ATE
revi
sed
6/27
/200
8
Page 15
p
ess
maj
or re
nova
tions
o
impr
ove
the
enta
ge (k
eep
it fro
m
ng)
revi
sed
6/27
/200
8
Ren
o-Sp
arks
Liv
esto
ck E
vent
s C
ente
r
Fina
ncia
l Upd
ate
for E
ffici
ently
Man
age
Asse
ts P
lank
Plan
k 4
Year
1Ye
ar 2
Year
3Ye
ar 4
Year
5K
ey M
easu
rem
ent
2007
/200
820
08/2
009
2009
/201
020
10/2
011
2011
/201
2
Effic
ient
ly M
anag
e As
sets
Pl
ank
- Man
age
the
RSC
VAas
sets
(prim
arily
the
publ
ic
asse
mbl
y fa
cilit
ies
and
golf)
max
imum
effi
cien
cy to
free
uad
ditio
nal f
unds
to s
uppo
rt R
SCVA
key
prio
ritie
s.
1. U
nlca
n be
don
e t
finan
cth
e R
SLEC
ope
rpe
rcgr
owi
Goa
l P\L
($36
5,48
1)($
366,
443)
($35
8,24
3)($
349,
030)
($33
8,74
2)ia
l per
form
ance
, mai
ntai
n G
oal M
a a
t rg
in-2
0.2%
-19.
1%-1
7.9%
-16.
8%-1
5.7%
atin
g de
ficit
UPD
ATE
Out
look
Bud
get
Actu
al/O
utlo
ok($
472,
110)
($47
8,22
1)-2
8.6%
-27.
3%
% o
Acf G
oal
hiev
ed
% o
f Goa
l Ac
hiev
ed
71.0
%70
.0%
Page 16

lank
l
S to
mai
ntai
n M
argi
n.
revi
sed
6/27
/200
8
Nat
iona
l Bow
ling
Stad
ium
Fina
ncia
l Upd
ate
for E
ffici
ently
Man
age
Asse
ts P
lank
Plan
k 4
Year
1Ye
ar 2
Year
3Ye
ar 4
Year
5K
ey M
easu
rem
ent
2007
/200
820
08/2
009
2009
/201
020
10/2
011
2011
/201
2
Effic
ient
ly M
anag
e As
sets
P- M
anag
e th
e R
SCVA
ass
ets
(prim
arily
the
publ
ic a
ssem
bly
faci
litie
s an
d go
lf) a
t max
imum
effic
ienc
y to
free
up
addi
tiona
fund
s to
sup
port
RSC
VA k
ey
prio
ritie
spr
iorit
ies.
1. N
B
Goa
l P\
L
($1,
948,
093)
($1,
507,
493)
($1,
303,
482)
($2,
019,
426)
($1,
524,
897)
Goa
l Ma
rg
in-2
11.4
%-8
9.2%
-51.
0%-2
03.5
%-8
6.0%
UPD
ATE
Out
look
Bud
get
Actu
al/O
utlo
ok($
2,06
8,88
9)($
1,58
2,06
0)-1
65.7
%-8
2.0%
%
Aof
Goa
l ch
ieve
d %
of G
oal
Achi
eved
12
8.0%
109.
0%
Page 17

p
prov
e th
e R
EC M
argi
n 10
%
revi
sed
6/27
/200
8
Ren
o Ev
ents
Cen
ter
Fina
ncia
l Upd
ate
for E
ffici
ently
Man
age
Asse
ts P
lank
Plan
k 4
Year
1Ye
ar 2
Year
3Ye
ar 4
Year
5K
ey M
easu
rem
ent
2007
/200
820
08/2
009
2009
/201
020
10/2
011
2011
/201
2
Effic
ient
ly M
anag
e As
sets
Pl
ank
- Man
age
the
RSC
VA
asse
ts (p
rimar
ily th
e pu
blic
as
sem
bly
faci
litie
s an
d go
lf) a
max
imum
effi
cien
cy to
free
uad
ditio
nal f
unds
to s
uppo
rt R
SCVA
key
prio
ritie
s.
1. Im
Goa
l P\L
$198
,498
$231
,304
$262
,267
$295
,120
$329
,958
Goa
l Ma
t rg
in8.
8%9.
6%10
.5%
11.4
%12
.2%
UPD
ATE
Out
look
Bud
get
Actu
al/O
utlo
ok$4
4,28
8$1
16,2
381.
9%4.
8%
%
Aof
Goa
l ch
ieve
d %
of G
oal
Achi
eved
21
.6%
50.0
%
Page 18

ank
-
unds
.
Wild
cree
k pr
oduc
e pr
ofit
by
11
revi
sed
6/27
/200
8
Wild
cree
k G
olf C
ours
e
Fina
ncia
l Upd
ate
for E
ffici
ently
Man
age
Asse
ts P
lank
Plan
k 4
Year
1Ye
ar 2
Year
3Ye
ar 4
Year
5K
ey M
easu
rem
ent
2007
/200
820
08/2
009
2009
/201
020
10/2
011
2011
/201
2
Effic
ient
ly M
anag
e As
sets
Pl
Man
age
the
RSC
VA a
sset
s (p
rimar
ily th
e pu
blic
ass
embl
y fa
cilit
ies
and
golf)
at m
axim
um
effic
ienc
y to
free
up
addi
tiona
l fto
sup
port
RSC
VA k
ey p
riorit
ies
1. FY 1
0- G
oal P
\L($
91,3
66)
($55
,350
)$5
,218
$58,
737
$116
,260
Goa
l Mar
gin
-4.6
%-2
.4%
0.2%
2.3%
4.4%
UPD
ATE
Out
look
Bud
get
Actu
al/O
utlo
ok($
220,
655)
($15
2,16
0)-1
0.6%
-6.9
%
% A o
f Goa
l ch
ieve
d %
of G
oal
Achi
eved
43
.0%
35.0
%
Page 19

ank
- th
gate
to e
limin
ate
ses
by F
Y 09
-10
revi
sed
6/27
/200
8
Nor
thga
te G
olf C
ours
e
Fina
ncia
l Upd
ate
for E
ffici
ently
Man
age
Asse
ts P
lank
Plan
k 4
Year
1Ye
ar 2
Year
3Ye
ar 4
Year
5K
ey M
easu
rem
ent
2007
/200
820
08/2
009
2009
/201
020
10/2
011
2011
/201
2
Effic
ient
ly M
anag
e As
sets
Pl
Man
age
the
RSC
VA a
sset
s (p
rimar
ily th
e pu
blic
ass
embl
y fa
cilit
ies
and
golf)
at m
axim
umef
ficie
ncy
to fr
ee u
p ad
ditio
nal
fund
s to
sup
port
RSC
VA k
ey
prio
ritie
s.
1. N
orlo
s G
oal P
\L($
547,
750)
($57
3,80
5)$0
$0$0
Goa
l Ma
rg
in-6
2.7%
-62.
7%0.
0%0.
0%0.
0%
UPD
ATE
Out
look
Bud
get
Actu
al/O
utlo
ok($
528,
180)
($52
7,09
4)-6
3.9%
-59.
9%
%
Aof
Goa
l ch
ieve
d %
of G
oal
Achi
eved
98
.0%
105.
0%
Page 20

RENO-SPARKS CONVENTION AND VISITORS AUTHORITY FISCAL 2008-2009 ANNUAL FORECAST AND CAPITAL BUDGET
Five Year Strategic Plan Continued
Plank 5 - Develop Capital Improvement Program Develop Capital Improvement Program – Create a reasonably phased capital improvement plan for the RSCVA-owned facilities to ensure they remain safe and competitive with industry standards.
Background RSCVA assets are insured for approximately $250,000,000 a year. It is imperative that we develop and maintain a capital improvement program to ensure that the existing facilities are safe and competitive within industry standards. An on-going capital improvement program should be developed and funded to address life safety and life cycle replacement needs. Parallel to other convention facilities, major improvements/expansions are likely to require large scale one-time or debt service funded financing tools.
Example of Initiatives • Address all life safety issues promptly • Examine potential cost-saving or revenue enhancement projects and implement if ROI
warrants • Identify ways to fund needed life cycle investments • Explore potential long-term funding strategies to address major improvements
Page 21

Plan
k 5
Year
1Ye
ar 2
Year
3Ye
ar 4
Year
5To
tal
Key
Mea
sure
men
t
2007
/200
820
08/2
009
2009
/201
020
10/2
011
2011
/201
2
$150
,000
$750
,000
$1,5
00,0
00$2
,000
,000
$2,5
00,0
00
$0$2
50,0
00$5
00,0
00$5
00,0
00$0
$1,2
50,0
00
UPD
ATE
Dev
elop
Cap
ital I
mpr
ovem
ent
Prog
ram
1.
Est
ablis
h an
ann
ual c
apita
l bu
dget
allo
catio
n w
ithin
5 y
ears
of
at le
ast 1
% o
f the
insu
red
valu
e of
th
e fa
cilit
ies
that
can
be
used
ea
ch y
ear f
or th
e hi
ghes
t prio
rity
2. E
stab
lish
a ca
pita
l rev
enue
w
ithin
five
yea
rs o
f .5%
of t
he
insu
red
valu
e of
the
faci
litie
s th
at
is a
vaila
ble
to a
ddre
ss e
mer
genc
y an
d un
fore
seen
but
ess
entia
l ca
pita
lim
prov
emen
ts
Actu
als
Budg
eted
1. $
350,
000
1. $
1,34
0,00
023
3% o
f Goa
l17
9% o
f Goa
l
2. $
150,
000
2. $
100,
000
40%
of G
oal
UPD
ATE
$150
,000
ahe
ad
of G
oal
capi
tal i
mpr
ovem
ents re
vise
d 6/
20/2
008
Page 22

RENO-SPARKS CONVENTION AND VISITORS AUTHORITY FISCAL 2008-2009 ANNUAL FORECAST AND CAPITAL BUDGET
Five Year Strategic Plan Continued
Plank 6 - Address Average Daily Rate Address Average Daily Rate – Act as a catalyst to create and foster a destination-wide revenue management culture through providing our stakeholders with tools, education and incentives that promote the growth in Average Daily Rate, Revenue Per Available Room and RSCVA resources.
Background Over the last 10 years, the Reno-Tahoe hotel and casino market has grown Average Daily Rate (ADR) at a slow pace compared to the majority of the North American hotel market which has seen a more substantial growth in ADR. Per Smith Travel Research, the average ADR for the entire country will exceed $100.00 for the first time in 2007. Growth in ADR, and the maintenance or growth of occupancy would have an extremely positive impact on the Reno-Tahoe lodging and casino market. Not only would the Reno-Tahoe market be more attractive to new hotel, motel and casino investment, but existing facilities would have better opportunity to re-invest in infrastructure. Focus on marketing to increase demand and help stimulate ADR growth by creating a growing customer base for Reno-Tahoe that has discretionary income. An increased focus on revenue per available room (RevPar) growth would also positively impact RSCVA funding.
Examples of Initiatives
• Develop a culture of revenue management with educational programs and associated policies
• Develop and provide tools to analyze Reno-Tahoe performance vs. competitive markets • Increase use of conventions, groups and special events to drive predictability and
effective revenue management
Page 23

9
$78.
41
Plan
k 6
Act
ual
Act
ual
Act
ual
Year
1Ye
ar 2
Year
3Ye
ar 4
Year
5K
ey M
easu
rem
ent
2004
/200
520
05/2
006
2006
/200
720
07/2
008
2008
/200
2009
/201
020
10/2
011
2011
/201
2
Add
ress
Ave
rage
Dai
lR
ate
– A
ct a
s a
cata
lys
and
crea
te a
nd fo
ster
ade
stin
atio
n-w
ide
reve
num
anag
emen
t cul
ture
th
roug
h pr
ovid
ing
our
stak
ehol
ders
with
tool
s,ed
ucat
ion,
and
ince
ntiv
that
pro
mot
e gr
owth
in
Ave
rage
Dai
ly R
ate
(AD
R),
Rev
enue
Per
A
vaila
ble
Roo
m
(Rev
PA
R) a
nd R
SC
VA
re
sour
ces.
AD
Ry
AD
RA
DR
AD
RA
DR
AD
RA
DR
AD
R1.
RS
CV
A to
cre
ate
mar
ket
awar
enes
s an
d de
man
d th
at w
ill
enab
le th
e lo
dgin
g pr
oper
ties
to
mak
e de
cisi
ons
to a
llow
the
Ann
ual
AD
R to
reac
h th
e cu
rren
t mid
poin
t of
the
com
petit
ive
set o
f con
vent
ion
citie
s (a
ppro
xim
atel
y $9
5) w
ithin
five
ye
ars
$62.
8t
8 $6
6.83
$7
4.12
$7
4.10
$8
0.06
$8
5.63
$9
0.72
$9
5.06
6.3
Incr ov
prev ye
e es
% o
f ea
se
er
ious
ar
10 In pr
.9%
of
crea
se
over
ev
ious
ye
ar
5.2%
of
incr
ease
ov
er
prev
ious
ye
ar
8% o
f In
crea
se
over
pr
evio
us
year
6.9%
oIn
crea
seov
er
prev
ious
year
f
5.9%
of
Incr
ease
ov
er
prev
ious
ye
ar
4.8%
of
Incr
ease
ov
er
prev
ious
ye
ar
UP
DA
TE
Out
look
Bud
get
$78.
41
$81.
08
$8
1.08
106%
of
Goa
l10
1% o
f G
oal
Page 24

RENO-SPARKS CONVENTION AND VISITORS AUTHORITY FISCAL 2008-2009 ANNUAL FORECAST AND CAPITAL BUDGET
SWOT Analysis
Business Climate:
Strengths (Internal): • Low cost of living • Favorable business environment • Proximity to California • Strong capabilities in logistics and distribution • Great air service for community of our size • Proximity of airport to downtown • Location on I-80 corridor provides strong East/West road access • Wide variety of casino action located in close geographical area • Becoming a diversified economic base • Redevelopment and reinvestment happening city-wide • Quality lifestyle – safe community/clean air/lack of traffic • Outdoor Recreation • Facility Management – able to operate and market our own facilities
Weaknesses (Internal):
• Over-reliance on room tax revenue • Gaming market facing significant competition • Limited marketing dollars • No known flagship business hotel • Heavily invested in facility management/lack of operating and capital reserves
Opportunities (External):
• Continue to work on cooperative regional marketing effort to fully develop local economy
• Pending hotel/casino re-investment • First tier cities are becoming too expensive/pricing out of consideration for many
groups • Proliferation of gaming worldwide – creating more opportunities and increasing
acceptance as a recreational activity Threats (External):
• Tight labor supply • Shrinking availability of entry-level workers • Heavy dependence on gaming driven economy/casino’s not diversifying revenue
streams • Limited non-stop air service
Page 25
RENO-SPARKS CONVENTION AND VISITORS AUTHORITY FISCAL 2008-2009 ANNUAL FORECAST AND CAPITAL BUDGET
SWOT Analysis Continued
• Competition from competitive and previously non-competitive cities to sell to
special events, meetings, conventions and tradeshows – second tier cities now competing
• Unstable fuel costs affect transportation budgets • Need for continued reinvestment in facilities • Internet Gaming • Surrounding (downtown) convention facilities are not engaging/more downtown
redevelopment needed to enhance walking core • Lack of retail in downtown/not visually pleasing
Sales & Marketing (Convention Sales, Tourism Sales and Marketing):
Strengths (Internal): • Excellent facilities-RSCC/REC/NBS • Variety of hotel accommodations • DC, Chicago, Northern California satellite offices • Value destination • Established destination brand (RTAAP) • Strong re-branding positioning story (PR opportunities) • Destination web site (VisitRenoTahoe.com) • Outdoor recreation amenities • Four seasons • Proximity to Lake Tahoe • Sporting-event friendly • Gaming • University within city limits • One-stop air service; International Airport • New shopping available • Vibrant arts, culture and heritage product • Unique special events • Top-name entertainment • New product development with niche markets • Experienced staff
Page 26

RENO-SPARKS CONVENTION AND VISITORS AUTHORITY FISCAL 2008-2009 ANNUAL FORECAST AND CAPITAL BUDGET
SWOT Analysis Continued
Weaknesses (Internal):
• Destination perception • Need to differentiate adventure destination marketing (lots of destinations promoting "adventure") • Increase use of technology to promote • Improve internal marketing & sales integration • Small base of business/repeat business to draw from • Limited sales and marketing budget
Opportunities (External): • More hotel inventory to be developed close to RSCC • Increase special event community cooperation (City, County, RSCVA) • Utilize and further develop existing infrastructure to attract sporting events that
warrant regional/national exposure • City redevelopment • Increase upscale shopping options • Increase non-stop air service • Continue development of the Truckee River plan • Reinvestment in hotel properties • New product development with niche markets • International markets opening (China)-NCOT license, Nevada the only state with
outbound partnership with China • Growing attitude of cooperation with properties/active participation in travel and
trade shows • Partnership with untraditional travel industry related entities
Threats (External): • Dependence on gaming customers • Fluctuating gas prices/impact on travel • Competition in river development in other cities • Proliferation of Indian gaming/expansion of amenities and gaming opportunities • Downtown under construction • Hotel product (rooms, internet access, close proximity to RSCC) • Limited pedestrian friendly area around RSCC • Lack of quality high end and chain hotels • Increased expansion of facility space in competitive markets • Uncontrolled growth and shrinking of public lands
Page 27

RENO-SPARKS CONVENTION AND VISITORS AUTHORITY FISCAL 2008-2009 ANNUAL FORECAST AND CAPITAL BUDGET
SWOT Analysis Continued
Facilities (REC, NBS, RSLEC, RSCC): Strengths (Internal):
REC • Capacity for shows (7,000) is a great size for our market and very popular with
the majority of live entertainment available today • Intimate setting for shows (not a bad seat in the house) • Location – within walking distance of approximately 6,000 convention quality
hotel rooms • Reno Events Center is “new” • Unlimited floor load limits, aircraft hanger door for large equipment access • Ability to partner with largest entertainer promoters in the world • Receive good support from NEWCO in the form of sponsorships and ticket buys
for popular entertainment NBS • World-class bowling stadium • New scoring system, recently renovated bowling lanes and carpet • Long-term contracts with USBC RSLEC • History of hosting very large successful events • Central western location for regional horse shows RSCC • Space inventory (more than 500,000 of public space) & date availability • Ability to negotiate convention/trade show discounts in-house • Ample parking – 1,900 spaces • Unlimited floor load limits, aircraft hanger door for large equipment access All RSCVA Facilities • Lodging inventory – 15,000 hotels/5,000 motel and other properties • Ability to host a variety of events – trade shows, concerts, sports tournaments • Competitive labor rates • Experienced staff • Destination - proximity to natural resources & activities
Page 28

RENO-SPARKS CONVENTION AND VISITORS AUTHORITY FISCAL 2008-2009 ANNUAL FORECAST AND CAPITAL BUDGET
SWOT Analysis Continued
Weaknesses (Internal):
REC • Limited revenue producing parking • Limited breakout space/meeting rooms NBS • Single-use facility RSLEC • Limited revenue producing parking • Size of facility limits ancillary revenue opportunities • Equestrian/ Livestock events seasonal due to weather/road conditions • Aging facility • Not a “walk friendly” neighborhood RSCC • Number of convention quality hotels within walking distance • Lack of greeters and concierge staff • Facility maintenance/daily and capital • Not a “walk friendly” neighborhood All RSCVA Facilities • Air service (lift) • Lack of marketing/special events dollars to entice new events • Lack of available resources to reinvest in facilities • Lack of local marketing efforts
Opportunities (External):
REC • Enhance REC to expand production opportunities • Population/market size continues to grow and diversify (capable of attracting
variety of acts and sell more tickets) • Include entertainment line-up in destination marketing efforts • Increase sign/advertising revenue NBS • Dedicated sales effort to drive group business • Special event / parties from increased convention business • NBS promoted events ( National Mixed / Pro Am) RSLEC • Renovation of property to entice a professional sports team to improve facilities
bottom line • Work with Associations to build new regional events RSCC • WiFi access throughout facility – fiber throughout building • Expansion of local hotels – Grand Sierra, Peppermill, Atlantis and Stations
Page 29
RENO-SPARKS CONVENTION AND VISITORS AUTHORITY
FISCAL 2008-2009 ANNUAL FORECAST AND CAPITAL BUDGET
SWOT Analysis Continued
• Do It Now promotional efforts – in conjunction with Well Bread (food service provider) and staff support
• Review possibility for a comprehensive contract for space rental and services • Space to provide continued growth of conventions and trade shows
Threats (External):
REC • Dependant on independent promoters/casino operators for booking • Building owned by City of Reno (no direct control over re-investment/upkeep of
facility)-dependent upon City for capital improvements • If entertainment product is limited; could affect suite value and revenue • Entertainment at Lake Tahoe NBS • Building owned by City of Reno (no direct control over re-investment/upkeep of
facility)-dependent upon City for capital improvements • Bowling participation and league play is shrinking • Dependent on USBC for marketing both major events RSLEC • New facilities on west coast being built • Competing facilities with ability to purchase events All RSCVA Facilities • Facilities need capital improvements • Limited air service compared to comparative destinations for conventions and
trade shows • Perception of Reno as “old gambling town” • Limited number of businesses and convention hotels (rooms w/desks, internet
access/expanded health clubs and spas) • Casino free meeting access
Page 30

RENO-SPARKS CONVENTION AND VISITORS AUTHORITY FISCAL 2008-2009 ANNUAL FORECAST AND CAPITAL BUDGET
INTRODUCTION
THE RENO-SPARKS CONVENTION AND VISITORS AUTHORITY
The Reno-Sparks Convention and Visitors Authority, an independent governmental entity, was established in February 1959 as the Washoe County Fair and Recreation Board. The Authority is the operating instrument in the Washoe County area for promoting conventions, tourism, and recreation. To provide revenue for such purposes, pursuant to the Fair and Recreation Board statute and related provisions of the Nevada Revised Statutes, a tax on the income from room charges of transient rental facilities is imposed by the state, county, and the incorporated cities of Reno and Sparks. The tax rates are thirteen and one half percent (13.5%) in Downtown Reno, thirteen and one half percent (13.5%) in Sparks, and twelve percent (12%) in the unincorporated areas of Washoe County and remaining portions of Reno. Countywide: • The Authority collects these taxes and retains a total of 8 5/8%. • 1% National Bowling Stadium tax that is going to the City of Reno. • 3/8% is remitted to the State of Nevada Department of Taxation. The remainder is distributed as follows: • 1% of the tax collected in Reno is returned to the City of Reno. • 1% of the tax collected in the unincorporated areas of Washoe County is
returned to Washoe County. • 1.5% tax in downtown Reno for the Reno Events Center. • 2.5% of the tax collected is returned to Sparks for the Victorian Square
Project. • The remaining 1% is allocated between:
1. Lowering the railroad tracks in downtown Reno, and; 2. The construction of the Reno Events Center.
The Authority consists of a thirteen-member board comprised of: (a) two members of the Board of County Commissioners of Washoe County; (b) two members of the City Council of the City of Reno, Nevada; (c) one member of the City Council of the City of Sparks, Nevada; (d) seven members appointed by the aforementioned elected officials; and (e) one from Incline Village/Crystal Bay. The seven members set forth in the item are selected from nominations made by gaming, motel and other industry associations, or the Greater Reno-Sparks Chamber of Commerce. Furthermore, these members must be actively engaged in the gaming industry (three members), the motel industry (one member), the finance industry (one member), the airline industry (one member), and general
Page 31

RENO-SPARKS CONVENTION AND VISITORS AUTHORITY FISCAL 2008-2009 ANNUAL FORECAST AND CAPITAL BUDGET
INTRODUCTION CONTINUED
business or commerce (one member). Private sector members serve two-year terms, and are limited to a maximum of two consecutive terms. Representatives of the various governmental entities serve until the expiration of their respective terms of office. The Authority operates the Reno-Sparks Convention Center, Wildcreek Golf Course, Northgate Golf Club, Reno-Sparks Livestock Events Center, and manages through the City of Reno the National Bowling Stadium and the Reno Events Center. Two additional facilities are owned by the Authority but operated under management agreements with other organizations. They are the Pioneer Center for the Performing Arts, which is operated under a management contract with the Reno Performing Arts Council Association, and the Visitor’s Center at Incline Village, North Lake Tahoe, which is operated by the Incline Village/Crystal Bay Visitor and Convention Bureau. For reporting and management purposes, the Authority’s funds are segregated into multiple departments. The General Fund includes: • Executive Office • Board of Directors • Finance and Purchasing • Room Tax • Human Resources • Information Technology • Mail Services • Reno-Sparks Convention Center • Reno-Sparks Livestock Events Center • Convention Sales and Services • Visitors Centers and Services • Marketing • Tourism Sales • National Bowling Stadium • Reno Events Center The Golf courses are accounted for in an enterprise fund. Each of the courses is broken down into three departments: • Operations • Food and Beverage • Cart and Range
Page 32

RENO-SPARKS CONVENTION AND VISITORS AUTHORITY FISCAL 2008-2009 ANNUAL FORECAST AND CAPITAL BUDGET
DOCUMENT PRESENTATION
The budget document has been formatted to separate the major departments and/or activities and to provide specific information about each. In so doing, the reader may gain a clear understanding of the budget. The activities of the Authority are contained within its various funds. This is necessary to comply with legal requirements for segregation, to better facilitate management control, or to satisfy the requirements of general accepted accounting principles. In governmental accounting, the term “fund” is used to identify a separate accounting entity with its own assets, liabilities, revenues and expenditures. This document is organized on the basis of these funds and the activities they contain.
Page 33
RENO-SPARKS CONVENTION AND VISITORS AUTHORITY FISCAL 2008-2009 ANNUAL FORECAST AND CAPITAL BUDGET
THE BUDGETARY PROCESS
The Authority follows the procedures outlined below in establishing the budgetary data reflected in the financial statements:
1. On or before April 15, the Authority submits a proposed operating
budget for the fiscal year commencing the following July 1, to the Department of Taxation.
The operating budget includes proposed expenditures and expenses and the means of financing all governmental and proprietary funds. Budgets for governmental funds are prepared on the modified accrual basis of accounting. Those for proprietary funds are prepared on the accrual basis of accounting.
2. Public hearings are conducted on the third Thursday or Friday in May
to obtain public comments.
3. On or before June 1, the budget is legally enacted through passage of a resolution by a majority vote of the Authority Board.
4. Department heads are authorized to transfer appropriations between
accounts within their respective departments subject to approval of the Chief Executive Officer. The Chief Executive Officer is authorized to transfer appropriations between departments within the various functional levels of the General Fund. The Authority Board must approve any revisions that alter or augment total appropriations or transfer appropriations between functional levels. Formal budgetary integration is employed as a management control device during the year for all funds of the Authority, except the Agency Fund, which, is not required to be budgeted.
5. Budgeted appropriations may not be exceeded by actual expenditures
of the various governmental functions in the General and Capital Projects Funds. State statutes do not require that debt service payments be limited by the budget. At year-end, any unencumbered appropriations lapse and outstanding encumbrances are re-appropriated in the following year’s budget. Actual expenses may not exceed the sum of budgeted operating and non-operating expenses in proprietary funds.
Page 34

RENO-SPARKS CONVENTION AND VISITORS AUTHORITY FISCAL 2008-2009 ANNUAL FORECAST AND CAPITAL BUDGET
FINANCIAL STRUCTURE AND ACCOUNTING SYSTEM
As previously indicated, the Authority’s financial structure is comprised of a number of funds. These include three governmental type funds, the General Fund (Fund 15), the Capital Projects Fund (Fund 23), and the Debt Service Fund (Fund 25); and two proprietary type funds, the Golf Course Fund (Fund 16), which is operated as an enterprise fund, and the Self Insurance Fund (Fund 20), an internal service fund. All funds are budgeted for and accounted for under either the accrual or modified accrual basis. The governmental funds are accounted for on a spending or “financial flow” basis. Only current assets and liabilities are included in their balance sheets, and their fund balance is considered to represent their “available spendable resources”. The governmental type funds of the Authority function as follows: 1. General Fund
The General Fund is the principal operating fund of the Authority. It is used to account for all financial resources except those required to be accounted for in another fund. It contains the various departments that comprise the general government and facility operations. In addition, fund transfers from the General Fund are the principal source of resources for the Debt Service Fund.
2. Capital Projects Fund
The Capital Projects Fund is used to account for the financial resources used to acquire, construct or make major repairs and renovations to capital facilities not included in an enterprise fund.
3. Debt Service Fund
The Debt Service Fund is used to account for the accumulation of resources or the repayment of general long-term debt, principal and interest, and related costs.
The Authority’s proprietary funds are accounted for on the basis of capital maintenance and include all assets and liabilities, both current and noncurrent, associated with the activity. The focus of the proprietary funds is on the determination of net income, changes in financial position and management control.
Page 35

RENO-SPARKS CONVENTION AND VISITORS AUTHORITY FISCAL 2008-2009 ANNUAL FORECAST AND CAPITAL BUDGET
FINANCIAL STRUCTURE AND ACCOUNTING SYSTEM CONTINUED
1. Golf Courses Enterprise Fund
This fund is used to account for the operations of the Authority’s two golf courses, Wildcreek Golf Course and Northgate Golf Club.
2. Self-Insurance Internal Service Fund
This fund is used to account for the activity and administration of the Authority’s self-insurance program.
Page 36

RENO-SPARKS CONVENTION AND VISITORS AUTHORITY FISCAL 2008-2009 ANNUAL FORECAST AND CAPITAL BUDGET
Fiscal Year 2008-09 Budget Calendar
• Tuesday January 22 Finance Department to distribute 6 month actual and 6 month planned to each department for review and update of the 2007-08 Outlook
• Tuesday February 5 Proposed changes to the 2007-08 Outlook due back to the Finance
Department from each Department • Friday February 8 Finance Department to review proposed changes to the 2007-08
Outlook with the President/CEO
• Tuesday February 12 2008-09 Budget spreadsheets to be distributed to each department from Finance including payroll for full-time staff with the 2007-08 approved Outlook
• Monday February 25 First draft & highlights due to Finance from all departments with
appropriate approval from the Department Manager and VP • Thursday February 28 Executive staff and VPs to review each department’s tentative 08-09
Budget with President/CEO and VP of Finance
• Monday March 24 Final Tentative Budget Approved with VPs and President/CEO
• Tuesday April 15 Tentative budget to be filed with the Department of Taxation (NRS 354.596)
• Wednesday April 30 Finance Committee Meeting: RSCVA Budget workshop with Finance
Committee and open to the full Board for discussion
• Thursday May 15 RSCVA Board of Directors Meeting: Tentative budget public hearing
date for general improvement, special districts and other districts whose budgets ARE NOT administered by the board of county commissioners
• Monday June 02 Final budget submitted to State
Page 37

RENO-SPARKS CONVENTION AND VISITORS AUTHORITY FISCAL 2008-2009 ANNUAL FORECAST AND CAPITAL BUDGET
FINANCIAL POLICIES
The Authority classifies its financial policies into the following major groups:
• Financial Planning • Revenue • Expenditure
Financial Planning Policies
1. Balanced Budget – The Authority, under normal circumstances, submits and maintains a balanced operating budget (i.e. Revenues = Expenditures/Expenses, adjusted for cash flow items).
2. Long–Range Planning – The Authority during the operating budget
process assesses the future needs of the organization with the goal of anticipating any variations or needs that would have an impact on the organizations financial well being. Examples of this are expansion needs of facilities, variations in revenue collections between large events (bowling tournaments primarily), and future debt and cash flow needs.
3. Asset Inventory – The Authority currently includes as capital assets
those assets which have a life of greater than one year and which cost a minimum of $5,000. As such, the majority of the assets reflected on the books of the Authority represent the facilities and buildings operated. Each fiscal year an assessment is completed comprising capital needs to maintain these assets in their current condition. The needs are reflected in the capital detail section of the budget.
Revenue Policies
1. Revenue Diversification – The Authority’s largest revenue source, room taxes, are largely out of the control of the RSCVA. In an attempt to maximize room tax revenues, the room tax audit department has been created and enlarged to verify that all amounts due to the Authority are being collected. Other major revenue sources include facility rentals, interest income and Convention & Visitor Services revenues.
2. Fees & Charges – The Authority collects fees from users of the
Authority’s golf courses as well as facility charges at the Reno-Sparks
Page 38

RENO-SPARKS CONVENTION AND VISITORS AUTHORITY FISCAL 2008-2009 ANNUAL FORECAST AND CAPITAL BUDGET
FINANCIAL POLICIES CONTINUED
Convention Center, Reno Events Center, National Bowling Stadium and Reno-Sparks Livestock Events Center. The long-term goal for these fees is for all Authority facilities to cover their own operating costs.
3. Use of One-time Revenues – The Authority does not encourage the
use of one-time revenues for ongoing expenditures, but instead prefers the funds be utilized to reduce debt or future capital financing needs.
4. Use of Unpredictable Revenues – The Authority’s largest revenue
source, room taxes, is largely unpredictable and uncontrollable by the Authority. As such, trend analysis and known fluctuations are used to make estimates as to the amount of this revenue stream to be incorporated within the annual budget.
Expenditure Policies
1. Debt Capacity, Issuance and Management – The Authority, under normal circumstances, issues general obligation bonds that are backed by Washoe County to maximize the rating on the bonds, thereby minimizing the interest costs on funds borrowed. Debt is normally issued only for refunding currently outstanding debt, to reduce total debt service costs, or to expand or build facilities.
The maximum debt capacity of the organization is set statutorily at 3% of assessed property valuation within Washoe County. Annual debt service requirements are the highest priority when preparing the budget. Operating and promotion efforts are reduced in times of financial shortfalls to allow sufficient funds to cover debt payments. The following are excerpts from the Authority’s debt management policy that is required to be filed annually with the State of Nevada:
Affordability of Existing, Authorized and Proposed General Obligation Debt NRS 350.013 1.(c)(1) A discussion of its ability to afford existing general obligation debt, authorized future general obligation debt and proposed future general obligation debt; NRS 350.013 1.(c)(6) A discussion of its sources of money projected to be available to pay existing general obligation debt, authorized future general obligation debt and proposed future general obligation debt;
Page 39

RENO-SPARKS CONVENTION AND VISITORS AUTHORITY
FISCAL 2008-2009 ANNUAL FORECAST AND CAPITAL BUDGET
FINANCIAL POLICIES CONTINUED General Obligation Bond Indebtedness
The Authority’s general obligation bonds are issued pursuant to NRS 244A.597 through 244A.655 and NRS 350.500 through 350.720 and are issued by the Authority on behalf of and in the name of Washoe County (the “County”). The Authority’s general obligation bonds constitute direct and general obligations of the County and the full faith and credit of the County is pledged to the payment of principal and interest, subject to Nevada constitutional and statutory limitations on the aggregate amount of property taxes. The general obligation bonds are payable by the County from any source legally available therefore at the times such payments are due including the General Fund of the County. In the event, however, that such legally available sources of funds (including net pledged revenues) are insufficient, the County is obligated to levy a general (property) tax on all taxable property within the County for payment of the general obligation bonds, subject to the limitations provided in the constitution and statutes of the State of Nevada (the “State”).
In any year in which the total property taxes levied within the County by all applicable taxing units (e.g., the State, the County, the school district, any city or any special district) exceed such property tax limitations, the reduction to be made by those units must be in property taxes levied for purposes other than the payment of their bonded indebtedness, including interest on such indebtedness. Nevada statutes provide that no act concerning the Authority’s bonds or their security may be repealed, amended or modified in such a manner as to impair adversely the bonds or their security until all of the bonds have been discharged in full or provision for their payment and reception has been fully made.
General Obligation Bonds
The Authority currently has no outstanding general obligation debt paid by the levy of a specific property tax. Principal and interest on the Authority’s debt are payable from the various pledged revenues of the Authority. There is no impact on the property tax rate so long as net pledged revenues are sufficient to pay debt service.
Page 40

RENO-SPARKS CONVENTION AND VISITORS AUTHORITY
FISCAL 2008-2009 ANNUAL FORECAST AND CAPITAL BUDGET
FINANCIAL POLICIES CONTINUED 2. Reserve or Stabilization Accounts – The Authority currently has one
stabilization account for the Convention Center Expansion bonds. This account must be funded with a minimum of one-half of the preceding year’s debt service requirements, and is currently funded with $4,654,000. This account was established as a component of the bond issue and required by Washoe County for them to agree to back the bond issue.
The Authority maintains cash and investment accounts to hold idle funds but at this point has no formally designated cash reserve account to fund revenue shortfalls or unpredicted expenditures.
3. Operating & Capital Expenditure Accountability – The Authority
currently provides the Finance Committee with a monthly report of operations, which details current month operating results with budgetary and prior year comparisons. This report also includes similar year-to-date information, and is discussed in detail at monthly committee meetings to allow for adjustments to future periods if necessary.
Page 41

RENO-SPARKS CONVENTION AND VISITORS AUTHORITY FISCAL 2008-2009 ANNUAL FORECAST AND CAPITAL BUDGET
BEGINNING AND ENDING FUND BALANCES
The following fund balances are projected to be available as resources in the governmental type funds at the beginning of FY08-09 and the projected balances at the close of FY08-09: General Fund Debt Service Capital Projects Beginning $ 4,545,344 $ 15,450,475 $ 1,550,573 Ending $ 4,111,078 $ 15,414,476 $ 889,623
The change in the General Fund reflects fund balances carried over from prior periods being expended in the current fiscal year ($829,562). The change in the Debt Service Fund reflects the regular funding of debt service requirements (which have, and will, remain level over the coming years). The change in the Capital Projects Fund reflects the usage of funds remaining from bonds issued for the West Plaza project at the Reno-Sparks Convention Center. Please refer to the Nevada State Submission tab for detailed fund balance information.
Page 42

RENO-SPARKS CONVENTION AND VISITORS AUTHORITY FISCAL 2008-2009 ANNUAL FORECAST AND CAPITAL BUDGET
DISTINGUISHED BUDGET PRESENTATION AWARD
The Government Finance Officers Association of the United States and Canada (GFOA) presented a Distinguished Budget Presentation Award to Reno-Sparks Convention and Visitors Authority, Nevada for its annual budget for the fiscal year beginning July 1, 2007. In order to receive this award a governmental unit must publish a budget document that meets program criteria as a policy document, as an operations guide, as a financial plan, and as a communications device. This award is valid for a period of one year only. We believe our current budget continues to conform to program requirements, and we are submitting it to GFOA to determine its eligibility for another award.
Page 43

GOVERNMENT FINANCE OFFICERS ASSOCIATION
Distinguished Budget Presentation
Award PRESENTED TO
Reno-Sparks Convention and Visitors Authority
Nevada For the Fiscal Year Beginning
Executive Director
July 1,2007
President
Page 44

RENO-SPARKS CONVENTION AND VISllrORS AUTHORITY FISCAL 2008-2009 ANNUAL FORECAST AND CAPITAL BUDGET
·EXCELLENCE IN FINANCIAL REPO~~TING AWARD
The Government Finance Officers Association of the United States and Canada (GFOA) presented a Certificate of Achievement for Excellence in Financial Reporting to the Reno-Sparks Convention and Visitors Authority for its Comprehensive Annual Financial Report for the Fiscal Year Ended June 30, 2007.
Certificate of Achievement for Excellence
in Financial Reporting
Presented to
Reno-Sparks
Convention & Visitors Authority
Nevada For its Comprehensive Annual
Financial Report
for the Fiscal Year Ended
June 30,2007
A Certificate of Achievement for Excellence in Financial Reporting is presented by the Government Finance Officers
Association of the United States and Canada to government units and public employee retirement
systems whose comprehensive annual financial reports (CAFRs) achieve the highest
. standards in government accounting and financial reporting.
President
Executive Director
Page 45


Account Budget OutlookDescription Totals FY 07-08 Amount % Percent
Revenues Room Tax Collections $27,272,613 $26,398,040 $874,573 3.3%Reno-Sparks Convention Center 4,462,075 5,018,569 (556,494) -11.1%National Bowling Stadium 1,929,550 1,069,351 860,199 80.4%Reno Events Center 2,440,158 2,284,236 155,922 6.8%Reno-Sparks Livestock Events Center 1,754,867 1,651,973 102,894 6.2%Wildcreek Golf Course 2,202,329 2,073,510 128,819 6.2%Northgate Golf Club 880,525 826,635 53,890 6.5%General and Administration 611,798 684,992 (73,194) -10.7%Convention Sales 227,968 207,027 20,941 10.1%Tourism Sales 62,000 64,945 (2,945) -4.5%Marketing 18,560 17,670 890 5.0%
Subtotal (Operating Revenues) $41,862,443 $40,296,948 $1,565,495 3.9%
Investment Interest Revenue 562,472 643,446 (80,974) -12.6%Insurance Contribution 2,039,027 1,887,329 151,698 8.0%
Total Revenues $44,463,942 $42,827,723 $1,636,219 3.8%
Increase (Decrease)
Reno-Sparks Convention and Visitors AuthorityFiscal 2008-2009 Annual Forecast and Capital Budget
Consolidated Summary
Northgate Golf Club2.0%
General and Administration
1 4%
Other0.7%
Investment Interest Revenue
1 3%
Source of Revenues FY 08-09 Budget
-
Room Tax Collections61.3%
Reno-Sparks Convention Center10.0%
National Bowling Stadium4.3%
Reno Events Center5.5%
Reno-Sparks Livestock Events Center
3.9%
Wildcreek Golf Course5.0%
1.4% 1.3%Insurance Contribution
4.6%
Room Tax Collections61.6%
Reno-Sparks Convention Center11.7%
National Bowling Stadium2.5%
Reno Events Center5.3%
Reno-Sparks Livestock Events Center
3.9%
Wildcreek Golf Course4.8%
Northgate Golf Club1.9%
General and Administration
1.6%
Other0.7%
Investment Interest Revenue
1.5%Insurance Contribution
4.4%
Source of Revenues FY 07-08 Outlook
Page 47

Account Budget OutlookDescription Totals FY 07-08 Amount % Percent
Increase (Decrease)
Reno-Sparks Convention and Visitors AuthorityFiscal 2008-2009 Annual Forecast and Capital Budget
Consolidated Summary
ExpensesPayroll and Related $15,753,236 $14,663,792 $1,089,444 7.4%Supplies and Services 8,283,140 8,252,699 30,441 0.4%Travel and Entertainment 701,049 620,414 80,635 13.0%Promotion and Advertising 4,231,288 4,659,982 (428,694) -9.2%Special Projects 1,850,691 1,500,151 350,540 23.4%Capital Outlay 171,500 167,481 4,019 2.4%Depreciation 555,084 546,340 8,744 1.6%Other 4,088,095 4,194,852 (106,757) -2.5%
Sub Total (Operating Expenses) $35,634,083 $34,605,711 $1,028,372 3.0%
Capital Fund 1,440,000 1,950,000 (510,000) -26.2%Debt Service 9,219,421 10,379,219 (1,159,798) -11.2%
Total Expenses $46,293,504 $46,934,930 ($641,426) -1.4%
Payroll and Related34.0%
Other
Capital Fund3.1%
Debt Service19.9%
Source of Expenses FY 08-09 Budget
Supplies and Services17.9%
Travel and Entertainment1.5%
Promotion and Advertising9.1%
Special Projects4.0%
Capital Outlay0.4%
Depreciation1.2%
Other8.8%
Payroll and Related31.2%
Supplies and Services17.6%
Travel and Entertainment1.3%
Promotion and Advertising9.9%
Special Projects3.2%
Capital Outlay0.4%
Depreciation1.2%
Other8.9%
Capital Fund4.2%
Debt Service22.1%
Source of Expenses FY 07-08 Outlook
Page 48
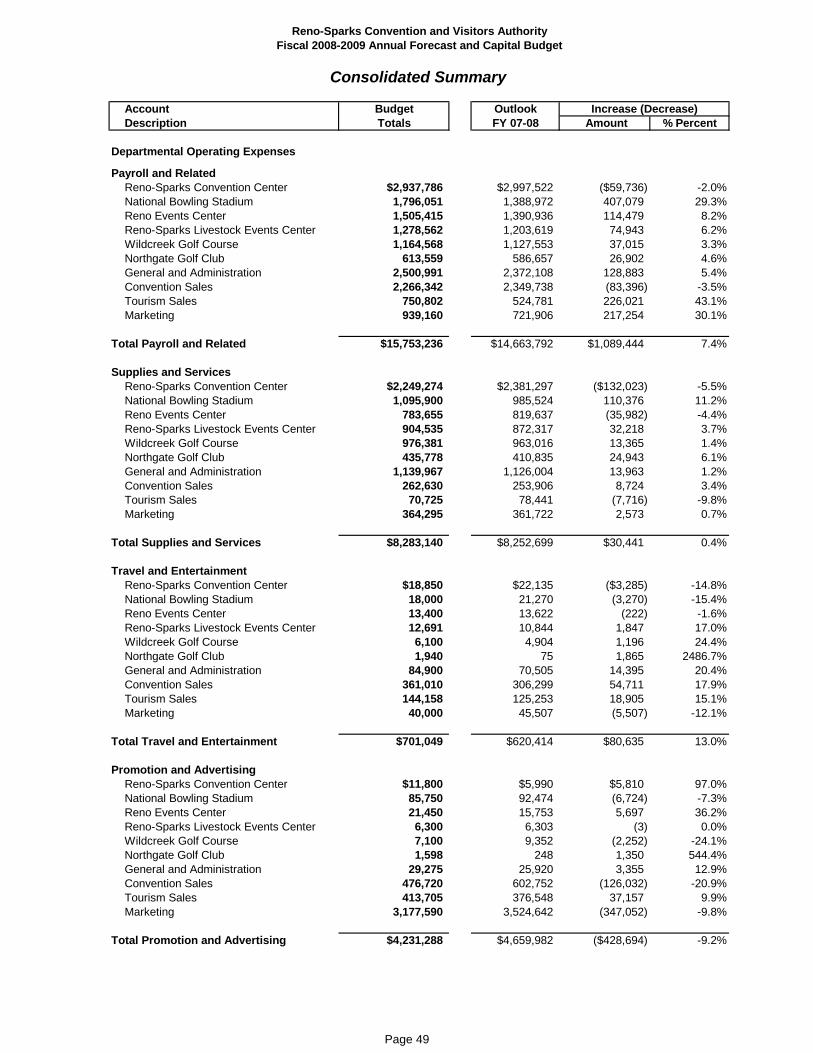
Account Budget OutlookDescription Totals FY 07-08 Amount % Percent
Increase (Decrease)
Reno-Sparks Convention and Visitors AuthorityFiscal 2008-2009 Annual Forecast and Capital Budget
Consolidated Summary
Departmental Operating Expenses
Payroll and RelatedReno-Sparks Convention Center $2,937,786 $2,997,522 ($59,736) -2.0%National Bowling Stadium 1,796,051 1,388,972 407,079 29.3%Reno Events Center 1,505,415 1,390,936 114,479 8.2%Reno-Sparks Livestock Events Center 1,278,562 1,203,619 74,943 6.2%Wildcreek Golf Course 1,164,568 1,127,553 37,015 3.3%Northgate Golf Club 613,559 586,657 26,902 4.6%General and Administration 2,500,991 2,372,108 128,883 5.4%Convention Sales 2,266,342 2,349,738 (83,396) -3.5%Tourism Sales 750,802 524,781 226,021 43.1%Marketing 939,160 721,906 217,254 30.1%
Total Payroll and Related $15,753,236 $14,663,792 $1,089,444 7.4%
Supplies and ServicesReno-Sparks Convention Center $2,249,274 $2,381,297 ($132,023) -5.5%National Bowling Stadium 1,095,900 985,524 110,376 11.2%Reno Events Center 783,655 819,637 (35,982) -4.4%Reno-Sparks Livestock Events Center 904,535 872,317 32,218 3.7%Wildcreek Golf Course 976,381 963,016 13,365 1.4%Northgate Golf Club 435,778 410,835 24,943 6.1%General and Administration 1,139,967 1,126,004 13,963 1.2%Convention Sales 262,630 253,906 8,724 3.4%Tourism Sales 70,725 78,441 (7,716) -9.8%Marketing 364,295 361,722 2,573 0.7%
Total Supplies and Services $8,283,140 $8,252,699 $30,441 0.4%
Travel and EntertainmentReno-Sparks Convention Center $18,850 $22,135 ($3,285) -14.8%National Bowling Stadium 18,000 21,270 (3,270) -15.4%Reno Events Center 13,400 13,622 (222) -1.6%Reno-Sparks Livestock Events Center 12,691 10,844 1,847 17.0%Wildcreek Golf Course 6,100 4,904 1,196 24.4%Northgate Golf Club 1,940 75 1,865 2486.7%General and Administration 84,900 70,505 14,395 20.4%Convention Sales 361,010 306,299 54,711 17.9%Tourism Sales 144,158 125,253 18,905 15.1%Marketing 40,000 45,507 (5,507) -12.1%
Total Travel and Entertainment $701,049 $620,414 $80,635 13.0%
Promotion and AdvertisingReno-Sparks Convention Center $11,800 $5,990 $5,810 97.0%National Bowling Stadium 85,750 92,474 (6,724) -7.3%Reno Events Center 21,450 15,753 5,697 36.2%Reno-Sparks Livestock Events Center 6,300 6,303 (3) 0.0%Wildcreek Golf Course 7,100 9,352 (2,252) -24.1%Northgate Golf Club 1,598 248 1,350 544.4%General and Administration 29,275 25,920 3,355 12.9%Convention Sales 476,720 602,752 (126,032) -20.9%Tourism Sales 413,705 376,548 37,157 9.9%Marketing 3,177,590 3,524,642 (347,052) -9.8%
Total Promotion and Advertising $4,231,288 $4,659,982 ($428,694) -9.2%
Page 49

Account Budget OutlookDescription Totals FY 07-08 Amount % Percent
Increase (Decrease)
Reno-Sparks Convention and Visitors AuthorityFiscal 2008-2009 Annual Forecast and Capital Budget
Consolidated Summary
Special ProjectsReno-Sparks Convention Center - - - 0.0%National Bowling Stadium $515,909 $650,000 ($134,091) -20.6%Reno Events Center - - - 0.0%Reno-Sparks Livestock Events Center 31,000 31,000 - 0.0%Wildcreek Golf Course - - - 0.0%Northgate Golf Club - - - 0.0%Convention Sales 490,032 281,573 208,459 74.0%Tourism Sales 171,500 68,649 102,851 149.8%Marketing 642,250 468,929 173,321 37.0%
Total Special Projects $1,850,691 $1,500,151 $350,540 23.4%
Capital OutlayReno-Sparks Convention Center - $5,075 ($5,075) -100.0%National Bowling Stadium - - - 0.0%Reno Events Center - - - 0.0%Reno-Sparks Livestock Events Center - - - 0.0%Wildcreek Golf Course - - - 0.0%Northgate Golf Club - - - 0.0%General and Administration $128,000 112,469 15,531 13.8%Convention Sales 25,500 26,092 (592) -2.3%Tourism Sales 3,000 8,282 (5,282) -63.8%Marketing 15,000 15,563 (563) -3.6%
Total Capital Outlay $171,500 $167,481 $4,019 2.4%
Total Operating Expenses $30,990,904 $29,864,519 $1,126,385 3.8%
Other ExpensesDepreciation $555,084 $546,340 $8,744 1.6%Debt Service 9,219,421 10,379,219 (1,159,798) -11.2%Capital Fund 1,440,000 1,950,000 (510,000) -26.2%Insurance Fund 2,258,120 1,894,876 363,244 19.2%Grants 1,329,975 1,320,414 9,561 0.7%Contingency 500,000 979,562 (479,562) -49.0%Pioneer Center - - - 0.0%
Total Other Expenses $15,302,600 $17,070,411 ($1,767,811) -10.4%
Total Expenses 46,293,504 46,934,930 (641,426) -1.4%
Operating Surplus (Deficit) ($1,829,562) ($4,107,207) $2,277,645 -55.5%
Page 50

Account Budget OutlookDescription Totals FY 07-08 Amount % Percent
Increase (Decrease)
Reno-Sparks Convention and Visitors AuthorityFiscal 2008-2009 Annual Forecast and Capital Budget
Consolidated Summary
Margins - Departmental TotalsRoom Taxes ($27,272,613) ($26,398,040) ($874,573) 3.3%Executive Office 1,503,260 1,408,119 95,141 6.8%Board of Directors 214,000 183,459 30,541 16.6%Finance & Purchasing 108,964 21,454 87,510 407.9%Room Tax 363,599 367,758 (4,159) -1.1%Human Resources 480,229 481,723 (1,494) -0.3%Information Technology 453,133 416,049 37,084 8.9%Mail Services 148,150 143,452 4,698 3.3%Reno-Sparks Convention Center 755,635 393,450 362,185 92.1%National Bowling Stadium 1,582,060 2,068,889 (486,829) -23.5%Reno Events Center (116,238) (44,288) (71,950) 162.5%Reno-Sparks Livestock Events Center 478,221 472,110 6,111 1.3%Wildcreek Golf Course 152,160 220,655 (68,495) -31.0%Northgate Golf Club 527,094 528,180 (1,086) -0.2%Convention Sales 3,477,180 3,479,007 (1,827) -0.1%Convention Services 177,086 134,326 42,760 31.8%Tourism Sales 1,491,890 1,117,009 374,881 33.6%Marketing 5,016,215 4,977,663 38,552 0.8%Visitor Services 92,180 92,899 (719) -0.8%Visitor Centers 51,340 50,037 1,303 2.6%Debt Service 8,735,999 9,849,576 (1,113,577) -11.3%Capital Fund 1,360,950 1,836,197 (475,247) -25.9%Grants 1,329,975 1,320,414 9,561 0.7%Pioneer Center 0 0%Pioneer Center - - - 0.0%Contingency 500,000 979,562 (479,562) -49.0%Insurance Fund 219,093 7,547 211,546 2803.0%
Total Margins - Departmental Totals $1,829,562 $4,107,207 ($2,277,645) -55.5%
Construction Net (675,000) (1,246,072) (Surplus) or Deficit 1,154,562 2,861,135 Revenues 44,463,942 42,827,723 Expenses (46,293,504) (46,934,930) Balance (1,829,562) (4,107,207) Construction (675,000) (1,246,072) (Surplus) or Deficit 1,154,562 2,861,135 Debt Cash Flow - (382,382) (Surplus) or Deficit 1,154,562 2,478,753
Page 51

B
udge
tFY
04-
05FY
05-
06FY
06-
07B
udge
tO
utlo
okFY
08-
09
Rev
enue
sR
oom
Tax
es
23,7
75,0
71
25
,262
,088
26,6
72,3
22
26
,519
,107
26,3
98,0
40
27
,272
,613
Ren
o-S
park
s C
onve
ntio
n C
ente
r3,
756,
324
3,28
6,47
0
4,
708,
574
4,50
4,31
8
5,
018,
569
4,46
2,07
5
N
atio
nal B
owlin
g S
tadi
um61
6,00
2
1,60
9,10
9
2,
398,
906
1,05
0,07
9
1,
069,
351
1,92
9,55
0
R
eno
Eve
nts
Cen
ter
1,05
0,33
5
2,
368,
709
2,15
2,64
5
2,
310,
000
2,28
4,23
6
2,
440,
158
Ren
o-S
park
s Li
vest
ock
Eve
nts
Cen
ter
1,57
2,81
2
1,
510,
448
1,58
0,12
2
1,
845,
469
1,65
1,97
3
1,
754,
867
Wild
cree
k G
olf C
ours
e1,
841,
940
2,08
8,13
6
2,
190,
126
2,16
4,87
7
2,
073,
510
2,20
2,32
9
N
orth
gate
Gol
f Cou
rse
803,
058
78
7,49
5
837,
621
88
0,00
2
826,
635
88
0,52
5
Gen
eral
and
Adm
inis
tratio
n43
8,88
6
578,
905
70
6,23
5
647,
841
68
4,99
2
611,
798
C
onve
ntio
n S
ales
187,
918
24
1,88
5
293,
927
24
2,39
6
207,
027
22
7,96
8
Tour
ism
Sal
es69
279
5863
276
375
6500
064
945
6200
0
Ren
o-Sp
arks
Con
vent
ion
and
Vis
itors
Aut
horit
yC
onso
lidat
ed S
umm
ary
Fisc
al 2
008-
2009
Ann
ual F
orec
ast a
nd C
apita
l Bud
get
Des
crip
tion
Acc
ount
Act
ual
FY 0
7-08
Tour
ism
Sal
es69
,279
58
,632
76
,375
65,0
00
64,9
45
62,0
00
Mar
ketin
g33
,610
33,4
92
31
,217
35,7
36
17
,670
18,5
60
Subt
otal
(Ope
ratin
g R
even
ues)
34,1
45,2
35
37,8
25,3
69
41,6
48,0
70
40
,264
,825
40
,296
,948
41
,862
,443
Inve
stm
ent I
nter
est R
even
ue54
4,58
0
619,
996
69
1,31
5
707,
613
64
3,44
6
562,
472
In
sura
nce
Con
tribu
tion
1,43
2,91
6
1,
640,
390
1,64
6,92
3
1,
782,
905
1,88
7,32
9
2,
039,
027
Tota
l Rev
enue
s36
,122
,731
40
,085
,755
43
,986
,308
42,7
55,3
43
42,8
27,7
23
44,4
63,9
42
Page 52

B
udge
tFY
04-
05FY
05-
06FY
06-
07B
udge
tO
utlo
okFY
08-
09
Ren
o-Sp
arks
Con
vent
ion
and
Vis
itors
Aut
horit
yC
onso
lidat
ed S
umm
ary
Fisc
al 2
008-
2009
Ann
ual F
orec
ast a
nd C
apita
l Bud
get
Des
crip
tion
Acc
ount
Act
ual
FY 0
7-08
Ope
ratin
g Ex
pens
esP
ayro
ll &
Rel
ated
11,3
83,1
99
12
,759
,882
14,0
52,5
94
14
,849
,334
14,6
63,7
92
15
,753
,236
Sup
plie
s &
Ser
vice
s6,
868,
728
7,57
9,41
3
8,
100,
406
8,02
6,33
0
8,
252,
699
8,28
3,14
0
Tr
avel
& E
nter
tain
men
t42
8,08
7
493,
476
53
5,92
3
807,
923
62
0,41
4
701,
049
P
rom
otio
n &
Adv
ertis
ing
4,07
5,55
4
3,
871,
659
3,81
3,14
8
4,
031,
156
4,65
9,98
2
4,
231,
288
Spe
cial
Pro
ject
s1,
572,
195
1,57
1,77
2
1,
537,
201
1,77
0,20
0
1,
500,
151
1,85
0,69
1
C
apita
l Out
lay
126,
125
13
3,56
5
145,
813
14
0,00
0
167,
481
17
1,50
0
Subt
otal
(Ope
ratin
g Ex
pens
es)
24,4
53,8
88
26,4
09,7
67
28,1
85,0
85
29
,624
,943
29
,864
,519
30
,990
,904
Cap
itala
ndO
ther
Expe
nses
Cap
ital a
nd O
ther
Exp
ense
sD
ebt S
ervi
ce10
,115
,085
9,47
9,31
2
9,
858,
621
10,3
88,4
18
10
,379
,219
9,21
9,42
1
G
rant
s-In
clin
e V
illag
e C
ryst
al B
ay1,
077,
902
1,12
5,21
5
1,
245,
526
1,16
5,38
7
1,
160,
414
1,18
9,97
5
G
rant
s-P
ione
er C
ente
r22
6,61
8
200,
000
18
0,00
0
160,
000
16
0,00
0
140,
000
P
ione
er C
ente
r-C
apita
l95
,354
49,2
92
37
,330
-
-
-
C
ontin
genc
y-
-
-
200,
000
82
9,56
2
500,
000
C
ontin
genc
y-O
pera
ting
Res
erve
-
-
-
-
150,
000
-
Con
tinge
ncy-
Cap
ital R
eser
ve-
-
-
-
32
5,00
0
100,
000
C
apita
l Im
prov
emen
ts2,
541,
048
678,
337
1,
445,
676
1,45
0,00
0
1,
625,
000
1,34
0,00
0
In
sura
nce
1,53
6,56
0
1,
617,
841
1,61
8,93
7
1,
828,
020
1,89
4,87
6
2,
258,
120
Ext
raor
dina
ry R
& M
-
-
-
-
-
-
Dep
reci
atio
n49
6,98
5
506,
322
50
2,03
0
535,
200
54
6,34
0
555,
084
Tota
l Cap
ital a
nd O
ther
Exp
ense
s16
,089
,552
13
,656
,319
14
,888
,120
15,7
27,0
25
17,0
70,4
11
15,3
02,6
00
Tota
l Exp
ense
s40
,543
,440
40
,066
,086
43
,073
,205
45,3
51,9
68
46,9
34,9
30
46,2
93,5
04
Page 53

B
udge
tFY
04-
05FY
05-
06FY
06-
07B
udge
tO
utlo
okFY
08-
09
Ren
o-Sp
arks
Con
vent
ion
and
Vis
itors
Aut
horit
yC
onso
lidat
ed S
umm
ary
Fisc
al 2
008-
2009
Ann
ual F
orec
ast a
nd C
apita
l Bud
get
Des
crip
tion
Acc
ount
Act
ual
FY 0
7-08
Payr
oll &
Rel
ated
Ren
o-S
park
s C
onve
ntio
n C
ente
r2,
681,
105
2,75
3,50
8
3,
108,
205
2,99
9,03
9
2,
997,
522
2,93
7,78
6
N
atio
nal B
owlin
g S
tadi
um1,
100,
458
1,35
3,22
5
1,
576,
313
1,30
2,97
2
1,
388,
972
1,79
6,05
1
R
eno
Eve
nts
Cen
ter
476,
469
1,
094,
106
1,15
5,84
4
1,
240,
785
1,39
0,93
6
1,
505,
415
Ren
o-S
park
s Li
vest
ock
Eve
nts
Cen
ter
1,12
6,79
8
1,
161,
345
1,11
2,54
7
1,
247,
714
1,20
3,61
9
1,
278,
562
Wild
cree
k G
olf C
ours
e1,
013,
676
1,02
5,08
5
1,
049,
651
1,13
3,67
6
1,
127,
553
1,16
4,56
8
N
orth
gate
Gol
f Cou
rse
462,
633
56
1,06
8
553,
975
65
0,98
8
586,
657
61
3,55
9
Gen
eral
and
Adm
inis
tratio
n2,
062,
948
2,13
8,28
2
2,
260,
030
2,43
2,59
4
2,
372,
108
2,50
0,99
1
C
onve
ntio
n S
ales
1,34
0,65
8
1,
406,
223
2,07
0,52
8
2,
474,
683
2,34
9,73
8
2,
266,
342
Tour
ism
Sal
es57
9,30
3
619,
937
61
2,98
8
528,
821
52
4,78
1
750,
802
M
arke
ting
539
151
647
103
552
513
838
062
721
906
939
160
Mar
ketin
g53
9,15
1
647,
103
55
2,51
3
838,
062
72
1,90
6
939,
160
Tota
l Pay
roll
& R
elat
ed11
,383
,199
12
,759
,882
14
,052
,594
14,8
49,3
34
14,6
63,7
92
15,7
53,2
36
Supp
lies
& S
ervi
ces
Ren
o-S
park
s C
onve
ntio
n C
ente
r1,
661,
894
1,73
5,31
5
2,
069,
485
2,23
2,47
5
2,
381,
297
2,24
9,27
4
N
atio
nal B
owlin
g S
tadi
um95
1,53
4
1,01
6,52
1
1,
281,
635
971,
200
98
5,52
4
1,09
5,90
0
R
eno
Eve
nts
Cen
ter
448,
523
85
4,62
6
800,
439
83
1,72
7
819,
637
78
3,65
5
Ren
o-S
park
s Li
vest
ock
Eve
nts
Cen
ter
905,
364
94
7,16
7
868,
788
90
1,04
5
872,
317
90
4,53
5
Wild
cree
k G
olf C
ours
e92
4,59
2
945,
281
98
0,49
7
931,
709
96
3,01
6
976,
381
N
orth
gate
Gol
f Cou
rse
379,
627
37
1,31
4
402,
094
41
6,31
4
410,
835
43
5,77
8
Gen
eral
and
Adm
inis
tratio
n97
5,29
6
1,11
8,72
6
1,
011,
975
1,06
3,65
0
1,
126,
004
1,13
9,96
7
C
onve
ntio
n S
ales
168,
721
14
8,00
1
272,
150
18
4,09
3
253,
906
26
2,63
0
Tour
ism
Sal
es56
,487
56,1
75
59
,271
70,5
76
78
,441
70,7
25
M
arke
ting
396,
690
38
6,28
7
354,
072
42
3,54
1
361,
722
36
4,29
5
Tota
l Sup
plie
s &
Ser
vice
s6,
868,
728
7,57
9,41
3
8,
100,
406
8,02
6,33
0
8,
252,
699
8,28
3,14
0
Page 54

B
udge
tFY
04-
05FY
05-
06FY
06-
07B
udge
tO
utlo
okFY
08-
09
Ren
o-Sp
arks
Con
vent
ion
and
Vis
itors
Aut
horit
yC
onso
lidat
ed S
umm
ary
Fisc
al 2
008-
2009
Ann
ual F
orec
ast a
nd C
apita
l Bud
get
Des
crip
tion
Acc
ount
Act
ual
FY 0
7-08
Trav
el &
Ent
erta
inm
ent
Ren
o-S
park
s C
onve
ntio
n C
ente
r19
,940
42,1
35
26
,815
23,2
00
22
,135
18,8
50
N
atio
nal B
owlin
g S
tadi
um21
,761
20,2
85
17
,794
14,0
00
21
,270
18,0
00
R
eno
Eve
nts
Cen
ter
3,69
3
17,1
18
17
,564
17,9
30
13
,622
13,4
00
R
eno-
Spa
rks
Live
stoc
k E
vent
s C
ente
r9,
532
14
,125
4,61
0
14,8
91
10
,844
12,6
91
W
ildcr
eek
Gol
f Cou
rse
7,84
5
3,20
0
3,29
3
5,45
7
4,90
4
6,10
0
Nor
thga
te G
olf C
ours
e13
0
-
-
1,
950
75
1,94
0
Gen
eral
and
Adm
inis
tratio
n78
,062
62,0
26
76
,716
80,3
00
70
,505
84,9
00
C
onve
ntio
n S
ales
139,
162
17
9,49
2
256,
975
47
9,39
5
306,
299
36
1,01
0
Tour
ism
Sal
es11
8,81
6
116,
876
10
0,54
6
125,
800
12
5,25
3
144,
158
M
arke
ting
2914
638
219
3161
045
000
4550
740
000
Mar
ketin
g29
,146
38
,219
31
,610
45,0
00
45,5
07
40,0
00
Trav
el &
Ent
erta
inm
ent
428,
087
49
3,47
6
535,
923
80
7,92
3
620,
414
70
1,04
9
Prom
otio
n &
Adv
ertis
ing
Ren
o-S
park
s C
onve
ntio
n C
ente
r-
153
28
15
,000
5,99
0
11,8
00
N
atio
nal B
owlin
g S
tadi
um11
9,67
8
59,0
32
96
,477
60,0
00
92
,474
85,7
50
R
eno
Eve
nts
Cen
ter
202,
225
11
3,42
3
25,6
22
21
,060
15,7
53
21
,450
Ren
o-S
park
s Li
vest
ock
Eve
nts
Cen
ter
10,0
50
8,
149
5,
543
6,
300
6,
303
6,
300
W
ildcr
eek
Gol
f Cou
rse
4,80
6
9,49
8
10,8
12
7,
200
9,
352
7,
100
N
orth
gate
Gol
f Cou
rse
858
1,73
6
5,50
5
1,50
0
248
1,59
8
Gen
eral
and
Adm
inis
tratio
n29
,993
38,8
02
19
,032
31,4
15
25
,920
29,2
75
C
onve
ntio
n S
ales
501,
065
47
3,39
6
477,
770
40
6,98
3
602,
752
47
6,72
0
Tour
ism
Sal
es26
7,20
4
413,
054
34
2,71
7
301,
698
37
6,54
8
413,
705
M
arke
ting
2,93
9,67
5
2,
754,
416
2,82
9,64
2
3,
180,
000
3,52
4,64
2
3,
177,
590
Tota
l Pro
mot
ion
& A
dver
tisin
g4,
075,
554
3,87
1,65
9
3,
813,
148
4,03
1,15
6
4,
659,
982
4,23
1,28
8
Page 55

B
udge
tFY
04-
05FY
05-
06FY
06-
07B
udge
tO
utlo
okFY
08-
09
Ren
o-Sp
arks
Con
vent
ion
and
Vis
itors
Aut
horit
yC
onso
lidat
ed S
umm
ary
Fisc
al 2
008-
2009
Ann
ual F
orec
ast a
nd C
apita
l Bud
get
Des
crip
tion
Acc
ount
Act
ual
FY 0
7-08
Spec
ial P
roje
cts
Nat
iona
l Bow
ling
Sta
dium
588,
000
42
4,70
4
584,
000
65
0,00
0
650,
000
51
5,90
9
Ren
o-S
park
s Li
vest
ock
Eve
nts
Cen
ter
18,0
45
42
,000
41,0
00
41
,000
31,0
00
31
,000
Con
vent
ion
Sal
es-
165,
745
34
9,66
6
457,
700
28
1,57
3
490,
032
To
uris
m S
ales
78,8
15
96
,844
91,9
36
71
,500
68,6
49
17
1,50
0
Mar
ketin
g88
7,33
5
842,
479
47
0,59
9
550,
000
46
8,92
9
642,
250
Tota
l Spe
cial
Pro
ject
s1,
572,
195
1,57
1,77
2
1,
537,
201
1,77
0,20
0
1,
500,
151
1,85
0,69
1
C
apita
l Out
lay
Ren
o-S
park
sC
onve
ntio
nC
ente
r-
--
-5
075
-R
eno
Spa
rks
Con
vent
ion
Cen
ter
5,
075
N
atio
nal B
owlin
g S
tadi
um-
-
-
-
-
-
R
eno
Eve
nts
Cen
ter
3,50
3
-
-
-
-
-
R
eno-
Spa
rks
Live
stoc
k E
vent
s C
ente
r-
-
-
-
-
-
W
ildcr
eek
Gol
f Cou
rse
6,77
3
3,41
0
-
-
-
-
Nor
thga
te G
olf C
ours
e-
-
-
-
-
-
G
ener
al a
nd A
dmin
istra
tion
103,
686
11
9,75
8
108,
059
10
5,00
0
112,
469
12
8,00
0
Con
vent
ion
Sal
es5,
159
8,
315
26
,326
21,0
00
26
,092
25,5
00
To
uris
m S
ales
-
2,
082
1,
699
2,
000
8,
282
3,
000
M
arke
ting
7,00
4
-
9,
729
12
,000
15,5
63
15
,000
Tota
l Cap
ital O
utla
y12
6,12
5
133,
565
14
5,81
3
140,
000
16
7,48
1
171,
500
Page 56

B
udge
tFY
04-
05FY
05-
06FY
06-
07B
udge
tO
utlo
okFY
08-
09
Ren
o-Sp
arks
Con
vent
ion
and
Vis
itors
Aut
horit
yC
onso
lidat
ed S
umm
ary
Fisc
al 2
008-
2009
Ann
ual F
orec
ast a
nd C
apita
l Bud
get
Des
crip
tion
Acc
ount
Act
ual
FY 0
7-08
Dep
artm
enta
l Mar
gins
- Pr
ofit
(Los
s)R
oom
Tax
Rev
enue
23,7
75,0
71
25
,262
,091
26,6
72,3
22
26
,519
,107
26,3
98,0
40
27
,272
,613
Ren
o-S
park
s C
onve
ntio
n C
ente
r(6
06,6
15)
(1
,244
,641
)
(4
95,9
59)
(7
65,3
96)
(3
93,4
50)
(7
55,6
35)
N
atio
nal B
owlin
g S
tadi
um(2
,165
,429
)
(1
,264
,658
)
(1
,157
,313
)
(1
,948
,093
)
(2
,068
,889
)
(1
,582
,060
)
R
eno
Eve
nts
Cen
ter
(84,
078)
289,
436
15
3,17
6
198,
498
44
,288
116,
238
R
eno-
Spa
rks
Live
stoc
k E
vent
s C
ente
r(4
96,9
77)
(6
62,3
38)
(4
52,3
66)
(3
65,4
81)
(4
72,1
10)
(4
78,2
21)
W
ildcr
eek
Gol
f Cou
rse
(290
,059
)
(63,
980)
(25,
976)
(91,
365)
(220
,655
)
(152
,160
)
Nor
thga
te G
olf C
ours
e(3
62,8
68)
(4
87,3
03)
(4
54,1
34)
(5
47,7
50)
(5
28,1
80)
(5
27,0
94)
E
xecu
tive
Offi
ce(1
,233
,294
)
(1
,284
,924
)
(1
,354
,293
)
(1
,425
,131
)
(1
,408
,119
)
(1
,503
,260
)
B
oard
of D
irect
ors
(217
,266
)
(290
,855
)
(159
,029
)
(186
,600
)
(183
,459
)
(214
,000
)
Fina
nce
(180
573)
(65
706)
3655
6(4
313
8)(2
145
4)(1
0896
4)Fi
nanc
e(1
80,5
73)
(65,
706)
36
,556
(43,
138)
(2
1,45
4)
(108
,964
)
R
oom
Tax
(3
32,9
45)
(3
19,6
78)
(3
34,4
68)
(3
85,5
68)
(3
67,7
58)
(3
63,5
99)
H
uman
Res
ourc
es(4
06,3
45)
(4
41,8
73)
(4
79,5
71)
(4
52,0
43)
(4
81,7
23)
(4
80,2
29)
In
form
atio
n Te
chno
logy
(319
,120
)
(355
,294
)
(332
,196
)
(430
,606
)
(416
,049
)
(453
,133
)
Mai
l Ser
vice
s(1
21,5
56)
(1
40,3
59)
(1
46,5
76)
(1
42,0
32)
(1
43,4
52)
(1
48,1
50)
C
onve
ntio
n S
ales
(1,9
23,5
30)
(2,0
85,5
29)
(3,1
07,7
83)
(3,6
41,4
95)
(3,4
79,0
07)
(3,4
77,1
80)
Con
vent
ion
Ser
vice
s(4
3,31
7)
(5
3,75
8)
(5
1,70
5)
(1
39,9
63)
(1
34,3
26)
(1
77,0
86)
To
uris
m S
ales
(1,0
31,3
46)
(1,2
46,3
36)
(1,1
32,7
82)
(1,0
35,3
95)
(1,1
17,0
09)
(1,4
91,8
90)
Mar
ketin
g(4
,611
,379
)
(4
,467
,916
)
(4
,043
,893
)
(4
,845
,192
)
(4
,977
,663
)
(5
,016
,215
)
V
isito
r Ser
vice
s(1
08,3
69)
(1
17,0
64)
(1
22,3
11)
(1
14,9
37)
(9
2,89
9)
(9
2,18
0)
V
isito
r Cen
ters
(45,
643)
(50,
032)
(50,
744)
(52,
738)
(50,
037)
(51,
340)
Deb
t Ser
vice
(9,6
39,5
44)
(8,9
25,3
60)
(9,2
35,6
07)
(9,7
31,8
05)
(9,8
49,5
76)
(8,7
35,9
99)
Gra
nts
(1,3
04,5
20)
(1,3
25,2
15)
(1,4
25,5
26)
(1,3
25,3
87)
(1,3
20,4
14)
(1,3
29,9
75)
Pio
neer
Cen
ter
(95,
354)
(49,
292)
(37,
330)
-
-
-
C
ontin
genc
y-
-
-
(200
,000
)
(829
,562
)
(500
,000
)
Con
tinge
ncy-
Ope
ratin
g R
eser
ve-
-
-
-
(1
50,0
00)
-
Con
tinge
ncy-
Cap
ital R
eser
ve-
-
-
-
(3
25,0
00)
(1
00,0
00)
C
apita
l Im
prov
emen
ts(2
,472
,009
)
(6
12,2
93)
(1
,377
,375
)
(1
,399
,000
)
(1
,511
,197
)
(1
,260
,950
)
In
sura
nce
(103
,644
)
22,5
49
27
,986
(45,
115)
(7,5
47)
(219
,093
)
Ext
raor
dina
ry R
& M
-
-
-
-
-
-
Tota
l Dep
artm
enta
l Mar
gins
(4,4
20,7
09)
19
,672
91
3,10
3
(2,5
96,6
25)
(4
,107
,207
)
(1,8
29,5
62)
Less
: RS
CC
Cap
ital &
Oth
er N
on-C
ash
Exp
ense
s3,
008,
645
465,
554
1,
636,
478
1,66
7,38
2
1,
246,
072
675,
000
Net
RSC
VA P
rofit
(Los
s)(1
,412
,064
)
485,
226
2,
549,
581
(929
,243
)
(2
,861
,135
)
(1,1
54,5
62)
Page 57


FY 0
8-09
07-
08
AN
D V
ISIT
OR
S AU
THO
RIT
YFI
SCAL
200
8-20
09 A
NN
UAL
FO
REC
AST
AND
CAP
ITAL
BU
DG
ET
Sum
mar
y of
Bud
gete
d St
affin
g Le
vels
REN
O-S
PAR
KS
CO
NVE
NTI
ON
Dep
artm
ent
FY 0
5-06
FYFY
06-
07
Full
Tim
et
Par
Tim
eFu
ll Ti
me
Par
t Tim
eFu
ll Ti
me
Par
t Tim
eFu
ll Ti
me
Par
t Tim
e
Exe
cutiv
e O
ffice
6.
0
-
5.
0
-
5.
0
-
5.0
-
B
oard
of D
irect
ors
-
-
-
-
-
-
-
-
Fi
nanc
e
6.0
-
6.0
-
6.0
-
6.
0
-
Roo
m T
ax
7.0
-
7.0
-
7.0
-
7.
0
-
Hum
an R
esou
rces
3.
0
1.
0
3.
0
1.
0
3.0
1.
0
3.0
1.
0
Info
rmat
ion
Tech
nolo
gy
2.0
-
2.0
-
2.0
-
2.
0
-
Mai
l Ser
vice
s
2.0
-
2.0
-
2.0
-
2.
0
-
Ren
o-S
park
s C
onve
ntio
n C
ente
r
40.0
13.
0
40.0
17
.0
41
.0
17
.0
39
.0
17
.0
R
eno-
Spa
rks
Live
stoc
k E
vent
s C
ente
r
19.0
3.
0
20
.0
4.0
20
.0
4.
0
20.0
4.0
N
atio
nal B
owlin
g S
tadi
um
12
.0
6
5.0
12
.0
56.0
13.0
56.0
12.5
56.0
Ren
o E
vent
s C
ente
r
12.0
45.
0
12.0
45
.0
12
.0
45
.0
12
.5
45
.0
W
ildcr
eek
Gol
f Cou
rse
11
.0
4
1.0
11
.0
41.0
11.0
41.0
11.0
41.0
Nor
thga
te G
olf C
lub
6.
0
29.
0
6.0
28.0
6.0
28
.0
5.
0
28.0
Con
vent
ion
Sal
es
17.0
- 22
.0
-
21.0
-
20
.0
-
C
onve
ntio
n S
ervi
ces
1.
0
28.
0
1.0
28.0
2.0
28
.0
2.
0
28.0
Mar
ketin
g
8.0
2.0
7.0
1.0
9.
0
1.0
9.
5
1.0
To
uris
m S
ales
7.
0
-
6.
0
-
5.
0
-
6.5
-
Tota
l
159.
02
27
.0
162.
0
221.
0
16
5.0
22
1.0
16
3.0
22
1.0
Not
es:
1) F
iftee
n fu
ll-tim
e em
ploy
ees
are
utili
zed
by b
oth
the
Ren
o E
vent
s C
ente
r and
Nat
iona
l Bow
ling
Sta
dium
.
New
Pos
ition
s:Ti
tleLo
catio
nE
vent
Coo
rdin
ator
Ren
o-S
park
s C
onve
ntio
n C
ente
rS
ales
Man
ager
Tour
ism
Sal
es
Del
eted
Pos
ition
s: Title
Loca
tion
Ass
ista
nt F
acilit
y S
ervi
ce M
anag
erR
eno-
Spa
rks
Con
vent
ion
Cen
ter
Eng
inee
ring
Tech
nici
anR
eno-
Spa
rks
Con
vent
ion
Cen
ter
Chi
ef E
ngin
eer
(Unf
illed
in O
utlo
ok)
Ren
o-S
park
s C
onve
ntio
n C
ente
rG
reen
skee
per
Nor
thga
te G
olf C
lub
Net
Cha
nge
of P
ositi
ons:
-2
Page 59

RENO-SPARKS CONVENTION AND VISITORS AUTHORITY FISCAL 2008-2009 ANNUAL FORECAST AND CAPITAL BUDGET
Staffing Level Changes
Two additional new staff positions have been added in FY 08-09 and four positions have been eliminated. The table below illustrates a positive financial affect on the operating budget.
New Positions:
Title Location Salary
Estimated Revenue Increase
Event Coordinator RSCC $ 50,000 $ - International Sales Manager Tourism 70,000
- $ 120,000
Deleted Positions:
Title Location Salary
Estimated Revenue Decrease
Assistant Facility Service Manager RSCC $ 38,000 $ - Engineering Technician RSCC 26,312 - Chief Engineer RSCC 73,401 - Greenskeeper Wildcreek 31,970 -
$ 169,683
Total Estimated Increase in Revenue $ - Less Net Decrease in Salaries 49,683 Less Payroll Related Expenses (28%) 13,911 Estimated Decrease in Operating Expenses $ 63,594
Page 60
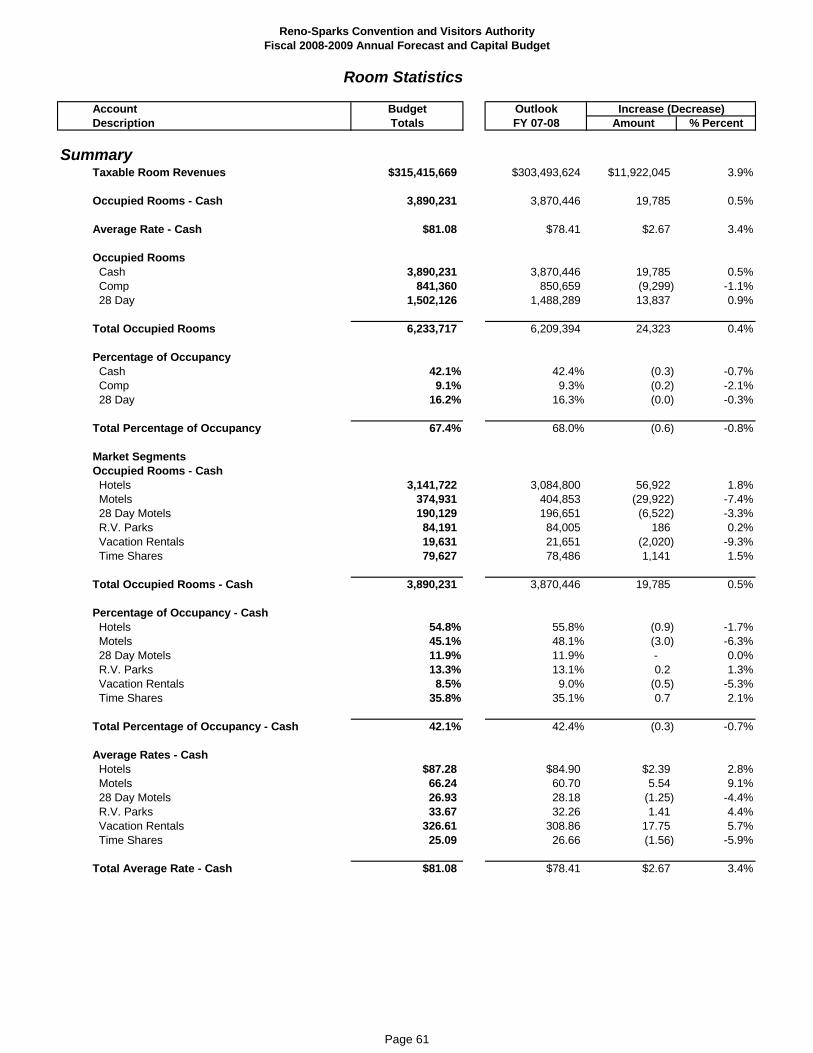
Account Budget OutlookDescription Totals FY 07-08 Amount % Percent
SummaryTaxable Room Revenues $315,415,669 $303,493,624 $11,922,045 3.9%
Occupied Rooms - Cash 3,890,231 3,870,446 19,785 0.5%
Average Rate - Cash $81.08 $78.41 $2.67 3.4%
Occupied Rooms Cash 3,890,231 3,870,446 19,785 0.5% Comp 841,360 850,659 (9,299) -1.1% 28 Day 1,502,126 1,488,289 13,837 0.9%
Total Occupied Rooms 6,233,717 6,209,394 24,323 0.4%
Percentage of Occupancy Cash 42.1% 42.4% (0.3) -0.7% Comp 9.1% 9.3% (0.2) -2.1% 28 Day 16.2% 16.3% (0.0) -0.3%
Total Percentage of Occupancy 67.4% 68.0% (0.6) -0.8%
Market Segments Occupied Rooms - Cash Hotels 3,141,722 3,084,800 56,922 1.8%
Increase (Decrease)
Reno-Sparks Convention and Visitors AuthorityFiscal 2008-2009 Annual Forecast and Capital Budget
Room Statistics
Motels 374,931 404,853 (29,922) -7.4% 28 Day Motels 190,129 196,651 (6,522) -3.3% R.V. Parks 84,191 84,005 186 0.2% Vacation Rentals 19,631 21,651 (2,020) -9.3% Time Shares 79,627 78,486 1,141 1.5%
Total Occupied Rooms - Cash 3,890,231 3,870,446 19,785 0.5%
Percentage of Occupancy - Cash Hotels 54.8% 55.8% (0.9) -1.7% Motels 45.1% 48.1% (3.0) -6.3% 28 Day Motels 11.9% 11.9% - 0.0% R.V. Parks 13.3% 13.1% 0.2 1.3% Vacation Rentals 8.5% 9.0% (0.5) -5.3% Time Shares 35.8% 35.1% 0.7 2.1%
Total Percentage of Occupancy - Cash 42.1% 42.4% (0.3) -0.7%
Average Rates - Cash Hotels $87.28 $84.90 $2.39 2.8% Motels 66.24 60.70 5.54 9.1% 28 Day Motels 26.93 28.18 (1.25) -4.4% R.V. Parks 33.67 32.26 1.41 4.4% Vacation Rentals 326.61 308.86 17.75 5.7% Time Shares 25.09 26.66 (1.56) -5.9%
Total Average Rate - Cash $81.08 $78.41 $2.67 3.4%
Page 61

4,773,411
5,017,909
4,926,899
4,610,335
4,515
4,644,852
4,598,603
50,395
4,713,962
$74.
10
$80.
06
$85.
63St
rate
gic
Plan
$90.
72$9
5.06
$66.
83$7
4.12
$78.
41
Out
look
$81.
08
Bud
get
$70
00
$80.
00
$90.
00
$100
.00
$110
.00
$120
.00
4,50
0,00
0
4,70
0,00
0
4,90
0,00
0
5,10
0,00
0
Casooms
RSC
VA F
Y 20
08-2
009
Annu
al F
orec
ast
Cas
h O
ccup
ied
Roo
ms-
Cas
h Av
erag
e R
ates
Tren
ds
4
4,534
4,382,318
4,314,673
4,092,349
3,870,446
3,890,231
4
4,55
$0
$54.
29$5
5.58
$57.
32$5
6.82
$56.
50$5
8.66
$62.
88$
$
$0.0
0
$10.
00
$20.
00
$30.
00
$40.
00
$50.
00
$60.
00
$70.
00
3,50
0,00
0
3,70
0,00
0
3,90
0,00
0
4,10
0,00
0
4,30
0,00
0
FY 9
8-99
FY 9
9-00
FY 0
0-01
FY 0
1-02
FY 0
2-03
FY 0
3-04
FY 0
4-05
FY 0
5-06
FY 0
6-07
FY 0
7-08
FY 0
8-09
FY 0
9-10
FY 1
0-11
FY 1
1-12
sh RatesCash Occupied Ro
Stra
tegi
c P
lan
Aver
age
Cas
h R
ate
Act
ual A
vera
ge C
ash
Rat
e
Page 62

Account Budget OutlookDescription Totals FY 07-08 Amount % Percent
Increase (Decrease)
Reno-Sparks Convention and Visitors AuthorityFiscal 2008-2009 Annual Forecast and Capital Budget
Room Statistics
Revenues
Cash - Taxable Hotels $274,215,049 $261,887,610 $12,327,439 4.7% Motels 24,835,707 24,575,656 260,051 1.1% 28 Day Motels 5,120,287 5,540,979 (420,692) -7.6% R.V. Parks 2,834,616 2,710,125 124,491 4.6% Vacation Rentals 6,411,771 6,687,166 (275,395) -4.1% Timeshares 1,998,239 2,092,088 (93,849) -4.5%
Totals $315,415,669 $303,493,624 $11,922,045 3.9%
Comp - Exempt Hotels $53,761,856 $54,627,064 ($865,208) -1.6% Motels 95,103 97,177 (2,074) -2.1% 28 Day Motels - - - 0.0% R.V. Parks 29,105 30,798 (1,693) -5.5% Vacation Rentals - - - 0.0% Timeshares - - - 0.0%
Totals $53,886,064 $54,755,039 ($868,975) -1.6%
28 Day - Exempt Hotels $405,741 $427,018 ($21,277) -5.0% Motels 1,304,285 1,281,852 22,433 1.8% 28 Day Motels 21,992,728 21,625,142 367,586 1.7% R.V. Parks 4,096,572 4,057,469 39,103 1.0% Vacation Rentals 2,773,403 2,916,194 (142,791) -4.9% Timeshares - - - 0.0%
Totals $30,572,729 $30,307,675 $265,054 0.9%
Total Revenues $399,874,462 $388,556,338 $11,318,124 2.9%
Combined Revenues Hotels $328,382,646 $316,941,692 $11,440,954 3.6% Motels 26,235,095 25,954,685 280,410 1.1% 28 Day Motels 27,113,015 27,166,121 (53,106) -0.2% R.V. Parks 6,960,293 6,798,392 161,901 2.4% Vacation Rentals 9,185,174 9,603,360 (418,186) -4.4% Timeshares 1,998,239 2,092,088 (93,849) -4.5%
Total Combined Revenues $399,874,462 $388,556,338 $11,318,124 2.9%
Page 63

Account Budget OutlookDescription Totals FY 07-08 Amount % Percent
Taxable Revenues By Market Segment Hotels $274,215,049 $261,887,610 $12,327,439 4.7% Motels 24,835,707 24,575,656 260,051 1.1% 28 Day Motels 5,120,287 5,540,979 (420,692) -7.6% R.V. Parks 2,834,616 2,710,125 124,491 4.6% Vacation Rentals 6,411,771 6,687,166 (275,395) -4.1% Timeshares 1,998,239 2,092,088 (93,849) -4.5%
Total Taxable Revenues $315,415,669 $303,493,624 $11,922,045 3.9%
-
Increase (Decrease)
Reno-Sparks Convention and Visitors AuthorityFiscal 2008-2009 Annual Forecast and Capital Budget
Room Tax Revenues and Statistics
Motels7.9%
28 Day Motels1.6%
R.V. Parks0.9%
Vacation Rentals2.0%
Timeshares0.6%
Revenue Source by Market Segment FY 08-09 Budget
Hotels86.9%
Hotels86.3%
Motels8.1%
28 Day Motels1.8%
R.V. Parks0.9% Vacation Rentals
2.2%
Timeshares0.7%
Revenue Source by Market Segment FY 07-08 Outlook
Page 64

Reno-Sparks Convention and Visitors AuthorityFiscal 2008-2009 Annual Forecast and Capital Budget
Taxable Room Revenue - Trend
Outlook BudgetMonth FY 05-06 FY 06-07 FY 07-08 FY 08-09 Amount %
July 31,147,952$ 30,641,193$ 30,700,843$ 30,515,098$ (185,745)$ -0.6%August 30,832,083 33,940,996 35,322,265 34,934,652 (387,613) -1.1%September 32,016,233 34,088,596 33,131,690 34,606,048 1,474,358 4.4%October 21,244,385 21,275,712 25,218,367 25,926,498 708,131 2.8%November 16,891,339 16,793,374 20,487,609 18,413,375 (2,074,234) -10.1%December 18,008,851 21,290,237 18,593,651 19,837,169 1,243,518 6.7%January 19,629,308 19,487,809 20,715,803 21,396,426 680,623 3.3%February 20,575,251 21,679,078 22,476,667 21,349,941 (1,126,726) -5.0%March 23,318,905 26,376,498 20,742,982 25,913,655 5,170,673 24.9%April 22,141,665 22,713,994 22,314,995 24,119,836 1,804,841 8.1%May 23,815,851 26,278,892 25,744,466 28,097,958 2,353,492 9.1%June 28,782,960 28,766,939 28,044,286 30,305,013 2,260,727 8.1%
Totals 288,404,784$ 303,333,318$ 303,493,624$ 315,415,669$ 11,922,045$ 3.9%
Actual Increase/(Decrease)
$15,000,000
$17,000,000
$19,000,000
$21,000,000
$23,000,000
$25,000,000
$27,000,000
$29,000,000
$31,000,000
$33,000,000
$35,000,000
$37,000,000
July August September October November December January February March April May June
Taxable Room Revenues
FY 05-06 FY 06-07 Outlook FY 07-08 Budget FY 08-09
Page 65

Account Budget OutlookDescription Totals FY 07-08 Amount % Percent
Increase (Decrease)
Reno-Sparks Convention and Visitors AuthorityFiscal 2008-2009 Annual Forecast and Capital Budget
Room Statistics
Occupied Rooms
Cash Hotels 3,141,722 3,084,800 56,922 1.8% Motels 374,931 404,853 (29,922) -7.4% 28 Day Motels 190,129 196,651 (6,522) -3.3% R.V. Parks 84,191 84,005 186 0.2% Vacation Rentals 19,631 21,651 (2,020) -9.3% Timeshares 79,627 78,486 1,141 1.5%
Totals 3,890,231 3,870,446 19,785 0.5%Comp
Hotels 838,888 848,096 (9,208) -1.1% Motels 1,693 1,721 (28) -1.6% 28 Day Motels - - - 0.0% R.V. Parks 779 842 (63) -7.5% Vacation Rentals - - - 0.0% Timeshares - - - 0.0%
Totals 841,360 850,659 (9,299) -1.1%28 Day
Hotels 7,490 7,745 (255) -3.3% Motels 43,241 41,097 2,144 5.2% 28 Day Motels 1,081,721 1,069,519 12,202 1.1% R.V. Parks 313,139 310,338 2,801 0.9% Vacation Rentals 56,535 59,590 (3,055) -5.1% Timeshares - - - 0.0%
Totals 1,502,126 1,488,289 13,837 0.9%
Total Occupied Rooms 6,233,717 6,209,394 24,323 0.4%
Vacant 3,012,169 2,925,647 86,522 3.0%
Total Available Rooms (Licensed) 9,245,886 9,135,041 110,845 1.2%
Occupied Rooms - Combined Hotels 3,988,100 3,940,641 47,459 1.2% Motels 419,865 447,671 (27,806) -6.2% 28 Day Motels 1,271,850 1,266,170 5,680 0.4% R.V. Parks 398,109 395,185 2,924 0.7% Vacation Rentals 76,166 81,241 (5,075) -6.2% Timeshares 79,627 78,486 1,141 1.5%
Total Occupied Rooms 6,233,717 6,209,394 24,323 0.4%
Page 66

Reno - Sparks Convention and Visitors Authority Fiscal 2008-2009 Annual Forecast and Capital Budget
Cash Occupied Rooms Nights - Trend
Outlook BudgetMonth FY 05-06 FY 06-07 FY 07-08 FY 08-09 Amount %
July 432,236 388,972 368,708 356,820 (11,888) -3.3%August 403,601 402,269 389,098 374,392 (14,706) -3.9%September 427,932 397,251 380,061 384,227 4,166 1.1%October 360,958 329,644 344,490 344,223 (267) -0.1%November 299,799 273,546 287,135 261,375 (25,760) -9.9%December 300,413 299,286 254,279 262,619 8,340 3.2%January 299,857 276,915 265,631 266,283 652 0.2%February 317,830 304,750 295,150 276,604 (18,546) -6.7%March 368,516 362,331 301,517 332,619 31,102 9.4%April 345,684 327,670 305,420 318,381 12,961 4.1%May 362,051 356,849 332,570 350,211 17,641 5.0%June 396,411 373,006 346,387 362,477 16,090 4.4%
Totals 4,315,288 4,092,489 3,870,446 3,890,231 19,785 0.5%
Actual Increase/(Decrease)
250,000
275,000
300,000
325,000
350,000
375,000
400,000
425,000
450,000
475,000
July August September October November December January February March April May June
Cash Occupied Room Nights
FY 05-06 FY 06-07 Outlook FY 07-08 Budget FY 08-09
Page 67

Account Budget OutlookDescription Totals FY 07-08 Amount % Percent
Increase (Decrease)
Reno-Sparks Convention and Visitors AuthorityFiscal 2008-2009 Annual Forecast and Capital Budget
Room Statistics
Average Rates
Cash Hotels $87.28 $84.90 $2.39 2.8% Motels 66.24 60.70 5.54 9.1% 28 Day Motels 26.93 28.18 (1.25) -4.4% R.V. Parks 33.67 32.26 1.41 4.4%
Vacation Rentals 326.61 308.86 17.75 5.7% Timeshares 25.09 26.66 (1.56) -5.9%
Totals $81.08 $78.41 $2.67 3.4%
Comp Hotels $64.09 $64.41 ($0.32) -0.5% Motels 56.17 56.47 (0.29) -0.5% 28 Day Motels - - - 0.0% R.V. Parks 37.36 36.58 0.78 2.1% Vacation Rentals - - - 0.0% Timeshares - - - 0.0%
Totals $64.05 $64.37 ($0.32) -0.5%
28 Day Hotels $54.17 $55.13 ($0.96) -1.7% Motels 30.16 31.19 (1.03) -3.3% 28 Day Motels 20.33 20.22 0.11 0.6% R.V. Parks 13.08 13.07 0.01 0.1% Vacation Rentals 49.06 48.94 0.12 0.2% Timeshares - - - 0.0%
Totals $20.35 $20.36 ($0.01) -0.1%
Page 68

Reno - Sparks Convention and Visitors AuthorityFiscal 2008-2009 Annual Forecast and Capital Budget
Average Cash Rates - Trend
Outlook BudgetMonth FY 05-06 FY 06-07 FY 07-08 FY 08-09 Amount %
July 72.06$ 78.77$ 83.27$ 85.52$ 2.25$ 2.7%August 76.39 84.37 90.78 93.31 2.53 2.8%September 74.82 85.81 87.17 90.07 2.89 3.3%October 58.86 64.54 73.20 75.32 2.11 2.9%November 56.34 61.39 71.35 70.45 (0.90) -1.3%December 59.95 71.14 73.12 75.54 2.42 3.3%January 65.46 70.37 77.99 80.35 2.36 3.0%February 64.74 71.14 76.13 77.19 1.06 1.4%March 63.28 72.80 68.80 77.91 9.11 13.2%April 64.05 69.32 73.06 75.76 2.69 3.7%May 65.78 73.64 77.41 80.23 2.82 3.6%June 72.61 77.12 80.96 83.61 2.64 3.3%
Totals 66.83$ 74.12$ 78.41$ 81.08$ 2.67$ 3.4%
Increase/(Decrease)Actual
$45.00
$50.00
$55.00
$60.00
$65.00
$70.00
$75.00
$80.00
$85.00
$90.00
$95.00
$100.00
July August September October November December January February March April May June
Average Cash Rates
FY 05-06 FY 06-07 Outlook FY 07-08 Budget FY 08-09
Page 69

Account Budget OutlookDescription Totals FY 07-08 Amount % Percent
Increase (Decrease)
Reno-Sparks Convention and Visitors AuthorityFiscal 2008-2009 Annual Forecast and Capital Budget
Room Statistics
Percentage of Occupancy
Cash Hotels 54.8% 55.8% (0.9) -1.7% Motels 45.1% 48.1% (3.0) -6.3% 28 Day Motels 11.9% 11.9% - 0.0% R.V. Parks 13.3% 13.1% 0.2 1.3% Vacation Rentals 8.5% 9.0% (0.5) -5.3% Timeshares 35.8% 35.1% 0.7 2.1%
Totals 42.1% 42.4% (0.3) -0.7%Comp
Hotels 14.6% 15.3% (0.7) -4.5% Motels 0.2% 0.2% - 0.0% 28 Day Motels 0.0% 0.0% - 0.0% R.V. Parks 0.1% 0.1% - 0.0% Vacation Rentals 0.0% 0.0% - 0.0% Timeshares 0.0% 0.0% - 0.0%
Totals 9.1% 9.3% (0.2) -2.1%28 Day
Hotels 54.8% 55.8% (0.9) -1.6% Motels 5.2% 4.9% 0.3 6.1% 28 Day Motels 67.8% 64.6% 3.2 5.0% R.V. Parks 49.4% 48.4% 1.0 2.1% Vacation Rentals 24.5% 24.7% (0.2) -0.8% Timeshares 0.0% 0.0% - 0.0%
Totals 16.2% 16.3% (0.0) -0.3%
Total Percentage of Occupancy 67.4% 68.0% (0.6) -0.8%
Vacant 32.6% 32.0% 0.6 1.7%
Total (must equal 100.0%) 100.0% 100.0% - 0.0%
Combined Percentage of Occupancy Hotels 69.6% 71.2% (1.6) -2.3% Motels 50.5% 53.2% (2.7) -5.1% 28 Day Motels 79.7% 76.5% 3.2 4.2% R.V. Parks 62.8% 61.6% 1.2 1.9% Vacation Rentals 33.0% 33.7% (0.7) -2.1% Timeshares 35.8% 35.1% 0.7 2.1%
Total Percentage of Occupancy 67.4% 68.0% (0.6) -0.8%
Page 70

Reno - Sparks Convention and Visitors Authority Fiscal 2008-2009 Annual Forecast and Capital Budget
Percentage of Occupancy - Trend
Outlook BudgetMonth FY 05-06 FY 06-07 FY 07-08 FY 08-09 Amount %
July 79.5% 77.2% 75.2% 72.3% (2.9) -4.1%August 76.4% 78.3% 77.5% 74.1% (3.4) -4.6%September 80.1% 79.1% 77.0% 76.6% (0.4) -0.6%October 71.7% 69.2% 70.8% 69.2% (1.6) -2.3%November 64.8% 63.1% 64.3% 59.0% (5.3) -9.0%December 63.6% 64.0% 56.9% 57.8% 0.9 1.5%January 63.5% 61.3% 56.8% 55.9% (0.9) -1.6%February 71.6% 70.7% 66.0% 64.1% (1.9) -3.0%March 72.1% 73.6% 63.9% 68.1% 4.1 6.1%April 72.5% 71.1% 65.9% 67.1% 1.2 1.8%May 72.9% 72.8% 68.5% 70.2% 1.7 2.5%June 79.0% 76.5% 73.1% 74.6% 1.6 2.1%
Totals 72.4% 72.4% 68.0% 67.4% (0.6) -0.8%
Actual Increase/(Decrease)
53.0%
58.0%
63.0%
68.0%
73.0%
78.0%
83.0%
July August September October November December January February March April May June
Percentage of Occupancy(Includes Cash, Comp, & 28 Day)
FY 05-06 FY 06-07 Outlook FY 07-08 Budget FY 08-09
Page 71

Account Budget OutlookDescription Totals FY 07-08 Amount % Percent
Increase (Decrease)
Reno-Sparks Convention and Visitors AuthorityFiscal 2008-2009 Annual Forecast and Capital Budget
Room Statistics
Hotels
Number of Licensed Properties 29 27 2 7.4%Number Of Days in the Year 365 366 (1) -0.3%Rooms Available per Day (Licensed Rooms) 15,703 15,195 508 3.3%Available Rooms Per Year 5,731,666 5,532,913 198,753 3.6%Average Number of Rooms Per Property 541 563 (22) -3.8%
Occupied Rooms Cash 3,141,722 3,084,800 56,922 1.8% Comp 838,888 848,096 (9,208) -1.1% 28 Day 7,490 7,745 (255) -3.3%
Total Occupied 3,988,100 3,940,641 47,459 1.2%
Vacant 1,743,566 1,592,272 151,294 9.5%
Total Available Rooms (Licensed) 5,731,666 5,532,913 198,753 3.6%
Percentage of Occupancy Cash 54.8% 55.8% (0.9) -1.6% Comp 14.6% 15.3% (0.7) -4.6% 28 Day 0.1% 0.1% - 0.0%
Total Occupancy Percentage 69.6% 71.2% (1.6) -2.2%
Vacant 30.4% 28.8% 0.8 2.6%
Total (must equal 100.0%) 100.0% 100.0% - 0.0%
Revenues Cash - Taxable $274,215,049 $261,887,610 $12,327,439 4.7%
Comp - Exempt 53,761,856 54,627,064 (865,208) -1.6% 28 Day - Exempt 405,741 427,018 (21,277) -5.0%
Total Revenues $328,382,646 $316,941,692 $11,440,954 3.6%
Average Rates Cash $87.28 $84.90 $2.39 2.8% Comp $64.09 $64.41 ($0.32) -0.5% 28 Day $54.17 $55.13 ($0.96) -1.7%
Page 72

Account Budget OutlookDescription Totals FY 07-08 Amount % Percent
Increase (Decrease)
Reno-Sparks Convention and Visitors AuthorityFiscal 2008-2009 Annual Forecast and Capital Budget
Room Statistics
Motels
Number of Licensed Properties 33 33 - 0.0%Number Of Days in the Year 365 366 (1) -0.3%Rooms Available per Day (Licensed Rooms) 2,276 2,276 - 0.0%Rooms Available per Year 830,740 840,910 (10,170) -1.2%Average Number of Rooms Per Property 69 69 - 0.0%
Occupied Rooms Cash 374,931 404,853 (29,922) -7.4% Comp 1,693 1,721 (28) -1.6% 28 Day 43,241 41,097 2,144 5.2%
Total Occupied 419,865 447,671 (27,806) -6.2%
Vacant 410,875 393,239 17,636 4.5%
Total Available Rooms (Licensed) 830,740 840,910 (10,170) -1.2%
Percentage of Occupancy Cash 45.1% 48.1% (3.0) -6.2% Comp 0.2% 0.2% - 0.0% 28 Day 5.2% 4.9% 0.3 6.1%
Total Occupancy Percentage 50.5% 53.2% (2.7) -5.1%
Vacant 49.5% 46.8% 2.7 5.8%
Total (must equal 100.0%) 100.0% 100.0% - 0.0%
Revenues Cash - Taxable $24,835,707 $24,575,656 $260,051 1.1%
Comp - Exempt 95,103 97,177 (2,074) -2.1% 28 Day - Exempt 1,304,285 1,281,852 22,433 1.8%
Total Revenues $26,235,095 $25,954,685 $280,410 1.1%
Average Rates Cash $66.24 $60.70 $5.54 9.1% Comp $56.17 $56.47 ($0.29) -0.5% 28 Day $30.16 $31.19 ($1.03) -3.3%
Page 73

Account Budget OutlookDescription Totals FY 07-08 Amount % Percent
Increase (Decrease)
Reno-Sparks Convention and Visitors AuthorityFiscal 2008-2009 Annual Forecast and Capital Budget
Room Statistics
28 Day Motels
Number of Licensed Properties 110 110 - 0.0%Number Of Days in the Year 365 366 (1) -0.3%Rooms Available per Day (Licensed Rooms) 4,373 4,373 - 0.0%Available Rooms Per Year 1,596,145 1,655,239 (59,094) -3.6%Average Number of Rooms Per Property 40 40 - 0.0%
Occupied Rooms Cash 190,129 196,651 (6,522) -3.3% Comp - - - 0.0% 28 Day 1,081,721 1,069,519 12,202 1.1%
Total Occupied 1,271,850 1,266,170 5,680 0.4%
Vacant 324,295 389,069 (64,774) -16.6%
Total Available Rooms (Licensed) 1,596,145 1,655,239 (59,094) -3.6%
Percentage of Occupancy Cash 11.9% 11.9% - 0.0% Comp 0.0% 0.0% - 0.0% 28 Day 67.8% 64.6% 3.2 5.0%
Total Occupancy Percentage 79.7% 76.5% 3.2 4.2%
Vacant 20.3% 23.5% (3.2) -13.6%
Total (must equal 100.0%) 100.0% 100.0% - 0.0%
Revenues Cash - Taxable $5,120,287 $5,540,979 ($420,692) -7.6%
Comp - Exempt - - - 0.0% 28 Day - Exempt 21,992,728 21,625,142 367,586 1.7%
Total Revenues $27,113,015 $27,166,121 ($53,106) -0.2%
Average Rates Cash $26.93 $28.18 ($1.25) -4.4% Comp $0.00 $0.00 $0.00 0.0% 28 Day $20.33 $20.22 $0.11 0.6%
Page 74

Account Budget OutlookDescription Totals FY 07-08 Amount % Percent
Increase (Decrease)
Reno-Sparks Convention and Visitors AuthorityFiscal 2008-2009 Annual Forecast and Capital Budget
Room Statistics
R.V. Parks
Number of Licensed Properties 15 15 - 0.0%Number Of Days in the Year 365 366 (1) -0.3%Spaces Available per Day (Licensed Spaces) 1,738 1,738 - 0.0%Available Spaces Per Year 634,370 641,487 (7,117) -1.1%Average Number of Spaces Per Property 116 116 - 0.0%
Occupied Spaces Cash 84,191 84,005 186 0.2% Comp 779 842 (63) -7.5% 28 Day 313,139 310,338 2,801 0.9%
Total Occupied 398,109 395,185 2,924 0.7%
Vacant 236,261 246,302 (10,041) -4.1%
Total Available Spaces (Licensed) 634,370 641,487 (7,117) -1.1%
Percentage of Occupancy Cash 13.3% 13.1% 0.2 1.3% Comp 0.1% 0.1% - 0.0% 28 Day 49.4% 48.4% 1.0 2.0%
Total Occupancy Percentage 62.8% 61.6% 1.2 1.9%
Vacant 37.2% 38.4% (1.2) -3.0%
Total (must equal 100.0%) 100.0% 100.0% - 0.0%
Revenues Cash - Taxable $2,834,616 $2,710,125 $124,491 4.6%
Comp - Exempt 29,105 30,798 (1,693) -5.5% 28 Day - Exempt 4,096,572 4,057,469 39,103 1.0%
Total Revenues $6,960,293 $6,798,392 $161,901 2.4%
Average Rates Cash $33.67 $32.26 $1.41 4.4% Comp $37.36 $36.58 $0.78 2.1% 28 Day $13.08 $13.07 $0.01 0.1%
Page 75

Account Budget OutlookDescription Totals FY 07-08 Amount % Percent
Increase (Decrease)
Reno-Sparks Convention and Visitors AuthorityFiscal 2008-2009 Annual Forecast and Capital Budget
Room Statistics
Vacation Rentals
Number of Licensed Properties 9 9 - 0.0%Number Of Days in the Year 365 366 (1) -0.3%Rooms Available per Day (Licensed Rooms) 632 632 - 0.0%Available Rooms Per Year 230,680 240,850 (10,170) -4.2%Average Number of Rooms Per Property 70 70 - 0.0%
Occupied Rooms Cash 19,631 21,651 (2,020) -9.3% Comp - - - 0.0% 28 Day 56,535 59,590 (3,055) -5.1%
Total Occupied 76,166 81,241 (5,075) -6.2%
Vacant 154,514 159,609 (5,095) -3.2%
Total Available Rooms (Licensed) 230,680 240,850 (10,170) -4.2%
Percentage of Occupancy Cash 8.5% 9.0% (0.5) -5.3% Comp 0.0% 0.0% - 0.0% 28 Day 24.5% 24.7% (0.2) -0.9%
Total Occupancy Percentage 33.0% 33.7% (0.7) -2.1%
Vacant 67.0% 66.3% 0.7 1.1%
Total (must equal 100.0%) 100.0% 100.0% - 0.0%
Revenues Cash - Taxable $6,411,771 $6,687,166 ($275,395) -4.1%
Comp - Exempt - - - 0.0% 28 Day - Exempt 2,773,403 2,916,194 (142,791) -4.9%
Total Revenues $9,185,174 $9,603,360 ($418,186) 0.0%
Average Rates Cash $326.61 $308.86 $17.75 5.7% Comp $0.00 $0.00 $0.00 0.0% 28 Day $49.06 $48.94 $0.12 0.2%
Page 76

Account Budget OutlookDescription Totals FY 07-08 Amount % Percent
Increase (Decrease)
Reno-Sparks Convention and Visitors AuthorityFiscal 2008-2009 Annual Forecast and Capital Budget
Room Statistics
Time Shares
Number of Licensed Properties 9 9 - 0.0%Number Of Days in the Year 365 366 (1) -0.3%Rooms Available per Day (Licensed Rooms) 609 609 - 0.0%Available Rooms Per Year 222,285 223,642 (1,357) -0.6%Average Number of Rooms Per Property 68 68 - 0.0%
Occupied Rooms Cash 79,627 78,486 1,141 1.5% Comp - - - 0.0% 28 Day - - - 0.0%
Total Occupied 79,627 78,486 1,141 1.5%
Vacant 142,658 145,156 (2,498) -1.7%
Total Available Rooms (Licensed) 222,285 223,642 (1,357) -0.6%
Percentage of Occupancy Cash 35.8% 35.1% 0.7 2.1% Comp 0.0% 0.0% - 0.0% 28 Day 0.0% 0.0% - 0.0%
Total Occupancy Percentage 35.8% 35.1% 0.7 2.1%
Vacant 64.2% 64.9% (0.7) -1.1%
Total (must equal 100.0%) 100.0% 100.0% - 0.0%
Revenues Cash - Taxable $1,998,239 $2,092,088 ($93,849) -4.5%
Comp - Exempt - - - 0.0% 28 Day - Exempt - - - 0.0%
Total Revenues $1,998,239 $2,092,088 ($93,849) 0.0%
Average Rates Cash $25.09 $26.66 ($1.56) -5.9% Comp $0.00 $0.00 $0.00 0.0% 28 Day $0.00 $0.00 $0.00 0.0%
Page 77

Account Budget OutlookDescription Totals FY 07-08 Amount % Percent
Increase (Decrease)
Reno-Sparks Convention and Visitors AuthorityFiscal 2008-2009 Annual Forecast and Capital Budget
Room Tax Revenues and Statistics
Gross Tax Collections By Jurisdictions RSCVA Lodging Tax $20,896,288 $20,106,453 $789,835 3.9% Convention Center (SB 477) 6,308,313 6,069,873 238,441 3.9% City Center (SB 477) 2,098,541 1,976,504 122,038 6.2% Downtown Events Center (SB 221) 1,613,628 1,624,442 (10,814) -0.7% Washoe County 361,950 341,414 20,536 6.0% Reno Parks & Recreation Fund 2,403,708 2,306,206 97,502 4.2% Reno Railroad District 1,055,615 1,058,432 (2,817) -0.3% State of Nevada 1,182,809 1,138,101 44,708 3.9% Victorian Square Project 971,245 968,289 2,956 0.3% National Bowling Stadium (SB 112) 3,154,157 3,034,936 119,220 3.9%
Total Gross Tax By Jurisdictions $40,046,255 $38,624,651 $1,421,604 3.7%
Convention Center(SB 477) 15.7%
City Center (SB 477)11.0%
Downtown Events Center (SB 221)
8.4%Washoe County
1.9%Reno Parks & Recreation
Fund12.6%
Reno Railroad District5.5%
State of Nevada6.2%
Victorian Square Project5.1%
National Bowling Stadium (SB 112)
16.5%
Distribution of Room Tax Collections FY 08-09 Budget
Convention Center(SB 477) 15.8%
City Center (SB 477)10.7%
Downtown Events Center (SB 221)
8.8%Washoe County
1.8%Reno Parks & Recreation
Fund12.5%
Reno Railroad District5.7%
State of Nevada6.1%
Victorian Square Project5.2%
National Bowling Stadium (SB 112)
16.4%
Distribution of Room Tax Collections FY 07-08 Outlook
Page 78

Account Budget OutlookDescription Totals FY 07-08 Amount % Percent
Increase (Decrease)
Reno-Sparks Convention and Visitors AuthorityFiscal 2008-2009 Annual Forecast and Capital Budget
Room Tax Revenues and Statistics
RSCVA Tax Revenues
RSCVA Lodging Tax $20,896,288 $20,281,168 $615,120 3.0% Convention Center 6,308,314 6,116,872 191,442 3.1%
Total RSCVA Tax Revenues $27,204,602 $26,398,040 $806,562 3.1%
Convention Center23.2%
RSCVA Lodging Tax76.8%
RSCVA Tax Revenue Source FY 08-09 Budget
Convention Center23.2%
RSCVA Lodging Tax76.8%
RSCVA Tax Revenue Source FY 07-08 Outlook
Page 79

Fiscal Year TaxEnding June 30 Collections Amount % Percent
FY 94-95 $15,332,558 $ - 0.0%FY 95-96 16,258,508 925,950 6.0%FY 96-97 16,347,316 88,808 0.5%FY 97-98 17,517,536 1,170,220 7.2%FY 98-99 17,137,688 (379,848) -2.2%FY 99-00 18,527,709 1,390,021 8.1%FY 00-01 18,737,762 210,053 1.1%FY 01-02 17,550,841 (1,186,921) -6.3%FY 02-03 16,963,290 (587,551) -3.3%FY 03-04 17,199,160 235,870 1.4%FY 04-05 18,262,011 1,062,851 6.2%FY 05-06 19,404,215 1,142,204 6.3%FY 06-07 20,433,999 1,029,784 5.3%
FY 07-08 Outlook 20,281,168 (152,831) -0.7%FY 08-09 Budget 20,948,530 667,362 3.3%
0
Increase (Decrease)
Reno-Sparks Convention and Visitors Authority
Room Tax Growth Trend (6 5/8%)
Fiscal 2008-2009 Annual Forecast and Capital Budget
$19,000,000
$20,000,000
$21,000,000
$22,000,000
6 5/8 % Room Tax Collections Trend
$14,000,000
$15,000,000
$16,000,000
$17,000,000
$18,000,000
FY 94-95 FY 95-96 FY 96-97 FY 97-98 FY 98-99 FY 99-00 FY 00-01 FY 01-02 FY 02-03 FY 03-04 FY 04-05 FY 05-06 FY 06-07 FY 07-08 Outlook
FY 08-09 Budget
Page 80

B
udge
tFY
98-
99FY
99-
00FY
00-
01FY
01-
02FY
02-
03FY
03-
04FY
04-
05FY
05-
06FY
06-
07B
udge
tO
utlo
okFY
08-
09
Taxa
ble
Rev
enue
s B
y D
istr
ict
Ren
o E
7,26
0,53
6
5,
656,
017
5,76
6,69
8
4,
883,
207
3,39
0,70
8
3,
690,
466
3,40
7,05
7
3,
459,
707
3,00
0,28
8
3,
036,
054
2,45
2,88
8
2,
013,
673
Ren
o B
80,1
16,0
25
89
,092
,271
92,3
07,5
15
89
,587
,519
92,9
87,0
00
10
6,43
7,85
0
112,
017,
387
11
6,89
2,39
5
122,
929,
385
12
4,29
5,32
4
122,
324,
481
13
2,79
5,64
7
Ren
o D
101,
777,
305
11
0,58
7,63
8
109,
527,
594
97
,229
,093
98,1
43,0
10
10
2,69
5,61
0
94,0
09,1
72
98
,113
,527
103,
745,
611
10
4,97
2,32
3
105,
843,
248
10
5,56
1,52
2
Spar
ks34
,430
,862
34,7
43,8
85
34
,027
,285
32,8
75,9
38
29
,546
,463
31,5
68,7
56
31
,970
,360
34,9
49,8
27
38
,186
,349
38,6
02,7
27
38
,731
,562
38,8
49,7
89
W
asho
e A
6,62
9,76
3
8,
306,
645
9,16
9,57
9
8,
851,
136
8,45
2,36
8
2,
122,
749
494,
152
47
5,39
6
483,
954
49
1,33
5
419,
392
27
1,32
7
Was
hoe
B 28
,938
,219
30,4
99,2
85
31
,634
,188
28,5
39,6
33
23
,696
,745
25,9
28,7
73
33
,644
,888
34,5
13,9
32
34
,984
,717
35,1
81,5
02
33
,722
,053
35,9
23,7
11
Tota
l Tax
able
Rev
enue
s25
9,15
2,71
0
278,
885,
741
28
2,43
2,85
9
261,
966,
526
25
6,21
6,29
4
272,
444,
204
27
5,54
3,01
6
288,
404,
784
30
3,33
0,30
4
306,
579,
265
30
3,49
3,62
4
315,
415,
669
Roo
m T
ax R
even
ue
Lo
dgin
g (6
.625
%)
17,1
37,6
68
18
,527
,708
18,7
37,7
62
17
,550
,841
16,9
63,2
90
18
,157
,051
18,2
62,0
11
19
,404
,215
20,4
33,9
99
20
,387
,522
20,2
81,1
68
20
,948
,530
Con
vent
ion
Cen
ter (
2.0%
)47
8,94
3
5,59
3,26
7
5,
656,
680
5,29
8,36
3
5,
120,
993
5,48
1,37
4
5,
513,
060
5,85
7,87
6
6,
168,
754
6,13
1,58
5
6,
116,
872
6,32
4,08
3
C
ity C
ente
r (1.
0%)
-
-
-
-
-
-
-
-
69,5
69
-
-
-
Tota
l Roo
m T
ax R
even
ue17
,616
,611
24,1
20,9
75
24
,394
,442
22,8
49,2
04
22
,084
,283
23,6
38,4
25
23
,775
,071
25,2
62,0
91
26
,672
,322
26,5
19,1
07
26
,398
,040
27,2
72,6
13
6.
798%
8.64
9%8.
637%
8.72
2%8.
619%
8.67
6%8.
628%
8.75
9%8.
793%
8.65
0%8.
698%
8.64
7%
Roo
m S
tatis
tics
O
ccup
ied
Roo
ms
Cas
h4
773
411
501
790
94
926
899
461
033
54
534
515
464
485
24
382
318
431
528
84
092
349
413
716
73
870
446
389
023
1
Act
ual
FY 0
7-08
R
oom
Tax
Col
lect
ions
and
Sta
tistic
sC
onso
lidat
ed S
umm
ary
Des
crip
tion
Ble
nded
Tax
Rat
e to
RS
CV
A
Fisc
al 2
008-
2009
Ann
ual F
orec
ast a
nd C
apita
l Bud
get
A
ccou
nt
Occ
upie
d R
oom
s-C
ash
4,77
3,41
1
5,
017,
909
4,92
6,89
9
4,
610,
335
4,53
4,51
5
4,
644,
852
4,38
2,31
8
4,
315,
288
4,09
2,34
9
4,
137,
167
3,87
0,44
6
3,
890,
231
A
vera
ge R
ate
- Cas
h54
.29
$
55
.58
$
57
.32
$
56
.82
$
56
.50
$
58
.66
$
$6
2.88
$66.
83$7
4.12
$74.
10$7
8.41
$81.
08
Ava
ilabl
e R
oom
s 9,
989,
265
10,2
34,2
43
10
,101
,948
9,99
5,29
8
10
,067
,601
9,91
1,86
1
9,
618,
024
9,28
0,06
0
8,
991,
132
9,28
6,12
8
9,
135,
041
9,24
5,88
6
Occ
upie
d R
oom
sC
ash
4,77
3,41
1
5,
017,
909
4,92
6,89
9
4,
610,
335
4,53
4,51
5
4,
644,
852
4,38
2,31
8
4,
315,
288
4,09
2,34
9
4,
137,
167
3,87
0,44
6
3,
890,
231
Com
p70
9,66
9
717,
534
74
8,90
3
749,
707
81
8,55
8
840,
564
84
3,83
3
818,
301
79
1,13
9
808,
395
85
0,65
9
841,
360
28
Day
1,37
8,42
1
1,
497,
407
1,59
5,92
3
1,
580,
163
1,56
0,21
5
1,
548,
199
1,54
3,64
5
1,
583,
153
1,54
0,91
0
1,
550,
427
1,48
8,28
9
1,
502,
126
To
tal O
ccup
ied
Roo
ms
6,86
1,50
1
7,
232,
850
7,27
1,72
5
6,
940,
205
6,91
3,28
8
7,
033,
615
6,76
9,79
6
6,
716,
742
6,42
4,39
8
6,
495,
989
6,20
9,39
4
6,
233,
717
Pe
rcen
tage
of O
ccup
ancy
C
ash
47.8
%49
.0%
48.8
%46
.1%
45.0
%46
.9%
45.6
%46
.5%
45.5
%44
.6%
42.4
%42
.1%
Com
p7.
1%7.
0%7.
4%7.
5%8.
1%8.
5%8.
8%8.
8%8.
8%8.
7%9.
3%9.
1%28
Day
13.8
%14
.6%
15.8
%15
.8%
15.5
%15
.6%
16.0
%17
.1%
17.1
%16
.7%
16.3
%16
.2%
Tota
l Per
cent
age
of O
ccup
ancy
68.7
%70
.7%
72.0
%69
.4%
68.7
%71
.0%
70.4
%72
.4%
71.5
%70
.0%
68.0
%67
.4%
Rev
enue
Per
Ava
ilabl
e R
oom
(Rev
PA
R)
$25.
94$2
7.25
$27.
96$2
6.21
$25.
45$2
7.49
$28.
65$3
1.08
$33.
74$3
3.01
$33.
22$3
4.11
Page 81

Object Account Account Budget Outlook
# # Description Totals FY 07-08 Amount % Percent
RevenuesR013 Convention Center Tax (2.0%) $6,324,083 $6,116,872 $207,211 3.4%R030 Nevada Sate Lodging Tax (5/8 %) 1,976,278 1,911,522 64,756 3.4%R450 Room Tax (6.0%) 18,972,252 18,369,646 602,606 3.3%
Total Revenues $27,272,613 $26,398,040 $874,573 3.3%
`
Increase (Decrease)
Reno-Sparks Convention and Visitors AuthorityFiscal 2008-2009 Annual Forecast and Capital Budget
Room TaxesFund 15999
Page 82

Account Budget OutlookDescription Totals FY 07-08 Amount % Percent
Increase (Decrease)
Reno-Sparks Convention and Visitors AuthorityFiscal 2008-2009 Annual Forecast and Capital Budget
Room Tax Revenues and Statistics
Tax Rates and Collections By JurisdictionsHistorical % of Revenues
Reno B (Outlying Reno area) 42.1% 40.3% 1.8% 4.5%Reno D (Downtown Reno) 33.5% 34.9% -1.4% -4.0%Reno E (Downtown Reno) 0.6% 0.8% -0.2% -24.7%Sparks (City of Sparks) 12.3% 12.8% -0.4% -3.1%Washoe A (Unincorporated Washoe County) 0.1% 0.1% -0.1% -72.4%Washoe B (Incline Village/ Crystal Bay) 11.4% 11.1% 0.3% 2.7%
Total Percentage 100.0% 100.0% - 0.0%
Revenues By JurisdictionsReno B (Outlying Reno area) $132,795,647 $122,324,481 $10,471,166 8.6%Reno D (Downtown Reno) 105,561,522 105,843,248 (281,726) -0.3%Reno E (Downtown Reno) 2,013,673 2,452,888 (439,215) -17.9%Sparks (City of Sparks) 38,849,789 38,731,562 118,227 0.3%Washoe A (Unincorporated Washoe County) 271,327 419,392 (148,065) -35.3%Washoe B (Incline Village/ Crystal Bay) 35,923,709 33,722,057 2,201,652 6.5%
Total Revenues by Location $315,415,667 $303,493,628 $11,922,039 3.9%
Reno B42.1%
S k
Washoe A0.1%
Washoe B11.4%
Room Tax Collections by Jurisdiction FY 08-09 Budget
Reno D33.5%
Reno E0.6%
Sparks12.3%
Reno B40.3%
Reno D34.9%
Reno E0.8%
Sparks12.8%
Washoe A0.1%
Washoe B11.1%
Room Tax Collections by Jurisdiction FY 07-08 Outlook
Page 83

Account Budget OutlookDescription Totals FY 07-08 Amount % Percent
Increase (Decrease)
Reno-Sparks Convention and Visitors AuthorityFiscal 2008-2009 Annual Forecast and Capital Budget
Room Tax Revenues and Statistics
Tax Rates By LocationReno B 12.000% 12.000% - 0.0%Reno D 13.500% 13.500% - 0.0%Reno E 13.500% 13.500% - 0.0%Sparks 13.500% 13.500% - 0.0%Washoe A 12.000% 12.000% - 0.0%Washoe B 12.000% 12.000% - 0.0%
Combined - Blended Tax Rate 12.696% 12.727% - 0.0%
Gross Room Tax CollectionsReno B $15,935,478 $14,678,938 $1,256,540 8.6%Reno D 14,250,805 14,288,838 (38,033) -0.3%Reno E 271,846 331,140 (59,294) -17.9%Sparks 5,244,722 5,228,761 15,961 0.3%Washoe A 32,559 50,327 (17,768) -35.3%Washoe B 4,310,845 4,046,647 264,198 6.5%
Total Gross Tax Collections $40,046,255 $38,624,651 $1,421,604 3.7%
Reno BTax Rates Convention Center 2.000% 2.000% - 0.0% City Center 1.000% 1.000% - 0.0% Washoe County 0.000% 0.000% - 0.0% Reno Parks & Recreation Fund 1.000% 1.000% - 0.0% Reno Railroad District 0.000% 0.000% - 0.0%State of Nevada 0 375% 0 375% - 0 0% State of Nevada 0.375% 0.375% - 0.0% RSCVA Lodging Tax 6.625% 6.625% - 0.0% National Bowling Stadium 1.000% 1.000% - 0.0%
Total Tax Rate 12.000% 12.000% - 0.0%
Tax Revenues Distribution - Reno B Convention Center $2,655,913 $2,446,490 $209,423 8.6% City Center 1,327,956 1,223,245 104,712 8.6% Washoe County - - - 0.0% Reno Parks & Recreation Fund 1,327,956 1,223,245 104,712 8.6% Reno Railroad District - - - 0.0% State of Nevada 497,984 458,717 39,267 8.6% RSCVA Lodging Tax 8,797,712 8,103,997 693,715 8.6% National Bowling Stadium 1,327,956 1,223,245 104,712 8.6%
Total - Reno B $15,935,478 $14,678,938 $1,256,540 8.6%
Page 84

Account Budget OutlookDescription Totals FY 07-08 Amount % Percent
Increase (Decrease)
Reno-Sparks Convention and Visitors AuthorityFiscal 2008-2009 Annual Forecast and Capital Budget
Room Tax Revenues and Statistics
Reno DTax Rates Convention Center 2.000% 2.000% - 0.0% City Center 0.000% 0.000% - 0.0% Downtown Events Center 1.500% 1.500% - 0.0% Washoe County 0.000% 0.000% - 0.0% Reno Parks & Recreation Fund 1.000% 1.000% - 0.0% Reno Railroad District 1.000% 1.000% - 0.0% State of Nevada 0.375% 0.375% - 0.0% RSCVA Lodging Tax 6.625% 6.625% - 0.0% National Bowling Stadium 1.000% 1.000% - 0.0%
Total Tax Rate 13.500% 13.500% - 0.0%
Tax Revenues Distribution - Reno D Convention Center $2,111,230 $2,116,865 ($5,635) -0.3% City Center - - - 0.0% Downtown Events Center 1,583,423 1,587,649 (4,226) -0.3% Washoe County - - - 0.0% Reno Parks & Recreation Fund 1,055,615 1,058,432 (2,817) -0.3% Reno Railroad District 1,055,615 1,058,432 (2,817) -0.3% State of Nevada 395,856 396,912 (1,056) -0.3% RSCVA Lodging Tax 6,993,451 7,012,115 (18,664) -0.3% National Bowling Stadium 1,055,615 1,058,432 (2,817) -0.3%
Total Tax Rate $14,250,805 $14,288,838 ($38,033) -0.3%
Reno ETax RatesConvention Center 2 000% 2 000% - 0 0% Convention Center 2.000% 2.000% - 0.0% City Center 1.000% 1.000% - 0.0% Downtown Events Center 1.500% 1.500% - 0.0% Washoe County 0.000% 0.000% - 0.0% Reno Parks & Recreation Fund 1.000% 1.000% - 0.0% Reno Railroad District 0.000% 0.000% - 0.0% State of Nevada 0.375% 0.375% - 0.0% RSCVA Lodging Tax 6.625% 6.625% - 0.0% National Bowling Stadium 1.000% 1.000% - 0.0%
Total Tax Rate 13.500% 13.500% - 0.0%
Tax Revenues Distribution - Reno E Convention Center $40,273 $49,058 ($8,784) -17.9% City Center 20,137 24,529 (4,392) -17.9% Downtown Events Center 30,205 36,793 (6,588) -17.9% Washoe County - - - 0.0% Reno Parks & Recreation Fund 20,137 24,529 (4,392) -17.9% Reno Railroad District - - - 0.0% State of Nevada 7,551 9,198 (1,647) -17.9% RSCVA Lodging Tax 133,406 162,504 (29,098) -17.9% National Bowling Stadium 20,137 24,529 (4,392) -17.9%
Total - Reno E $271,846 $331,140 ($59,294) -17.9%
Page 85

Account Budget OutlookDescription Totals FY 07-08 Amount % Percent
Increase (Decrease)
Reno-Sparks Convention and Visitors AuthorityFiscal 2008-2009 Annual Forecast and Capital Budget
Room Tax Revenues and Statistics
SparksTax Rates Convention Center 2.000% 2.000% - 0.0% City Center 1.000% 1.000% - 0.0% Washoe County 0.000% 0.000% - 0.0% Reno Parks & Recreation Fund 0.000% 0.000% - 0.0% Reno Railroad District 0.000% 0.000% - 0.0% State of Nevada 0.375% 0.375% - 0.0% Victorian Square Project 2.500% 2.500% - 0.0% RSCVA Lodging Tax 6.625% 6.625% - 0.0% National Bowling Stadium 1.000% 1.000% - 0.0%
Total Tax Rate 13.500% 13.500% - 0.0%
Tax Revenues Distribution - Sparks Convention Center $776,996 $774,631 $2,365 0.3% City Center 388,498 387,316 1,182 0.3% Washoe County - - - 0.0% Reno Parks & Recreation Fund - - - 0.0% Reno Railroad District - - - 0.0% State of Nevada 145,687 145,243 443 0.3% Victorian Square Project 971,245 968,289 2,956 0.3% RSCVA Lodging Tax 2,573,799 2,565,966 7,833 0.3% National Bowling Stadium 388,498 387,316 1,182 0.3%
Total - Sparks $5,244,722 $5,228,761 $15,961 0.3%
Washoe ATax RatesConvention Center 2 000% 2 000% - 0 0% Convention Center 2.000% 2.000% - 0.0% City Center 1.000% 1.000% - 0.0% Washoe County 1.000% 1.000% - 0.0% Reno Parks & Recreation Fund 0.000% 0.000% - 0.0% Reno Railroad District 0.000% 0.000% - 0.0% State of Nevada 0.375% 0.375% - 0.0% RSCVA Lodging Tax 6.625% 6.625% - 0.0% National Bowling Stadium 1.000% 1.000% - 0.0%
Total Tax Rate 12.000% 12.000% - 0.0%
Tax Revenues Distribution - Washoe A Convention Center $5,427 $8,388 ($2,961) -35.3% City Center 2,713 4,194 (1,481) -35.3% Washoe County 2,713 4,194 (1,481) -35.3% Reno Parks & Recreation Fund - - - 0.0% Reno Railroad District - - - 0.0% State of Nevada 1,017 1,573 (555) -35.3% RSCVA Lodging Tax 17,975 27,785 (9,809) -35.3% National Bowling Stadium 2,713 4,194 (1,481) -35.3%
Total - Washoe A $32,559 $50,327 ($17,768) -35.3%
Page 86

Account Budget OutlookDescription Totals FY 07-08 Amount % Percent
Increase (Decrease)
Reno-Sparks Convention and Visitors AuthorityFiscal 2008-2009 Annual Forecast and Capital Budget
Room Tax Revenues and Statistics
Washoe BTax Rates Convention Center 2.000% 2.000% - 0.0% City Center 1.000% 1.000% - 0.0% Washoe County 1.000% 1.000% - 0.0% Reno Parks & Recreation Fund 0.000% 0.000% - 0.0% Reno Railroad District 0.000% 0.000% - 0.0% State of Nevada 0.375% 0.375% - 0.0% RSCVA Lodging Tax 6.625% 6.625% - 0.0% National Bowling Stadium 1.000% 1.000% - 0.0%
Total Tax Rate 12.000% 12.000% - 0.0%
Tax Revenues Distribution - Washoe B Convention Center $718,474 $674,441 $44,033 6.5% City Center 359,237 337,221 22,017 6.5% Washoe County 359,237 337,221 22,017 6.5% Reno Parks & Recreation Fund - - - 0.0% Reno Railroad District - - - 0.0% State of Nevada 134,714 126,458 8,256 6.5% RSCVA Lodging Tax 2,379,946 2,234,086 145,859 6.5% National Bowling Stadium 359,237 337,221 22,017 6.5%
Total - Washoe B $4,310,845 $4,046,647 $264,198 6.5%
Page 87

Number Percent ofName of Rooms Total Rooms
Grand Sierra 1,994 7.91%Silver Legacy 1,710 6.78%Peppermill Hotel/Casino 1,623 6.44%Circus Circus 1,572 6.23%Nugget 1,382 5.48%Atlantis Hotel/Casino 974 3.86%Harrah's 928 3.68%Sands Regency 833 3.30%Eldorado Hotel/Casino 815 3.23%All Other Hotels 3,627 14.38%Total All Hotels 15,458 61.30%Motels 2,276 9.02%Other Rental Properties 7,485 29.68%
Total Room Inventory 25,219 100.00%
RENO-SPARKS CONVENTION AND VISITORS AUTHORITYPRINCIPAL ROOM TAXPAYERS
(Unaudited)March 1, 2008
The chief revenue source of the Authority is from room license taxes imposed on transient rental facilitieslocated in Washoe County. The properties listed above represent the largest properties in this area andaccordingly, represent the group which generates the largest volume of room license tax revenues.
Source: Reno-Sparks Convention and Visitors Authority
Page 88

RENO-SPARKS CONVENTION AND VISITORS AUTHORITY FISCAL 2008-2009 ANNUAL FORECAST AND CAPITAL BUDGET
RENO- SPARKS CONVENTION CENTER
DESCRIPTION: The Reno-Sparks Convention Center offers more than 500,000 square feet of exhibition, meeting room, and pre-function space. A total of 381,000 square feet of exhibit space is available in five (5) contiguous halls. The facility provides 81,000 square feet of concourse and pre-function space – 17,500 square feet of which serves as a central registration area. The Mt. Rose Ballroom furnishes meeting planners with 30,000 square feet of multi-purpose swing space for formal dining functions, general sessions, seminars, and/or exhibits. The ballroom subdivides into seven (7) smaller breakout rooms. Forty-six (46) meeting rooms (excluding seven ballroom breakout rooms) encompassing 72,000 square feet, affords clients with flexible space to meet the unique requirements of each show. The convention center includes state-of-the-art lighting, heating, ventilation, air conditioning, audio/visual and communication technology to address the increasing service requirements demanded by show clients. Skylights and vibrant colors highlight the corridors throughout the facility. STAFF: The convention center staff is comprised of thirty-nine (39) full-time positions. There are four departments within the Convention Center consisting of:
• Administration – General Manager, two Event Services Managers, Senior Event Manager, Booking Coordinator, Sales Manager, Office Administrator, Receptionist, two Audio Visual Technicians, and an Audio Visual Manager.
• Engineering – Engineering Supervisor and six Engineers. • Maintenance – Facility Services Supervisor and fourteen Facility Service
Workers. • Public Safety – Public Safety Supervisor and five Public Safety Officers.
FISCAL YEAR 2008-2009 OBJECTIVES:
• Achieve goals and measurements as outlined in the Strategic Plan. • To provide superior customer service in support of Sales Department
efforts and retention of current client base. Increase customer service levels through employee training, additional personnel, high quality features and convenience.
• Continue to monitor and track energy efficiency program. • Increase “Green” efforts with respect to recycling, lighting retrofits, and
investigating Leadership in Energy and Environmental Design (LEED) steps for the facility.
• Increase facility utilization through increased short-term sales efforts.
Page 89

RENO-SPARKS CONVENTION AND VISITORS AUTHORITY FISCAL 2008-2009 ANNUAL FORECAST AND CAPITAL BUDGET
RENO-SPARKS CONVENTION CENTER CONTINUED
STRATEGIES / PROGRAMS:
• Continue short-term business development sales initiatives. • Coordinate sales initiative and activities with Well Bread Restaurant
Services. • Continue to maximize all available revenue streams. • Employee product and guest relations training. • Maximize the development and use of the Event Business Management
System (EBMS) throughout the Convention Center and coordinate efforts with RSCVA Sales & Marketing Departments.
• Continue to practice the ten Guiding Principles and RSCC Mission Statement as developed by staff which include the following:
Documented training for each department Implement “Know Your Building” course Establish Employee Advisory Panel Work order reporting/documentation Employee Exchange Program Customer Service Training Recognition Program
• Continue Event Coordinator site visits at other facilities: Provides training and a network for problem solving
• Implement additional “Green” initiatives and continue to work with local groups, i.e. Keep Truckee Meadows Beautiful to promote facility sustainability.
Revenues:
• Due to the lower number of major conventions/trade show, total revenues are projected to decrease by 11.1%.
• Facility rental rates will remain at the current rate ($0.25 per net square foot).
• Cost reimbursable will increase due to trash removal recovery fees realized from Hearth Patio & Barbeque Association. The revenue is offset by trash removal expenses.
• In addition, parking rates will remain at seven dollars ($7) per vehicle. • Concessions and catering revenue is projected to decrease by 33.1%.
This is a result of the loss of major conventions such as American Legion, Supercomputing, National Cattlemen’s Beef Association, Rocky Mountain Elk Foundation, and AMS Users Group. Revenues are projected to decrease by $200,000 in anticipation of lower food and beverage commissions.
Page 90
RENO-SPARKS CONVENTION AND VISITORS AUTHORITY FISCAL 2008-2009 ANNUAL FORECAST AND CAPITAL BUDGET
RENO- SPARKS CONVENTION CENTER CONTINUED
The convention center signed an advertising agreement with Spot Focus, a company specializing in advertising for convention centers and airports. Sign leases are expected to generate $10,000 in the first year. Operating Expenses:
• Two positions were realigned: Assistant Facility Services Supervisor and Building Engineer Technician.
• An Event Coordinator position will be added in October 2008 in anticipation of the retirement of an event coordinator at year-end.
• Due to fewer major conventions and trade shows, the RSCC’s supplies and services are projected to decrease in FY 08-09 by 5.5%.
• Major expenses include $450,000 has been budgeted for tents for Safari Club International’s Hunters First Convention and parking lot adjustments for Hearth Patio & Barbeque Association’s March 2009 event.
• Overall, electrical utility costs are projected to drop by a modest 3.2%. The skybridge addition, which includes two escalators and an elevator, is projected to increase electrical expenses by $16,000; however, this is offset by lower demand from fewer major events. Sierra Pacific Power Company has projected a slight increase in utility expenses of 4-5%.
• The Public Safety Department will see an increase in building related repairs of $9,000. Many of the department’s forty-seven security cameras have reached their life expectancy (5 years) and will require replacement.
FINANCIAL DEPARTMENTAL DETAIL: The financial reporting of the Reno-Sparks Convention Center is made up of the following four areas: Administrative, Maintenance, Engineering, and Public Safety. A consolidated summary is included for your reference. The following pages detail the departmental line items for the current year budget compared to prior year outlook.
Page 91

Account Budget OutlookDescription Totals FY 07-08 Amount % Percent
Payroll and RelatedAdministrative 905,632 854,574 51,058 6.0%Maintenance 917,893 1,000,831 (82,938) -8.3%Engineering 524,824 555,328 (30,504) -5.5%Public Safety 589,437 586,789 2,648 0.5%
Total Payroll and Related 2,937,786 2,997,522 (59,736) -2.0%
Supplies and ServicesAdministrative 772,900 848,762 (75,862) -8.9%Maintenance 185,954 210,916 (24,962) -11.8%Engineering 1,212,260 1,248,268 (36,008) -2.9%Public Safety 78,160 73,351 4,809 6.6%
Total Supplies and Services 2,249,274 2,381,297 (132,023) -5.5%
Travel and EntertainmentAdministrative 18,850 22,135 (3,285) -14.8%Maintenance - - - 0.0%Engineering - - - 0.0%Public Safety - - - 0.0%
Total Travel and Entertainment 18,850 22,135 (3,285) -14.8%
Increase (Decrease)
Reno-Sparks Convention and Visitors AuthorityFiscal 2008-2009 Annual Forecast and Capital Budget
Reno-Sparks Convention Center - Summary
Promotion and AdvertisingAdministrative 11,800 5,990 5,810 97.0%Maintenance - - - 0.0%Engineering - - - 0.0%Public Safety - - - 0.0%
Total Promotion and Advertising 11,800 5,990 5,810 97.0%
Page 92

Account Budget OutlookDescription Totals FY 07-08 Amount % Percent
Increase (Decrease)
Reno-Sparks Convention and Visitors AuthorityFiscal 2008-2009 Annual Forecast and Capital Budget
Reno-Sparks Convention Center - Summary
Capital OutlayAdministrative - 5,075 (5,075) -100.0%Maintenance - - - 0.0%Engineering - - - 0.0%Public Safety - - - 0.0%
Total Capital Outlay - 5,075 (5,075) -100.0%
Total Expenditures 5,217,710 5,412,019 (194,309) -3.6%
Operating RevenuesAdministrative 4,462,075 5,018,569 (556,494) -11.1%Maintenance - - - 0.0%Engineering - - - 0.0%Public Safety - - - 0.0%
Total Operating Revenues 4,462,075 5,018,569 (556,494) -11.1%
Profit or (Loss) (755,635) (393,450) (362,185) 92.1%
Margin Percentage 16 9% 7 8% (9 1) 116 0%Margin Percentage -16.9% -7.8% (9.1) 116.0%
Departmental Profit or (Loss)Margins
Administrative 2,752,893 3,282,033 (529,140) -16.1%Maintenance (1,103,847) (1,211,747) 107,900 -8.9%Engineering (1,737,084) (1,803,596) 66,512 -3.7%Public Safety (667,597) (660,140) (7,457) 1.1%
Total Departmental Profit or (Loss) (755,635) (393,450) (362,185) 92.1%
Page 93

B
udge
tFY
04-
05FY
05-
06FY
06-
07B
udge
tO
utlo
okFY
08-
09
Rev
enue
sFa
cilit
y R
enta
ls1,
985,
557
1,62
1,88
0
2,
179,
329
2,23
0,08
0
2,
046,
022
2,16
5,06
9
C
once
ssio
ns46
3,07
9
653,
347
1,
003,
168
974,
120
1,
257,
111
841,
371
M
isce
llane
ous
& Ve
ndin
g82
0,33
6
543,
149
1,
117,
931
817,
212
1,
226,
758
1,02
8,96
0
Ev
ent P
arki
ng48
7,35
2
468,
094
40
8,14
6
482,
906
48
8,67
8
426,
675
FY 0
7-08
Ren
o-Sp
arks
Con
vent
ion
Cen
ter
Con
solid
ated
Sum
mar
yFi
scal
200
8-20
09 A
nnua
l For
ecas
t and
Cap
ital B
udge
t
Des
crip
tion
Acco
unt
Ac
tual
Tota
l Rev
enue
s3,
756,
324
3,28
6,47
0
4,
708,
574
4,50
4,31
8
5,
018,
569
4,46
2,07
5
Expe
nses
Payr
oll &
Rel
ated
2,68
1,10
5
2,
753,
508
3,10
8,20
5
2,
999,
039
2,99
7,52
2
2,
937,
786
Supp
lies
& Se
rvic
es1,
661,
894
1,73
5,31
5
2,
069,
485
2,23
2,47
5
2,
381,
297
2,24
9,27
4
Tr
avel
& E
nter
tain
men
t19
,940
42,1
35
26
,815
23,2
00
22
,135
18,8
50
Pr
omot
ion
& Ad
verti
sing
-
15
3
28
15,0
00
5,
990
11
,800
Cap
ital O
utla
y-
-
-
-
5,
075
-
Tota
l Exp
ense
s4,
362,
939
4,53
1,11
1
5,
204,
533
5,26
9,71
4
5,
412,
019
5,21
7,71
0
Dep
artm
enta
l Pro
fit (L
oss)
(606
,615
)
(1
,244
,641
)
(495
,959
)
(7
65,3
96)
(393
,450
)
(7
55,6
35)
Mar
gin
Perc
enta
ge-1
6.1%
-37.
9%-1
0.5%
-17.
0%-7
.8%
-16.
9%
Page 94

Object Account Account Budget Outlook
# # Description Totals FY 07-08 Amount % Percent
03 Payroll and Related0301 Wages - Management 596,533 548,396 48,137 8.8%0305 Temporary Personnel Services 54,500 83,207 (28,707) -34.5%0308 Wages-Casual 5,681 9,254 (3,573) -38.6%0311 Group Insurance 100,800 76,828 23,972 31.2%0312 Retirement Expense 119,214 106,562 12,652 11.9%0313 Industrial Insurance 12,045 9,842 2,203 22.4%0317 FICA/Medicare 8,909 7,383 1,526 20.7%0321 Employee Training 750 902 (152) -16.9%0327 Insurance Contribution - - - 0.0%0380 Vehicle Allowances 7,200 7,200 - 0.0%0382 Bonus/Incentive Pay - 5,000 (5,000) -100.0%0399 Miscellaneous Employee Expense - - - 0.0%
Total Payroll and Related 905,632 854,574 51,058 6.0%
04 Supplies and Services0410 Office Supplies Expenses 15,000 15,794 (794) -5.0%0415 Miscellaneous Supplies 113,500 175,976 (62,476) -35.5%0420 Postage & Freight 2,700 2,670 30 1.1%0421 Communications 7,800 11,860 (4,060) -34.2%0422 Printing and Binding 1,000 1,291 (291) -22.5%0444 Repairs - Equipment 3,900 2,635 1,265 48.0%0450 Professional Services Legal 0 0%
Fund 15030
Increase (Decrease)
Reno-Sparks Convention and Visitors AuthorityFiscal 2008-2009 Annual Forecast and Capital Budget
Reno-Sparks Convention Center - Administration
0450 Professional Services - Legal - - - 0.0%0460 Contractual Services 5,520 4,258 1,262 29.6%0462 Equip. Lease & Maintenance Agmts. 6,180 4,850 1,330 27.4%0463 Insurance 162,000 159,336 2,664 1.7%0470 Miscellaneous Expenses 449,500 464,292 (14,792) -3.2%0471 Finance Charges - 20 (20) -100.0%0473 Dues and Subscriptions 1,800 1,615 185 11.5%0474 Licenses 4,000 4,165 (165) -4.0%0481 Credit Card Disc/Cash Over - - - 0.0%
Total Supplies and Services 772,900 848,762 (75,862) -8.9%
05 Travel and Entertainment0501 Travel and Lodging 11,700 15,964 (4,264) -26.7%0504 Registrations 6,210 5,711 499 8.7%0505 Local Transportation 900 215 685 318.6%0506 Entertainment 40 245 (205) -83.7%0507 Meeting Expenses - - - 0.0%
Total Travel and Entertainment 18,850 22,135 (3,285) -14.8%
Page 95

Object Account Account Budget Outlook
# # Description Totals FY 07-08 Amount % Percent
Fund 15030
Increase (Decrease)
Reno-Sparks Convention and Visitors AuthorityFiscal 2008-2009 Annual Forecast and Capital Budget
Reno-Sparks Convention Center - Administration
06 Promotion and Advertising0601 Hospitality 1,800 2,296 (496) -21.6%0615 Other Advertising 10,000 3,694 6,306 170.7%
Total Promotion and Advertising 11,800 5,990 5,810 97.0%
02 Capital Outlay
0201 Major Repair - 5,075 (5,075) -100.0%0211 Major Equipment - - - 0.0%0220 Minor Equipment - - - 0.0%
Total Capital Outlay - 5,075 (5,075) -100.0%
Total Expenditures 1,709,182 1,736,536 (27,354) -1.6%
RevenuesR310 Rental Income 5,322,227 6,368,847 (1,046,620) -16.4%R311 Facility Rental Discounts (3,157,158) (4,322,825) 1,165,667 -27.0%R313 Sign/Reader Board Rental - - - 0.0%R314 Rental Rebate (Hotels) 111,500 266,323 (154,823) -58.1%R320 Concessions and Catering 841,371 1,257,111 (415,740) -33.1%R330 Set-up Charges 34,830 30,400 4,430 14.6%R333 Vending Machine Revenue 12,000 10,978 1,022 9.3%R360 Miscellaneous Revenues 3 050 49 053 (46 003) 93 8%R360 Miscellaneous Revenues 3,050 49,053 (46,003) -93.8%R365 A/V Equipment Rental 539,080 440,299 98,781 22.4%R370 Technical Service 204,750 339,252 (134,502) -39.6%R375 Telecom 39,350 43,917 R415 Sale Of Fixed Assets - - - 0.0%R420 Gain (Loss) Sale of Fixed Assets - - - 0.0%R480 Other Rental Revenue - 7,440 (7,440) -100.0%R490 Sign Leases 10,000 2,000 8,000 400.0%R520 Event Parking Fees 426,675 488,678 (62,003) -12.7%R750 Cost Reimbursables 74,400 37,096 37,304 100.6%
Total Revenues 4,462,075 5,018,569 (556,494) -11.1%
Departmental Profit (Loss) 2,752,893 3,282,033 (529,140) -16.1%
Page 96
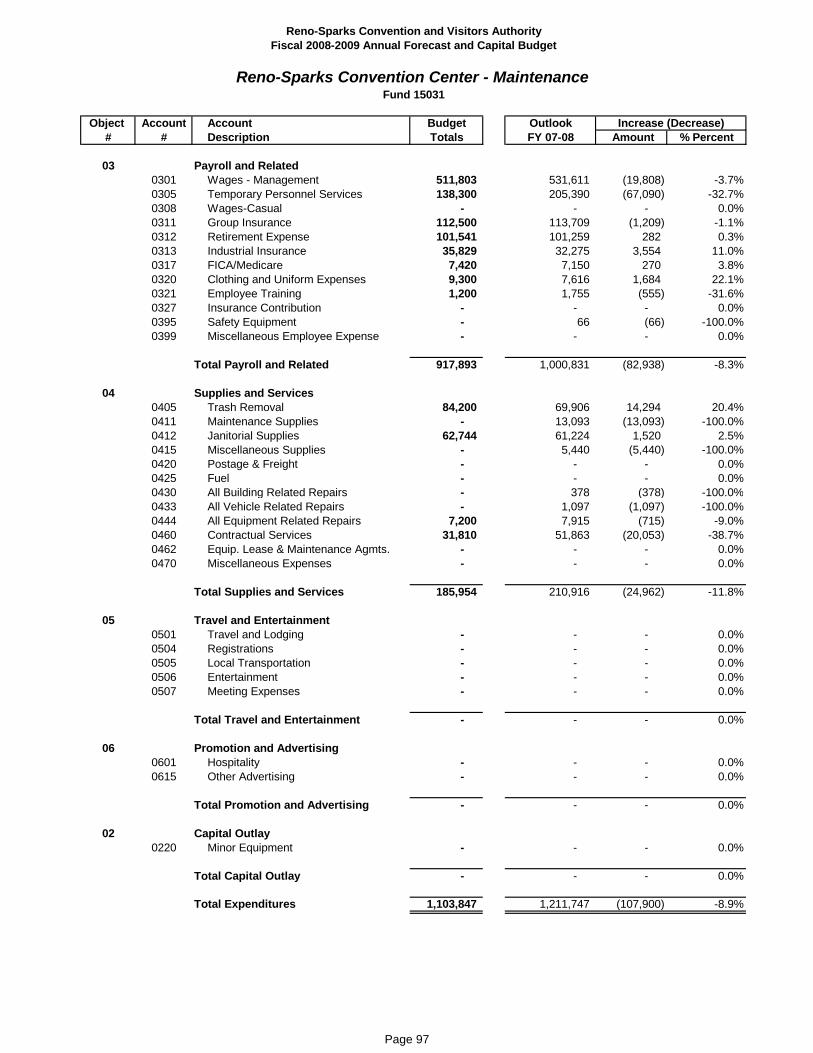
Object Account Account Budget Outlook
# # Description Totals FY 07-08 Amount % Percent
03 Payroll and Related0301 Wages - Management 511,803 531,611 (19,808) -3.7%0305 Temporary Personnel Services 138,300 205,390 (67,090) -32.7%0308 Wages-Casual - - - 0.0%0311 Group Insurance 112,500 113,709 (1,209) -1.1%0312 Retirement Expense 101,541 101,259 282 0.3%0313 Industrial Insurance 35,829 32,275 3,554 11.0%0317 FICA/Medicare 7,420 7,150 270 3.8%0320 Clothing and Uniform Expenses 9,300 7,616 1,684 22.1%0321 Employee Training 1,200 1,755 (555) -31.6%0327 Insurance Contribution - - - 0.0%0395 Safety Equipment - 66 (66) -100.0%0399 Miscellaneous Employee Expense - - - 0.0%
Total Payroll and Related 917,893 1,000,831 (82,938) -8.3%
04 Supplies and Services0405 Trash Removal 84,200 69,906 14,294 20.4%0411 Maintenance Supplies - 13,093 (13,093) -100.0%0412 Janitorial Supplies 62,744 61,224 1,520 2.5%0415 Miscellaneous Supplies - 5,440 (5,440) -100.0%0420 Postage & Freight - - - 0.0%0425 Fuel - - - 0.0%0430 All Building Related Repairs 378 (378) 100 0%
Fund 15031
Increase (Decrease)
Reno-Sparks Convention and Visitors AuthorityFiscal 2008-2009 Annual Forecast and Capital Budget
Reno-Sparks Convention Center - Maintenance
0430 All Building Related Repairs - 378 (378) -100.0%0433 All Vehicle Related Repairs - 1,097 (1,097) -100.0%0444 All Equipment Related Repairs 7,200 7,915 (715) -9.0%0460 Contractual Services 31,810 51,863 (20,053) -38.7%0462 Equip. Lease & Maintenance Agmts. - - - 0.0%0470 Miscellaneous Expenses - - - 0.0%
Total Supplies and Services 185,954 210,916 (24,962) -11.8%
05 Travel and Entertainment0501 Travel and Lodging - - - 0.0%0504 Registrations - - - 0.0%0505 Local Transportation - - - 0.0%0506 Entertainment - - - 0.0%0507 Meeting Expenses - - - 0.0%
Total Travel and Entertainment - - - 0.0%
06 Promotion and Advertising0601 Hospitality - - - 0.0%0615 Other Advertising - - - 0.0%
Total Promotion and Advertising - - - 0.0%
02 Capital Outlay
0220 Minor Equipment - - - 0.0%
Total Capital Outlay - - - 0.0%
Total Expenditures 1,103,847 1,211,747 (107,900) -8.9%
Page 97

Object Account Account Budget Outlook
# # Description Totals FY 07-08 Amount % Percent
03 Payroll and Related0301 Wages - Management 350,253 378,873 (28,620) -7.6%0305 Temporary Personnel Services - - - 0.0%0308 Wages-Casual 13,471 8,279 5,192 62.7%0311 Group Insurance 52,500 57,125 (4,625) -8.1%0312 Retirement Expense 69,184 73,405 (4,221) -5.8%0313 Industrial Insurance 25,458 25,674 (216) -0.8%0317 FICA/Medicare 5,690 5,124 566 11.0%0320 Clothing and Uniform Expenses 5,400 3,745 1,655 44.2%0321 Employee Training 2,040 1,796 244 13.6%0327 Insurance Contribution - - - 0.0%0395 Safety Equipment 828 1,307 (479) -36.6%
Total Payroll and Related 524,824 555,328 (30,504) -5.5%
04 Supplies and Services0401 Utilities - Electric 839,260 867,274 (28,014) -3.2%0402 Utilities - Gas & Heat 182,863 192,894 (10,031) -5.2%0403 Utilities - Water 27,669 28,263 (594) -2.1%0404 Utilities - Sewer 16,683 20,786 (4,103) -19.7%0407 Fire Protection 1,684 1,789 (105) -5.9%0412 Janitorial Supplies - - - 0.0%0415 Miscellaneous Supplies 2,080 1,561 519 33.2%0425 Fuel 0 0%
Fund 15032
Increase (Decrease)
Reno-Sparks Convention and Visitors AuthorityFiscal 2008-2009 Annual Forecast and Capital Budget
Reno-Sparks Convention Center - Engineering
0425 Fuel - - - 0.0%0430 All Building Related Repairs 97,703 100,457 (2,754) -2.7%0433 All Vehicle Related Repairs - - - 0.0%0444 All Equipment Related Repairs 8,782 7,924 858 10.8%0460 Contractual Services 35,536 27,320 8,216 30.1%0462 Equip. Lease & Maintenance Agmts. - - - 0.0%0470 Miscellaneous Expenses - - - 0.0%
Total Supplies and Services 1,212,260 1,248,268 (36,008) -2.9%
05 Travel and Entertainment0501 Travel and Lodging - - - 0.0%0504 Registrations - - - 0.0%0505 Local Transportation - - - 0.0%0506 Entertainment - - - 0.0%0507 Meeting Expenses - - - 0.0%
Total Travel and Entertainment - - - 0.0%
Page 98

Object Account Account Budget Outlook
# # Description Totals FY 07-08 Amount % Percent
Fund 15032
Increase (Decrease)
Reno-Sparks Convention and Visitors AuthorityFiscal 2008-2009 Annual Forecast and Capital Budget
Reno-Sparks Convention Center - Engineering
06 Promotion and Advertising0601 Hospitality - - - 0.0%0615 Other Advertising - - - 0.0%
Total Promotion and Advertising - - - 0.0%
02 Capital Outlay
0211 Major Equipment - - - 0.0%0220 Minor Equipment Purchases - - - 0.0%
Total Capital Outlay - - - 0.0%
Total Expenditures 1,737,084 1,803,596 (66,512) -3.7%
Revenues R360 Miscellaneous Revenue - - - 0.0%R750 Cost Reimbursables - - - 0.0%
Total Revenues - - - 0.0%
Net Departmental Expenses 1,737,084 1,803,596 (66,512) -3.7%
Page 99

Object Account Account Budget Outlook
# # Description Totals FY 07-08 Amount % Percent
03 Payroll and Related0301 Wages - Management 293,488 291,083 2,405 0.8%0305 Temporary Personnel Services - - - 0.0%0308 Wages-Casual 136,015 140,453 (4,438) -3.2%0311 Group Insurance 50,400 47,038 3,362 7.1%0312 Retirement Expense 59,140 55,132 4,008 7.3%0313 Industrial Insurance 26,199 20,898 5,301 25.4%0317 FICA/Medicare 10,445 15,323 (4,878) -31.8%0320 Clothing and Uniform Expenses 9,600 10,427 (827) -7.9%0321 Employee Training 1,800 4,061 (2,261) -55.7%0395 Safety Equipment 2,350 2,374 (24) -1.0%0399 Miscellaneous Employee Expense - - - 0.0%
Total Payroll and Related 589,437 586,789 2,648 0.5%
04 Supplies and Services0410 Office Supplies Expenses 3,500 5,463 (1,963) -35.9%0415 Miscellaneous Supplies 1,200 373 827 221.7%0421 Communications 23,400 23,845 (445) -1.9%0422 Printing and Binding 4,300 4,825 (525) -10.9%0425 Fuel 8,195 11,573 (3,378) -29.2%0430 All Building Related Repairs 24,800 15,863 8,937 56.3%0433 All Vehicle Related Repairs 3,150 2,623 527 20.1%0444 All Equipment Related Repairs 0 0%
Fund 15035
Increase (Decrease)
Reno-Sparks Convention and Visitors AuthorityFiscal 2008-2009 Annual Forecast and Capital Budget
Reno-Sparks Convention Center - Public Safety
0444 All Equipment Related Repairs - - - 0.0%0460 Contractual Services 9,100 8,246 854 10.4%0462 Equip. Lease & Maintenance Agmts. - - - 0.0%0470 Miscellaneous Expenses - 540 (540) -100.0%0473 Dues and Subscriptions 515 - 515 100.0%0474 Licenses - - - 0.0%
Total Supplies and Services 78,160 73,351 4,809 6.6%
05 Travel and Entertainment0501 Travel and Lodging - - - 0.0%0504 Registrations - - - 0.0%0505 Local Transportation - - - 0.0%0506 Entertainment - - - 0.0%0507 Meeting Expenses - - - 0.0%
Total Travel and Entertainment - - - 0.0%
Page 100

Object Account Account Budget Outlook
# # Description Totals FY 07-08 Amount % Percent
Fund 15035
Increase (Decrease)
Reno-Sparks Convention and Visitors AuthorityFiscal 2008-2009 Annual Forecast and Capital Budget
Reno-Sparks Convention Center - Public Safety
06 Promotion and Advertising0601 Hospitality - - - 0.0%0615 Other Advertising - - - 0.0%
Total Promotion and Advertising - - - 0.0%
02 Capital Outlay
0211 Major Equipment - - - 0.0%0220 Minor Equipment - - - 0.0%
Total Capital Outlay - - - 0.0%
Total Expenditures 667,597 660,140 7,457 1.1%
Page 101


RENO-SPARKS CONVENTION AND VISITORS AUTHORITY FISCAL 2008-2009 ANNUAL FORECAST AND CAPITAL BUDGET
NATIONAL BOWLING STADIUM
DESCRIPTION: The National Bowling Stadium (NBS) was designed to fulfill every tournament director’s fantasy of a bowling facility. Seventy-eight (78) bowling lanes are complimented by a state-of-the-art digital, eight foot tall scoring system, spacious tournament offices, squad rooms, 440 lockers, plus abundant retail space and an exclusive lounge for tournament VIP’s. The NBS plays host to the United States Bowling Congress (USBC) Open Championships, which brings approximately 80,000 bowlers over a 4-month period every third year, and the United States Bowling Congress Women’s Championships, which brings approximately 55,000 bowlers over a 4-month period every third year. STAFF: The National Bowling Stadium has five full-time employees – Operations Manager, Audio-Visual/Lane Maintenance Supervisor, Pinsetter Mechanic, Short-Term Sales Person, and a Scoring & Network Technician. SHARED STAFF: The National Bowling Stadium shares fifteen full-time employees with the Reno Events Center – General Manager, Administrative Assistant II, Building Engineer Supervisor, two Building Engineers, Facility Service Workers Supervisor, four Senior Facility Service Workers, two Facility Service Workers, and three Security Officers. FISCAL YEAR 2008-2009 OBJECTIVES:
• To control operating expenses within the projected FY 08-09 NBS budget. • To achieve our goal of attracting 600 teams to the Storm National Mixed
Championships Tournament. • To achieve the goal of attracting 11,000 teams to the USBC Women’s
Championships Tournament. Revenues: The primary sources for revenue for FY 08-09 occur in December from Storm National Mixed Championships Tournament and March – July from the USBC Women’s Championships Tournament. Operating Expenses: Site fees within the FY 08-09 budget include the USBC Open Championship ($400,000) and USBC Women’s Championships ($85,909).
Page 103

RENO-SPARKS CONVENTION AND VISITORS AUTHORITY FISCAL 2008-2009 ANNUAL FORECAST AND CAPITAL BUDGE
NATIONAL BOWLING STADIUM
FINANCIAL DEPARTMENTAL DETAIL: The following pages detail the departmental line items for the current year budget compared to prior year outlook.
Page 104

Account Budget OutlookDescription Totals FY 07-08 Amount % Percent
Payroll and RelatedAdministrative 1,796,051 1,388,972 407,079 29.3%
Total Payroll and Related 1,796,051 1,388,972 407,079 29.3%
Supplies and ServicesAdministrative 1,095,900 985,524 110,376 11.2%
Total Supplies and Services 1,095,900 985,524 110,376 11.2%
Travel and EntertainmentAdministrative 18,000 21,270 (3,270) -15.4%
Total Travel and Entertainment 18,000 21,270 (3,270) -15.4%
Capital OutlayAdministrative - - - 0.0%
Total Capital Outlay - - - 0.0%
Promotion and AdvertisingAdministrative 85,750 92,474 (6,724) -7.3%
Increase (Decrease)
Reno-Sparks Convention and Visitors AuthorityFiscal 2008-2009 Annual Forecast and Capital Budget
National Bowling Stadium - Summary
Total Promotion and Advertising 85,750 92,474 (6,724) -7.3%
Special ProjectsAdministrative 515,909 650,000 (134,091) -20.6%
Total Special Projects 515,909 650,000 (134,091) -20.6%
Total Expenditures and Uses 3,511,610 3,138,240 373,370 11.9%
Operating RevenuesAdministrative 1,929,550 1,069,351 860,199 80.4%
Total Operating Revenues 1,929,550 1,069,351 860,199 80.4%
Profit or (Loss) (1,582,060) (2,068,889) 486,829 -23.5%
Margin Percentage -82.0% -193.5% 111.5 -57.6%
Departmental Profit or (Loss)Margins
Administrative (1,582,060) (2,068,889) 486,829 -23.5%
Total Departmental Profit or (Loss) (1,582,060) (2,068,889) 486,829 -23.5%
Page 105
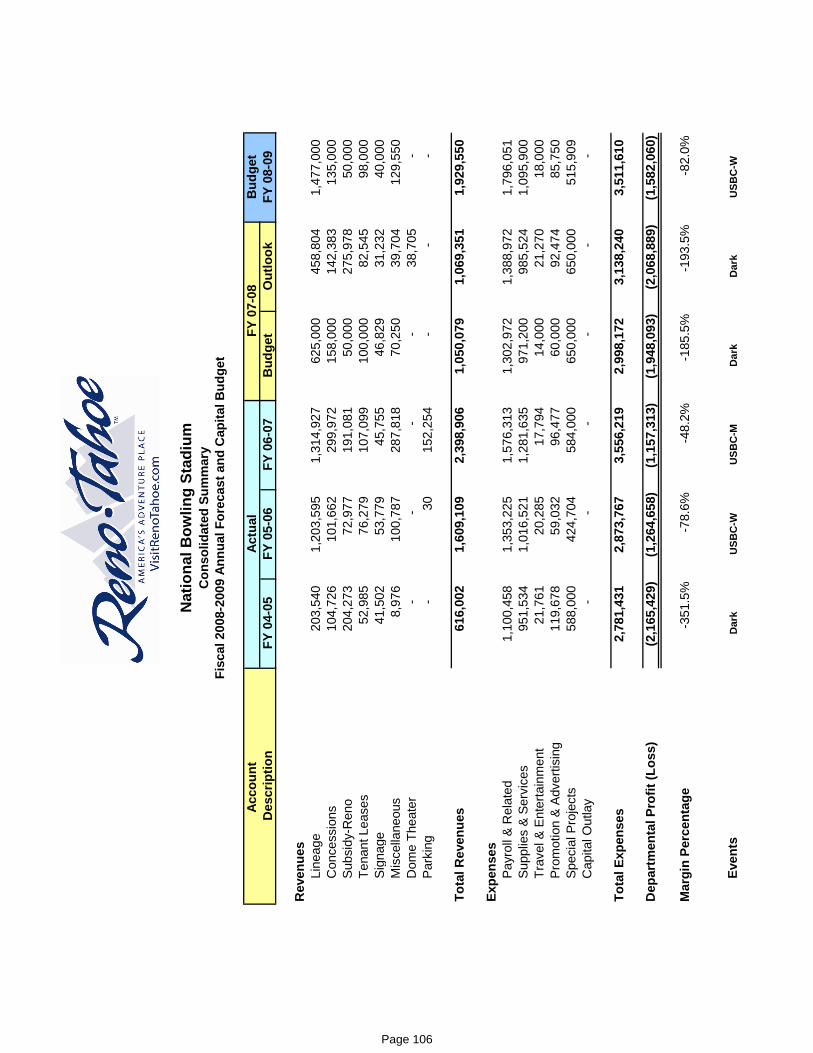
Bud
get
FY 0
4-05
FY 0
5-06
FY 0
6-07
Bud
get
Out
look
FY 0
8-09
R
even
ues
Line
age
203,
540
1,
203,
595
1,31
4,92
7
62
5,00
0
458,
804
1,
477,
000
Con
cess
ions
104,
726
10
1,66
2
299,
972
15
8,00
0
142,
383
13
5,00
0
Subs
idy-
Ren
o20
4,27
3
72,9
77
19
1,08
1
50,0
00
27
5,97
8
50,0
00
Te
nant
Lea
ses
52,9
85
76
,279
107,
099
10
0,00
0
82,5
45
98
,000
Sign
age
4150
253
779
4575
546
829
3123
240
000
Nat
iona
l Bow
ling
Stad
ium
Con
solid
ated
Sum
mar
yFi
scal
200
8-20
09 A
nnua
l For
ecas
t and
Cap
ital B
udge
t
Des
crip
tion
Acco
unt
Ac
tual
FY 0
7-08
Sign
age
41,5
02
53,7
79
45,7
55
46,8
29
31,2
32
40,0
00
Mis
cella
neou
s8,
976
10
0,78
7
287,
818
70
,250
39,7
04
12
9,55
0
Dom
e Th
eate
r-
-
-
-
38
,705
-
Pa
rkin
g-
30
15
2,25
4
-
-
-
Tota
l Rev
enue
s61
6,00
2
1,60
9,10
9
2,
398,
906
1,05
0,07
9
1,
069,
351
1,92
9,55
0
Expe
nses
Pa
yrol
l & R
elat
ed1,
100,
458
1,35
3,22
5
1,
576,
313
1,30
2,97
2
1,
388,
972
1,79
6,05
1
Su
pplie
s &
Serv
ices
951,
534
1,
016,
521
1,28
1,63
5
97
1,20
0
985,
524
1,
095,
900
Trav
el &
Ent
erta
inm
ent
21,7
61
20
,285
17,7
94
14
,000
21,2
70
18
,000
Prom
otio
n &
Adve
rtisi
ng11
9,67
8
59,0
32
96
,477
60,0
00
92
,474
85,7
50
Sp
ecia
l Pro
ject
s58
8,00
0
424,
704
58
4,00
0
650,
000
65
0,00
0
515,
909
C
apita
l Out
lay
-
-
-
-
-
-
Tota
l Exp
ense
s2,
781,
431
2,87
3,76
7
3,
556,
219
2,99
8,17
2
3,
138,
240
3,51
1,61
0
Dep
artm
enta
l Pro
fit (L
oss)
(2,1
65,4
29)
(1
,264
,658
)
(1,1
57,3
13)
(1
,948
,093
)
(2,0
68,8
89)
(1
,582
,060
)
Mar
gin
Perc
enta
ge-3
51.5
%-7
8.6%
-48.
2%-1
85.5
%-1
93.5
%-8
2.0%
Even
tsD
ark
USB
C-W
USB
C-M
Dar
kD
ark
USB
C-W
Page 106

Object Account Account Budget Outlook# # Description Totals FY 07-08 Amount % Percent
03 Payroll and Related0301 Wages - Management 950,098 858,577 91,521 10.7%0305 Temporary Personnel Services 31,000 10,376 20,624 198.8%0308 Wages-Casual 420,170 178,043 242,127 136.0%0310 Independent Contract Staffing - - - 0.0%0311 Group Insurance 112,500 101,765 10,735 10.5%0312 Retirement Expense 191,080 165,054 26,026 15.8%0313 Industrial Insurance 47,960 28,678 19,282 67.2%0317 FICA/Medicare 32,893 28,444 4,449 15.6%0320 Clothing & Uniform Expense 6,750 4,435 2,315 52.2%0321 Employee Training - - - 0.0%0380 Vehicle Allowances 3,600 3,600 - 0.0%0382 Bonus/Incentive Pay - 10,000 (10,000) -100.0%0399 Miscellaneous Employee Expense - - - 0.0%
Total Payroll and Related 1,796,051 1,388,972 407,079 29.3%
04 Supplies and Services0401 Utilities - Electric 499,000 - 499,000 100.0%0402 Utilities - Gas & Heat 107,000 437,832 (330,832) -75.6%0403 Utilities - Water 8,400 106,395 (97,995) -92.1%0404 Utilities - Sewer 6,000 5,767 233 4.0%0405 Trash Removal 20,000 5,615 14,385 256.2%0407 Fire Protection 10,000 15,555 (5,555) -35.7%0410 Office Supplies Expenses 12,000 11,040 960 8.7%0411 Maintenance Supplies 6,000 16,325 (10,325) -63.2%0412 J it i l S li 30 000 11 241 18 759 166 9%
Fund 15130
Increase (Decrease)
Reno-Sparks Convention and Visitors AuthorityFiscal 2008-2009 Annual Forecast and Capital Budget
National Bowling Stadium - Administration
0412 Janitorial Supplies 30,000 11,241 18,759 166.9%0415 Miscellaneous Supplies 12,000 20,962 (8,962) -42.8%0420 Postage & Freight 6,000 12,932 (6,932) -53.6%0421 Communications 14,400 10,586 3,814 36.0%0422 Printing and Binding 2,400 16,298 (13,898) -85.3%0425 Fuel - Auto 600 2,704 (2,104) -77.8%0430 All Building & Grounds Related Repairs 48,000 392 47,608 12144.9%0433 All Vehicle Related Repairs 600 38,175 (37,575) -98.4%0441 Lesae - Principal - 978 (978) -100.0%0442 Lease - Interest - 636 (636) -100.0%0444 All Equipment Related Repairs 24,000 18,404 5,596 30.4%0450 Professional Services - Legal - 23,508 (23,508) -100.0%0452 Professional Services - Other 22,000 - 22,000 100.0%0454 Elevator & Escalator Costs 32,400 13,571 18,829 138.7%0460 Contractual Services 2,400 35,418 (33,018) -93.2%0462 Equip. Lease & Maintenance Agmts. 14,400 2,862 11,538 403.1%0463 Insurance 54,000 15,770 38,230 242.4%0466 Bowling Ball Expense - 19,416 (19,416) -100.0%0467 Rental Bowling Shoe Expense - 2,942 (2,942) -100.0%0468 Repair & Maintenance Pinsetters 26,000 - 26,000 100.0%0469 Bowling Lane Maintenance 12,000 49,541 (37,541) -75.8%0470 Miscellaneous Expenses 6,000 14,983 (8,983) -60.0%0471 Finance Charges 600 7,838 (7,238) -92.3%0472 Equipment Rental 3,600 75 3,525 4700.0%0473 Dues and Subscriptions 6,600 390 6,210 1592.3%0474 Licenses 5,500 6,301 (801) -12.7%0475 Food Purchases - 5,421 (5,421) -100.0%0476 Soft Drink Purchases - - - 0.0%0477 Beer Purchases - - - 0.0%0478 Liquor & Wine Purchases - - - 0.0%0479 Paper Products - - - 0.0%0481 Credit Card Discounts - - - 0.0%0482 Audio - Visual Supplies 69,000 - 69,000 100.0%0483 Bowling Pin Expense 35,000 55,651 (20,651) -37.1%0486 Cost of Goods Sold - - - 0.0%
Total Supplies and Services 1,095,900 985,524 110,376 11.2%
Page 107

Object Account Account Budget Outlook# # Description Totals FY 07-08 Amount % Percent
Fund 15130
Increase (Decrease)
Reno-Sparks Convention and Visitors AuthorityFiscal 2008-2009 Annual Forecast and Capital Budget
National Bowling Stadium - Administration
05 Travel and Entertainment0501 Travel and Lodging 8,400 9,929 (1,529) -15.4%0504 Registrations 1,000 904 96 10.6%0505 Local Transportation - 697 (697) -100.0%0506 Entertainment 8,600 9,554 (954) -10.0%0507 Meeting Expenses - 186 (186) -100.0%
Total Travel and Entertainment 18,000 21,270 (3,270) -15.4%
02 Capital Outlay0204 Major Repairs - - - 0.0%0212 Major Equipment - - - 0.0%0220 Minor Equipment - - - 0.0%
Total Capital Outlay - - - 0.0%
06 Promotion and Advertising0601 Hospitality 35,500 - 35,500 100.0%0603 Booth Expense 500 37,378 (36,878) -98.7%0605 Brochures 1,000 450 550 122.2%0606 Promotional Materials - - - 0.0%0611 Advertising Productions - - - 0.0%0612 Consumer Advertising - - - 0.0%0615 Other Advertising - - - 0.0%0620 Familiarization Tours - - - 0.0%0630 Promotions 48,750 - 48,750 100.0%0645 Vid P d ti 54 646 (54 646) 100 0%0645 Video Production - 54,646 (54,646) -100.0%
Total Promotion and Advertising 85,750 92,474 (6,724) -7.3%
07 Special Projects0715 Prizes & Awards 30,000 - 30,000 100.0%0731 USBC - Women's Site Fees 85,909 250,000 (164,091) -65.6%0732 USBC - Men's Site Fees 400,000 400,000 - 0.0%
Total Special Projects 515,909 650,000 (134,091) -20.6%
Total Expenditures and Uses 3,511,610 3,138,240 373,370 11.9%
Operating RevenuesR105 Bowling Revenues 1,477,000 458,804 1,018,196 221.9%R106 Tenant Lease Revenues 98,000 82,545 15,455 18.7%R320 Concessions & Catering Net 135,000 142,383 (7,383) -5.2%R520 Parking Revenue Fees - - - 0.0%R370 Technical Services - 23,097 (23,097) -100.0%R310 Rental Income - - - 0.0%R331 Food Sales - - - 0.0%R332 Beverage Sales - - - 0.0%R333 Vending Machine Revenues 14,250 14,885 (635) -4.3%R360 Miscellaneous Rev 3,300 1,722 1,578 91.6%R490 Sign Leases 40,000 31,232 8,768 28.1%R375 Telcom Revenues 12,000 - 12,000 100.0%R371 Stagehands - - - 0.0%R385 Subsidy - Reno 50,000 275,978 (225,978) -81.9%R314 Room Rebates 100,000 38,705 61,295 158.4%
Operating Revenues 1,929,550 1,069,351 860,199 80.4%
Departmental Profit or (Loss) (1,582,060) (2,068,889) 486,829 -23.5%
Page 108

RENO-SPARKS CONVENTION AND VISITORS AUTHORITY FISCAL 2008-2009 ANNUAL FORECAST AND CAPITAL BUDGET
RENO EVENTS CENTER
DESCRIPTION: The Reno Events Center (REC) is part of a $65 million two-phased project to develop a special events and convention/meeting venue in downtown Reno. The Center is located one block north of the National Bowling Stadium. The 118,000 square foot facility encompasses a multipurpose space on the first floor that may be used for concerts/sporting events, large dinners and small conventions and trade shows. Meeting rooms and suites are on the second floor. STAFF: The Reno Events Center has five full-time employees – Operations Manager, Box Office Manager, Building Engineer, Event Coordinator II, and Stagehand Supervisor. SHARED STAFF: The Reno Events Center shares fifteen full-time employees with the National Bowling Stadium – General Manager, Administrative Assistant II, Building Engineer Supervisor, two Building Engineers, Facility Service Workers Supervisor, four Senior Facility Service Workers, two Facility Service Workers, and three Security Officers. FISCAL YEAR 2008-2009 OBJECTIVES:
• Control operating expenses within the projected FY 08-09 budget. • Host 100 event days from 23 trade/special events. • Host 23.5 event days (concert, boxing, etc.) at the Reno Events Center
during FY 08-09 as follow: Four concerts – September. Three concerts – October, March and April. Two concerts – November, February and May. One concert – July, August, December and June. One-half concert – January.
Revenues:
• The majority of revenue from Reno Events Center is based on “drop-in” business normally booked 90 -120 days out.
• Primary revenue generated from public shows includes facility rent, suite rental, food and beverage, and ticket rebates.
Operating Expenses:
• Expenses are reflective of a stabilized event calendar and minimal staffing (five full-time employees) and utilizing contract staffing services as necessary.
Page 109

RENO-SPARKS CONVENTION AND VISITORS AUTHORITY FISCAL 2008-2009 ANNUAL FORECAST AND CAPITAL BUDGET
RENO EVENTS CENTER CONTINUED
FINANCIAL DEPARTMENTAL DETAIL: The following pages detail the departmental line items for the current year budget compared to prior year outlook.
Page 110

Account Budget OutlookDescription Totals FY 07-08 Amount % Percent
Payroll and RelatedAdministrative 1,505,415 1,390,936 114,479 8.2%
Total Payroll and Related 1,505,415 1,390,936 114,479 8.2%
Supplies and ServicesAdministrative 783,655 819,637 (35,982) -4.4%
Total Supplies and Services 783,655 819,637 (35,982) -4.4%
Travel and EntertainmentAdministrative 13,400 13,622 (222) -1.6%
Total Travel and Entertainment 13,400 13,622 (222) -1.6%
Capital OutlayAdministrative - - - 0.0%
Total Capital Outlay - - - 0.0%
Promotion and AdvertisingAdministrative 21,450 15,753 5,697 36.2%
Increase (Decrease)
Reno-Sparks Convention and Visitors AuthorityFiscal 2008-2009 Annual Forecast and Capital Budget
Reno Events Center - Summary
Total Promotion and Advertising 21,450 15,753 5,697 36.2%
Special ProjectsAdministrative - - - 0.0%
Total Special Projects - - - 0.0%
Total Expenditures and Uses 2,323,920 2,239,948 83,972 3.7%
Operating RevenuesAdministrative 2,440,158 2,284,236 155,922 6.8%
Total Operating Revenues 2,440,158 2,284,236 155,922 6.8%
Profit or (Loss) 116,238 44,288 71,950 162.5%
Margin Percentage 4.8% 1.9% 2.8 145.7%
Departmental Profit or (Loss)Margins
Administrative 116,238 44,288 71,950 162.5%
Total Departmental Profit or (Loss) 116,238 44,288 71,950 162.5%
Page 111

B
udge
tFY
04-
05FY
05-
06FY
06-
07B
udge
tO
utlo
okFY
08-
09
Rev
enue
s
Fa
cilit
y R
enta
ls34
8,54
5
583,
120
49
5,26
2
600,
000
59
1,37
5
613,
500
C
once
ssio
ns11
0,91
5
292,
927
21
2,33
3
200,
000
18
0,45
2
251,
850
P
arki
ng18
,929
48,2
73
25
,697
40,0
00
44
,459
45,2
00
S
uite
s41
7,50
0
626,
000
66
8,70
8
652,
000
62
2,20
8
644,
708
B
ox O
ffice
62,7
67
23
3,98
2
182,
670
24
0,00
0
191,
812
19
6,25
0
Ren
o Ev
ents
Cen
ter
Con
solid
ated
Sum
mar
yFi
scal
200
8-20
09 A
nnua
l For
ecas
t and
Cap
ital B
udge
t
Des
crip
tion
Acc
ount
Act
ual
FY 0
7-08
Faci
lity
Use
Fee
s-
275,
686
22
2,61
0
240,
000
23
3,19
4
259,
000
M
erch
andi
se23
,064
68,9
32
48
,003
58,0
00
55
,711
58,7
50
S
ign
Leas
es-
16,5
75
38
,878
60,0
00
18
,401
10,0
00
Te
chni
cal S
ervi
ces
68,6
15
21
1,03
7
255,
732
22
0,00
0
315,
990
60
,000
Mis
cella
neou
s-
12,1
77
2,
752
-
30,6
34
30
0,90
0
To
tal R
even
ues
1,05
0,33
5
2,
368,
709
2,15
2,64
5
2,
310,
000
2,28
4,23
6
2,
440,
158
Expe
nses
Pay
roll
& R
elat
ed47
6,46
9
1,09
4,10
6
1,
155,
844
1,24
0,78
5
1,
390,
936
1,50
5,41
5
S
uppl
ies
& S
ervi
ces
448,
523
85
4,62
6
800,
439
83
1,72
7
819,
637
78
3,65
5
Trav
el &
Ent
erta
inm
ent
3,69
3
17,1
18
17
,564
17,9
30
13
,622
13,4
00
P
rom
otio
n &
Adv
ertis
ing
202,
225
11
3,42
3
25,6
22
21
,060
15,7
53
21
,450
Spe
cial
Pro
ject
s-
-
-
-
-
-
C
apita
l Out
lay
3,50
3
-
-
-
-
-
Tota
l Exp
ense
s1,
134,
413
2,07
9,27
3
1,
999,
469
2,11
1,50
2
2,
239,
948
2,32
3,92
0
Dep
artm
enta
l Pro
fit (L
oss)
(84,
078)
28
9,43
6
153,
176
19
8,49
8
44,2
88
116,
238
Mar
gin
Perc
enta
ge-8
.0%
12.2
%7.
1%8.
6%1.
9%4.
8%
Page 112

Object Account Account Budget Outlook# # Description Totals FY 07-08 Amount % Percent
03 Payroll and Related0301 Wages - Management 783,214 724,124 59,090 8.2%0305 Temporary Personnel Services 94,250 68,746 25,504 37.1%0308 Wages-Casual 314,663 294,895 19,768 6.7%0310 Independent Contract Staffing - - - 0.0%0311 Group Insurance 97,500 88,877 8,623 9.7%0312 Retirement Expense 150,965 141,910 9,055 6.4%0313 Industrial Insurance 27,449 24,906 2,543 10.2%0317 FICA/Medicare 25,674 34,645 (8,971) -25.9%0320 Clothing & Uniform Expense 8,100 9,233 (1,133) -12.3%0321 Employee Training - - - 0.0%0380 Vehicle Allowances 3,600 3,600 - 0.0%0399 Miscellaneous Employee Expense - - - 0.0%
Total Payroll and Related 1,505,415 1,390,936 114,479 8.2%
04 Supplies and Services0401 Utilities - Electric 264,429 239,797 24,632 10.3%0402 Utilities - Gas & Heat 28,287 29,445 (1,158) -3.9%0403 Utilities - Water 3,267 3,712 (445) -12.0%0404 Utilities - Sewer 3,498 3,727 (229) -6.1%0405 Trash Removal 14,247 15,712 (1,465) -9.3%0407 Fire Protection 6,364 6,578 (214) -3.3%0410 Office Supplies Expenses 8,188 8,506 (318) -3.7%0411 Maintenance Supplies 13,623 17,794 (4,171) -23.4%0412 Janitorial Supplies 21,343 18,602 2,741 14.7%0415 Mi ll S li 16 981 18 260 (1 279) 7 0%
Increase (Decrease)
Reno-Sparks Convention and Visitors AuthorityFiscal 2008-2009 Annual Forecast and Capital Budget
Reno Events CenterFund 15135
0415 Miscellaneous Supplies 16,981 18,260 (1,279) -7.0%0420 Postage & Freight 653 704 (51) -7.2%0421 Communications 13,350 13,081 269 2.1%0422 Printing and Binding 2,477 1,131 1,346 119.0%0425 Fuel - Auto 2,498 2,200 298 13.5%0430 All Building & Grounds Related Repairs 30,000 31,410 (1,410) -4.5%0433 All Vehicle Related Repairs 1,057 674 383 56.8%0441 Lesae - Principal - 766 (766) -100.0%0442 Lease - Interest - 18,092 (18,092) -100.0%0444 All Equipment Related Repairs 25,685 26,944 (1,259) -4.7%0450 Professional Services - Legal - - - 0.0%0452 Professional Services - Other 29,396 29,692 (296) -1.0%0454 Elevator & Escalator Costs 11,400 19,604 (8,204) -41.8%0460 Contractual Services 165,058 198,873 (33,815) -17.0%0462 Equip. Lease & Maintenance Agmts. 5,495 7,045 (1,550) -22.0%0463 Insurance 40,800 39,276 1,524 3.9%0470 Miscellaneous Expenses 27,342 25,168 2,174 8.6%0471 Finance Charges - - - 0.0%0472 Equipment Rental - 750 (750) -100.0%0473 Dues and Subscriptions 2,110 1,601 509 31.8%0474 Licenses 2,500 3,400 (900) -26.5%0481 Credit Card Discounts 28,227 22,488 5,739 25.5%0482 Audio - Visual Supplies 15,380 14,605 775 5.3%0486 Cost of Goods Sold - - - 0.0%
Total Supplies and Services 783,655 819,637 (35,982) -4.4%
05 Travel and Entertainment0501 Travel and Lodging 7,700 8,397 (697) -8.3%0504 Registrations 3,500 3,524 (24) -0.7%0505 Local Transportation - 16 (16) -100.0%0506 Entertainment 2,200 1,656 544 32.9%0507 Meeting Expenses - 29 (29) -100.0%
Total Travel and Entertainment 13,400 13,622 (222) -1.6%
02 Capital Outlay0220 Minor Equipment 0 0%0220 Minor Equipment - - - 0.0%
Total Capital Outlay - - - 0.0%
Page 113

Object Account Account Budget Outlook# # Description Totals FY 07-08 Amount % Percent
Increase (Decrease)
Reno-Sparks Convention and Visitors AuthorityFiscal 2008-2009 Annual Forecast and Capital Budget
Reno Events CenterFund 15135
06 Promotion and Advertising0601 Hospitality 10,450 10,755 (305) -2.8%0603 Booth Expense - - - 0.0%0605 Brochures - - - 0.0%0606 Promotional Materials - - - 0.0%0611 Advertising Productions - - - 0.0%0612 Consumer Advertising - - - 0.0%0615 Other Advertising 2,000 1,998 2 0.1%0620 Familiarization Tours - - - 0.0%0630 Promotions 9,000 3,000 6,000 200.0%0645 Video Production - - - 0.0%
Total Promotion and Advertising 21,450 15,753 5,697 36.2%
07 Special Projects0715 Prizes & Awards - - - 0.0%
Total Special Projects - - - 0.0%
Total Expenditures and Uses 2,323,920 2,239,948 83,972 3.7%
Operating RevenuesR106 Tenant Lease Revenues 613,500 591,375 22,125 3.7%R310 Events Center Facility Rent - - - 0.0%R314 Room Rebates 251,850 180,452 71,398 39.6%R320 Concessions & Catering Net - - - 0.0%R331 F d S l 0 0%R331 Food Sales - - - 0.0%R332 Beverage Sales - - - 0.0%R333 Vending Machine Revenues 4,800 7,006 (2,206) -31.5%R360 Miscellaneous Rev 60,000 315,990 (255,990) -81.0%R370 Technical Services 282,000 16,163 265,837 1644.7%R371 Stagehand Revenues 14,100 7,465 6,635 88.9%R375 Telecom Revenues 644,708 622,208 22,500 3.6%R475 Suite Revenue 196,250 191,812 4,438 2.3%R485 Box Office Rebates 259,000 233,194 25,806 11.1%R486 Facility Use Fees 10,000 18,401 (8,401) -45.7%R490 Sign Leases 45,200 44,459 741 1.7%R520 Parking Revenue Fees - - - 0.0%R750 Cost Reimbureables 58,750 55,711 3,039 5.5%R800 Merchandise Sales - - - 0.0%
Operating Revenues 2,440,158 2,284,236 155,922 6.8%
Departmental Profit or (Loss) 116,238 44,288 71,950 162.5%
Page 114

RENO-SPARKS CONVENTION AND VISITORS AUTHORITY FISCAL 2008-2009 ANNUAL FORECAST AND CAPITAL BUDGET
RENO-SPARKS LIVESTOCK EVENTS CENTER
DESCRIPTION: The Reno-Sparks Livestock Events Center (RSLEC) hosts livestock as well as many other types of events. Indoor facilities consist of a main arena (45,000 square feet/climate-controlled/6,100 seats), livestock pavilion (20,000 square feet/1,000 seats), and an exhibits hall (20,000 square feet/climate-controlled). Outdoor facilities consist of a rodeo arena (45,000 square feet/9,100 seats), cutting arena (20,000 square feet/partially covered), 657 stalls and paved, lighted parking for over 3,000 vehicles. The Reno-Sparks Livestock Events Center is home of the Reno Rodeo, Nevada State Fair, National Reined Cow Horse Association’s Snaffle Bit Futurity, and Region III Arabians, in addition to other arena events scheduled throughout the year. STAFF: The Reno-Sparks Livestock Events Center has twenty full-time employees – General Manager, Administrative Assistant, Operations Supervisor, Assistant Operations Supervisor, Events/Booking Coordinator, Mechanic/Maintenance Manager, two Security Officers, three Building Engineers, nine Facility Service Workers, and augmented by temporary, casual and community service workers to handle peak workloads. FISCAL YEAR 2008-2009 OBJECTIVES:
• Identify and implement new revenue streams to maximize potential. • Continually review operational policies and procedures to maximize operating
efficiencies while providing excellent service. • Identify and study the financial impact of potential new events to increase revenues. • Continue improving service levels to ensure that existing customers return to the
facility. • Completion of funding task force project.
Revenues:
• The increase reflects existing business, newly contracted business, and anticipated drop in business, as well as a scheduled facility rate increase. The budget reflects a focus on new short term revenue producing events and an increase in parking rates.
Operating Expenses:
• Payroll: No positions to be added in this budget period. An organization wide pay increase has been anticipated for FY 08-09.
• Supplies & Services: An increase is budgeted, primarily in the area of utilities. • Travel & Entertainment: An increase is anticipated over last fiscal year, due to
trips scheduled for last fiscal year rescheduled for FY 08-09. • Capital: A separate list is detailed within the capital section.
Page 115

RENO-SPARKS CONVENTION AND VISITORS AUTHORITY FISCAL 2008-2009 ANNUAL FORECAST AND CAPITAL BUDGET
RENO- SPARKS LIVESTOCK EVENTS CENTER CONTINUED
FINANCIAL DEPARTMENTAL DETAIL: The following pages detail the departmental line items for the current year budget compared to prior year outlook.
Page 116

B
udge
tFY
04-
05FY
05-
06FY
06-
07B
udge
tO
utlo
okFY
08-
09
R
even
ues
Faci
lity
Ren
tals
839,
079
77
2,01
4
686,
559
81
5,31
1
742,
066
80
1,77
0
Con
cess
ions
193,
101
21
5,46
2
305,
655
31
2,35
2
273,
687
28
7,49
1
Mis
cella
neou
s 33
9,95
9
282,
556
34
2,77
7
397,
824
39
1,22
2
400,
982
St
all&
Pen
Ren
tals
4,23
65,
280
4,94
65,
133
3,52
94,
032
Des
crip
tion
Acco
unt
Actu
alFY
07-
08
Ren
o-Sp
arks
Liv
esto
ck E
vent
s C
ente
rC
onso
lidat
ed S
umm
ary
Fisc
al 2
008-
2009
Ann
ual F
orec
ast a
nd C
apita
l Bud
get
Stal
l & P
en R
enta
ls4,
236
5,28
0
4,
946
5,13
3
3,
529
4,03
2
R
.V. P
arki
ng62
,913
53,7
30
56
,280
71,1
85
61
,148
68,2
30
Ev
ent P
arki
ng13
3,52
4
181,
406
18
3,90
5
243,
664
18
0,32
1
192,
362
Tota
l Rev
enue
s1,
572,
812
1,51
0,44
8
1,
580,
122
1,84
5,46
9
1,
651,
973
1,75
4,86
7
Expe
nses
Payr
oll &
Rel
ated
1,12
6,79
8
1,
161,
345
1,11
2,54
7
1,
247,
714
1,20
3,61
9
1,
278,
562
Supp
lies
& Se
rvic
es90
5,36
4
947,
167
86
8,78
8
901,
045
87
2,31
7
904,
535
Tr
avel
& E
nter
tain
men
t9,
532
14
,125
4,61
0
14,8
91
10
,844
12,6
91
Pr
omot
ion
& Ad
verti
sing
10,0
50
8,
149
5,
543
6,
300
6,
303
6,
300
Sp
ecia
l Pro
ject
s18
,045
42,0
00
41
,000
41,0
00
31
,000
31,0
00
C
apita
l Out
lay
-
-
-
-
Tota
l Exp
ense
s2,
069,
789
2,17
2,78
6
2,
032,
488
2,21
0,95
0
2,
124,
083
2,23
3,08
8
Dep
artm
enta
l Pro
fit (L
oss)
(496
,977
)
(6
62,3
38)
(452
,366
)
(3
65,4
81)
(472
,110
)
(4
78,2
21)
Mar
gin
Perc
enta
ge-3
1.6%
-43.
9%-2
8.6%
-19.
8%-2
8.6%
-27.
3%
Page 117

Object Account Account Budget Outlook
# # Description Totals FY 07-08 Amount % Percent
03 Payroll and Related0301 Wages - Management 850,795 801,227 49,568 6.2%0305 Temporary Personnel Services - 832 (832) -100.0%0308 Wages-Casual 38,807 37,998 809 2.1%0311 Group Insurance 150,000 138,799 11,201 8.1%0312 Retirement Expense 165,229 153,748 11,481 7.5%0313 Industrial Insurance 48,929 42,794 6,135 14.3%0317 FICA/Medicare 14,102 14,854 (752) -5.1%0320 Clothing & Uniform Expense 3,500 1,167 2,333 199.9%0321 Employee Training - - - 0.0%0380 Vehicle Allowances 7,200 7,200 - 0.0%0382 Bonus/Incentive Pay - 5,000 (5,000) -100.0%0399 Miscellaneous Employee Expense - - - 0.0%
Total Payroll and Related 1,278,562 1,203,619 74,943 6.2%
04 Supplies and Services0401 Utilities - Electric 257,044 239,159 17,885 7.5%0402 Utilities - Gas 89,395 83,366 6,029 7.2%0403 Utilities - Water 16,159 15,502 657 4.2%0404 Utilities - Sewer 14,363 14,220 143 1.0%0405 Trash Removal 158,925 154,065 4,860 3.2%0407 Fire Protection 438 110 328 298.2%0410 Office Supplies Expenses 3 888 3 719 169 4 5%
Increase (Decrease)
Reno-Sparks Convention and Visitors AuthorityFiscal 2008-2009 Annual Forecast and Capital Budget
Reno-Sparks Livestock Events Center
0410 Office Supplies Expenses 3,888 3,719 169 4.5%0411 Maintenance Supplies - 602 (602) -100.0%0412 Janitorial Supplies 38,251 40,736 (2,485) -6.1%0415 Miscellaneous Supplies 20,940 21,402 (462) -2.2%0420 Postage & Freight 955 835 120 14.4%0421 Communications 9,350 9,656 (306) -3.2%0422 Printing and Binding 511 599 (88) -14.7%0425 Fuel - Auto 28,656 24,699 3,957 16.0%0430 All Building & Grounds Related Repairs 52,800 54,019 (1,219) -2.3%0433 All Vehicle Related Repairs 3,096 4,155 (1,059) -25.5%0444 All Equipment Related Repairs 19,648 17,477 2,171 12.4%0450 Professional Services - Legal - - - 0.0%0460 Contractual Services 141,724 138,999 2,725 2.0%0462 Equip. Lease & Maintenance Agmts. 3,300 3,300 - 0.0%0463 Insurance 40,800 40,960 (160) -0.4%0470 Miscellaneous Expenses 1,117 892 225 25.2%0471 Finance Charges - - - 0.0%0472 Equipment Rental 375 375 - 0.0%0473 Dues and Subscriptions 300 300 - 0.0%0474 Licenses 2,500 3,170 (670) -21.1%
Total Supplies and Services 904,535 872,317 32,218 3.7%
Page 118

Object Account Account Budget Outlook
# # Description Totals FY 07-08 Amount % PercentIncrease (Decrease)
Reno-Sparks Convention and Visitors AuthorityFiscal 2008-2009 Annual Forecast and Capital Budget
Reno-Sparks Livestock Events Center
05 Travel and Entertainment
0501 Travel and Lodging 8,966 7,690 1,276 16.6%0504 Registrations 1,325 1,760 (435) -24.7%0505 Local Transportation - - - 0.0%0506 Entertainment 2,400 1,394 1,006 72.2%0507 Meeting Expenses - - - 0.0%
Total Travel and Entertainment 12,691 10,844 1,847 17.0%
06 Promotion and Advertising0601 Hospitality 6,300 6,303 (3) 0.0%0606 Promotional Materials - - - 0.0%0615 Other Advertising - - - 0.0%
Total Promotion and Advertising 6,300 6,303 (3) 0.0%
02 Capital Outlay0211 Major Equipment - - - 0.0%0220 Minor Equipment - - - 0.0%0290 Miscellaneous Capital - - - 0.0%
Total Capital Outlay - - - 0.0%
07 Special Projects07 Special Projects0706 RLEC Event Grants 31,000 31,000 - 0.0%
Total Special Projects 31,000 31,000 - 0.0%
Total Expenditures and Uses 2,233,088 2,124,083 109,005 5.1%
RevenuesR310 Rental Income 881,723 822,968 58,755 7.1%R311 Rental Discounts (79,953) (80,902) 949 -1.2%R320 Concessionaires/Catering 287,491 273,687 13,804 5.0%R330 Set-Up Charges 179,782 172,379 7,403 4.3%R360 Miscellaneous Revenues - 12,157 (12,157) -100.0%R375 Telecom 13,451 - 13,451 100.0%R460 Transient Stall/Pen Rental 4,032 3,529 503 14.3%R480 Other Rental Revenue 30,570 28,370 2,200 7.8%R490 Sign Leases 32,412 30,918 1,494 4.8%R500 Recreational Vehicle Parking 68,230 61,148 7,082 11.6%R520 Event Parking Fees 192,362 180,321 12,041 6.7%R750 Cost Reimbursables 124,111 123,463 648 0.5%R800 Merchandise Sales 20,656 23,935 (3,279) -13.7%
Total Revenues 1,754,867 1,651,973 102,894 6.2%
Departmental Profit or (Loss) (478,221) (472,110) (6,111) 1.3%
Page 119


RENO-SPARKS CONVENTION AND VISITORS AUTHORITY FISCAL 2008-2009 ANNUAL FORECAST AND CAPITAL BUDGET
WILDCREEK GOLF COURSE
DESCRIPTION: Wildcreek Golf Course located in Sparks, Nevada, is a year round facility featuring a 7,105-yard par-72 championship course with driving range, restaurant, and bar. Wildcreek also features a 9-hole executive course that is popular with beginners and locals interested in playing a par-3 executive course. STAFF: Wildcreek Golf Course has ten full-time employees – Golf Professional, Administrative Assistant, Golf Course Superintendent, Food Service Supervisor, Building Engineer, three Greenskeepers, Irrigation/Maintenance Technician, Mechanic and shares two Groundskeepers with Northgate. This golf course also employees 26 part-time/seasonal personnel. FISCAL YEAR 2008-2009 OBJECTIVES:
• Maintain season pass sales at $179,000. • Increase rounds on championship course from 34,151 to 37,184. • Increase rounds on executive course from 25,438 to 28,464. • Maximize revenues from other sources - pro shop, food and
beverage, and range. • Install VFD (variable frequency drive) pump control to increase course
condition through adequate water distribution. • Purchase handheld GPS units to be more competitive in the market
place. • Repave deteriorated cart paths to improve overall appearance and
safety. FINANCIAL DEPARTMENTAL DETAIL: The financial reporting of Wildcreek Golf Course is made up of the following three areas: golf operations, food and beverage, and driving range/carts. A consolidated summary is included for your reference. The following pages detail the departmental line items for the current year budget compared to prior year outlook.
Page 121

Account Budget OutlookDescription Totals FY 07-08 Amount % Percent
Payroll and RelatedGolf Operations 882,058 871,955 10,103 1.2%Food & Beverage 193,983 174,047 19,936 11.5%Driving Range - Carts 88,527 81,551 6,976 8.6%
Total Payroll and Related 1,164,568 1,127,553 37,015 3.3%
Supplies and ServicesGolf Operations 848,250 845,594 2,656 0.3%Food & Beverage 112,431 106,578 5,853 5.5%Driving Range - Carts 15,700 10,844 4,856 44.8%
Total Supplies and Services 976,381 963,016 13,365 1.4%
Travel and EntertainmentGolf Operations 6,000 4,848 1,152 23.8%Food & Beverage 100 56 44 78.6%Driving Range - Carts - - - 0.0%
Total Travel and Entertainment 6,100 4,904 1,196 24.4%
Promotion and AdvertisingGolf Operations 7,100 9,352 (2,252) -24.1%Food & Beverage 0 0%
Increase (Decrease)
Reno-Sparks Convention and Visitors AuthorityFiscal 2008-2009 Annual Forecast and Capital Budget
Wildcreek Golf Course - Summary
Food & Beverage - - - 0.0%Driving Range - Carts - - - 0.0%
Total Promotion and Advertising 7,100 9,352 (2,252) -24.1%
Depreciation Golf Operations 156,000 145,000 11,000 7.6%Food & Beverage - - - 0.0%Driving Range - Carts 44,340 44,340 - 0.0%
Total Depreciation 200,340 189,340 11,000 5.8%
Capital OutlayGolf Operations - - - 0.0%Food & Beverage - - - 0.0%Driving Range - Carts - - - 0.0%
Total Capital Outlay - - - 0.0%
Total Expenditures Golf Operations 1,899,408 1,876,749 22,659 1.2%Food & Beverage 306,514 280,681 25,833 9.2%Driving Range - Carts 148,567 136,735 11,832 8.7%
Total Expenditures 2,354,489 2,294,165 60,324 2.6%
Page 122

Account Budget OutlookDescription Totals FY 07-08 Amount % Percent
Increase (Decrease)
Reno-Sparks Convention and Visitors AuthorityFiscal 2008-2009 Annual Forecast and Capital Budget
Wildcreek Golf Course - Summary
Operating RevenuesGolf Operations 1,438,267 1,370,981 67,286 4.9%Food & Beverage 344,162 304,682 39,480 13.0%Driving Range - Carts 419,900 397,847 22,053 5.5%
Total Operating Revenues 2,202,329 2,073,510 128,819 6.2%
Profit or (Loss) (152,160) (220,655) 68,495 -31.0%
Margin Percentage -6.9% -10.6% 3.7 -35.1%
Departmental Profit or (Loss)Margins
Golf Operations (461,141) (505,768) 44,627 -8.8%Food & Beverage 37,648 24,001 13,647 56.9%Driving Range - Carts 271,333 261,112 10,221 3.9%
Total Departmental Profit or (Loss) (152,160) (220,655) 68,495 -31.0%
Statistics
Rounds 65,648 59,589 6,059 10.2%
Average Green Fee $18.71 $19.35 ($0.64) -3.3%
Profit (Loss) Per Round) ($2.32) ($3.70) $1.39 -37.4%
Page 123

B
udge
tFY
04-
05FY
05-
06FY
06-
07B
udge
tO
utlo
okFY
08-
09
R
even
ues
Gre
en F
ees
9 H
ole
263,
576
27
3,93
1
309,
771
31
1,59
5
285,
072
31
3,15
9
Gre
en F
ees
18 H
ole
618,
239
68
0,91
2
719,
494
73
3,85
1
688,
051
73
6,35
8
Mem
bers
hips
143,
185
14
6,35
5
147,
453
15
5,95
0
179,
682
17
8,50
0
Pro
Shop
154,
244
18
1,51
1
191,
856
17
6,50
0
190,
349
31
,950
Mis
cella
neou
s &
Less
ons
28,3
16
29
,121
32,3
44
33
,000
27,8
27
17
8,30
0
Food
& B
ever
age
276,
501
34
0,51
2
356,
819
32
8,07
9
304,
682
34
4,16
2
Car
t Ren
tal
282,
561
34
9,29
0
346,
611
33
1,22
7
316,
965
33
1,50
0
Driv
ing
Ran
ge75
,318
86,5
04
85
,778
94,6
75
80
,882
88,4
00
Tota
l Rev
enue
s1,
841,
940
2,08
8,13
6
2,
190,
126
2,16
4,87
7
2,
073,
510
2,20
2,32
9
Expe
nses
Wild
cree
k G
olf C
ours
eC
onso
lidat
ed S
umm
ary
Fisc
al 2
008-
2009
Ann
ual F
orec
ast a
nd C
apita
l Bud
get
Des
crip
tion
Acco
unt
Actu
alFY
07-
08
Payr
oll &
Rel
ated
1,01
3,67
6
1,
025,
085
1,04
9,65
1
1,
133,
676
1,12
7,55
3
1,
164,
568
Supp
lies
& Se
rvic
es92
4,59
2
945,
281
98
0,49
7
931,
709
96
3,01
6
976,
381
Tr
avel
& E
nter
tain
men
t7,
845
3,
200
3,
293
5,
457
4,
904
6,
100
Pr
omot
ion
& Ad
verti
sing
4,80
6
9,49
8
10,8
12
7,
200
9,
352
7,
100
C
apita
l Out
lay
6,77
3
3,41
0
-
-
Dep
reci
atio
n17
4,30
7
165,
642
17
1,84
9
178,
200
18
9,34
0
200,
340
Tota
l Exp
ense
s2,
131,
999
2,15
2,11
6
2,
216,
102
2,25
6,24
2
2,
294,
165
2,35
4,48
9
Dep
artm
enta
l Pro
fit (L
oss)
(290
,059
)
(6
3,98
0)
(25,
976)
(9
1,36
5)
(220
,655
)
(1
52,1
60)
Mar
gin
Perc
enta
ge-1
5.7%
-3.1
%-1
.2%
-4.2
%-1
0.6%
-6.9
%
Stat
istic
s9
Hol
e Ex
ecut
ive
21,3
2424
,524
26,6
9728
,829
25,4
3828
,464
18 H
ole
Cha
mpi
onsh
ip27
,928
31,2
1935
,799
34,0
7334
,151
37,1
84
Tota
l Rou
nds
49,2
5255
,743
62,4
9662
,902
59,5
8965
,648
Tota
l Rev
enue
Per
Rou
nd$3
7.40
$37.
46$3
5.04
$34.
42$3
4.80
$33.
55
Prof
it (L
oss)
Per
Rou
nd($
5.89
)($
1.15
)($
0.42
)($
1.45
)($
3.70
)($
2.32
)
Cas
h Fl
ow(1
15,7
52)
10
1,66
2
145,
873
86
,835
(31,
315)
48,1
80
Le
ss: C
apita
l86
,414
269,
487
20
0,00
0
200,
000
20
0,00
0
200,
000
N
et(2
02,1
66)
(167
,825
)
(5
4,12
7)
(113
,165
)
(231
,315
)
(1
51,8
20)
Page 124

Object Account Account Budget Outlook# # Description Totals FY 07-08 Amount % Percent
03 Payroll and Related0301 Wages - Management 567,478 552,321 15,157 2.7%0305 Temporary Personnel Services - - - 0.0%0308 Wages-Casual 90,245 90,403 (158) -0.2%0311 Group Insurance 74,100 83,263 (9,163) -11.0%0312 Retirement Expense 113,052 109,403 3,649 3.3%0313 Industrial Insurance 23,020 20,051 2,969 14.8%0317 FICA/Medicare 12,333 15,436 (3,103) -20.1%0320 Clothing & Uniform Expense 750 1,078 (328) -30.4%0321 Employee Training - - - 0.0%0327 Insurance Contribution - - - 0.0%0380 Vehicle Allowance - - - 0.0%0395 Safety Equipment 1,080 - 1,080 100.0%0399 Miscellaneous Employee Expense - - - 0.0%
Total Payroll and Related 882,058 871,955 10,103 1.2%
04 Supplies and Services0401 Utilities - Electric 88,000 84,329 3,671 4.4%0402 Utilities - Gas & Heat 22,700 21,294 1,406 6.6%0403 Utilities - Water 5,500 4,710 790 16.8%0404 Utilities - Sewer 6,200 4,905 1,295 26.4%0405 Trash Removal 9,600 7,968 1,632 20.5%0406 Utilities - Irrigation 308,000 308,775 (775) -0.3%
Increase (Decrease)
Reno-Sparks Convention and Visitors AuthorityFiscal 2008-2009 Annual Forecast and Capital Budget
Wildcreek Golf Course - Golf OperationsFund 16090
g , , ( )0407 Fire Protection 500 225 275 122.2%0410 Office Supplies Expense 3,750 3,619 131 3.6%0411 Maintenance Supplies 1,200 1,336 (136) -10.2%0412 Janitorial Supplies 6,600 5,596 1,004 17.9%0415 Miscellaneous Supplies 62,000 67,888 (5,888) -8.7%0420 Postage & Freight 360 290 70 24.1%0421 Communications 6,750 11,391 (4,641) -40.7%0422 Printing & Binding 2,500 2,652 (152) -5.7%0425 Fuel - Auto 26,000 19,804 6,196 31.3%0430 All Building & Grounds Related Repairs 24,000 21,793 2,207 10.1%0444 All Equipment Related Repairs 22,000 26,073 (4,073) -15.6%0450 Prof Services - Legal - - - 0.0%0452 Prof Services - Others - - - 0.0%0456 Pro Contract Payments - - - 0.0%0460 Contractual Services 53,700 52,099 1,601 3.1%0462 Equip. Lease & Maintenance Agmts. 3,732 3,588 144 4.0%0463 Insurance 39,600 38,052 1,548 4.1%0470 Miscellaneous Expenses 2,400 1,436 964 67.1%0471 Finance Charges - - - 0.0%0472 Equipment Rental - - - 0.0%0473 Dues 2,550 3,087 (537) -17.4%0474 Licenses 100 (18) 118 -655.6%0481 Credit Card Discounts 29,535 25,293 4,242 16.8%0484 Inventory Freight 2,522 2,603 (81) -3.1%0485 Inventory Discount (1,904) (2,079) 175 -8.4%0486 Cost of Goods Sold 120,355 128,885 (8,530) -6.6%
Total Supplies and Services 848,250 845,594 2,656 0.3%
05 Travel and Entertainment0501 Travel and Lodging 3,500 3,531 (31) -0.9%0504 Registrations 900 200 700 350.0%0505 Local Transportation 1,600 1,117 483 43.2%0506 Entertainment - - - 0.0%
Total Travel and Entertainment 6,000 4,848 1,152 23.8%
Page 125

Object Account Account Budget Outlook# # Description Totals FY 07-08 Amount % Percent
Increase (Decrease)
Reno-Sparks Convention and Visitors AuthorityFiscal 2008-2009 Annual Forecast and Capital Budget
Wildcreek Golf Course - Golf OperationsFund 16090
06 Promotion and Advertising0605 Brochures - - - 0.0%0606 Promotional Materials 7,100 9,352 (2,252) -24.1%0615 Other Advertising - - - 0.0%0627 Other Production Costs - - - 0.0%
Total Promotion and Advertising 7,100 9,352 (2,252) -24.1%
09 Depreciation 0900 Depreciation Expense 156,000 145,000 11,000 7.6%
Total Depreciation Expense 156,000 145,000 11,000 7.6%
02 Capital Outlay0220 Minor Equipment - - - 0.0%
Total Capital Outlay - - - 0.0%
Total Expenditures and Uses 1,899,408 1,876,749 22,659 1.2%
RevenuesR110 Green Fees - 9 Hole 313,159 285,072 28,087 9.9%R120 Green Fees - 18 Hole 736,358 688,051 48,307 7.0%, , ,R140 Annual Memberships 178,500 179,682 (1,182) -0.7%R260 Golf Pro Lessons Commissions - - - 0.0%R360 Miscellaneous Revenue - 178 (178) -100.0%R820 Rental Clubs 31,950 27,649 4,301 15.6%R800 Gross Retail Pro Shop Sales 178,300 190,349 (12,049) -6.3%
Total Revenues 1,438,267 1,370,981 67,286 4.9%
Departmental Profit or (Loss) (461,141) (505,768) 44,627 -8.8%
Statistics - Rounds Executive 28,464 25,438 3,026 11.9% Championship 37,184 34,151 3,033 8.9%
Total Rounds 65,648 59,589 6,059 10.2%
Average Green FeesExecutive $11.00 $11.21 ($0.20) -1.8%Championship $19.80 $20.15 ($0.34) -1.7%
Total Combined Average Fees $18.71 $19.35 ($0.64) -3.3%
Capital Budget (Inc. in Depreciation) Totals 200,000 200,000 - 0.0%
Page 126

Object Account Account Budget Outlook
# # Description Totals FY 07-08 Amount % Percent
03 Payroll and Related0301 Wages - Management 113,051 99,590 13,461 13.5%0305 Temporary Personnel Services 7,774 6,637 1,137 17.1%0308 Wages-Casual 31,131 30,356 775 2.6%0311 Group Insurance 7,200 6,569 631 9.6%0312 Retirement Expense 23,175 19,207 3,968 20.7%0313 Industrial Insurance 5,046 4,393 653 14.9%0317 FICA/Medicare 3,056 4,153 (1,097) -26.4%0320 Clothing & Uniform Expense 3,550 3,142 408 13.0%0399 Miscellaneous Employee Expense - - - 0.0%
Total Payroll and Related 193,983 174,047 19,936 11.5%
04 Supplies and Services0410 Office Supplies Expenses - - - 0.0%0412 Janitorial Supplies 1,690 1,123 567 50.5%0415 Miscellaneous Supplies 400 387 13 3.4%0460 Contractual Services - - - 0.0%0462 Equip. Lease & Maintenance Agmts. - - - 0.0%0470 Miscellaneous Expenses - - - 0.0%0474 Licenses 1,891 1,693 198 11.7%0475 Food Purchases 42,500 42,741 (241) -0.6%0476 Soft Drink Purchases 17,900 17,295 605 3.5%0477 Beer Purchases 34 230 31 712 2 518 7 9%
Increase (Decrease)
Reno-Sparks Convention and Visitors AuthorityFiscal 2008-2009 Annual Forecast and Capital Budget
Wildcreek Golf Course - Food & BeverageFund 16096
0477 Beer Purchases 34,230 31,712 2,518 7.9%0478 Liquor & Wine Purchases 6,700 5,740 960 16.7%0479 Paper Products 6,760 5,788 972 16.8%0481 Credit Card Disc/Cash Over 360 99 261 263.6%
Total Supplies and Services 112,431 106,578 5,853 5.5%
05 Travel and Entertainment
0501 Travel and Lodging - - - 0.0%0504 Registrations - - - 0.0%0505 Local Transportation 100 56 44 78.6%0506 Entertainment - - - 0.0%0507 Meeting Expenses - - - 0.0%
Total Travel and Entertainment 100 56 44 78.6%
06 Promotion and Advertising0601 Hospitality - - - 0.0%0606 Promotional Materials - - - 0.0%0615 Other Advertising - - - 0.0%
Total Promotion and Advertising - - - 0.0%
Page 127

Object Account Account Budget Outlook
# # Description Totals FY 07-08 Amount % PercentIncrease (Decrease)
Reno-Sparks Convention and Visitors AuthorityFiscal 2008-2009 Annual Forecast and Capital Budget
Wildcreek Golf Course - Food & BeverageFund 16096
02 Capital Outlay0211 Major Equipment - - - 0.0%0220 Minor Equipment - - - 0.0%
Total Capital Outlay - - - 0.0%
Total Expenditures and Uses 306,514 280,681 25,833 9.2%
RevenuesR312 Food & Beverage Cost of Sales - - - 0.0%R331 Food Sales 97,720 91,247 6,473 7.1%R332 Beverage Sales 228,150 196,249 31,901 16.3%R333 Vending Machine Revenues 1,363 - 1,363 100.0%R334 Corkage 900 775 125 16.1%R335 Banquet Room Rentals 3,229 2,657 572 21.5%R340 Banquet Sales 12,300 12,966 (666) -5.1%R360 Miscellaneous Revenues 500 788 (288) -36.5%
Total Revenues 344,162 304,682 39,480 13.0%
Departmental Profit or (Loss) 37,648 24,001 13,647 56.9%
StatisticsCost of Food Sales Percentage 43.5% 46.8% (3.3) -7.2%Cost of Beverage Sales Percentage 25.8% 27.9% (2.1) -7.6%Payroll and Related Percentage 56.4% 57.1% (0.8) -1.3%
Page 128

Object Account Account Budget Outlook# # Description Totals FY 07-08 Amount % Percent
03 Payroll and Related0301 Wages - Management 54,229 35,844 18,385 51.3%0305 Temporary Personnel Services - - - 0.0%0308 Wages-Casual 17,921 32,938 (15,017) -45.6%0311 Group Insurance 1,500 - 1,500 100.0%0312 Retirement Expense 11,117 7,264 3,853 53.0%0313 Industrial Insurance 1,603 2,237 (634) -28.3%0317 FICA/Medicare 2,157 3,268 (1,111) -34.0%0320 Clothing & Uniform Expense - - - 0.0%
Total Payroll and Related 88,527 81,551 6,976 8.6%
04 Supplies and Services0411 Maintenance Supplies - - - 0.0%0415 Miscellaneous Supplies 9,100 5,399 3,701 68.5%0430 All Building & Grounds Related Repairs - - - 0.0%0444 All Equipment Related Repairs 6,600 5,445 1,155 21.2%0470 Miscellaneous Expenses - - - 0.0%
Total Supplies and Services 15,700 10,844 4,856 44.8%
05 Travel and Entertainment0501 Travel and Lodging - - - 0.0%0504 Registrations - - - 0.0%
Increase (Decrease)
Reno-Sparks Convention and Visitors AuthorityFiscal 2008-2009 Annual Forecast and Capital Budget
Wildcreek Golf Course - Cart & Driving RangeFund 16099
- - - 0.0%
06 Promotion and Advertising0606 Promotional Materials - - - 0.0%0615 Other Advertising - - - 0.0%0627 Other Production Costs - - - 0.0%
Total Promotion and Advertising - - - 0.0%
09 Depreciation0900 Depreciation Expense 44,340 44,340 - 0.0%
Total Depreciation 44,340 44,340 - 0.0%
01 Capital Outlay0110 Capital Lease - Interest - - - 0.0%
Total Capital Outlay - - - 0.0%
Total Expenditures and Uses 148,567 136,735 11,832 8.7%
RevenuesR130 Golf Cart Rentals 331,500 316,965 14,535 4.6%R150 Driving Range Revenues 88,400 80,882 7,518 9.3%R360 Miscellaneous Revenue - - - 0.0%R650 Prolink Revenues - - - 0.0%
Total Revenues 419,900 397,847 22,053 5.5%
Departmental Profit or (Loss) 271,333 261,112 10,221 3.9%
Statistics Total Rounds 65,648 59,589 6,059 10.2% Average Cart Fee Per Round 5.05$ 5.32$ ($0.27) -5.1%
Page 129


RENO-SPARKS CONVENTION AND VISITORSAUTHORITY FISCAL 2008-2009 ANNUAL FORECAST AND CAPITAL BUDGET
NORTHGATE GOLF CLUB
DESCRIPTION: Northgate Golf Club located in Northwest Reno features a 6,966-yard golf course par-72, driving range, restaurant, and bar. The course is operated seasonally, being open from March through late November, given its location and elevation. STAFF: Northgate Golf Club has four full-time employees – Golf Professional, Golf Course Superintendent, Mechanic, Greenskeeper and shares two Groundskeepers with Wildcreek. This golf course also employs 26 part-time/seasonal personnel. FISCAL YEAR 2008-2009 OBJECTIVES:
• To increase season pass sales to $93,000 from $75,000. • To attain a level of 19,237 rounds from 18,212. • Maximize revenues from other sources- pro shop, food and beverage,
and range. FINANCIAL DEPARTMENTAL DETAIL: The financial reporting of Northgate Golf Club is made up of the following three areas: Golf operations, food and beverage, and driving range/cart. A consolidated summary is included for your reference. The following pages detail the departmental line items for the current year budget compared to prior year outlook.
Page 131

Account Budget OutlookDescription Totals FY 07-08 Amount % Percent
Payroll and RelatedGolf Operations 457,925 447,126 10,799 2.4%Food & Beverage 76,681 64,297 12,384 19.3%Driving Range - Carts 78,953 75,234 3,719 4.9%
Total Payroll and Related 613,559 586,657 26,902 4.6%
Supplies and ServicesGolf Operations 370,722 348,911 21,811 6.3%Food & Beverage 48,356 47,097 1,259 2.7%Driving Range - Carts 16,700 14,827 1,873 12.6%
Total Supplies and Services 435,778 410,835 24,943 6.1%
Travel and EntertainmentGolf Operations 1,940 75 1,865 2486.7%Food & Beverage - - - 0.0%Driving Range - Carts - - - 0.0%
Total Travel and Entertainment 1,940 75 1,865 2486.7%
Promotion and AdvertisingGolf Operations 1,598 248 1,350 544.4%Food & Beverage 0 0%
Increase (Decrease)
Reno-Sparks Convention and Visitors AuthorityFiscal 2008-2009 Annual Forecast and Capital Budget
Northgate Golf Course - Summary
Food & Beverage - - - 0.0%Driving Range - Carts - - - 0.0%
Total Promotion and Advertising 1,598 248 1,350 544.4%
Depreciation Golf Operations 330,000 330,000 - 0.0%Food & Beverage - - - 0.0%Driving Range - Carts 24,744 27,000 (2,256) -8.4%
Total Depreciation 354,744 357,000 (2,256) -0.6%
Capital OutlayGolf Operations - - - 0.0%Food & Beverage - - - 0.0%Driving Range - Carts - - - 0.0%
Total Capital Outlay - - - 0.0%
Total Expenditures Golf Operations 1,162,185 1,126,360 35,825 3.2%Food & Beverage 125,037 111,394 13,643 12.2%Driving Range - Carts 120,397 117,061 3,336 2.8%
Total Expenditures 1,407,619 1,354,815 52,804 3.9%
Page 132
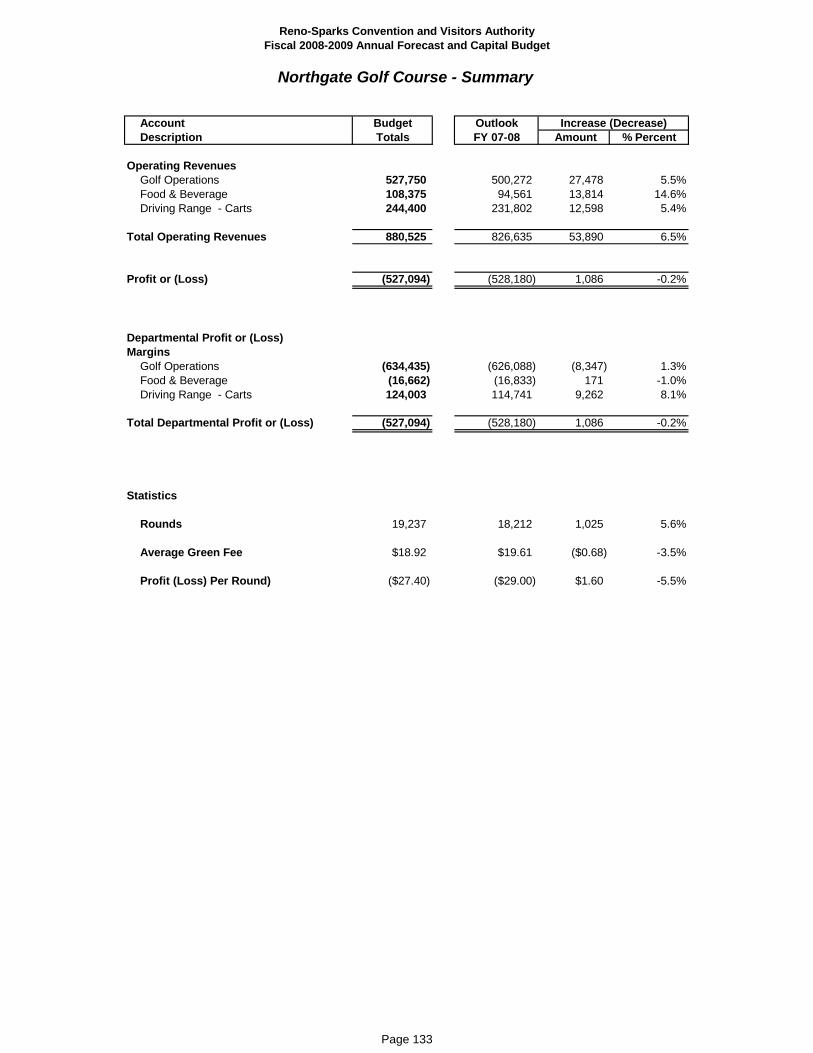
Account Budget OutlookDescription Totals FY 07-08 Amount % Percent
Increase (Decrease)
Reno-Sparks Convention and Visitors AuthorityFiscal 2008-2009 Annual Forecast and Capital Budget
Northgate Golf Course - Summary
Operating RevenuesGolf Operations 527,750 500,272 27,478 5.5%Food & Beverage 108,375 94,561 13,814 14.6%Driving Range - Carts 244,400 231,802 12,598 5.4%
Total Operating Revenues 880,525 826,635 53,890 6.5%
Profit or (Loss) (527,094) (528,180) 1,086 -0.2%
Departmental Profit or (Loss)Margins
Golf Operations (634,435) (626,088) (8,347) 1.3%Food & Beverage (16,662) (16,833) 171 -1.0%Driving Range - Carts 124,003 114,741 9,262 8.1%
Total Departmental Profit or (Loss) (527,094) (528,180) 1,086 -0.2%
St ti tiStatistics
Rounds 19,237 18,212 1,025 5.6%
Average Green Fee $18.92 $19.61 ($0.68) -3.5%
Profit (Loss) Per Round) ($27.40) ($29.00) $1.60 -5.5%
Page 133

B
udge
tFY
04-
05FY
05-
06FY
06-
07B
udge
tO
utlo
okFY
08-
09
R
even
ues
Gre
en F
ees
18 H
ole
314,
339
32
8,38
9
358,
703
36
3,48
5
357,
067
36
4,00
0
Mem
bers
hips
73,7
50
78
,115
75,2
65
92
,800
75,0
00
93
,000
Pro
Sho
p46
,821
47,2
53
52
,773
58,8
50
61
,166
62,2
00
M
isce
llane
ous
& L
esso
ns8,
477
5,
545
9,
779
7,
300
7,
039
8,
550
Fo
od &
Bev
erag
e10
7,77
1
98,6
64
11
0,92
4
116,
174
94
,561
108,
375
C
art R
enta
l20
6,93
9
185,
354
18
6,57
0
199,
000
19
0,04
3
201,
500
D
rivin
g R
ange
44,9
61
44
,175
43,6
07
42
,393
41,7
59
42
,900
Tota
l Rev
enue
s80
3,05
8
787,
495
83
7,62
1
880,
002
82
6,63
5
880,
525
Nor
thga
te G
olf C
ours
eC
onso
lidat
ed S
umm
ary
Fisc
al 2
008-
2009
Ann
ual F
orec
ast a
nd C
apita
l Bud
get
Des
crip
tion
Acco
unt
Actu
alFY
07-
08
Expe
nses
Pay
roll
& R
elat
ed46
2,63
3
561,
068
55
3,97
5
650,
988
58
6,65
7
613,
559
S
uppl
ies
& S
ervi
ces
379,
627
37
1,31
4
402,
094
41
6,31
4
410,
835
43
5,77
8
Trav
el &
Ent
erta
inm
ent
130
-
-
1,95
0
75
1,
940
P
rom
otio
n &
Adv
ertis
ing
858
1,73
6
5,50
5
1,50
0
248
1,59
8
Cap
ital O
utla
y-
-
-
-
-
-
D
epre
ciat
ion
322,
678
34
0,68
0
330,
181
35
7,00
0
357,
000
35
4,74
4
Tota
l Exp
ense
s1,
165,
926
1,27
4,79
8
1,
291,
755
1,42
7,75
2
1,
354,
815
1,40
7,61
9
Dep
artm
enta
l Pro
fit (L
oss)
(362
,868
)
(4
87,3
03)
(454
,134
)
(5
47,7
50)
(5
28,1
80)
(527
,094
)
Mar
gin
Perc
enta
ge-4
5.2%
-61.
9%-5
4.2%
-62.
2%-6
3.9%
-59.
9%
Stat
istic
s18
Hol
e C
ours
e18
,783
16,6
6318
,761
18,2
1418
,212
19,2
37
Tota
l Rou
nds
18,7
8316
,663
18,7
6118
,214
18,2
1219
,237
Tota
l Rev
enue
Per
Rou
nd$4
2.75
$47.
26$4
4.65
$48.
31$4
5.39
$45.
77
Prof
it (L
oss)
Per
Rou
nd($
19.3
2)($
29.2
4)($
24.2
1)($
30.0
7)($
29.0
0)($
27.4
0)
Cas
h Fl
ow(4
0,19
0)
(1
46,6
23)
(1
23,9
53)
(1
90,7
50)
(1
71,1
80)
(1
72,3
50)
Le
ss: C
apita
l14
0,84
8
222,
417
20
0,00
0
100,
000
10
0,00
0
100,
000
Le
ss: D
ebt S
ervi
ce41
7,07
1
417,
071
41
7,07
1
417,
071
14
7,37
8
148,
103
N
etC
ash
Flow
(598
109)
(786
111)
(741
024)
(707
821)
(418
558)
(420
453)
Net
Cas
h Fl
ow(5
98,1
09)
(786
,111
)
(7
41,0
24)
(707
,821
)
(418
,558
)
(4
20,4
53)
Page 134

Object Account Account Budget Outlook
# # Description Totals FY 07-08 Amount % Percent
03 Payroll and Related0301 Wages - Management 291,841 272,997 18,844 6.9%0305 Temporary Personnel Services - - - 0.0%0308 Wages-Casual 46,153 57,576 (11,423) -19.8%0311 Group Insurance 43,500 43,675 (175) -0.4%0312 Retirement Expense 58,474 54,199 4,275 7.9%0313 Industrial Insurance 10,215 9,085 1,130 12.4%0317 FICA/Medicare 6,332 8,499 (2,167) -25.5%0320 Clothing & Uniform Expense 450 719 (269) -37.4%0321 Employee Training - - - 0.0%0395 Safety Equipment 960 376 584 155.3%
Total Payroll and Related 457,925 447,126 10,799 2.4%
04 Supplies and Services0401 Utilities - Electric 120,200 109,201 10,999 10.1%0402 Utilities - Gas & Heat 6,350 7,501 (1,151) -15.3%0403 Utilities - Water 2,400 2,054 346 16.8%0404 Utilities - Sewer 3,150 2,645 505 19.1%0405 Trash Removal 2,670 2,364 306 12.9%0406 Utilities - Irrigation 23,000 23,000 - 0.0%0407 Fire Protection 816 408 408 100.0%0410 Office Supplies - - - 0.0%0411 Maintenance Supplies 0 0%
Increase (Decrease)
Reno-Sparks Convention and Visitors AuthorityFiscal 2008-2009 Annual Forecast and Capital Budget
Northgate Golf Course - Golf OperationsFund 16091
0411 Maintenance Supplies - - - 0.0%0412 Janitorial Supplies 3,650 2,879 771 26.8%0415 Miscellaneous Supplies 51,500 52,164 (664) -1.3%0420 Postage & Freight - - - 0.0%0421 Communications 5,640 8,565 (2,925) -34.2%0422 Printing & Binding - - - 0.0%0425 Fuel 13,000 10,486 2,514 24.0%0430 All Building & Grounds Related Repairs 18,000 15,399 2,601 16.9%0433 All Vehicle Related Repairs 600 992 (392) -39.5%0444 All Equipment Related Repairs 19,000 17,384 1,616 9.3%0452 Prof Services - Others - - - 0.0%0456 Pro Contract Payments - - - 0.0%0460 Contractual Services 24,000 20,984 3,016 14.4%0462 Equip. Lease & Maintenance Agmts. 3,876 3,684 192 5.2%0463 Insurance 18,000 16,644 1,356 8.1%0470 Miscellaneous Expenses - - - 0.0%0471 Finance Charges - - - 0.0%0473 Dues & Subscriptions 400 1,045 (645) -61.7%0481 Credit Card Discounts 10,930 9,576 1,354 14.1%0484 Inventory Freight - - - 0.0%0486 Cost of Good Sold 43,540 41,936 1,604 3.8%
Total Supplies and Services 370,722 348,911 21,811 6.3%
05 Travel and Entertainment0501 Travel and Lodging 1,350 - 1,350 100.0%0504 Registrations 450 - 450 100.0%0505 Local Transportation 140 75 65 86.7%
Total Travel and Entertainment 1,940 75 1,865 2486.7%
06 Promotion and Advertising0606 Promotional Materials - - - 0.0%0615 Other Advertising 1,598 248 1,350 544.4%0627 Other Production Costs - - - 0.0%
Total Promotion and Advertising 1,598 248 1,350 544.4%
Page 135
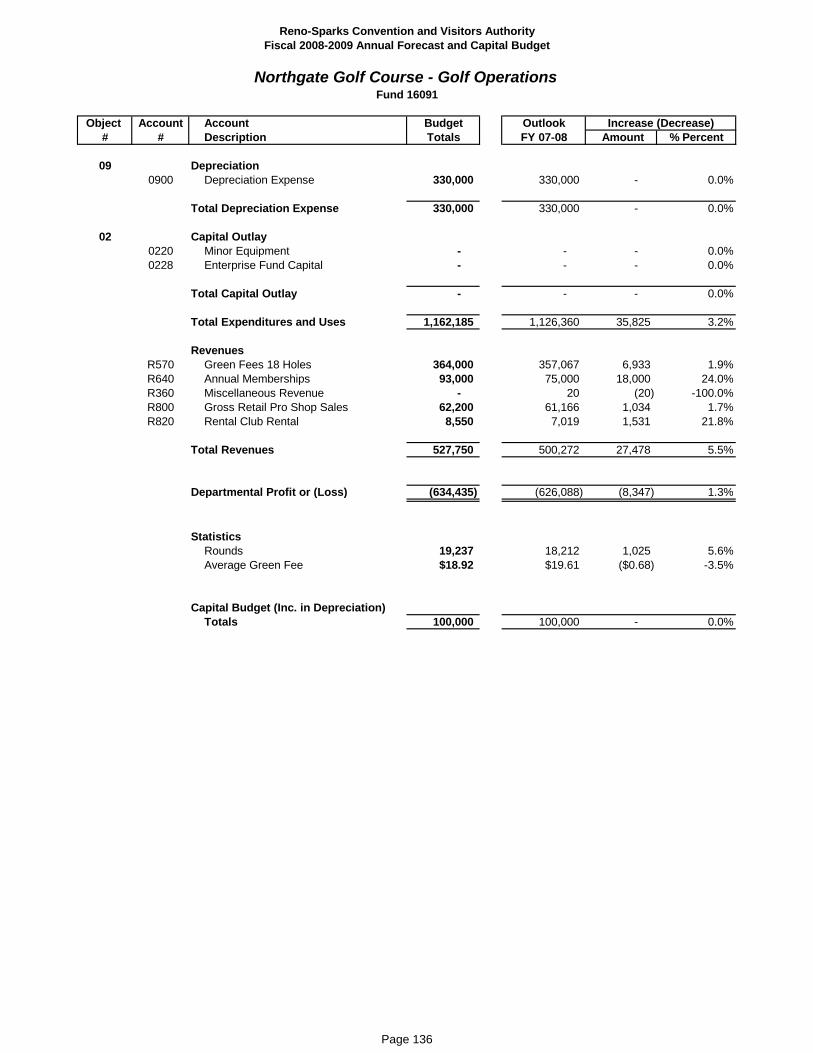
Object Account Account Budget Outlook
# # Description Totals FY 07-08 Amount % PercentIncrease (Decrease)
Reno-Sparks Convention and Visitors AuthorityFiscal 2008-2009 Annual Forecast and Capital Budget
Northgate Golf Course - Golf OperationsFund 16091
09 Depreciation 0900 Depreciation Expense 330,000 330,000 - 0.0%
Total Depreciation Expense 330,000 330,000 - 0.0%
02 Capital Outlay0220 Minor Equipment - - - 0.0%0228 Enterprise Fund Capital - - - 0.0%
Total Capital Outlay - - - 0.0%
Total Expenditures and Uses 1,162,185 1,126,360 35,825 3.2%
RevenuesR570 Green Fees 18 Holes 364,000 357,067 6,933 1.9%R640 Annual Memberships 93,000 75,000 18,000 24.0%R360 Miscellaneous Revenue - 20 (20) -100.0%R800 Gross Retail Pro Shop Sales 62,200 61,166 1,034 1.7%R820 Rental Club Rental 8,550 7,019 1,531 21.8%
Total Revenues 527,750 500,272 27,478 5.5%
Departmental Profit or (Loss) (634 435) (626 088) (8 347) 1 3%Departmental Profit or (Loss) (634,435) (626,088) (8,347) 1.3%
Statistics Rounds 19,237 18,212 1,025 5.6%Average Green Fee $18.92 $19.61 ($0.68) -3.5%
Capital Budget (Inc. in Depreciation) Totals 100,000 100,000 - 0.0%
Page 136

Object Account Account Budget Outlook# # Description Totals FY 07-08 Amount % Percent
03 Payroll and Related0301 Wages - Management 33,544 26,351 7,193 27.3%0305 Temporary Personnel Services 2,800 2,100 700 33.3%0308 Wages-Casual 28,592 25,853 2,739 10.6%0311 Group Insurance - 123 (123) -100.0%0312 Retirement Expense 6,877 4,676 2,201 47.1%0313 Industrial Insurance 2,050 1,434 616 43.0%0317 FICA/Medicare 1,789 2,646 (857) -32.4%0320 Clothing & Uniform Expense 1,029 1,114 (85) -7.6%0399 Miscellaneous Employee Expense - - - 0.0%
Total Payroll and Related 76,681 64,297 12,384 19.3%
04 Supplies and Services0410 Office Supplies Expenses - - - 0.0%0412 Janitorial Supplies 2,218 1,785 433 24.3%0415 Miscellaneous Supplies 764 714 50 7.0%0460 Contractual Services - - - 0.0%0462 Equip. Lease & Maintenance Agmts. - - - 0.0%0470 Miscellaneous Expenses - - - 0.0%0471 Finance Charges /Renewal Fees - - - 0.0%0473 Dues and Subscriptions - - - 0.0%0474 Licenses 454 454 - 0.0%0475 Food Purchases 20 533 20 081 452 2 3%
Increase (Decrease)
Reno-Sparks Convention and Visitors AuthorityFiscal 2008-2009 Annual Forecast and Capital Budget
Northgate Golf Course - Food & BeverageFund 16094
0475 Food Purchases 20,533 20,081 452 2.3%0476 Soft Drink Purchases 8,556 8,073 483 6.0%0477 Beer Purchases 11,218 10,903 315 2.9%0478 Liquor & Wine Purchases 1,635 2,108 (473) -22.4%0479 Paper Products 2,618 2,550 68 2.7%0481 Credit Card Disc/ Cash Over 360 429 (69) -16.1%
Total Supplies and Services 48,356 47,097 - 0.0%
05 Travel and Entertainment0501 Travel and Lodging - - - 0.0%0504 Registrations - - - 0.0%0505 Local Transportation - - - 0.0%0506 Entertainment - - - 0.0%0507 Meeting Expenses - - - 0.0%
Total Travel and Entertainment - - - 0.0%
06 Promotion and Advertising0601 Hospitality - - - 0.0%0606 Promotional Materials - - - 0.0%0615 Other Advertising - - - 0.0%
Total Promotion and Advertising - - - 0.0%
Page 137
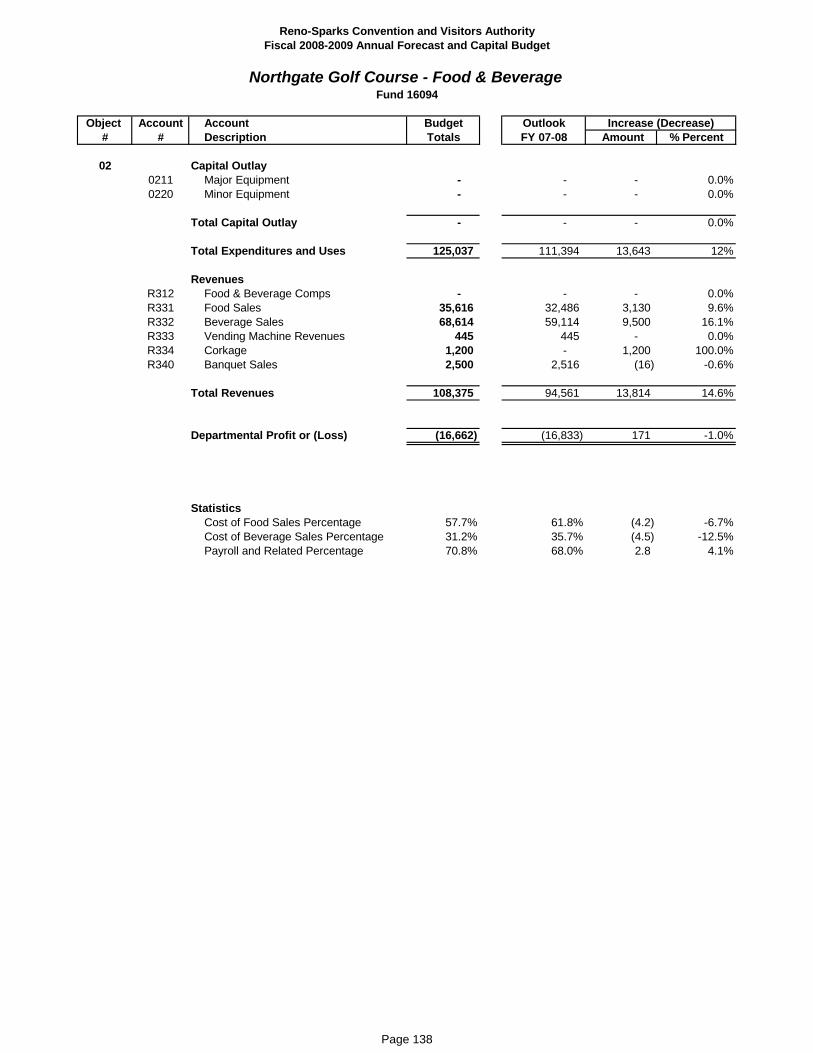
Object Account Account Budget Outlook# # Description Totals FY 07-08 Amount % Percent
Increase (Decrease)
Reno-Sparks Convention and Visitors AuthorityFiscal 2008-2009 Annual Forecast and Capital Budget
Northgate Golf Course - Food & BeverageFund 16094
02 Capital Outlay0211 Major Equipment - - - 0.0%0220 Minor Equipment - - - 0.0%
Total Capital Outlay - - - 0.0%
Total Expenditures and Uses 125,037 111,394 13,643 12%
RevenuesR312 Food & Beverage Comps - - - 0.0%R331 Food Sales 35,616 32,486 3,130 9.6%R332 Beverage Sales 68,614 59,114 9,500 16.1%R333 Vending Machine Revenues 445 445 - 0.0%R334 Corkage 1,200 - 1,200 100.0%R340 Banquet Sales 2,500 2,516 (16) -0.6%
Total Revenues 108,375 94,561 13,814 14.6%
Departmental Profit or (Loss) (16,662) (16,833) 171 -1.0%
StatisticsCost of Food Sales Percentage 57.7% 61.8% (4.2) -6.7%Cost of Beverage Sales Percentage 31.2% 35.7% (4.5) -12.5%Payroll and Related Percentage 70.8% 68.0% 2.8 4.1%
Page 138

Object Account Account Budget Outlook# # Description Totals FY 07-08 Amount % Percent
03 Payroll and Related0301 Wages - Management 47,658 44,592 3,066 6.9%0305 Temporary Personnel Services - - - 0.0%0308 Wages-Casual 18,534 18,103 431 2.4%0311 Group Insurance - - - 0.0%0312 Retirement Expense 9,307 8,782 525 6.0%0313 Industrial Insurance 1,919 1,552 367 23.6%0317 FICA/Medicare 1,535 2,205 (670) -30.4%0320 Clothing & Uniform Expense - - - 0.0%
Total Payroll and Related 78,953 75,234 3,719 4.9%
04 Supplies and Services0410 Office Supplies Expenses - - - 0.0%0411 Maintenance Supplies 100 100 - 0.0%0415 Miscellaneous Supplies 6,600 6,338 262 4.1%0444 All Equipment Related Repairs 10,000 8,389 1,611 19.2%0470 Miscellaneous Expenses - - - 0.0%
Total Supplies and Services 16,700 14,827 1,873 12.6%
05 Travel and Entertainment0501 Travel and Lodging - - - 0.0%0504 Registrations - - - 0.0%
Increase (Decrease)
Reno-Sparks Convention and Visitors AuthorityFiscal 2008-2009 Annual Forecast and Capital Budget
Northgate - Cart & Driving RangeFund 16098
- - - 0.0%
06 Promotion and Advertising0606 Promotional Materials - - - 0.0%0615 Other Advertising - - - 0.0%0627 Other Production Costs - - - 0.0%
Total Promotion and Advertising - - - 0.0%
09 Depreciation 0900 Depreciation Expense 24,744 27,000 (2,256) -8.4%
Total Depreciation 24,744 27,000 (2,256) -8.4%
Capital Outlay01 0110 Capital Lease Interest - - - 0.0%
Total Capital Outlay - - - 0.0%
Total Expenditures and Uses 120,397 117,061 3,336 2.8%
RevenuesR580 Golf Cart Rentals 201,500 190,043 11,457 6.0%R590 Driving Range Revenues 42,900 41,759 1,141 2.7%R650 Prolink Revenues - - - 0.0%
Total Revenues 244,400 231,802 12,598 5.4%
Departmental Profit or (Loss) 124,003 114,741 9,262 8.1%
Statistics Total Rounds 19,237 18,212 1,025 5.6% Average Cart Fee Per Round $10.47 $10.44 $0.04 0.4%
Page 139


RENO-SPARKS CONVENTION AND VISITORS AUTHORITY FISCAL 2008-2009 ANNUAL FORECAST AND CAPITAL BUDGET
GENERAL AND ADMINISTRATION SUMMARY
DESCRIPTION: General and Administration consists of the following departments:
• Executive Office • Board of Directors • Finance and Purchasing • Room Tax • Human Resources • Information Technology • Mail Services
Please find the following reports:
• G&A Summary showing revenues and expenses for FY08-09 • Departmental detail
Executive Office Board of Directors Finance and Purchasing Room Tax Human Resources Information Technology Mail Services
Page 141

Account Budget OutlookDescription Totals FY 07-08 Amount % Percent
Payroll and RelatedExecutive Office 870,720 790,298 80,422 10.2%Board of Directors 22,000 19,440 2,560 13.2%Finance & Purchasing 426,252 415,222 11,030 2.7%Room Tax 476,589 466,576 10,013 2.1%Human Resources 400,714 391,736 8,978 2.3%Information Technology 169,173 163,538 5,635 3.4%Mail Services 135,543 125,298 10,245 8.2%
Total Payroll and Related 2,500,991 2,372,108 128,883 5.4%
Supplies and ServicesExecutive Office 558,865 543,948 14,917 2.7%Board of Directors 189,000 162,732 26,268 16.1%Finance & Purchasing 123,600 128,711 (5,111) -4.0%Room Tax 42,920 52,022 (9,102) -17.5%Human Resources 49,315 67,354 (18,039) -26.8%Information Technology 163,660 159,083 4,577 2.9%Mail Services 12,607 12,154 453 3.7%
Total Supplies and Services 1,139,967 1,126,004 13,963 1.2%
Travel and EntertainmentExecutive Office 60 000 51 626 8 374 16 2%
Reno-Sparks Convention and Visitors AuthorityFiscal 2008-2009 Annual Forecast and Capital Budget
General and Administrative - Summary
Increase (Decrease)
Executive Office 60,000 51,626 8,374 16.2%Board of Directors 3,000 1,287 1,713 133.1%Finance & Purchasing 13,340 10,901 2,439 22.4%Room Tax 1,660 772 888 115.0%Human Resources 6,600 5,604 996 17.8%Information Technology 300 315 (15) -4.8%Mail Services - - - 0.0%
Total Travel and Entertainment 84,900 70,505 14,395 20.4%
Promotion and AdvertisingExecutive Office 7,675 11,389 (3,714) -32.6%Board of Directors - - - 0.0%Finance & Purchasing - - - 0.0%Room Tax - - - 0.0%Human Resources 21,600 14,531 7,069 48.6%Information Technology - - - 0.0%Mail Services - - - 0.0%
Total Promotion and Advertising 29,275 25,920 3,355 12.9%
Capital OutlayExecutive Office 6,000 10,858 (4,858) -44.7%Board of Directors - - - 0.0%Finance & Purchasing - - - 0.0%Room Tax - - - 0.0%Human Resources 2,000 2,498 (498) -19.9%Information Technology 120,000 93,113 26,887 28.9%Mail Services - 6,000 (6,000) -100.0%
Total Capital Outlay 128,000 112,469 15,531 13.8%
Total Expenditures 3,883,133 3,707,006 176,127 4.8%
Page 142

Account Budget OutlookDescription Totals FY 07-08 Amount % Percent
Reno-Sparks Convention and Visitors AuthorityFiscal 2008-2009 Annual Forecast and Capital Budget
General and Administrative - Summary
Increase (Decrease)
Miscellaneous RevenuesExecutive Office - - - 0.0%Board of Directors - - - 0.0%Finance & Purchasing 454,228 533,380 (79,152) -14.8%Room Tax 157,570 151,612 5,958 3.9%Human Resources - - - 0.0%Information Technology - - - 0.0%Mail Services - - - 0.0%
Total Miscellaneous Revenues 611,798 684,992 (73,194) -10.7%
Total Expenditures 3,271,335 3,022,014 249,321 8.3%
Departmental TotalsExecutive Office 1,503,260 1,408,119 95,141 6.8%Board of Directors 214,000 183,459 30,541 16.6%Finance & Purchasing 108,964 21,454 87,510 407.9%Room Tax 363,599 367,758 (4,159) -1.1%Human Resources 480,229 481,723 (1,494) -0.3%Information Technology 453,133 416,049 37,084 8.9%Mail Services 148 150 143 452 4 698 3 3%Mail Services 148,150 143,452 4,698 3.3%
Totals 3,271,335 3,022,014 249,321 8.3%
Page 143

B
udge
tFY
04-
05FY
05-
06FY
06-
07B
udge
tO
utlo
okFY
08-
09
R
even
ues
Exec
utiv
e O
ffice
-
-
-
-
-
-
Boar
d of
Dire
ctor
s-
-
-
-
-
-
Fi
nanc
e31
0,36
6
427,
594
54
2,34
9
498,
879
53
3,38
0
454,
228
Roo
m T
ax12
2,01
8
151,
306
16
3,88
6
148,
962
15
1,61
2
157,
570
Hum
an R
esou
rces
-
5
-
-
-
-
In
form
atio
n Te
chno
logy
-
-
-
-
-
-
Mai
l Ser
vice
s6,
502
-
-
-
-
-
Tota
l Rev
enue
s43
8,88
6
578,
905
70
6,23
5
647,
841
68
4,99
2
611,
798
Expe
nses
Payr
oll &
Rel
ated
Exec
utiv
e O
ffice
704,
480
71
8,50
9
749,
420
84
9,29
6
790,
298
87
0,72
0
Gen
eral
and
Adm
inis
trat
ion
Con
solid
ated
Sum
mar
yFi
scal
200
8-20
09 A
nnua
l For
ecas
t and
Cap
ital B
udge
t
Des
crip
tion
Acco
unt
Actu
alFY
07-
08
Boar
d of
Dire
ctor
s16
,160
15
,520
16
,960
24
,000
19,4
40
22,0
00
Fi
nanc
e36
4,12
2
378,
509
39
5,86
3
416,
597
41
5,22
2
426,
252
Roo
m T
ax39
7,72
9
423,
455
44
8,21
1
488,
930
46
6,57
6
476,
589
Hum
an R
esou
rces
310,
058
35
0,75
2
378,
249
37
2,67
8
391,
736
40
0,71
4
In
form
atio
n Te
chno
logy
152,
875
13
8,42
9
153,
403
15
9,80
6
163,
538
16
9,17
3
M
ail S
ervi
ces
117,
524
11
3,10
8
117,
924
12
1,28
7
125,
298
13
5,54
3
Tota
l Pay
roll
& R
elat
ed2,
062,
948
2,13
8,28
2
2,
260,
030
2,43
2,59
4
2,
372,
108
2,50
0,99
1
Supp
lies
& S
ervi
ces
Exec
utiv
e O
ffice
472,
903
50
8,83
4
515,
203
49
5,32
0
543,
948
55
8,86
5
Bo
ard
of D
irect
ors
196,
920
26
7,80
6
142,
069
15
9,00
0
162,
732
18
9,00
0
Fi
nanc
e10
8,63
2
104,
713
10
1,41
5
111,
670
12
8,71
1
123,
600
Roo
m T
ax56
,124
42,8
59
49
,498
43,8
00
52
,022
42,9
20
H
uman
Res
ourc
es35
,267
60,6
18
65
,392
54,9
15
67
,354
49,3
15
In
form
atio
n Te
chno
logy
96,3
42
12
0,86
2
123,
384
18
5,70
0
159,
083
16
3,66
0
M
ail S
ervi
ces
9,10
8
13,0
34
15
,014
13,2
45
12
,154
12,6
07
Tota
l Sup
plie
s &
Ser
vice
s97
5,29
6
1,11
8,72
6
1,
011,
975
1,06
3,65
0
1,
126,
004
1,13
9,96
7
Tr
avel
& E
nter
tain
men
tEx
ecut
ive
Offi
ce47
,217
34,8
78
61
,098
54,6
00
51
,626
60,0
00
Bo
ard
of D
irect
ors
4,18
6
7,52
9
-
3,
600
1,
287
3,
000
Fi
nanc
e18
,185
10,0
78
8,
515
13
,750
10,9
01
13
,340
Roo
m T
ax1,
110
76
7
64
5
1,
800
77
2
1,
660
H
uman
Res
ourc
es5,
938
6,
648
4,
311
3,
950
5,
604
6,
600
In
form
atio
n Te
chno
logy
-
90
9
69
0
1,
100
31
5
30
0
M
ail S
ervi
ces
1,42
6
1,21
7
1,45
7
1,50
0
-
-
Tota
lTra
vel&
Ente
rtai
nmen
t78
062
6202
676
716
8030
070
505
8490
0To
tal T
rave
l & E
nter
tain
men
t78
,062
62
,026
76
,716
80
,300
70,5
05
84,9
00
Page 144

B
udge
tFY
04-
05FY
05-
06FY
06-
07B
udge
tO
utlo
okFY
08-
09
Gen
eral
and
Adm
inis
trat
ion
Con
solid
ated
Sum
mar
yFi
scal
200
8-20
09 A
nnua
l For
ecas
t and
Cap
ital B
udge
t
Des
crip
tion
Acco
unt
Actu
alFY
07-
08
Prom
otio
n &
Adv
ertis
ing
Exec
utiv
e O
ffice
6,25
8
15,7
63
5,
060
10
,915
11,3
89
7,
675
Bo
ard
of D
irect
ors
-
-
-
-
-
-
Fina
nce
-
-
-
-
-
-
Roo
m T
ax-
-
-
-
-
-
H
uman
Res
ourc
es23
,735
23,0
39
13
,972
20,5
00
14
,531
21,6
00
In
form
atio
n Te
chno
logy
-
-
-
-
-
-
Mai
l Ser
vice
s-
-
-
-
-
Tota
l Pro
mot
ion
& A
dver
tisin
g29
,993
38
,802
19
,032
31
,415
25,9
20
29,2
75
Cap
ital O
utla
yEx
ecut
ive
Offi
ce2,
436
6,
940
23
,512
15,0
00
10
,858
6,00
0
Boar
d of
Dire
ctor
s-
-
-
-
-
-
Fi
nanc
e-
-
-
-
-
-
Roo
m T
ax-
3,90
3
-
-
-
-
Hum
an R
esou
rces
31,3
47
82
1
17
,647
-
2,
498
2,
000
In
form
atio
n Te
chno
logy
69,9
03
95
,094
54,7
19
84
,000
93,1
13
12
0,00
0
M
ail S
ervi
ces
-
13
,000
12,1
81
6,
000
6,
000
-
Tota
l Cap
ital
103,
686
11
9,75
8
108,
059
10
5,00
0
112,
469
12
8,00
0
Tota
l Exp
ense
s3,
249,
985
3,47
7,59
4
3,
475,
812
3,71
2,95
9
3,
707,
006
3,88
3,13
3
Dep
artm
enta
l Pro
fit (L
oss)
(2,8
11,0
99)
(2
,898
,689
)
(2,7
69,5
77)
(3
,065
,118
)
(3
,022
,014
)
(3,2
71,3
35)
Mar
gins
- Pr
ofit
(Los
s)Ex
ecut
ive
Offi
ce(1
,233
,294
)
(1
,284
,924
)
(1
,354
,293
)
(1
,425
,131
)
(1
,408
,119
)
(1
,503
,260
)
Bo
ard
of D
irect
ors
(217
,266
)
(290
,855
)
(159
,029
)
(186
,600
)
(183
,459
)
(214
,000
)
Fina
nce
(180
,573
)
(65,
706)
36,5
56
(4
3,13
8)
(2
1,45
4)
(1
08,9
64)
R
oom
Tax
(332
,945
)
(319
,678
)
(334
,468
)
(385
,568
)
(367
,758
)
(363
,599
)
Hum
an R
esou
rces
(406
,345
)
(441
,873
)
(479
,571
)
(452
,043
)
(481
,723
)
(480
,229
)
Info
rmat
ion
Tech
nolo
gy(3
19,1
20)
(3
55,2
94)
(3
32,1
96)
(4
30,6
06)
(4
16,0
49)
(4
53,1
33)
M
ail S
ervi
ces
(121
,556
)
(140
,359
)
(146
,576
)
(142
,032
)
(143
,452
)
(148
,150
)
Tota
l Dep
artm
enta
l Mar
gins
(2,8
11,0
99)
(2
,898
,689
)
(2,7
69,5
77)
(3
,065
,118
)
(3
,022
,014
)
(3,2
71,3
35)
Page 145

RENO-SPARKS CONVENTION AND VISITORS AUTHORITY FISCAL 2008-2009 ANNUAL FORECAST AND CAPITAL BUDGET
EXECUTIVE OFFICE
DESCRIPTION: The Executive Office provides administrative and management direction for the RSCVA, including administrative support to the thirteen member Board of Directors. STAFF: The Executive Office has five full-time positions – Chief Executive Officer, Vice President Finance, two Administrative Assistants, and an Internal Auditor. FISCAL YEAR 2008-2009 OBJECTIVES:
• Implement Strategic Plan. • Carrying out independent appraisals of the effectiveness of the policies,
procedures and standards by which the Authority’s financial, physical and information resources are managed as directed by the Chief Executive Officer and Board.
FINANCIAL DEPARTMENTAL DETAIL: The following pages detail the departmental line items for the current year budget compared to prior year outlook.
Page 146

Object Account Account Budget Outlook
# # Description Totals FY 07-08 Amount % Percent
03 Payroll and Related0301 Wages - Management 591,877 577,752 14,125 2.4%0305 Temporary Personnel Services - - - 0.0%0308 Wages-Casual - - - 0.0%0311 Group Insurance 48,000 46,346 1,654 3.6%0312 Retirement Expense 120,105 116,304 3,801 3.3%0313 Industrial Insurance 2,959 2,613 346 13.2%0317 FICA/Medicare 8,579 9,083 (504) -5.5%0321 Employee Training - - - 0.0%0350 Board Meeting Expense - - - 0.0%0380 Vehicle Allowances 19,200 19,200 - 0.0%0382 Bonus/Incentive Pay 80,000 19,000 61,000 321.1%0399 Miscellaneous Employee Expense - - - 0.0%
Total Payroll and Related 870,720 790,298 80,422 10.2%
04 Supplies and Services0410 Office Supplies Expenses 10,200 9,348 852 9.1%0415 Miscellaneous Supplies - - - 0.0%0420 Postage & Freight 1,800 1,539 261 17.0%0421 Communications 7,150 9,779 (2,629) -26.9%0422 Printing and Binding 2,400 1,558 842 54.0%0430 All Building Related Repairs - - - 0.0%0450 Professional Services Legal 60 000 76 978 (16 978) 22 1%
Increase (Decrease)
Reno-Sparks Convention and Visitors AuthorityFiscal 2008-2009 Annual Forecast and Capital Budget
Executive Office Fund 15010
0450 Professional Services - Legal 60,000 76,978 (16,978) -22.1%0452 Professional Services - Other 25,000 25,000 - 0.0%0460 Contractual Services 2,400 2,373 27 1.1%0462 Equip. Lease & Maintenance Agmts. 8,400 9,500 (1,100) -11.6%0470 Miscellaneous Expenses 6,000 6,186 (186) -3.0%0471 Finance Charges / Renewal - - - 0.0%0465 Rent 407,040 387,040 20,000 5.2%0473 Dues and Subscriptions 28,475 14,647 13,828 94.4%
Total Supplies and Services 558,865 543,948 14,917 2.7%
05 Travel and Entertainment0501 Travel and Lodging 34,800 21,298 13,502 63.4%0504 Registrations 14,400 16,550 (2,150) -13.0%0505 Local Transportation - - - 0.0%0506 Entertainment 3,600 3,868 (268) -6.9%0507 Meeting Expenses 7,200 9,910 (2,710) -27.3%
Total Travel and Entertainment 60,000 51,626 8,374 16.2%
Page 147
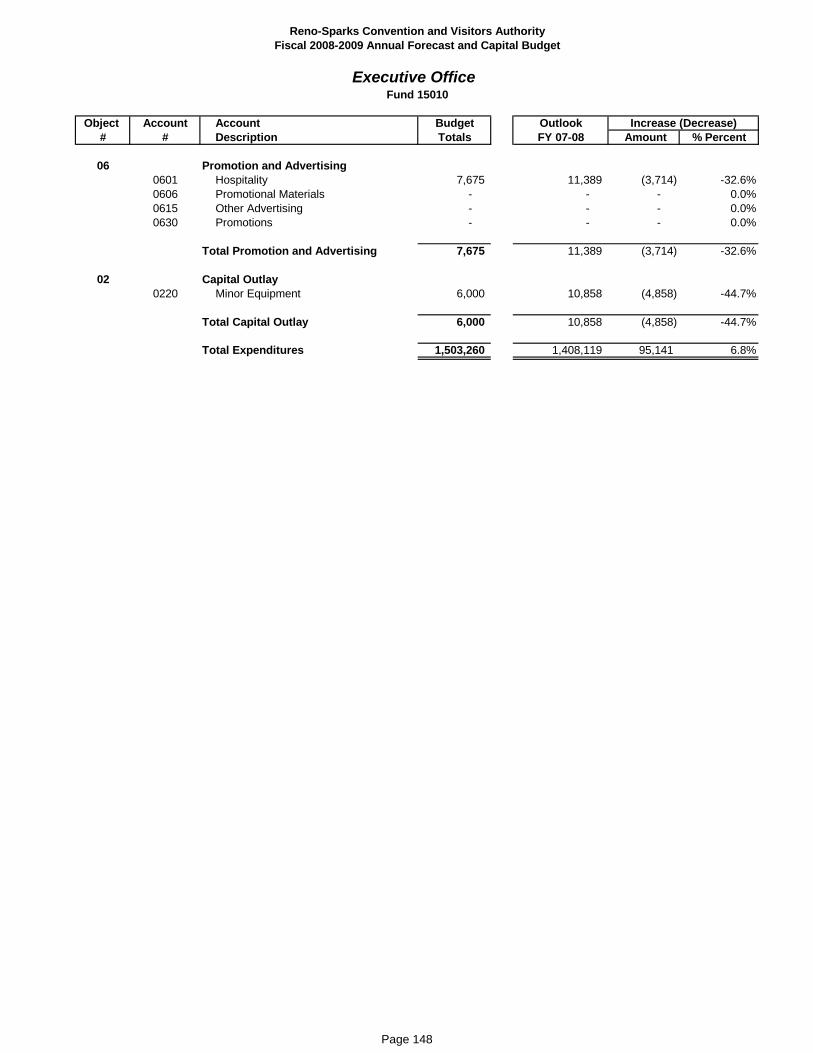
Object Account Account Budget Outlook
# # Description Totals FY 07-08 Amount % PercentIncrease (Decrease)
Reno-Sparks Convention and Visitors AuthorityFiscal 2008-2009 Annual Forecast and Capital Budget
Executive Office Fund 15010
06 Promotion and Advertising0601 Hospitality 7,675 11,389 (3,714) -32.6%0606 Promotional Materials - - - 0.0%0615 Other Advertising - - - 0.0%0630 Promotions - - - 0.0%
Total Promotion and Advertising 7,675 11,389 (3,714) -32.6%
02 Capital Outlay 0220 Minor Equipment 6,000 10,858 (4,858) -44.7%
Total Capital Outlay 6,000 10,858 (4,858) -44.7%
Total Expenditures 1,503,260 1,408,119 95,141 6.8%
Page 148

RENO-SPARKS CONVENTION AND VISITORS AUTHORITY FISCAL 2008-2009 ANNUAL FORECAST AND CAPITAL BUDGET
RSCVA BOARD OF DIRECTORS
DESCRIPTION: The RSCVA Board of Directors consists of a thirteen member board comprised of
a. Two members of the Board of County Commissioners of Washoe County;
b. Two members of the City Council of the City of Reno, Nevada; c. One member of the City Council of the City of Sparks, Nevada; d. One member from Incline Village/Crystal Bay. e. Seven members appointed by the aforementioned elected officials;
and The seven members set forth in item e are selected from nominations made by gaming, motel and other industry associations, or the Greater Reno-Sparks Chamber of Commerce. Three members must be actively engaged in the gaming industry, one member from the motel industry, one member from the finance industry, one member from the airline industry, and one member from the general business or commerce industry. Private sector members serve two-year terms, and are limited to a maximum of two consecutive terms. Representatives of the various governmental entities serve until the expiration of their respective terms of office.
Page 149

RENO-SPARKS CONVENTION AND VISITORS AUTHORITY
FISCAL 2008-2009 ANNUAL FORECAST AND CAPITAL BUDGET
RSCVA BOARD OF DIRECTORS CONTINUED FISCAL YEAR 2008-2009 OBJECTIVES:
• Oversee implementation of Strategic Plan. • Celebrate progress and achievements. • Increase openness and trust between Board and staff. • Determine ground rules and norms for the work of the Board.
FINANCIAL DEPARTMENTAL DETAIL: The following pages detail the departmental line items for the current year budget compared to prior year outlook.
Page 150

Object Account Account Budget Outlook
# # Description Totals FY 07-08 Amount % Percent
03 Payroll and Related0305 Temporary Personnel Services - - - 0.0%0350 Board Meeting Expense 22,000 19,440 2,560 13.2%0390 Staff / Board Retreats - - - 0.0%
Total Payroll and Related 22,000 19,440 2,560 13.2%
04 Supplies and Services0410 Office Supplies Expenses - - - 0.0%0415 Miscellaneous Supplies - - - 0.0%0450 Professional Services - Legal 144,000 122,140 21,860 17.9%0452 Professional Services - Other - - - 0.0%0460 Contractual Services 36,000 36,385 (385) -1.1%0463 Insurance - - - 0.0%0470 Miscellaneous Expenses 9,000 4,207 4,793 113.9%
Total Supplies and Services 189,000 162,732 26,268 16.1%
05 Travel and Entertainment0501 Travel and Lodging 3,000 1,287 1,713 133.1%0504 Registrations - - - 0.0%0505 Local Transportation - - - 0.0%0506 Entertainment - - - 0.0%0507 Meeting Expenses 0 0%
Increase (Decrease)
Reno-Sparks Convention and Visitors AuthorityFiscal 2008-2009 Annual Forecast and Capital Budget
Board of Directors Fund 15011
0507 Meeting Expenses - - - 0.0%
3,000 1,287 1,713 133.1%
06 Promotion and Advertising0601 Hospitality - - - 0.0%0691 Community Update - - - 0.0%
Total Promotion and Advertising - - - 0.0%
Total Expenditures 214,000 183,459 30,541 16.6%
Page 151

RENO-SPARKS CONVENTION AND VISITORS AUTHORITYFISCAL 2008-2009 ANNUAL FORECAST AND CAPITAL BUDGET
RSCVA BOARD OF DIRECTORS
Sharon ZadraChairman
City of RenoTerm is Coterminous
Dwight DortchVice-ChairmanCity of Reno
Term is Coterminous
Mark PardueSecretary/Treasurer
Incline Village/Crystal BayTerm Expires January 2010
Page 152

Motel Industry
Term Expires December 2008
FISCAL 2008-2009 ANNUAL FORECAST AND CAPITAL BUDGETRENO-SPARKS CONVENTION AND VISITORS AUTHORITY
RSCVA BOARD OF DIRECTORS - CONTINUED
Phillip SalernoCity of Sparks
Term is coterminous
Frank BaldwinGaming Industry
Jim DeVolld
Term Expires July 2009
Roberta Ross
Term Expires June 2008
Banking Industry
Lynn AtchesonAir Service Industry
Howard A. "Hal" Lenox, Jr.Business Industry
Term Expires December 2009David HumkeWashoe County
Term is coterminous
Term Expires June 2008Bonnie Weber
Washoe CountyTerm is coterminous
Air Service Industry
John FarahiGaming Industry
Liza CartlidgeTerm Expires March 2010Gaming Industry
Term Expires July 2009
Page 153

RENO-SPARKS CONVENTION AND VISITORS AUTHORITY FISCAL 2008-2009 ANNUAL FORECAST AND CAPITAL BUDGET
FINANCE AND PURCHASING
DESCRIPTION: The Finance and Purchasing Department is responsible for the administration and maintenance of all financial records, the distribution and posting of room taxes, the preparation of various financial reports, payroll functions, purchasing, coordination and submission of the annual budget and, in conjunction with our external auditors, preparation of the annual audit and associated Comprehensive Annual Financial Report (CAFR). In addition, the Finance and Purchasing Department provides financial and technical assistance to other departments throughout the Authority. STAFF: The Finance Department has six full-time positions: Accounting Manager, Accountant, three Accounting Staff, and a Purchasing Agent. FISCAL YEAR 2008-2009 OBJECTIVES:
• Maintain positive work environment and high energy level with staff. • Maintain high degree of trust/respect with Board and the community. • Continue to educate internal users of financial data. • Develop and maintain minimum cash flow requirements. • Provide for education and training for staff (Regulatory, Finance, and
Purchasing). • Implement accounting procedures and policies increasing internal
controls. • Maintain internal controls resulting in positive internal/external audits. • Maintain accurate and timely reporting of financial data. • Continue to grow and maximize use of purchasing card, thereby
increasing the rebate obtained by the Authority. FINANCIAL DEPARTMENTAL DETAIL: The following pages detail the departmental line items for the current year budget compared to prior year outlook.
Page 154

Object Account Account Budget Outlook
# # Description Totals FY 07-08 Amount % Percent
03 Payroll and Related0301 Wages - Management 310,674 302,493 8,181 2.7%0305 Temporary Personnel Services - - - 0.0%0308 Wages-Casual - No PERS - - - 0.0%0311 Group Insurance 46,800 45,711 1,089 2.4%0312 Retirement Expense 62,871 61,206 1,665 2.7%0313 Industrial Insurance 1,400 1,347 53 3.9%0317 FICA/Medicare 4,507 4,465 42 0.9%0380 Vehicle Allowances - - - 0.0%0399 Miscellaneous Employee Expense - - - 0.0%
Total Payroll and Related 426,252 415,222 11,030 2.7%
04 Supplies and Services0410 Office Supplies Expenses 5,400 4,597 803 17.5%0415 Miscellaneous Supplies - - - 0.0%0420 Postage & Freight 4,200 3,542 658 18.6%0421 Communications 3,275 4,749 (1,474) -31.0%0422 Printing and Binding 3,300 3,836 (536) -14.0%0450 Professional Services - Legal - - - 0.0%0451 Professional Services - Auditing 56,000 51,011 4,989 9.8%0452 Professional Services - Other - 10,700 (10,700) -100.0%0460 Contractual Services 36,700 36,523 177 0.5%0462 Equip Lease & Maintenance Agmts 9 600 9 500 100 1 1%
Increase (Decrease)
Reno-Sparks Convention and Visitors AuthorityFiscal 2008-2009 Annual Forecast and Capital Budget
Finance & PurchasingFund 15020
0462 Equip. Lease & Maintenance Agmts. 9,600 9,500 100 1.1%0470 Miscellaneous Expenses 3,600 3,108 492 15.8%0471 Finance Charges - - - 0.0%0473 Dues and Subscriptions 1,525 1,145 380 33.2%
Total Supplies and Services 123,600 128,711 (5,111) -4.0%
05 Travel and Entertainment0501 Travel and Lodging 9,950 7,824 2,126 27.2%0504 Registrations 3,050 2,971 79 2.7%0505 Local Transportation 240 12 228 1900.0%0506 Entertainment 100 94 6 6.4%
Total Travel and Entertainment 13,340 10,901 2,439 22.4%
Page 155

Object Account Account Budget Outlook
# # Description Totals FY 07-08 Amount % PercentIncrease (Decrease)
Reno-Sparks Convention and Visitors AuthorityFiscal 2008-2009 Annual Forecast and Capital Budget
Finance & PurchasingFund 15020
06 Promotion and Advertising0615 Other Advertising - - - 0.0%
Total Promotion and Advertising - - - 0.0%
02 Capital Outlay
0220 Minor Equipment - - - 0.0%
Total Capital Outlay - - - 0.0%
Total Expenditures 563,192 554,834 8,358 1.5%
Revenues R070 Investment Interest Income 174,996 272,010 (97,014) -35.7%R360 Miscellaneous Revenue 33,264 22,566 10,698 47.4%R380 Admin Revenue - Reno 245,968 238,804 7,164 3.0%
Total Revenues 454,228 533,380 (79,152) -14.8%
Net Departmental Expenses 108,964 21,454 87,510 407.9%
Page 156

RENO-SPARKS CONVENTION AND VISITORS AUTHORITY FISCAL 2008-2009 ANNUAL FORECAST AND CAPITAL BUDGET
ROOM TAX
DESCRIPTION: The Room Tax Department is responsible for the collection and administration of room taxes, including audits of all properties within Washoe County. STAFF: The Room Tax Department has seven full-time positions: Room Tax Audit Manager, Assistant Room Tax Audit Manager, four Room Tax Auditors, and an Administrative Assistant. FISCAL YEAR 2008-2009 OBJECTIVES:
• Maintain positive work environment and high energy level with staff. • Maintain high degree of trust and respect with Board and community. • Complete revision and issue new regulations. • Improve community and industry relations through annual meetings. • Complete sixty (60) room tax audits, resulting in three year audit cycle.
FINANCIAL DEPARTMENTAL DETAIL: The following pages detail the departmental line items for the current year budget compared to prior year outlook.
Page 157

Object Account Account Budget Outlook
# # Description Totals FY 07-08 Amount % Percent
03 Payroll and Related0301 Wages - Management 348,700 345,060 3,640 1.1%0305 Temporary Personnel Services - - - 0.0%0308 Wages-Casual - No PERS - - - 0.0%0311 Group Insurance 50,400 45,642 4,758 10.4%0312 Retirement Expense 70,867 69,225 1,642 2.4%0313 Industrial Insurance 1,568 1,532 36 2.3%0317 FICA/Medicare 5,054 5,117 (63) -1.2%0399 Miscellaneous Employee Expense - - - 0.0%
Total Payroll and Related 476,589 466,576 10,013 2.1%
04 Supplies and Services0410 Office Supplies Expenses 4,200 5,086 (886) -17.4%0415 Miscellaneous Supplies - - - 0.0%0420 Postage & Freight 1,920 1,730 190 11.0%0421 Communications 2,000 3,021 (1,021) -33.8%0422 Printing and Binding - - - 0.0%0450 Professional Services - Legal 24,000 30,891 (6,891) -22.3%0452 Professional Services - Other - - - 0.0%0460 Contractual Services - - - 0.0%0462 Equip. Lease & Maintenance Agmts. 9,000 9,500 (500) -5.3%0470 Miscellaneous Expenses 1,800 1,794 6 0.3%0473 Dues and Subscriptions 0 0%
Increase (Decrease)
Reno-Sparks Convention and Visitors AuthorityFiscal 2008-2009 Annual Forecast and Capital Budget
Room TaxFund 15021
0473 Dues and Subscriptions - - - 0.0%
42,920 52,022 (9,102) -17.5%
05 Travel and Entertainment0501 Travel and Lodging 700 227 473 208.4%0504 Registrations 600 300 300 100.0%0505 Local Transportation 360 245 115 46.9%
Total Travel and Entertainment 1,660 772 888 115.0%
Page 158
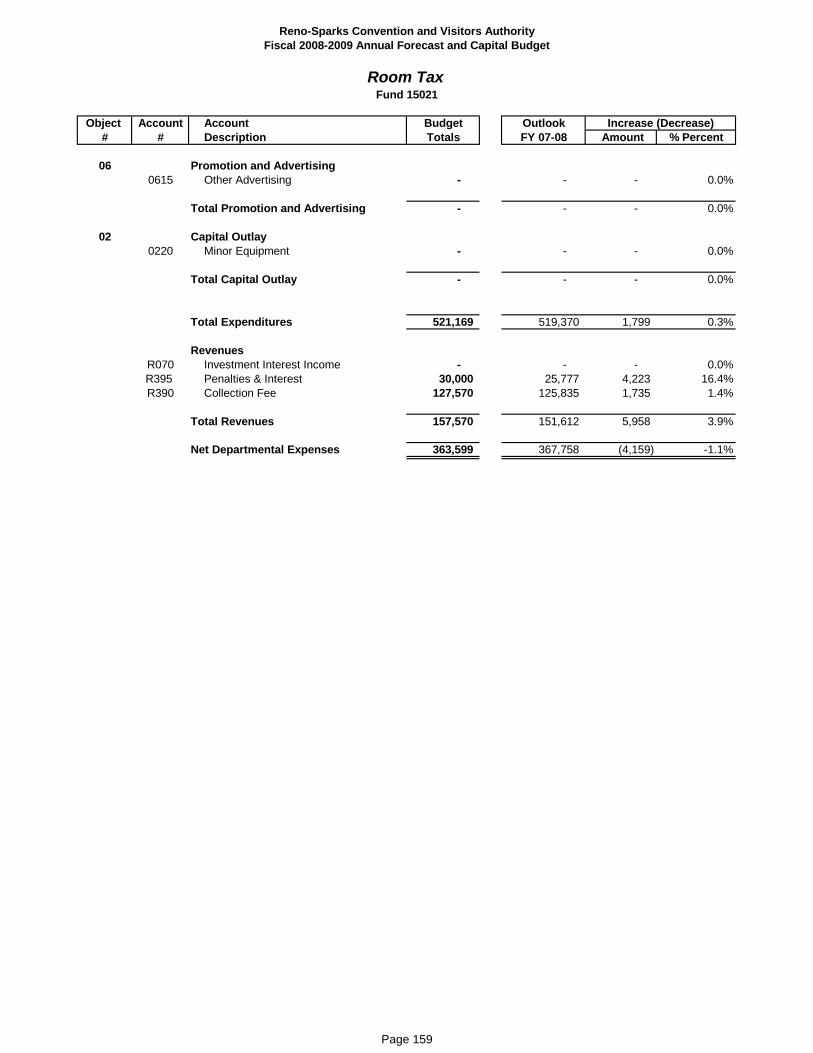
Object Account Account Budget Outlook
# # Description Totals FY 07-08 Amount % PercentIncrease (Decrease)
Reno-Sparks Convention and Visitors AuthorityFiscal 2008-2009 Annual Forecast and Capital Budget
Room TaxFund 15021
06 Promotion and Advertising0615 Other Advertising - - - 0.0%
Total Promotion and Advertising - - - 0.0%
02 Capital Outlay
0220 Minor Equipment - - - 0.0%
Total Capital Outlay - - - 0.0%
Total Expenditures 521,169 519,370 1,799 0.3%
Revenues R070 Investment Interest Income - - - 0.0%R395 Penalties & Interest 30,000 25,777 4,223 16.4%R390 Collection Fee 127,570 125,835 1,735 1.4%
Total Revenues 157,570 151,612 5,958 3.9%
Net Departmental Expenses 363,599 367,758 (4,159) -1.1%
Page 159

RENO-SPARKS CONVENTION AND VISITORS AUTHORITY FISCAL 2008-2009 ANNUAL FORECAST AND CAPITAL BUDGET
HUMAN RESOURCES
DESCRIPTION: The Human Resources Department‘s primary responsibilities include: recruitment/employment, salary/compensation, employee development, coaching/counseling, performance management, employee benefits, employee relations, training, personnel policy development, worker’s compensation, job descriptions, personnel legal compliance, and record-keeping. STAFF: The Human Resources Department has three full-time positions – Executive Director of Human Resources, Human Resources Administrator, Human Resources Coordinator and one part-time Administrative Assistant. FISCAL YEAR 2008-2009 OBJECTIVES:
• Focus on the development of supervisors at through in-house and outsourced training programs.
• Effective recruitment for open positions. • Continue to improve employee communication and self-service abilities
via technology allowing HR to be more efficient.
Operating Expenses:
• No changes in personnel this year. • Contractual services reflect maintenance costs for various software
programs. • Overall expenses in supplies and services are projected to decrease
by 26.8% from FY 07-08 outlook. • The FY 08-09 overall budget reflects a projected 0.3% decrease from
the FY 07-08 outlook.
FINANCIAL DEPARTMENTAL DETAIL: The following pages detail the departmental line items for the current year budget compared to prior year outlook.
Page 160

Object Account Account Budget Outlook
# # Description Totals FY 07-08 Amount % Percent
Payroll and Related03 0301 Wages - Management 247,894 240,283 7,611 3.2%
0305 Temporary Personnel Service - 116 (116) -100.0%0308 Wages-Casual - - - 0.0%0311 Group Insurance 29,700 29,511 189 0.6%0312 Retirement Expense 48,769 47,807 962 2.0%0313 Industrial Insurance 1,117 1,045 72 6.9%0317 FICA/Medicare 3,592 3,627 (35) -1.0%0321 Employee Training 6,600 3,412 3,188 93.4%0375 Accident Drug Screening 5,400 6,809 (1,409) -20.7%0377 Employee Assistance Program 10,992 10,940 52 0.5%0380 Vehicle Allowances 4,800 4,800 - 0.0%0382 Bonuses 2,750 6,000 (3,250) -54.2%0386 Employee Tuition - - - 0.0%0395 Safety Equipment - - - 0.0%0398 Employee Special Events 35,500 36,104 (604) -1.7%0399 Miscellaneous Employee Expense 3,600 1,282 2,318 180.8%
Total Payroll and Related 400,714 391,736 8,978 2.3%
04 Supplies and Services0410 Office Supplies Expenses 4,800 5,168 (368) -7.1%0415 Miscellaneous Supplies 900 2,711 (1,811) -66.8%0420 Postage & Freight 1,800 1,399 401 28.7%
Increase (Decrease)
Reno-Sparks Convention and Visitors AuthorityFiscal 2008-2009 Annual Forecast and Capital Budget
Human ResourcesFund 15120
0421 Communications 2,175 2,304 (129) -5.6%0422 Printing and Binding 1,200 599 601 100.3%0444 All Equipment Related Repairs - - - 0.0%0450 Professional Services - Legal 11,500 22,429 (10,929) -48.7%0452 Professional Services - Other 10,000 13,627 (3,627) -26.6%0453 Professional Services - Administration - - - 0.0%0460 Contractual Services 6,000 5,362 638 11.9%0462 Equip. Lease & Maintenance Agmts. 8,400 9,500 (1,100) -11.6%0470 Miscellaneous Expenses - 740 (740) -100.0%0471 Finance Charges - - - 0.0%0473 Dues and Subscriptions 2,540 3,515 (975) -27.7%
Total Supplies and Services 49,315 67,354 (18,039) -26.8%
05 Travel and Entertainment0501 Travel and Lodging 4,900 4,729 171 3.6%0504 Registrations 1,700 875 825 94.3%0505 Local Transportation - - - 0.0%0506 Entertainment - - - 0.0%0507 Meeting Expenses - - - 0.0%
Total Travel and Entertainment 6,600 5,604 996 17.8%
Page 161

Object Account Account Budget Outlook
# # Description Totals FY 07-08 Amount % PercentIncrease (Decrease)
Reno-Sparks Convention and Visitors AuthorityFiscal 2008-2009 Annual Forecast and Capital Budget
Human ResourcesFund 15120
06 Promotion and Advertising0615 Other Advertising - - - 0.0%0621 Recruitment Advertising 21,600 14,531 7,069 48.6%
Total Promotion and Advertising 21,600 14,531 7,069 48.6%
02 Capital Outlay
0220 Minor Equipment 2,000 2,498 (498) -19.9%
Total Capital Outlay 2,000 2,498 (498) -19.9%
Total Expenditures 480,229 481,723 (1,494) -0.3%
Revenues R360 Miscellaneous Revenue - - - 0.0%
Total Revenues - - - 0.0%
Net Departmental Expenses 480,229 481,723 (1,494) -0.3%
Page 162
RENO-SPARKS CONVENTION AND VISITORS AUTHORITY FISCAL 2008-2009 ANNUAL FORECAST AND CAPITAL BUDGET
INFORMATION TECHNOLOGY
DESCRIPTION: The Information Technology Department’s primary responsibilities include support and maintenance of 18 Windows servers providing access to the internet, e-mail, EZ-Track timekeeping system, Mitchell Humphrey Financial Management System (FMS), Ungerboeck Event Based Management System (EBMS) for all facilities, Meeting Matrix Space Planner for the Reno-Sparks Convention Center, Sage Software’s Abra Payroll and Human Resource System, Employee Self Service, Pro-Shopkeeper Golf Point of Sale System, as well as other applications needed to facilitate a computer network. The Information Technology Department supports approximately 190 users. STAFF: Information Technology has two full-time positions – Manager of Information Technology and Computer Network/PC Support Specialist. FISCAL YEAR 2008-2009 OBJECTIVES:
• Software upgrade to Microsoft Office 2007 for 130 users. • Replacement of approximately 30 workstations to include Windows Vista
operating system. • Network infrastructure updates to accommodate VLANs and VoIP. • Continued development of disaster recovery site located at the Reno-
Sparks Convention Center. • Contractual services include maintenance contracts on the various
systems outlined above and outside consultation which provides network and security services.
FINANCIAL DEPARTMENTAL DETAIL: The following pages detail the departmental line items for the current year budget compared to prior year outlook.
Page 163

Object Account Account Budget Outlook
# # Description Totals FY 07-08 Amount % Percent
Payroll and Related03 0301 Wages - Management 123,016 117,802 5,214 4.4%
305 Temporary Personnel - 1,488 (1,488) -100.0%0308 Wages-Casual - - - 0.0%0310 Independent Contractors - - - 0.0%0311 Group Insurance 18,600 17,566 1,034 5.9%0312 Retirement Expense 25,219 24,147 1,072 4.4%0313 Industrial Insurance 553 530 23 4.3%0317 FICA/Medicare 1,785 1,735 50 2.9%0321 Training - 270 (270) -100.0%
Total Payroll and Related 169,173 163,538 5,635 3.4%
04 Supplies and Services0410 Office Supplies Expenses 300 753 (453) -60.2%0415 Miscellaneous Supplies - - - 0.0%0420 Postage & Freight 60 69 (9) -13.0%0421 Communications 11,300 10,216 1,084 10.6%0422 Printing and Binding - - - 0.0%0425 Fuel - - - 0.0%0444 All Equipment Related Repairs - - - 0.0%0460 Contractual Services 152,000 148,030 3,970 2.7%0462 Equip. Lease & Maintenance Agmts. - - - 0.0%0470 Miscellaneous Expenses 15 (15) 100 0%
Increase (Decrease)
Reno-Sparks Convention and Visitors AuthorityFiscal 2008-2009 Annual Forecast and Capital Budget
Information TechnologyFund 15121
0470 Miscellaneous Expenses - 15 (15) -100.0%0471 Finance Charges - - - 0.0%0473 Dues and Subscriptions - - - 0.0%0474 Licenses - - - 0.0%
Total Supplies and Services 163,660 159,083 4,577 2.9%
05 Travel and Entertainment0501 Travel and Lodging - - - 0.0%0504 Registrations - - - 0.0%0505 Local Transportation 300 315 (15) -4.8%0506 Entertainment - - - 0.0%0507 Meeting Expenses - - - 0.0%
Total Travel and Entertainment 300 315 (15) -4.8%
Page 164

Object Account Account Budget Outlook
# # Description Totals FY 07-08 Amount % PercentIncrease (Decrease)
Reno-Sparks Convention and Visitors AuthorityFiscal 2008-2009 Annual Forecast and Capital Budget
Information TechnologyFund 15121
06 Promotion and Advertising0615 Other Advertising - - - 0.0%0620 Familiarization Tours - - - 0.0%
Total Promotion and Advertising - - - 0.0%
02 Capital Outlay 0220 Minor Equipment 72,000 82,783 (10,783) -13.0%0275 Software Purchases 48,000 10,330 37,670 364.7%
Total Capital Outlay 120,000 93,113 26,887 28.9%
Total Expenditures and Uses 453,133 416,049 37,084 8.9%
Page 165

RENO-SPARKS CONVENTION AND VISITORS AUTHORITY FISCAL 2008-2009 ANNUAL FORECAST AND CAPITAL BUDGET
MAIL SERVICES
DESCRIPTION: The Mail Services Department’s primary responsibilities include: processing of all incoming and outgoing mail - including all interdepartmental mail - shipping, messenger and courier services, copy jobs, and visitor planner fulfillment. STAFF: Mail Services has two full-time positions - Supervisor and Senior Clerk/Messenger. FISCAL YEAR 2008-2009 OBJECTIVES:
• Minimize ground and air rates with various shipping carriers. Operating Expenses:
• Vehicle repairs reflect all costs for two vehicles, a courtesy van and a delivery truck.
• Miscellaneous expenses reflect gas (rising costs) for two vehicles FINANCIAL DEPARTMENTAL DETAIL: The following pages detail the departmental line items for the current year budget compared to prior year outlook.
Page 166
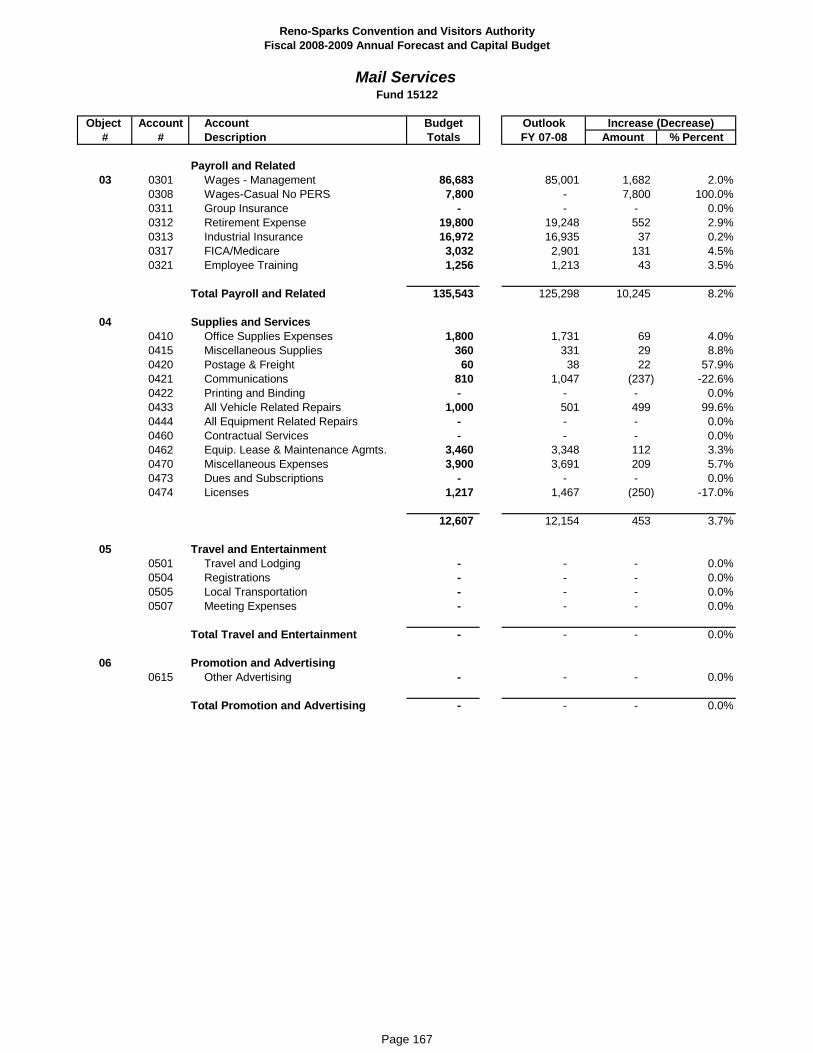
Object Account Account Budget Outlook
# # Description Totals FY 07-08 Amount % Percent
Payroll and Related03 0301 Wages - Management 86,683 85,001 1,682 2.0%
0308 Wages-Casual No PERS 7,800 - 7,800 100.0%0311 Group Insurance - - - 0.0%0312 Retirement Expense 19,800 19,248 552 2.9%0313 Industrial Insurance 16,972 16,935 37 0.2%0317 FICA/Medicare 3,032 2,901 131 4.5%0321 Employee Training 1,256 1,213 43 3.5%
Total Payroll and Related 135,543 125,298 10,245 8.2%
04 Supplies and Services0410 Office Supplies Expenses 1,800 1,731 69 4.0%0415 Miscellaneous Supplies 360 331 29 8.8%0420 Postage & Freight 60 38 22 57.9%0421 Communications 810 1,047 (237) -22.6%0422 Printing and Binding - - - 0.0%0433 All Vehicle Related Repairs 1,000 501 499 99.6%0444 All Equipment Related Repairs - - - 0.0%0460 Contractual Services - - - 0.0%0462 Equip. Lease & Maintenance Agmts. 3,460 3,348 112 3.3%0470 Miscellaneous Expenses 3,900 3,691 209 5.7%0473 Dues and Subscriptions - - - 0.0%0474 Licenses 1 217 1 467 (250) 17 0%
Increase (Decrease)
Reno-Sparks Convention and Visitors AuthorityFiscal 2008-2009 Annual Forecast and Capital Budget
Mail ServicesFund 15122
0474 Licenses 1,217 1,467 (250) -17.0%
12,607 12,154 453 3.7%
05 Travel and Entertainment0501 Travel and Lodging - - - 0.0%0504 Registrations - - - 0.0%0505 Local Transportation - - - 0.0%0507 Meeting Expenses - - - 0.0%
Total Travel and Entertainment - - - 0.0%
06 Promotion and Advertising0615 Other Advertising - - - 0.0%
Total Promotion and Advertising - - - 0.0%
Page 167
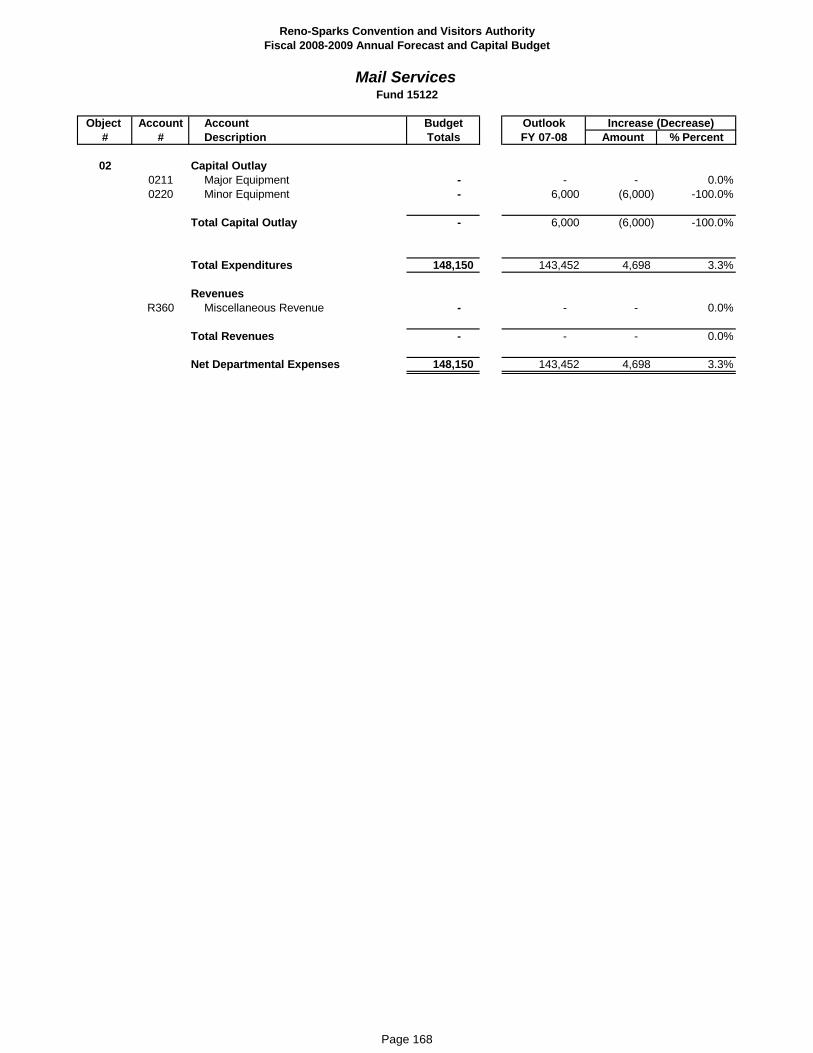
Object Account Account Budget Outlook
# # Description Totals FY 07-08 Amount % PercentIncrease (Decrease)
Reno-Sparks Convention and Visitors AuthorityFiscal 2008-2009 Annual Forecast and Capital Budget
Mail ServicesFund 15122
02 Capital Outlay
0211 Major Equipment - - - 0.0%0220 Minor Equipment - 6,000 (6,000) -100.0%
Total Capital Outlay - 6,000 (6,000) -100.0%
Total Expenditures 148,150 143,452 4,698 3.3%
Revenues R360 Miscellaneous Revenue - - - 0.0%
Total Revenues - - - 0.0%
Net Departmental Expenses 148,150 143,452 4,698 3.3%
Page 168

RENO-SPARKS CONVENTION AND VISITORS AUTHORITY FISCAL 2008-2009 ANNUAL FORECAST AND CAPITAL BUDGET
CONVENTION SALES SUMMARY
DESCRIPTION: The Convention Sales department consists of the following teams:
• Convention and Meeting Sales: Focuses on attracting conventions and meetings to Reno-Tahoe.
• Convention Services:
Serves as a resource for incoming groups.
Page 169

RENO-SPARKS CONVENTION AND VISITORS AUTHORITY FISCAL 2008-2009 ANNUAL FORECAST AND CAPITAL BUDGET
CONVENTION SALES
DESCRIPTION: Convention Sales is primarily responsible for generating and/or assisting with qualified leads, with the objective of booking meetings, convention or tradeshows tied to over-night stays. In addition to aggressively uncovering new potential clients, the Sales Department insures that existing client relationships are nurtured and maintained, thus securing continued future business. These relationships are enhanced by regularly scheduled sales calls, visits, and participation in industry related events. The RSCVA sales team will continue to promote Reno-Tahoe as a premier meeting, convention and trade show destination. The focus of our sales team continues to be towards, but not limited to, associations, corporations, tradeshow management companies and third party meeting planners.
STAFF: The Convention Sales department consists of twenty full-time positions – Vice President of Convention Sales, Assistant Director of Convention Sales, eleven Sales Managers, Sales Coordinator, five Sales Support Assistants, and an Executive Sales Administrator. Sales efforts are concentrated on the RSCC, REC, RSLEC and our Hotel Partners. A variety of facilities allows the sales staff to prospect a number of different meetings and event types. FISCAL YEAR 2008-2009 OBJECTIVES:
• Continue to position Reno-Tahoe as a premier meeting and convention destination.
• Continue working with the Reno-Tahoe hotel community, developing new meeting and convention business.
• Continue to develop new RSCC, REC, NBS and RSLEC users. • Book room nights for current and future years consistent with Strategic
Plan sales goals and the Marketing plan (one citywide per month). Citywide events are defined as utilizing a minimum of 2,500 room
nights and two or more hotels. • Develop “Extend Your Stay” program.
The department’s progress will continue to be tracked on a monthly basis, reporting prospecting calls, solicitation calls, leads and definite room nights booked. Definite bookings continue to be ratified based on utilization of the Booking Validation Form.
Page 170
RENO-SPARKS CONVENTION AND VISITORS AUTHORITY FISCAL 2008-2009 ANNUAL FORECAST AND CAPITAL BUDGET
CONVENTION SALES CONTINUED
The following will highlight the major elements of the Sales budget submittal: Operating Expenses:
• Payroll and Related: Decreasing due to the reallocation of the wages for the Vice President of Marketing and Tourism to the Marketing and Tourism Sales budgets.
• Contractual Services: Increase related to hiring Trend Analysis Projections (TAP) to do monthly pace reports.
• Travel and Entertainment: This area is projected to increase as a result of full staffing and Sales Managers traveling every six weeks, in addition to the Vice President of Convention Sales traveling every four to six weeks. There will also be additional sales familiarization tours and the conducting of more super site visits.
• Promotions: Budget is up due to the re-supplying show giveaways. • Promotional Material: Reflects an increase due to additional giveaways
for Sales Missions and tradeshows. • Brochures: Reflects an increase as it relates to the printing of the
“Extend Your Stay”, Convention Planner and Visitor Planner brochures.
• Familiarization Tours/Site Inspections: Reflects an increase due to the Convention Sales hosting a post familiarization trip for Meeting Planner International (MPI) attendees.
• New Market Productions: Reflects an increase due to the Convention Sales department hosting more super site visits of potential clients.
FINANCIAL DEPARTMENTAL DETAIL: The following pages detail the departmental line items for the current year budget compared to prior year outlook.
Page 171

RENO-SPARKS CONVENTION AND VISITORS AUTHORITY FISCAL 2008-2009 ANNUAL FORECAST AND CAPITAL BUDGET
CONVENTION SALES CONTINUED
FY 2008-2009 CONVENTION SALES ROOM NIGHT GOALS
Reno-Sparks Convention Center/Reno Event Center 2008-2009 16,704 2009-2010 43,646 2010-beyond 194.520
TOTAL 254,870
Hotels 2008-2009 23,323 2009-2010 42,759 2010-beyond 43,148
TOTAL 109,230
Grand Totals 2008-2009 40,027 2009-2010 86,405 2010 - beyond 237,668
Total proposed pending Sales & Marketing committee review 05-06-08
364,100
Page 172

Account Budget OutlookDescription Totals FY 07-08 Amount % Percent
Payroll and RelatedConvention Sales 2,092,088 2,186,193 (94,105) -4.3%Convention Services 174,254 163,545 10,709 6.5%
Total Payroll and Related 2,266,342 2,349,738 (83,396) -3.5%
Supplies and ServicesConvention Sales 230,430 241,785 (11,355) Convention Services 32,200 12,121 20,079 165.7%
Total Supplies and Services 262,630 253,906 8,724 3.4%
Travel and EntertainmentConvention Sales 346,010 293,581 52,429 17.9%Convention Services 15,000 12,718 2,282 17.9%
Total Travel and Entertainment 361,010 306,299 54,711 17.9%
Promotion and AdvertisingConvention Sales 455,120 585,392 (130,272) -22.3%Convention Services 21,600 17,360 4,240 24.4%
Total Promotion and Advertising 476,720 602,752 (126,032) -20.9%
Capital OutlayConvention Sales 25,500 26,092 (592) -2.3%
Reno-Sparks Convention and Visitors AuthorityFiscal 2008-2009 Annual Forecast and Capital Budget
Convention Sales - Summary
Increase (Decrease)
, , ( )Convention Services - - - 0.0%
Total Capital Outlay 25,500 26,092 (592) -2.3%
Special ProjectsConvention Sales 490,032 281,573 208,459 74.0%Convention Services - - - 0.0%
Total Special Projects 490,032 281,573 208,459 74.0%
Total Expenditures 3,882,234 3,820,360 61,874 1.6%
Miscellaneous RevenuesConvention Sales 162,000 135,609 26,391 19.5%Convention Services 65,968 71,418 (5,450) -7.6%
Total Miscellaneous Revenues 227,968 207,027 20,941 10.1%
Total Expenditures - Net 3,654,266 3,613,333 40,933 1.1%
Departmental TotalsConvention Sales 3,477,180 3,479,007 (1,827) -0.1%Convention Services 177,086 134,326 42,760 31.8%
Totals 3,654,266 3,613,333 40,933 1.1%
Page 173

B
udge
tFY
04-
05FY
05-
06FY
06-
07B
udge
tO
utlo
okFY
08-
09
R
even
ues
Con
vent
ion
Sal
es11
8,47
9
162,
126
20
0,48
9
159,
996
13
5,60
9
162,
000
C
onve
ntio
n S
ervi
ces
69,4
39
79
,759
93,4
38
82
,400
71,4
18
65
,968
Tota
l Rev
enue
s18
7,91
8
241,
885
29
3,92
7
242,
396
20
7,02
7
227,
968
Expe
nses
Payr
oll &
Rel
ated
Con
vent
ion
Sal
es1,
241,
530
1,29
1,65
8
1,
927,
394
2,30
4,42
0
2,
186,
193
2,09
2,08
8
C
onve
ntio
n S
ervi
ces
99,1
28
11
4,56
5
143,
134
17
0,26
3
163,
545
17
4,25
4
Con
vent
ion
Sale
sC
onso
lidat
ed S
umm
ary
Fisc
al 2
008-
2009
Ann
ual F
orec
ast a
nd C
apita
l Bud
get
Des
crip
tion
Acc
ount
A
ctua
lFY
07-
08
Tota
l Pay
roll
& R
elat
ed1,
340,
658
1,40
6,22
3
2,
070,
528
2,47
4,68
3
2,
349,
738
2,26
6,34
2
Supp
lies
& S
ervi
ces
Con
vent
ion
Sal
es15
8,72
8
137,
148
27
0,14
1
171,
993
24
1,78
5
230,
430
C
onve
ntio
n S
ervi
ces
9,99
3
10,8
53
2,
009
12
,100
12,1
21
32
,200
Tota
l Sup
plie
s &
Ser
vice
s16
8,72
1
148,
001
27
2,15
0
184,
093
25
3,90
6
262,
630
Tr
avel
& E
nter
tain
men
tC
onve
ntio
n S
ales
139,
162
17
9,48
8
256,
975
46
0,79
5
293,
581
34
6,01
0
Con
vent
ion
Ser
vice
s-
4
-
18
,600
12,7
18
15
,000
Tota
l Tra
vel &
Ent
erta
inm
ent
139,
162
17
9,49
2
256,
975
47
9,39
5
306,
299
36
1,01
0
Prom
otio
n &
Adv
ertis
ing
Con
vent
ion
Sal
es49
7,43
0
465,
301
47
7,77
0
385,
583
58
5,39
2
455,
120
C
onve
ntio
n S
ervi
ces
3,63
5
8,09
5
-
21
,400
17,3
60
21
,600
Tota
l Pro
mot
ion
& A
dver
tisin
g50
1,06
5
473,
396
47
7,77
0
406,
983
60
2,75
2
476,
720
Page 174
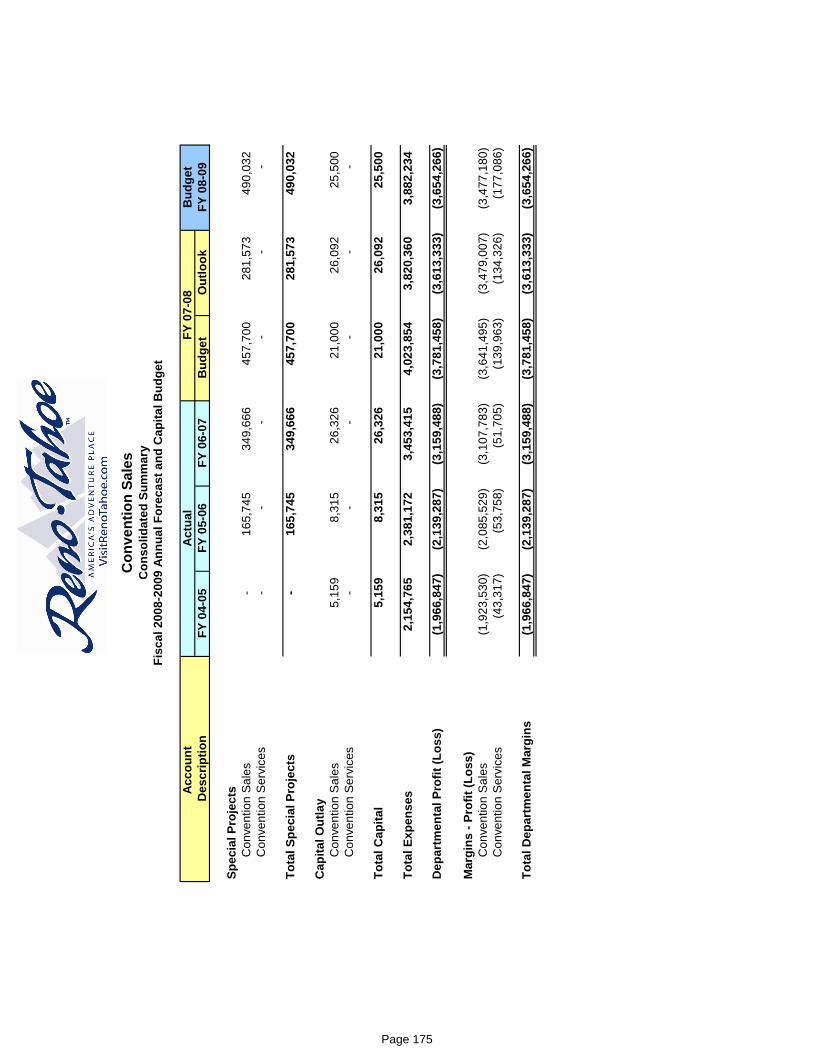
B
udge
tFY
04-
05FY
05-
06FY
06-
07B
udge
tO
utlo
okFY
08-
09
Con
vent
ion
Sale
sC
onso
lidat
ed S
umm
ary
Fisc
al 2
008-
2009
Ann
ual F
orec
ast a
nd C
apita
l Bud
get
Des
crip
tion
Acc
ount
A
ctua
lFY
07-
08
Spec
ial P
roje
cts
C
onve
ntio
n S
ales
-
16
5,74
5
349,
666
45
7,70
0
281,
573
49
0,03
2
Con
vent
ion
Ser
vice
s-
-
-
-
-
-
Tota
l Spe
cial
Pro
ject
s-
16
5,74
5
349,
666
45
7,70
0
281,
573
49
0,03
2
Cap
ital O
utla
yC
onve
ntio
n S
ales
5,15
9
8,31
5
26,3
26
21
,000
26,0
92
25
,500
Con
vent
ion
Ser
vice
s-
-
-
-
-
-
Tota
lCap
ital
515
98
315
2632
621
000
2609
225
500
Tota
l Cap
ital
5,15
9
8,
315
26,3
26
21,0
00
26,0
92
25,5
00
Tota
l Exp
ense
s2,
154,
765
2,38
1,17
2
3,
453,
415
4,02
3,85
4
3,
820,
360
3,88
2,23
4
Dep
artm
enta
l Pro
fit (L
oss)
(1,9
66,8
47)
(2
,139
,287
)
(3,1
59,4
88)
(3
,781
,458
)
(3,6
13,3
33)
(3
,654
,266
)
Mar
gins
- Pr
ofit
(Los
s)C
onve
ntio
n S
ales
(1,9
23,5
30)
(2,0
85,5
29)
(3,1
07,7
83)
(3,6
41,4
95)
(3,4
79,0
07)
(3,4
77,1
80)
Con
vent
ion
Ser
vice
s(4
3,31
7)
(5
3,75
8)
(5
1,70
5)
(1
39,9
63)
(1
34,3
26)
(1
77,0
86)
Tota
l Dep
artm
enta
l Mar
gins
(1,9
66,8
47)
(2
,139
,287
)
(3,1
59,4
88)
(3
,781
,458
)
(3,6
13,3
33)
(3
,654
,266
)
Page 175

Object Account Account Budget Outlook# # Description Totals FY 07-08 Amount % Percent
03 Payroll and Related0301 Wages - Management 1,461,454 1,621,187 (159,733) -9.9%0305 Temporary Personnel Services - 1,152 (1,152) -100.0%0308 Wages - Casual No PERS - 2,718 (2,718) -100.0%0311 Group Insurance 174,000 160,819 13,181 8.2%0312 Retirement Expense 294,474 317,626 (23,152) -7.3%0313 Industrial Insurance 8,768 8,633 135 1.6%0317 FICA/Medicare 21,192 23,262 (2,070) -8.9%0320 Clothing & Uniform Expense - - - 0.0%0321 Employee Training - - - 0.0%0327 Insurance Contribution - - - 0.0%0380 Vehicle Allowances 7,200 12,000 (4,800) -40.0%0382 Bonus/Incentive Pay 100,000 23,961 76,039 317.3%0385 Moving Expense 25,000 2,574 22,426 871.3%0386 Employee Tuition - - - 0.0%0399 Miscellaneous Employee Expense - 12,261 (12,261) -100.0%
Total Payroll and Related 2,092,088 2,186,193 (94,105) -4.3%
04 Supplies and Services0410 Office Supplies Expenses 18,000 21,084 (3,084) -14.6%0415 Miscellaneous Supplies - - - 0.0%0420 Postage & Freight 42,000 54,235 (12,235) -22.6%0421 Communications 28,800 38,704 (9,904) -25.6%0422 Printing & Binding 36,000 38,852 (2,852) -7.3%0425 Fuel 2,450 100 2,350 2350.0%
Reno-Sparks Convention and Visitors AuthorityFiscal 2008-2009 Annual Forecast and Capital Budget
Convention Sales Fund 15050
Increase (Decrease)
, ,0433 All Vehicle Related Repairs - - - 0.0%0444 All Equipment related Repairs - - - 0.0%0460 Contractual Services (Representation) 70,600 42,417 28,183 66.4%0462 Equip. Lease & Maintenance Agmts. 9,096 9,824 (728) -7.4%0463 Insurance 3,482 3,482 - 0.0%0470 Miscellaneous Expenses 3,252 12,422 (9,170) -73.8%0471 Finance Charges 515 515 - 0.0%0473 Dues and Subscriptions 16,235 20,150 (3,915) -19.4%0499 CINET - - - 0.0%
Total Supplies and Services 230,430 241,785 (11,355) -4.7%
05 Travel and Entertainment0501 Travel and Lodging 224,864 208,140 16,724 8.0%0504 Registrations 22,205 23,490 (1,285) -5.5%0505 Local Transportation 1,925 3,916 (1,991) -50.8%0506 Entertainment 96,216 57,086 39,130 68.5%0507 Meeting Expenses 800 949 (149) -15.7%
Total Travel and Entertainment 346,010 293,581 52,429 17.9%
02 Capital Outlay0220 Minor Equipment 25,500 26,092 (592) -2.3%
Total Capital Outlay 25,500 26,092 (592) -2.3%
Page 176

Object Account Account Budget Outlook# # Description Totals FY 07-08 Amount % Percent
Reno-Sparks Convention and Visitors AuthorityFiscal 2008-2009 Annual Forecast and Capital Budget
Convention Sales Fund 15050
Increase (Decrease)
06 Promotion and Advertising0601 Hospitality 52,595 74,740 (22,145) -29.6%0603 Booth Expense 53,799 135,201 (81,402) -60.2%0604 Exhibit Space Rental 97,893 94,121 3,772 4.0%0605 Brochures 20,000 - 20,000 100.0%0606 Promotional Materials 32,333 29,243 3,090 10.6%0615 Other Advertising - 95,000 (95,000) -100.0%0620 Familiarization Tours/Site Inspections 155,000 150,426 4,574 3.0%0627 Website Design 10,000 - 10,000 100.0%0630 Promotions 23,000 4,075 18,925 464.4%0632 New Market Productions 10,500 2,586 7,914 306.0%0645 Video Production - - - 0.0%0670 Special Events Advertising - - - 0.0%0697 Local Convention Update - - - 0.0%
Total Promotion and Advertising 455,120 585,392 (130,272) -22.3%
07 Special Projects0720 Other Community Projects - - - 0.0%0727 Site fees - - - 0.0%0730 Special Promotions 490,032 281,573 208,459 74.0%
Total Special Projects 490,032 281,573 208,459 74.0%
Total Expenses 3,639,180 3,614,616 24,564 0.7%
RevenuesR360 Miscellaeous Revenues 162,000 135,609 26,391 19.5%R400 Convention Services Revenues - - - 0.0%
Total Revenues 162,000 135,609 26,391 19.5%
Total Expenditures and Uses 3,477,180 3,479,007 (1,827) -0.1%
Page 177
RENO-SPARKS CONVENTION AND VISITORS AUTHORITY
FISCAL 2008-2009 ANNUAL FORECAST AND CAPITAL BUDGET
CONVENTION SERVICES DESCRIPTION: Convention Services provides registration clerks and other support personnel as needed by convention/meeting clients as well as collateral materials for all booked groups, as requested, to assist in the promotion Reno- Tahoe as the destination for their event. STAFF: Convention Services consists of two full-time Convention Services Managers. In addition, there are 26 casual on-call registration clerks. There is no consideration at this time to increase the number of registration clerks. FISCAL YEAR 2008-2009 OBJECTIVES:
• Continue to contact clients who have booked through the sales team in advance of their convention/meeting through electronic methods to ensure a feeling of trust, confidence, and concern that their event is most successful.
• Research clients electronically booked outside the sales team in order to provide the same courtesies, promote the destination, and help generate revenue by means of the registration clerks.
• Develop relationship with hotel partner Convention Services departments to promote registration clerks services.
• Create and promote the “Extend Your Stay Program”. Increase length of stay for convention attendees with assistance of brochures and attending previous conventions to promote attendance.
Revenues:
• Major revenues continue to be registration staffing. Additional revenue is generated from promotion of welcome packages for convention and meeting clients.
Payroll and Related:
• Two full-time employees for full year. Supplies and Services:
• Reflects an increase in shipping as a result of mailing “Extend Your Stay Brochure” as well convention and visitor planners.
Page 178

RENO-SPARKS CONVENTION AND VISITORS AUTHORITY
FISCAL 2008-2009 ANNUAL FORECAST AND CAPITAL BUDGET
CONVENTION SERVICES CONTINUED Travel and Entertainment:
• Travel expenses are included in this budget for FY 08-09. This will be for Convention Services to attend pre-year conventions to help increase attendance at future year conventions held in Reno.
• Entertainment has been added as in the past all entertainment costs were charged to Convention Sales.
Capital:
• No capital expenditures are expected for this department.
Promotion and Advertising:
• Promotional materials have been added to the budget to cover expenses related to the citywide “Welcome Packages”.
FINANCIAL DEPARTMENTAL DETAIL: The following pages detail the departmental line items for the current year budget compared to prior year outlook.
Page 179

Object Account Account Budget Outlook# # Description Totals FY 07-08 Amount % Percent
03 Payroll and Related0301 Wages - Management 92,778 80,549 12,229 15.2%0305 Temporary Personnel Services - - - 0.0%0308 Wages - Part-time- No PERS 41,897 48,628 (6,731) -13.8%0311 Group Insurance 14,400 10,618 3,782 35.6%0312 Retirement Expense 18,610 16,285 2,325 14.3%0313 Industrial Insurance 2,021 1,025 996 97.2%0317 FICA/Medicare 3,248 5,108 (1,860) -36.4%0320 Clothing & Uniform Expense 1,300 882 418 47.4%0321 Employee Training - 450 (450) -100.0%0382 Bonus/Incentive Pay - - - 0.0%0399 Miscellaneous Employee Expense - - - 0.0%
Total Payroll and Related 174,254 163,545 10,709 6.5%
04 Supplies and Services0410 Office Supplies Expenses - - - 0.0%0420 Postage & Freight 18,000 1,196 16,804 1405.0%0421 Communications - - - 0.0%0422 Printing & Binding 10,000 10,000 - 0.0%0434 Repairs - Office Equipment - - - 0.0%0470 Miscellaneous Expenses - - - 0.0%0471 Finance Charges - - - 0.0%0473 Dues and Subscriptions 4,200 925 3,275 354.1%
32,200 12,121 20,079 165.7%
Reno-Sparks Convention and Visitors AuthorityFiscal 2008-2009 Annual Forecast and Capital Budget
Convention ServicesFund 15063
Increase (Decrease)
, , ,
05 Travel and Entertainment0501 Travel and Lodging 13,440 12,621 819 6.5%0504 Registrations - - - 0.0%0505 Local Transportation - 97 (97) -100.0%0506 Entertainment 1,560 - 1,560 100.0%
Total Travel and Entertainment 15,000 12,718 2,282 17.9%
02 Capital Outlay0220 Minor Equipment - - - 0.0%
Total Capital Outlay - - - 0.0%
06 Promotion and Advertising0601 Hospitality - - - 0.0%0603 Booth Expense 6,600 6,060 540 8.9%0605 Brochures - - - 0.0%0606 Promotional Materials 15,000 11,300 3,700 32.7%0615 Other Advertising - - - 0.0%
Total Promotion and Advertising 21,600 17,360 4,240 24.4%
Page 180

Object Account Account Budget Outlook# # Description Totals FY 07-08 Amount % Percent
Reno-Sparks Convention and Visitors AuthorityFiscal 2008-2009 Annual Forecast and Capital Budget
Convention ServicesFund 15063
Increase (Decrease)
07 Special Projects0730 Special Promotions - - - 0.0%
Total Special Projects - - - 0.0%
Total Expenditures and Uses 243,054 205,744 37,310 18.1%
RevenuesR360 Miscellaneous Revenues - - - 0.0%R400 Convention Services Revenues 65,968 71,418 (5,450) -7.6%
Total Revenues 65,968 71,418 (5,450) -7.6%
Net Departmental Expenses 177,086 134,326 42,760 31.8%
Page 181

RENO-SPARKS CONVENTION AND VISITORS AUTHORITY FISCAL 2008-2009 ANNUAL FORECAST AND CAPITAL BUDGET
TOURISM SALES
DESCRIPTION: The Tourism Sales Department promotes Washoe County (Reno, Sparks and North Lake Tahoe area) as a tourist destination to travel agents, international and domestic tour operators, motor coach operators, airlines, and consumers. The department facilitates sales, marketing and promotional activities with the Reno-Tahoe hospitality community to attract leisure visitors and groups to the area. STAFF: The Tourism Sales Department currently has five full-time positions – Executive Director, two Sales Managers (responsible for Outdoor Activities, Tour Operators/Wholesale and Golf, Special Projects, and drive market including motor coach and travel agency segment), one Event Coordinator and an administrative assistant. This budget reflects the addition of another sales manager who will manage the international segment as well as 50% of the salary and benefits of the Vice President of Marketing and Tourism (which were in Convention Sales in FY 07-08). FISCAL YEAR 2008-2009 OBJECTIVES:
• Increase frequent independent traveler (FIT) visitation to the destination as well as room night production through improved market penetration and market share:
Be proactive in positioning Reno-Tahoe on each wholesaler’s website.
Proactively pursue ski and golf groups through ski councils and golf membership clubs.
• Continue to align the destination with strategic partners and leverage co-operative advertising opportunities:
Develop an aggressive cooperative marketing campaign with existing and new partners to impact spring, summer, fall and winter bookings.
• Continue to support existing leisure markets for Reno-Tahoe, yet aggressively pursue new markets:
Research and attend new trade shows such as ITB, Bank Travel, Addison Travel Shows, Rendezvous, etc.
• Concentrate and continually educate core markets (drive market) to the benefits of visiting “America’s Adventure Place.”
• Cooperate with the local hospitality community to capitalize on overall travel industry market potential and uphold the integrity of each stakeholder’s rate structure.
• Continue to fine tune and manage a true room night tracking mechanism for FIT (traditional tour operators/wholesalers and online companies) and identify specific average daily rates for each segment.
Page 183

RENO-SPARKS CONVENTION AND VISITORS AUTHORITY
FISCAL 2008-2009 ANNUAL FORECAST AND CAPITAL BUDGET
TOURISM SALES CONTINUED FISCAL YEAR 2008-2009 OBJECTIVES (continued):
• Create special events to entice all market segments to visit Reno-Tahoe. • Continue to develop and expand the international market and take
advantage of the weak US dollar relative to other currencies. Develop drive itineraries and educate foreign travel agents and wholesale operators on the connecting flights into Reno-Tahoe International Airport from major international airports throughout the western US.
• Create and develop “packages” utilizing all product segments to extend length of stay and offer “hassle free” vacation planning.
• Establish the importance - nationally and internationally - of outdoor activities, opportunities, and culture and heritage tourism as key product lines, as we position Reno-Tahoe as “America’s Adventure Place.”
• Continue to promote Reno-Tahoe as a regional destination to attract international visitors.
• Continue to aggressively attract leisure conventions to our region such as National Tour Association in 2009 and solicit events like Mountain Travel Symposium, Ski Tops, NAJ, and Go West Summit.
This proposed budget is 33.6% higher compared to last year as the total expenditures and uses total $1,491,890 compared to FY 07-08 outlook of $1,117,009. Overview of Difference Variance from FY 07-08 Outlook: +33.6% or $374,881.
• $100,000 reserve for National Tour Association 2009. • 50% of the salary and benefits for the Vice-President of Marketing and
Tourism that migrated from Convention Sales. • Salary and benefits for new International Market Sales Manager. • $15,000 for new TIS bonus plan. • $22,492 for travel expenses related to new International Market Sales
Manager and Vice-President of Marketing and Tourism. • $8,697 in additional tour and travel advertising funds.
Page 184

RENO-SPARKS CONVENTION AND VISITORS AUTHORITY
FISCAL 2008-2009 ANNUAL FORECAST AND CAPITAL BUDGET
TOURISM SALES CONTINUED Payroll and Related (0301-0399):
• Increase of 43.1% due to addition of International Sales Manager and the migration of 50% of the salary and benefits of the Vice-President of Marketing and Tourism from Convention Sales. Payroll also includes a new proposed TIS bonus plan.
Supplies and Services (0410-0473):
• Decreases by (-9.8%) year over year. Travel and Entertainment (0501-0507):
• Projecting a 15.1% increase for travel and entertainment. • To remain competitive in the marketplace, it is extremely important to be
visible at industry events, continue to educate and promote Reno-Tahoe with formal presentations at wholesalers’ reservation offices, product launches, consumer and trade shows. We plan to attend the major industry shows (IACVB, ESTO, E-Tourism, WACVB, NTA, ASTA, CITM, WTM, USTOA, ABA, MTS, Ski Tops, RSA, NAJ and Pow Wow), coordinate promotions at our wholesaler’s reservation offices (American Airlines Vacations, America West Vacations, Certified, GoGo, Mark Travel, Expedia, Hotels.com, Travelocity, JetAway, Trip Reservations, and Alaska Airlines Vacations) as well as their respective product launches where we have an opportunity to speak directly with each company’s top producing travel agencies. We will continue to participate in golf and ski shows promoting Reno-Tahoe to direct consumers. We will continue to be pro-active developing new customers and products for our region.
Promotion and Advertising (0601-0675):
• Projecting a 9.9% increase overall for Promotion and Advertising – TIS added an additional $8,697 to the Tour and Travel Advertising line bringing the total to $100,000. We are proposing three campaigns (summer, late fall, and spring) with our wholesalers where TIS would fund approximately $33,000 per campaign and invite the stakeholders to join the cooperative campaigns to grow the initial buy and extend the promotion. We will look to expand our participation in key international and domestic tradeshows, and therefore our promotional materials line is projected to increase by $11,348, as well as our booth expense by $5,837.
Page 185

RENO-SPARKS CONVENTION AND VISITORS AUTHORITY FISCAL 2008-2009 ANNUAL FORECAST AND CAPITAL BUDGET
TOURISM SALES CONTINUED
Highlights – Definition of line items
• Hospitality (0601) – We cater food & beverage for the reservation agents when we give and coordinate presentations at our partner’s reservation centers. These are the front line agents and it makes a huge impact to feed them and provide promo items for them to remember to sell Reno-Tahoe. We invite the hotel community to join us at these presentations and to share the cost and the wholesaler will declare it “Reno-Tahoe Day” at the center. Hospitality also covers the F&B at industry events the RSCVA sponsors.
• Booth Expense/Exhibit Space Rental (0603/0604) – These are the costs associated with exhibitor services, material handling, décor, AV, promo items related to specific events as well as the actual cost of the booth.
• Brochures (0605) – Design and development of individual brochures for specific events such as NTA, ABA, Pow Wow, World Travel Market, travel agency certification program, niche markets and golf/ski/adventure packages.
• Promotional Items (0606) – These are logo items that we present to reservation agents, travel agents, direct consumers, tour operators, airlines, etc. to promote our area. The items range from nice golf shirts/hats to carabineers, back packs, mouse pads, coffee mugs, golf balls/tees, pens, plastic bags, sticky note pads and water bottles. We also need to update our displays, pop ups, table cloths and banners this upcoming year.
• Tour and Travel Advertising (0614) – These dollars support marketing campaigns with our traditional major leisure partners (i.e. Alaska Airlines Vacations, American Airlines Vacations, US Airways, Mark Travel, Expedia, Travelocity, etc.). These campaigns are targeted to impact bookings during off peak travel into Reno-Tahoe. TIS would like to participate in three major leisure marketing campaigns with our partners to impact spring, fall and winter bookings. All of our campaigns will be cooperative campaigns with our stake holders.
• Other Advertising (0615) – These dollars support the less traditional segment (niche), ski trade publications, wholesaler brochures, Fun Train, advertising at golf or ski consumer shows, etc.
• Familiarization Tours (0620) – TIS hosts two major FAM events, one in the winter and one in the summer, where we showcase our region to existing as well as potential clients. This year we have also hosted smaller FAM trips for Aloha Airlines, Go Go, American Airlines Vacations, AAA, America West Airlines, and various travel writers and travel agencies that
Page 186

RENO-SPARKS CONVENTION AND VISITORS AUTHORITY FISCAL 2008-2009 ANNUAL FORECAST AND CAPITAL BUDGET
TOURISM SALES CONTINUED
sell or will sell Reno-Tahoe. Due to the fact that we are hosting more FAMS than in the past we will budget an increase of 5.5% compared to the Outlook for FY 07-08.
• Promotions (0630) – These dollars are set aside to sponsor events such as Nevada Night at NTA, the Governor’s Conference on Tourism, various airline golf events, major sponsorship of wholesale product launches, Ski Tops and Mountain Travel Symposium sponsorship where we have an opportunity to promote Reno-Tahoe to an exclusive group of buyers to increase visitation to our area. We are projecting an increase of 5.3%. New Market Promotions (0632) – These dollars support the creation of incremental room nights from either new or untraditional cities or market segments. This line item enables TIS to attend new trade shows (ITB, Rendezvous, new wholesaler product launches, etc.). We are projecting an increase of 4.6% from the FY 07-08 outlook.
Special Projects: • This section of the budget is projecting an increase of 149.8% which is the
$100,000 reserve for National Tour Association in 2009 under Other Community Projects below.
• Special Promotions (0730) – These dollars support events, opportunities, and projects to promote Reno-Tahoe to attract incremental visitors. For example, we will organize sales missions or road trips where we visit areas with sales calls and special events where we invite local travel agencies, wholesalers, and media to attend. Reno-Tahoe Nights where the RSCVA and community partners travel to selected cities to host travel agencies, wholesalers, airlines, and their most coveted customers showcasing Reno-Tahoe as a new destination for them to visit or sell. We have stepped up our participation with our major leisure partners to not just being an attendee with a booth but a major sponsor at various events allowing us the opportunity to actually promote Reno-Tahoe to a targeted audience such as the US Airways product launches on the east coast, Mountain Travel Symposium, Ski Tops, Go Go Worldwide Vacations, Funjet, RSA, NAJ, etc. We project the special promotions line to increase slightly by 4.2%.
• Other Community Projects (0720) - $100,000 reserve for National Tour Association Convention to be held in Reno in 2009.
Page 187
RENO-SPARKS CONVENTION AND VISITORS AUTHORITY FISCAL 2008-2009 ANNUAL FORECAST AND CAPITAL BUDGET
TOURISM SALES CONTINUED
Revenues (R360):
• The majority of the revenues collected by Tourism Sales are through co-op opportunities where the hotel/attractions help out on the cost of certain events. Example – We promote Reno-Tahoe at seven major golf shows throughout the year. The RSCVA is responsible for the planning/development of the various shows including a 20’ by 20’ golf banner that highlights the major golf courses, golf balloon, etc. We encourage the properties/golf courses to join us at these shows to promote the area at a cost that is divided equally among the partners. The hotels participate in cooperative marketing campaigns that result in revenue for the RSCVA. TIS is projecting this line item to decrease by (-4.5%) from the FY 07-08 outlook.
FINANCIAL DEPARTMENTAL DETAIL The following pages detail the departmental line items for the current year budget, compared to prior year outlook.
Page 188

Account Budget OutlookDescription Totals FY 07-08 Amount % Percent
Payroll and RelatedTourism Sales 750,802 524,781 226,021 43.1%
Total Payroll and Related 750,802 524,781 226,021 43.1%
Supplies and ServicesTourism Sales 70,725 78,441 (7,716) -9.8%
Total Supplies and Services 70,725 78,441 (7,716) -9.8%
Travel and EntertainmentTourism Sales 144,158 125,253 18,905 15.1%
Total Travel and Entertainment 144,158 125,253 18,905 15.1%
Capital OutlayTourism Sales 3,000 8,282 (5,282) -63.8%
Total Capital Outlay 3,000 8,282 (5,282) -63.8%
Promotion and AdvertisingTourism Sales 413,705 376,548 37,157 9.9%
Total Promotion and Advertising 413,705 376,548 37,157 9.9%
Special ProjectsTourism Sales 171,500 68,649 102,851 149.8%
Total Special Projects 171,500 68,649 102,851 149.8%
Total Expenditures and Uses 1,553,890 1,181,954 371,936 31.5%
Reno-Sparks Convention and Visitors AuthorityFiscal 2008-2009 Annual Forecast and Capital Budget
Tourism Sales - Summary
Increase (Decrease)
Page 189

B
udge
tFY
04-
05FY
05-
06FY
06-
07B
udge
tO
utlo
okFY
08-
09
R
even
ues
Tour
ism
Sal
es69
,279
58,6
32
76
,375
65,0
00
64
,945
62,0
00
Tota
l Rev
enue
s69
,279
58
,632
76
,375
65
,000
64,9
45
62,0
00
Expe
nses
Payr
oll &
Rel
ated
Tour
ism
Sal
es57
9,30
3
619,
937
61
2,98
8
528,
821
52
4,78
1
750,
802
Tota
l Pay
roll
& R
elat
ed57
9,30
3
619,
937
61
2,98
8
528,
821
52
4,78
1
750,
802
Supp
lies
& S
ervi
ces
Tour
ism
Sal
es56
,487
56,1
75
59
,271
70,5
76
78
,441
70,7
25
Tour
ism
Sal
esC
onso
lidat
ed S
umm
ary
Fisc
al 2
008-
2009
Ann
ual F
orec
ast a
nd C
apita
l Bud
get
Des
crip
tion
Acco
unt
Actu
alFY
07-
08
Tota
l Sup
plie
s &
Ser
vice
s56
,487
56
,175
59
,271
70
,576
78,4
41
70,7
25
Trav
el &
Ent
erta
inm
ent
Tour
ism
Sal
es11
8,81
6
116,
876
10
0,54
6
125,
800
12
5,25
3
144,
158
Tota
l Tra
vel &
Ent
erta
inm
ent
118,
816
11
6,87
6
100,
546
12
5,80
0
125,
253
14
4,15
8
Prom
otio
n &
Adv
ertis
ing
Tour
ism
Sal
es26
7,20
4
413,
054
34
2,71
7
301,
698
37
6,54
8
413,
705
Tota
l Pro
mot
ion
& A
dver
tisin
g26
7,20
4
413,
054
34
2,71
7
301,
698
37
6,54
8
413,
705
Spec
ial P
roje
cts
Tour
ism
Sal
es78
,815
96,8
44
91
,936
71,5
00
68
,649
171,
500
Tota
l Spe
cial
Pro
ject
s78
,815
96
,844
91
,936
71
,500
68,6
49
171,
500
Cap
ital O
utla
yTo
uris
m S
ales
-
2,
082
1,
699
2,
000
8,
282
3,
000
Tota
l Cap
ital
-
2,08
2
1,
699
2,00
0
8,
282
3,00
0
Tota
l Exp
ense
s1,
100,
625
1,30
4,96
8
1,
209,
157
1,10
0,39
5
1,
181,
954
1,55
3,89
0
Dep
artm
enta
l Pro
fit (L
oss)
(1,0
31,3
46)
(1
,246
,336
)
(1,1
32,7
82)
(1
,035
,395
)
(1
,117
,009
)
(1,4
91,8
90)
Mar
gins
- Pr
ofit
(Los
s)To
uris
m S
ales
(1,0
31,3
46)
(1,2
46,3
36)
(1,1
32,7
82)
(1,0
35,3
95)
(1,1
17,0
09)
(1,4
91,8
90)
Tota
lDep
artm
enta
lMar
gins
(103
134
6)(1
246
336)
(113
278
2)(1
035
395)
(111
700
9)(1
491
890)
Tota
l Dep
artm
enta
l Mar
gins
(1,0
31,3
46)
(1
,246
,336
)
(1,1
32,7
82)
(1
,035
,395
)
(1
,117
,009
)
(1,4
91,8
90)
Page 190

Object Account Account Budget Outlook# # Description Totals FY 07-08 Amount % Percent
03 Payroll and Related0301 Wages - Management 547,203 376,642 170,561 45.3%0305 Temporary Personnel Services - 3,892 (3,892) -100.0%0308 Wages - Casual No PERS - - - 0.0%0311 Group Insurance 59,400 51,877 7,523 14.5%0312 Retirement Expense 110,130 74,935 35,195 47.0%0313 Industrial Insurance 2,737 1,994 743 37.3%0317 FICA/Medicare 7,932 5,641 2,291 40.6%0380 Vehicle Allowances 8,400 4,800 3,600 75.0%0382 Bonus/Incentive Pay 15,000 5,000 10,000 200.0%0385 Moving Expense - - - 0.0%0399 Miscellaneous Employee Expense - - - 0.0%
Total Payroll and Related 750,802 524,781 226,021 43.1%
04 Supplies and Services0410 Office Supplies Expenses 6,392 6,789 (397) -5.8%0420 Postage & Freight 19,400 19,662 (262) -1.3%0421 Communications 9,400 10,488 (1,088) -10.4%0422 Printing & Binding 5,821 4,836 985 20.4%0425 Fuel - - - 0.0%0462 Equip. Lease & Maintenance Agmts. 17,081 17,477 (396) -2.3%0470 Miscellaneous Expenses 2,000 2,456 (456) -18.6%0471 Finance Charges 75 75 - 0.0%0473 Dues and Subscriptions 10,556 16,658 (6,102) -36.6%
Reno-Sparks Convention and Visitors AuthorityFiscal 2008-2009 Annual Forecast and Capital Budget
Tourism SalesFund 15055
Increase (Decrease)
70,725 78,441 (7,716) -9.8%
05 Travel and Entertainment0501 Travel and Lodging 106,908 84,416 22,492 26.6%0504 Registrations 18,750 21,635 (2,885) -13.3%0505 Local Transportation 1,200 1,084 116 10.7%0506 Entertainment 15,800 17,400 (1,600) -9.2%0507 Meeting Expenses 1,500 718 782 108.9%
Total Travel and Entertainment 144,158 125,253 18,905 15.1%
02 Capital Outlay0211 Major Equipment - - - 0.0%0220 Minor Equipment 3,000 8,282 (5,282) -63.8%
Total Capital Outlay 3,000 8,282 (5,282) -63.8%
06 Promotion and Advertising0601 Hospitality 28,500 27,126 1,374 5.1%0602 Sales Representation - - - 0.0%0603 Booth Expense 59,500 53,663 5,837 10.9%0604 Exhibit Space Rental 40,655 40,162 493 1.2%0605 Brochures 16,300 15,906 394 2.5%0606 Promotional Materials 45,500 34,152 11,348 33.2%0614 Tour & Travel Advertising 100,000 91,303 8,697 9.5%0615 Other Advertising 5,500 3,365 2,135 63.4%0620 Familiarization Tours 65,000 61,623 3,377 5.5%0630 Promotions 36,250 34,436 1,814 5.3%0632 New Market Promotions 15,500 14,812 688 4.6%0645 Video Production 1,000 - 1,000 100.0%0675 Motel Marketing - - - 0.0%
Total Promotion and Advertising 413,705 376,548 37,157 9.9%
Page 191

Object Account Account Budget Outlook# # Description Totals FY 07-08 Amount % Percent
Reno-Sparks Convention and Visitors AuthorityFiscal 2008-2009 Annual Forecast and Capital Budget
Tourism SalesFund 15055
Increase (Decrease)
07 Special Projects0720 Other Community Projects 100,000 - 100,000 100.0%0730 Special Promotions 71,500 68,649 2,851 4.2%
Total Special Projects 171,500 68,649 102,851 149.8%
Total Expenses 1,553,890 1,181,954 371,936 31.5%
RevenuesR352 Registrations - - - 0.0%R360 Miscellaneous Revenues 62,000 64,945 (2,945) -4.5%R750 Cost Reimbursable - - - 0.0%
Total Revenues 62,000 64,945 (2,945) -4.5%
Total Expenditures and Uses 1,491,890 1,117,009 374,881 33.6%
Page 192

RENO-SPARKS CONVENTION AND VISITORS AUTHORITY FISCAL 2008-2009 ANNUAL FORECAST AND CAPITAL BUDGET
MARKETING
DESCRIPTION: The Marketing Department is responsible for planning, developing, and implementing all RSCVA marketing programs, including the Reno-Tahoe, America’s Adventure Place campaign, and all marketing efforts associated with the travel and convention segments, the Reno-Sparks Convention Center, Reno-Sparks Livestock Events Center, Reno Events Center, National Bowling Stadium, Northgate Golf Club and Wildcreek Golf Course. The Marketing Department also administers the RSCVA Special Events Funding Program. STAFF: Marketing is comprised of nine full-time positions – including an Executive Director of Marketing and Tourism, Assistant Director of Marketing, New Market Development and Visitor Services Manager, Internet Marketing Manager, Special Events Manager, Communications Manager, Marketing Coordinator, Marketing Copywriter, and an Administrative Assistant. Also, 50% of the salary and benefits of the Vice President of Marketing and Tourism has been moved from Convention Sales to Marketing. FISCAL YEAR 2008-2009 OBJECTIVES:
• Support the 5 year Strategic Plan of the RSCVA. • Support Convention Sales and Tourism Sales efforts. • Support RSCVA facilities marketing programs. • Continue “Reno-Tahoe, America’s Adventure Place” branding and
advertising efforts and grow awareness directed at leisure travelers in key geographic drive and fly markets.
• Improve the perception and image of Reno-Tahoe through public relations efforts and pushing the message of new development and renaissance within the destination.
• Further develop and expand the RSCVA Special Events Funding Program to support the development of new events, increase room nights and national marketing exposure for Reno-Tahoe.
• Continue to support and expand cooperative efforts with our destination and hotel property partners in both consumer and convention advertising.
• Continue to develop the destination website - VisitRenoTahoe.com - and expand the presence of Reno-Tahoe on leading travel related social media sites.
• Expand and refine research programs to identify opportunities for developing new geographic markets and expanding niche marketing segments to increase overall leisure and group business.
Page 193

RENO-SPARKS CONVENTION AND VISITORS AUTHORITY FISCAL 2008-2009 ANNUAL FORECAST AND CAPITAL BUDGET
MARKETING CONTINUED
The FY 08-09 Marketing Budget is projected to increase 0.8% compared to last year, as the expenditures and uses total $5,016,215 compared to the FY 07-08 Outlook of $4,977,663. Payroll and Related (0301-0399):
• An increase of 30.1% is expected in FY 08-09, Due to the migration of 50% of the salary and benefits of the Vice-President of Marketing and Tourism from Convention Sales. Also, the department was not at full staffing levels for FY 07-08 and is projected to be at full staffing levels in FY 08-09.
Supplies and Services (0410-0474):
• Projecting a 1.0% increase from the previous fiscal year, largely attributed to an increase in postage and freight and in dues and subscriptions.
Travel and Entertainment (0501-507):
• Projecting a (-12.1%) decrease for travel and entertainment through reduced participation in industry events and professional development opportunities.
Promotion and Advertising (0601-0683):
• Projecting a (-9.8%) decrease for Promotion and Advertising. The majority of this decrease is attributed to reductions in the following categories; one-time supplemental budget from last fiscal year ($300,900), Convention Advertising ($3,832), Broadcast Media ($75,082), and Consumer Print Media ($62,372).
• This line also includes a new expenditure of $75,000 for Advertising Agency Fees to increase the effectiveness and consistency of RSCVA advertising programs and overall marketing collateral.
Special Projects (0730-0731): • An increase of 37% is projected to implement the Special Events Funding
Program in FY 08-09. This includes direct funding of events through the program, networking and educational meetings of event organizers, and scholarships for event education programs.
• The increase is attributed to the funding of events that were contractually obligated to in FY 07-08. However, timing on the second payment of the contracts occurs in FY 08-09. The cost savings that occurred in FY 07-08 (through adjusting outlook totals) is equal to the increase proposed in this budget line.
Page 194

RENO-SPARKS CONVENTION AND VISITORS AUTHORITY FISCAL 2008-2009 ANNUAL FORECAST AND CAPITAL BUDGET
MARKETING CONTINUED
• The Marketing Department requests $50,000 to be allocated for marketing and other costs associated with organizing the 2009 WAC Basketball Tournament in partnership with the University of Nevada, Reno.
The following chart illustrates special project funding:
Actual FY 07-08 Budget
Special Event Funding FY 06-07 Budget Outlook FY 08-09
Legends Reno Tahoe Open
250,000
200,000
200,000
150,000
Reno River Festival
63,723
50,000
50,000
25,000
Commitments from Prior Year - - -
66,250
WAC Basketball Tournament - - -
50,000 Current Year Special Event Grants & Other Support
214,375
300,000
218,929
351,000
Total Special Event Funding
528,098
550,000
468,929
642,250
Capital Outlay- (0220-0275): • This line is projected to be down (3.6%) from the previous fiscal year.
Revenues (R360):
• The revenues collected by Marketing are through our photo site online, where we sell various photos of Reno-Tahoe. The Marketing Department is projecting an increase of 56.3% over FY 07-08 Outlook.
FINANCIAL DEPARTMENTAL DETAIL The following pages detail the departmental line items for the current year budget, compared to prior year outlook.
Page 195
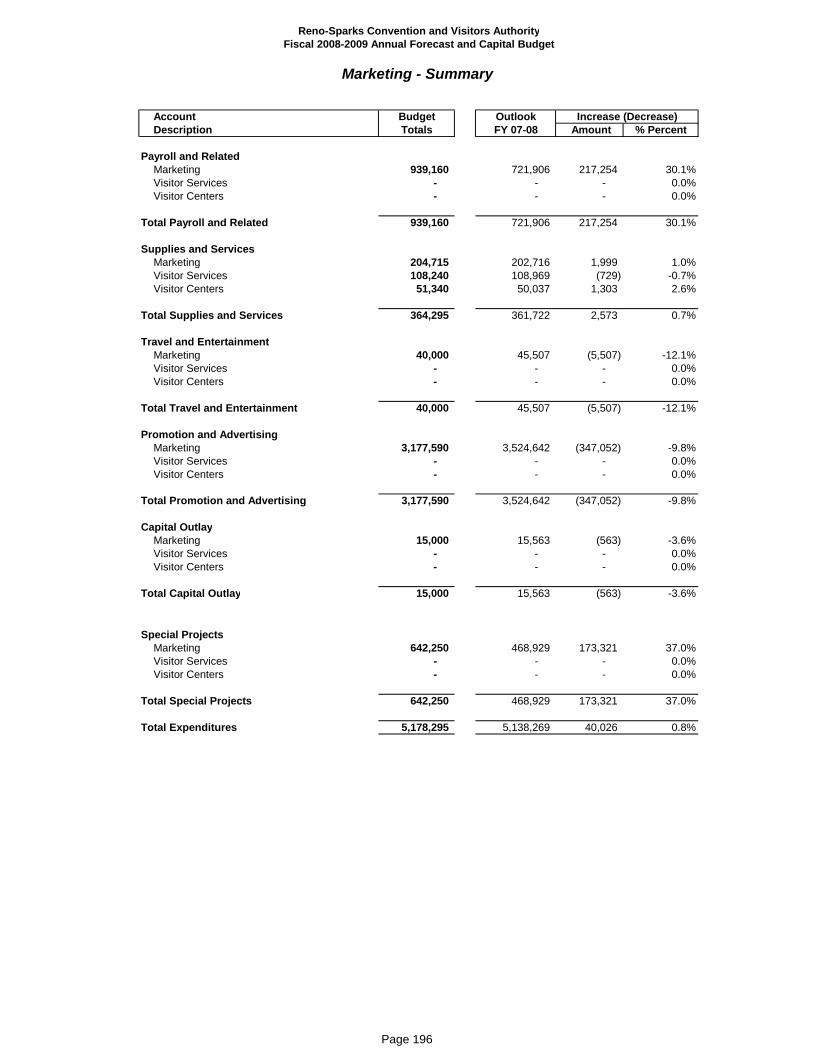
Account Budget OutlookDescription Totals FY 07-08 Amount % Percent
Payroll and RelatedMarketing 939,160 721,906 217,254 30.1%Visitor Services - - - 0.0%Visitor Centers - - - 0.0%
Total Payroll and Related 939,160 721,906 217,254 30.1%
Supplies and ServicesMarketing 204,715 202,716 1,999 1.0%Visitor Services 108,240 108,969 (729) -0.7%Visitor Centers 51,340 50,037 1,303 2.6%
Total Supplies and Services 364,295 361,722 2,573 0.7%
Travel and EntertainmentMarketing 40,000 45,507 (5,507) -12.1%Visitor Services - - - 0.0%Visitor Centers - - - 0.0%
Total Travel and Entertainment 40,000 45,507 (5,507) -12.1%
Promotion and AdvertisingMarketing 3,177,590 3,524,642 (347,052) -9.8%Visitor Services - - - 0.0%Visitor Centers - - - 0.0%
Reno-Sparks Convention and Visitors AuthorityFiscal 2008-2009 Annual Forecast and Capital Budget
Marketing - Summary
Increase (Decrease)
Total Promotion and Advertising 3,177,590 3,524,642 (347,052) -9.8%
Capital OutlayMarketing 15,000 15,563 (563) -3.6%Visitor Services - - - 0.0%Visitor Centers - - - 0.0%
Total Capital Outlay 15,000 15,563 (563) -3.6%
Special ProjectsMarketing 642,250 468,929 173,321 37.0%Visitor Services - - - 0.0%Visitor Centers - - - 0.0%
Total Special Projects 642,250 468,929 173,321 37.0%
Total Expenditures 5,178,295 5,138,269 40,026 0.8%
Page 196

Account Budget OutlookDescription Totals FY 07-08 Amount % Percent
Reno-Sparks Convention and Visitors AuthorityFiscal 2008-2009 Annual Forecast and Capital Budget
Marketing - Summary
Increase (Decrease)
Miscellaneous RevenuesMarketing 2,500 1,600 900 56.3%Visitor Services 16,060 16,070 (10) -0.1%Visitor Centers - - - 0.0%
Total Miscellaneous Revenues 18,560 17,670 890 5.0%
Total Expenditures - Net 5,159,735 5,120,599 39,136 0.8%
Departmental TotalsMarketing 5,016,215 4,977,663 38,552 0.8%Visitor Services 92,180 92,899 (719) -0.8%Visitor Centers 51,340 50,037 1,303 2.6%
Totals 5,159,735 5,120,599 39,136 0.8%
Page 197
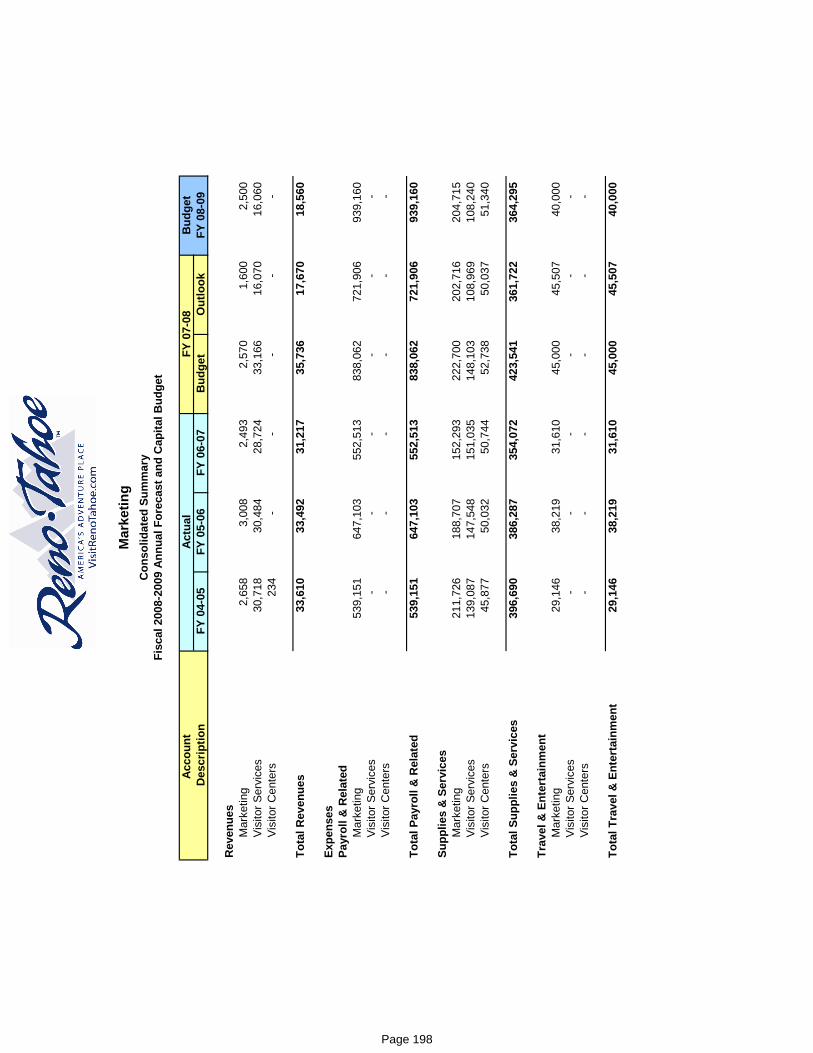
Bud
get
FY 0
4-05
FY 0
5-06
FY 0
6-07
Bud
get
Out
look
FY 0
8-09
Rev
enue
sM
arke
ting
2,65
8
3,00
8
2,49
3
2,57
0
1,60
0
2,50
0
Visi
tor S
ervi
ces
30,7
18
30
,484
28,7
24
33
,166
16,0
70
16
,060
Visi
tor C
ente
rs23
4
-
-
-
-
-
Tota
l Rev
enue
s33
,610
33,4
92
31
,217
35,7
36
17
,670
18,5
60
Expe
nses
Payr
oll &
Rel
ated
Mar
ketin
g53
9,15
1
647,
103
55
2,51
3
838,
062
72
1,90
6
939,
160
Vi
sito
r Ser
vice
s-
-
-
-
-
-
Mar
ketin
gC
onso
lidat
ed S
umm
ary
Fisc
al 2
008-
2009
Ann
ual F
orec
ast a
nd C
apita
l Bud
get
Des
crip
tion
Acco
unt
Actu
alFY
07-
08
Visi
tor C
ente
rs-
-
-
-
-
-
Tota
l Pay
roll
& R
elat
ed53
9,15
1
647,
103
55
2,51
3
838,
062
72
1,90
6
939,
160
Supp
lies
& S
ervi
ces
Mar
ketin
g21
1,72
6
188,
707
15
2,29
3
222,
700
20
2,71
6
204,
715
Vi
sito
r Ser
vice
s13
9,08
7
147,
548
15
1,03
5
148,
103
10
8,96
9
108,
240
Vi
sito
r Cen
ters
45,8
77
50
,032
50,7
44
52
,738
50,0
37
51
,340
Tota
l Sup
plie
s &
Ser
vice
s39
6,69
0
386,
287
35
4,07
2
423,
541
36
1,72
2
364,
295
Tr
avel
& E
nter
tain
men
tM
arke
ting
29,1
46
38
,219
31,6
10
45
,000
45,5
07
40
,000
Visi
tor S
ervi
ces
-
-
-
-
-
-
Visi
tor C
ente
rs-
-
-
-
-
-
Tota
l Tra
vel &
Ent
erta
inm
ent
29,1
46
38
,219
31,6
10
45
,000
45,5
07
40
,000
Page 198

Bud
get
FY 0
4-05
FY 0
5-06
FY 0
6-07
Bud
get
Out
look
FY 0
8-09
Mar
ketin
gC
onso
lidat
ed S
umm
ary
Fisc
al 2
008-
2009
Ann
ual F
orec
ast a
nd C
apita
l Bud
get
Des
crip
tion
Acco
unt
Actu
alFY
07-
08
Prom
otio
n &
Adv
ertis
ing
Mar
ketin
g2,
939,
675
2,75
4,41
6
2,
829,
642
3,18
0,00
0
3,
524,
642
3,17
7,59
0
Vi
sito
r Ser
vice
s-
-
-
-
-
-
Vi
sito
r Cen
ters
-
-
-
-
-
-
Tota
l Pro
mot
ion
& A
dver
tisin
g2,
939,
675
2,75
4,41
6
2,
829,
642
3,18
0,00
0
3,
524,
642
3,17
7,59
0
Spec
ial P
roje
cts
Mar
ketin
g88
7,33
5
842,
479
47
0,59
9
550,
000
46
8,92
9
642,
250
Vi
sito
r Ser
vice
s-
-
-
-
-
-
Vi
sito
r Cen
ters
-
-
-
-
-
-
Tota
l Spe
cial
Pro
ject
s88
7,33
5
842,
479
47
0,59
9
550,
000
46
8,92
9
642,
250
Cap
ital O
utla
yM
arke
ting
7,00
4
-
9,
729
12
,000
15,5
63
15
,000
Visi
tor S
ervi
ces
-
-
-
-
-
-
Visi
tor C
ente
rs-
-
-
-
-
-
Tota
l Cap
ital
7,00
4
-
9,
729
12
,000
15,5
63
15
,000
Tota
l Exp
ense
s4,
799,
001
4,66
8,50
4
4,
248,
165
5,04
8,60
3
5,
138,
269
5,17
8,29
5
Dep
artm
enta
l Pro
fit (L
oss)
(4,7
65,3
91)
(4
,635
,012
)
(4,2
16,9
48)
(5
,012
,867
)
(5
,120
,599
)
(5,1
59,7
35)
Mar
gins
- Pr
ofit
(Los
s)M
arke
ting
(4,6
11,3
79)
(4,4
67,9
16)
(4,0
43,8
93)
(4,8
45,1
92)
(4,9
77,6
63)
(5,0
16,2
15)
Visi
tor S
ervi
ces
(108
,369
)
(117
,064
)
(122
,311
)
(114
,937
)
(92,
899)
(92,
180)
Visi
tor C
ente
rs(4
5,64
3)
(5
0,03
2)
(5
0,74
4)
(5
2,73
8)
(5
0,03
7)
(5
1,34
0)
Tota
l Dep
artm
enta
l Mar
gins
(4,7
65,3
91)
(4
,635
,012
)
(4,2
16,9
48)
(5
,012
,867
)
(5
,120
,599
)
(5,1
59,7
35)
Page 199

Object Account Account Budget Outlook# # Description Totals FY 07-08 Amount % Percent
03 Payroll and Related0301 Wages - Management 676,956 524,691 152,265 29.0%0305 Wages-Temp - - - 0.0%0308 Wages - Casual No PERS 21,138 9,140 11,998 131.3%0311 Group Insurance 81,000 64,321 16,679 25.9%0312 Retirement Expense 137,749 105,632 32,117 30.4%0313 Industrial Insurance 3,142 2,436 706 29.0%0317 FICA/Medicare 10,775 8,391 2,384 28.4%0380 Vehicle Allowance 8,400 3,600 4,800 133.3%0385 Moving Expense - - - 0.0%0399 Miscellaneous Employee Expense - 3,695 (3,695) -100.0%
Total Payroll and Related 939,160 721,906 217,254 30.1%
Supplies and Services0410 Office Supplies Expenses 8,000 7,264 736 10.1%0415 Miscellaneous Supplies - - - 0.0%0420 Postage & Freight 7,500 5,401 2,099 38.9%0421 Communications 10,315 11,919 (1,604) -13.5%0422 Printing and Binding 3,000 2,398 602 25.1%0425 Fuel - - - 0.0%0433 All Vehicle Related Repairs - - - 0.0%0450 Prof Services - Legal - - - 0.0%0452 Prof Services - Other - - - 0.0%0460 Contractual Services 155,900 155,673 227 0.1%0462 Equip. Lease & Maintenance Agmts. 10,000 9,674 326 3.4%
Reno-Sparks Convention and Visitors AuthorityFiscal 2008-2009 Annual Forecast and Capital Budget
Marketing Fund 15060
Increase (Decrease)
q p g , ,0470 Miscellaneous Expenses 5,000 8,774 (3,774) -43.0%0471 Finance Charges - 40 (40) -100.0%0473 Dues and Subscriptions 5,000 1,573 3,427 217.9%0474 Licenses - - - 0.0%
Total Supplies and Services 204,715 202,716 1,999 1.0%
Travel and Entertainment0501 Travel and Lodging 19,000 30,656 (11,656) -38.0%0504 Registrations 8,000 8,454 (454) -5.4%0505 Local Transportation 2,000 1,189 811 68.2%0506 Entertainment 6,000 4,487 1,513 33.7%0507 Meeting Expenses 5,000 721 4,279 593.5%
Total Travel and Entertainment 40,000 45,507 (5,507) -12.1%
Page 200

Object Account Account Budget Outlook# # Description Totals FY 07-08 Amount % Percent
Reno-Sparks Convention and Visitors AuthorityFiscal 2008-2009 Annual Forecast and Capital Budget
Marketing Fund 15060
Increase (Decrease)
Promotion and Advertising0601 Hospitality 40,000 44,732 (4,732) -10.6%0603 Booth Expense 10,000 11,906 (1,906) -16.0%0605 Brochures - - - 0.0%0606 Promotional Materials 10,000 10,362 (362) -3.5%0611 Advertising Production 172,000 142,841 29,159 20.4%0613 Convention Advertising 450,000 453,832 (3,832) -0.8%0614 Tour & Travel Advertising - 7,575 (7,575) -100.0%0615 Other Advertising 264,000 261,765 2,235 0.9%0616 Special Event Advertising - - - 0.0%0617 Research & Visitors Surveys 200,000 199,797 203 0.1%0618 Advertising Agency Fees 75,000 - 75,000 100.0%0620 Fam Tours - - - 0.0%0622 Cooperative Advertising 200,000 200,000 - 0.0%0624 Ski Cooperative Advertising 98,000 97,500 500 0.5%0625 Tourism Advertising Productions 14,000 14,001 (1) 0.0%0626 Convention Advertising Productions 100,000 99,384 616 0.6%0627 Website Design 250,000 250,000 - 0.0%0630 Promotions 6,590 9,993 (3,403) -34.1%0640 Community Awareness Progr. 18,000 18,000 - 0.0%0662 Sport & Event Marketing - 300,900 (300,900) -100.0%0670 Special Events Advertising - 5,000 (5,000) -100.0%0671 Special Events Ad. Production 60,000 52,500 7,500 14.3%0675 Motel Marketing - - - 0.0%0680 Broadcast Media 550,000 625,082 (75,082) -12.0%0681 Outdoor Media 35,000 32,100 2,900 9.0%, , ,0682 Consumer Print Media 550,000 612,372 (62,372) -10.2%0683 Broadcast Production 75,000 75,000 - 0.0%
Total Promotion and Advertising 3,177,590 3,524,642 (347,052) -9.8%
07 Special Projects
0730 Special Promotions & Site Fees 241,250 418,929 (177,679) -42.4%0731 Special Events Promotions 401,000 50,000 351,000 702.0%
Total Special Projects 642,250 468,929 173,321 37.0%
02 Capital Outlay0220 Minor Equipment 15,000 15,563 (563) -3.6%0275 Software Purchases - - - 0.0%
Total Capital Outlay 15,000 15,563 (563) -3.6%
Total Expenditures and Uses 5,018,715 4,979,263 39,452 0.8%
RevenuesR360 Miscellaneous Revenues 2,500 1,600 900 56.3%
Total Revenues 2,500 1,600 900 56.3%
Net Departmental Expenses 5,016,215 4,977,663 38,552 0.8%
Page 201

RENO-SPARKS CONVENTION AND VISITORS AUTHORITY FISCAL 2008-2009 ANNUAL FORECAST AND CAPITAL BUDGET
VISITOR SERVICES
DESCRIPTION: The Reno-Tahoe call center will continue to be outsourced. STAFF: Not applicable. FISCAL YEAR 2008-2009 OBJECTIVES:
• To provide customer service and answer questions about the destination through a variety of 800 numbers.
• To refer potential visitors to hotels/motels for accommodations, or refer to Silver Voyages for lodging and activity packages.
• Refer potential visitors to visitrenotahoe.com. • Develop additional visitor services programs to extend the length of stay
and frequency of visitation to the destination. • To collect name, email, and address information to enhance our database
for future marketing initiatives. Payroll and Related:
• Not Applicable Supplies and Services:
• 0420 - Postage and Freight: Expense of sending out Visitor Planners.
• 0421 - Communications: Toll Free numbers and use expense. • 0460 - Contractual Services: Answer West Contract. • 0470 - Misc. Expenses.
Travel and Entertainment:
• Not Applicable Capitol Outlay:
• Not Applicable FINANCIAL DEPARTMENTAL DETAIL: The following pages detail the departmental line items for the current year budget compared to prior year outlook.
Page 202
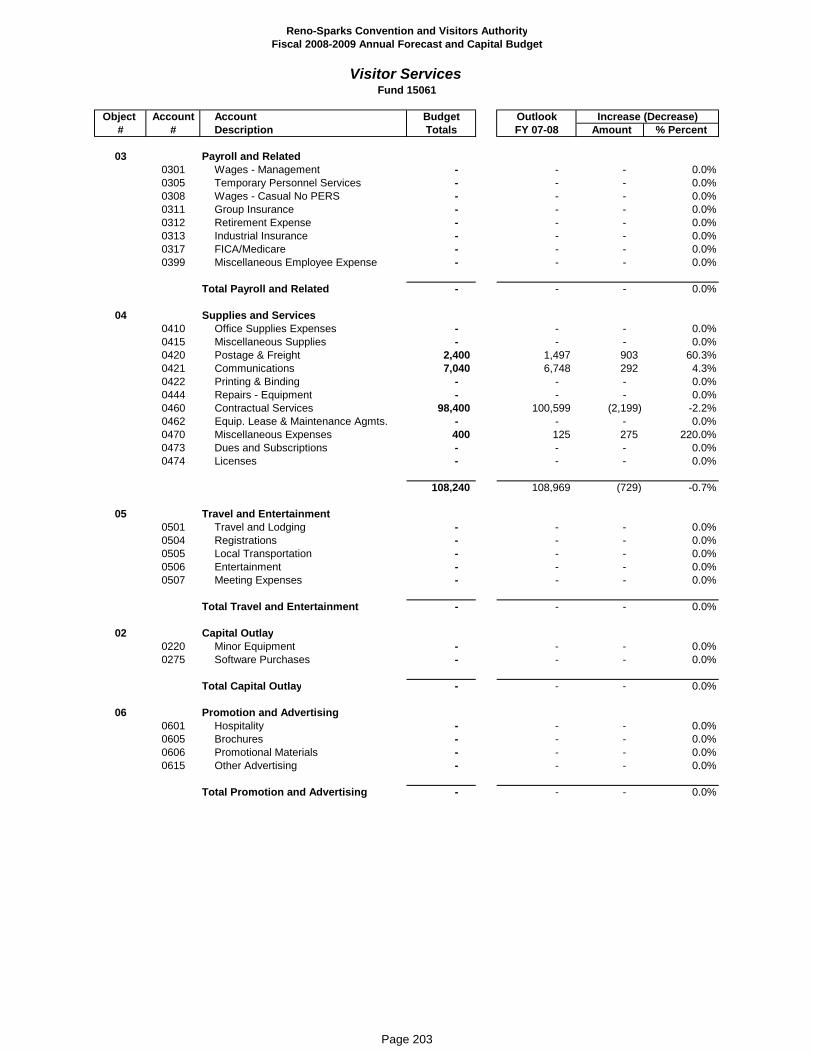
Object Account Account Budget Outlook# # Description Totals FY 07-08 Amount % Percent
03 Payroll and Related0301 Wages - Management - - - 0.0%0305 Temporary Personnel Services - - - 0.0%0308 Wages - Casual No PERS - - - 0.0%0311 Group Insurance - - - 0.0%0312 Retirement Expense - - - 0.0%0313 Industrial Insurance - - - 0.0%0317 FICA/Medicare - - - 0.0%0399 Miscellaneous Employee Expense - - - 0.0%
Total Payroll and Related - - - 0.0%
04 Supplies and Services0410 Office Supplies Expenses - - - 0.0%0415 Miscellaneous Supplies - - - 0.0%0420 Postage & Freight 2,400 1,497 903 60.3%0421 Communications 7,040 6,748 292 4.3%0422 Printing & Binding - - - 0.0%0444 Repairs - Equipment - - - 0.0%0460 Contractual Services 98,400 100,599 (2,199) -2.2%0462 Equip. Lease & Maintenance Agmts. - - - 0.0%0470 Miscellaneous Expenses 400 125 275 220.0%0473 Dues and Subscriptions - - - 0.0%0474 Licenses - - - 0.0%
108,240 108,969 (729) -0.7%
Reno-Sparks Convention and Visitors AuthorityFiscal 2008-2009 Annual Forecast and Capital Budget
Visitor ServicesFund 15061
Increase (Decrease)
, , ( )
05 Travel and Entertainment0501 Travel and Lodging - - - 0.0%0504 Registrations - - - 0.0%0505 Local Transportation - - - 0.0%0506 Entertainment - - - 0.0%0507 Meeting Expenses - - - 0.0%
Total Travel and Entertainment - - - 0.0%
02 Capital Outlay0220 Minor Equipment - - - 0.0%0275 Software Purchases - - - 0.0%
Total Capital Outlay - - - 0.0%
06 Promotion and Advertising0601 Hospitality - - - 0.0%0605 Brochures - - - 0.0%0606 Promotional Materials - - - 0.0%0615 Other Advertising - - - 0.0%
Total Promotion and Advertising - - - 0.0%
Page 203

Object Account Account Budget Outlook# # Description Totals FY 07-08 Amount % Percent
Reno-Sparks Convention and Visitors AuthorityFiscal 2008-2009 Annual Forecast and Capital Budget
Visitor ServicesFund 15061
Increase (Decrease)
07 Special Projects0730 Special Promotions - - - 0.0%
Total Special Projects - - - 0.0%
Total Expenses 108,240 108,969 (729) -0.7%
RevenuesR100 Information Referral Information 16,060 16,070 (10) -0.1%R360 Misc Revenue-Website - - - 0.0%
Total Revenues 16,060 16,070 (10) -0.1%
Net Departmental Expenses 92,180 92,899 (719) -0.8%
Page 204

RENO-SPARKS CONVENTION AND VISITORS AUTHORITY FISCAL 2008-2009 ANNUAL FORECAST AND CAPITAL BUDGET
VISITOR CENTERS
DESCRIPTION: The budget assumes continued participation with the Sparks Chamber of Commerce to operate a regional visitor center and the Reno-Tahoe Airport Authority Ambassador programs. STAFF: Not applicable. FISCAL YEAR 2008-2009 OBJECTIVES:
• Continue to partially fund and support the Sparks Visitor Center ($36,700) and fund the Airport Authority Ambassador program ($13,200).
Payroll and Related:
• Not applicable. Supplies and Services:
• 0421- Phone service to the Sparks Visitor Center. • 0460- Partial Funding of the Sparks Visitor Center, and RTIA Ambassador
programs. Travel and Entertainment:
• Not applicable Capitol Outlay:
• Not Applicable FINANCIAL DEPARTMENTAL DETAIL: The following pages detail the departmental line items for the current year budget compared to prior year outlook.
Page 205

Object Account Account Budget Outlook# # Description Totals FY 07-08 Amount % Percent
03 Payroll and Related0301 Wages - Management - - - 0.0%0305 Temporary Personnel Services - - - 0.0%0308 Wages - Casual No PERS - - - 0.0%0311 Group Insurance - - - 0.0%0312 Retirement Expense - - - 0.0%0313 Industrial Insurance - - - 0.0%0317 FICA/Medicare - - - 0.0%0399 Miscellaneous Employee Expense - - - 0.0%
Total Payroll and Related - - - 0.0%
04 Supplies and Services0401 Utilities - Electric - - - 0.0%0402 Utilities - Gas & Heat - - - 0.0%0403 Utilities - Water - - - 0.0%0410 Office Supplies Expenses - - - 0.0%0411 Maintenance Supplies - - - 0.0%0412 Janitorial Supplies - - - 0.0%0415 Miscellaneous Supplies - - - 0.0%0420 Postage & Freight - - - 0.0%0421 Communications 1,440 1,202 238 19.8%0422 Printing & Binding - - - 0.0%0444 All Equipment Related Repairs - - - 0.0%0460 Contractual Services 49,900 48,835 1,065 2.2%0462 Equip. Lease & Maintenance Agmts. - - - 0.0%
Reno-Sparks Convention and Visitors AuthorityFiscal 2008-2009 Annual Forecast and Capital Budget
Visitor CentersFund 15064
Increase (Decrease)
q p g0470 Miscellaneous Expenses - - - 0.0%0471 Finance Charges - - - 0.0%0473 Dues and Subscriptions - - - 0.0%0474 Licenses - - - 0.0%0481 Credit Card Discounts - - - 0.0%0486 Cost of Goods Sold - - - 0.0%
Total Supplies and Services 51,340 50,037 1,303 2.6%
05 Travel and Entertainment0501 Travel and Lodging - - - 0.0%0504 Registrations - - - 0.0%0505 Local Transportation - - - 0.0%0506 Entertainment - - - 0.0%0507 Meeting Expenses - - - 0.0%
Total Travel and Entertainment - - - 0.0%
02 Capital Outlay0220 Minor Equipment - - - 0.0%0275 Software Purchases - - - 0.0%
Total Capital Outlay - - - 0.0%
Page 206

Object Account Account Budget Outlook# # Description Totals FY 07-08 Amount % Percent
Reno-Sparks Convention and Visitors AuthorityFiscal 2008-2009 Annual Forecast and Capital Budget
Visitor CentersFund 15064
Increase (Decrease)
06 Promotion and Advertising0601 Hospitality - - - 0.0%0605 Brochures - - - 0.0%0606 Promotional Materials - - - 0.0%0615 Other Advertising - - - 0.0%
Total Promotion and Advertising - - - 0.0%
07 Special Projects0730 Special Promotions - - - 0.0%
Total Special Projects - - - 0.0%
Total Expenses 51,340 50,037 1,303 2.6%
RevenuesR360 Miscellaneous Revenues - - - 0.0%R401 Visitor Centers Revenue - - - 0.0%R402 NBS Retail Sales - - - 0.0%R490 Sign Leases - - - 0.0%
Total Revenues - - - 0.0%
Net Departmental Expenses 51,340 50,037 1,303 2.6%
Page 207


RENO-SPARKS CONVENTION AND VISITORS AUTHORITY FISCAL 2008-2009 ANNUAL FORECAST AND CAPITAL BUDGET
CAPITAL AND OTHER EXPENSES SUMMARY
DESCRIPTION: Capital and Other Expenses consists of the following:
• Debt Service • Grants • Pioneer Center • Contingency • Capital Improvements • Self Insurance
Please find the following reports:
• Capital and Other Expenses Summary showing revenues and expenses for FY 08-09:
• Departmental detail Debt Service Grants Pioneer Center Contingency Capital Improvements Self Insurance
Page 209

Account Budget OutlookDescription Totals FY 07-08 Amount % Percent
RevenueDebt Service 483,422 529,643 (46,221) -8.7%Grants - - - 0.0%Pioneer Center - - - 0.0%Contingency - - - 0.0%Capital Improvements 79,050 113,803 (34,753) -30.5%Insurance - Self 2,039,027 1,887,329 151,698 8.0%
Total Revenue 2,601,499 2,530,775 70,724 2.8%
ExpensesDebt Service 9,219,421 10,379,219 (1,159,798) -11.2%Grants 1,329,975 1,320,414 9,561 0.7%Pioneer Center - - - 0.0%Contingency 500,000 979,562 (479,562) -49.0%Capital Improvements 1,440,000 1,950,000 (510,000) -26.2%Insurance - Self 2,258,120 1,894,876 363,244 19.2%
Total Expenses 14,747,516 16,524,071 (1,776,555) -10.8%
Profit Or (Loss) (12,146,017) (13,993,296) 1,847,279 -13.2%
Increase (Decrease)
Reno-Sparks Convention and Visitors AuthorityFiscal 2008-2009 Annual Forecast and Capital Budget
Capital and Other Expenses - Summary
Operating Revenues 41,862,443 40,296,948 1,565,495 3.9%
Percentage to Total Operating Revenues -29.0% -34.7% 5.7 -16.4%
Page 210

B
udge
tFY
04-
05FY
05-
06FY
06-
07B
udge
tO
utlo
okFY
08-
09
Rev
enue
sD
ebt S
ervi
ce47
5,54
1
553,
952
62
3,01
4
656,
613
52
9,64
3
483,
422
G
rant
s-
-
-
-
-
-
P
ione
er C
ente
r-
-
-
-
-
-
C
ontin
genc
y-
-
-
-
-
-
C
apita
l Im
prov
emen
ts69
,039
66,0
44
68
,301
51,0
00
11
3,80
3
79,0
50
In
sura
nce
1,43
2,91
6
1,
640,
390
1,64
6,92
3
1,
782,
905
1,88
7,32
9
2,
039,
027
Ext
raor
dina
ry R
& M
-
-
-
-
-
-
Tota
l Rev
enue
s1,
977,
496
2,26
0,38
6
2,
338,
238
2,49
0,51
8
2,
530,
775
2,60
1,49
9
Cap
ital a
nd O
ther
Exp
ense
sC
onso
lidat
ed S
umm
ary
Fisc
al 2
008-
2009
Ann
ual F
orec
ast a
nd C
apita
l Bud
get
Des
crip
tion
Acc
ount
A
ctua
lFY
07-
08
Expe
nses
Deb
t Ser
vice
10,1
15,0
85
9,
479,
312
9,85
8,62
1
10
,388
,418
10,3
79,2
19
9,
219,
421
Gra
nts-
Incl
ine
Vill
age
Cry
stal
Bay
1,07
7,90
2
1,
125,
215
1,24
5,52
6
1,
165,
387
1,16
0,41
4
1,
189,
975
Gra
nts-
Pio
neer
Cen
ter
226,
618
20
0,00
0
180,
000
16
0,00
0
160,
000
14
0,00
0
Pio
neer
Cen
ter-
Cap
ital
95,3
54
49
,292
37,3
30
-
-
-
Con
tinge
ncy
-
-
-
20
0,00
0
829,
562
50
0,00
0
Con
tinge
ncy-
Ope
ratin
g R
eser
ve-
-
-
-
15
0,00
0
-
C
ontin
genc
y-C
apita
l Res
erve
-
-
-
-
325,
000
10
0,00
0
Cap
ital I
mpr
ovem
ents
2,54
1,04
8
67
8,33
7
1,44
5,67
6
1,
450,
000
1,62
5,00
0
1,
340,
000
Insu
ranc
e1,
536,
560
1,61
7,84
1
1,
618,
937
1,82
8,02
0
1,
894,
876
2,25
8,12
0
E
xtra
ordi
nary
R &
M-
-
-
-
-
-
Tota
l Exp
ense
s15
,592
,567
13
,149
,997
14
,386
,090
15
,191
,825
16
,524
,071
14
,747
,516
Dep
artm
enta
l Pro
fit (L
oss)
(13,
615,
071)
(1
0,88
9,61
1)
(12,
047,
852)
(1
2,70
1,30
7)
(13,
993,
296)
(1
2,14
6,01
7)
Page 211

B
udge
tFY
04-
05FY
05-
06FY
06-
07B
udge
tO
utlo
okFY
08-
09
Cap
ital a
nd O
ther
Exp
ense
sC
onso
lidat
ed S
umm
ary
Fisc
al 2
008-
2009
Ann
ual F
orec
ast a
nd C
apita
l Bud
get
Des
crip
tion
Acc
ount
A
ctua
lFY
07-
08
Mar
gins
- Pr
ofit
(Los
s)D
ebt S
ervi
ce(9
,639
,544
)
(8
,925
,360
)
(9
,235
,607
)
(9
,731
,805
)
(9
,849
,576
)
(8
,735
,999
)
G
rant
s(1
,304
,520
)
(1
,325
,215
)
(1
,425
,526
)
(1
,325
,387
)
(1
,320
,414
)
(1
,329
,975
)
P
ione
er C
ente
r(9
5,35
4)
(4
9,29
2)
(3
7,33
0)
-
-
-
Con
tinge
ncy
-
-
-
(2
00,0
00)
(8
29,5
62)
(5
00,0
00)
C
ontin
genc
y-O
pera
ting
Res
erve
-
-
-
-
(150
,000
)
-
C
ontin
genc
y-C
apita
l Res
erve
-
-
-
-
(325
,000
)
(100
,000
)
Cap
ital I
mpr
ovem
ents
(2,4
72,0
09)
(612
,293
)
(1,3
77,3
75)
(1,3
99,0
00)
(1,5
11,1
97)
(1,2
60,9
50)
Insu
ranc
e(1
03,6
44)
22
,549
27,9
86
(4
5,11
5)
(7
,547
)
(2
19,0
93)
E
xtra
ordi
nary
R &
M-
-
-
-
-
-
Tota
l Dep
artm
enta
l Mar
gins
(13,
615,
071)
(1
0,88
9,61
1)
(12,
047,
852)
(1
2,70
1,30
7)
(13,
993,
296)
(1
2,14
6,01
7)
R
SCC
Exp
ansi
on &
Oth
er N
on-C
ash
Expe
nses
RS
CC
Con
stru
ctio
n1,
823,
268
483,
456
1,
252,
133
1,28
5,00
0
1,
300,
000
690,
000
In
vest
men
t Int
eres
t-Bon
d P
roce
eds
19,9
16
13
,482
-
-
53,9
28
15
,000
Deb
t Ser
vice
-Def
easa
nce
1,20
5,29
3
(4
,420
)
38
4,34
5
382,
382
-
-
Net
RSC
C3,
008,
645
465,
554
1,
636,
478
1,66
7,38
2
1,
246,
072
675,
000
Page 212

RENO-SPARKS CONVENTION AND VISITORS AUTHORITY FISCAL 2008-2009 ANNUAL FORECAST AND CAPITAL BUDGET
DEBT SERVICE FUND
DESCRIPTION: The Debt Service Fund is used to account for the accumulation of resources required for the repayment of debt principal and interest. The principal resources for this fund are transfers-in from other funds and interest earnings on these funds. STAFF: Not applicable. FISCAL YEAR 2008-2009 OBJECTIVES:
• To ensure funds are available and invested to maximize interest earnings to make debt payments
FINANCIAL DEPARTMENTAL DETAIL: The following pages detail the departmental line items for the current year budget compared to prior year outlook and a detailed debt schedule.
Page 213

Object Account Account Budget Outlook
# # Description Totals FY 07-08 Amount % Percent
Debt Service 0101 Principal - Short Term 100,000 100,000 - 0.0%0102 Interest - Short Term 115,043 114,051 992 0.9%0103 Principal - Bonds 3,835,000 4,875,000 (1,040,000) -21.3%0104 Interest - Bonds 5,160,278 5,281,068 (120,790) -2.3%
Total Debt Service 9,210,321 10,370,119 (1,159,798) -11.2%
Services0490 Bond Costs 9,100 9,100 - 0.0%
Total Services 9,100 9,100 - 0.0%
Interest IncomeR070 Investment Interest Revenue 483,422 529,643 (46,221) -8.7%R080 Proceeds - Long Term Debt - - - 0.0%
Total Interest Income 483,422 529,643 (46,221) -8.7%
Profit Or (Loss) 8,735,999 9,849,576 (1,113,577) -11.3%
Increase (Decrease)
Reno-Sparks Convention and Visitors AuthorityFiscal 2008-2009 Annual Forecast and Capital Budget
Debt ServiceFund 25900
Page 214

Inte
rest
Mat
urity
Orig
inal
Bal
ance
Bal
ance
Due
inD
escr
iptio
nR
ate
Dat
eIs
sue
July
1, 2
007
Add
ition
sD
elet
ions
June
30,
200
820
08-2
009
Gov
ernm
enta
l Act
iviti
esG
ener
al O
blig
atio
n B
onds
Pay
able
(Lim
ited
Tax)
Impr
ovem
ent
an
d R
efun
ding
Bon
ds:
Oct
ober
1, 1
989
Serie
sC
apita
l App
reci
atio
n-
2008
7,55
5,65
7$
3,72
0,00
0$
-$
3,
720,
000
$
-
$
-$
A
ugus
t 1, 1
995
Serie
s4.
0 - 5
.6%
2011
12,4
95,0
005,
720,
000
-
375,
000
5,34
5,00
0
1,68
0,00
0
Apr
il 1,
199
9 Se
ries
4.0
- 4.5
%20
105,
950,
000
4,09
0,00
0
-
41
5,00
0
3,
675,
000
1,
170,
000
Ja
nuar
y 20
00 S
erie
sC
urre
nt In
tere
st5.
0 - 5
.5%
2010
85,6
15,0
001,
220,
000
-
-
1,
220,
000
60
5,00
0
C
apita
l App
reci
atio
n-
2021
19,3
84,0
7527
,809
,189
1,80
4,27
7
-
29
,613
,466
-
Ju
ne 1
, 200
1 R
efun
ding
4.0
- 5.2
5%20
3092
,995
,000
92,9
95,0
00
-
365,
000
92,6
30,0
00
38
0,00
0
D
efer
red
amou
nts
on fu
ndin
g(2
23,8
91)
-
(81,
114)
(142
,777
)
-
C
apita
l Lea
se P
ayab
le5.
79%
2008
125,
896
40,8
08
-
40,8
08
-
-
20
07B
ank
Loan
397
%20
123
000
000
300
000
0-
100
000
290
000
010
000
0
REN
O-S
PAR
KS
CO
NVE
NTI
ON
AN
D V
ISIT
OR
S AU
THO
RIT
YFI
SCAL
200
8-20
09 A
NN
UAL
FO
REC
AST
AND
CAP
ITAL
BU
DG
ET
2007
Ban
k Lo
an3.
97%
2012
3,00
0,00
03,
000,
000
-
10
0,00
0
2,90
0,00
0
10
0,00
0
138,
371,
106
$
1,
804,
277
$
4,
934,
694
$
13
5,24
0,68
9$
3,93
5,00
0$
Year
End
ing
June
30,
Prin
cipa
lIn
tere
stPr
inci
pal
Inte
rest
Tota
l20
093,
835,
000
$
5,
160,
278
$
10
0,00
0$
11
5,04
3$
9,
210,
321
$
20
104,
015,
000
4,96
4,24
810
0,00
011
1,07
69,
190,
324
2011
3,58
5,00
04,
772,
275
679,
000
107,
109
9,14
3,38
420
122,
056,
332
4,99
0,38
42,
021,
000
80,1
739,
147,
889
2013
4,07
2,80
85,
638,
428
-
-
9,71
1,23
620
14-2
018
19,0
00,7
0032
,028
,425
-
-
51,0
29,1
2520
19-2
023
22,4
38,6
2729
,883
,527
-
-
52,3
22,1
5420
24-2
028
49,8
00,0
0012
,899
,118
-
-
62,6
99,1
1820
29-2
030
23,6
80,0
001,
258,
950
-
-
24,9
38,9
50
132,
483,
467
$
10
1,59
5,63
3$
2,90
0,00
0$
413,
401
$
237,
392,
501
$
Pr
esen
ted
belo
w is
a s
umm
ary
of d
ebt s
ervi
ce re
quire
men
ts to
mat
urity
of t
he A
utho
rity'
s ob
ligat
ions
:
Bon
ds
Not
e: B
onds
wou
ld b
e el
igib
le fo
r cal
l in
FY 2
011
Med
ium
Ter
m
Page 215

RENO-SPARKS CONVENTION AND VISITORS AUTHORITY FISCAL 2008-2009 ANNUAL FORECAST AND CAPITAL BUDGET
DEBT ADMINISTRATION
The Authority’s outstanding debt of $135,383,466 is comprised of the following items:
1. 2007 Medium Term – West Plaza Expansion, $2,900,000 outstanding as of 7/08
2. 1995 Refunding - refunded portions of bonds issued for various
purposes, $5,345,000 as of 7/08
3. 1999 Refunding - refunded portions of outstanding bond issues, $3,675,000 as of 7/08
4. 1999 Convention Center Issue - Includes $1,220,000 current interest
and $29,613,466 capital appreciation bonds for the renovation and expansion of the Reno-Sparks Convention Center as of 7/08
5. 2001 Convention Center Refunding - $92,995,000 as of 7/08
The debt payments above are funded from general fund room tax revenues, of which a 2% countywide room tax is dedicated to the Convention Center Bonds (items 4 and 5 above). These bonds also have a reserve account established, currently $4.7 million, to provide additional security in the event revenues fall below expectations. The interest on this reserve ($158,000) is transferred semi-annually to the trust fund to offset the net debt payment funded by the Authority. Payments are due on the bond issues above on January 1 and July 1 annually (with the exception of item 1 which is due on November 1 and May 1), and are funded as detailed below. The Convention Center Bonds payments accumulate in a trust fund in which the amount to be transferred monthly is evaluated on a semiannual basis in July and January, and is administered by Zions Bank. The other bond issues are not held in trust, but are segmented from the Authority’s other cash accounts, and have an amount equal to 1/6 of the next interest payment and 1/12 of the next principal payment transferred monthly. The Authority’s debt is included in the overall debt capacity of Washoe County.
Page 216

RENO-SPARKS CONVENTION AND VISITORS AUTHORITY FISCAL 2008-2009 ANNUAL FORECAST AND CAPITAL BUDGET
GRANTS
DESCRIPTION: Provides funding to Incline Village/Crystal Bay Visitors & Convention Bureau for marketing/operations, and for operation and maintenance of the Pioneer Center. STAFF: Not applicable. FISCAL YEAR 2008-2009 OBJECTIVES: Not applicable.
FINANCIAL DEPARTMENTAL DETAIL: The following pages detail the departmental line items for the current year budget compared to prior year outlook.
Page 217

Object Account Account Budget Outlook
# # Description Totals FY 07-08 Amount % Percent
07 Grants 0704 RPACA 140,000 160,000 (20,000) -12.5%0705 Incline Village Crystal Bay 1,189,975 1,160,414 29,561 2.5%
Total Grants 1,329,975 1,320,414 9,561 0.7%
Total Expenditures 1,329,975 1,320,414 9,561 0.7%
Increase (Decrease)
Reno-Sparks Convention and Visitors AuthorityFiscal 2008-2009 Annual Forecast and Capital Budget
GrantsFund 15080
Page 218

RENO-SPARKS CONVENTION AND VISITORS AUTHORITY FISCAL 2008-2009 ANNUAL FORECAST AND CAPITAL BUDGET
PIONEER CENTER
DESCRIPTION: Under the agreement with the Pioneer Center for the Performing Arts Association, the RSCVA retains the responsibility for expenditures in the area of capital repairs to the auditorium. There are no capital expenditures budgeted from RSCVA funds this year. STAFF: The Pioneer Center for the Performing Arts Association is responsible for the marketing, booking and staffing of the Pioneer Center. FISCAL YEAR 2008-2009 OBJECTIVES: The objectives are established by and for the Pioneer Center for the Performing Arts Association. Since the RSCVA owns the building, our objectives would be to provide financial assistance in terms of capital and building improvements in addition to the grants provided in the amount of $140,000.
FINANCIAL DEPARTMENTAL DETAIL: The following pages detail the departmental line items for the current year budget compared to prior year outlook.
Page 219

Object Account Account Budget Outlook
# # Description Totals FY 07-08 Amount % Percent
04 Supplies and Services 0430 All Building & Grounds Related Repairs - - - 0.0%0452 Professional Services - Other - - - 0.0%
Total Supplies and Services - - - 0.0%
02 Capital Outlay 0290 Miscellaneous Capital - - - 0.0%
Total Capital Outlay - - - 0.0%
Total Expenditures - - - 0.0%
Increase (Decrease)
Reno-Sparks Convention and Visitors AuthorityFiscal 2008-2009 Annual Forecast and Capital Budget
Pioneer CenterFund 15040
Page 220

RENO-SPARKS CONVENTION AND VISITORS AUTHORITY FISCAL 2008-2009 ANNUAL FORECAST AND CAPITAL BUDGET
CONTINGENCY FUND
DESCRIPTION: Reserve for any unbudgeted item or activities not known at time of budget preparation that may be expended during the fiscal year. STAFF: Not applicable. FISCAL YEAR 2008-2009 OBJECTIVES: The contingency fund, in the amount of $500,000 in the FY 08-09 budget, is a buffer in the event of downturns in economic conditions, allowing minimal or no adjustments to operating budgets. The FY 07-08 outlook reflects a carryover of $979,562:
• $829,562 to fund FY 08-09 operations; • Creation of a $150,000 operating (rainy day fund) reserve which is not
anticipated to be expended in FY 08-09. FINANCIAL DEPARTMENTAL DETAIL: The following pages detail the departmental line items for the current year budget compared to prior year outlook.
Page 221

Object Account Account Budget Outlook
# # Description Totals FY 07-08 Amount % Percent
15000 Special Projects 0000 Contingency 500,000 979,562 (479,562) -49.0%
Total Special Projects 500,000 979,562 (479,562) -49.0%
Total Expenditures 500,000 979,562 (479,562) -49.0%
Increase (Decrease)
Reno-Sparks Convention and Visitors AuthorityFiscal 2008-2009 Annual Forecast and Capital Budget
ContingencyFund 15000
Page 222

RENO-SPARKS CONVENTION AND VISITORS AUTHORITY FISCAL 2008-2009 ANNUAL FORECAST AND CAPITAL BUDGET
CAPITAL FUND
DESCRIPTION: The Capital Projects Fund is used to account for most construction, major repairs, and the purchase of most major fixed assets - other than those in the enterprise funds. It is funded through interest earnings, the proceeds of both long and short-term debt and transfers-in from other funds. STAFF: Not applicable. FISCAL YEAR 2008-2009 OBJECTIVES:
• To provide adequate funding for approved capital projects for the current fiscal year.
Total capital expenditures within the FY 08-09 of $1,340,000 plus a $100,000 capital reserve totaling $1,440,000 will be funded as follows:
• $690,000 from bond proceeds remaining from the West Plaza Expansion;
• $325,000 from FY 07-08 capital reserve established per Strategic Plan Plank #5;
• $425,000 from FY 08-09 operations. FINANCIAL DEPARTMENTAL DETAIL: The following pages detail the departmental line items for the current year budget compared to prior year outlook. A $900,000 capital reserve, which was mandated by State Statute when the bonds were issued for the RSCC Expansion, exists for extraordinary repairs & maintenance. The attached detail schedule includes costs for only the budget fiscal year.
Page 223

Object Account Account Budget Outlook
# # Description Totals FY 07-08 Amount % Percent
Capital Expenditures 0201 Major Repairs - Convention Center 325,000 125,000 200,000 160.0%0202 Major Repairs - Pioneer Center - - - 0.0%0204 Major Repairs - NBS - - - 0.0%0211 Major Equipment - - - 0.0%0216 Major Repairs - RSLEC 75,000 75,000 - 0.0%0220 Minor Equipment - - - 0.0%0230 Convention Center Expansion 690,000 1,300,000 (610,000) -46.9%0290 Miscellaneous Capital Costs - Reserve 350,000 450,000 (100,000) -22.2%
Total Capital Expenditures 1,440,000 1,950,000 (510,000) -26.2%
Supplies and Services0430 All Building & Grounds Related Repairs - - - 0.0%0452 Professional Services - Other - - - 0.0%0460 Contractual Services - - - 0.0%0470 Miscellaneous Expense - - - 0.0%
Total Supplies and Services - - - 0.0%
Special Events0616 Promotion and Advertising - - - 0.0%
Total Special Events 0 0%
Increase (Decrease)
Reno-Sparks Convention and Visitors AuthorityFiscal 2008-2009 Annual Forecast and Capital Budget
Capital FundFund 23600
Total Special Events - - - 0.0%
R070 Interest 15,000 53,928 (38,928) -72.2%R077 Ext R&M 64,050 59,875 4,175 7.0%
Total Revenues 79,050 113,803 (34,753) -30.5%
Total Expenditures 1,360,950 1,836,197 (475,247) -25.9%
Page 224

RENO-SPARKS CONVENTION AND VISITORS AUTHORITY FISCAL 2008-2009 ANNUAL FORECAST AND CAPITAL BUDGET
CAPITAL EXPENDITURES
The Authority defines capital expenditures as those which will have a useful life of greater than one year and which cost a minimum of $5,000. Capital expenditures are generally classified into two groups: routine and non-routine. Non-routine expenditures are those which are not expected to reoccur frequently or are of a large dollar amount. Routine expenditures are those which are 1) included in almost every budget year (wear & tear, obsolescence); and 2) will have no significant impact on the operating budget. The FY 08-09 budget includes a total of $1,740,000 in capital expenditures ($300,000 in the Golf Course Enterprise Fund, $1,340,000 in the Capital Projects Fund, and a $100,000 capital reserve); see Capital Detail for listing of projects. The projects listed in the current budget are of a routine nature and require no additional personnel or operating costs (utility, maintenance, etc) to complete. The in-house telecom project is expected to have operational cost reductions throughout the organization once in place as compared to the current services provided through a third party. The other projects are not anticipated to produce any operational savings but are necessary to maintain the facilities current usage levels and pricing structures. The following is a preliminary capital detail for FY 08-09.
Page 225

RENO-SPARKS CONVENTION AND VISITORS AUTHORITY FISCAL 2008-2009 ANNUAL FORECAST AND CAPITAL BUDGET
CAPITAL DETAIL - PRELIMINARY
DESCRIPTION AMOUNT Reno-Sparks Convention Center • Graphic wall lighting $180,000 • Re-roof A & F concourses 245,000 • Replace UPS batteries 40,000 • Parking lot sealing & striping 75,000 • A-Meeting rooms upgrade 150,000 • Risers 100,000
Total $790,000
National Bowling Stadium • Pinsetters $250,000 _______ Total $250,000 Organization-Wide • Telecom system $225,000 _______ Total $225,000 Reno Events Center $0.00 _______ Total $0.00
Page 226

RENO-SPARKS CONVENTION AND VISITORS AUTHORITY FISCAL 2008-2009 ANNUAL FORECAST AND CAPITAL BUDGET
CAPITAL DETAIL - PRELIMINARY CONTINUED
DESCRIPTION AMOUNT Reno-Sparks Livestock Events Center
• Office roof $15,000 • HVAC unit 25,000 • Steps to main arena 10,000 • Parking lot repairs 15,000 • Miscellaneous furniture, fixtures, and equipment 10,000
(Grounds repair, tables, chairs, etc.) _______
Total $75,000 Sub-Total Capital Fund $ 1,340,000 Capital Reserve • Reserve (Uncommitted) $100,000
Total $100,000 Total Capital Fund $ 1,440,000 Northgate
• Replace fairway mower $50,000 • Repair pumps 15,000 • Replace greensmower 25,000 • Improve drainage 10,000 Total $100,000
Page 227

RENO-SPARKS CONVENTION AND VISITORS AUTHORITY FISCAL 2008-2009 ANNUAL FORECAST AND CAPITAL BUDGET
CAPITAL DETAIL - PRELIMINARY CONTINUED
Wildcreek
• Remodel Hole 14 landing area $150,000 • Replace greensmower 25,000 • Replace utility carts 25,000
Total $200,000 Both golf courses, which fall under the Enterprise Fund, reflect these capital requirements as part of their overall depreciation costs.
Page 228

Reno‐Sparks Convention Center Graphic Wall Lighting: Improve over‐all facility Graphic Wall Lighting 180,000$ X facility marketability. Re‐roof A & F Concourses 245,000 X Risers: Contractual obligations require Replace UPS Batteries 40,000 X riser purchase for D‐league basketball. Parking Lot Sealing & Striping 75,000 X
Capital Project Benefit‐CostAmount Life
Cycle
Improv
emen
ts
Efficiency
Reven
ue
Opp
ortunities
Type
RENO-SPARKS CONVENTION AND VISITORS AUTHORITY FISCAL 2008-2009 ANNUAL FORECAST AND CAPITAL BUDGET
CAPITAL BUDGET EFFECT ON OPERATING BUDGET
The following chart illustrates the capital projects for FY08-09. Projects having abenefit-cost impact on the operating budget are described in detail below. Many of theprojects listed are normal life cycle expenditures and although they address issues ofsafety, liability and maintaining the asset’s value will not have any significant impact onthe operating budget. A capital reserve of $100,000 has been established for FY 08-09. The establishmentof this reserve is part of the Authority’s strategic plan (plank 5) to develop a capitalimprovement program.
Parking Lot Sealing & Striping 75,000 XA‐Meeting Rooms Upgrade 150,000 XRisers 100,000 X
Total Reno‐Sparks Convention Center 790,000$
National Bowling Stadium Pinsetters: Reduced jams andPinsetters 250,000$ X X faster ball return time.
Total National Bowling Stadium 250,000$
Reno‐Sparks Livestock Events Center Normal repair cycle.Office Roof 15,000$ XHVAC Unit 25,000 XSteps to Main Arena 10,000 XParking Lot Repairs 15,000 XMisc Furniture, Fixtures, and Equipment 10,000 X
Total Reno‐Sparks Livestock Event Center 75,000$
Northgate Golf Club Mowers: Estimated reduction in repairRepair Fairway Mower 50,000$ X costs: $2,000 annually.Repair Pumps 15,000 XReplace Greensmower 25,000 XImprove Drainage 10,000 X Depreciation: $15,000 annually.
Total Northgate Golf Club 100,000$
Wildcreek Golf Course Mowers: Estimated reduction in repairRemodel Hole 14 Landing Area 150,000$ X costs: $4,000 annually.Replace Greensmower 25,000 Replace Greensmower 25,000 X X Depreciation: $25,000 annually.
Total Wildcreek Golf Course 200,000$
Organization ‐Wide Telecom System: Estimated revenues ofTelecom System 225,000$ X X X $15,000 for RSCC and an expected savings
Total Organization ‐Wide 225,000$ of $40,000
RENO-SPARKS CONVENTION AND VISITORS AUTHORITY FISCAL 2008-2009 ANNUAL FORECAST AND CAPITAL BUDGET
CAPITAL BUDGET EFFECT ON OPERATING BUDGET
The following chart illustrates the capital projects for FY08-09. Projects having abenefit-cost impact on the operating budget are described in detail below. Many of theprojects listed are normal life cycle expenditures and although they address issues ofsafety, liability and maintaining the asset’s value will not have any significant impact onthe operating budget. A capital reserve of $100,000 has been established for FY 08-09. The establishmentof this reserve is part of the Authority’s strategic plan (plank 5) to develop a capitalimprovement program.
Page 229

RENO-SPARKS CONVENTION AND VISITORS AUTHORITY FISCAL 2008-2009 ANNUAL FORECAST AND CAPITAL BUDGET
INSURANCE FUND
DESCRIPTION: Internal Service Funds (Insurance Fund) are used to account for the financing of goods or services provided by one department or agency to other departments of the government on a cost reimbursement basis. Financial activities of insurance programs are accounted for in the Internal Service Fund (Insurance Fund). The Authority is self-insured to aggregate and specific stop-loss limits for workers’ compensation (industrial) claims and without limitation for unemployment claims. Employee health (medical, dental and vision) insurance is provided through several purchased coverage (fixed premium) plans at no financial risk to the Authority. STAFF: Not applicable. FISCAL YEAR 2008-2009 OBJECTIVES:
• Obtain Other Post Employment Benefits (OPEB) valuation and determine funding strategy to manage liability. There is currently $150,000 within the budget to address the liability in the FY 08-09 budget.
FINANCIAL DEPARTMENTAL DETAIL:
• The State Industrial Insurance line reflects the potential for costs associated with an on the job injury, the RSCVA is self-insured for this risk (up to the external reinsurance obtained).
• In governmental accounting, employee group insurance withholdings along with RSCVA contributions are recorded as revenues to the insurance fund. As a result of the USBC-W tournament and assuming full staff, this accounts for the projected increase in revenues.
The following pages detail the departmental line items for the current year budget compared to prior year outlook.
Page 230

Object Account Account Budget Outlook
# # Description Totals FY 06-07 Amount % Percent
Payroll & Related 0313 State Industrial Insurance 120,000 78,355 41,645 53.1%0314 Unemployment Insurance 80,000 72,258 7,742 10.7%0315 Health Insurance - Claims Expense 30,000 29,911 89 0.3%0316 Health Insurance - Premium Expense 1,560,000 1,423,578 136,422 9.6%0318 Long Term Disability 69,000 64,967 4,033 6.2%0319 Life Insurance Premiums 84,000 79,123 4,877 6.2%0326 Dental Insurance Premiums 138,000 129,746 8,254 6.4%0375 Accident Drug Screening 160,000 - 160,000 100.0%
Total Payroll & Related 2,241,000 1,877,938 363,062 19.3%
Supplies and Services0450 Professional Services - Legal - - - 0.0%0453 Professional Services - Administration 2,820 2,812 8 0.3%0460 Contractual Services 14,300 14,126 174 1.2%0463 Insurance - - - 0.0%0471 Finance Charges/Renewal - - - 0.0%
Total Supplies and Services 17,120 16,938 182 1.1%
Total Expenditures 2,258,120 1,894,876 363,244 19.2%
Increase (Decrease)
Reno-Sparks Convention and Visitors AuthorityFiscal 2008-2009 Annual Forecast and Capital Budget
Insurance FundFund 20999
Revenues / ContributionsR071 RSVCA Health Insurance Contribution 1,416,600 1,270,393 146,207 11.5%R072 COBRA Health Insurance Contribution 11,208 9,341 1,867 20.0%R073 PERS Contribution 94,200 89,243 4,957 5.6%R074 Employee Insurance Contribution 294,000 285,890 8,110 2.8%R075 Industrial Insurance Contribution 223,019 232,462 (9,443) -4.1%
Total Revenues 2,039,027 1,887,329 151,698 8.0%
Net Departmental Expenses 219,093 7,547 211,546 2803.0%
Page 231


Ellen OppenheimPresident
Chief Executive Officer
Tim D. Smith Knud Svendsen Joe Kelley Philip D'AmicoVice-President Vice-President Vice-President Vice-President
Finance Marketing & Tourism Facilities Convention Sales
RENO-SPARKS CONVENTION AND VISITORS AUTHORITY
EXECUTIVE STAFF
FISCAL 2008-2009 ANNUAL FORECAST AND CAPITAL BUDGET
Finance Marketing & Tourism Facilities Convention Sales
Ralph Witsell Michael Thomas Steve CasperExecutive Director Executive Director Executive Director
Tourism Sales Marketing Human Resources
John House Charlton Northington Rick OdynskiGeneral Manager General Manager Internal Auditor
Reno-Sparks Livestock Reno-Sparks ConventionEvents Center Center
Page 233

Rev
ised
07/
01/0
8
Exec
utiv
e Le
ader
ship
El
len
Opp
enhe
im
Pres
iden
t / C
EO
Phi
lip D
’Am
ico
Vice
Pre
side
nt o
f C
onve
ntio
n S
ales
Knu
d S
vend
sen
Vice
Pre
side
nt o
f M
arke
ting
&
Tour
ism
Joe
Kel
ley
Vice
Pre
side
nt o
f Fa
cilit
ies
Tim
Sm
ith
Vice
Pre
side
nt o
f Fi
nanc
e
C
harlo
tte A
nder
son
Assi
stan
t to
CEO
Ste
ve C
aspe
r E
xecu
tive
Dire
ctor
of
Hum
an
Res
ourc
es
Ric
k O
dyns
ki
Inte
rnal
Aud
itor
Ral
ph W
itsel
l E
xecu
tive
Dire
ctor
of
Tou
rism
Sal
es
Mic
hael
Tho
mas
Exe
cutiv
e D
irect
or
of M
arke
ting
Cha
rlton
N
orth
ingt
on
Gen
eral
Man
ager
R
SCC
John
Hou
se
Gen
eral
Man
ager
R
SLE
C
Page 234

2003 2004 2005 2006 2007
ExpensesGovernmental activities:
General government 2,791,974$ 2,920,705$ 3,297,097$ 3,528,656$ 3,514,851$ Community support 23,818,639 22,739,585 25,307,919 26,957,431 29,461,499 Debt service - interest and fiscal charges 7,391,061 7,843,794 7,683,781 7,530,910 7,366,517
Total governmental activities expenses 34,001,674 33,504,084 36,288,797 38,016,997 40,342,867
Business-type activities:Golf courses 3,799,637 3,304,888 3,311,425 3,424,086 3,504,610
Total business-type activities expenses 3,799,637 3,304,888 3,311,425 3,424,086 3,504,610
Total primary government expenses 37,801,311$ 36,808,972$ 39,600,222$ 41,441,083$ 43,847,477$
Program RevenuesGovernmental activities:
Charges for services: Community support 6,043,425$ 7,954,260$ 7,286,277$ 9,108,739$ 11,241,764$ General government 239,332 212,179 340,563 376,406 395,736 Operating grants and contributions 862,083 598,126 544,580 619,997 691,315 Capital grants and contributions - - 455,132 - -
Total governmental activities program revenues 7,144,840 8,764,565 8,626,552 10,105,142 12,328,815
Business-type activities:Charges for services: Golf courses 3,267,235 3,044,028 2,644,998 2,875,620 3,027,747
Fiscal Year
Reno-Sparks Convention & Visitors AuthorityChanges in Net Assets
For The Years Ended June 30, 2003 through 2007
(Unaudited)(accrual basis of accounting)
Golf courses 3,267,235 3,044,028 2,644,998 2,875,620 3,027,747 Total business-type activities program revenues 3,267,235 3,044,028 2,644,998 2,875,620 3,027,747
Total primary government program revenues 10,412,075$ 11,808,593$ 11,271,550$ 12,980,762$ 15,356,562$
Net (expense)/revenueGovernmental activities (26,856,834)$ (24,739,519)$ (27,662,245)$ (27,911,855)$ (28,014,052)$ Business-type activities (532,402) (260,860) (666,427) (548,466) (476,863) Total primary government net expense (27,389,236)$ (25,000,379)$ (28,328,672)$ (28,460,321)$ (28,490,915)$
General Revenues and Other Changes in Net AssetsGovernmental activities:
Room taxes, penalties and interest 22,084,691$ 23,638,425$ 23,775,071$ 25,262,091$ 26,672,321$ Unrestricted investment and interest earnings 26,095 18,227 86,933 201,189 303,691 Miscellaneous 10,698 8,884 11,390 1,308 6,808 Transfers - - - (400,000) (400,000)
Total governmental activities 22,121,484 23,665,536 23,873,394 25,064,588 26,582,820
Business-type activities:Transfers - - - 400,000 400,000
Total business-type activities - - - 400,000 400,000
Total primary government 22,121,484$ 23,665,536$ 23,873,394$ 25,464,588$ 26,982,820$
Change in Net AssetsGovernmental activities (4,735,350)$ (1,073,983)$ (3,788,851)$ (2,847,267)$ (1,431,232)$ Business-type activities (532,402) (260,860) (666,427) (148,466) (76,863) Total primary government (5,267,752)$ (1,334,843)$ (4,455,278)$ (2,995,733)$ (1,508,095)$
Page 235

2003
2004
2005
2006
2007
Gov
ernm
enta
l act
iviti
esIn
vest
ed in
cap
ital a
sset
s, n
et o
f rel
ated
deb
t(1
6,58
6,51
4)$
(2
0,86
7,80
3)$
(2
4,41
7,32
0)$
(2
9,43
0,09
7)$
(3
2,64
8,25
6)$
R
estri
cted
19,8
02,4
95
9,71
5,69
4
9,18
5,56
2
9,21
7,90
9
9,56
8,41
2
Unr
estri
cted
(def
icit)
(24,
834,
518)
(11,
540,
411)
(11,
249,
613)
(9,1
16,4
50)
(7
,680
,026
)
Tota
l gov
ernm
enta
l act
iviti
es n
et a
sset
s(2
1,61
8,53
7)$
(2
2,69
2,52
0)$
(2
6,48
1,37
1)$
(2
9,32
8,63
8)$
(3
0,75
9,87
0)$
Busi
ness
-type
act
iviti
esIn
vest
ed in
cap
ital a
sset
s, n
et o
f rel
ated
deb
t3,
443,
547
$
3,
002,
682
$
2,
732,
958
$
2,
717,
040
$
2,
564,
804
$
U
nres
trict
ed(d
efic
it)15
715
233
715
7(5
954
6)(1
9209
4)(1
1672
1)
Fisc
al Y
ear
Ren
o-Sp
arks
Con
vent
ion
& V
isito
rs A
utho
rity
Net
Ass
ets
by C
ompo
nent
For T
he Y
ears
End
ed J
une
30, 2
003
thro
ugh
2007
(Una
udite
d)(a
ccru
al b
asis
of a
ccou
ntin
g)
Unr
estri
cted
(def
icit)
157,
152
337,
157
(59,
546)
(192
,094
)
(116
,721
)
Tota
l bus
ines
s-ty
pe a
ctiv
ities
net
ass
ets
3,60
0,69
9$
3,33
9,83
9$
2,67
3,41
2$
2,52
4,94
6$
2,44
8,08
3$
Prim
ary
gove
rnm
ent
Inve
sted
in c
apita
l ass
ets,
net
of r
elat
ed d
ebt
(13,
142,
967)
$
(17,
865,
121)
$
(21,
684,
362)
$
(26,
713,
057)
$
(30,
083,
452)
$
Res
trict
ed19
,802
,495
9,
715,
694
9,
185,
562
9,
217,
909
9,
568,
412
U
nres
trict
ed (d
efic
it)(2
4,67
7,36
6)
(1
1,20
3,25
4)
(1
1,30
9,15
9)
(9
,308
,544
)
(7,7
96,7
47)
To
tal p
rimar
y go
vern
men
t net
ass
ets
(18,
017,
838)
$
(19,
352,
681)
$
(23,
807,
959)
$
(26,
803,
692)
$
(28,
311,
787)
$
Page 236

1217
Reno-Sparks Convention & Visitors Authority
General Room Tax (6 5/8%) CollectionsLast Ten Fiscal Years
(Unaudited)
Governmental Activities Tax Revenues
(accrual basis of accounting)
$19,000,000
$19,500,000
$20,000,000
$20,500,000
$21,000,000
Ten Year Room Tax Collections
General Room Tax is the combination of a 6% tax imposed by the local political subdivisions of Washoe County,Reno and Sparks, and the 5/8% imposed by the State of Nevada Department of Taxation that is retained by the Authority.It is the principal source of operating revenues.
1998 17,511,450$ 2003 16,963,290$ 1999 17,137,668 2004 18,157,051 2000 18,527,709 2005 18,262,011 2001 18,737,762 2006 19,404,215 2002 17,550,841 2007 20,433,999
$16,000,000
$16,500,000
$17,000,000
$17,500,000
$18,000,000
$18,500,000
1998 1999 2000 2001 2002 2003 2004 2005 2006 2007Year Ended June 30,
Page 237

1998
1999
2000
2001
2002
2003
2004
2005
2006
2007
Gen
eral
Fun
dR
eser
ved
176,
994
$
150,
325
$
42,4
71$
31,5
08$
19,6
98$
21,0
05$
157,
030
$
266,
788
$
141,
851
$
303,
923
$
Unr
eser
ved
3,08
6,23
2
5,96
9,93
0
5,83
1,41
9
4,93
8,92
9
3,22
7,62
0
4,09
5,89
2
4,60
0,58
8
3,93
8,25
1
5,09
9,29
3
6,81
5,43
0
Tota
l gen
eral
fund
3,26
3,22
6$
6,12
0,25
5$
5,87
3,89
0$
4,97
0,43
7$
3,24
7,31
8$
4,11
6,89
7$
4,75
7,61
8$
4,20
5,03
9$
5,24
1,14
4$
7,11
9,35
3$
All
othe
r gov
ernm
enta
l fun
dsR
eser
ved
2,27
7,92
3$
1,32
1,78
8$
11,0
51,8
11$
61,2
37,9
26$
18,4
28,8
83$
22,2
49,0
37$
18,2
96,0
81$
15,5
12,4
55$
14,6
24,8
03$
16,7
11,8
21$
Unr
eser
ved,
repo
rted
in:
Cap
ital p
roje
cts
fund
452,
018
8,10
6
96
,146
,739
25
,157
,884
17
,554
,431
-
-
-
-
-
S
peci
al re
venu
e fu
nds
208,
034
280,
332
1,08
6,93
5
1,19
5,16
6
806,
997
-
-
-
-
-
Deb
t ser
vice
fund
-
-
-
-
-
-
-
-
-
-
Tota
l all
othe
r gov
ernm
enta
l fun
ds2,
937,
975
$
1,
610,
226
$
10
8,28
5,48
5$
87
,590
,976
$
36
,790
,311
$
22
,249
,037
$
18
,296
,081
$
15
,512
,455
$
14
,624
,803
$
16
,711
,821
$
Fisc
al Y
ear
Ren
o-Sp
arks
Con
vent
ion
& V
isito
rs A
utho
rity
Fund
Bal
ance
s of
Gov
ernm
enta
l Fun
dsLa
st T
en F
isca
l Yea
rs
(Una
udite
d)(m
odifi
ed a
ccru
al b
asis
of a
ccou
ntin
g)
Page 238

Rev
enue
s19
9819
9920
0020
0120
0220
0320
0420
0520
0620
07
Roo
m ta
x (N
et 6
%)
15,8
59,8
19$
15
,520
,907
$
16,7
79,8
12$
16
,970
,049
$
15,8
95,1
05$
15
,362
,980
$
16,4
44,1
22$
16
,539
,180
$
17,5
73,6
28$
18
,506
,263
$
Roo
m ta
x (S
tate
5/8
%)
1,65
1,63
1
1,61
6,76
1
1,74
7,89
7
1,76
7,71
3
1,65
5,73
6
1,60
0,31
0
1,71
2,92
9
1,72
2,83
1
1,83
0,58
7
1,92
7,73
6
Roo
m ta
x (N
BS
1%
)2,
650,
367
2,
595,
468
2,
805,
008
2,
840,
479
2,
238,
112
-
-
-
-
-
R
oom
tax
(RS
CC
2%
)-
47
8,94
3
5,
593,
265
5,
656,
676
5,
298,
363
5,
121,
401
5,
481,
374
5,
513,
060
5,
857,
876
6,
168,
754
R
oom
tax
(City
Ctr)
-
144,
983
1,58
6,18
3
738,
006
-
-
-
-
-
69,5
68
Faci
lity
use
fees
5,17
6,94
2
4,09
5,01
8
5,34
2,04
7
5,14
3,68
4
3,35
1,52
2
5,82
1,90
4
7,64
8,10
5
6,99
5,47
0
8,77
4,73
2
10,8
40,2
45
In
vest
men
t ear
ning
s25
4,76
5
25
0,29
9
3,
276,
472
6,
914,
582
4,
371,
330
88
8,17
8
61
6,35
3
63
1,51
3
82
1,18
6
99
5,00
6
M
isce
llane
ous
1,06
9,99
9
555,
523
320,
061
349,
891
265,
526
471,
551
527,
218
642,
760
711,
721
804,
063
Tota
l rev
enue
s26
,663
,523
25,2
57,9
02
37
,450
,745
40,3
81,0
80
33
,075
,694
29,2
66,3
24
32
,430
,101
32,0
44,8
14
35
,569
,730
39,3
11,6
35
Expe
nditu
res
Gen
eral
gov
ernm
ent
1,56
6,35
9
1,85
2,07
2
2,51
3,58
6
2,53
2,85
2
2,62
1,49
0
2,69
4,64
1
2,84
4,48
0
3,24
9,98
5
3,47
7,57
5
3,47
5,81
2
Com
mun
ity s
uppo
rt F
acili
ty o
pera
tion
7,07
1,02
8
7,02
1,37
7
7,34
1,93
7
8,08
0,08
5
6,81
4,86
0
8,65
0,50
7
9,62
1,00
2
10,4
43,9
24
11
,706
,207
12,8
30,0
37
C
onve
ntio
n an
d to
uris
m p
rom
otio
n5,
845,
305
5,
472,
269
6,
704,
786
6,
509,
031
6,
123,
590
5,
812,
516
6,
451,
333
8,
054,
384
8,
354,
631
8,
910,
736
C
omm
unity
gra
nts
and
mis
cella
neou
s1,
123,
383
1,
157,
923
1,
206,
616
1,
262,
773
1,
185,
542
1,
011,
309
1,
074,
439
1,
304,
520
1,
325,
215
1,
425,
526
D
ebt s
ervi
ce P
rinci
pal
4,42
3,66
1
4,72
2,07
2
6,36
2,72
5
5,
420,
000
5,82
5,00
0
8,
308,
318
4,
515,
000
4,71
0,00
0
4,
115,
000
4,47
5,00
0
Fisc
al Y
ear
Ren
o-Sp
arks
Con
vent
ion
& V
isito
rs A
utho
rity
Cha
nge
in F
und
Bal
ance
s of
Gov
ernm
enta
l Fun
ds a
nd R
even
ues
by S
ourc
eLa
st T
en F
isca
l Yea
rs
(Una
udite
d)(m
odifi
ed a
ccru
al b
asis
of a
ccou
ntin
g)
Prin
cipa
l4,
423,
661
4,
722,
072
6,
362,
725
5,42
0,00
0
5,
825,
000
8,30
8,31
8
4,51
5,00
0
4,
710,
000
4,11
5,00
0
4,
475,
000
Int
eres
t4,
752,
297
4,
274,
685
3,
786,
383
10
,844
,621
5,82
8,94
5
5,54
9,80
4
5,43
3,62
0
5,39
1,92
1
5,35
1,61
1
5,32
4,42
2
Oth
er b
ond
cost
s28
,064
14
5,36
9
1,
681,
357
81
3,28
8
2,
668,
271
67
3,97
1
5,
255
13,1
64
12,7
01
59,1
99
Cap
ital o
utla
y78
8,66
4
88
6,49
5
5,
675,
942
27
,398
,418
54,5
31,7
80
9,
736,
953
5,
597,
207
2,
089,
017
67
8,33
7
1,
445,
676
To
tal e
xpen
ditu
res
25,5
98,7
61
25
,532
,262
35,2
73,3
32
62
,861
,068
85,5
99,4
78
42
,438
,019
35,5
42,3
36
35
,256
,915
35,0
21,2
77
37
,946
,408
Exc
ess
of re
venu
es
ove
r exp
endi
ture
s1,
064,
762
(2
74,3
60)
2,17
7,41
3
(22,
479,
988)
(52,
523,
784)
(13,
171,
695)
(3,1
12,2
35)
(3
,212
,101
)
548,
453
1,36
5,22
7
Oth
er fi
nanc
ing
sour
ces
(use
s)
Tran
sfer
s in
13,7
04,8
46
13
,969
,967
24,3
04,7
04
24
,901
,136
21,4
00,0
00
19
,530
,205
11,0
00,0
00
8,
750,
000
8,
650,
000
9,
700,
000
Tr
ansf
ers
out
(13,
129,
846)
(13,
707,
461)
(24,
304,
704)
(24,
901,
136)
(21,
400,
000)
(20,
030,
205)
(11,
200,
000)
(9,0
00,0
00)
(9
,050
,000
)
(10,
100,
000)
Sal
e of
cap
ital a
sset
s43
,119
38
2
-
-
39,3
24,8
74
-
-
-
-
-
Is
suan
ce o
f med
ium
term
fina
ncin
g-
1,
500,
000
-
-
-
-
-
-
-
3,
000,
000
Is
suan
ce o
f ref
undi
ng b
onds
-
5,91
8,33
4
-
89,5
23,2
83
-
-
-
-
-
-
Is
suan
ce o
f bon
ds-
-
10
4,25
1,48
1
-
-
-
-
-
-
-
P
aym
ent t
o re
fund
ed d
ebt e
scro
w a
gent
-
(5,8
77,5
82)
-
(8
8,64
1,25
7)
(3
9,32
4,87
4)
-
-
-
-
-
Is
suan
ce o
f cap
ital l
ease
-
-
-
-
-
-
-
125,
896
-
-
Tota
l oth
er fi
nanc
ing
sour
ces
(use
s)
618,
119
1,80
3,64
0
104,
251,
481
882,
026
-
(500
,000
)
(2
00,0
00)
(124
,104
)
(4
00,0
00)
2,60
0,00
0
Net
cha
nge
in fu
nd b
alan
ce1,
682,
881
$
1,
529,
280
$
10
6,42
8,89
4$
(2
1,59
7,96
2)$
(5
2,52
3,78
4)$
(1
3,67
1,69
5)$
(3
,312
,235
)$
(3,3
36,2
05)
$
14
8,45
3$
3,
965,
227
$
Deb
t ser
vice
as
a pe
rcen
tage
of
non
capi
tal e
xpen
ditu
res
37.1
0%37
.09%
39.9
7%48
.16%
46.1
0%44
.44%
33.2
4%30
.50%
27.6
0%27
.01%
Page 239

Rat
e fo
r pro
pert
ies
with
in th
e C
ity o
f Spa
rks
and
rela
ted
allo
catio
n of
thos
e ta
xes:
Fisc
alN
atio
nal
Even
tsC
ity
Park
and
Was
hoe
Stat
eYe
arR
SCVA
Spar
ksB
owlin
g (2
)C
ente
rC
ente
r (1)
Rai
lroad
Rec
reat
ion
Cou
nty
of N
evad
aTo
tal
2007
8.62
5
2.
5
1.0
-
1.
0
-
-
-
0.37
5
13
.520
068.
625
2.5
1.
0
-
1.0
-
-
-
0.
375
13.5
2005
8.62
5
2.
5
1.0
-
1.
0
-
-
-
0.37
5
13
.520
048.
625
2.5
1.
0
-
1.0
-
-
-
0.
375
13.5
2003
8.62
5
-
1.
0
-
1.0
-
-
-
0.
375
11.0
2002
8.62
5
-
1.
0
-
1.0
-
-
-
0.
375
11.0
2001
8.62
5
-
1.
0
-
1.0
-
-
-
0.
375
11.0
2000
8.62
5
-
1.
0
-
1.0
-
-
-
0.
375
11.0
1999
6.62
5
-
1.
0
-
-
-
-
-
0.37
5
8.
019
986.
625
-
1.0
-
-
-
-
-
0.
375
8.0
Rat
e fo
r pro
pert
ies
with
in th
e D
ownt
own
Ren
o an
d re
late
d al
loca
tion
of th
ose
taxe
s:
Fisc
alN
atio
nal
Even
tsC
ity
Park
and
Was
hoe
Stat
eYe
arR
SCVA
Spar
ksB
owlin
g (2
)C
ente
rC
ente
r (1)
Rai
lroad
Rec
reat
ion
Cou
nty
of N
evad
aTo
tal
2007
8.62
5
-
1.
0
1.5
-
1.
0
1.0
-
0.
375
13.5
2006
8.62
5
-
1.
0
1.5
-
1.
0
1.0
-
0.
375
13.5
2005
8.62
5
-
1.
0
1.5
-
1.
0
1.0
-
0.
375
13.5
2004
8.62
5
-
1.
0
1.5
-
1.
0
1.0
-
0.
375
13.5
2003
8.62
5
-
1.
0
1.5
-
1.
0
1.0
-
0.
375
13.5
2002
8.62
5
-
1.
0
1.5
-
1.
0
1.0
-
0.
375
13.5
2001
8.62
5
-
1.
0
-
-
1.0
1.
0
-
0.37
5
12
.020
008.
625
-
1.0
-
-
1.
0
1.0
-
0.
375
12.0
1999
662
51
01
01
00
375
100
Ren
o-Sp
arks
Con
vent
ion
& V
isito
rs A
utho
rity
Roo
m T
ax R
ates
by
Loca
tion
Last
Ten
Fis
cal Y
ears
(Una
udite
d)
City
of R
eno
City
of R
eno
1999
6.62
5
-
1.0
-
-
1.
0
1.0
-
0.
375
10
.019
986.
625
-
1.0
-
-
-
1.
0
-
0.37
5
9.
0
Rat
e fo
r pro
pert
ies
with
in th
e C
ity o
f Ren
o (p
rope
rtie
s no
t loc
ated
in th
e D
ownt
own
Cen
ter)
and
rela
ted
allo
catio
n of
thos
e ta
xes:
Fisc
alN
atio
nal
Even
tsC
ity
Park
and
Was
hoe
Stat
eYe
arR
SCVA
Spar
ksB
owlin
g (2
)C
ente
rC
ente
r (1)
Rai
lroad
Rec
reat
ion
Cou
nty
of N
evad
aTo
tal
2007
8.62
5
-
1.
0
-
1.0
-
1.
0
-
0.37
5
12
.020
068.
625
-
1.0
-
1.
0
-
1.0
-
0.
375
12.0
2005
8.62
5
-
1.
0
-
1.0
-
1.
0
-
0.37
5
12
.020
048.
625
-
1.0
-
1.
0
-
1.0
-
0.
375
12.0
2003
8.62
5
-
1.
0
-
1.0
-
1.
0
-
0.37
5
12
.020
028.
625
-
1.0
-
1.
0
-
1.0
-
0.
375
12.0
2001
8.62
5
-
1.
0
-
1.0
-
1.
0
-
0.37
5
12
.020
008.
625
-
1.0
-
1.
0
-
1.0
-
0.
375
12.0
1999
6.62
5
-
1.
0
-
-
-
1.0
-
0.
375
9.0
1998
6.62
5
-
1.
0
-
-
-
1.0
-
0.
375
9.0
Rat
e fo
r pro
pert
ies
with
in u
ninc
orpo
rate
d W
asho
e C
ount
y an
d re
late
d al
loca
tion
of th
ose
taxe
s:
Fisc
alN
atio
nal
Even
tsC
ity
Park
and
Was
hoe
Stat
eYe
arR
SCVA
Spar
ksB
owlin
g (2
)C
ente
rC
ente
r (1)
Rai
lroad
Rec
reat
ion
Cou
nty
of N
evad
aTo
tal
2007
8.62
5
-
1.
0
-
1.0
-
-
1.
0
0.37
5
12
.020
068.
625
-
1.0
-
1.
0
-
-
1.0
0.
375
12.0
2005
8.62
5
-
1.
0
-
1.0
-
-
1.
0
0.37
5
12
.020
048.
625
-
1.0
-
1.
0
-
-
1.0
0.
375
12.0
2003
8.62
5
-
1.
0
-
1.0
-
-
1.
0
0.37
5
12
.020
028.
625
-
1.0
-
1.
0
-
-
1.0
0.
375
12.0
2001
8.62
5
-
1.
0
-
1.0
-
-
1.
0
0.37
5
12
.020
008.
625
-
1.0
-
1.
0
-
-
1.0
0.
375
12.0
1999
6.62
5
-
1.
0
-
-
-
-
1.0
0.
375
9.0
1998
6.62
5
-
1.
0
-
-
-
-
1.0
0.
375
9.0
(1) T
his
is a
tax
impo
sed
for t
he p
urpo
se o
f bui
ldin
g a
mul
ti-pu
rpos
e fa
cilit
y in
dow
ntow
n R
eno.
The
Aut
horit
y re
tain
ed th
e fu
nds
until
a c
apita
l im
prov
emen
t pla
n w
as
agr
eed
upon
and
the
met
hods
in w
hich
the
proj
ect w
ill be
fund
ed h
ad b
een
iden
tifie
d. (I
mpo
sed
June
199
9; R
etai
ned
thro
ugh
Oct
ober
200
0)
(2)
This
is a
1%
tax
impo
sed
by th
e St
ate
of N
evad
a. T
he e
ntire
am
ount
is c
olle
cted
and
adm
inis
tere
d by
the
Auth
ority
. The
pro
ceed
s ar
e re
stric
ted
and
can
only
be
use
d fo
r the
ope
ratio
ns o
r pay
men
t of d
ebt s
ervi
ce a
ssoc
iate
d w
ith th
e N
atio
nal B
owlin
g St
adiu
m. T
axes
tran
sfer
red
upon
sal
e of
the
Stad
ium
dur
ing
2002
.
City
of R
eno
City
of R
eno
Page 240

Num
ber
Perc
enta
ge o
fN
umbe
rPe
rcen
tage
of
of R
oom
sR
ank
Tota
l Roo
ms
of R
oom
sR
ank
Tota
l Roo
ms
Gra
nd S
ierr
a R
esor
t/Ren
o H
ilton
1,99
5
17.
94%
2,00
1
17.
20%
Silv
er L
egac
y 1,
710
2
6.81
%1,
720
2
6.19
%C
ircus
Circ
us1,
572
3
6.26
%1,
572
3
5.66
%N
ugge
t1,
407
4
5.60
%1,
407
4
5.06
%Pe
pper
mill
Hot
el/C
asin
o1,
070
5
4.26
%1,
075
5
3.87
%At
lant
is H
otel
/Cas
ino
975
63.
88%
592
92.
13%
Har
rah'
s92
8
7
3.69
%-
-
Sa
nds
Reg
ency
833
83.
32%
938
63.
38%
Eldo
rado
Hot
el/C
asin
o81
5
9
3.24
%81
8
7
2.94
%
Ren
o-Sp
arks
Con
vent
ion
& V
isito
rs A
utho
rity
Prin
cipa
l Roo
m T
axpa
yers
(Una
udite
d)Ju
ne 3
0, 2
007
and
1998
Taxp
ayer
2007
1998
Fisc
al Y
ear
Hya
tt - L
ake
Taho
e42
2
10
1.68
%-
-
Fl
amin
go H
ilton
-
-
604
82.
17%
Sund
owne
r Hot
el/C
asin
o-
-
58
3
10
2.10
%Al
l Oth
er H
otel
s13,
150
12
.54%
9,79
0
35.2
3%To
tal A
ll H
otel
s14
,877
59
.22%
21,1
00
75.9
2%M
otel
s3,
634
14
.47%
-
0.00
%O
ther
Ren
tal P
rope
rties
6,61
0
26.3
1%6,
692
24
.08%
Tota
l Roo
m In
vent
ory
25,1
21
10
0.00
%27
,792
100.
00%
The
chie
f rev
enue
sou
rce
of th
e Au
thor
ity is
from
room
lice
nse
taxe
s im
pose
d on
tran
sien
t ren
tal f
acilit
ies
loca
ted
in W
asho
e C
ount
y. T
he p
rope
rties
list
ed a
bove
repr
esen
t the
larg
est p
rope
rties
in th
is a
rea
and
acco
rdin
gly,
repr
esen
t the
gro
up w
hich
gen
erat
es th
e la
rges
t vol
ume
of ro
om li
cens
e ta
x re
venu
es.
1 For J
une
30, 1
998
All O
ther
Hot
els
incl
udes
Mot
els
Page 241

Bus
ines
s Ty
pe-A
ctiv
ities
Gen
eral
Tota
lFi
scal
Obl
igat
ion
Med
ium
Ter
mC
apita
lC
apita
lPr
imar
yYe
arB
onds
Obl
igat
ions
Leas
esLe
ases
Gov
ernm
ent
2007
135,
554,
189
$
3,00
0,00
0$
40,8
08$
-$
138,
594,
997
$
2006
138,
075,
844
-
82,9
29
-
138,
158,
773
2005
140,
099,
440
-
122,
686
98,4
00
140,
320,
526
2004
142,
592,
488
-
-
156,
204
142,
748,
692
2003
144,
774,
769
-
-
208,
272
144,
983,
041
2002
150,
578,
651
-
-
-
150,
578,
651
2001
193,
497,
043
-
-
-
193,
497,
043
2000
186,
393,
491
-
-
-
186,
393,
491
1999
84,2
68,9
05
1,
748,
699
-
-
86
,017
,604
1998
8697
140
281
145
187
782
853
Gov
ernm
enta
l Act
iviti
es
Ren
o-Sp
arks
Con
vent
ion
& V
isito
rs A
utho
rity
Out
stan
ding
Deb
t by
Type
Last
Ten
Fis
cal Y
ears
(Una
udite
d)(a
mou
nts
expr
esse
d in
thou
sand
s)
1998
86,9
71,4
02
81
1,45
1
-
-
87
,782
,853
Not
e: D
etai
ls re
gard
ing
the
outs
tand
ing
debt
can
be
foun
d in
the
note
s to
the
finan
cial
sta
tem
ents
.
Not
e: P
aym
ent o
f gen
eral
obl
igat
ion
bond
s an
d m
ediu
m te
rm o
blig
atio
ns is
pro
vide
d by
tran
sien
t lod
ging
taxe
s (g
over
nmen
tal a
ctiv
ities
),
pay
men
t of c
apita
l lea
ses
is p
rovi
ded
by fa
cilit
y ch
arge
s (g
over
nmen
tal a
ctiv
ities
), pa
ymen
t of c
apita
l lea
ses
is p
rovi
ded
by
g
olf c
ours
e op
erat
ions
(bus
ines
s-ty
pe a
ctiv
ities
).
Page 242

General Less: AmountsFiscal Obligation Available in Debt Year Bonds Service Fund Total
2007 135,554,189$ 14,300,051$ 121,254,138$ 2006 138,075,844 14,035,658 124,040,186 2005 140,099,440 14,461,016 125,638,424 2004 142,592,488 16,350,560 126,241,928 2003 144,774,769 16,801,315 127,973,454 2002 150,578,651 11,443,589 139,135,062 2001 193,497,043 11,319,665 182,177,378 2000 186,393,491 10,846,124 175,547,367 1999 84,268,905 1,006,688 83,262,217 1998 86,971,402 1,754,542 85,216,860
Last Ten Fiscal Years(Unaudited)
Reno-Sparks Convention & Visitors AuthorityGeneral Bonded Debt Outstanding
Note: Details regarding the outstanding debt can be found in the notes to the financial statements.
Note: Payment of general obligation bonds is provided by transient lodging taxes.
Page 243

General PresentObligation Self-Supporting Percent
Debt General Applicable ApplicableOutstanding Obligation Debt to Washoe Net Debt
Name of Government Unit (Thousands) (Thousands) County (Thousands)
Debt repaid with property taxes: Washoe County - Governmental Funds 262,497$ 193,417$ 100% 69,080$ Washoe County - Special Assessments 4,052 4,052 100% - Washoe County School District 480,405 - 100% 480,405 City of Reno 90,865 - 100% 90,865 City of Sparks 9,955 - 100% 9,955 Sparks - Sewer/Utility 49,489 49,489 100% - Washoe County (RSCVA) 135,554 135,554 100% -
Total Overlapping Bonded Debt 650,305$
Note: The Authority's schedule of overlapping bonding debt is the same as Washoe County, Nevada's. Overlapping governments are those that coincide, at least in part, with the geographic boundaries of the County. The outstanding debt of those overlapping governments is borne by the residents and businesses of Washoe County. When considering the ability to issue and repaylong term debt the entire debt burden borne by the residents and businesses should be taken into account However every
(Unaudited)
Reno-Sparks Convention & Visitors AuthorityDirect and Overlapping Governmental Activities Bonded Debt
June 30, 2007
long-term debt, the entire debt burden borne by the residents and businesses should be taken into account. However, every taxpayer is not responsible for repaying the debt of each overlapping government.
Direct debt: Washoe County (RSCVA) 135,554$
Note: Payment of general obligation bonds is provided by transient lodging taxes.
Source: JNA Consulting Group
Page 244

1998
1999
2000
2001
2002
2003
2004
2005
2006
2007
Deb
t lim
it 24
3,10
8$
226,
291
$
23
8,28
7$
251,
736
$
25
0,25
5$
255,
914
$
28
0,76
4$
309,
508
$
39
3,23
2$
412,
360
$
Tota
l net
deb
t app
licab
le to
lim
it85
,217
83,2
62
17
5,54
7
182,
177
13
9,13
5
127,
973
12
6,24
2
125,
638
12
4,04
0
121,
254
Lega
l deb
t mar
gin
157,
891
$
14
3,02
9$
62,7
40$
69
,559
$
111,
120
$
12
7,94
1$
154,
522
$
18
3,87
0$
269,
192
$
29
1,10
6$
Tota
l net
deb
t app
licab
le to
the
limit
a
s a
perc
enta
ge o
f deb
t lim
it35
.05%
36.7
9%73
.67%
72.3
7%55
.60%
50.0
1%44
.96%
40.5
9%31
.54%
29.4
0%
Asse
ssed
val
ue13
,745
,319
$
Deb
t lim
it (3
% o
f ass
esse
d va
lue)
412,
360
Deb
t app
licab
le to
deb
t lim
it
Gen
eral
obl
igat
ion
bond
s13
5,55
4
(Una
udite
d)
Fisc
al Y
ear
(am
ount
s ex
pres
sed
in th
ousa
nds)
Ren
o-Sp
arks
Con
vent
ion
& V
isito
rs A
utho
rity
Lega
l Deb
t Mar
gin
Info
rmat
ion
Last
Ten
Fis
cal Y
ears
Amou
nts
set a
side
for r
epay
men
t o
f gen
eral
obl
igat
ion
debt
(14,
300)
Tota
l net
deb
t app
licab
le to
lim
it12
1,25
4
Lega
l deb
t mar
gin
291,
106
$
Not
e: T
he g
ener
al o
blig
atio
n de
bt s
ubje
ct to
the
limita
tion
may
be
offs
et b
y am
ount
s se
t asi
de fo
r rep
ayin
g ge
nera
l obl
igat
ions
bon
ds.
Sour
ce: J
NA
Con
sulti
ng G
roup
Page 245
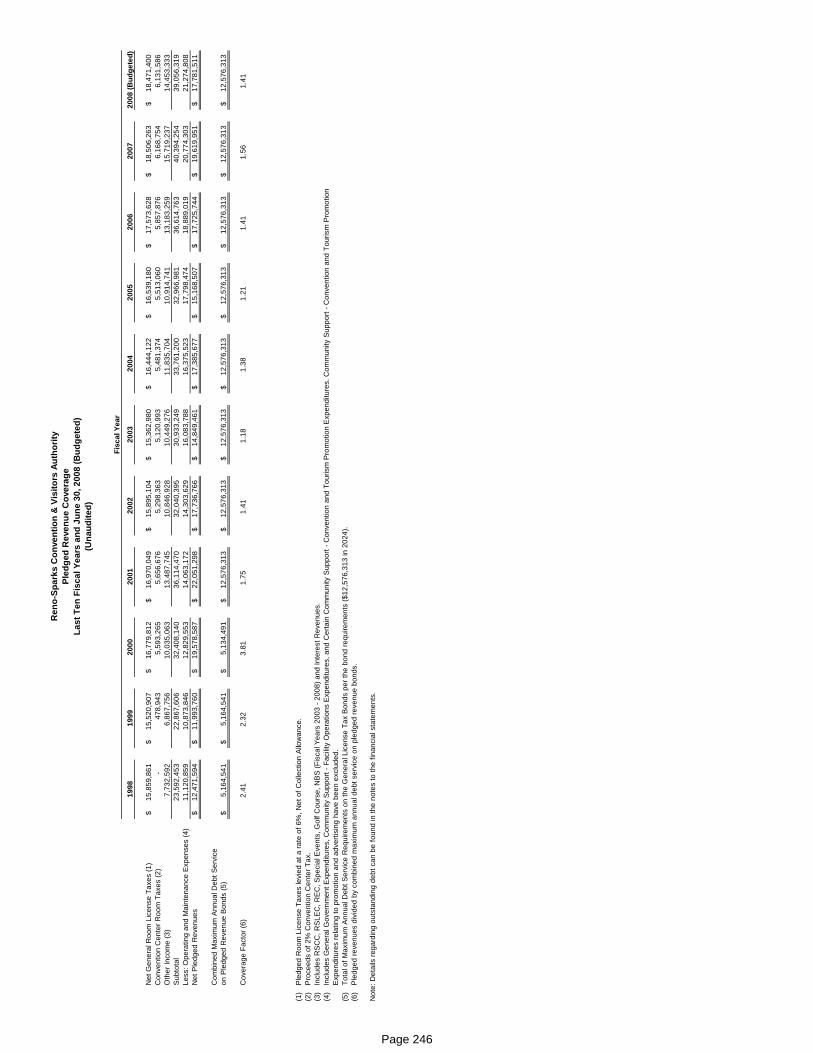
1998
1999
2000
2001
2002
2003
2004
2005
2006
2007
2008
(Bud
gete
d)
Net
Gen
eral
Roo
m L
icen
se T
axes
(1)
15,8
59,8
61$
15,5
20,9
07$
16,7
79,8
12$
16,9
70,0
49$
15,8
95,1
04$
15,3
62,9
80$
16,4
44,1
22$
16,5
39,1
80$
17,5
73,6
28$
18,5
06,2
63$
18,4
71,4
00$
Con
vent
ion
Cen
ter R
oom
Tax
es (2
)-
47
8,94
3
5,
593,
265
5,
656,
676
5,
298,
363
5,
120,
993
5,
481,
374
5,
513,
060
5,
857,
876
6,
168,
754
6,
131,
586
O
ther
Inco
me
(3)
7,73
2,59
26,
867,
756
10,0
35,0
6313
,487
,745
10,8
46,9
2810
,449
,276
11,8
35,7
0410
,914
,741
13,1
83,2
5915
,719
,237
14,4
53,3
33S
ubto
tal
23,5
92,4
5322
,867
,606
32,4
08,1
4036
,114
,470
32,0
40,3
9530
,933
,249
33,7
61,2
0032
,966
,981
36,6
14,7
6340
,394
,254
39,0
56,3
19Le
ss: O
pera
ting
and
Mai
nten
ance
Exp
ense
s (4
)11
,120
,859
10,8
73,8
4612
,829
,553
14,0
63,1
7214
,303
,629
16,0
83,7
8816
,375
,523
17,7
98,4
7418
,889
,019
20,7
74,3
0321
,274
,808
Net
Ple
dged
Rev
enue
s12
,471
,594
$
11
,993
,760
$
19
,578
,587
$
22
,051
,298
$
17
,736
,766
$
14
,849
,461
$
17
,385
,677
$
15
,168
,507
$
17
,725
,744
$
19
,619
,951
$
17
,781
,511
$
Com
bine
d M
axim
um A
nnua
l Deb
t Ser
vice
on P
ledg
ed R
even
ue B
onds
(5)
5,16
4,54
1$
5,16
4,54
1$
5,13
4,49
1$
12,5
76,3
13$
12,5
76,3
13$
12,5
76,3
13$
12,5
76,3
13$
12,5
76,3
13$
12,5
76,3
13$
12,5
76,3
13$
12,5
76,3
13$
Cov
erag
e Fa
ctor
(6)
2.41
2.32
3.81
1.75
1.41
1.18
1.38
1.21
1.41
1.56
1.41
(1)
Ple
dged
Roo
m L
icen
se T
axes
levi
ed a
t a ra
te o
f 6%
, Net
of C
olle
ctio
n A
llow
ance
.(2
)P
roce
eds
of 2
% C
onve
ntio
n C
ente
r Tax
.(3
)In
clud
es R
SC
C, R
SLE
C, R
EC
, Spe
cial
Eve
nts,
Gol
f Cou
rse,
NB
S (F
isca
l Yea
rs 2
003
- 200
8) a
nd In
tere
st R
even
ues.
(4
)In
clud
es G
ener
al G
over
nmen
t Exp
endi
ture
s, C
omm
unity
Sup
port
- Fac
ility
Ope
ratio
ns E
xpen
ditu
res,
and
Cer
tain
Com
mun
ity S
uppo
rt - C
onve
ntio
n an
d To
uris
m P
rom
otio
n E
xpen
ditu
res.
Com
mun
ity S
uppo
rt - C
onve
ntio
n an
d To
uris
m P
rom
otio
nE
xpen
ditu
res
rela
ting
to p
rom
otio
n an
d ad
verti
sing
hav
e be
en e
xclu
ded.
(5)
Tota
l of M
axim
um A
nnua
l Deb
t Ser
vice
Req
uire
men
ts o
n th
e G
ener
al L
icen
se T
ax B
onds
per
the
bond
requ
irem
ents
($12
,576
,313
in 2
024)
.(6
)P
ledg
ed re
venu
es d
ivid
ed b
y co
mbi
ned
max
imum
ann
ual d
ebt s
ervi
ce o
n pl
edge
d re
venu
e bo
nds.
Not
e: D
etai
ls re
gard
ing
outs
tand
ing
debt
can
be
foun
d in
the
note
s to
the
finan
cial
sta
tem
ents
.
Last
Ten
Fis
cal Y
ears
and
Jun
e 30
, 200
8 (B
udge
ted)
Ren
o-Sp
arks
Con
vent
ion
& V
isito
rs A
utho
rity
Pled
ged
Rev
enue
Cov
erag
e
(Una
udite
d)
Fisc
al Y
ear
Page 246

Tota
lPe
rU
nem
ploy
men
tPe
rson
alTa
xabl
eG
ross
Gam
ing
Tota
lFi
scal
Cap
itaM
edia
nSc
hool
Rat
eIn
com
eSa
les
Win
Pass
enge
rYe
arPo
pula
tion
Inco
me
Age
Enro
llmen
t(P
erce
nt)
(Tho
usan
ds)
(Tho
usan
ds)
(Tho
usan
ds)
Air T
raffi
c(1
)(1
)(2
)(3
)(4
)(1
)(5
)(6
)(7
)
2007
409,
085
45
,711
$
36
.263
,046
4.
40%
18,8
83,2
03$
7,
202,
641
$
1,06
9,60
8$
5,01
4,38
2
20
0639
6,84
4
43,4
92
36.0
62,3
90
4.00
%17
,452
,129
7,26
8,59
3
1,
072,
937
5,
149,
700
2005
383,
453
41
,382
35
.962
,098
3.
70%
16,1
29,5
09
6,
687,
447
1,01
6,86
4
5,09
7,17
0
20
0437
3,23
3
40,1
46
36.7
60,4
11
4.00
%15
,039
,256
6,00
3,36
8
1,
011,
658
4,
918,
829
2003
359,
423
37
,465
39
.158
,908
4.
60%
14,1
95,2
66
5,
481,
583
1,03
2,98
8
4,51
4,22
5
20
0235
3,27
136
,679
35
.857
,592
4.
60%
13,4
20,2
295,
280,
706
1,04
9,15
2
4,48
5,36
920
0134
1,93
537
,356
35.0
55,6
73
4.10
%13
,139
,838
5,21
3,74
21,
113,
315
5,33
2,43
520
0033
4,60
136
,095
37.3
54,1
21
3.00
%12
,322
,546
4,96
6,61
31,
121,
396
5,94
7,05
519
9932
7,89
933
,915
37.2
54,0
88
3.
60%
11,2
88,1
864,
679,
516
1,03
8,80
56,
318,
665
Ren
o-Sp
arks
Con
vent
ion
& V
isito
rs A
utho
rity
Dem
ogra
phic
and
Eco
nom
ic S
tatis
tics
Last
Ten
Fis
cal Y
ears
(Una
udite
d)
1998
320,
828
32
,265
36
.552
,675
3.
80%
10,4
75,4
46
4,
377,
548
1,00
9,35
3
7,04
7,66
0
The
abov
e es
timat
es w
ere
obta
ined
from
:
(1)
Was
hoe
Cou
nty
Dep
artm
ent o
f Com
mun
ity D
evel
opm
ent 1
998,
200
0-20
02.
Bure
au o
f Eco
nom
ic a
nd B
usin
ess
Res
earc
h, U
nive
rsity
of N
evad
a - R
eno,
199
9.
N
evad
a D
epar
tmen
t of E
mpl
oym
ent,
Trai
ning
and
Reh
abilit
atio
n, 2
003-
2004
.
Bu
reau
of E
cono
mic
Ana
lysi
s, 2
005-
2007
.
(2)
Bure
au o
f Eco
nom
ic a
nd B
usin
ess
Res
earc
h, U
nive
rsity
of N
evad
a - R
eno,
199
8 - 2
004.
CB
Ric
hard
Ellis
Dem
ogra
phic
Rep
ort 2
005-
2007
.
(3)
Was
hoe
Cou
nty
Scho
ol D
istri
ct e
nrol
lmen
ts.
(4)
Nev
ada
Dep
artm
ent o
f Em
ploy
men
t Sec
urity
.
(5)
Bure
au o
f Eco
nom
ic a
nd B
usin
ess
Res
earc
h, U
nive
rsity
of N
evad
a - R
eno
1998
.
S
tate
Dep
artm
ent o
f Tax
atio
n 19
99-2
007.
(6)
Bure
au o
f Eco
nom
ic a
nd B
usin
ess
Res
earc
h, U
nive
rsity
of N
evad
a - R
eno
1998
.
S
tate
of N
evad
a, G
amin
g C
ontro
l Boa
rd, 1
999-
2007
.
(7)
Bure
au o
f Eco
nom
ic a
nd B
usin
ess
Res
earc
h, U
nive
rsity
of N
evad
a - R
eno,
199
8-20
02.
R
eno-
Taho
e In
tern
atio
nal A
irpor
t, 20
03-2
007.
Page 247
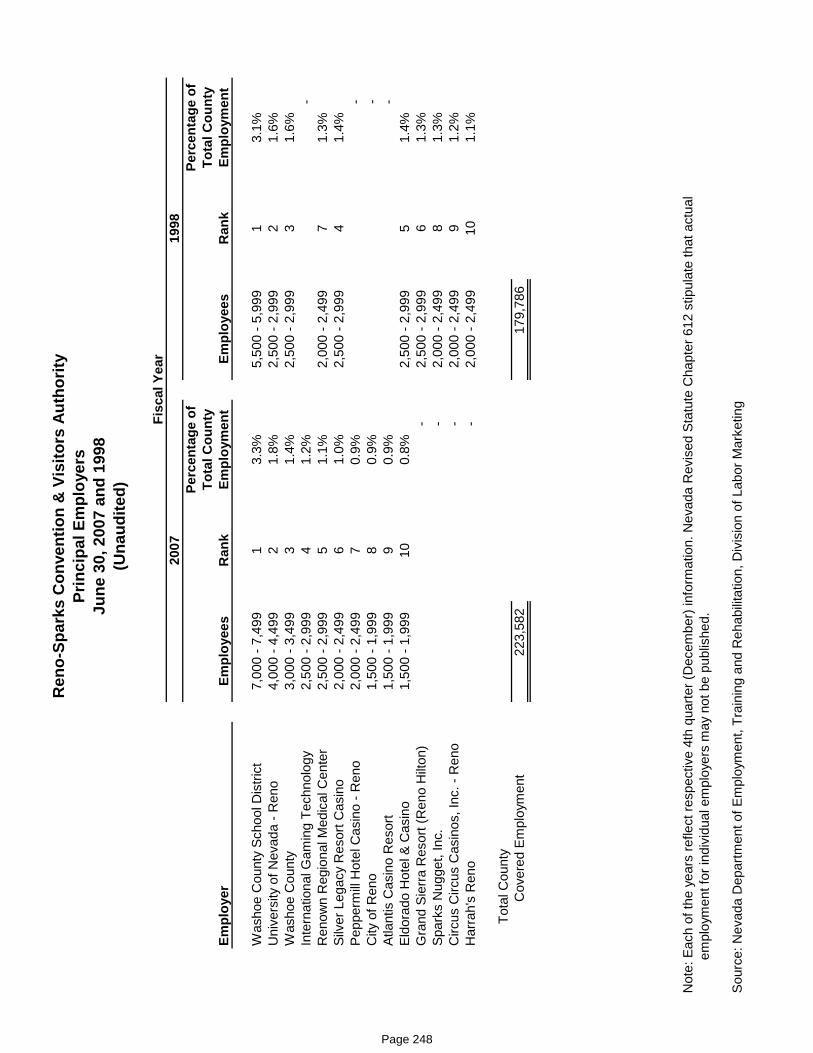
Perc
enta
ge o
fPe
rcen
tage
of
Tota
l Cou
nty
Tota
l Cou
nty
Empl
oyee
sR
ank
Empl
oym
ent
Empl
oyee
sR
ank
Empl
oym
ent
Was
hoe
Cou
nty
Scho
ol D
istri
ct7,
000
- 7,4
991
3.3%
5,50
0 - 5
,999
13.
1%U
nive
rsity
of N
evad
a - R
eno
4,00
0 - 4
,499
21.
8%2,
500
- 2,9
992
1.6%
Was
hoe
Cou
nty
3,00
0 - 3
,499
31.
4%2,
500
- 2,9
993
1.6%
Inte
rnat
iona
l Gam
ing
Tech
nolo
gy2,
500
- 2,9
994
1.2%
-
Ren
own
Reg
iona
l Med
ical
Cen
ter
2,50
0 - 2
,999
51.
1%2,
000
- 2,4
997
1.3%
Silv
er L
egac
y R
esor
t Cas
ino
2,00
0 - 2
,499
61.
0%2,
500
- 2,9
994
1.4%
Pepp
erm
ill H
otel
Cas
ino
- Ren
o2,
000
- 2,4
997
0.9%
-
City
of R
eno
1,50
0 - 1
,999
80.
9%-
Empl
oyer
Ren
o-Sp
arks
Con
vent
ion
& V
isito
rs A
utho
rity
Prin
cipa
l Em
ploy
ers
June
30,
200
7 an
d 19
98(U
naud
ited)
Fisc
al Y
ear
2007
1998
Atla
ntis
Cas
ino
Res
ort
1,50
0 - 1
,999
90.
9%-
El
dora
do H
otel
& C
asin
o1,
500
- 1,9
9910
0.8%
2,50
0 - 2
,999
51.
4%G
rand
Sie
rra
Res
ort (
Ren
o H
ilton
)-
2,
500
- 2,9
996
1.3%
Spa
rks
Nug
get,
Inc.
-
2,
000
- 2,4
998
1.3%
Circ
us C
ircus
Cas
inos
, Inc
. - R
eno
-
2,00
0 - 2
,499
91.
2%H
arra
h's
Ren
o-
2,
000
- 2,4
9910
1.1%
Tota
l Cou
nty
C
over
ed E
mpl
oym
ent
223,
582
17
9,78
6
Not
e: E
ach
of th
e ye
ars
refle
ct re
spec
tive
4th
quar
ter (
Dec
embe
r) in
form
atio
n. N
evad
a R
evis
ed S
tatu
te C
hapt
er 6
12 s
tipul
ate
that
act
ual
em
ploy
men
t for
indi
vidu
al e
mpl
oyer
s m
ay n
ot b
e pu
blis
hed.
Sour
ce: N
evad
a D
epar
tmen
t of E
mpl
oym
ent,
Trai
ning
and
Reh
abilit
atio
n, D
ivis
ion
of L
abor
Mar
ketin
g
Page 248
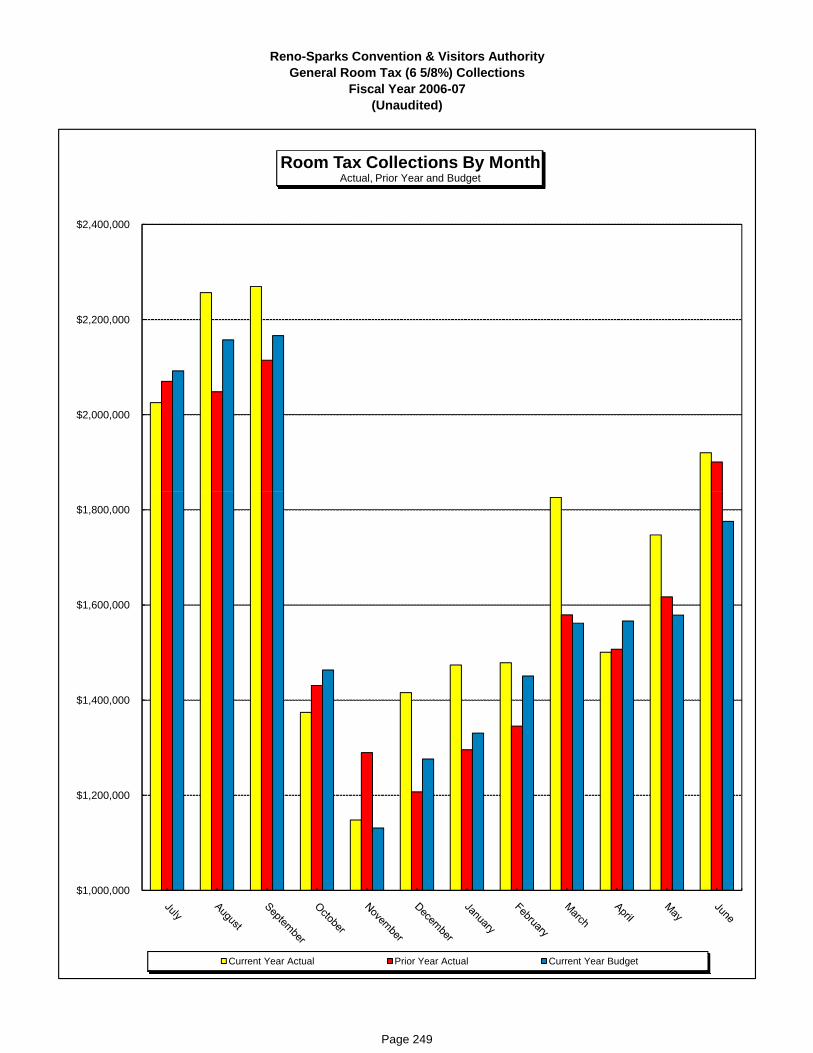
1217
Reno-Sparks Convention & Visitors AuthorityGeneral Room Tax (6 5/8%) Collections
Fiscal Year 2006-07(Unaudited)
$2,000,000
$2,200,000
$2,400,000
Room Tax Collections By MonthActual, Prior Year and Budget
$1,000,000
$1,200,000
$1,400,000
$1,600,000
$1,800,000
Current Year Actual Prior Year Actual Current Year Budget
Page 249

1998
1999
2000
2001
2002
2003
2004
2005
2006
2007
Func
tion
Gen
eral
Gov
ernm
ent
1520
2026
2827
2525
25
27
Cul
ture
and
Rec
reat
ion
5050
5050
5055
5555
55
55
Com
mun
ity S
uppo
rt14
014
815
516
016
016
016
517
020
0
20
0
Tota
l20
5
21
8
22
5
23
6
23
8
24
2
24
5
25
0
28
0
28
2
Fisc
al Y
ear
Ren
o-Sp
arks
Con
vent
ion
& V
isito
rs A
utho
rity
Full-
time
Equi
vale
nt E
mpl
oyee
s by
Fun
ctio
nLa
st T
en F
isca
l Yea
rs(U
naud
ited)
Not
es:
(1
) Inf
orm
atio
n pr
ovid
ed o
n bu
dget
ed e
mpl
oyee
s.
(2) C
ultu
re &
Rec
reat
ion
repr
esen
ts b
usin
ess-
type
act
iviti
es (G
olf C
ours
es)
Page 250

Con
vent
ion
Cen
ter
Fisc
alN
umbe
r of
Est
imat
edN
umbe
r of
Est
imat
edN
umbe
r of
Est
imat
edN
umbe
r of
Est
imat
edYe
arE
vent
sA
ttend
ance
Eve
nts
Atte
ndan
ceE
vent
sA
ttend
ance
Eve
nts
Atte
ndan
ce20
0827
568,
957
156
552,
365
150
75,0
0011
213
8,55
720
0938
363,
260
156
563,
412
130
175,
000
106
131,
629
2010
2832
5,00
014
557
3,41
214
027
5,00
010
412
8,99
620
1122
285,
000
140
575,
550
170
100,
000
102
126,
416
2012
2127
5,36
014
059
3,96
715
020
0,00
010
013
0,00
0
Not
es:
1) D
ue to
em
phas
is o
n ho
stin
g la
rger
eve
nts,
the
num
ber o
f eve
nts
at c
erta
in fa
cilit
ies
is e
stim
ated
to d
ecre
ase.
2) N
umbe
r of e
vent
s in
clud
es c
onve
ntio
ns a
nd tr
ade
show
s cu
rren
tly s
ched
uled
on
a te
ntat
ive
basi
s. (
Not
e: F
irm c
ontra
cted
dat
es
are
issu
ed o
nly
one
year
in a
dvan
ce.)
Ren
o-Sp
arks
Con
vent
ion
& V
isito
rs A
utho
rity
Con
vent
ion
Cen
ter,
Ren
o-Sp
arks
Liv
esto
ck E
vent
s C
ente
r, N
atio
nal B
owlin
g St
adiu
man
d R
eno
Even
ts C
ente
r Act
ivity
Sum
mar
y(U
naud
ited)
Ren
o E
vent
s C
ente
r
Futu
re B
ooki
ngs
and
Proj
ecte
d A
ttend
ance
Ren
o-S
park
s Li
vest
ock
Eve
nts
Cen
ter
Nat
iona
l Bow
ling
Sta
dium
Fisc
alN
umbe
r of
Est
imat
edN
umbe
r of
Est
imat
edN
umbe
r of
Est
imat
edN
umbe
r of
Est
imat
edYe
arE
vent
sA
ttend
ance
Eve
nts
Atte
ndan
ceE
vent
sA
ttend
ance
Eve
nts
Atte
ndan
ce19
9817
51,8
6517
682
3,91
460
165,
590
n/a
n/a
1999
215
299,
360
185
876,
225
110
70,0
00n/
an/
a20
0024
234
4,92
918
090
2,51
177
110,
000
n/a
n/a
2001
8220
1,09
518
090
2,51
113
515
0,00
0n/
an/
a20
0215
935
8,07
516
590
2,51
164
66,8
51n/
an/
a20
0315
735
4,37
714
288
5,22
510
897
,166
n/a
n/a
2004
236
539,
857
150
510,
300
5213
4,50
0n/
an/
a20
0522
950
4,62
814
551
1,12
512
747
,500
6172
,925
2006
257
552,
881
135
515,
125
5011
9,70
048
160,
339
2007
285
576,
161
133
522,
125
8923
9,26
883
169,
014
Not
es:
1) D
ue to
em
phas
is o
n ho
stin
g la
rger
eve
nts,
the
num
ber o
f eve
nts
at c
erta
in fa
cilit
ies
has
falle
n sl
ight
ly in
rece
nt y
ears
. How
ever
, the
em
phas
is o
n fe
wer
but
larg
er e
vent
s m
ay re
sult
in in
crea
sed
atte
ndan
ce.
2) N
umbe
r of e
vent
s in
clud
es a
ll sh
ow a
ctiv
ity (c
onve
ntio
ns, t
rade
sho
ws,
pub
lic c
onsu
mer
sho
ws,
con
certs
and
mee
tings
).
3) T
he R
eno
Eve
nts
Cen
ter o
pene
d Ja
nuar
y 20
05
Ren
o E
vent
s C
ente
r
His
toric
al U
sage
and
Atte
ndan
ce
Con
vent
ion
Cen
ter
Ren
o-S
park
s Li
vest
ock
Eve
nts
Cen
ter
Nat
iona
l Bow
ling
Sta
dium
Page 251


~1i~ AMERICA'S ADVENTURE PLACE Reno-Sparks Convention and Visitors Authority
May 15, 2008
Department of Taxation 1550 E. College Parkway, Suite 115 Carson City, NV 89706
The Reno-Sparks Convention & Visitors Authority herewith submits the final budget for the fiscal year ending June 30, 2009.
This budget contains no funds, including Debt Service, that require property tax revenues.
This budget contains three (3) governmental type funds with estimated expenditures of $39,773,276 and two (2) proprietary funds with estimated expenses of $6,020,228.
Copies of this budget have been filed for public record and inspection in the offices enumerated in NRS 354.596 (Local Government Budget Act).
~E~ Ellen Oppenheim
CEO
certify that all applicable funds and financial operations of this Local Government are listed herein.
Dated: May 15, 2008
visit:renot:a hoe.com
P.O. Box 837 • Reno, NV 89504 • 775-827-7600 • FAX: 775-827-7719
Page 253

Reno-Sparks Convention & Visitors Authority
Final Budget For the Fiscal Year July 1, 2008 – June 30, 2009
Index
Schedule Content/Fund Page Schedule S2 Full Time Equivalent Employees by Function 1 Schedule A Estimated Revenues and Other Resources Governmental
Fund Types, Expendable Trust Funds and Tax Supported Proprietary Fund Types
2
Schedule A1 Estimated Expenditures and Other Financing Uses 3 Schedule A2 Proprietary and Nonexpendable Trust Funds 4 Schedule B General Fund 5 Schedule B2 Capital Projects Fund 8 Schedule C Debt Service Fund 9 Schedule F1 Golf Courses 12 Schedule F2 Golf Courses 13 Schedule F1 Internal Service (Self Insurance) Fund 15 Schedule F2 Internal Service (Self Insurance) Fund 16 Schedule C1 All Existing Or Proposed General Obligation Bonds,
Revenue Bonds, Medium-Term Financing, Capital Leases and Special Assessment Bonds
18
Schedule T Transfer Reconciliation (Operating and Residual Equity) 19 Schedule CP-1 Summary Statement of Capital Projects 20 Schedule CP-2 Statement of Capital Projects, Anticipated Capital Project
Expenses and Proposed Source(s) of Funding Operation & Maintenance
21
Lobbying Lobbying Expense Estimate 22
Page 254

FULL TIME EQUIVALENT EMPLOYEES BY FUNCTION
ACTUAL ESTIMATEDPRIOR YEAR CURRENT YEAR BUDGET YEAR
ENDING 06/30/07 ENDING 06/30/08 ENDING 06/30/09General Government * 27 26 26Culture and Recreation ** 55 55 55Community Support * 200 180 200
Other
TOTAL 282 261 281
Employee's retirement contribution is paid by local government.
POPULATION (AS OF JULY 1) N/A N/A N/ASource of population estimate*Assessed Valuation (Secured and
Unsecured only)Unsecured only)Net Proceeds of MinesTOTAL ASSESSED VALUE
TAX RATE General Fund Special Revenue Funds Debt Service Funds Enterprise Funds Other
TOTAL TAX RATE N/A N/A N/A
* Positions included in general fund as applicable to department.** Positions included in enterprise (Golf Courses) fund.
RENO-SPARKS CONVENTION & VISITORS AUTHORITY
SCHEDULE S-2 - STATISTICAL DATA
PAGE 1LGB 62 Form 4
Page 255

ES
TIM
ATE
D R
EV
EN
UE
S A
ND
OTH
ER
RE
SO
UR
CE
S
SC
HE
DU
LE A
- G
OV
ER
NM
EN
TAL
FUN
D T
YP
ES
, EX
PE
ND
AB
LE T
RU
ST
FUN
DS
AN
D T
AX
SU
PP
OR
TED
PR
OP
RIE
TAR
Y F
UN
D T
YP
ES
Bud
get f
or F
isca
l Yea
r End
ing
June
30,
200
9B
udge
t Sum
mar
y fo
r Ren
o-S
park
s C
onve
ntio
n &
Vis
itors
Aut
horit
y
OTH
ER
FIN
AN
CIN
GG
OV
ER
NM
EN
TAL
FUN
DS
AN
DB
EG
INN
ING
SU
PP
LEM
EN
TAL
AD
VA
LOR
EM
SO
UR
CE
SE
XP
EN
DA
BLE
TR
US
T FU
ND
SFU
ND
CIT
Y/C
OU
NTY
TAX
ES
TAX
OTH
ER
OTH
ER
TH
AN
OP
ER
ATI
NG
FUN
D N
AM
EB
ALA
NC
ES
RE
LIE
F TA
XR
EQ
UIR
ED
RA
TER
EV
EN
UE
STR
AN
SFE
RS
INTR
AN
SFE
RS
INTO
TAL
(1)
(2)
(3)
(4)
(5)
(6)
(7)
(8)
Gen
eral
Fun
d4,
545,
344
00
N/A
38,7
79,5
890
043
,324
,933
Cap
ital P
roje
cts
Fund
1,55
0,57
30
0N
/A79
,050
070
0,00
02,
329,
623
Deb
t Ser
vice
Fun
d15
,450
,475
00
N/A
483,
422
08,
700,
000
24,6
33,8
97
Sub
tota
l Gov
ernm
enta
lF u
nd T
ypes
, Exp
enda
ble
Fund
Typ
es, E
xpen
dabl
eTr
ust F
unds
21,5
46,3
920
0N
/A39
,342
,061
09,
400,
000
70,2
88,4
53
PR
OP
RIE
TAR
Y F
UN
DS
xxxx
xxxx
xx0
00
xxxx
xxxx
xxxx
xxxx
xxxx
xxxx
xxxx
xxxx
xxxx
xxxx
xxxx
xxxx
xx0
00
xxxx
xxxx
xxxx
xxxx
xxxx
xxxx
xxxx
xxxx
xxxx
xxxx
xxxx
xxxx
xx0
00
xxxx
xxxx
xxxx
xxxx
xxxx
xxxx
xxxx
xxxx
xxxx
xxxx
SU
BTO
TAL
PR
OP
RIE
TAR
Y F
UN
DS
xxxx
xxxx
xx0
00
xxxx
xxxx
xxxx
xxxx
xxxx
xxxx
xxxx
xxxx
xxxx
xxxx
TOTA
L A
LL F
UN
DS
xxxx
xxxx
xx0
00
xxxx
xxxx
xxxx
xxxx
xxxx
xxxx
xxxx
xxxx
xxxx
xxxx
PA
GE
2Fo
rm 5
Page 256
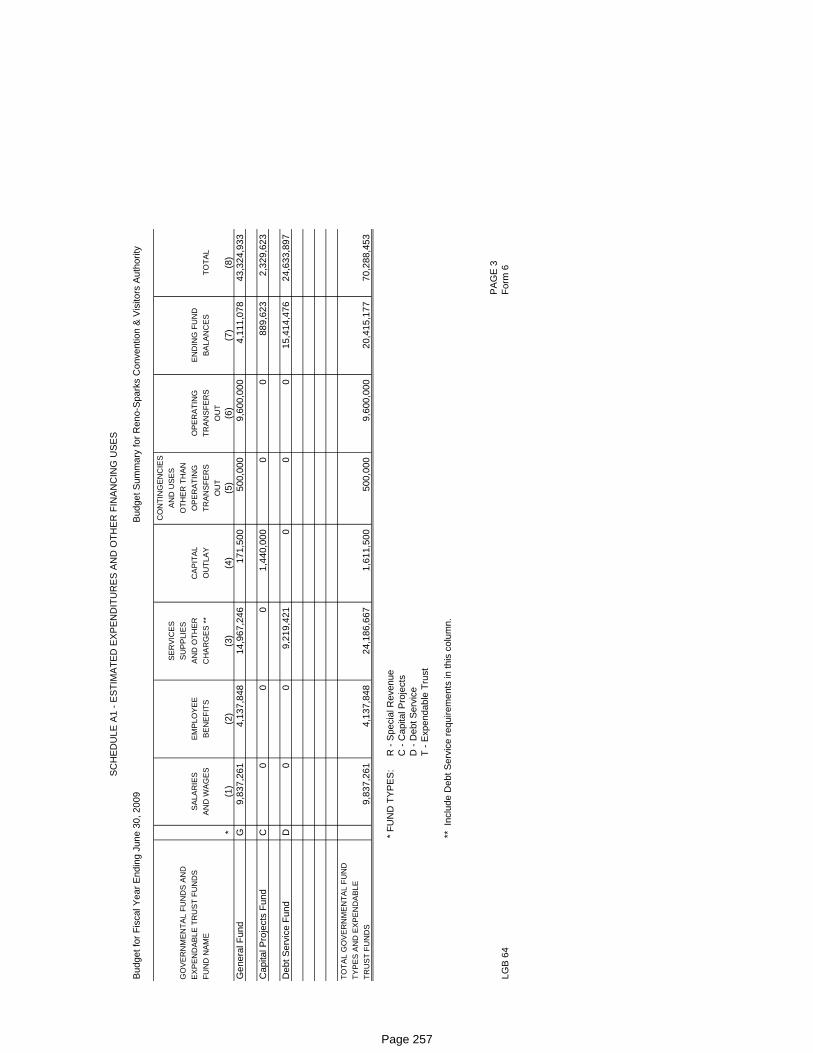
SC
HE
DU
LE A
1 - E
STI
MA
TED
EX
PE
ND
ITU
RE
S A
ND
OTH
ER
FIN
AN
CIN
G U
SE
S
Bud
get f
or F
isca
l Yea
r End
ing
June
30,
200
9B
udge
t Sum
mar
y fo
r Ren
o-S
park
s C
onve
ntio
n &
Vis
itors
Aut
horit
y
CO
NTI
NG
EN
CIE
SS
ER
VIC
ES
AN
D U
SE
SG
OV
ER
NM
EN
TAL
FUN
DS
AN
DS
UP
PLI
ES
OTH
ER
TH
AN
EX
PE
ND
AB
LE T
RU
ST
FUN
DS
SA
LAR
IES
EM
PLO
YE
EA
ND
OTH
ER
CA
PIT
AL
OP
ER
ATI
NG
OP
ER
ATI
NG
EN
DIN
G F
UN
DFU
ND
NA
ME
AN
D W
AG
ES
BE
NE
FITS
CH
AR
GE
S *
*O
UTL
AY
TRA
NS
FER
STR
AN
SFE
RS
BA
LAN
CE
STO
TAL
OU
TO
UT
*(1
)(2
)(3
)(4
)(5
)(6
)(7
)(8
)G
ener
al F
und
G9,
837,
261
4,13
7,84
814
,967
,246
171,
500
500,
000
9,60
0,00
04,
111,
078
43,3
24,9
33
Cap
ital P
roje
cts
Fund
C0
00
1,44
0,00
00
088
9,62
32,
329,
623
Deb
t Ser
vice
Fun
dD
00
9,21
9,42
10
00
15,4
14,4
7624
,633
,897
TO
TAL
GO
VE
RN
ME
NTA
L FU
ND
TY
PE
S A
ND
EX
PE
ND
AB
LE
TR
US
T FU
ND
S9,
837,
261
4,13
7,84
824
,186
,667
1,61
1,50
050
0,00
09,
600,
000
20,4
15,1
7770
,288
,453
* FU
ND
TY
PE
S:
R -
Spe
cial
Rev
enue
C -
Cap
ital P
roje
cts
D -
Deb
t Ser
vice
T - E
xpen
dabl
e Tr
ust
**
Inc
lude
Deb
t Ser
vice
requ
irem
ents
in th
is c
olum
n.
PA
GE
3LG
B 6
4Fo
rm 6
Page 257

SC
HE
DU
LE A
2 - P
RO
PR
IETA
RY
AN
D N
ON
EX
PE
ND
AB
LE T
RU
ST
FUN
DS
Bud
get f
or F
isca
l Yea
r End
ing
June
30,
200
9B
udge
t Sum
mar
y fo
r Ren
o-S
park
s C
onve
ntio
n &
Vis
itors
Aut
horit
y
OP
ER
ATI
NG
OP
ER
ATI
NG
NO
NO
PE
RA
TIN
GN
ON
OP
ER
ATI
NG
OP
ER
ATI
NG
TR
AN
SFE
RS
FUN
D N
AM
ER
EV
EN
UE
SE
XP
EN
SE
S *
*R
EV
EN
UE
SE
XP
EN
SE
SIN
OU
TN
ET
INC
OM
E*
(1)
(2)
(3)
(4)
(5)
(6)
(7)
Gol
f Cou
rses
E3,
082,
854
3,76
2,10
80
050
0,00
00
(179
,254
)
Sel
f Ins
uran
ce F
und
I2,
039,
027
2,25
8,12
00
00
300,
000
(519
,093
)
TOTA
L5,
121,
881
6,02
0,22
80
050
0,00
030
0,00
0(6
98,3
47)
*FU
ND
TYP
ES
:E
-Ent
erpr
ise
FU
ND
TY
PE
S:
E -
Ent
erpr
ise
I - In
tern
al S
ervi
ceN
- N
onex
pend
able
Tru
st
** I
nclu
ding
Dep
reci
atio
n
PA
GE
4LG
B 6
5Fo
rm 7
Page 258

(1) (2) (3) (4)ESTIMATED
ACTUAL PRIOR CURRENTYEAR ENDING YEAR ENDING TENTATIVE FINAL
REVENUES 6/30/07 6/30/08 APPROVED APPROVEDTaxes: Room tax (net) 26,672,321 26,398,040 27,432,403 27,272,613 Subtotal 26,672,321 26,398,040 27,432,403 27,272,613
Miscellaneous: Interest earnings 303,691 272,010 174,996 174,996 Rents and royalties 10,840,245 9,985,424 10,576,100 10,586,650 Convention & Visitors Services 401,519 289,642 308,528 308,528 Other 402,544 412,982 438,122 436,802 Subtotal 11,947,999 10,960,058 11,497,746 11,506,976
SUBTOTAL REVENUE ALL SOURCES 38,620,320 37,358,098 38,930,149 38,779,589
Other Financing Sources: Short/medium -term financing 0 0 0 0 Fund transfers In 0 0 0 0 Proceeds from sale of fixed assets 0 0 0 0
SUBTOTAL OTHER FINANCING SOURCES 0 0 0 0
Beginning Fund Balance:
BUDGET YEAR ENDING 6/30/09
Beginning Fund Balance: Reserved 141,851 303,923 325,000 325,000 Unreserved 5,099,293 6,815,430 4,220,344 4,220,344
Total Beginning Fund Balance 5,241,144 7,119,353 4,545,344 4,545,344 Prior Period Adjustments 0 0 0 0 Residual Equity Transfers 0 0 0 0
TOTAL AVAILABLE RESOURCES 43,861,464 44,477,451 43,475,493 43,324,933
RENO-SPARKS CONVENTION & VISITORS AUTHORITYSCHEDULE B - GENERAL FUND
PAGE 5LGB 67 Form 9
Page 259

(1) (2) (3)ESTIMATED
ACTUAL PRIOR CURRENTEXPENDITURES BY FUNCTION YEAR ENDING YEAR ENDING TENTATIVE FINALAND ACTIVITY 6/30/07 6/30/08 APPROVED APPROVEDGENERAL GOVERNMENT Salaries and wages 1,636,243 1,687,831 1,742,548 1,730,844 Employee benefits 623,787 684,277 1,182,800 770,147 Services and supplies 1,107,724 1,222,429 1,260,372 1,254,142 Capital outlay 108,058 112,469 128,000 128,000 Subtotal 3,475,812 3,707,006 4,313,720 3,883,133
TOTAL GENERAL GOVERNMENT 3,475,812 3,707,006 4,313,720 3,883,133COMMUNITY SUPPORTOTHER - FACILITY OPERATION Salaries and wages 5,311,587 4,802,813 5,203,359 5,264,991 Employee benefits 1,641,322 2,178,236 2,263,561 2,252,823 Services and supplies 5,839,798 5,527,980 5,834,244 5,768,514 Capital outlay 37,330 5,075 0 0 Subtotal 12,830,037 12,514,104 13,301,164 13,286,328
OTHER - CONVENTION & TOURISM PROMOTION Salaries and wages 2,388,028 2,663,555 2,842,706 2,841,426 Employee benefits 847,998 932,870 1,123,567 1,114,878 Services and supplies 5,636,954 6,494,221 6,627,281 6,614,615 Capital outlay 37,756 49,937 43,500 43,500
Subtotal 8,910,736 10,140,583 10,637,054 10,614,419
BUDGET YEAR ENDING 6/30/09
Subtotal 8,910,736 10,140,583 10,637,054 10,614,419
OTHER - COMMUNITY GRANTS & MISCELLANEOUS Salaries and wages 0 0 0 0 Employee benefits 0 0 0 0 Services and supplies 1,425,526 1,320,414 1,336,942 1,329,975 Capital outlay 0 0 0 0 Subtotal 1,425,526 1,320,414 1,336,942 1,329,975
TOTAL COMMUNITY SUPPORT 23,166,299 23,975,101 25,275,160 25,230,722
TOTAL EXPENDITURES 26,642,111 27,682,107 29,588,880 29,113,855
RENO-SPARKS CONVENTION & VISITORS AUTHORITYSCHEDULE B - GENERAL FUND
PAGE 6LGB 68 Form 10
Page 260

(1) (2) (3)ESTIMATED
ACTUAL PRIOR CURRENTEXPENDITURES BY FUNCTION YEAR ENDING YEAR ENDING TENTATIVE FINALAND ACTIVITY 6/30/07 6/30/08 APPROVED APPROVEDPAGE FUNCTION SUMMARY
6 General Government 3,475,812 3,707,006 4,313,720 3,883,1336 Community Support 23,166,299 23,975,101 25,275,160 25,230,722
TOTAL EXPENDITURES - ALL FUNCTIONS 26,642,111 27,682,107 29,588,880 29,113,855
OTHER USES: Contingency 0 0 500,000 500,000 Residual Equity Transfer 0 0 0 0 Operating transfers (Schedule T) 10,100,000 12,250,000 9,400,000 9,600,000
TOTAL EXPENDITURES AND OTHER USES 36,742,111 39,932,107 39,488,880 39,213,855
ENDING FUND BALANCE Reserved 303,923 325,000 350,000 0 Unreserved 6,815,430 4,220,344 3,636,613 4,111,078
TOTAL ENDING FUND BALANCE 7,119,353 4,545,344 3,986,613 4,111,078
TOTAL GENERAL FUND COMMITMENTS AND FUND BALANCE 43,861,464 44,477,451 43,475,493 43,324,933
BUDGET YEAR ENDING 6/30/09
Schedule of reserved fund balance: FY 06-07 FY 07-08 FY 08-09
Reserved for inventory 0 0 0Reserved for prepaid expenditures 0 0 0Reserved for encumbrances 303,923 325,000 350,000Reserved for subsequent years expend. 0 0 0Reserved for other receivables 0 0 0
303,923 325,000 350,000
RENO-SPARKS CONVENTION & VISITORS AUTHORITYSCHEDULE B - SUMMARY - EXPENDITURES, OTHER USES AND FUND BALANCE
GENERAL FUND - ALL FUNCTIONS
PAGE 7LGB 69 Form 11
Page 261

(1) (2) (3) (4)ESTIMATED
RESOURCES ACTUAL PRIOR CURRENTYEAR ENDING YEAR ENDING TENTATIVE FINAL
REVENUES 6/30/07 6/30/08 APPROVED APPROVEDTaxes Room Taxes 0 0 0 0Subtotal 0 0 0 0
Miscellaneous Interest Earnings 68,301 113,803 79,050 79,050 Rents and royalties 0 0 0 0Subtotal 68,301 113,803 79,050 79,050
OTHER FINANCING SOURCES Operating transfers In 3,200,000 650,000 700,000 700,000 Proceds from short-term financing 0 0 0 0 Proceeds from long-term debt 0 0 0 0
Beginning Fund Balance Reserved 589,145 2,411,770 1,550,573 1,550,573 Unreserved 0 0 0 0
Total Beginning Fund Balance 589,145 2,411,770 1,550,573 1,550,573 Prior Period Adjustments 0 0 0 0 Residual Equity Transfers 0 0 0 0
BUDGET YEAR ENDING 6/30/09
TOTAL AVAILABLE RESOURCES 3,857,446 3,175,573 2,329,623 2,329,623
EXPENDITURES:Capital Projects Services and supplies 0 0 0 0 Capital outlay 1,445,676 1,625,000 1,090,000 1,440,000Subtotal 1,445,676 1,625,000 1,090,000 1,440,000OTHER USES: Contingency 0 0 0 0 Operating Transfers (Schedule T) 0 0 0 0ENDING FUND BALANCE: Reserved 2,411,770 1,550,573 1,239,623 889,623 Unreserved 0 0 0 0
TOTAL ENDING FUND BALANCE 2,411,770 1,550,573 1,239,623 889,623
TOTAL CAPITAL PROJECTS FUNDCOMMITMENTS AND FUND BALANCE 3,857,446 3,175,573 2,329,623 2,329,623
RENO-SPARKS CONVENTION & VISITORS AUTHORITYSCHEDULE B-2
FUND 23 - CAPITAL PROJECTS FUNDPAGE 8
LGB 72 Form 14
Page 262

(1) (2) (3) (4)ESTIMATED
RESOURCES ACTUAL PRIOR CURRENTYEAR ENDING YEAR ENDING TENTATIVE FINAL
REVENUES 6/30/07 6/30/08 APPROVED APPROVEDMiscellaneous Room Tax 0 0 0 0 Interest Earnings 623,014 529,643 483,422 483,422 Other 0 0 0 0Subtotal 623,014 529,643 483,422 483,422
Other Financing Sources Transfers In (Schedule T) 6,500,000 11,000,000 8,700,000 8,700,000 Proceeds of medium-term financing 3,000,000 0 0 0 Net Proceeds of Refunding 0 0 0 0
Beginning Fund Balance Reserved 14,035,658 14,300,051 15,450,475 15,450,475 Unreserved 0 0 0 0
Total Beginning Fund Balance 14,035,658 14,300,051 15,450,475 15,450,475 Prior Period Adjustments 0 0 0 0 Residual Equity Transfers 0 0 0 0
TOTALTOTAL AVAILABLE RESOURCES 24,158,672 25,829,694 24,633,897 24,633,897
BUDGET YEAR ENDING 6/30/09
RENO-SPARKS CONVENTION & VISITORS AUTHORITYSCHEDULE C - DEBT SERVICE FUND
THE ABOVE DEBT IS REPAID BY OPERATING RESOURCES
PAGE 9LGB 80 Form 15
Page 263

(1) (2) (3) (4)ESTIMATED
EXPENDITURES AND RESERVES ACTUAL PRIOR CURRENTYEAR ENDING YEAR ENDING TENTATIVE FINAL 6/30/07 6/30/08 APPROVED APPROVED
TYPE - 1989 SERIES BONDS Principal 3,725,000 3,720,000 0 0 Interest 0 0 0 0 Reserves - Increase or (Decrease) 0 0 0 0 Other 0 0 0 0
* Total reserved amount (memo only)TYPE - 2007 Medium Term Obligation Principal 0 100,000 100,000 100,000 Interest 0 114,051 115,043 115,043 Reserves - Increase or (Decrease) 0 0 0 0 Other 0 0 0 0
* Total reserved amount (memo only)TYPE - 1995 SERIES REFUNDING BONDS Principal 355,000 375,000 1,680,000 1,680,000 Interest 322,544 303,604 248,610 248,610 Reserves - Increase or (Decrease) 0 0 0 0 Other 0 0 0 0
* Total reserved amount (memo only)TYPE - 1999 Convention Center Capital Appreciation Bonds Principal 0 0 0 0
BUDGET YEAR ENDING 6/30/09
Principal 0 0 0 0 Interest 0 0 0 0 Reserves - Increase or (Decrease) 0 0 0 0 Other 0 0 0 0
* Total reserved amount (memo only)
RENO-SPARKS CONVENTION & VISITORS AUTHORITYSCHEDULE C - DEBT SERVICE FUND
THE ABOVE DEBT IS REPAID BY OPERATING RESOURCESPAGE 10
LGB 73 Form 16
Page 264

(1) (2) (3)ESTIMATED
EXPENDITURES AND RESERVES ACTUAL PRIOR CURRENTYEAR ENDING YEAR ENDING TENTATIVE FINAL 6/30/07 6/30/08 APPROVED APPROVED
2001 RSCC Refunding Bonds Principal 0 365,000 380,000 380,000 Interest 4,747,030 4,739,730 4,724,545 4,724,545 Reserves - Increase or (Decrease) 0 0 0 0 Other 0 0 0 0
* Total reserved amount (memo only) 4,654,000 4,654,000 4,654,000 4,654,000TYPE - 1999 SERIES B REFUNDING Principal 395,000 415,000 1,170,000 1,170,000 Interest 187,748 170,634 136,660 136,660 Reserves - Increase or (Decrease) 0 0 0 0 Other 0 0 0 0
* Total reserved amount (memo only)TYPE - 1999 Convention Center Current Interest Bonds Principal 0 0 605,000 605,000 Interest 67,100 67,100 50,463 50,463 Reserves - Increase or (Decrease) 0 0 0 0 Other 0 0 0 0
* Total reserved amount (memo only)Fiscal Agent Fees 59,199 9,100 9,100 9,100Advance Refunding 0 0 0 0
BUDGET YEAR ENDING 6/30/09
Advance Refunding 0 0 0 0ENDING FUND BALANCE Reserved 14,300,051 15,450,475 15,414,476 15,414,476 Unreserved 0 0 0 0 TOTAL ENDING FUND BALANCE 14,300,051 15,450,475 15,414,476 15,414,476
TOTAL COMMITMENTS AND FUND BALANCE 24,158,672 25,829,694 24,633,897 24,633,897
THE ABOVE DEBT IS REPAID BY OPERATING RESOURCESLGB 73 PAGE 11
Form 16
Page 265

ESTIMATEDACTUAL PRIOR CURRENT
PROPRIETARY FUND YEAR ENDING YEAR ENDING TENTATIVE FINAL 6/30/07 6/30/08 APPROVED APPROVED
OPERATING REVENUE: User Charges 3,027,747 2,900,145 3,082,854 3,082,854Total Operating Revenue 3,027,747 2,900,145 3,082,854 3,082,854
OPERATING EXPENSE: Salaries and wages 1,225,338 1,295,661 1,336,812 1,340,377 Employee benefits 378,288 418,549 444,240 437,750 Services and supplies 1,402,201 1,388,430 1,437,147 1,428,897 Depreciation 502,030 546,340 555,084 555,084Total Operating Expense 3,507,857 3,648,980 3,773,283 3,762,108
Operating Income or (Loss) (480,110) (748,835) (690,429) (679,254)
NONOPERATING REVENUES: Interest Earned 0 0 0 0 Gain on sale of fixed assets 0 0 0 0Total Nonoperating Revenues 0 0 0 0
NONOPERATING EXPENSE Loss on disposal of fixed assets 0 0 0 0 Interest Expense 0 0 0 0TOTAL NONOPERATING EXPENSE 0 0 0 0
Net Income Before Operating Transfers (480,110) (748,835) (690,429) (679,254)
BUDGET YEAR ENDING 6/30/09
Net Income Before Operating Transfers (480,110) (748,835) (690,429) (679,254)
Operating Transfers (Schedule T) In 400,000 600,000 500,000 500,000 Out 0 0 0 0Net Operating transfers 400,000 600,000 500,000 500,000
NET INCOME (80,110) (148,835) (190,429) (179,254)
RENO-SPARKS CONVENTION & VISITORS AUTHORITYSCHEDULE F-1 REVENUES, EXPENSES AND NET INCOME
FUND 16 - GOLF COURSES
PAGE 12LGB 77 Form 19
Page 266
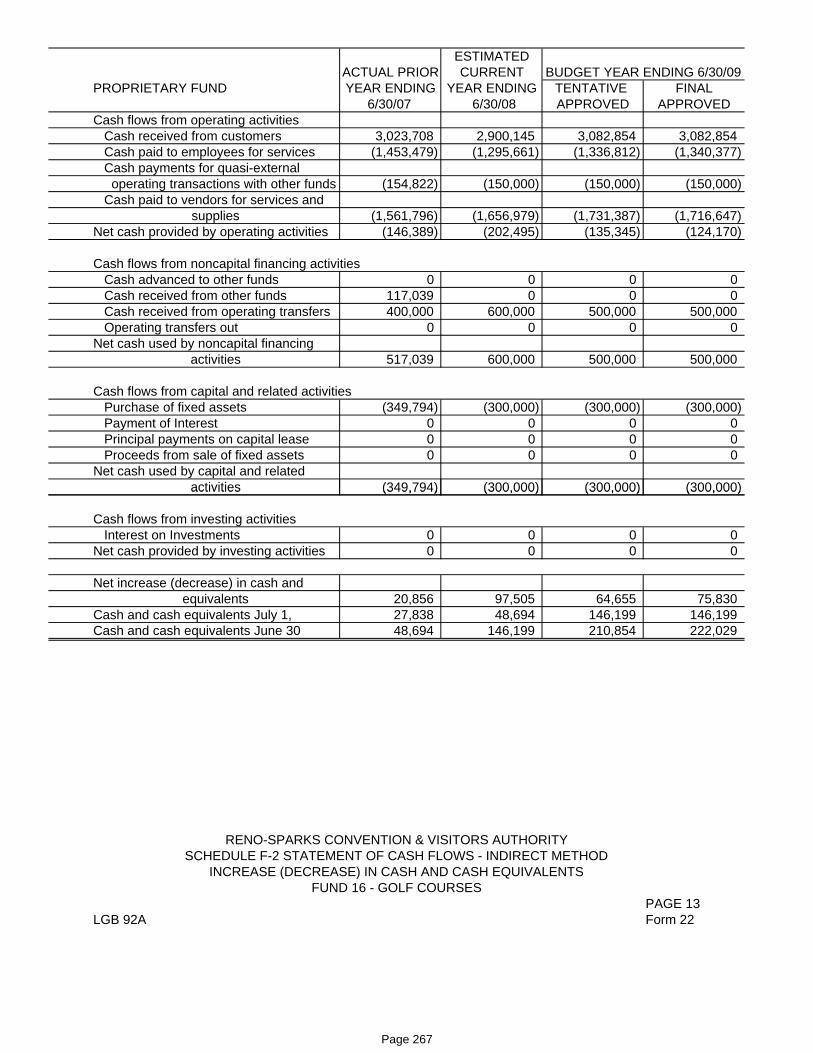
ESTIMATEDACTUAL PRIOR CURRENT
PROPRIETARY FUND YEAR ENDING YEAR ENDING TENTATIVE FINAL 6/30/07 6/30/08 APPROVED APPROVED
Cash flows from operating activities Cash received from customers 3,023,708 2,900,145 3,082,854 3,082,854 Cash paid to employees for services (1,453,479) (1,295,661) (1,336,812) (1,340,377) Cash payments for quasi-external operating transactions with other funds (154,822) (150,000) (150,000) (150,000) Cash paid to vendors for services and
supplies (1,561,796) (1,656,979) (1,731,387) (1,716,647)Net cash provided by operating activities (146,389) (202,495) (135,345) (124,170)
Cash flows from noncapital financing activities Cash advanced to other funds 0 0 0 0 Cash received from other funds 117,039 0 0 0 Cash received from operating transfers 400,000 600,000 500,000 500,000 Operating transfers out 0 0 0 0Net cash used by noncapital financing
activities 517,039 600,000 500,000 500,000
Cash flows from capital and related activities Purchase of fixed assets (349,794) (300,000) (300,000) (300,000) Payment of Interest 0 0 0 0 Principal payments on capital lease 0 0 0 0 Proceeds from sale of fixed assets 0 0 0 0Net cash used by capital and related
activities (349,794) (300,000) (300,000) (300,000)
BUDGET YEAR ENDING 6/30/09
activities (349,794) (300,000) (300,000) (300,000)
Cash flows from investing activities Interest on Investments 0 0 0 0Net cash provided by investing activities 0 0 0 0
Net increase (decrease) in cash andequivalents 20,856 97,505 64,655 75,830
Cash and cash equivalents July 1, 27,838 48,694 146,199 146,199Cash and cash equivalents June 30 48,694 146,199 210,854 222,029
RENO-SPARKS CONVENTION & VISITORS AUTHORITYSCHEDULE F-2 STATEMENT OF CASH FLOWS - INDIRECT METHOD
INCREASE (DECREASE) IN CASH AND CASH EQUIVALENTSFUND 16 - GOLF COURSES
PAGE 13LGB 92A Form 22
Page 267

ESTIMATEDACTUAL PRIOR CURRENT
PROPRIETARY FUND YEAR ENDING YEAR ENDING TENTATIVE FINAL 6/30/07 6/30/08 APPROVED APPROVED
Reconcilation of operating income (loss) to cash provided by operating activitiesOperating income/(loss) (480,110) (748,835) (690,429) (679,254)
Adjustment to reconcile to net cash Depreciation 502,030 546,340 555,084 555,084 (Increase) decrease in accounts receivable (7,313) 0 0 0 (Increase) decrease in prepaid expenses 0 0 0 0 (Increase) decrease in inventory (23,995) 0 0 0 Increase (decrease) in accounts payable (135,600) 0 0 0 Increase (decrease) in accrued liabilities (5,749) 0 0 0 Increase (decrease) in compensated absences 1,074 0 0 0 Increase (decrease) in deferred revenues 3,274 0 0 0Total adjustments 333,721 546,340 555,084 555,084
Net cash provided by operating activities (146,389) (202,495) (135,345) (124,170)
BUDGET YEAR ENDING 6/30/09
RENO-SPARKS CONVENTION & VISITORS AUTHORITYSCHEDULE F-2 RECONCILIATION OF OPERATING INCOME TO NET CASH
PROVIDED BY OPERATING ACTIVITIESFUND 16 - GOLF COURSES
PAGE 14LGB 89 Form 23
Page 268
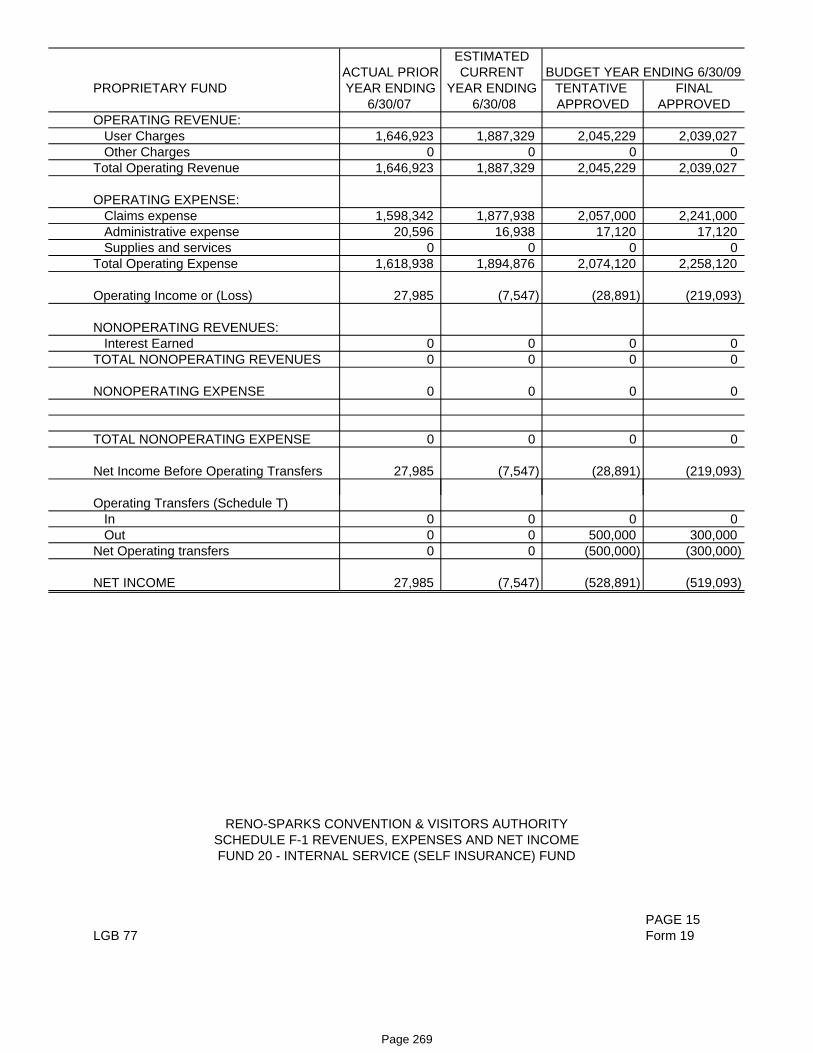
ESTIMATEDACTUAL PRIOR CURRENT
PROPRIETARY FUND YEAR ENDING YEAR ENDING TENTATIVE FINAL 6/30/07 6/30/08 APPROVED APPROVED
OPERATING REVENUE: User Charges 1,646,923 1,887,329 2,045,229 2,039,027 Other Charges 0 0 0 0Total Operating Revenue 1,646,923 1,887,329 2,045,229 2,039,027
OPERATING EXPENSE: Claims expense 1,598,342 1,877,938 2,057,000 2,241,000 Administrative expense 20,596 16,938 17,120 17,120 Supplies and services 0 0 0 0Total Operating Expense 1,618,938 1,894,876 2,074,120 2,258,120
Operating Income or (Loss) 27,985 (7,547) (28,891) (219,093)
NONOPERATING REVENUES: Interest Earned 0 0 0 0TOTAL NONOPERATING REVENUES 0 0 0 0
NONOPERATING EXPENSE 0 0 0 0
TOTAL NONOPERATING EXPENSE 0 0 0 0
Net Income Before Operating Transfers 27,985 (7,547) (28,891) (219,093)
BUDGET YEAR ENDING 6/30/09
Operating Transfers (Schedule T) In 0 0 0 0 Out 0 0 500,000 300,000Net Operating transfers 0 0 (500,000) (300,000)
NET INCOME 27,985 (7,547) (528,891) (519,093)
RENO-SPARKS CONVENTION & VISITORS AUTHORITYSCHEDULE F-1 REVENUES, EXPENSES AND NET INCOMEFUND 20 - INTERNAL SERVICE (SELF INSURANCE) FUND
PAGE 15LGB 77 Form 19
Page 269

ESTIMATEDACTUAL PRIOR CURRENT
PROPRIETARY FUND YEAR ENDING YEAR ENDING TENTATIVE FINAL 6/30/07 6/30/08 APPROVED APPROVED
Cash flows from operating activities Cash received from users 311,707 487,329 595,229 589,027 Cash received from quasi-external operating transactions with other funds 1,335,216 1,400,000 1,450,000 1,450,000 Cash paid to vendors for services and supplies (1,636,574) (1,894,876) (2,074,120) (2,258,120)Net cash provided by operating activities 10,349 (7,547) (28,891) (219,093)
Cash flows from noncapital financing activities Cash advanced to other funds (21,076) 0 0 0 Cash received from other funds 0 50,000 500,000 500,000 Cash received from operating transfers 0 0 0 0 Operating transfers out 0 0 (500,000) (300,000)Net cash used by noncapital financing
activities (21,076) 50,000 0 200,000
Cash flows from investing activities Interest on Investments 0 0 0 0Net cash provided by investing activities 0 0 0 0
Net increase (decrease) in cash andinvestments (10,727) 42,453 (28,891) (19,093)
Cash and investments July 1, 25,744 15,017 57,470 57,470Cash and investments June 30, 15,017 57,470 28,579 38,377
BUDGET YEAR ENDING 6/30/09
Cash and investments June 30, 15,017 57,470 28,579 38,377
RENO-SPARKS CONVENTION & VISITORS AUTHORITYSCHEDULE F-2 STATEMENT OF CASH FLOWS - INDIRECT METHOD
INCREASE (DECREASE) IN CASH AND CASH EQUIVALENTSFUND 20 - INTERNAL SERVICE (SELF INSURANCE) FUND
PAGE 16LGB 92A Form 22
Page 270

ESTIMATEDACTUAL PRIOR CURRENT
PROPRIETARY FUND YEAR ENDING YEAR ENDING TENTATIVE FINAL 6/30/07 6/30/08 APPROVED APPROVED
Reconcilation of operating income (loss) to cash provided by operating activitiesOperating income/(loss) 27,985 (7,547) (28,891) (219,093)
Adjustment to reconcile to net cash (Increase) decrease in accounts receivable 0 0 0 0 Increase (decrease) in prepaid expenses 10,523 0 0 0 Increase (decrease) in accrued liabilities (28,159) 0 0 0Total adjustments (17,636) 0 0 0
Net cash provided by operating activities 10,349 (7,547) (28,891) (219,093)
BUDGET YEAR ENDING 6/30/09
RENO-SPARKS CONVENTION & VISITORS AUTHORITYSCHEDULE F-2 RECONCILIATION OF OPERATING INCOME TO NET CASH
PROVIDED BY OPERATING ACTIVITIESFUND 20 - INTERNAL SERVICE (SELF INSURANCE) FUND
PAGE 17LGB 89 Form 23
Page 271

* TY
PE
RE
NO
-SP
AR
KS
CO
NV
EN
TIO
N &
VIS
ITO
RS
AU
THO
RIT
Y1
- GE
NE
RA
L O
BLI
GA
TIO
N B
ON
DS
2 - G
EN
ER
AL
OB
LIG
ATI
ON
RE
VE
NU
E S
UP
PO
RTE
D B
ON
DS
SC
HE
DU
LE C
-13
- GE
NE
RA
L O
BLI
GA
TIO
N -
RE
VE
NU
E B
ON
DS
4 - R
EV
EN
UE
BO
ND
SA
LL E
XIS
TIN
G O
R P
RO
PO
SE
D G
EN
ER
AL
OB
LIG
ATI
ON
BO
ND
S,
5 -M
ED
IUM
TE
RM
FIN
AN
CIN
GR
EV
EN
UE
BO
ND
S, M
ED
IUM
-TE
RM
FIN
AN
CIN
G, C
AP
ITA
L LE
AS
ES
6 -M
ED
IUM
TE
RM
FIN
AN
CIN
G -
LEA
SE
PU
RC
HA
SE
AN
D S
PE
CIA
L A
SS
ES
SM
EN
T B
ON
DS
7 - C
AP
ITA
L LE
AS
ES
8 - S
PE
CIA
L A
SS
ES
SM
EN
T B
ON
DS
9 - M
OR
TGA
GE
S10
- O
THE
R (S
PE
CIF
Y T
YP
E)
11 -
PR
OP
OS
ED
(SP
EC
IFY
TY
PE
)
(1)
(2)
(3)
(4)
(5)
(6)
(7)
(8)
(9)
(10)
(11)
BE
GIN
NIN
G
RE
QU
IRE
ME
NTS
FO
R F
ISC
AL
YE
AR
NA
ME
OF
BO
ND
OR
LO
AN
*TE
RM
OR
IGIN
AL
ISS
UE
FIN
AL
INTE
RE
ST
OU
TSTA
ND
ING
AM
OU
NT
DA
TEP
AY
ME
NT
RA
TEB
ALA
NC
E IN
TER
ES
T P
RIN
CIP
AL
TO
TAL
OF
ISS
UE
DA
TE7/
1/20
08 P
AY
AB
LE P
AY
AB
LEFU
ND
: DE
BT
SE
RV
ICE
1995
GO
Ref
undi
ngB
onds
215
YR
S12
495
000
8/1/
957/
1/10
520
9%A
vg5
345
000
248
610
168
000
01
928
610
EN
DIN
G 0
6/30
/09
1995
G. O
. Ref
undi
ng B
onds
2 1
5 Y
RS
12,4
95,0
008/
1/95
7/1/
105.
209%
Avg
.5,
345,
000
248,
610
1,68
0,00
01,
928,
610
1999
Ser
ies
B R
efun
ding
210
YR
S5,
950,
000
4/1/
997/
1/10
4.35
4%3,
675,
000
136,
660
1,17
0,00
01,
306,
660
2007
Med
ium
Ter
m5
5 Y
RS
3,00
0,00
05/
16/0
75/
1/12
3.96
7%2,
900,
000
115,
043
100,
000
215,
043
1999
Con
vent
ion
Cen
ter
2 3
0 Y
RS
85,6
15,0
001/
20/0
07/
1/29
6.36
% A
vg.
1,22
0,00
050
,463
605,
000
655,
463
C
urre
nt In
tere
st B
onds
1999
Con
vent
ion
Cen
ter
230
YR
S19
,384
,075
1/20
/00
7/1/
206.
36%
Avg
.29
,613
,466
00
0
Cap
ital A
ppre
ciat
ion
Bon
ds20
01 C
onve
ntio
n C
ente
r 2
30
YR
S92
,995
,000
6/20
/01
7/1/
294.
00-5
.25%
92,6
30,0
004,
724,
545
380,
000
5,10
4,54
5
Cur
rent
Inte
rest
Bon
ds
TOTA
L - A
LLD
EB
T S
ER
VIC
E21
9,43
9,07
513
5,38
3,46
65,
275,
321
3,93
5,00
09,
210,
321
PA
GE
18
LGB
76
Form
22
Page 272

FUN
D T
YP
ETO
FU
ND
PA
GE
FRO
M F
UN
DP
AG
EA
MO
UN
TFR
OM
FU
ND
PA
GE
TO F
UN
DP
AG
EA
MO
UN
T
GE
NE
RA
L FU
ND
GE
NE
RA
L FU
ND
7D
EB
T S
ER
VIC
E9
8,70
0,00
0G
EN
ER
AL
FUN
D7
CA
PIT
AL
PR
OJE
CTS
870
0,00
0G
EN
ER
AL
FUN
D7
SE
LF IN
SU
RA
NC
E15
0G
EN
ER
AL
FUN
D7
GO
LF C
OU
RS
E12
0
Sub
tota
l0
9,40
0,00
0
GO
LF C
OU
RS
E F
UN
DG
OLF
CO
UR
SE
12S
ELF
INS
UR
AN
CE
1550
0,00
0
Sub
tota
l50
0,00
00
DE
BT
SE
RV
ICE
DE
BT
SE
RV
ICE
9G
EN
ER
AL
FUN
D7
8,70
0,00
0
Sub
tota
l8 ,
700,
000
0
TRA
NS
FER
S IN
TRA
NS
FER
S O
UT
Sub
tota
l8,
700,
000
0
CA
PIT
AL
PR
OJE
CTS
CA
PIT
AL
PR
OJE
CTS
8G
EN
ER
AL
FUN
D7
700,
000
Sub
tota
l70
0,00
00
INTE
RN
AL
SE
RV
ICE
FU
ND
SE
LF IN
SU
RA
NC
E15
GE
NE
RA
L FU
ND
70
SE
LF IN
SU
RA
NC
E15
GO
LF C
OU
RS
E12
500,
000
Sub
tota
l0
500,
000
Tota
l9,
900,
000
9,90
0,00
0
PA
GE
19
LGB
99A
Form
22a
RE
NO
-SP
AR
KS
CO
NV
EN
TIO
N &
VIS
ITO
RS
AU
THO
RIT
YS
CH
ED
ULE
T -
TRA
NS
FER
RE
CO
NC
ILIA
TIO
N (O
PE
RA
TIN
G A
ND
RE
SID
UA
L E
QU
ITY
)B
udge
t for
Fis
cal Y
ear E
ndin
g Ju
ne 3
0, 2
009
Page 273

Ent
ity:
Ren
o-S
park
s C
onve
ntio
n &
Vis
itors
Aut
horit
yB
udge
t for
Fis
cal Y
ear E
ndin
g Ju
ne 3
0, 2
009
(1)
(2)
Cap
ital P
roje
ctD
escr
iptio
n O
f Cap
ital P
roje
ctN
umbe
r
RS
CV
A 0
0-1
Pur
chas
e an
d im
plem
enta
tion
of n
ew p
hone
sys
tem
RLE
C 0
0-1
Faci
lity
Rep
airs
at L
ives
tock
Eve
nts
Cen
ter
RS
CC
00-
1Fa
cilit
y R
epai
rs a
t Con
vent
ion
Cen
ter
NB
S 0
0-1
Pin
sette
r Rep
lace
men
t
RE
C 0
0-1
Pur
chas
e of
Ris
ers
GC
- 1R
epla
cem
ent o
f var
ious
equ
ipm
ent a
t gol
f cou
rses
GC
- 2R
e pai
rs a
nd re
nova
tions
to g
olf c
ours
esG
C 2
Rep
airs
and
reno
vatio
ns to
gol
f cou
rses
Sch
edul
e C
P-1
Sum
mar
y S
tate
men
t of C
apita
l Pro
ject
sP
age
20Fo
rm 2
4
Page 274

Ent
ity:
Ren
o-S
park
s C
onve
ntio
n &
Vis
itors
Aut
horit
yB
udge
t for
Fis
cal Y
ear E
ndin
g Ju
ne 3
0, 2
009
(1)
(2)
(3)
(4)
(5)
(6)
(7)
(8)
Che
ck If
Cap
ital
Spe
cific
Spe
cific
Tax
Rat
eC
apita
l Pro
ject
Cap
ital
Impr
ovem
ent
Am
ount
of O
&M
Fund
Rev
enue
Incr
ease
If Ta
x R
ate
Incr
ease
Num
ber
Impr
ovem
ent
Bud
get T
his
(2) E
xpen
ses
Fund
ing
This
Fund
ing
O&
MN
eces
sary
Nec
essa
ry, L
ist
(form
CP
-1)
Fund
Fisc
al Y
ear
This
Bud
get Y
rO
&M
Exp
ense
(if a
pplic
able
)To
Fun
d O
&M
Spe
cific
Tax
& R
ate
RS
CV
A 0
0-1
Cap
ital P
roje
cts
300,
000
0N
/AN
/A
RLE
C 0
0-1
Cap
ital P
roje
cts
100,
000
0N
/AN
/A
RS
CC
00-
1C
apita
l Pro
ject
s69
0,00
00
N/A
N/A
NB
S 0
0-1
Cap
ital P
roje
cts
250,
000
0N
/AN
/A
RE
C 0
0-1
Cap
ital P
roje
cts
100,
000
0N
/AN
/A
GC
- 1G
olf C
ours
e Fu
nd20
0 ,00
00
N/A
N/A
GC
1G
olf C
ours
e Fu
nd20
0,00
00
N/A
N/A
GC
- 2G
olf C
ours
e Fu
nd10
0,00
00
N/A
N/A
Tota
ls (1
)1,
740,
000
0N
/AN
/A
(1)
Tota
l by
capi
tal i
mpr
ovem
ent f
und
- Mus
t agr
ee w
ith to
tal f
und
expe
nditu
res
in e
ach
capi
tal f
und
budg
et. (
1 pa
ge p
er fu
nd)
(2)
Mus
t inc
lude
all
antic
ipat
ed o
pera
ting
expe
nses
incl
udin
g pa
yrol
l.P
age
21S
ched
ule
CP
-2 S
tate
men
t of C
apita
l Pro
ject
s, A
ntic
ipat
ed C
apita
l Pro
ject
Exp
ense
sFo
rm 2
5
and
Pro
pose
d S
ourc
es(s
) of F
undi
ng fo
r Ope
ratio
n &
Mai
nten
ance
Page 275

Pursuant to NRS 354.600 (3), each (emphasis added) local government budget must contain a
separate statement of anticipated expenses relating to activities designed to influence the passage
or defeat of legislation in an upcoming legislative session.
1. Activity: Monitoring of issues that may affect the Authority
2. Funding Source: Room Tax Revenues - General Fund
3. Transportation $
4. Lodging and meals $
5 Salaries and Wages $
L O B B Y I N G E X P E N S E E S T I M A T E
Nevada Legislature: 75th Session; February 2, 2009 to June 1, 2009
Form 306/20/2008
5. Salaries and Wages $
6. Compensation to lobbyists $ 36,000
7. Entertainment $
8. Supplies, equipment & facilities; other personnel and $ 500
services spent in Carson City
Total $ 36,500
Entity: Reno-Sparks Convention & Visitors Authority Budget Fiscal Year 2008-2009
Lobbying Expense Estimate, Page 1 of 1 Page 22
Form 306/20/2008
Page 276
RENO-SPARKS CONVENTION & VISITORS AUTHORITY
I Hal Lenox
Mark Pardue L----.·
Lisa Cartlidge /~t til ~iS~---
Jim DeVolld ~=--::Y~ Dwight Dortch vClJ!.Jj~;c~-t.
John Farahi Sharon Zadra ~~
David Humke Wld.ua.X·
" ...., .
......~--. --'--,
Roberta Ross
Phillip Salerno
Page 277

Fiscal Year 2008-2009 Budget Resolution
Resolution #554
WHEREAS, Nevada Revised Statutes (NRS) require that the Authority prepare and file a final budget for the fiscal year 2008-2009; and,
WHEREAS, a final budget for fiscal year 2008-2009 has been prepared in the manner and on the forms prescribed; and,
WHEREAS, the proposed budget is attached hereto; and,
WHEREAS, a public hearing as required by NRS has been held at the time and place noticed, and there being no opposition or change resulting from such public hearing.
NOW THEREFORE, it is RESOLVED that the attached budget be adopted as the final budget for fiscal year 2008-2009 and that it be made an integral part of this resolution.
Passed and adopted this 15th day of May 2008, by the Governing Body consisting of 13 members
Ayes
o Nays
~5 Absent
o Abstain
Page 278

RENO NEWSPAPERS INC Publishers of
Reno Gazette-Journal 955 Kuenzli St. P.O. Box 22,000 • Reno, NV 89520 • 775.788.6200
Legal Advertising Office 775.788.6394
RENO SPARKS CONVENTION C Customer Acct# 313589 4001 S VIRGINIA ST, STE G PO# PH RENO NV 89502 Ad# 1000556843
Legal Ad Cost $52.96
STATE OF NEVADA COUNTY OF WASHOE
Being first duly sworn, deposes and says: That as the legal clerk of the Reno Gazette-Journal, a daily newspaper published in Reno, Washoe County, State of Nevada, that the notice referenced below has published in each regular and entire issue of said newspaper between the dates: 05/09/2008 - 05/09/2008, for exact publication dates please see last line of Proof of Publication below.
~ ....",S.ub.s.cribed.al1.d..sworJl,ta"he£qre me 1 LINDA ANDERS:)N ~
~ . Notarf ubllc· Stuto of Nevada i ~ Appcinlil1-3nl ReccrrJed ill Waso03 Coon~{ [
Signed ; . No: 00·5430·2· Expires January 15. 2012 ~~);h( :;4111""1.1"1 .. 1I1 .. II ..UlllllltU ·" • U ..Uf'ltllltlU UIl UC..
MAY 9 2008
Proof of Publication
NOTICE OF PUBLIC HEARING RENO-SPARKS CONVENTION & VISITORS AUTHORITY Notice is hereby given that theBoard of Directors of the Reno- Sparks Convention & VisitorsAuthority will conduct a publichearing on the proposed budget for fiscal year 2008-2009.The hearing is scheduled for9:00 a.m., Thursday, May 15,2008 in the Board Room oftheReno-Sparks Convention & Visitors Authority, 4001 South Virginia Street, Suite G, Reno Nevada 89502. A tentative budgethas been prepared in such detail and on appropriate formsas prescribed by the NevadaDepartment of Taxation. Copies of the tentative budget areon file and available for publicinspection at the Reno-SparksConvention & Visitors Authority, 4001 South Virginia Street,Suite G, Reno Nevada 89502,the office of the County C1erkof Washoe County, and the Department of Taxation in CarsonCity, Nevada. Tim D. Smith Vice President Finance Reno-Sparks Convention & Visitors Authority No. 556843, May 9, 2008
Ad Number: 1000556843 Pagc 1 of 1
Page 279


RENO-SPARKS CONVENTION AND VISITORS AUTHORITY FISCAL 2008-2009 ANNUAL FORECAST AND CAPITAL BUDGET
GLOSSARY
The following list of general definitions, taken from NRS 354.476 through NRS 354.580 shall be applied to the various accounting terms used throughout this manual:
“ACCOUNT” – A systematic arrangement of items, showing the effect of transactions on a specific asset, liability or equity.
“ACCOUNTING SYSTEM” – The methods and records established to identify, assemble, analyze, classify, record and report a government’s transactions and to maintain accountability for the related assets and liabilities.
“ACCRUAL BASIS” – The basis of accounting under which expenditures or expenses are recorded as soon as they result in liabilities for benefits received and revenues are recorded when earned, despite the possibility that the receipt of the revenue or the payment for the expense may take place, in whole or in part, in another accounting period.
“ACCUMULATED DEPRECIATION” – The total of periodic credits made to record the reduction in the estimated service life of fixed assets.
“ADR” - Average Daily Rate “APPROPRIATION” - An authorization by a governing body to make expenditures and to incur obligations for specified purposes.
“ASSETS” – Property which:
1. Is owned by a governmental unit; and 2. Has a monetary value.
“BALANCED BUDGET” – A budget where the total sum of money collected in a year is equal to the amount it spends on goods, services, and debt interest. “BUDGET” – A plan of financial operation embodying an estimate of proposed expenditures and expenses for a given period and the proposed means of financing them. “BUDGET AUGMENTATION” – A procedure for increasing appropriations of a fund with the express intent of employing previously unbudgeted resources of the fund for carrying out the increased appropriations. “BUDGET YEAR” – The fiscal year for which a budget is being prepared.
Page 281

RENO-SPARKS CONVENTION AND VISITORS AUTHORITY FISCAL 2008-2009 ANNUAL FORECAST AND CAPITAL BUDGET
GLOSSARY CONTINUED
“BUDGETARY ACCOUNTS” – Accounts used to enter the formally adopted annual operating budget into the general ledger as part of the management control technique of formal budgetary integration. “BUDGETARY CONTROL” – The control or management of a government or enterprise in accordance with an approved budget to keep expenditures within the limitations of available appropriations and available revenues. ‘CAPITAL PROJECTS FUND” – A fund created to account for all resources used for the acquisition or construction of designated fixed assets by a governmental unit except those financed by special assessment, proprietary or trust funds. “CONTINGENCY ACCOUNT” – An account showing assets or other resources which have been appropriated to provide for unforeseen expenditures or anticipated expenditures of an uncertain amount. “COTERMINOUS” – A term on the Board of Directors which has the same extent in time as a position held in another public office. “DEBT SERVICE FUND” – A fund to account for the accumulation of resources for and the payment of principal or interest on any general long-term debt. “DEPRECIATION” –
1. The expiration of the service life of fixed assets attributable to wear and tear through use and lapse of time, obsolescence, inadequacy or other physical or functional cause.
2. An element of expense resulting from the use of assets having a
long service life.
“ENTERPRISE FUND” – A fund established to account for operations: 1. Which are financed and conducted in a manner similar to the
operations of private business enterprises, where the intent of the governing body is to have the expenses (including depreciation) of providing goods or services on a continuing basis to the general public, financed or recovered primarily through charges to the users; or
Page 282

RENO-SPARKS CONVENTION AND VISITORS AUTHORITY FISCAL 2008-2009 ANNUAL FORECAST AND CAPITAL BUDGET
GLOSSARY CONTINUED
2. For which the governing body has decided that a periodic
determination of revenues earned, expenses incurred and net income is consistent with public policy and is appropriate for capital maintenance, management control, accountability or other purposes.
“ESTIMATED REVENUE” – The amount of revenue estimated to be collected or accrued during a given period.
“EXPENDITURE” –
1. “Expenditure” means: (a) If accounts are kept on the accrual basis or the modified
accrual basis, the cost of goods delivered or services rendered, whether paid or unpaid, any provision for retirement of debt which is not reported as a liability of the fund from which the debt is retired, and any capital outlays.
(b) If accounts are kept on a cash basis, only cash
disbursements for the purposes listed in paragraph (a).
(c) Encumbrances are not considered expenses. “EXPENSE” – Any charge incurred, whether paid or unpaid, for operation, maintenance or interest or any other charge which is presumed to provide benefit in the current fiscal year. “FINANCIAL BUDGET” – The budget that has been adopted by a local governing body or adopted by default as defined by NRS 354.470 to 354.626, inclusive, and approved by the Department of Taxation for the ensuing fiscal year. “FISCAL YEAR” – The 12-month period beginning on the 1st day of July and ending on the last day of June. “FIT” – Frequent Individual Traveler “FIXED ASSETS” – Assets of a long-term character which are intended to continue to be held or used such as land, buildings, machinery, furniture and other equipment. Fixed assets are generally those assets with a cost of over $5,000, and a useful life greater than one (1) year.
Page 283

RENO-SPARKS CONVENTION AND VISITORS AUTHORITY
FISCAL 2008-2009 ANNUAL FORECAST AND CAPITAL BUDGET
GLOSSARY CONTINUED “FUNCTION” – A group of related activities aimed at accomplishing a major service or regulatory program for which a governmental unit is responsible, such as general government, public safety, public works, health, welfare, culture and recreation, conservation of natural resources, urban redevelopment and housing, economic development and assistance or economic opportunity. “FUND” – A fiscal and accounting entity having a self-balancing set of accounts, recording cash and other financial resources together with all related liabilities and residual entities or balances, or changes therein, which are segregated for the purpose of carrying on specific activities or attaining certain objectives in accordance with specific regulations, restrictions or limitation. “FUND BALANCE” – The excess of assets over liabilities and reserves in a governmental fund. “FUND BALANCE – RESERVED FOR DEBT SERVICE” – An account used to segregate a portion of fund balance for resources legally restricted to the payment of general long-term debt principal and interest maturing in future years. “GENERAL FUND” – The fund used to account for all financial resources except those required to be accounted for in another fund. “GENERAL LONG-TERM DEBT” – Debt which is legally payable from general revenues and is backed by the full faith and credit of a governmental unit. The term includes debt represented by local government securities issued pursuant to chapter 350 of NRS and debt created for short-term financing pursuant to NRS 354.430 to 354.460, inclusive. “GENERALLY ACCEPTED ACCOUNTING PRINCIPLES (GAAP)” – Standards established by the AICPA for the conduct and reporting of financial audits. There are 10 basic Generally Accepted Accounting Standards (GAAS), classed into three broad categories: general standards, standards of fieldwork and standards of reporting. The Auditing Standards Board of the AICPA publishes Statements of Auditing Standards (SAS) to comment and expand upon these basic standards. These SAS, together with the 10 basic standards, constitute GAAS. These GAAS set forth the objectives of the audit and establish measures that can be applied to judge the quality of its performance. “GOVERNING BODY” – The Board of Directors.
Page 284
RENO-SPARKS CONVENTION AND VISITORS AUTHORITY FISCAL 2008-2009 ANNUAL FORECAST AND CAPITAL BUDGET
GLOSSARY CONTINUED
“GOVERNMENTAL FUND TYPES” – Funds used to account to the acquisition, use and balances of expendable financial resources and the related current liabilities – except those accounted for in proprietary funds and fiduciary funds. In essence, these funds are accounting segregation of financial resources. Expendable assets are assigned to a particular governmental fund type according to the purposes for which they may or must be used. Current liabilities are assigned to the fund type from which they are to be paid. The difference between the assets and liabilities of governmental fund types is referred to as fund balance. The measurement focus in these fund types is on the determination of financial position and changes in financial position, (sources, uses and balances of financial resources), rather than on net income determination. The statement of revenues, expenditures, transfers and other changes in fund balance. Under current GAAP, there are five governmental fund types: general, special revenue, debt service, capital projects and permanent funds . “INTERFUND TRANSFER” – An amount of money transferred from one fund to another. “INTERNAL SERVICE FUND” – A fund used to account for the financing of goods or services furnished by a designated department or agency to governmental units within its own organization or to other departments or agencies on basis of reimbursements for cost. “IVCBVB” - Incline Village Crystal Bay Visitors Bureau “LONG-TERM DEBT” – Any unmatured debt that is not a fund liability. “MEASUREMENT FOCUS” – The accounting convention that determines (1) which assets and which liabilities are included on a government’s balance sheet and where they are reported there, and (2) whether an operating statement presents information on the flow of financial resources (revenue and expenditures) or information on the flow of economic resources (revenues and expenses). “MODIFIED ACCRUAL BASIS” – The basis of accounting under which expenditures other than accrued interest on general long-term debt are recorded at the time liabilities are incurred and revenues are recorded when they become measurable and available to finance expenditures of the fiscal period.
“NBS” – National Bowling Stadium
Page 285

RENO-SPARKS CONVENTION AND VISITORS AUTHORITY FISCAL 2008-2009 ANNUAL FORECAST AND CAPITAL BUDGET
GLOSSARY CONTINUED
“NRS” – Nevada Revised Statutes. “NET INCOME” – The proprietary fund excess of operating revenues, nonoperating revenues and operating transfers in over operating expenses, nonoperating expenses and operating transfers out. “OBJECT” – As used in the classification of expenditures, an article purchased or a service obtained, distinguished from the results derived from the expenditure, for example, Payroll and Related, contractual services, materials or supplies. “OPERATING EXPENSE” – Proprietary fund expenses related directly to the fund’s primary activities. “OPERATING INCOME” – The excess of proprietary fund operating revenues over operating expenses. “OPERATING REVENUES” – Proprietary fund revenues directly related to the fund’s primary activities. They consist primarily of user charges for goods or services. “OPERATING TRANSFERS” – All interfund transfers other than residual equity transfers (e.g., legally authorized transfers from a fund receiving revenue to the fund through which the resources are to be expanded. “PROPRIETARY FUND” – A fund used to account for the government or agency’s ongoing organizations and activities that are similar to those often found in the private sector. These funds are considered self-supporting in that the services rendered by them are generally financed through user charges or on a cost reimbursement basis. Proprietary funds use the economic resources measurement focus and the accrual basis of accounting. “REC” – Reno Events Center “RESOLUTION” – A special or temporary order of a legislative body requiring less legal formality than an ordinance or statute. “RETAINED EARNINGS” – An equity account reflecting the accumulated earning of an enterprise or internal service fund.
Page 286

RENO-SPARKS CONVENTION AND VISITORS AUTHORITY FISCAL 2008-2009 ANNUAL FORECAST AND CAPITAL BUDGET
GLOSSARY CONTINUED
“REVENUE” –
1. “Revenue” means the gross increase in ownership equity during a designated period.
2. If the accounts are kept on an accrual basis, this term designates:
(a) Additions to assets which do not increase any liability or represent the recovery of an expenditure or contributions of fund capital in proprietary funds; and
(b) The cancellation of liabilities without a corresponding
increases in other liabilities or a decrease in assets.
3. If accounts are kept on the modified accrual basis, the additions must be measurable and available to finance expenditures of the fiscal period.
“ROI” – Return on Investment “RSCC” – Reno-Sparks Convention Center “RSLEC” – Reno-Sparks Livestock Events Center “RPACA” – Reno Performing Arts Center Association “SHORT-TERM DEBT” – Debt with a maturity of one year or less after the date of issuance. Short-term debt usually includes variable-rate debt, bond anticipation notes, tax anticipation notes and revenue anticipation notes. “u.v.” – Unique visit refers to a website hit within a specific menu
Page 287