uncertainty of the level 2 psa for npp paks · uncertainty of the level 2 psa for npp paks ......
TRANSCRIPT

Institute for Electric Power Research CoBudapest
Uncertainty of the Level 2 PSA for NPP Paks
Gabor LAJTHA, Attila BAREITH, Előd HOLLÓ, Zoltán KARSA,
Péter SIKLÓSSY, Zsolt TÉCHY
VEIKI INSTITUTE FOR ELECTRIC POWER RESEARCH
Workshop on Evaluation of Uncertainties inRelation to Severe Accidents &
Level 2 Probabilistic Safety AnalysisAiix-en-Provence, 7-9 November 2005
2Institute for Electric Power Research Co
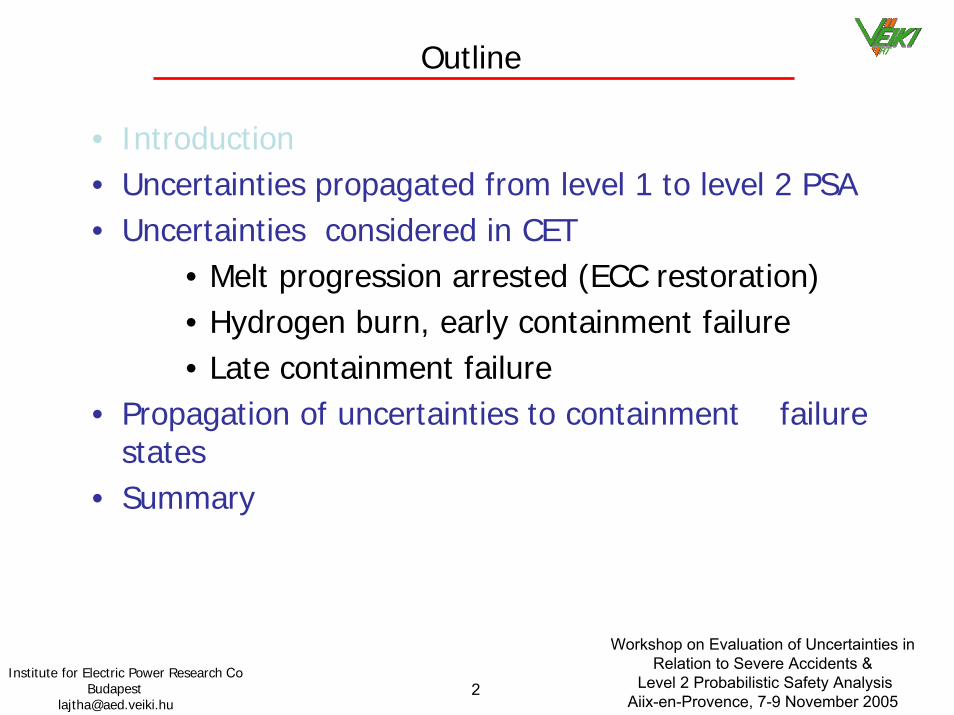
Outline
• Introduction• Uncertainties propagated from level 1 to level 2 PSA• Uncertainties considered in CET
• Melt progression arrested (ECC restoration)• Hydrogen burn, early containment failure• Late containment failure
• Propagation of uncertainties to containment failure states
• Summary

Workshop on Evaluation of Uncertainties inRelation to Severe Accidents &
Level 2 Probabilistic Safety AnalysisAiix-en-Provence, 7-9 November 2005
3Institute for Electric Power Research Co
Introduction
• Level 1 PSA for internal initiators and internal hazards– Nominal power and shutdown state
• Over 500 core damage sequences considered
• Level 2 PSA is based on Level 1– 17 PDS, 13 release categories
• Uncertainty analysis (aleatoric and epistemic uncertainties)
Workshop on Evaluation of Uncertainties inRelation to Severe Accidents &
Level 2 Probabilistic Safety AnalysisAiix-en-Provence, 7-9 November 2005
4Institute for Electric Power Research Co
Level 1 – Level 2 Interface:Uncertainty Analysis
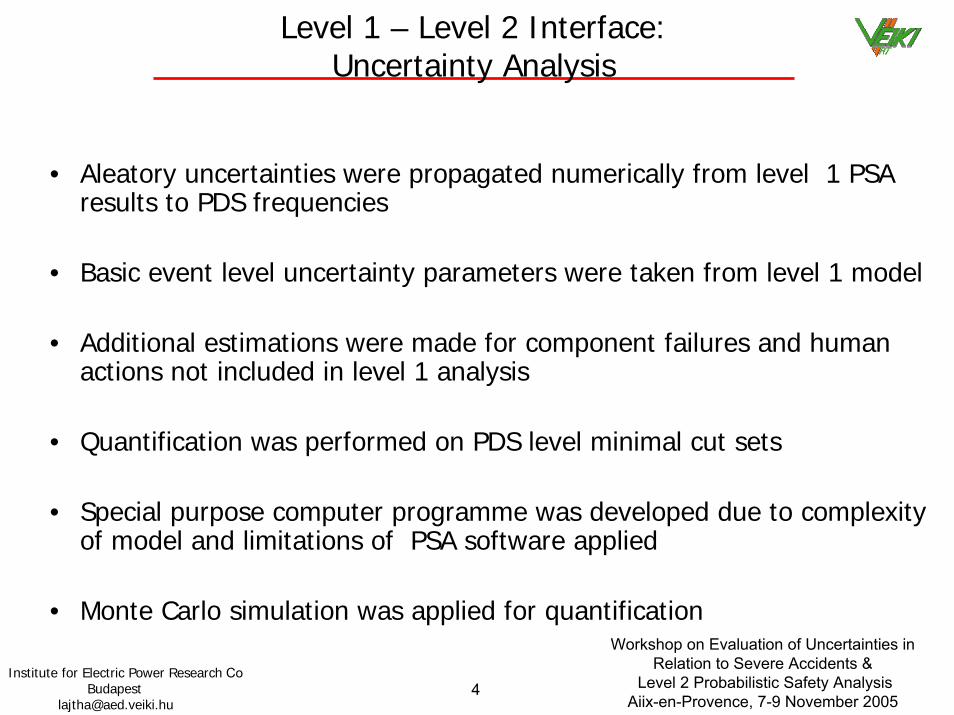
• Aleatory uncertainties were propagated numerically from level 1 PSA results to PDS frequencies
• Basic event level uncertainty parameters were taken from level 1 model
• Additional estimations were made for component failures and human actions not included in level 1 analysis
• Quantification was performed on PDS level minimal cut sets
• Special purpose computer programme was developed due to complexity of model and limitations of PSA software applied
• Monte Carlo simulation was applied for quantification

Workshop on Evaluation of Uncertainties inRelation to Severe Accidents &
Level 2 Probabilistic Safety AnalysisAiix-en-Provence, 7-9 November 2005
5Institute for Electric Power Research Co
Level 1 – Level 2 Interface:Uncertainty Analysis cont’d
1e-9
1e-8
1e-7
1e-6
1e-5
1e-4
PD
S_0
5C
PD
S_0
5J0
PD
S_0
5JA
PD
S_0
0B
PD
S_0
0E
PD
S_0
2A
PD
S_1
2B
PD
S_0
5F
PD
S_0
3B
PD
S_0
2B
PD
S_0
8B
PD
S_1
3C
PD
S_0
5B
PD
S_1
1B
PD
S_0
9F
PD
S_1
3F
PD
S_1
7F
95%, 5%75%, Median, 25%
Workshop on Evaluation of Uncertainties inRelation to Severe Accidents &
Level 2 Probabilistic Safety AnalysisAiix-en-Provence, 7-9 November 2005
6Institute for Electric Power Research Co
Level 1 – Level 2 Interface:Sensitivity Analysis
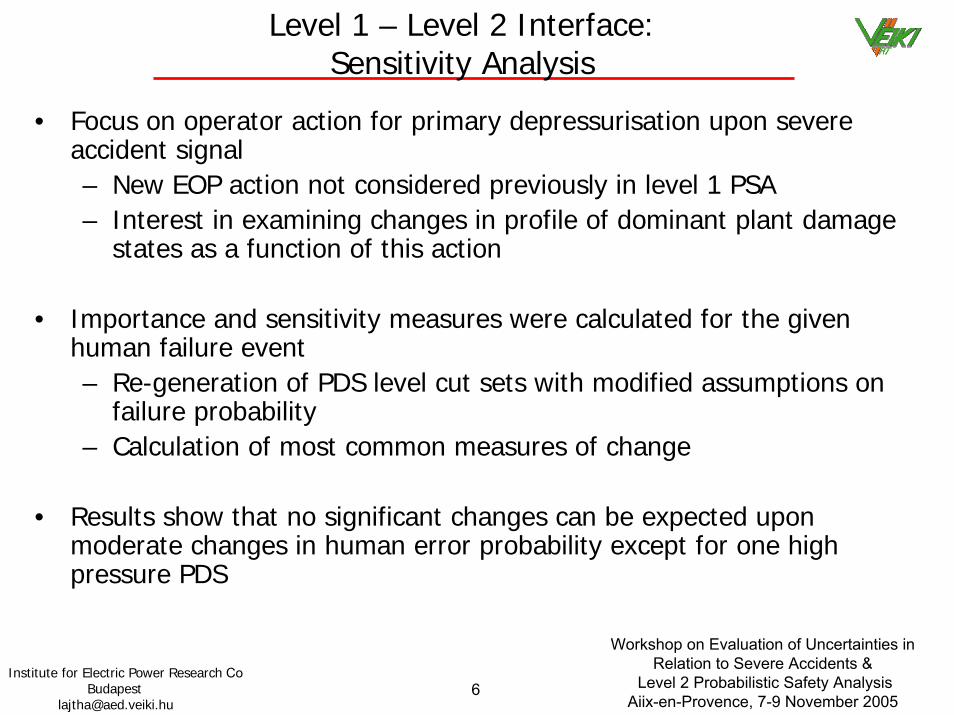
• Focus on operator action for primary depressurisation upon severeaccident signal– New EOP action not considered previously in level 1 PSA– Interest in examining changes in profile of dominant plant damage
states as a function of this action
• Importance and sensitivity measures were calculated for the givenhuman failure event– Re-generation of PDS level cut sets with modified assumptions on
failure probability– Calculation of most common measures of change
• Results show that no significant changes can be expected upon moderate changes in human error probability except for one high pressure PDS
Workshop on Evaluation of Uncertainties inRelation to Severe Accidents &
Level 2 Probabilistic Safety AnalysisAiix-en-Provence, 7-9 November 2005
7Institute for Electric Power Research Co
Uncertainties in the Containment Event Tree
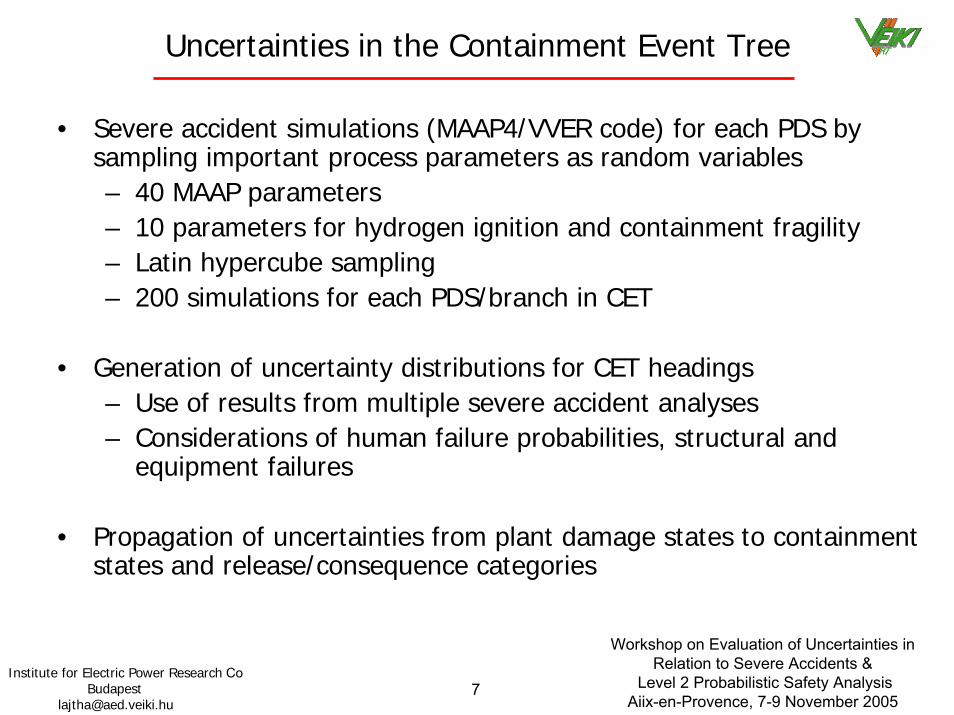
• Severe accident simulations (MAAP4/VVER code) for each PDS by sampling important process parameters as random variables– 40 MAAP parameters– 10 parameters for hydrogen ignition and containment fragility– Latin hypercube sampling– 200 simulations for each PDS/branch in CET
• Generation of uncertainty distributions for CET headings– Use of results from multiple severe accident analyses– Considerations of human failure probabilities, structural and
equipment failures
• Propagation of uncertainties from plant damage states to containment states and release/consequence categories

Workshop on Evaluation of Uncertainties inRelation to Severe Accidents &
Level 2 Probabilistic Safety AnalysisAiix-en-Provence, 7-9 November 2005
8Institute for Electric Power Research Co
Containment Event Tree
Workshop on Evaluation of Uncertainties inRelation to Severe Accidents &
Level 2 Probabilistic Safety AnalysisAiix-en-Provence, 7-9 November 2005
9Institute for Electric Power Research Co
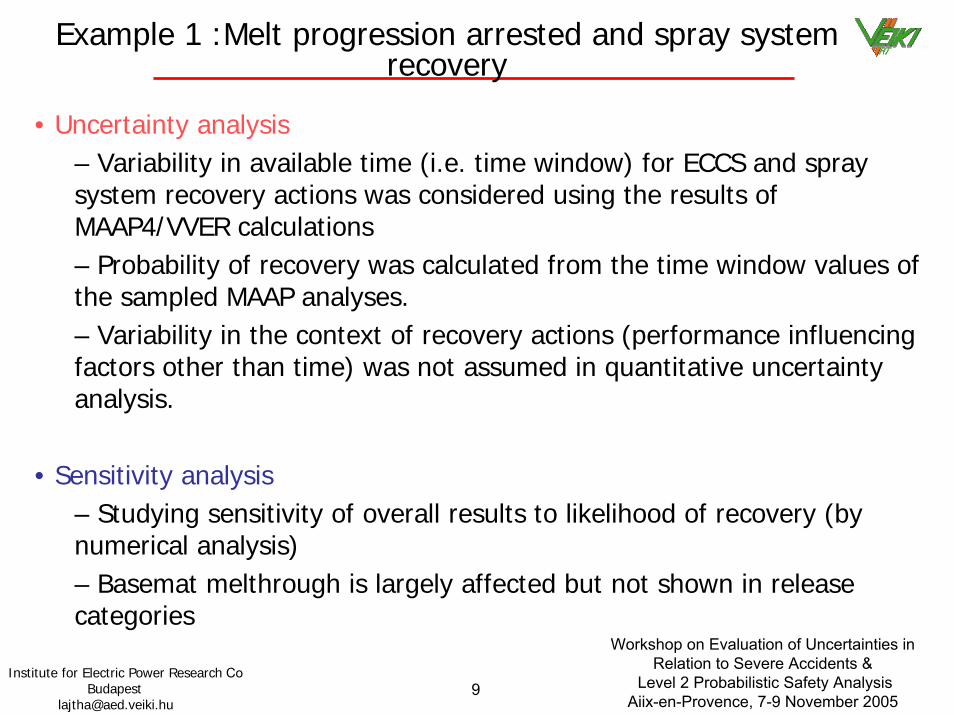
Example 1 :Melt progression arrested and spray system recovery
• Uncertainty analysis– Variability in available time (i.e. time window) for ECCS and spraysystem recovery actions was considered using the results of MAAP4/VVER calculations– Probability of recovery was calculated from the time window values of the sampled MAAP analyses.– Variability in the context of recovery actions (performance influencing factors other than time) was not assumed in quantitative uncertaintyanalysis.
• Sensitivity analysis– Studying sensitivity of overall results to likelihood of recovery (bynumerical analysis)– Basemat melthrough is largely affected but not shown in release categories
Workshop on Evaluation of Uncertainties inRelation to Severe Accidents &
Level 2 Probabilistic Safety AnalysisAiix-en-Provence, 7-9 November 2005
10Institute for Electric Power Research Co
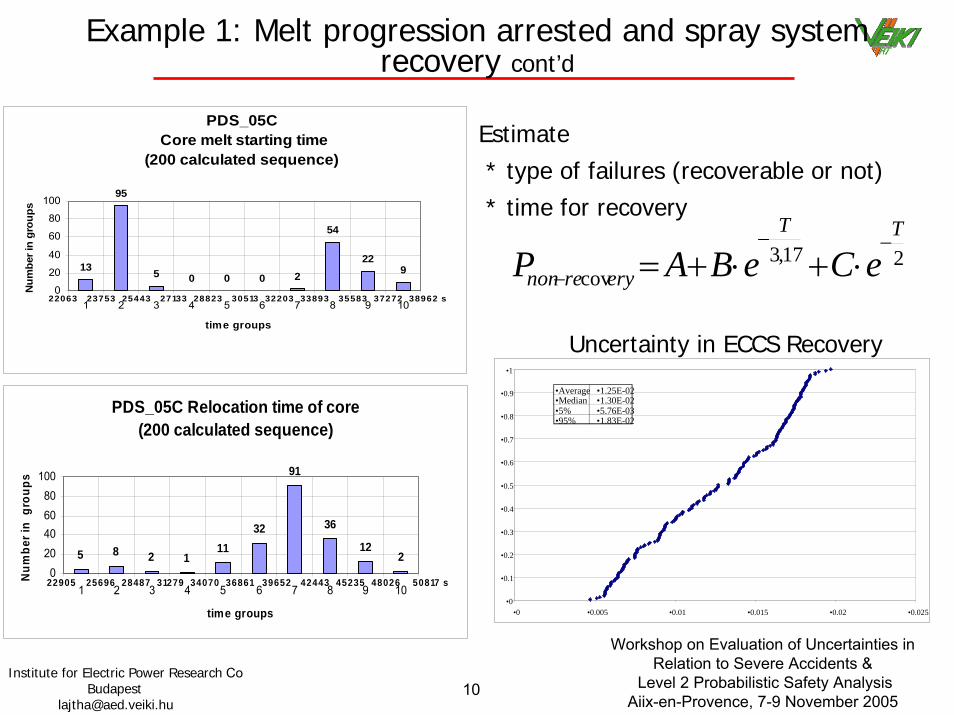
Example 1: Melt progression arrested and spray system recovery cont’d
PDS_05C Relocation time of core(200 calculated sequence)
5 8 111
32
91
36
1222
020406080
100
1 2 3 4 5 6 7 8 9 10
time groups
Num
ber i
n g
roup
s
22905 25696 28487 31279 34070 36861 39652 42443 45235 48026 50817 s
217,3cov
TT
eryrenon eCeBAP−−
− ⋅+⋅+=
PDS_05C Core melt starting time
(200 calculated sequence)
13
95
5 0 0 0 2
54
229
0
20
40
60
80
100
1 2 3 4 5 6 7 8 9 10
time groups
Num
ber i
n gr
oups
22063 23753 25443 27133 28823 30513 32203 33893 35583 37272 38962 s
Estimate* type of failures (recoverable or not)* time for recovery
•0
•0.1
•0.2
•0.3
•0.4
•0.5
•0.6
•0.7
•0.8
•0.9
•1
•0 •0.005 •0.01 •0.015 •0.02 •0.025
•Average •1.25E-02•Median •1.30E-02•5% •5.76E-03•95% •1.83E-02
Uncertainty in ECCS Recovery

Workshop on Evaluation of Uncertainties inRelation to Severe Accidents &
Level 2 Probabilistic Safety AnalysisAiix-en-Provence, 7-9 November 2005
11Institute for Electric Power Research Co
• A complicated process appears in a simplified manner in the CET. For the quantification of burn probabilities and in order to evaluate consequences the DET concept is introduced.
• Hydrogen mole fraction – different hydrogen quantities are produced in each sample (MAAP4/VVER codecalculation)
• Ignition – probability of ignition depends on the existence ofigniting sources (spontaneous ignition, recombiner) and also on the hydrogen concentration
• Combustion mechanism – three combustion mechanisms are distinguished (burn, accelerated flames and DDT) for the determination of containment pressure load the H2AICCis used with Modified Adiabatic Isochoric Complete Combustion (AICC) model
• Containment failure - Joint treatment of containment loads and fragility curves
Example 2: Hydrogen burn, early containment failure
Workshop on Evaluation of Uncertainties inRelation to Severe Accidents &
Level 2 Probabilistic Safety AnalysisAiix-en-Provence, 7-9 November 2005
12Institute for Electric Power Research Co
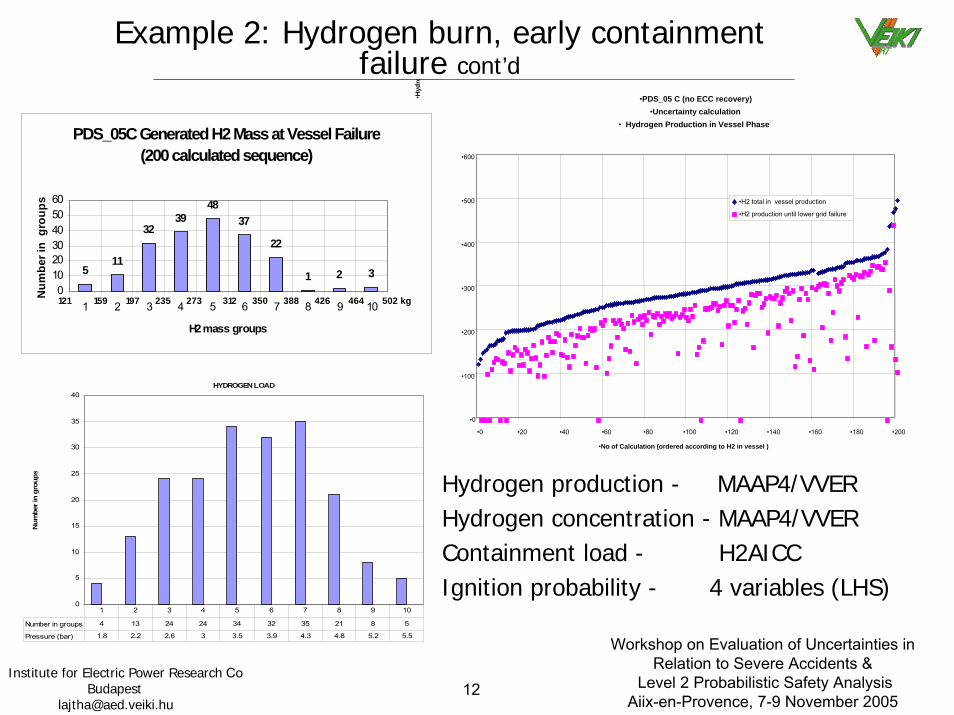
•PDS_05 C (no ECC recovery) •Uncertainty calculation
• Hydrogen Production in Vessel Phase
•0
•100
•200
•300
•400
•500
•600
•0 •20 •40 •60 •80 •100 •120 •140 •160 •180 •200
•No of Calculation (ordered according to H2 in vessel )
•Hyd
roge
nM
ass
(kg)
•H2 total in vessel production
•H2 production until lower grid failure
Hydrogen production - MAAP4/VVERHydrogen concentration - MAAP4/VVERContainment load - H2AICCIgnition probability - 4 variables (LHS)
Example 2: Hydrogen burn, early containmentfailure cont’d
PDS_05C Generated H2 Mass at Vessel Failure (200 calculated sequence)
511
3948
37
22
1 2 3
32
0102030405060
1 2 3 4 5 6 7 8 9 10
H2 mass groups
Num
ber i
n g
roup
s
121 159 197 235 273 312 350 388 426 464 502 kg
HYDROGEN LOAD
0
5
10
15
20
25
30
35
40
Num
ber i
n gr
oups
Number in groups 4 13 24 24 34 32 35 21 8 5
Pressure (bar) 1.8 2.2 2.6 3 3.5 3.9 4.3 4.8 5.2 5.5
1 2 3 4 5 6 7 8 9 10
Workshop on Evaluation of Uncertainties inRelation to Severe Accidents &
Level 2 Probabilistic Safety AnalysisAiix-en-Provence, 7-9 November 2005
13Institute for Electric Power Research Co
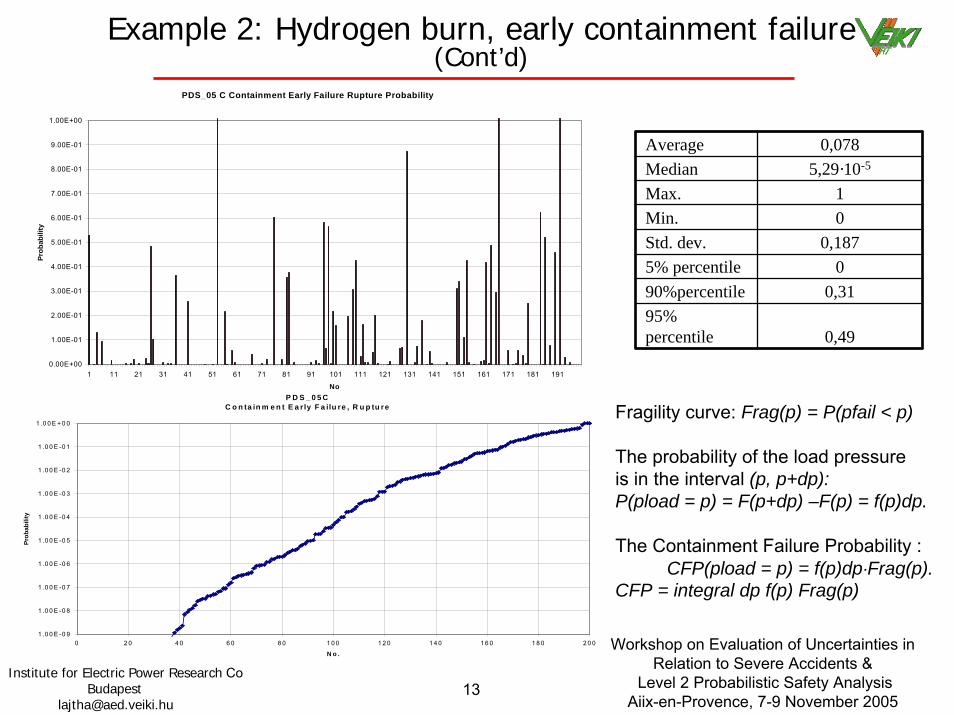
Example 2: Hydrogen burn, early containment failure(Cont’d)
P D S _ 0 5 C C o n ta in m e n t E a r ly F a ilu re , R u p tu re
1 .0 0 E -0 9
1 .0 0 E -0 8
1 .0 0 E -0 7
1 .0 0 E -0 6
1 .0 0 E -0 5
1 .0 0 E -0 4
1 .0 0 E -0 3
1 .0 0 E -0 2
1 .0 0 E -0 1
1 .0 0 E + 0 0
0 2 0 4 0 6 0 8 0 1 0 0 1 2 0 1 4 0 1 6 0 1 8 0 2 0 0
N o .
Prob
abili
ty
Average 0,078Median 5,29·10-5
Max. 1Min. 0Std. dev. 0,1875% percentile 090%percentile 0,3195% percentile 0,49
PDS_05 C Containment Early Failure Rupture Probability
0.00E+00
1.00E-01
2.00E-01
3.00E-01
4.00E-01
5.00E-01
6.00E-01
7.00E-01
8.00E-01
9.00E-01
1.00E+00
1 11 21 31 41 51 61 71 81 91 101 111 121 131 141 151 161 171 181 191
No
Prob
abili
ty
Fragility curve: Frag(p) = P(pfail < p)
The probability of the load pressure is in the interval (p, p+dp):P(pload = p) = F(p+dp) –F(p) = f(p)dp.
The Containment Failure Probability :CFP(pload = p) = f(p)dp⋅Frag(p).
CFP = integral dp f(p) Frag(p)

Workshop on Evaluation of Uncertainties inRelation to Severe Accidents &
Level 2 Probabilistic Safety AnalysisAiix-en-Provence, 7-9 November 2005
14Institute for Electric Power Research Co
Example 3: Late containment failure Cavity Damage
• Reactor vessel cavity damage leads to late enhanced leakage• Probability of cavity (door) damage determined as a function of two major
factors (by using the results of MAAP calculations)• Temperature in the cavity• Corium level in the cavity
• Discrete probability values calculated fromsampled simulations for each PDS
PDS_05CMaximum Level of Corium in the Cavity
(200 calculated sequence)
14
1 0 2
16
4550
44
20
8
0
10
20
30
40
50
60
1 2 3 4 5 6 7 8 9 10
Max level groups
Num
ber i
n gr
oups
0 .004 0.053 0 .103 0 .152 0 .201 0 .250 0 .299 0.349 0 .399 0.448 0 .497 m
PDS_05 C Cavity Door Load and Probability of Failure
0
0.1
0.2
0.3
0.4
0.5
0.6
0.7
0.8
0.9
1
0 20 40 60 80 100 120 140 160 180 200
No
Prob
abili
ty (-
)
Cor
ium
Lev
el (m
)
0
100
200
300
400
500
600
700
800
Tem
pera
ture
(deg
C)
Corium Level (m )Failure ProbabilityTem perature (deg C)
Mean 0,85Median 0,99Minimum 0,01525% 0,8175% 1Variation 0,25
Workshop on Evaluation of Uncertainties inRelation to Severe Accidents &
Level 2 Probabilistic Safety AnalysisAiix-en-Provence, 7-9 November 2005
15Institute for Electric Power Research Co
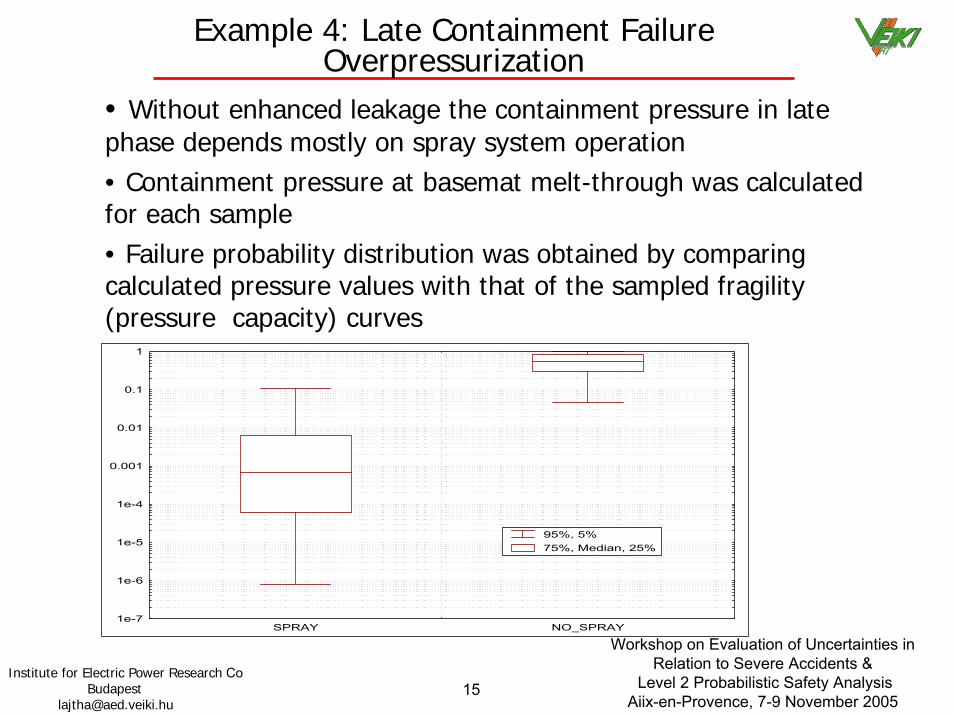
Example 4: Late Containment FailureOverpressurization
• Without enhanced leakage the containment pressure in late phase depends mostly on spray system operation• Containment pressure at basemat melt-through was calculated for each sample • Failure probability distribution was obtained by comparing calculated pressure values with that of the sampled fragility (pressure capacity) curves
1e-7
1e-6
1e-5
1e-4
0.001
0.01
0.1
1
SPRAY NO_SPRAY
95%, 5%75%, Median, 25%
Workshop on Evaluation of Uncertainties inRelation to Severe Accidents &
Level 2 Probabilistic Safety AnalysisAiix-en-Provence, 7-9 November 2005
16Institute for Electric Power Research Co
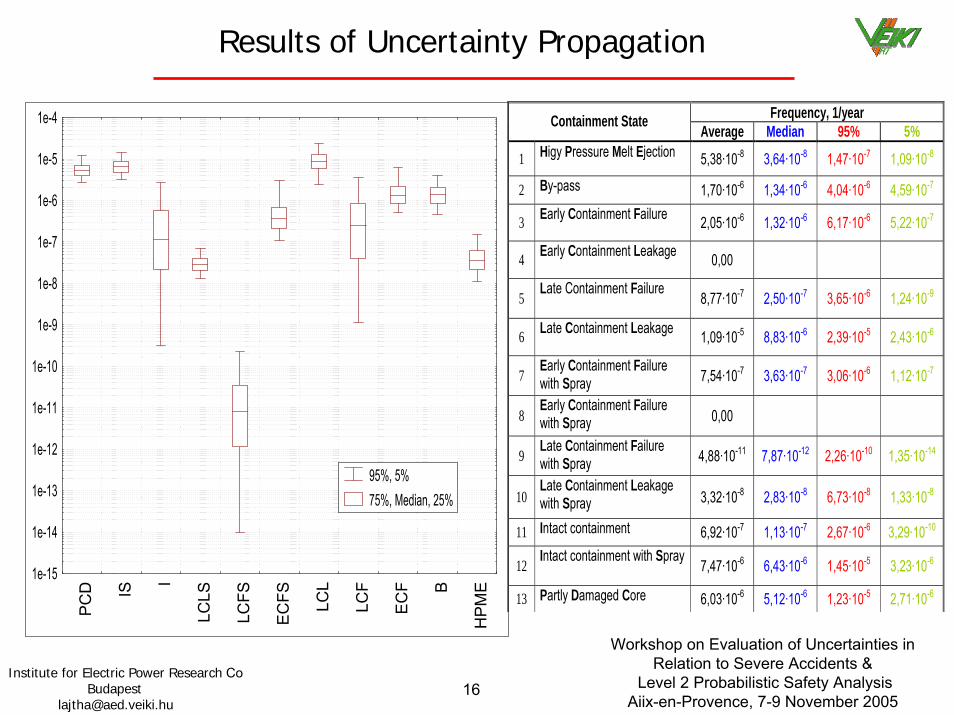
Results of Uncertainty Propagation
1e-15
1e-14
1e-13
1e-12
1e-11
1e-10
1e-9
1e-8
1e-7
1e-6
1e-5
1e-4
PC
D IS
I
LCLS
LCFS
EC
FS LCL
LCF
EC
F B
HP
ME
95%, 5%75%, Median, 25%
Frequency, 1/year Containment State Average Median 95% 5%
1 Higy Pressure Melt Ejection 5,38·10-8 3,64·10-8 1,47·10-7 1,09·10-8
2 By-pass 1,70·10-6 1,34·10-6 4,04·10-6 4,59·10-7
3 Early Containment Failure 2,05·10-6 1,32·10-6 6,17·10-6 5,22·10-7
4 Early Containment Leakage 0,00
5 Late Containment Failure 8,77·10-7 2,50·10-7 3,65·10-6 1,24·10-9
6 Late Containment Leakage 1,09·10-5 8,83·10-6 2,39·10-5 2,43·10-6
7 Early Containment Failure with Spray 7,54·10-7 3,63·10-7 3,06·10-6 1,12·10-7
8 Early Containment Failure with Spray 0,00
9 Late Containment Failure with Spray 4,88·10-11 7,87·10-12 2,26·10-10 1,35·10-14
10 Late Containment Leakage with Spray 3,32·10-8 2,83·10-8 6,73·10-8 1,33·10-8
11 Intact containment 6,92·10-7 1,13·10-7 2,67·10-6 3,29·10-10
12 Intact containment with Spray 7,47·10-6 6,43·10-6 1,45·10-5 3,23·10-6
13 Partly Damaged Core 6,03·10-6 5,12·10-6 1,23·10-5 2,71·10-6
Workshop on Evaluation of Uncertainties inRelation to Severe Accidents &
Level 2 Probabilistic Safety AnalysisAiix-en-Provence, 7-9 November 2005
17Institute for Electric Power Research Co
SUMMARY
• Uncertainty analysis for the level 2 PSA of NPP Paks has been performed with a combination of multiple severe accident simulations and the use of dedicated probabilistic methods and tools to express uncertainties of accident phenomena and consequently, containment states.
• The main advantage of this method is that it has proven capable of determining aleatory uncertainty of a level 2 PSA. Also, the method isrobust and easy to use with the elaborated computer program.
• On the other hand the calculations were very time consuming in spite of the fast running code, MAAP. The automation of producing input for thecodes and of running the MAAP and H2AICC code and finally uncertainty processing was allowed to perform this work in a reasonable time frame.