unceasit 3 - apps.dtic.mil · with an efficient system, systematic investigations can be made...
TRANSCRIPT

AD-Also 509 H NO
UNCEASIT 3

.0 ItI~ [6

o EOA -, I-P7 09 BBCI LE COXY
00 Grant Number: AFOSR-84-033800
HOT CORROSION IN GAS TURBINES A NEW, UNIQUE AND INFORMATIVE
| TECHIQUE IS EASE.
< Trevor R. Griffiths
Department of Inorganic and Structural Chemistry
The University of Leeds
LEEDS
West Yorkshire LS2 9JT
United Kingdom
20 May 1987
Final Report, 31 July 1984 - I December 1986.
Approval for public release; distribution unlimited.
Prepared for
European Office of Aerospace Research and Development 223/231 Old
Marylebone Road, LONDON NW1 5TH, U.K.
S ELECTENOV 0 219871
H
87 , ' 12
UNCLASSIFIEDSECURITY CLASSIFICATION OF THIS PAGE
REPORT DOCUMENTATION PAGEa& REPORT SECURITY CLASSIFICATION lb RESTRICTIVE MARKINGS
70 SECURITY CLASSIFICATION AUTHORITY 3 .DISTRIBUTION/ AVAILABILITY OF REPORT
2b DECLASSIFICATION / DOWNGRADING SCHEDULE Approved for public release;Distribution unlimited
4. PERFORMING ORGANIZATION REPORT NUMBER(S) 5 MONITORING ORGANIZATION REPORT NUMBER(S)
EOAD-TR-87 0.9.6a NAME OF PERFORMING ORGANIZATION 6b OFFICE SYMBOL 7a NAME OF MONITORING ORGANIZATIONThe University of Leeds 1 (if applicable) European Office of Aerospace Research and
___________________ I_ Development
6c. ADDRESS (City, State. and ZIP Code) 7b ADDRESS (City, State, and ZIP Code)Department of Inorganic and Structural Box 14ChemistryFPNeYok050
20Leeds LS2 9JT, United Kingdom P NeYok05-00
Ba. NAME OF FUNDING /SPONSORING 8 b OFFICE SYMBOL 9 PROCUREMENT INSTRUMENT IDENTIFICATION NUMBERORGANIZATION European Office ot (If applicable) AFOSR 84-0338
jAerospace Research & Development LRP
6c. ADDRESS (City, State, and ZIP Code) 10 SOURCE OF FUNDING NUMBERSBox 14 PROGRAM PROJECT ITASKWOKUI
FONwYr 091020ELEMENT NO I NO NO ACCESSION NOFF0Ne Yok 951-00061102F 2301 Ell
11 TITLE (include Security Classification)HOT CORROSION IN GAS TURBINES: A NEW, UNIQUE AND INFORMATIVE TECHNIQUE IS EASE
12 ERSNA AUHORS)Dr. Trevor R. Griffiths
1 ra TYPE OF REPORT 13b TIME COVERED 14 DATE OF REPORT (YearMonthD) SPGCONFial ScienifcFROM 31Jul84 To 1 Dec86 1987 May 20
16. SUPPLEMENTARY NOTATION
17 COSATI CODES It 4S.BJECT TERMS (Continue on reverse if necessary and identify by block number)FIELD GROUP SUB-GROUP BASE \electronic absorption spectroscopy experiments) ,qas
turbines, advanced turbine materials, aerospace applications,molten.sulfates, !iot corrosQ * sgectroscopy, furnaces,chlorid
19 ABSTRACT (Continu on reverwe of netessary and identify by block-a t hot crrosion of advaned utbn materialsused in aerpce applications mmt.w be studhi sucisfuly tith ERM C0lactroic Abstlirm qetxoso~yflperisaits). This tednque pemats the contiuiul 11113ntr" of the disslution of orrosiam poduist intomoltel mulgiatR idspoita urder coditias *sid rAptite effe~imly cipfratir cditssM. 'ftW SW tUtvin or-iginally d~eelope fcr stuskyimx hoo corosEi on mertssater tues, and this PreliunarY study has develop~aid extnad it to turbine materials, %hre the effects of thamal cycling and clxi& additim can be followe.'le mxt dtails tte spectrocopic Stldiemade aid how rates are dkained frosoac~etra; the deign andtasin of tbs'ual 9r ii ftxs; and som crumble and spectracMcxc studies of IN 73B in sulphate 4
cdoii& mialts. A riaomtly matiketed Alliu ftber optic 011-t 0010t-wter couild be morifiM to erance 9Mstudlies and make in situ studies of operatun turb1ie.-
20. DISTRIBUTION /AVAILABILITY OF ABSTRACT 21 ABSTRACT SECURITY CLASSIFICATION
O:UNCLASSIFiED/UNLIMITED EXSAME AS RPT C9 DTIC USERS Unclassified
22fNA OF RESPONSIBLE INDIVIDUAL 22b TELEPHONE (include Area Code) I22c OFFICE SYMBOL0 LaRell K. Smith 1(44 1) 409-4505 EOARD/LRP
DOFORM 1473.94 MAR 83 APR edition may be used until exhausted SECURITY CLASSIFICATION OF THIS PAGEAll other editions are obsolete UNCLASSIFIED

E9RMD.- S8 7 Q 9
This report has been reviewed by the EOARD Information Office and isreleasable to the National Technical Information Service (NTIS). At NTISit will be releasable to the general public, including foreign nations.
This technical report has been reviewed and is approved for publication.
Chief, Physical Chemistry/Materials
ROBERT C. WINN, Lt Colonel, USAFChief Scientist

Preface
The work reported here has been associated with studies also
using and developing the EASE technique (Electronic Absorption
Spectroscopy Experiments) on the related topic of hot corrosion
by molten salt deposits, but occurring on superheater and reheater
tubes in fossil fuel fired power generation plant. Naturally,
at times, the findings of Dr. Hubbard, the Experimental Officer
for this project, were applicable both to this project and super-
heater corrosion, and vice Versa. The contributions and co-
operation of research students Keith King and Susan Marchant are
gratefully acknowledged, as are their co-sponsors, the Science
and Engineering Research Council (SERC) and the Central Electricity
Generating Board (CEGB), N.E. Region, and we thank the latter for
the use of their in-house reports.
L oniO For
0 TS GRAiil M0TIC TAB 0IUnannouroed 0Justifiostion
ByD13tribution/
A-ailabilty Codes
Avail and/orFDst Special

TABLE OF CONTENTSPagu
1. PURPOSE AND SCOPE 2
1.1. Background 2
1.2. Operational Procedures 3
2. SPECTROSCOPIC STUDIES 4
2.1. Introduction 4
2.2. Chromium(1lI) and Iron(lIl) in Melts 6
3. COORDINATION COMPLEXES IN MOLTEN SALTS 8
3.1. Spectra obtained using Sulphate Melts
with Added Chloride 8
3.2. Nickel(ll) in Sulphate Melts with Added
Chloride 9
3.3. Chromium(IlI) in Sulphate Melts and
Added Chloride 17
3.4. Iron(III) in Sulphate Melts with Added
Chloride 22
3.5. Isosbestic Points 22
4. HOT CORROSION OF SUPERALLOYS 24
4.1. Crucible Tests 27
4.2. Spectroscopic Studies
5. RECOM20ENDATIONS FOR FUTURE WORK
APPENDIX A. Thermal Gradient Furnaces 4-
A.1. Introduction 4
A.2. Furnace Design
A.3. Variable Thermal Gradients 4C
APPENDIX B. Optical System 47
B.1. Spectrophotometer Optical Arrangement 47
B.2. Selection of Optimum Mask Systenm -- ,
B.3. Size of Section Examined 56
APPENDIX C. The Measurement of Accurate Spectra Ci
C.1. Resolution LI
C.2. Band Shape (2
C.3. Signal-to-Noist, Ratio '4
C.4. Stray Lipht
REFERENCES Cc

1. PURPOSE AND SCOPE
1.1. Background
The hot corrosion of advanced turbine materials used in
aerospace applications may now be studied with EASE. The acronym
EASE stands for Electronic Absorption Spectroscopy Experiments, and
the technique was originally developed at Leeds University to
investigate the hot corrosion occurring on superheater and reheater
tubes in fossil fuel fired power generation plant. Such corrosion
is brought about by molten sulphate deposits similar to those
occuring in gas turbines. The EASE technique has many features and
advantages, and is unique in that in principle it permits the cont-
inuous monitoring of the dissolution of corrosion products into the
molten sulphate under heat flux conditions which replicate effectively
in-plant conditions. It was therefore of interest and appropriate
to continue its development.and apply it to hot corrosion in gas
turbines, especially that by molten sulphates containing added
chloride.
The immediate objectives were to establish the necessary back-
ground and practical knowledge and extensions to the EASE apparatus
and technique that would be necessary so that new information would
be obtained on advanced aerospace materials, and this report
describes our successes and how most of this has been achieved. The
long term general objectives are (1) to adapt, streamline and
partially automate the EASE technique to study hot corrosion in gas
turbines; (2) to acquire data necessary regarding superalloys and
the like by crucible tests (analysing the melt), combined with a
fundamental study of the chemistry of niobium, tantalum, molybdenum
and tungsten in molten sulphate (and with added chloride) using
electronic absorption spectroscopy, since this is lacking in the
literature; and (3) using EASE, and replicating closely as many
operational conditions as possible, obtain ned information regarding
corrosion rates, mechanisms and models for advanced aerospace
materials.
-2

A hope long harboured has been that spectroscopic
measurements could be made rapidly in normally inaccessible places
using fibre optics as light guides. After the practical side of
this report was complete a portable commercial instrument, termed
a Guided Wave Analyser, appeared on the European market a few
months ago. It is American made (and had been released on the
American market a year earlier) and is fully automated and computerised.
The Principal Investigator has had one demonstrated in his laboratory,
and concludes that such instruments are the new generation of versatile
spectrophotometers. With certain modifications they could be adapted
to enhance considerably data collection and manipulation during EASE
measurements. In principle, with some cooling of the fibre tip, and
using a strobe light source, the spectra of molten sulphate deposits
on individual blades in an operating gas turbine could be measured
and monitored. Additional comments on future work using the present
system are given on pages 39-41.
1.2. Operational Procedures
The project was seen as taking place on three levels; an
efficiently working base system; melding into current hot corrcsion
research; and new research, particularly the testing of speculations.
a. Efficiently working base system.
With an efficient system, systematic investigations can be
made quickly and reliably, and speculative investigations can be
followed up effectively. Over the years various research students
had contributed in their individual ways to our understanding of
molten salt spectroscopy, but it was now appropriate, having defined
objectives, to systematize and mgularize the base procedures of
servicing, equipment replacement, stock-taking, calibration of
instruments, (spectrophotometers and furnaces in particular), and
compilations of basic data.
b. Integration with current hot corrosion research.
In our development of molten salt spectroscopy, and more recently
-3-

its application to hot corrosion, various restarch students had
produced a variety of useful practical procedures and computer
programs. It was now appropriate, and especially for this project,
to consolidate,Systematize and establish the reliability and domain
of these procedures and techniques. Further, theoretical considerations
then are needed, to identify possible sources of ambiguities and
errors, to build confidence into simple systems, allow extension to
complex systems, and formulate standard procedures. The various
computing programs and approaches, developed in the past using
different languages required integration into a uniform access and
implementation procedure, together with the setting up of a spectral
database. The opportunity was also taken to start transferring
literature references and important past observations into computerised
notebook form.
This project also prompted cross-correlation with other techniques
employed in the Chemistry and Applied Science departments of the
University, particularly X-ray .studies, electron microscopy, and
standard metallurgical preparative and testing procedures.
c. New research, and the testing of ideas.
In the testing of the hot corrosion of superalloys it is
necessary to make crucible and spectroscopic (EASE) investigations
under relevant conditions while gleaning new data from analysis of the
molten salt solutions. Results known from metallurgical investigations
must be carefully married with chemical findings, making due allowance
for different experimental conditions. Possible ways of using the EASE
technique to derive, for example, diffusion and Soret coefficients for
transition metal ions in molten salts are potentially available,
employing realistic operating conditions. Also, new computing programs
can be developed, tested and produced in support of the above.
2. SPECTROSCOPIC STUDIES
2.1. Introduction
There are relatively few reports in the literature of the
spectra of transition metal ions in sulphate melts, and only the earlier
-4-

work by us for the spectra of such ions in aluminium-containing
sulphate melts (1). The corresponding spectra in chloride systems
(including those containing AIC 3) are more widely reported. There
are, however, no reports for mixed sulphate-chloride melts.
Our use of aluminium-containing sulphate melts, specifically
(Na, K, Al)SO4 , have cation mole ratios, respectively, of 42.5:42.5:15,
stems from our original EASE technique studies relating to hot
corrosion in coal-fired steam-generating plant (2,3). Although the
major cations found from analysis of deposits were sodium and
potassium, the (Na,K)SO4 eutectic mixture melted at around 800*C,
well above the known melting point of the sulphate deposit on super-
heater tubes of around 550*C. Previous crucible tests achieved this
lower liquidus temperature by using the ternary eutectic (Li,Na,K)SO4
but here the cation mole percent of lithium is 78. Although lithium
is a minor constituent of superheater deposits, the CEGB had for many
years used this eutectic mixture to their satisfaction : we opted to
search for a ternary sulphate mixture employing one of the next most
abundant elements found in deposits after sodium and potassium (1),
and which would need to be present in smaller amounts than these
other two cations. Preliminary comparative corrosion rate tests have
indicated that our aluminium-containing melts were approximately
twice as corrosive as the lithium -containing eutectic.
When considering the application of our EASE technique to hot
corrosion in gas turbines we were unhappy with the common North
American concept that the melt involved in low temperature hot
corrosion was largely the sodium sulphate-cobalt sulphate eutectic.
This latter was based on phase diagram considerations, since
insufficient sulphate deposits for analysis are found on, (or allowed
to remair, on), aircraft gas turbine engines or burner-rig assemblies.
(1). T.R. Griffiths and K. King, J. Chez. Soc., Faraday Trans. i, 1961,
77, 2763.
(2). T.R. Griffiths, K. King and D. Mortimer, High Temp. Technology,
1982, 1, 43.
(3). T.R. Griffiths, K. King and D. Mortimer, Power Ind. Res., 1982, 2, 79.

Our enquiries with European turbine specialists, and
general reading, showed a preference for an alternative explanation,
but no universal (or Continentally acceptable) alternative was
advanced: the concept that molten sodium sulphate would be deposited
(mp 8840C), and that this would oxidise the cobalt in the superalloy,
and take it into solution was not considered likely or feasible. We
therefore considered the situation and favoured investigating the
behaviour of synthetic sea-salt mixed with varying amounts of sea-salt
sulphate, i.e., a sulphate mixture containing the relative amounts of
the cations within synthetic sea-salt. Unfortunately the time-scale
of this project did not permit us to commence studies of and within
these mixtures, and we deemed it more profitable to use, for the
moment, the flthium-containing and the aluminium-containing sulphates,
to link in better with our previous and existing work. However, we
do consider that a major part of future studies should be on the
behaviour of metals, alloys and coated alloys in sea-salt sulphate
and chloride melts.
Before the behaviour of alloys in molten sulphates can be
studied spectroscopically, it is necessary to know the main features
of the spectra of ions of the individual component elements in these
melts, and the interaction of each metallic element with these melts.
Our studies on nickel were essentially complete and have been
published (3), but work on chromium and iron were incomplete, and
have been continued in this project and are therefore here reported.
2.2. Chromium(IIl) and Iron(III) in Melts.The chromium(IlI) spectra in (Li, Na, K)SO4 at 600'C has been
recorded by Johnson ct 0,. (4). They identified an octahedral species3-
which they proposed as [Cr(SO 4) I , with three bidentate sulphate43
ligands. The Cz (11) spectrum in (Li, K)Cl e:t ctic was recorded by
Harrington and Sundheim (5), who noted slight changes upon increasing
(4). K.E. Johnson, R. Palmer and T.S. Piper, Spectrochim. Acta, 1965,
21, 1697.
(5), G. Harrington and B.R. Sundheim, Ann. N.Y. Acad. Sci., 1960, 79, 950.
-6-

3-
the temperature from 392 to 44A'C. The [CrC1 61 species was
proposed, and the observed changes attributed to thermal perturbations.
Gruen and McBeth (6) also examined this system, and extended the
temperature range to 1000*C. Even at the highest temperature the
spectrum could still be interpreted on the basis of [CrCl 6
3
octahedra, with no indication of an octahedral-tetrahedral
equilibrium, (which is a common feature of chloride melts containing
nickel(II)).
Iron(III) is d5
ion and thus d-d transitions are both Laporte
and spin-forbidden. As a consequence, the bands are very weak, and
their observation is further limited by a very strong charge transfer
edge, which dominates the iron(III) spectrum in molten systems.
Harrington and Sundheim (5) obtained the spectrum in (Li,K)Cl eutectic,
finding a strongly absorbing shoulder below 400 nm on the edge of a
band which rose sharply around 250 nm. Increasing the temperature
from 373 to 434*C caused the shoulder to diminish. Comparison of
the spectra with others of iron(III) in a variety of non-aqueous
solvents led the authors to propose a tetrahedral [FeC 4] species.
Silcox and Haendler J7) recorded the ultraviolet spectrum of iron(III)
in the (Na, K, Mg)Cl eutectic at 430*C, and again a rising absorption
edge was found, but this time containing possible indications of weak
bands. No identification of the iron species was attempted.
We have published a preliminary report (8) on the spectrum of
iron(III) in chloride and, for the first time, sulphate melts in which
we identified many of the weak bands, and concluded that tetrahedral
complex ions were formed in both chloride and sulphate melts.
(6). D.M. Gruen and R.L. McBeth, Paper for the Seventh International
Conference on Coordination Chemistry, Stockholm (June 19E2)
(7). N.W. Silcox and H.M. Haendler, J. Phys. Chem., 1960, 64, 303.
(8). T.R. Griffitns and K. King, Chem. Comm., 1991, 518.
-7-

3. COORDINATION COMPLEXES IN MOLTEN SALTS
The assertion that discrete co-ordination complexes exist in molten salts
at high temperatures has at times been questioned. The alternative
view (9) is that the metal ion is merely at a centre having, say,
basically octahedral or tetrahedral symmetry, and that the lifetime
of a given anion contiguous to the metal is very short, and thus no
bonding between metal and ligand can occur. While this may be the
case at temperatures approaching 1000*C, there is ample evidence
for the existence of discrete complexes at temperatures pertinent
to this project. This evidence includes the effect of very small
additions on nickel(II) spectra in nitrate melts (10). Such
additions produce large changes in the spectra, which would not be
possible unless discrete chloride-containing complexes were formed.
Equally strong evidence for complex formation arises from the
appearance of identical spectra in molten salts and in appropriate
non-aqueous solvents, where discrete complexes are known to exist.
We therefore conclude that for this study our spectra are to be
interpreted in terms of complex ions, but for future work at
higher temperatures, the existence of cations at the centres of
various anion site symmetries will have to be assessed as possible
contributors to the overall understanding.
3.1. Spectra obtained using Sulphate Melts with Added Chloride
Typical spectra for Ni(II), Cr(III) and Fe(III) in molten
(Na, K, AI)SO4 have been published and briefly described (1) :
spectra in mixed sulphate with chloride melts have not previously
been reported.
It was initially found that it was not possible to investigate
the effect of temierature upon a melt of given chloride content.
(9). J. Brynestad, C.R. Boston and G.P. Smith, J. Chem. Phys.,
1967, 47, 3179.
(10). T.R. Griffiths and P.J. Potts, Inorg. Chem., 197S, 14, 1&39.
-8-

K
Al2C16 is slowly lost from these melts, and thus significant
melt composition changes would have occurred in the time required
for thermal equilibration at each temperature. The best procedure
was therefore to keep the melt temperature constant and add the
chloride in approximately 5 mo) anion percent increments. At the
end of each run the chloride content of a solidified melt sample
was analysed. In all cases the chloride content was within t 2
mol anion percent of the expected value.
It was also found that chloride additions enhanced the
decomposition of the melt, as evidence by the formation of a
precipitate. Thus, at the highest temperature (7301C) , chloride
additions were limited to 45 mol anion percent for chromium and
iron, but 35 mol anion percent for nickel, since a larger scan
range was required for this ion, and thus each spectrum took
longer to record. A water-insoluble white residue was isolated
from melt samples in which decomposition had taken place, and was
shown to be Al203 by micro-anaiysis.
3.2. Nickel(Il) in Sulphate Melts with Added Chloride.
The variation of the nickel(Il) spectrum with chloride content
from 0 to 35 mol anion percent was recorded over the temperature
range 5E7-720'C. At 567'C the system was very near its melting point
and too opaque for recording spectra at chloride content below 15 mcl
anion percent. The variation with chloride content at 600 and 720'C
is shown in Figs. I and 2, respectively.
The spectrum of nickel(II) in the pure ternary sulphate melt,
(Na, K, Al)SO4, is similar to that in the (Li, Na, Y)SO4 melt (11),
except that the shoulder on the low energy sidc of the main band is
much more pronounced in the aluminium-containing melt. The effect
of increasing the temperature is to shift the whole spectrum to
(11). K.E. Johnson and T.S. Piper, Discuss. Faral'ay Soc., 1961, 32, 32.
-9-

CC anion fraction moL%
30.
S25". 20.
Lis4- 10
8 i0 12 14 16 e8 20 22 24 26
WAVENUMbER / kK
Figure Variation of nickel(II) spectrum in (Na,K,Al)(SO4,CI) with chloride content.
at 6000C (49 point smoothing fifth order polynomial).
6-CCarin fraction IMO
35- 3025
"" 20
4 105
00
'C
8 i0 i2 i4 i6 18 210 22 24 26
VAVENUtBER /LK
Figure 2 Variation of nickel(Il) spectrum in (Na,K.Al)(S0 4 'Cl) with chloride
content, at 720'C (49 point smoothing, fifth order polynomial).
-10-

slightly lower energy, and to introduce a second shoulder on the
low energy Bide of the main band. The progressive broadening of
bands with increasing temperature tended to mask these effects.
The addition of chloride ions has a dramatic effect on the
spectra at all temperatures. As the chloride content is increased,
the original main band diminishes and the spectra becomes dominated
by bands emerging at lower energies. The addition of chloride is
also accompanied by the establishment of a number of isosbestic points
at approximately 10,000, 12,000, 20,000 and 25,000 cm- . However,
not all the curves pass through these points and there is an apparent
improvement in the convergence with increasing temperature.
The occurrence of isosbestic points has often been taken as an
indication of a two species equilibrium. A more detailed analysis
is given in Section 3.5.
To establish the effect of complete replacement of sulphate by
chloride in the melt, the spectrum of nickel(II) chloride in the
(Na, K, Al)Cl melt, having the same cation ratios as the eutectic
(Na, K, Al)SO4 , was recorded at 692'C. This is shown in Fig. 3, along
with the spectra for chloride additions to the sulphate melt at that
temperature. The spectrum in (Na, K, Al)Cl is very similar to that
reported by Smith (12) for nickel(II) in fused CsCl at 8000 C.
a. Higher Derivative Analysis
Both second and fourth derivative analyses were performed, and
good agreement between the two was found. Simultaneous smoothing and
differentiation was utilised (13), equivalent to a 49 point different-
iation of a 49 point smoothed spectrum, fitting a fifth order polynomal.
The uncertainties in the energies of the bands obtained wer< fstir!CL
at ±200 cm 1 .
(12). G.P. Smith, in 'Molten Salt Chemistry', Ed. M. Blander, Wiley and
Sons (1964).
(13). T.R. Griffiths, K. King, H.V. St.A. Hubbard, M-J Schwing-Weill
and J. Meullemeestre, Anal. Chim. Acta, 1982, 143, 163.
- 11 -

CI" anion fraction I mol %6' '
100 ' ",
35 ,5"u S' ~30. ", "
_125.
S4, 10
U.
2 r
0b 0
10 i2 14 16 18 20 22 24 26
WAVENUMBER / WZFigure 3 Variation of nickel(II) spectrum in (N4 KAl)(S04 Cl) with chloride content,
and spectrum in (Na,K,AI)CI (dashed line), at 6920C (49 point anoothina
fifth order polynom al).
-12-

For the spectra in the (Na, K, Al)(SO4, Cl) system up to
six bands (labelled A-F) were identified, although all of them
were not always present. Representative second and fourth derivatives
are shown in Fig. 4. The variation of the energies of the resolved
bands with chloride content, at the six temperatures investigated,
is shown in Fig. 5.
A similar analysis of the nickel(II) spectrum in (Na, K, Al)Cl-1
yielded four main bands at 17,500, 15,800, 14,300 and 13,400 cm ,
and these may be associated with the bands C-F, respectively, above.
b. Discussion
In the spectrochemical series for molten salts reported by
Johnson (14), sulphate appears directly above chloride. A shift to
lower energy is therefore expected as sulphate ligands are replaced
by chloride in the nickel coordination sphere. The interpretation of
the mixed sulphate-chloride spectra is aided by the results from the
analysis of nickel(II) in (Na,'K, Al)Cl, and so this will be considered
first.
The similarity of the nickel(lI) spectra in fused CsCI and in
a crystal of Cs 2ZnC 4 doped with Cs 2NiC1 4, in which nickel ions are
known to be tetrahedrally coordinated, led Smith (12) to conclude that
nickel complexes of Td symmetry were present in the CsCI melt. The
same conclusion may be drawn here, regarding nickel(Il) in the fused
(Na, K, Al)Cl melt. Assuming a Dq value of 370 cm-
for the NiCl4 2-
complex (12), bands C, D and E may be assigned to the 3T (F) - 3T (P)
transition. This triplet state is split into three distinct bands by
spin-orbit coupling (12). Band F, which is much lass pronounced than
the rest, may be assigned to the spin-forbidden transition 3T I(F)
1E(D) or IT2 (D) : subsequent more detailed work may reveal this bard to
be made up of two bands close together.
Considering now the mixed sulphate-chloride spectra it is
clear that tetrahedral nickel species are present in these melts.
(14). K.E. Johnson, Electrochim. Acta, 1966, 11, 129.
- 13 -

mu
WVVi iO i2 i4 16 20 ' 22 26 i@ S0
UAVYEM*SeJ / K
Figure 4 Spectrum of nickel(II) in (NaK.A.)(S04 'Cl). containing 10 mol anion
chloride at 6920C. A second derivative: B, fourth derivative.
14 -

5670C 600*1 628K
AA -- A
B B
S20
C
FF
0 10 20 30 0 10L 20 3C 0 10 2 0 3 0chlbr ide anion fracrion Im~ol %
25 r 6*C70
AA
BB
20~
E
CC
E E
30 0 chloide ano r acio firc!
Figu.re 1; Variation in energies of resolved band, of the nlcko'I0I apectru" in (Na X '(0 Cl
with Chcrade content at 507. 600 62A. 660, 692 and '2COC.

r
Bands A and B may be assigned to transitions in an octahedral
complex : band B is the main transition 3A 3T g(P), and band
B may be a spin-forbidden transition to the A og or IT 1 state,
from the IG free ion term, and again more work is merited.
There are therefore 0h and Td nickel species in the pure
(Na, K, Al)SO4 melt. The octahedral complex is clearly4-
[Ni(SO 4 )3 ] , (strictly, it has D3 symmetry, but the crystal field
of the metal ion may be taken as 0 h), with three bidentate sulphate
ligands (11). The tetrahedral species, identified by two of the
3 3three components of the transition T I(F) T (P), is not so well
defined, the choice being between mono- and bidentate sulphate
ligands. The former is favoured since there is now a greater
distance between pairs of sites to be bridged by a bidentate ligand,
and also because of the lower coordination number, so that fouL
sulphates could be accommodated around the nickel atom, whereas six
(to form octahedral [Ni(SO4 )6] I0 - )
might not. It is thus here
concluded that the tetrahedral species is [Ni(SO4 ) 4]6.
The effect of temperature upon the spectrum is to shift the
band to lower energy, and make the components due to the tetraheiral
species more prominent. This indicates that higher temperatures
favour the formation of tetrahedral nickel. Similar results have been
obtained in chloride melts (15). At thc .! ::c-t temrCerat-rC, 72C c, thc
spin-forbidden bands A and F are no longer detected (Fig. 5). This
results from the thermal broadening of the relatively strong spin-
allowed bands.
The addition of chloride to the (Na, K, AI)SO mlt has a4 m
markedly different effect upon the tetrahedral bands (C-F),
compared with the octahedral bands A and B. Both sets are shifted
progressively, but the tetrahedral bands to a much greater extent.
The shift is due to the admission of chloride io.is into the
(15). C.A. Angell and D.M. Gruen, J. Phys. Chem., 1966, 7(0, IbL21.
- ( -

Coordination sphere of the nickel. But for the tetrahedrml bands
the replacement of, say, one oxygen atom (of a sulphate ligand) by
a chloride ion has a greater effect on the crystal field splitting
in the tetrahedral complex than in the octahedral.
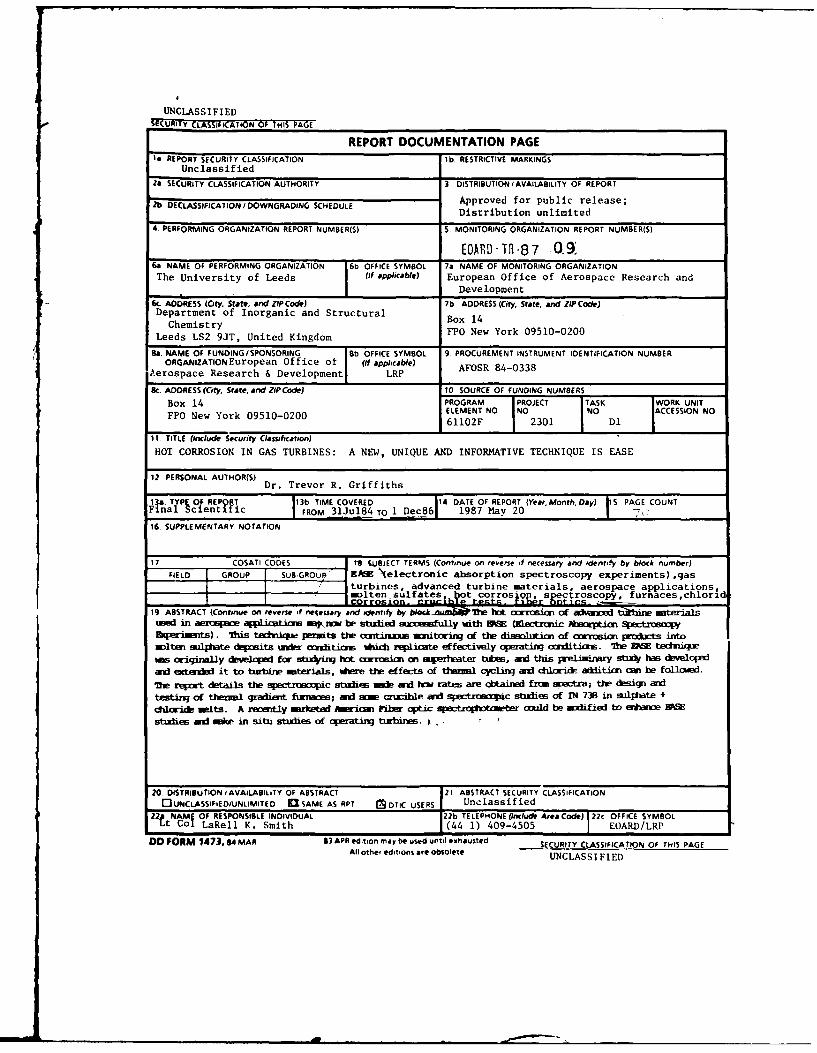
3.3. Chromium(III) in Sulphate Melts with Added Chloride.
The effect of chlorides on the spectrum of chromium(III) in
(Na, K, AI)SO 4 is comparatively small and virtually temperature
independent in the range examined 610 - 730*C. The variation is
shown, at 610*C, in Fig. 6 and at 692°C, in Fig. 7. The spectrum
of Cr(III) in the (Na, K, Al)Cl melt, at 692*C, is also shown in
Fig. 7.
The effect of increasing temperature on the spectrum in
(Na, K, Al)SO 4 is to produce a very slight shift to lower energy.
Additionally, the doublet at 14,000 cm- I
(Fig. 6) becomes less
pronounced : this latter effect may be attributed to thermal
broadening.
Chloride additions also cause a shift to lower energy, but
of greater magnitude than that due to ;ncreasr~ntemperature. The
effect on the smaller band is interesting in that chloride addition
appears to increase the intensity of the lower energy component of
the doublet which comprises this band.
In the (Na, K, Al)Cl melt the Cr(ll1) spectrum is at lower
energy than when recorded in the mixed sulphate-clloridc system.
The bands are also sharper and more intense.
Chromium(fIl) complexes slowly decomposed in the pure
(Na, K, Al)SO4 melt, and in melts with added chloride, but only
when the melt temperature was above aLout 700C. Here small
spectral changes could be detected only aftur several hourr, and
ultimately a green precipitate formud in the melt, identified as
Cr 203 by elemental analysis, Solutions around 6001C were stable
for at least 80 hours.
6-
ft
4-
Clanion tratior I mo %
AVEM~tBER W P
Figure 7 Variation of chromim(II) spectrum in (al.Al)(S 4 Cl) with chloridecotn
at60C 4 oitmoothing fifth order polynomial).)
Cl-anion ~ ~ frc8o -m!

a. Higher derivative analysis
The analysis performed is equivalent to a 47 point different-
iation of a 47 point smoothed spectrum, with a fifth order polynomial.
A typical result is shown in Fig. 8. The bands obtained were
closely spaced and therefore not always resolved by the second
derivative. However, in cases where resolution was possible, good
agreement between second and fourth derivative spectra was obtained,
and where a band was not resolved in the second derivative, the value
obtained from the fourth derivative alone was used.
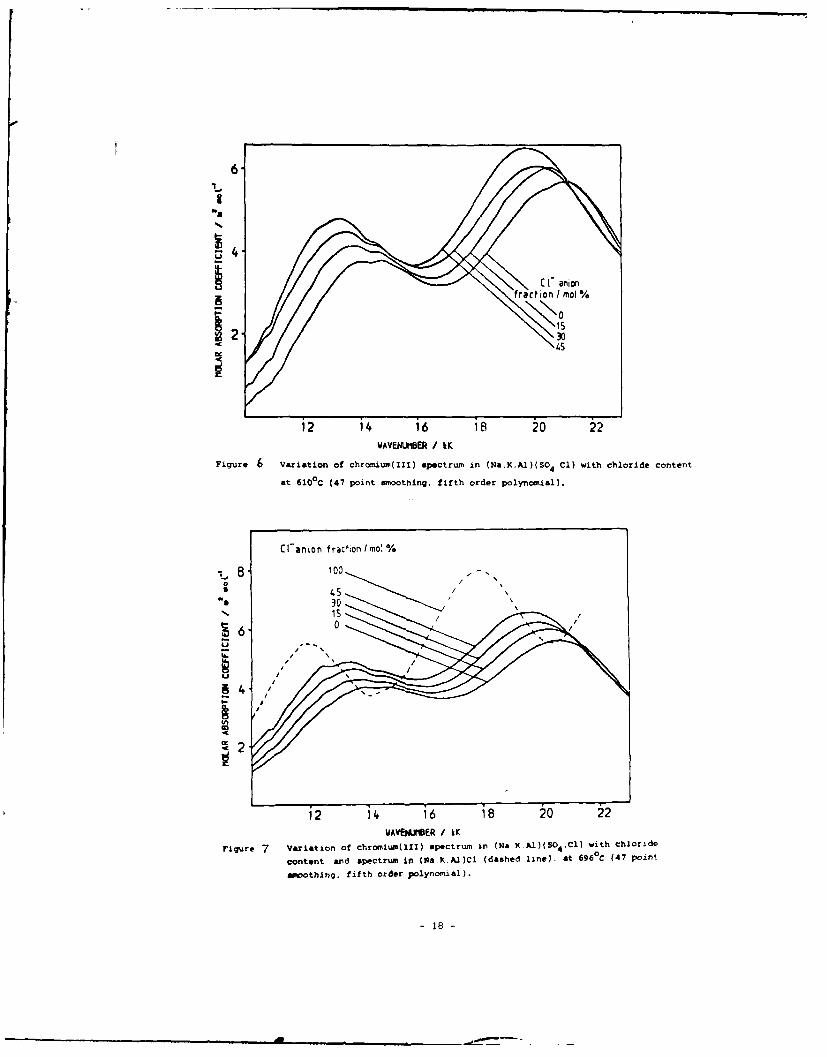
Up to ten bands (designated G-P) were obtained, and the
variation of their energies with chloride content is shown in Fig. 9.
Components G-I occur in the main band of the spectrum, while the
smaller band comprises N-P. The remaining components, J-M, are in
the region between these two bands. For the spectrum in the
(Na, K, Al)Cl melt, the bands are as follows (in cm- ) : G, 18,400;
H, 17,600; I, 16,700; J, nrt observed; K, 16,000; L, 15,200; M,
14,400; N, 13,600; o, 12,800; and P, 11,700.
b. Discussion
The chromium(lII) ion is highly stabilised on octahedral
coordination, and [Cr(SO4 ) ] species are therefore present in the
(Na, K, Al)SO 4 melt. The two main bands in the spectra may therefore
be assianed to the transitions A _ 4T (F) and 4A 4 T (F). A2 2g 24 19 4
third band, at higher energy, due to the transition A 2 T Ig(P) ,
is in this case masked by the charge transfer absorption edge. The
ten resolved component bands may now be assigned.
Bands G-I are the three components of the triplet transition
4A 2 4T Ig (F) , and N-P the corresponding bands for the 4A2 4T, (F)
transition. The remaining four bands, J-M, may be assigned to four
of the possible five components of the spin-forbidden transitions4A2 2TI(G) and 2E(G). These bands are therefore seldom detected
on normally recorded spectra of octahedral Cr(LII) complexes.
E,?

2 A
8 io i2 (4 ; id / 22 24 26 20
UAVEJER / KFigure 8 Spectrum of chroium(11) in (Na,K,Al)(SO4. C), containing 20 ool anion
chloride at 640°C. A, second derivative: B. fourth derivative.
20 -
m~m m ~ mm m mmm mM m m
mm mmmm mmm m mm mm . •mlfil
610*C r64 OC
AA
10 20 3 40 0 1 0010020chloride anion fraction I mo%
0 r10 20 30 0 0 10 20 30 4
chlre nion fraction I moi %
rigr e 9 Voxietton in energies of resolved ba~nda of the chromiurm(Zll) slpectru~m In (No.K,Al)(04.Cl) with chloride content. Ot 610. 640, 670 end 6990C.
- 21 -

The marked absence of profile change with added chloride,
and the lack of shift of the resolved bands, indicates clearly
that only complexes of octahedral symmetry are to be found in] 3-these melts; the complex [Cr(SO 4 ) 3 is progressively changed
3-43to [CrCl 6]
3
The slow decomposition of these melts above 700c suggeststhat the mechanism of Cr 2 3 formation on the surface of chromium-
containing alloys undergoing hot corrosion may well occur via the
formation of an octahedral chromium(IIl) complex in the molten
sulphate. Further work is needed in this area.
3.4. Iron(III) in Sulphate Melts with Added Chloride.
The spectrum of iron(Ill) in (Na, K, Al)SO4 melt is doninated
by a strong ligand-to-melt charge transfer edge, which completely
swamps the weak, spin-forbidden d-d transitions. The effect of
chloride addition is to shift this edge progressively to lower
energy (Fig.10).
An analysis of these spectra, including higher
analyses, has been published as a preliminary communication (8)
It was concluded that only tetrahedrs! sulphate complexes, probably5-[Fe(SO 4) , were present in the pure sulphate melt, and the
addition of chloride caused the progressive replacement of sulphate
ligands to form, ultimately, tetrahedral [FeC14]
3.5. Isosbestic Points
An isosbestic point (and occasionally more than one) can
sometimes be observed in a set of spectra where one parameter of
the system is progressively varied: Fig.11 shows a stylised
example. The presence of an isosbestic point is good evidence for
the presence of two species in equilibrium in the system, their
relative concentrations varying as the parameter is varied

i /
/
CI" anion fraction I mol% /
v40 100
* 4030200
is8
;:20
0
10 2
WAVENUEBER / LKFigure 10 Variation of iron(IZI) spectrum in (Na.K.AI)(So 4Cl) with chloride content.
and spectrum in (Na,K,AI)CI (dashed line), at 699°C (47 point mmoothino.
fifth order polynomial).
2E
.r E3
EE
wavelength
Figure I Stylised internally linear spectra of a two-species equilibrium.
A ;- B. The spectra of A and B are plotted together with three
spectra of the equilibrium mixture, non.inally recoded at three
different values of the external parameter.
- 23 -

(exceptions to this are specialised and rare). Fig. I shows the
spectrum of nickel(1I) in the (Na,K,AI)SO4 eutectic melt as
chloride is added, and added such that only the sulphate/chloride
mole ratio is progressively varied, the cation ratios being main-
tained constant. Expressed in terms of mole per cent chloride
added, it can be seen that isosbestic points appear over a
limited chloride concentration range. By taking two spectra
within this range as reference spectra it is possible (10) to
generate the profile of any other spectrum recorded in this
range (Fig.12). The procedure (10) may be extended to generate
the spectra of the two individual species (Fig. 13) which,
combined in varying ratios, produce the observed spectra. One
of the individual species is identified as the octahedral nickel(I)
complex ion NiCl2 (SO4 )x, where x is probably 2 (i.e. the
complex has two bidentate sulphate ligands), but it could be 3
or 4, the complex having two or four monodentate sulphate ligands.
The other species is the tetrahedral nickel species NiC (SO 4
It is thus possible to identify, and quantify, the
individual species (corrosion products) within complex molten
salt mixtures (simulating deposits).
4. HOT CORROSION OF SUPERALLOYS
There are severalsuperalloys in use in gas turbine engines, including
IN 736, IN 71b, IN 100, Hastalloy X, Rcnt 80 and Rent 95.
Samples of all of these were obtained, the IN 730 from Dr. S.R.J.
Saunders, National Physical Laboratory, London, and the rest from
the Materials Section, Wright-Patterson AFB, Dayton, Ohio.
Unfortunately the American samples did not arrive unv-il the
practical side of the contract was almost completed. Further,
our Mechanical Workshops were unable to section them into the
required dimensions. We were recently informed by Dr. M. Khobaib
(Wright-Patterson AFB), when on a visit to England, that he had

E"E E,-S. E3
z E
033-
o2
-0.08" ,
B 10 12 14 16 18 20 22 24
WAVENUJME / kK
Figure 12 Internal linearity function. A for [3(25 chloride), relative to
(309(chloride) and 2(20 chloride). at 628°C.
- 25 -

7.0 E
7 5.0 El
4.0i
3.0/
S2.0-
9 11 3 15 17 19 21 23
VAVEI&JIBER / kl
Figure 1 Terminal spectra, EA and fB generated from E1 (35% chloride) and E2(25% chloride) at 587
0C, with PA - 2.98. and 0. . -2.70.
- 26 -

periodic access at WPAFB to the specialised equipment required,
and we have just received sections of suitable size of RENE 80.
So far, we have therefore had time to investigate only IN 738
samples, and we used both crucible tests and spectroscopic studies.
4.1. Crucible tests
A range of crucible tests were made on the superalloy IN 73b.
Specimens were cut from rods designed and notched for use
in the carousel holder used in gas burner rig studies (at the
National Physical Laboratory). Half the specimens were polished
with Linde alumina of various meshes on a Selvet cloth, and the
rest were oxidised by heating in air for 24h at around 6201C. The
melts chosen were pure sulphate, and sulphate with 20 mole per
cent chloride. The cations present were lithium, sodium and
potassium, and maintained at a ratio of 78 : 13.5 : 8.5,
respectively. Aluminium -containing melts were not utilised
since these experiments were long-term, and the volatile Al 2C 6
would be lost from the chloride-containing system. The tests were
further sub-divided into those conducted in air, with the remainder
under a synthetic comtustion gas mixture containing SO2 and SO3.
Samples of the melts were taken at periodic intervals for
elemental analysis, and the maximum run was 262 h. Table I
summarises the various conditions employed. The tests Were
therefore continued for several days. In the early stages no
detectable coloration occurred. Later, in several cases, a grey
light cream coloured opaqueness appeared, but it was difficult to
conclude whether this was due to metal ions entering the melt, or
to precipitate oxides, or the effect of reflected light. After
about a week distinct colours could be seen in some crucibles,
ranging from blue to green, and some underlying greyness: a few
samples appeared pale yellow over the grey.
Quantitative determinations were made on melt samples for
the major component elements, namely, Ni, Co and Cr, and also for
- 27 -

Table I. Results of crucible tests of samples of IN 738 in m lten
(Li, Na, K)SO4 eutectic at 620*C.
4
?la hrs 18 84 180 B hrs 24 42 108 204
Oxidisedb Fe 0.25 0.1 0.15 unpolished Fe 0.25 0.2 0.1 0.7cq
'sulphate Ni N T/N 0.1 sulphate Ni N N 0.2 5.9
C hrs 24 42 108 204
polished Fe 0.2 0.2 0.1 0.2
sulphate Ni N N 0.1 1-4
Pretreatment Melt hrs Ni Co Cr
D unpolished sulphate + 20% chloride 238 1.55 0.25 N
E polished sulphate + 20% chloride 238 8.50 0.08 0.65
F oxidised sulphate 192 0.4C 0.C2 N
G unpolished sulphate 238 1.10 0.10 0.05
H polished sulphate 236 0.20 O..2 N
J oxidised sulphate + 2Gi chloride 192 0.7 0.10 0.45
K unpolished sulphate 2C2 1.5; 0.1 C N
L polished sulphate 262 0.05 0.05 0.08
M oxidised sulphate 262 3.05 0.05 N
a, Specimen identifier
b, Nature of pre-treatment of specimen
c, Eutectic sulphate mtlt, containing Li, Na, K at 70:13.5:.5 mcle per cent
- 2 -

iron, which is present in IN 738 to < 0.5%. The melt samples, upon
solidification, were not completely soluble in distilled water; a
residue remained, and tests were therefore made on both parts.
Surprsingly no metal ions could be detected in the water soluble
portions. From the residues, after dissolution in acid, iron was
detected in the early stages (ca. 24 h) but did not subsequently
increase in concentration. Nickel was detectable after about 100 h,
and steadily increased in concentration, becoming the most abundant
species as expected. Cobalt was the next most abundant, followed by
chromium. Towards the end of the run their average detected
quantities, relative to chromium as unity, were : Co, 1.14 and Ni, 29.3.
It was clear from the results that the melts containing 20%
chloride attacked the samples approximately twice as fast as the
pure sulphate melts, but more data is needed to determine whether
there is a significant differere in the extent of attack on polished,
unpolished or oxidised samples.
Some melt samples were closely inspected under a microscope as
water was added. The purpose was to ascertain whether the greyish
coloration seen in the melt was due to metal ions entering the melt,
or small metal particles.
A dry fragment of the melt, around I mm diameter, was generally
observed as a mixture of forms and colours. These ranged from white
wisps on the surface and white crystalline blocks through to grey-
purple and dark grey-purle patches containing black dots and lines.
Upon addition of water the fragment dissclved an] collap sed like a
sand castle, producing bubbles and breaking into granules of around
20 pm diameter. The granules had a distinct sard colour, and the
black particles had the look of metal inclusions from 50 Lim down to
less than 1 = in diameter. However, upon the addition of more
fresh water some of these darker fragments dissolved.
- 2) -
M l l m nm lm m m m m

The tentative conclusions we can therefore reach at this
time are that 260 h are insufficient for metal ions to enter the
melt in sufficient concentrations to enable standard analytical
techniques to detect the, in the small melt samples removed,
though they were later seen in our spectroscopic studies.
Reactions may have taken place on the surface, and then particles
flaked off and entered the melt. These particles cannot be flakes
of the superalloy itself since the elemental ratios are different,
viz., relative to chromium as unity the ratios are, for alloy and
particle respectively, 3.86 and 29.3 for nickel and 0.52 and 1.14
for cobalt. There are therefore a considerable number of crucible
related experiments and analyses required for a more complete
understanding.
4.2 Spectroscopic Studies
Spectra were recorded of a (Li, Na, K)SO4 melt containint' c
coupon of IN 738 over a period of thirteen days. An isothermal
furnace was used, and the sulphate melt maintained at 700 ± 201C
and synthetic combustion gas containing So2 passed over the melt
for the duration of the run. The sulphate powder, after melting,
was held at temperature for about ten hours, during which time its
spectrum against air was regularly recorded, to ascertain that no
changes or decomposition were occurring. The specimer was then
added and spectra recorded at reg'ilar intervals. At 117 h it was
noted that no changes had been observed for some time and so
pellets of (Li, Na, K)CI were added to the melt to bring the
chloride concentration up to 20 mole percent. Spectra were then
taken almost continually and the run stopped after 303 h. After
about 207 h some difficulties were encountered with the apparatus
due to, it is believed, SO in the combustion gas beginning to3
attack the plastic tubing and silicon rubber bung. Small dark
particles were seen entering the melt, and causing a rising
absorption throughout the spectral region. Though this was at this
time essentially eliminated by baseline correction future long tern.
experiments will be redesigned.
_3C0 _

a. Spectroscopic Results.
Upon introduction of the metal specimen into the sulphate
melt a slow rise in absorbance commenced, about 0.1 absorbance units
in 16 h. (The specimens were first polished and then oxidised in air
at 620'C for at least 24 h.) The absorbance decreased sharply for
four hours, and then steadily for twenty hours, after which it
remained essentially constant for fifty hours, but with a slight
overall rise. On adding chloride (20 per cent) after 117 h a slow
rise was seen for 18 h, after which it steadied off. Figure 14
shows some of the spectra obtained over this time span, and Figure
15 the combined results for several specimens at a fixed wavelength,
as described above.
b. Computer Treatment of Spectra.
In an attempt to identify the ions entering solution derivative
slectra were calculated: some exami]es, alsc showing computer plotted
spectra, are given in Figures 16-19. Be.ause the concentratio, of
the ionic species in solution is here small the spectra had to be
mathematically smoothed, to reduce noise contributions, but upon
differentiation small narrow peaks appear more intense. We have
catalogued the position of all the peaks that could be reliably
identified, but upon comparison with peak maxima for nickel, chromium,
cobalt and iron species were unable to identify unambiguously the
presence of sulphato complexes of these elements. Complexes of the
lesser components of IN 738 (Ti, 3.4; W, 2.55; Ta, 1.75; M,,1.70
and Nb, 0.9%) may also have been contributing to the observeJ spectra,
but we have not yet a sufficient spectroscoFic data base to identify
their presence, though work in this area has commenced in our
laboratory.
- ii -

2.0
1.6
1. 4
1.2
(2)
0.8
0. 6
(3)0.4
10 15 20 25 30 35 40 4S
Wavenu-Ibv r/ 101 c1- I
Fi pure 14. Exaup It s of ahsorpt i on spet ra recorded of corrosion products
formed in solution aft( r v.,rrcu. it-c rsi~m i (.' 1 a sarpil of 1% 738 in
multen (LiNa,K)SO., tuttctit at L<C.
(1), after 24 hours; (2), after 43 hours; (3), after 117 hours; and (4),
after 191 hours. Note that after spectrum (3) 'as r.corded (li,Na,1,)C1
was added to J'iV' a chlorid con~c-ntration of 20( mole per cent and th;us
spectrum (4) reveals chloride attack, b\ the appearance of dissolved
corrosion products (probably chloro-sulphiato transition metal cor.plex ionsO
-1in thc 7,OO0-25,000 cm wavenumber region.
- 3d -

0.9 .
I.I
0.7 I
hlo ide ddedl0..1 I I
0 4 . I
, II i .
.1 I
0 40 8t' 120 1bO 189
Tine/hr
Figure 15. Variation in absorbance, at 500 nm, with tiMe of corrosion
products formed in a melt of (Li,Na,K)SO4 eutectic at 700'C abovt a
sample of IN 738. Arrow indicates tiv. at which (Li,Na,K)Cl was aGGed
to give a chloride concentration of 20 mole per ceat. Note that after
the first few hours of initial reaction some corrosion products precipitate
out and a plateau, probably a passive state is reached. Addition of
chloride inrediately causes attack of the passivated surface. Attack was
more rapid if the IN 738 was placed initially in a chloride-containinp mtlt.
-33-

2.0
I.e
1.6
1.4
1.2
1.0(A)
0.8
, 0.6
.0P 0 15 20 25 5 35 00. 02
0.01(). 00C
-0.01 V .V-0.02 20 25 35 35 4 4-0. 03. 3, (B)0
0. 3 is 2o 25 50 3j! ,
0.0 -f-
_o. .(C)
Wavenumber/0 cm-
Figure 16. (A), Absorption spectrum of the corrosion products in a
(Li,Na,K)SO 4 eutectic melt above a specimen of IN 7T8 after 116 hours
irmmersion at 700'c.
Possible band maxima are identified by their computed second derivative
minima (B), which correspond well, as expected, with their computed fourth
derivative maxima (C).
-34 -

2.0
1. 6
1.
1,2
(A)1.0
Ur 0.8
00. 6
0.4 __ _ _ _ __ _ _ _ __ _ _ _ __ _ _ _ _
0. 010.o 0 S. 10 15 20 25 30 3SJ 's
0.0,-0.0") fin 4 0
-0.01
15 2D 25 T-
L (C)
lWavenurmber/ 10 3ca; 1
Figure 17. (A), Absorption spectrum at 700'C of the corrosion products
from a specimen of IN 738 after 117 hrs in molten (Li,Na,K)SO 4follow.ed
by 50 hrs after melt composition changed to SO 4:C2 of 80 :20 mole per
cent. (B) Second derivative and (C) fourth derivative spectra. Note
increased band resolution in fourth derivative.
- 3r,~
o. 030 j
o. 035
0. 020
(A)
0. D15
U 0.010
,.,o G.005
.0D
C. 010G. 01 10 12 I. 16 1 12C 22 2L. 2t 2PC. 0100. OuO-P
-0. 005
-0. 05
0. 20
0. i0 00. 05
-C.0
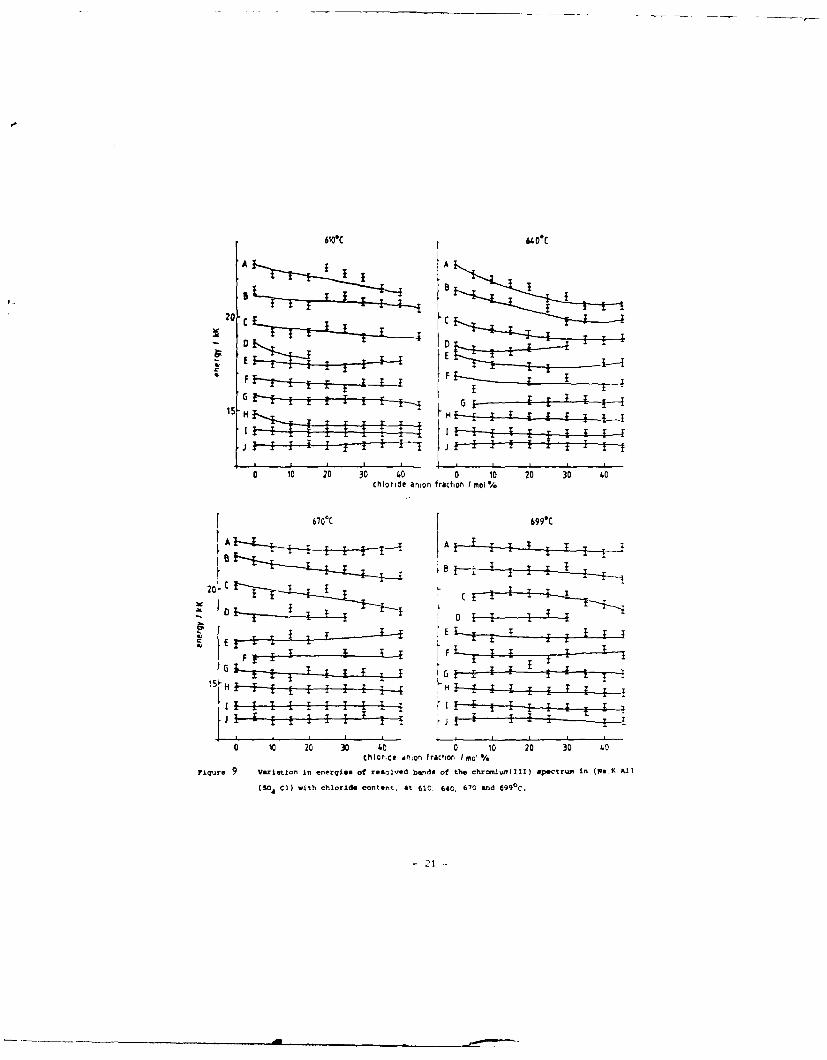
Wavenumber,'10 cn-1
Figure 18. (A), Plot of difference spectrum between spectra (3) and (4)
in Figure 14 showing net effect of chloride addition. (B) and (C) second
and fourth derivatives, rcspectively. The parameters used in the
mathematical computations were chosen so as to reveal the broad overall
features of the constituent bands, viz., a 25 point convolute with a quadratic
-1
and quartic polvnomial, respectively, with a sanmpling' interval of 60 cm
- 36 -

0. 040
0. 03$
0.033
0. 025 4
0. 020
CU 0.015r
0.010 (A)0
< 0. 0051
0 000
G. 01 1 12 1' 16 1 20 2 24 26 260. 010
0. DC'A0. 0055 ]-0. Oo V
10 I i.-0. c (s B)
-0. 02010 612 1 61 20 24 26! 26 3
Wavenumber/10 cn.
Figure 19. (A), Plot of difference spectrucm between spectra (3) and (4) in
Figure 14, but the second (B) and fourth (C) derivative spectra have been
calculated so as to reveal tht finer features of th1 constituent bands, and
thus enhance identification. Samplin! interval now 40 cm-
-------

c. Present Conclusions
The preliminary results show that during the first twenty
hours of exposure of IN 738 samples to molten sulphate, transition
metal ions enter the melt. Some of these then commence precipitation
out of the melt as a result of reacting with (most probably) the
oxide ions generated in the melt. The precipitate settles out in
the melt, by gravity, adjacent to the sample. In addition,cr
alternatively, some of it may bond to the sample surface in the form
of a scale, or a scale may form subsequently, or even independently,
or after the surface of the sample is depleted of certain elements
and a particular composition (range) is reached. Further experiments
can resolve this.
The effect of introducing chloride at this stage is to increase
slowly the concentration of transition metal ions in the melt,
thereby indicating that the precipitate and/or the oxide layer
formed on the surface is attacked by chloride: this is of course
consistent with the general expectation of increased corrosion rates
in the presence of chloride. The identities and concentrations of
the ions formed in solution have not yet beer, determined, but this
should be possible upon a combindtion of further cruc i "," , :-,
longer spectroscopic runs, computer treatment of spectra, and
variation of the melt composition. Metallurgical tests or- ccpa.s
with adherent melt, e.g. electron microprobe analysis (EMPjA would
help confirm the results of such tests, and also identify the
composition of adherent oxide or scale, and that of a possible
layer in the melt (deposit) adjacent to the scale. One of the
most sionificant findings in our studies on pure nickel, (3), (arid
indicated in incomplete work on iron and chromium samples (1)) has
been the existence of a layer (0.2 m. approx. thick) in the melt,
(16). T.R. Griffiths, K. King and S.H. Marchant, unpublished results.
- 38 -

but adjacent to the scale, and that the rate determining stel, for,
certainly nickel dissolution, is the transport of (nickel) ions
through this layer. The presence of this layer in superalloy hot
corrosion studies is therefore expected, and so far indicated by
our results, and a major future task is to identify and measure it,
and determine its role in the (slow) attack of molten sulphates
(and chlorides) on superalloys. Its role, after several hundred
hours exposure of superalloys to melts, to accelerated hot corrosion
can also be studied.
5. RECOMMENDATIONS FOR FUTURE WORK
Our original Research Proposal outlined our aims and gave a
statement of work for a three year period. We consider that the
work described above, and in the Appendices, constitutes approximately
the first third of the total work envisaged: it was initially stated
that 'The first 12 months will be spent attuning the EASE technique
to gas turbine corrosion, providing preliminary results, and
establishing required fundamental information' . Our work on hot
corrosion on superheater and reheater tubes in coal fired plant
continues to be supported by the SERC and the CEGB, NE Region, (we
have a research student for the next three years and some technical
assistance). Thus continuation of this project will still have
the benefit and resources of on-going research on the EASE
technique and hot corrosion, and with much the same aims.
The recent workshop-conference on The Interaction of Molten
Salts and Metals : Current Understanding of Hot Corrosion and New
Approaches to Practical Problems (17) organised and edited by the
Principal Investigator, is the latest and most complete survey and
forward looking account of hot corrosion. It spans both the
American and European views on the nature of molten salt attack
and brought together for the first time molten salt chemists and
specialists in hot corrosion, but trained in metallurgy and materials
(17) Proceedings of the Molten Salts Discussion Group Workshop-Conference
on 'The Interaction of Molten Salts and Metals : Current Understanding
of Hot corrosion and New Approaches to Practical Problems', 2-4 July
1986, University of York, sponsored by the Office of Naval Research
US Navy, London Branch Office, edited by T.R. Griffiths, Hon. Secretary,
Molten Salts Discussion Group.
_ 39 _

science. This occasion enabled the latter to describe the problems
encountered, and their materials solution, and the former to reflect
thereon and offer information and approaches based on their
understanding of molten salt chena.stry and the kehaviour of rclten
salt systems which, for example, contained species which could also
be hot corrosion breakdown products. Thus it Is particularly
timely that the impetus started, and the international contacts
gained, by this workshop-conference should be continued at the
earliest possible opportunity. Also, it was stated in the original
Research Proposal that a second spectrophotometer would be sought,
and this has now been acquired, and will shortly be interfaced with
a microprocessor and data capture and processing equipment.
The second twelve months of the Research Proposal were to
be 'spent on fundamental and practical studies and on identifying
corrosion mechanisms,' and this would be followed. It is recognised
that, after the initial attack on superalloys, (which we have made
preliminary investigations upon here with the EASE technique),
subsequent (catastropic) attack occurs after long term exposure,
often not before 2000 hr (around 80 days). We have therefore plans
and prepared furnaces for such studies : samples of melt would be
taken at regular intervals and examined spectroscopically and
analytically for the appearance of corrosion products in the melts,
at which time detailed EASE investigations would commnence. Parallel
metallurgical investigations would be made, utilising equipment
available to us at Leeds, (and at times employing the specialised
apparatus in the laboratories of the CEGB, NE Region in nearby
Harrogate). Such combined studies on initial hot corrosion attack
and the later catastropic (or accelerated) corrosion will yield
new information on the mechanism of the latter, at present not
understood. Further, it may indicate the possible role of init.a
attack on the timing and nature of later -.ctack, and hence lead
to recommendations for delaying the latter.
-40 -

Additional fundamental studies are necessary, for monitoring
and determining the mechanisms of the initial attack, since so far
we have concentrated upon codifying the behaviour and spectra of
nickel, chromium and iron in molten salts : some studies on cobalt
are required, and no spectral studies have been reported for the
superalloy component elements, niobium, tantalum, molybdenum and
tungsten in sulphate melts. Since, for example, niobium metal
dissolves rapidly and dramatically in molten sulphates (18) it is
vital to identify the nature, and stability, of the chemical
species so formed in solution : our present studies on initial
attack on IN 738 have indicated weak bands in the spectra which
cannot as yet be fully identified, and it is possible that they
arise from species involving niobium and similar elements.
There are therefore many fruitful topics for study using spectral
and crucible measurements, and the EASE technique, all of which focus
on the hot corrosion products formed in the corrodant, a powerful
approach which yields mechanistic data ard parallels and contributes
to metallurgical and electrochemical investigations. It is our
experience that those trained in the-x last two techniques ar, noA
well versed in modern solution chemistry and theory, or the
interpretation of spectra : they are therefore (understandably)
reluctant to commit themselves and accept our claimes and findings.
The links must first be obvious. Our expanding contacts with this
community are clearly leading us to utilise a synthesis of techniqles,
incorporating in particular electrochemistry, where simultaneous
spectroscopic and electrochemical measurements can be made. We
t.herefore, with further funding, would undertake a symb.iotic
approach, spectroelectrochemistry of metals in melts, which without
doubt is needed, and will considerably clarify and enhance our
current understanding of the hot corrosion of turbine alloys.
(18). Private communication from Dr. J.E. Striniger, Electric Power
Research Institute, Palo Alto, California, USA.
_ 41 _

Appendix A
Thermal Gradient Furnaces.
A.I. Introduction
We have already indicated that the EASE technique employs
spectroscopic measurements at various positions within a vertical
thermal gradient. Our publications on the technique (2,3) have
only included a cursory description of one of the furnaces we have
used and we therefore here give a more complete account.
The design of the furnace is first described, then the
choice of optical system necessary to examine a thin horizontal
section of the silica cell containing the molten salt is discussed,
and finally, the effects of the optical modifications on the
spectrophotometer performance are examined.
A.2. Furnace design
The principal feature of the various furnaces used is that
a pair of masks containing narrow, horizontal apertures remain
fixed in the light beam while the furnace is moved vertically, to
bring different sections of the melt into the light path created
by the aperture of the masks. (Fig. Al).
The vertical cell housing and horizontal light ports of the
first furnace built (V, Fig. A2) were made of aluminous porcelain
tubing (id 4.5 cm, od 5.5 cm); the inner ends of the light port
tubes were cut to fit the curved surface of the vertical tube. The-l
Kanthal (12.6 2 m ) heating element (C) was a uniform coil around
the outside of the vertical tube, with a spacing of 3 mm and a
total resistance of 100 2, and regulati"3by an Ether temperature
controller. The windings terminated just above the light port-1
tubes, giving a thermal gradient of around 30*C cm in the cell
space. The high temperature of the winding nec-ssary to establish
- 42 -

01,5 h0109t
Lee Q ' I 'y'el-Ad~aa, - 7 \ e
CCerex. l
XL
Fi~~re .I. Sc~ . ev 9utin X ft F'E t~i u-

ix
Key to Figure
A; cell support collar U
B7 firebrick
C; heating coil
D; copper cooling tube
E: silica windows
F; cell location platform - --- S"
G: furnace support column
H; thermocouple
I: furnace support platform
J7 1 mm pitch screw thread
K: brass plate
L* table leg clamp
M: locating lug
N: graduated wheel
0 : p c s~ t lc r, s c a le 0 - -
P; locking screw
0: ceramic rod
R-, inner mark
S-S'* optical axis
T; outer mask
U: brass jacket
V; cerw-ic tube L
W; control thermocouple
X: modified cell Figure A 2 Thermal gradient furnace (legend on facing
page)
- 44 -

sufficiently high temperaturesin the cell space reduced the life
of the heating element considerably. Frequent rewinding was
necessary, and also time-consuming recalibration procedures. It
was later found that the element life could be extended to more
normal expectations by cementing the windings in place with ultra-
pure cement.
The furnace assembly rests in the spectrophotometer cell
compartment in a brass plate (K); the furnace is held in position
by three locating lugs (M), while the table is held rigidly,
and reproducibly, in the leg clamps (L).
The inner mask (R) is an interchangeable inconel screer.,
containing an aperture 8 mm wide, and mounted on a ceramic rod,
which is fixed to the furnace table by a locking screw (P).
Screens containing apertures of various heights were investigated.
A second mask (T) , having an aperture 8 mm wide and of variable
height, was mounted at the light exit port.
The thermocouple (H), by Thermocoax, Philips, was used to
measure the temperature of the horizontal section of melt being
examined, and was also fixed to the table, with its tip in contact
with the side of the silica cell, and in line with the apertures
of the two masks. All three were adjusted to be in the vertical
centre of the light beam. This thermocouple was calibrated using
a second, identical thermocouple contained in a tight-fitting silica
sheath, and immersed in a melt contained in a silica cell.
Different horizontal sections of the melt we.e brought into
the aperture upon raising or lowering the furnace, using the
graduated furnace position wheel (N) . This controls the height
of the platform (I) supporting the furnace via the 1mm pitch screw
thread. The furnace position, and hence the sample position, was
thus known to ± 0.005 mm and could be altered by very small increments.
-45

A.3. Variable thermal gradients
The above furnace design, with a single heating element above
the molten salt, gave essentially a constant temperature difference
between the bottom of the silica cell, where the metal coupon was
located, and the melt-gas interface near the top of the cell. In
practice, this difference was around 100'C, and the synthetic
combustion gas flowing over the melt passed through a zone of 800-
900*C before reaching the melt-gas interface, which varied from
about 680-7301C. It was considered important that the temperature
gradient was capable of being varied independently of the melt-gas
interface temperature.
A similar furnace was designed but with an independently
contyolled heating element below the silica cell. This furnace
was not constructed in the Department's workshops, but to our
design by Severn Science Ltd., Bristol. The upper heating wire
was platinum and the lower was Kanthal. The furnace worked well,
but the second heating element meant that the thermal gradient
across the silica cell was no longer essentially linear. This
also meant that the furnace calibration was a slow, time-consuming
process.
The second variable thermal gradient furnace was later built
in our workshops, with both sets of windings of Kanthal: the
platinum upper winding of fe Severn Science furnace was chosen
partly so that much higher synthetic combustion gas and melt-gas
interface temperatures could be investigated: unfortunately time
did not permit this possible aspect of this project to be
investigated beyond a few preliminary experiments.

Appendix B
Optical System
B.I. Spectrophotometer optical arrangement
The specialist optical system of the Cary 14H spectrophotometer
is shown schematically in Fig. B1. This spectrophotometer was
specifically designed so that accurate spectra can be obtained of
samples that may be glowing white hot. Its essential feature is
that its optics are reversed, so that the light beam is chopped
before passing through the cell compartment and monochromator. By
amplifying the AC (chopped) component of the AC and DC signal
from the detectors (G, A), the spectrophotometer is able to
eliminate photometric errors due to both stray light, and black
body radiation from a hot sample (19), the latter producing the
(continuous) DC detector signal.
The foci are also unusual in this instrument. Radiation
from the light source (BB or CC) passes through the condensing
lens (AA) to the beam splitter (Z). The focussing mirrors (DD,DD')
for- the image of the horizontal aperture at the chopper X). The
image of the vertical aperture is focussed at the screens (Y, and Y').
The focassing elements (W and W') give images of the vertical slit
at (U) and (U'), while the image of the vertical aperture is
formed at (T) and (T'); the image of the horizontal aperture is at
infinity. The distance S-U, S'-U' is 20 cm, and this section is
shown in detail in Fig. B2.
After passing through the cell space, the beams are recombined
(Q) and directed through the slit (P) to the doublf monochromator
comprising the grating (N) and a prism (a) in series. The light
is finally brought to the appropriate detector (A or G).
(19). D.M. Gruen, Quart. Rev. Chem. Soc., 1965, 19, 349.
_47 _

INey to, Figure
6B.CC" light sources
AA: condensing lens
Z; beam splitter
DDD focussing mirrors
YY : acreers
X: chopper
W.W': focussing elements
EE EE': mirrors
U,U'* image of vertical slit
T.T': horizontal alit image
S.S': image of vertical apeiture
Q: bear, combiner
P': cylindrical lens
P.L.H: monochromator alit system
O.M: grating colimator mirrors
N: grating
K,X prism colimator mirrors
J: prism
E: movable mirror
D.B: focussing lenses
C: flat mirror
F: fccus. a er-t
G: PnS d -tector
A- ph trt -b d tectc.z
A
C G
I'
7aq'urC Op3tcl a,,rqer~orrt Of the Cary 141 speCtloph~tormter
reproducpd by .-ourtCSy Of Varra, Ltd
... EE

BZjr opt .c5 ir ce.'l space. S vertical apertsrp imagP: horiZo""ta lit i's~
V vertical alit image (the hcr.zontal Apertore lVrage AP at infinlty).
-49-

In practice, however, the two light beams do not behave in
the cell compartment as expected, because the quartz-halogen lamp
employed is a non-point source. As a result, the light passing
through the sample is no longer parallel in the vertical plane.
This is because each of the many point sources of the tungsten
filament gives rise to a set of rays behaving ideally, but no
two sets of rays will be parallel and the resultant of their
combination is a slightly divergent beam passing through the sample.
This means that the positions of the interposed masks in this
particular application become critical. With a beam parallel in
the vertical plane, a mask inserted at any position along the light
path will sample the same section of the cell, having the
dimensions of the aperture in the mask. This is no longer the case
with non-parallel light, and it was therefore necessary to establish
the sampling characteristics of various mask configuratiors in order
to select the most suitable combination.
B.2. Selection of Optimum Mask System
A photographic step plate (Kodak Ltd., London) was chosen to
simulate a non-uniform concentration gradient. The tablet was a
piece of photographic negative, 22 mo x 33 omm, having horizcntal
steps, 3 m, wide, of increasingly greater absorbance. The rance
of absorbance was from 0.05 to 3.05, in eleven step of nominal
absorbance increment of 0.3.
The tablet was centrally mounted on the cell location
platform, so that raising the furnace would alter the observed
absorbance in a stepwise fashion. The ability of a chosen mask
system to cut out light from all but a thin horizontal section of
the tablet would then be evident from the degree of 'stepping' in
a lot of absorbance versus furnace position.
Nine possible mask configurations, designated (i) - (ix),
were examined (Table BI). For each combination the absorbance
AN - _ ___ _ _ _ _ _ _ _ _ _ _

Table B. Various mark combinations examined
Inner mask Outer mask
System Aperture heightmr. Aperture height 'mr.,
(i) 1 1(ii) 1 2
(iii) 1 3
(iv) 1 removed
(v) 2 2
(vi) 2 3
(vii) 2 removed
(viii) removed 1
(ix) removed 2
_A -1

was recorded at 0.5 mm vertical intervals from the clear section
of the tablet, below the first step, to the seventh step. Various
calibrated neutral density screens brought the absorbance readings
on scale. This was carried out, for each mask combination, at
three representative wavelenths, viz., 400, 800 and 1200 nm.
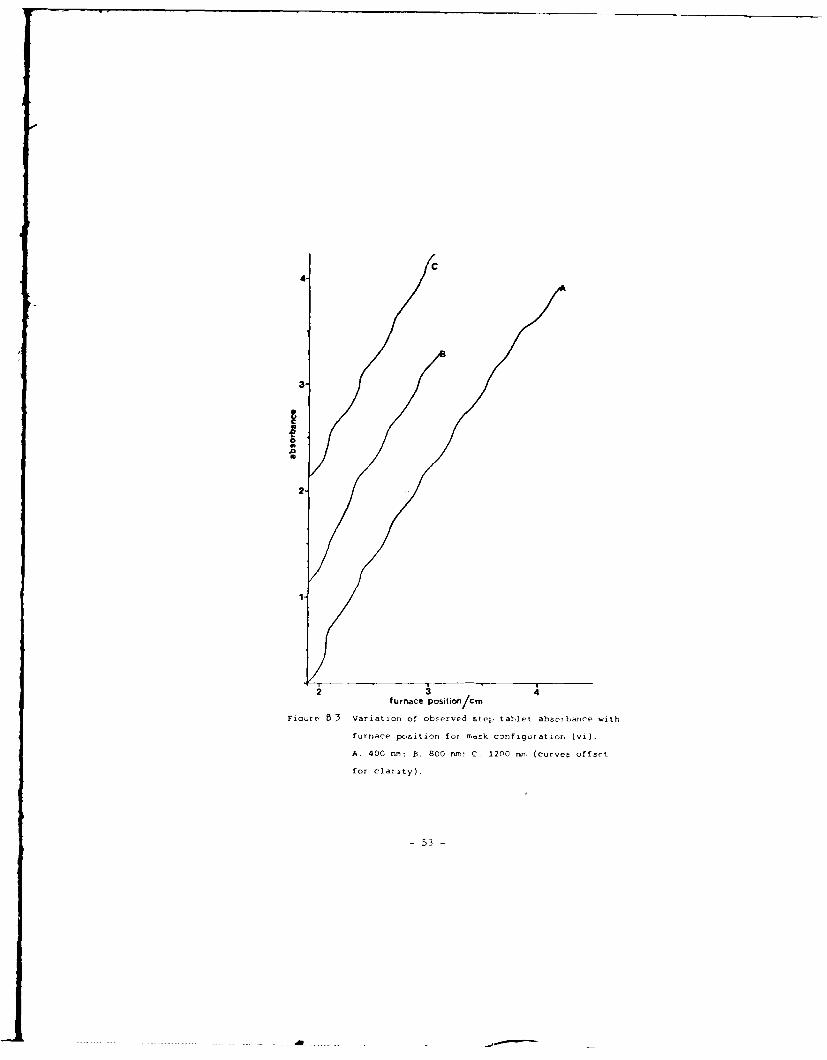
The results showed a clear division between combinations
i) - (iv) and (v) - (ix). The latter showed only slight undulations
in the plots of absorbance versus furnace position, indicating that
a relatively large section of the tablet is sampled with such
combinations. A representative plot, for system (vi) , is shown in
Fig. B3. Conversely, systems i) - (iv) gave plots with well-defined
steps, typified by that for system (iii) in Fig. B4.
Configurations v) - (ix) were clearly inadequate for saapling
narrow, horizontal sections in the cell space, and were therefore
discarded. To establish which of the configurations i) - (iv)
gave the narrowest sample section, the slopes of the nominally
horizontal parts of the steps were calculated, and are shown in
Table B2. The thinnest sample sections are indicated by the
smallest slopes. The results show that the effect of increasinn
the outer mask aperture height from i nm (system (i)) to 2 mr..
(system (ii)), while the inner aperture height remains at urn., is
quite small. Greater increases in slope are apparent on gcing fron.
2 to 3 mm outer aperture height, and when removing the outer mask
completely.
Clearly, the optimum system would have been that in which both
inner and outer masks had aperture heights of Imm (system W )i.
However, because of its high initial absorbance, this system would
be limited to samples with maximum absorbance arDund unity. For
this reason, and also because the change on going from system (i)
to system (ii) is small, it was decided to use system (ii), i.e.,
- 52 -
I
C4
3'
00
2-
furnace position/cm
Figre B 3 Variation of observed step tablet absczbance with
furnace position for rrask configuration (vi).
A, 400 nrm: S, 800 nr: C, 1200 nrn (curveS offset
for clarity).
- 53 -

4- C
3"
Ca
2.
1
furnace position/cm
Figjre B4 Variation of observed ste;, tal1e-t absorbanc( with
furnace position for mask configuration (iii).
A. 400 nru: B. 800 nr: C 1200 nm (curves offs-t
for clarity).
- 54 -

"'able b.2. GradieniLs of lines fitted t(, steps from absorbance
plots for systems (J) - (iv)
Wavelength Slope of line fitted to step (% 103
System /ran 2 3 4 5 6 .7
400 39.4 40.2 18.8 126.6 33.4 -
(i) 800 33.6 36.0 - - . -
1200 43.6 31.2 -
400 35.2 44.0 27.4 36.0 139.4 27.6
(ii) 800 36.4 35.6 26.4 40.4 - -
1200 37.2 35.4 32.8 29.2 - -
400 44.0 55.4 :38.2 60.0 44.4 51.8
(iii) 800 39.0 39.4 20.0 72.0 -
1200 44.4 32.4 ;37.6 58.6
400 59.8 62.8 58.0 69.& 51.2 49.4
(iv) 800 55.2 94.6 43.4 45.4 E5.6
1200 63.2 63.0 56.6 76.4 74.6

inner mask ape Lure D Diz, x I =In, and outer mask aperturp 8 m, x
2 mm, for this study. The next stage is to establish the dimensions
of the melt section which is sampled by this s'ste:, wh,.1 the
melt is contained in the 10 mm square modified optical cells
(Fig. B5).
8.3. Size of Section Examined
To determine the height of the tablet being examined at any
one time, the section of the absorbance curve at 400 nm, spanning
tablet steps 2 and 3, was remeasured at 0.1 mm vertical furnace
movement increments. From tis the position of the step boundary,
b, was accurately obtained, together with the actual absorbances.
A2, A3, of the two steps. These values were 25.8 cm, and 0.9C5
and 1.445, respectively. From these three parameters the expected
curves were calculated for various values of a variable, y, which
represents the actual height (above the base-plate) of the section
of tablet being examined. The method is as f lows (with reference
to Fig. B6).
F th- section cf curve under exacin-tior, there will be
three differtnt ex~ressions for the absorLance, A, depen~i- upon
the frt.ace position, p; the actual sample height, y; an3 the
position of the step boundary, b, viz.,
(a) if p < b - (y/2) , then A = A2 , where A. is the absorbance
of step 2;
(t) if p >1 b + (y/2), then A = A3 , where A 3 is the absorbance
Cf step 3; and
(c) if b - (y/2) < p < b + (y/2) , when the absurbance will Lc
a comcinat ion of proportions of A. and A.
To obtain an expression for A within conlition (c) consider
the absorbance at a position p' (Fig. BG) , which will be given by
C

SYNTHETICFLUEGASINLET
GASODUTLET
P,..ATI NI Z EDKAOWOOLCATALYST
SILICASOLID OPTICALSILICA CELLINSERT
Figure R5 A mdified optical cell and insert.
57 -

A, STEP3
I
I
,P.
furnace position
Figure b Calculation of theoretical curve
b t-'er steps 2 and 3. in terr.f of y
th, hcig).t of tatlet se tticr. exa .-r-d
58 -

A' - [(y/2)A 2 + (b-p')A 2 * (p'+(y/2)-b)A3]/y. Similarly, at p",
the absorbance is given by A' = [(y/2)A3+(p"-b)A3 + (b-(p"-(y/2))A2)]/y
These expressions are equivalent, and can be simplified by
replacing (y/2) by a and (b-p) by 8, to give one expression for
the absorbance for condition (c) , namely,
A = [(I+*/,')A 2 + (1-a/Ct)A 3]/2
This equation was used to calculate the lines shown in Fig. B7.
It can be seen that the best approximation to the observed curve
is obtained with y in the region 1.4 - 1.6 mm.
The variation of the sample height across a cell of path
length 10 mm was obtained from a scaled geometric drawing. If
the height at the centre is taken as 1.5 mm, the corresponding
maximum heights of the sample at the two optical faces of the cell
are 1.25 and 1.75 mm. Since, in this particular application, very
small increments in the change of furnace position were not
required, a maximum light section height of 2 mm was assumed.
Thus increments of 2 mm or more ensured that no overlap of
exarined sections of the specimen occurred.
-5'-j

e e ! o, P-
1.4 ,I'
yE vausIm
1.3 a /.0
I SI I I e
y values~era) ' '
A 0.8 ',,
1. 1.0.3c 1.2,' ,
D 1.6 ,
F 1.6 C
'I "
06
, 12,
1.0'
furaceposio/m
forvaios vae fy
1,C ,-, , ,

The Masurecer t of Ac ,;rate S ,ctra
The effect of masking all but a thin horizontal section of
the sample beam (and the consequent attenuation of the reference
beani on the manor features of spectrophotometer performance are
now discussed.
C.1. Resolutior,
The resolving power of the instrument is determined by the
spectral band width (SBW): the greater the spectral band width,
the poorer the resolving power. The spectral band width is giver.
by w)
SBW = (D x SW) + SCM + DL
where D is the reciprocal linear dispersion, SW the mechanical
slit width, SCM the slit curvature mismatch, and DL the diffraction
limit.
The contrlbution of both diffraction and slit curvature a.c
very scal, an-d may be regarded as neiligible for normal slit width
readinas (20) . Thus the mechanical slit width has the major
influence on resolution.
The slit servo-mechanism of the Cary 1411 spectrophotometer
operates to maintain constant energy at the detector. The use of
neutral density screens on the reference bean, will thus increase
the mechanical slit width, and hence the spectral band width. The
energy reaching the detector is proportional to th- square of the
mechanical slit width. Hence, if a neutral density screen of
(20). Cary Instruments (Applied Physics Corporation, now Variar
Instruments) , Report AR14-2 (September, 19e4).
-CA

transmission Ti is placed in the reference beam, the slit width
increases by a factor of (100/T) , to maintain a constant energy
flux at the detector. Using the above equation, it is possible to
calculate the various spectral band widths for different neutral
density screens. The results, derived from data given in ref. 2U
are presented in Table C.1. Screen combinations of the order of
6-8% T are typical in this application, and the resolving power
will thus be reduced by a factor of three. However, this is much
smaller than the variation in resolving power over the range
1400 - 400 nm when no neutral density screens are used.
C.2. Band Shape
The influence of the spectral band width on observed band
shapes depends on the natural band width (NBW) of the peak under
investigation. The optimum spectral band width is such that (20)
(SBW) i(NBW) < 0.1
and under these conditions the Observed and true heights differ
by less than 0.5%. The d - d bands recorded in this project have
natural band widths in the range 100 - 200 nm; thus a spectral
band width no greater than 10 nm will satisfy the above equation.
In the wavelength range of interest (1400 - 260 m) the spectral
band width is greatest at 800 nm, and for a neutral density screen
of 6% transmission has the value 3.29 nm (Table B3). Reducing the
transmission to 1% gives a spectral band width of 9.0 nra. Therefore
screen combinations having a resultant transmission of greater than
1% (i.e., an absorbance of 2.0) may be used without increasing the
spectral band width above the optimum value.
In practice, screens have an absorbance of 1.2 - 1.4 units
were used, and thus no distortion of peak height is expected.
-6 -

Table C.1. Values of the spectral band width (rim) for different
neutral density screens in the reference bear.,
Wavelength Percentage transmission of screen*
/nm 100 50 4) 26 8
400 0.085 0.103 0.112 0.127 0.199
600 0.089 0.104 0.113 0.128 0.188
800 1.010 1.388 1.532 1.674 3.293
1000 0.590 0.076 0.851 1.022 1.730
1200 0.712 0.928 1.015 1.213 2.035
1400 1.011 i.334 1.43 1.760 2.987
i.e. no screen

C.3. Signal-to-Noise Ratio
As previously stated, the Cary 14H spectrophotometer operates
with a constant reference signal at the detector. In the ultra-
violet and visible regions the detector employed is a photomultiplier.
With a photoelectric device such as this, the limiting signal-to-noise
(S/N) ratio is determined (21) by the 'shot noise', i.e. statistical
fluctuations in the signal arising from the nature of the processes
involved. The shot noise is proportional to the signal intensity,
and since this is kept constant, the absolute noise output of
the photomultiplier is fixed. The S/N ratio thus decreases in
proportion to the reduction in signal intensity from the sample beam.
In the infrared region the detector is a photoconductive (PbS)
device. In this case, noise is independent of light changes, and
again, S/N ratio will decrease directly with beam intensity.
In practice, the increase in pen noise has not been found to be
serious: it is taken into account when considering the photometric
error limits.
C.4. Stray light
Strictly, the term 'stray light' refers to stray radiant
energy (SPF) . This is light resultinq from imperfections in the
optics, and is outside the spectral band defined by the monochromator.
(The term is also often used to refer tc background room light or
black body radiation from a hot sample; the elimination of these
effects has already been described.)
In the absence of stray radiant energy, the absorbance is
given by A = 1og(1 /1), where I is the incident radiation, and0 0
(21) R.P. Bauman, 'Absorption Spectroscopy', John Wiley, New York, 1962.
- A, -

I the transmitted radiation. With stray light contributing
equally to sample and reference beams (as it must do in the Cary
14H spectrophotometer optical arrangement), the observed
absorbance is Aob s = logl(lo 0 SRE)/(I * SRE)]. The SRE is
measured as a proportion of the flux leaving the monochromator,
and 0.001% is a reasonable figure for the Cary 14H. The optical
modifications applied will reduce both I and I, and hence also0
the absolute amount of SRE. There will thus be no deviation in
the observed absorbance, and the spectra obtained in the project
are instrumentally reliable: errors which might arise due to
sample handling, etc., are discussed elsewhere in this report.
- £5

bREFERENCES
1. T.R. Griffiths and K. King, J. Chem. Soc., Faraday Trans. 1,
1981, 77, 2763.
2. T.R. Griffiths, K. King and D. Mortimer, High Temperature
Technology, 1982, 1, 43.
3. T.R. Griffiths, K. King and D. Mortimer, Power Ind. Res.,
1982, 2, 79.
4. K.E. Johnson, R. Palmer and T.S. Piper, Spectrochim. Acta,
1965, 21, 1697.
5. G. Harrington and B.R. Sundheim, Ann. N.Y. Acad. Sci., 1960,
79, 950.
6. D.M. Gruen and R.L. McBeth, Paper for the Seventh International
Conference on Coordination Chemistry, Stockholm (June 1962).
7. N.W. Silcox and H.M. Haendler, J. Phys. Chem., 1960, 64, 303.
6. T.R. Griffiths and K. King, Chem. Comm., 1981, 518.
9. 3. Brynestad, C.R. Boston and G.P. Smith, J. Chem. Phys.,
1967, 47, 3179.
10. T.R. Griffiths and P.J. Potts, Inorg. Chem., 1975, 14, 2039.
11. K.E. Johnson and T.S. Piper, Discuss. Faraday Soc., 19C1, 3-,
12. G.P. Smith, in 'Mclter. Salt Chei-istry' , Ed. M. Blander,
Wiley and Sons (1964)
13. T.R. Griffiths, K. King, H.V. St.A. Hubbard, M-J Schwin--Wcf!l
and J. Meullemeestre, Anal. Chim. Acta., 1982, 143, 163.
14. K.E. Johnson, Electrochim. Acta, 1966, 11, 129.
15. C.A. Angell and D.M. Gruen, J. Phys. Chem., 1966, 70, 1601.
16. T.R. Griffiths, K. King and S.H. Marchant, unpublished results.
17. Proceedings of the Molten Salts Discussion Group Wcrkshop.-
Conference on 'The Interaction of Molten Salts and Metals
Current Understanding ol Hot Corrosion and New Approaches to
Practical Problems', 2-4 ly 1986, University of York,
sponsored by the Office of Naval Research, US Navy, Lorda:n
- 6-

Branch Office, edited by T.R. Griffiths, Hon. Secretary,
Molten Salts Discussion Group.
28. Private commurication from Dr. J.E. Stringer, Electric
Power Research Institute, Palo Alto, California, USA.
19. D.M. Gruen, Quart. Rev. Chem. Soc., 1965, 19, 349.
20. Cary Instruments (Applied Physics Corporation, now Varian
Instruments), Report AR14-2 (September, 1964).
21. R.P. Bauman, 'Absorption Spectroscopy', John Wiley, New
York, 1962.
-67 -

DATE.