unbalance defect detection in rotating machines … · unbalance defect detection in rotating...
TRANSCRIPT

UNBALANCE DEFECT DETECTION IN ROTATING MACHINES BY MEANS OF SOUND ANALYSIS
Bachelor of Science Thesis in Software Engineering and Management
ANTON SHUMEIKA
University of GothenburgChalmers University of TechnologyDepartment of Computer Science and EngineeringGöteborg, Sweden, May 2012

The Author grants to Chalmers University of Technology and University of Gothenburg the non-exclusive right to publish the Work electronically and in a non-commercial purpose make it accessible on the Internet. The Author warrants that he/she is the author to the Work, and warrants that the Work does not contain text, pictures or other material that violates copyright law.
The Author shall, when transferring the rights of the Work to a third party (for example a publisher or a company), acknowledge the third party about this agreement. If the Author has signed a copyright agreement with a third party regarding the Work, the Author warrants hereby that he/she has obtained any necessary permission from this third party to let Chalmers University of Technology and University of Gothenburg store the Work electronically and make it accessible on the Internet.
Unbalance Defect Detection in Rotating Machines by Means of Sound Analysis
ANTON SHUMEIKA
© Anton Shumeika, May 2012.
Examiner: Helena Holmström Olsson
University of GothenburgChalmers University of TechnologyDepartment of Computer Science and EngineeringSE412 96 GöteborgSwedenTelephone + 46 (0)31772 1000
Department of Computer Science and EngineeringGöteborg, Sweden May 2\0\12

Unbalance Defect Detection in Rotating Machines by Means of Sound Analysis
Anton ShumeikaDepartment of Applied Information Technology
Gothenburg University, ChalmersSweden
Abstract
Defect detection in rotating machines in the early stages becomes more prioritized. In this respect, cheap, user-friendly and precise assessment techniques and tools need to be developed. This paper researches the feasibility of unbalance defect detection in rotating machines based on sound analysis. It is well known that sound carries important information about the condition of rotating parts in rotating machines. Two rotating machines were analyzed to find the differences in sound pattern between a fully functional machine and a machine with unbalance defect. It has proven difficult to definitely determine the unbalance defect by using a simple signal processing technique. Further work in this area was suggested.
Keywords: unbalance; rotating machines; defect detection; sound analysis; smart-phone
I. INTRODUCTION
The introductory part of this paper reflects on the relevance of the conducted research. The topic of the research is “unbalance defect detection by means of sound analysis”. The main objectives and hypothesis of the research are presented in this part.
A. Relevance of the research topic
Vibration diagnostic is the most accurate and efficient method of defect diagnostics in rotating machinery (Lugovskoi et al, 2000). Adams (2001, p.277) refers to vibration as “the most regularly measured condition parameter in modern rotating machinery”. Plants spend considerable amount of budget to prevent unplanned shutdowns and reduce maintenance costs (Adams, 2001). Predictive maintenance (PdM) uses techniques to determine the current state of in-service equipment. Tools used to collect vibration data are often expensive and not user-friendly. Depending on the complexity, these tools require further computer assisted analysis of the collected data. Due to these facts, study and exploration of new and cheaper means of mechanical error detection is relevant and is in the focus of the research topic: “unbalance defect detection by means of sound analysis”.
This research was conducted with the support of Diadrom and Alfa Laval. Diadrom is a leading IT-company within the diagnostics area, with specification on high-technology products. Alfa Laval is a leading producer of
specialized products and solutions that are used to heat, cool, separate, and transport. Both companies are interested in the research of alternative means of diagnostics, where highly available, low-cost, user-friendly tools and techniques are used.
B. Purpose of the study and hypothesis
This paper aims to research a cheaper, more user-friendly way of evaluating the state of in-service equipment, using a smart-phone device. To fulfill the aim of the research, the following tasks are performed:
Reviewing the literature of the sound and vibration analysis areas
Conducting the experiment Drawing conclusions about feasibility of the study
The hypothesis for the research is:“It is possible to detect unbalance defect of rotating
machines by analysis of the sound, recorded with a smart-phone device”
The focus of this research is on the possibility of defect detection, rather than on the analysis of the wider spectrum of mechanical defects. This research focuses on a single defect, unbalance, to test the concept. The success of this research will provide the basis for further researches, covering wider range of mechanical defects, which can be detected by sound analysis.
C. Background
All in-service rotating machines convert part of the energy into vibration. Every machine has a level of vibration, which is considered as normal or safe. Once the machine’s vibration passes the safe level, it may indicate various defects or faults. Nowadays, many tools exist for vibration diagnostics, which utilize accelerometers, velocity-meters, or laser technologies. Much has been written on the vibration analysis using different techniques, among which Randall (2002), Nandi & Toliyat (1999) and Adams (2001) are found. Randall (2002) describes multiple approaches to vibration analysis and error detection in rotating machines. One of the defects addressed in his work is shaft speed errors, which includes unbalance. Not much attention has been given to the sound produced by the vibrating elements. In fact, sound is also a vibration which can be sensed by the human ear. Sound, produced by the parts of rotating machines, carries certain properties (Benko et al, 2004). Mechanical defects in rotating parts, while in-service, can generate patterns in the sound. Parts, such as motor,

bearings, belt, gears, and bowl can serve as an example. Each of these parts will have a unique frequency in the sound sample due to a difference in rotation speed. Knowing the rotation speed and internal structure of the rotating machine, it is possible to predict what sound pattern will be produced by each rotating part (Benko et al, 2004). Sound analysis assessment of the in-service equipment can be the most low-cost and the most user-friendly technique of PdM.
Within the scope of this research, one of the most common problems of the rotating machines, unbalance, is investigated. Unbalance can cause excessive forces that affect the machine. Unbalance occurs when the mass center of the rotating part does not coincide with the axis of rotation. In general, there are three types of unbalance :
Static unbalance Couple unbalance Dynamic unbalance (Lifetime Reliability Solutions,
2004)Static unbalance (Fig. 1a) is represented by one or more
forces, which shift the mass center away from the rotation axis. This unbalance can be detected on a static rotor. Couple unbalance (Fig. 1b) is usually represented by two forces, equal in magnitude and opposite in direction. Such an unbalance can be detected on an in-service equipment. The most common unbalance is dynamic (Fig. 1c). It is a combination of static and couple unbalances. Dynamic unbalance can be detected only on an in-service equipment. Unbalance can be caused by multiple factors, including:
manufacturing defects build up debris on the rotating equipment
components erosion or wear out of components (Lifetime
Reliability Solutions, 2004)Unbalance is the main cause of the excessive once-per-
revolution vibrations of the rotor (Adams, 2001). Excessive vibrations can cause preliminary failure of rotating parts and the whole machine. Within this research, the term unbalance refers to the dynamic unbalance.
In this section, the importance of the mechanical error detection has been covered. The overview of related literature was presented in the background section. The second step is the definition of methods and approaches needed in order to perform a practical experiment. In section two the method of the research and data collection is described.
II. METHODOLOGY OF RESEARCH
This section of the research paper introduces approaches relevant for implementation of the research experiment. It
contains a description of the research experiment setup and explains the methods used for the data collection and analysis.
A. Approaches used in research implementation
The theory behind the research is to establish the feasibility of unbalance defect diagnostics by analyzing sound recorded with a smart-phone. The scope of this research does not include direct analysis of the recorded sound on the mobile device. In this research a mobile device (smart-phone) was used only to conduct the recording. Analysis of the sound recordings has been made with the use of the computer software MATLAB (MathWorks, 2011). This software has an extensive toolkit for signal processing and analysis. In this research, two possible ways to conduct the experiment were defined:
1. This approach is based on more in-depth technical knowledge. In this approach, the knowledge of mechanics and full understanding of how a machine functions is required. In order to be able to detect how an unbalance defect represents itself in the sound pattern, a researcher should study the structure and mechanics of the rotating machine. An understanding of the internal structure and detailed knowledge about the machine should help establish what kind of artifact should be present in the recorded sound. Elevated amplitudes of certain frequencies, unexpected frequencies, distortions and other abnormalities are considered sound artifacts or defect patterns. In other words, a researcher should know what to look for and the experiment should be carried out as confirmation of the researcher’s hypothesis. Absence of such expected artifacts would mean the inability to detect the unbalance defect by means of sound analysis. Moreover, Downham and Woods (1971) disagree with applying unified methods for vibration analysis of rotating machines. According to the authors, analysis of the vibration data is highly machine-dependent and unified methods might not be suitable for every possible case. This puts additional limitations on current approach.
2. This approach is more practical. Here, a researcher compares sound recordings from two identical machines among which one is fully functional without known defects and the other has unbalance defect. In this case, the goal is to find out if there are any artifacts present in the recording of the unbalanced machine sound. In other words, any mismatch of the sound patterns of the two recordings should be assumed to be a representation of unbalance defect. In this regard, further investigation and confirmation is required through literature review. This approach does not require a deep understanding of mechanics of the defects. It is preferable to prove this concept within the scope of the current research with this approach. It gives quick results about either presence or absence of sound artifacts in the recordings.
For the current research, the second approach has been selected to test the hypothesis. Benko et al (2004, 2005) have described a similar comparison-based approach as the most

effective in the defect diagnostics of the motor in a vacuum cleaner based on sound analysis.
B. Data collection
To test the hypothesis an experiment was conducted. The experiment took place at the Alfa Laval factory in Tumba, Sweden. Two sets of sound recordings were made. One set of sounds was recorded on a fully functional machine. The second set of recordings was made of the same machine, which was tuned into an unbalanced mode. This setup helps to get clean recording data and therefore better results which are less affected by differences in the recording environment. A grinder (Fig. 1) was used as the rotating machine during the experiment. This grinder is used to train technical personnel at Alfa Laval to recognize defective vibrations of rotating machines. The grinder was located in a quite room. There were no other sound sources present in the room at the time of the experiment. The walls, windows and floor were not covered with any sound absorbing material and therefore were able to serve as a reflection surface for the sound.
To improve the validity of the experiment, each set of recordings consists of five samples per set, recorded from two different positions related to the machine. Position one is to the left of the machine and position two is to the right. Each recording position lies within 10-15 centimeters from the side of the grinder on the same hight as the rotor shaft. The sides of the recording positions are marked with the numbers “1” and “2” in Fig. 2.
The recordings were made with Sony Ericsson Xperia X10 (Xperia X10 | Smartphone - Sony Smartphones, 2012) smart-phone with operation system Anrdoid 2.3 (Android 2.3 Platform Highlights, 2012). This phone belongs to the high-end middle-price android devices line. Its hardware is comparable to all widely used android devices. No additional recording or amplifying hardware other than the smart-phone’s built-in microphone was used. The application RecordNow (Shumeika, 2012) was developed to make sound recordings. The application stores raw input from the microphone into “wav” file. The sample rate of recordings was set to 44100 Hertz, which is the highest sample rate supported by the phone. This sample rate is higher than the required rate for sampling the sound produced by unbalance vibrations and its harmonics. The Nyquist–Shannon
sampling theory (Zawistowski & Shah) states that in order to perfectly recreate analog signal sampling rate should be twice as high as the maximum expected frequency of the signal. In other words, in order to recreate a signal of 50 Hertz without data loss, the sample rate to record such a signal should not be less than 100 Hertz. The grinder’s speed during testing was set to the maximum possible value of 3000 Revolutions per minute (RPM) which converts to 50 Hertz.
3000 RPM÷60 sec=50 HertzGaneriwala et al (1999) have conducted a similar study
of misalignment vibration patterns in rotating machines. Their study did not show any significant vibrations at the rotation speed under 2100 RPM.
Along with the sound recordings, vibration data was collected from the machine to verify the state of unbalance. Vibration data was measured on both positions, point one and point two (Fig. 2), for both working and faulty machines. Vibration data was collected with Cosmos Offline (Alfa Laval 2012, Keeping a sharp eye on your performance) a handheld vibration data collector device. This device stores vibration data for each measurement point. The collected data was moved to the Cosmos frequency analysis software on a computer. The Cosmos software produced the frequency amplitude diagram (Fig. 3).
C. Analysis
The method of observation was used to analyze the recorded sound data. Visual observation is the main method usually used to detect faults in frequency spectrum diagrams (Baydar & Ball, 2001). Frequency spectrum diagrams is the product of application of Fourier transformation algorithms on the sound data. Adams (2001, p.279) mentions that Fast Fourier Transformation (FFT) algorithms became “a primary signal analysis tool and has been the major modern advancement in rotating machinery vibration signal analysis.” Vaseghi (2007, p.26) describes that the “power of the Fourier transform in signal analysis and pattern recognition lies in its simplicity and its ability to reveal spectral structures that can be used to characterize a signal”.
Power spectral density (PSD) analysis algorithm is used to represent the frequency spectrum for the sound data. This algorithm shows the variation of energy as a function of frequency (Power spectral density function). It is possible to see how much energy every frequency of the sound transfers. The PSD is calculated using FFT applied to the sound data (Fig. 4, Fig. 5).
D. Limitations
Sound analysis diagnostic uses tools which have no direct physical connection to the diagnosed equipment. This fact introduces restrictions and external factors which can influence the quality of analysis. In the case of the current research and the related experiment there are external factors which influenced the results. These include recording hardware, experiment setup and the approach used.
1) Hardware limitations
Figure 2. Grinder

From the beginning of the research Android based smart-phones were targeted as the recording hardware due to their distribution and popularity growth (Android- and iOS-Powered Smartphones Expand Their Share of the Market in the First Quarter, According to IDC, 2012). It is more likely that the technical personnel will use android smart-phone to conduct the audio analysis of the equipment. Another positive aspect of Android phones is the openness of the platform itself, which allows better access to its hardware. Ironically, the strength of Android devices is, at the same time, their weakness. Due to the popularity of Android platform many companies make low-end cheap devices with hardware parts of a low quality (Android phones have less reliable hardware, 2012). Practically it means that recording made with one model of Android device might show good results in detecting errors, when another model might fail. It is a limitation for the research because the proof of the hypothesis depends on the quality of the audio recordings.
2) Experiment setupBenko et al (2004) analyzed the sound of vacuum cleaner
motors recorded in echo-free environment. The motors were placed one at a time in a sealed box which was covered inside with sound absorbing material. Benko et al. (2004) were able to detect four defects of the motors by analyzing the sound. Sound recording is dependent on the recording environment. Glass on the windows, concrete floor and walls reflect sound and create echoes in the recording (Home Studio: Your recording environment). Distance from the recording device to the machine influences the comparison between recordings. These factors distort recorded sound and create additional difficulties in sound analysis. Environment should be taken into account due to the fact that most of the rotating machines are placed within a noisy environment, unfriendly to sound recording.
3) Approach and analysisWithin this research, visual observation of frequency
spectra approach was used for sound analysis. Power density spectrum was the transformation used to visualize the frequency spectrum. An assumption was made that unbalance defect manifests itself in the sound pattern the same way it manifests itself in the vibration data – elevated energy at the rotation speed. Unbalance might require the use of other analysis approaches in order to detect this defect in the sound pattern.
In section two it was established that practical experiment is the best way to test the hypothesis of the research. Experiment setup and data collection were described in detail. In the next section the results of the data analysis are presented.
III. RESULTS
Vibration data collected by the Cosmos tool is presented in the Fig. 3. Fig. 3 (a) and (b) show vibration data collected for the faulty machine. Fig. 3 (c) and (d) show vibration data for the working machine. Vertical axis shows the amplitude of the vibration and horizontal axis – the frequency, on which vibrations occur.
The recorded sound data has been transferred to a computer where Fourier transformation was applied to it. MATLAB (MathWorks, 2011) software was used to apply the Fourier transformation and create frequency spectrum
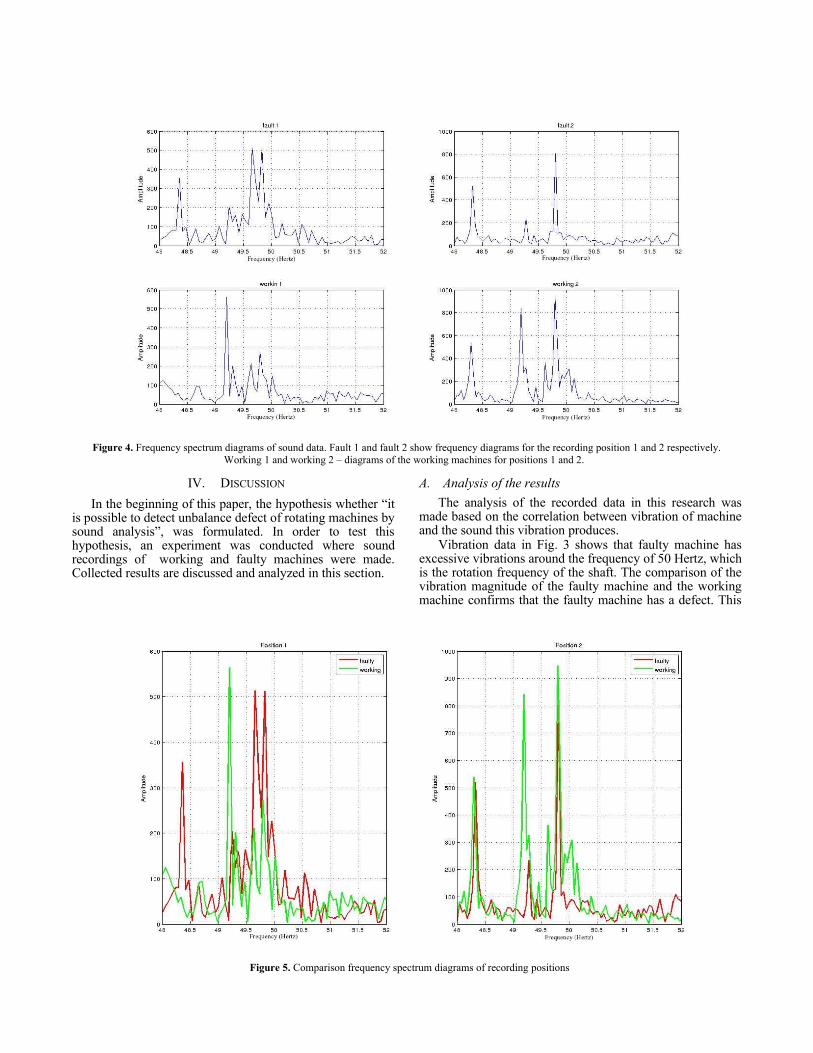
diagrams to visualize the recorded sound frequencies. Fig. 4 shows four diagrams of both working and faulty machines for each recording position. These spectrum diagrams present the range of sound frequencies between 48 Hertz and 52 Hertz for the average values of each recording set. Each diagram has amplitude on the vertical axis and frequency on the horizontal axis. The diagrams give clear view of the amplitude peaks at the frequency of rotation – about 50 Hertz.
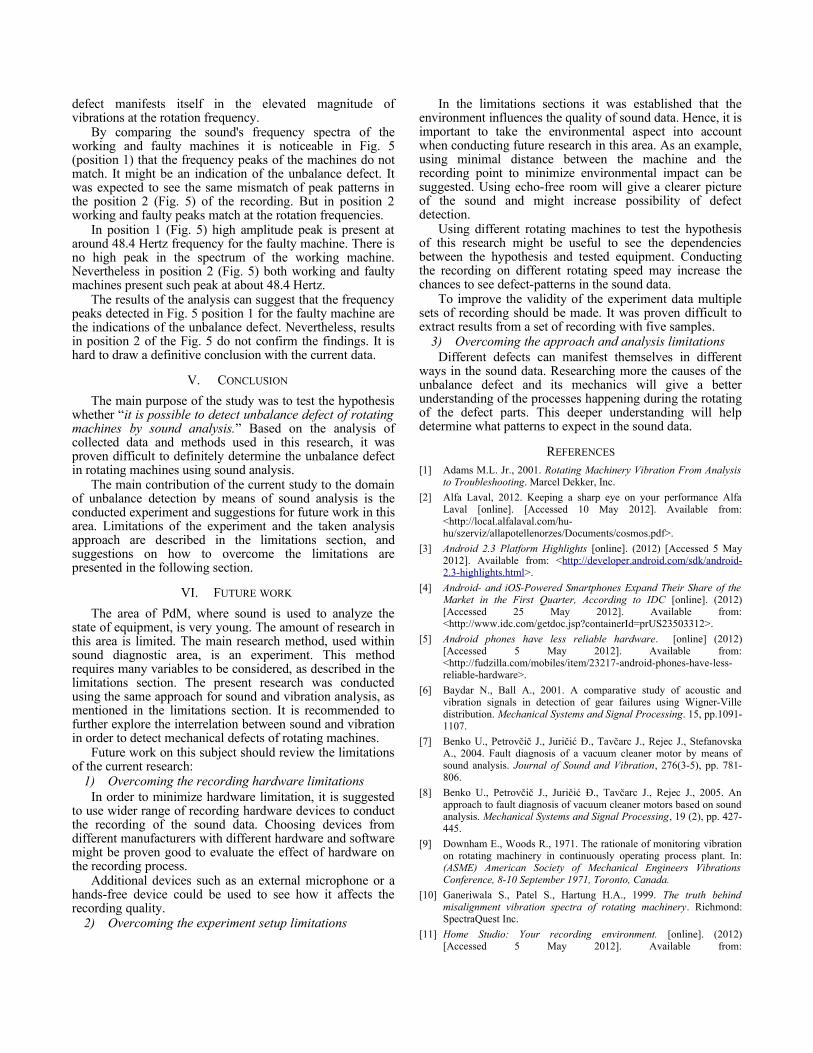
The comparison diagram has been generated to have a clearer look on the frequency spectrum for the recording sets at each position (Fig. 5). Green lines represent working machine and red lines – faulty machine.
IV. DISCUSSION
In the beginning of this paper, the hypothesis whether “it is possible to detect unbalance defect of rotating machines by sound analysis”, was formulated. In order to test this hypothesis, an experiment was conducted where sound recordings of working and faulty machines were made. Collected results are discussed and analyzed in this section.
A. Analysis of the results
The analysis of the recorded data in this research was made based on the correlation between vibration of machine and the sound this vibration produces.
Vibration data in Fig. 3 shows that faulty machine has excessive vibrations around the frequency of 50 Hertz, which is the rotation frequency of the shaft. The comparison of the vibration magnitude of the faulty machine and the working machine confirms that the faulty machine has a defect. This
Figure 4. Frequency spectrum diagrams of sound data. Fault 1 and fault 2 show frequency diagrams for the recording position 1 and 2 respectively.Working 1 and working 2 – diagrams of the working machines for positions 1 and 2.
Figure 5. Comparison frequency spectrum diagrams of recording positions
defect manifests itself in the elevated magnitude of vibrations at the rotation frequency.
By comparing the sound's frequency spectra of the working and faulty machines it is noticeable in Fig. 5 (position 1) that the frequency peaks of the machines do not match. It might be an indication of the unbalance defect. It was expected to see the same mismatch of peak patterns in the position 2 (Fig. 5) of the recording. But in position 2 working and faulty peaks match at the rotation frequencies.
In position 1 (Fig. 5) high amplitude peak is present at around 48.4 Hertz frequency for the faulty machine. There is no high peak in the spectrum of the working machine. Nevertheless in position 2 (Fig. 5) both working and faulty machines present such peak at about 48.4 Hertz.
The results of the analysis can suggest that the frequency peaks detected in Fig. 5 position 1 for the faulty machine are the indications of the unbalance defect. Nevertheless, results in position 2 of the Fig. 5 do not confirm the findings. It is hard to draw a definitive conclusion with the current data.
V. CONCLUSION
The main purpose of the study was to test the hypothesis whether “it is possible to detect unbalance defect of rotating machines by sound analysis.” Based on the analysis of collected data and methods used in this research, it was proven difficult to definitely determine the unbalance defect in rotating machines using sound analysis.
The main contribution of the current study to the domain of unbalance detection by means of sound analysis is the conducted experiment and suggestions for future work in this area. Limitations of the experiment and the taken analysis approach are described in the limitations section, and suggestions on how to overcome the limitations are presented in the following section.
VI. FUTURE WORK
The area of PdM, where sound is used to analyze the state of equipment, is very young. The amount of research in this area is limited. The main research method, used within sound diagnostic area, is an experiment. This method requires many variables to be considered, as described in the limitations section. The present research was conducted using the same approach for sound and vibration analysis, as mentioned in the limitations section. It is recommended to further explore the interrelation between sound and vibration in order to detect mechanical defects of rotating machines.
Future work on this subject should review the limitations of the current research:
1) Overcoming the recording hardware limitations In order to minimize hardware limitation, it is suggested
to use wider range of recording hardware devices to conduct the recording of the sound data. Choosing devices from different manufacturers with different hardware and software might be proven good to evaluate the effect of hardware on the recording process.
Additional devices such as an external microphone or a hands-free device could be used to see how it affects the recording quality.
2) Overcoming the experiment setup limitations
In the limitations sections it was established that the environment influences the quality of sound data. Hence, it is important to take the environmental aspect into account when conducting future research in this area. As an example, using minimal distance between the machine and the recording point to minimize environmental impact can be suggested. Using echo-free room will give a clearer picture of the sound and might increase possibility of defect detection.
Using different rotating machines to test the hypothesis of this research might be useful to see the dependencies between the hypothesis and tested equipment. Conducting the recording on different rotating speed may increase the chances to see defect-patterns in the sound data.
To improve the validity of the experiment data multiple sets of recording should be made. It was proven difficult to extract results from a set of recording with five samples.
3) Overcoming the approach and analysis limitationsDifferent defects can manifest themselves in different
ways in the sound data. Researching more the causes of the unbalance defect and its mechanics will give a better understanding of the processes happening during the rotating of the defect parts. This deeper understanding will help determine what patterns to expect in the sound data.
REFERENCES
[1] Adams M.L. Jr., 2001. Rotating Machinery Vibration From Analysis to Troubleshooting. Marcel Dekker, Inc.
[2] Alfa Laval, 2012. Keeping a sharp eye on your performance Alfa Laval [online]. [Accessed 10 May 2012]. Available from: <http://local.alfalaval.com/hu-hu/szerviz/allapotellenorzes/Documents/cosmos.pdf>.
[3] Android 2.3 Platform Highlights [online]. (2012) [Accessed 5 May 2012]. Available from: <http://developer.android.com/sdk/android-2.3-highlights.html>.
[4] Android- and iOS-Powered Smartphones Expand Their Share of the Market in the First Quarter, According to IDC [online]. (2012) [Accessed 25 May 2012]. Available from: <http://www.idc.com/getdoc.jsp?containerId=prUS23503312>.
[5] Android phones have less reliable hardware. [online] (2012)[Accessed 5 May 2012]. Available from: <http://fudzilla.com/mobiles/item/23217-android-phones-have-less-reliable-hardware>.
[6] Baydar N., Ball A., 2001. A comparative study of acoustic and vibration signals in detection of gear failures using Wigner-Ville distribution. Mechanical Systems and Signal Processing. 15, pp.1091-1107.
[7] Benko U., Petrovčič J., Juričić Đ., Tavčarc J., Rejec J., Stefanovska A., 2004. Fault diagnosis of a vacuum cleaner motor by means of sound analysis. Journal of Sound and Vibration, 276(3-5), pp. 781-806.
[8] Benko U., Petrovčič J., Juričić Đ., Tavčarc J., Rejec J., 2005. An approach to fault diagnosis of vacuum cleaner motors based on sound analysis. Mechanical Systems and Signal Processing, 19 (2), pp. 427-445.
[9] Downham E., Woods R., 1971. The rationale of monitoring vibration on rotating machinery in continuously operating process plant. In:(ASME) American Society of Mechanical Engineers Vibrations Conference, 8-10 September 1971, Toronto, Canada.
[10] Ganeriwala S., Patel S., Hartung H.A., 1999. The truth behind misalignment vibration spectra of rotating machinery. Richmond: SpectraQuest Inc.
[11] Home Studio: Your recording environment. [online]. (2012) [Accessed 5 May 2012]. Available from:

<http://www.shure.co.uk/support_download/educational_content/studio-home-recording/home-studio-recording-environment>.
[12] Lifetime Reliability Solutions, 2004. Rotating Machinery Rotor Balancing. [online] [Accessed 5 May 2012]. Available from: <http://www.lifetime-reliability.com/free-articles/precision-maintenance/Rotating_Machinery_Rotor_Balancing.pdf>
[13] Lugovskoi A.I., Loginov S.A., Tobratov A.K., Shevchenko Yu.V., 2000. Vibration Diagnostics and Maintenance of Machinery. Chemistry and Technology of Fuels and Oils, 36(5).
[14] MathWorks (2011). MATLAB. (Version 7.0.13.564). (Software). [Downloaded 10 May 2012]. Available from: <http://www.mathworks.se/products/matlab/trial.html?s_cid=ML2012_trial_a>.
[15] Nandi S., Toliyat H.A., 1999, Fault diagnosis of electrical machines-a review, Proceedings of the IEEE-IEMDC Conference, Seattle, WA.
[16] Power spectral density function [online]. [Accessed 10 May 2012]. Available from: <http://www.cygres.com/OcnPageE/Glosry/Spec.html>.
[17] Randall R.B., 2002. State of the art in monitoring rotating machinery, Proceedings of ISMA 2002, Vol. 4, pp. 1457–1477.
[18] Shumeika A., 2012, RecordNow. (Version 1.0). (Android application). [Downloaded 1 May 2012]. Available from: <https://github.com/aquarius29/sound_recorder/tree/recordnow>.
[19] Vaseghi S., 2007, Multimedia Signal Processing: Theory and Applications in Speech, Music and Communications. United Kingdom: Wiley.
[20] Xperia X10 | Smartphone - Sony Smartphones [online]. (2012) [Accessed 10 May 2012]. Available from: <http://www.sonymobile.com/global-en/products/phones/xperia-x10/>.
[21] Zawistowski T., Shah P., An Introduction to Sampling Theory [online]. [Accessed 10 May 2012]. Available from: <http://www2.egr.uh.edu/~glover/applets/Sampling/Sampling.html>.