unaudited results for the
TRANSCRIPT

Unaudited results for thesix months to 30th June 2016
28th July 2016

Highlights for H1 2016
2
Financial results
• Revenue up 20.6% to ₦292.2B
• EBITDA down 10.2% to ₦132.5B at 45.4% margin, on lowerselling price, higher fuel costs in Nigeria and plants in ramp-up
• EPS down 13.7% to ₦6.23
• Net debt of ₦293.3B, gearing ratio of 43.1%
Operational highlights
• Group cement volumes up 59.6% to nearly 13.0Mt
• Record sales volumes in Nigerian market, up 38.8% to more than 8.7Mt after price reduction
• West & Central Africa sales volumes up 185% to 2.6Mt*
• South & East Africa sales volumes up 79.6% to 1.6Mt*
• Good start in Tanzania with strong market share gains
• Appointment of Dorothy Ufot as first woman on Board
• Appointment of Massimo Bettanin as Head of EHSS– Brief to prepare Dangote Cement to comply with proposed
Sustainability Disclosure Guidelines from 2017
*As of 1st January 2016, Ethiopia was regrouped into the West & Central operating region
Regional revenues (₦bn)
Six months to30th June
2016 2015 Change
Nigeria 216.6 207.8 4.2%
West & Central Africa *
49.9 17.1 192%
South & East Africa
26.1 17.3 50.9%
Inter-company sales (0.4) -
Total 292.2 242.2 20.6%
Regional sales volumes (‘000 tonnes)
+45.4%
+00.0%
0
2,000
4,000
6,000
8,000
10,000
12,000
14,000
H1 2015 H1 2016
Nigeria W&C Africa S&E Africa

Financial Overview
Six months to 30th June 2016 2015
₦B ₦B % change Comments
Revenue 292.2 242.2 20.6%Maiden H1 contributions from non-Nigerian factories and improved revenue from Nigeria
Cost of sales (139.2) (84.5) 64.7% Higher fuel costs in Nigeria owing to gas disruption
Gross profit 153.0 157.7 (3.0%)
Gross margin 52.4% 65.1% 57% in Nigeria, 17% Pan-Africa
EBITDA 132.5 147.5 (10.2%) Lower selling price and higher fuel costs in Nigeria, plus impact of plants in ramp-up
EBITDA margin 45.4% 60.9%
EBIT 98.0 122.4 (19.9%)
EBIT margin 33.6% 50.5%
Net finance income 26.8 6.3 Net gain of N42.7B on translation of net assets denominated in foreign currency
Profit before tax 124.9 128.7 (3.0%)
Income tax (expense)/credit (21.4) (6.9) 210% Effective tax rate is 17.2% at Group, 10% in Nigeria
Profit for the period 103.4 121.8 (15.1%)
Earnings per share 6.23 7.22 (13.7%)
3
Income Statement
Financial Overview
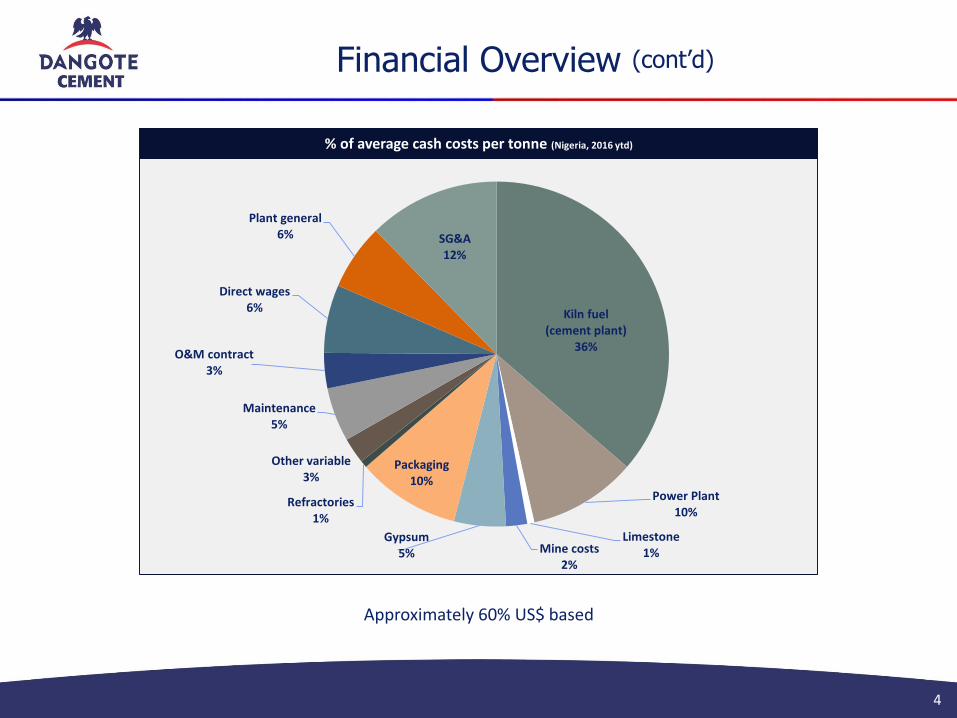
4
Kiln fuel (cement plant)
36%
Power Plant10%
Limestone 1%Mine costs
2%
Gypsum5%
Packaging10%
Refractories1%
Other variable3%
Maintenance5%
O&M contract3%
Direct wages6%
Plant general6% SG&A
12%
% of average cash costs per tonne (Nigeria, 2016 ytd)
(cont’d)
Approximately 60% US$ based

Financial Overview
5
Movement in net debt
Cash₦B
Debt₦B
Net debt₦B
As at 1st January 2016 40.8 (245.0) (204.2)
Cash generated from operations beforechanges in working capital
113.9 - 113.9
Changes in working capital 7.6 - 7.6
Income tax paid (0.7) - (0.7)
Capital expenditure (54.6) - (54.6)
Other investing activities (3.1) - (3.1)
Change in non-current prepayments 7.1 - 7.1
Net interest payments (19.8) - (19.8)
Net loans obtained (repaid) 79.4 (79.4) -
Other cash and non-cash movements 14.8 (18.0) (3.2)
Dividend paid (136.3) - (136.3)
As at 30th June 2016 49.1 342.4 293.3
(cont’d)

6
As at As at30/06/16 31/12/15
₦B ₦B
Property, plant and equipment 1,065.2 917.2
Other non-current assets 26.1 25.1
Intangible assets 6.3 2.6
Current assets 224.6 125.2
Cash and cash equivalents 49.1 40.8
Total Assets 1,371.3 1,110.9
Non-current liabilities 84.8 57.2
Current liabilities 257.6 153.4
Debt 342.4 255.6
Total liabilities 691.0 466.0
Net Assets 680.2 644.7
Net debt as % of net assets 43.1% 33.3%
Financial Overview
Balance sheet
(cont’d)

Nigeria
7
• Record H1 sales up 38.8% to nearly 8.8Mt
• Q2 sales up 31.8% despite recent price increases
• Market share of 66% vs 58% in H1 2015
• Imports rapidly falling away at lower price
• Gas disruption worsens, weighs on margins, along withlower selling price in Nigeria following Sept 15 price cut
– Coal now on Obajana 1&2 since early July
• Successful marketing initiatives target 14,000+ retail outlets
• Impact of devaluation in late June not yet felt
– At $1=₦285 cash costs rose by 25%
– Protection of margin is main objective
Nigeria performance
Six months to30th June
2016 2015 Change
Volumes sold (kt) 8,766 6,315 38.8%
Revenue (₦B) 216.6 207.8 4.2%
EBITDA (₦B) 124.1 144.3 (14.0%)
EBITDA margin 57.3% 67.4%
0
1,000
2,000
3,000
4,000
5,000
Q1 Q2 Q3 Q42014 2015 2016
Quarterly sales (‘000 tonnes)
+36.3%+45.4%
H1 2016 (H1 15) Obajana Ibese
Gas 50% (88%) 26% (83%)
Coal 12% (7%) 52% (17%)
LPFO 39% (5%) 22% (0%)
Kiln fuel mix
* Excluding corporate costs and eliminations (see note 4 to accounts)
+31.8%

West & Central Africa
8
• Strong performance across the region
• Sales volumes up 185% to nearly 2.6Mt, including Ethiopia
• Revenues rise 227% to ₦49.9B, EBITDA up 230%
• Excellent sales increases across the region
– Senegal sales up 58%
– Ghana up 74%
– Cameroon up 240%
– Ethiopia up 860%
• Strong market shares achieved
– Senegal 29% share
– Ethiopia 28% share
– Cameroon 47% share
• Congo set for operations in October 2016
• Sierra Leone expected ready by October 2016
H1 sales ('000 tonnes)
0
400
800
1,200
1,600
2,000
2,400
2015 2016
West & Central Africa performance
Six months to30th June
2016 2015 Change
Volumes sold (kt) 2,562 898 185%
Revenue (₦B) 49.9 17.1 192%
EBITDA (₦B) 11.8 3.6 230%
EBITDA margin 23.7% 21.0%

West & Central Africa
9
Cameroon
• GDP growing at c5% but slowing on lower oil price
• Infrastructure investment continues but at more modest levels
• Cement pricing generally stable, $110 at June 2016
• Our sales volumes up 240%, leading supplier with 47% market share a year after opening
Ghana
• Solid economic growth but high inflation because of fuel costs, Government revenues impacted by low oil price, fuel shortages, blackouts not helping construction
• Improved supply and logistics enabled us to increase market share to 15% on improved sales
• Allocated 1,000 trucks to bring cement from Nigeria, improving local delivery capability
• Importing from Nigeria provides non-duty alternative to imports from outside ECOWAS
• Pricing supportive at about $133 in June
Ethiopia
• Economy slowed by drought and subsequent flooding
• Government committed to infrastructure
• $500m World Bank financing for power, transport
• Strong sales performance, nearly 1Mt, gained 28% market share in year since opening
• Pricing at about $74/tonne in June 2016
Senegal
• Economy slowing because of lack of key export goods
• But government has approved $370m infrastructure investment for roads and power
• Strong sales despite maintenance downtime
• Achieving 29% market share
• Increasing export sales to Mali, also targeting Gambia and Liberia for bulk cement
• Typical ex-factory price was $79 in June 2016

South & East Africa
10
H1 sales ('000 tonnes)
0200400600800
1,0001,2001,4001,6001,800
2015 2016
South & East Africa performance
Six months to30th June
2016 2015 Change
Volumes sold (kt) 1,656 922 79.6%
Revenue (₦B) 26.1 17.3 50.9%
EBITDA (₦B) 1.1 3.3 (67.4%)
EBITDA margin 4.2% 19.3%
• Sales volumes up 79.6% to more than 1.6Mt
• Revenues up 50.9% to ₦26.1B
• EBITDA falls 67.4% owing to lower pricing across the region, FX challenges and fuel costs in Tanzania
• South Africa volumes up 18% despite poor economy
• Zambia makes good maiden H1 contribution
• Tanzania makes solid start, now a leading supplier with 23% monthly share in June 2016

South & East Africa
11
South Africa
• Economy weak on China slowdown, Brexit worries
• But infrastructure investment set to rise
• Strong 18% volume growth despite economy
• Pricing pressure on competition, new capacity
Tanzania
• Govt has ambitious plans for medium-term growth but climate is subdued at present following VAT increases
• Infrastructure and housing drive cement demand
• Price competition and new DCP capacity has driven prices down to about $80
• Solid start to operations at Mtwara, quickly becoming a leading supplier across Tanzania
• Reliance on diesel gensets will subdue margins until coal-fired power plant is completed
Zambia
• Low copper prices impact export earnings, Kwacha depreciation vs US$
• Increased unemployment, 20% inflation, power shortages
• Infrastructure stalling, limited new projects, ‘wait and see’ pending election in August
• But increasing demand from Malawi despite import permits
• Despite inflation, cement prices under pressure$72/tonne in June
• Dangote Cement achieves 40%-45% share in first year

Corporate Developments
12
• Dorothy Ufot, SAN, appointed as first female Director• Brings considerable experience as a leading commercial lawyer• Substantial experience in international business law• Strong expertise in international commercial arbitration
• Massimo Bettanin appointed Head of EHSS• Previously advised Dangote Cement while at ERM• Helped develop EHSS policies for Dangote Industries• Will manage development of EHSS strategy and implement roll-out,
monitoring and reporting across all sites• Prepares DCP for new Sustainability Requirements being considered by NSE
+46%+47%

Outlook for 2016
13
• Strong volume growth expected
• Nigeria has locked in 18% growth even if H2 is flat on 2015
• >1Mt expected in July despite 3-day midweek Eid holiday, well above July 15
• Ghana to import more cement from Nigeria
• Tanzania, Congo to contribute in H2
• Focus on protection of margins in Nigeria
• More coal facilities in Nigeria coming onstream
• Coal running on Obajana 1&2 since early July, Line 4 readying
• Ibese 3&4 readying for coal
• All lines will be able to run on 100% coal if necessary
• Reduces impact of serious gas disruption
• Eliminates need for LPFO (substantially more expensive than gas per tonne of cement)
• Increasing use of Nigerian coal, but blending with imported coal
• Accelerating own Nigerian mining initiative
• Nigeria will export more cement to ECOWAS, especially Ghana
• Expansion plan now likely to take 3-5 years owing to currency constraints
+46%+47%
Investor Relations
14
For further information contact:
Carl FranklinHead of Investor RelationsDangote Cement Plc
+44 207 399 3070+44-7713 634 [email protected]
www.dangotecement.com
@DangoteCement