unaudited pro forma consolidated financial information · 2018-11-22 · unaudited pro forma...
TRANSCRIPT
UNAUDITED PRO FORMA CONSOLIDATED FINANCIAL INFORMATION
The following Unaudited Pro Forma Consolidated Financial Information contains unaudited pro forma
consolidated income statements for the year ended December 31, 2014 and the nine months ended
September 30, 2015, an unaudited pro forma consolidated statement of financial position as of
September 30, 2015, and unaudited pro forma consolidated statement of comprehensive income for the year
ended December 31, 2014 and the nine months ended September 30, 2015. This Unaudited Pro Forma
Consolidated Financial Information has been derived from assumptions described below and has also been
derived from and should be read in conjunction with the following documents:
the audited consolidated financial statements of Solvay as of and for the year ended December 31,
2014, prepared in accordance with IFRS;
the unaudited consolidated interim financial statements of Solvay as of and for the nine-month
period ended September 30, 2015, prepared in accordance with IFRS;
the audited consolidated financial statements of Cytec as of and for the year ended December 31,
2014, prepared in accordance with U.S. GAAP; and
the unaudited consolidated interim financial statements of Cytec as of and for the nine-month
period ended September 30, 2015, prepared in accordance with U.S. GAAP.
The Unaudited pro forma consolidated income statements reflect the Acquisition and the Financing, as
if they had occurred on January 1, 2014, and the Unaudited Pro Forma Consolidated Statement of Financial
Position reflects the Acquisition and the Financing, as if they had occurred on September 30, 2015 as
described further in this Chapter.
Cytec has prepared its audited consolidated financial statements as of and for the year ended December
31, 2014, and its unaudited consolidated interim financial statements as of and for the nine-month period
ended September 30, 2015, in US dollars and in accordance with U.S. GAAP. Solvay reports its financial
results in euros and in conformity with IFRS. IFRS differs from U.S. GAAP in certain significant respects.
For the purpose of preparing the Unaudited Pro Forma Consolidated Financial Information, Cytec historical
financial information has therefore been adjusted for material known differences between U.S. GAAP and
IFRS. However, some material differences may exist between U.S. GAAP and IFRS that have not resulted
in pro forma adjustments, as detailed below. In addition, certain items may have been reclassified due to the
conversion from U.S. GAAP to IFRS and different accounting policies. In addition, some differences have
not been addressed as part of the conversion exercise when they related to items that would have been re-
measured to fair value as part of the purchase price allocation exercise.
The Unaudited Pro Forma Consolidated Financial Information is presented for illustrative purposes
only. The unaudited pro forma adjustments are based on available information and certain assumptions that
Solvay believes are reasonable and give effect to events that are directly attributable to the Acquisition and
the Financing and are factually supportable. In addition, the Unaudited Pro Forma Consolidated Financial
Information does not purport to represent what Solvay’s financial position or results of operations would
have actually been if the Acquisition and the Financings had been completed on January 1, 2014 or any other
date nor does it purport to represent Solvay’s results of operations for any future period or our financial
condition at any future date. The unaudited pro forma consolidated financial information does not reflect
any cost savings or other synergies that may result from the Acquisition nor does it reflect any special items
such as restructuring and integration costs that may be incurred as a result of the Acquisition.
The Unaudited Pro Forma Consolidated Financial Information has not been prepared in accordance
with the requirements of Regulation S-X under the U.S. Securities and Exchange Act of 1934. Neither the
adjustments nor the resulting pro forma financial information have been audited. In evaluating the Unaudited
Pro Forma Consolidated Financial Information, investors should carefully consider the consolidated
financial statements of Solvay.

UNAUDITED PRO FORMA CONSOLIDATED FINANCIAL INFORMATION OF SOLVAY FOR
THE YEAR ENDED DECEMBER 31, 2014 AND AS OF AND FOR THE NINE MONTHS ENDED
SEPTEMBER 30, 2015
Introduction
On July 28, 2015, Solvay SA (the “Company”) entered into a definitive merger agreement with U.S.-
based Cytec Industries Inc. (“Cytec”) to acquire 100% of its share capital for US$75.25 per share in cash
(the “Acquisition”). The merger is subject to customary closing conditions, including regulatory approvals
and Cytec shareholders’ approval. The transaction is expected to close in the fourth quarter of 2015.
Since the Acquisition is expected to have a material impact on the financial position and results of
operations of the Solvay Group (“Solvay” or the “Group”), the following unaudited pro forma consolidated
financial information was prepared by the Company, comprising unaudited pro forma consolidated income
statements for the year ended December 31, 2014 and the nine months ended September 30, 2015, an
unaudited pro forma consolidated statement of financial position as of September 30, 2015, and unaudited
pro forma consolidated statements of comprehensive income for the year ended December 31, 2014 and the
nine months ended September 30, 2015, and pro forma notes (together, the “Unaudited Pro Forma
Consolidated Financial Information”).
The purpose of the Unaudited Pro Forma Consolidated Financial Information is to show the material
effects that the Acquisition would have had on the historical consolidated financial statements of the Group
as if it had occurred as of January 1, 2014 with respect to the unaudited pro forma consolidated income
statements, and as of September 30, 2015 with respect to the unaudited pro forma consolidated statement of
financial position.
The Unaudited Pro Forma Consolidated Financial Information has been prepared in accordance with
the basis of preparation described in the accompanying note 1 of this Unaudited Pro Forma Consolidated
Financial Information. As the Acquisition has not yet been completed, pro forma adjustments are based upon
available information and certain assumptions that management of Solvay believes are reasonable.
Based on its nature, the Unaudited Pro Forma Consolidated Financial Information addresses only a
hypothetical situation and, therefore, does not represent the Group’s actual financial position or results after
completion of the Acquisition.
The Unaudited Pro Forma Consolidated Financial Information is presented for illustrative purposes
only and is not indicative of the result of operations or the financial position that the Group would have had
if the Acquisition had occurred as of January 1, 2014 in the unaudited pro forma consolidated income
statements and as of September 30, 2015 in the unaudited pro forma consolidated statement of financial
position, nor is the Unaudited Pro Forma Consolidated Financial Information indicative of the future
operating results or financial position of the Group.
The Unaudited Pro Forma Consolidated Financial Information includes the following notes:
Note 1 – Basis of preparation
Note 2 – Historical financial information of Cytec and Solvay,
Note 3 – Adjustments to the historical financial information of Cytec,
o Note 3.1 – Presentation
o Note 3.2 – Conversion from US GAAP to IFRS and accounting policies alignments
o Note 3.3 – Preliminary purchase price allocation
Note 4 – Pro forma adjustments
o Note 4.1 – Determination of the consideration transferred
o Note 4.2 – Description and accounting treatment of the Financing of the acquisition

o Note 4.3 – Acquisition costs
Preliminary purchase price allocation only includes identification and valuation of tangible and
intangible assets, as well as share-based payment awards. The final purchase price allocation will be
performed at the acquisition date and will address all identifiable assets acquired and liabilities assumed in
accordance with IFRS 3 Business Combinations.
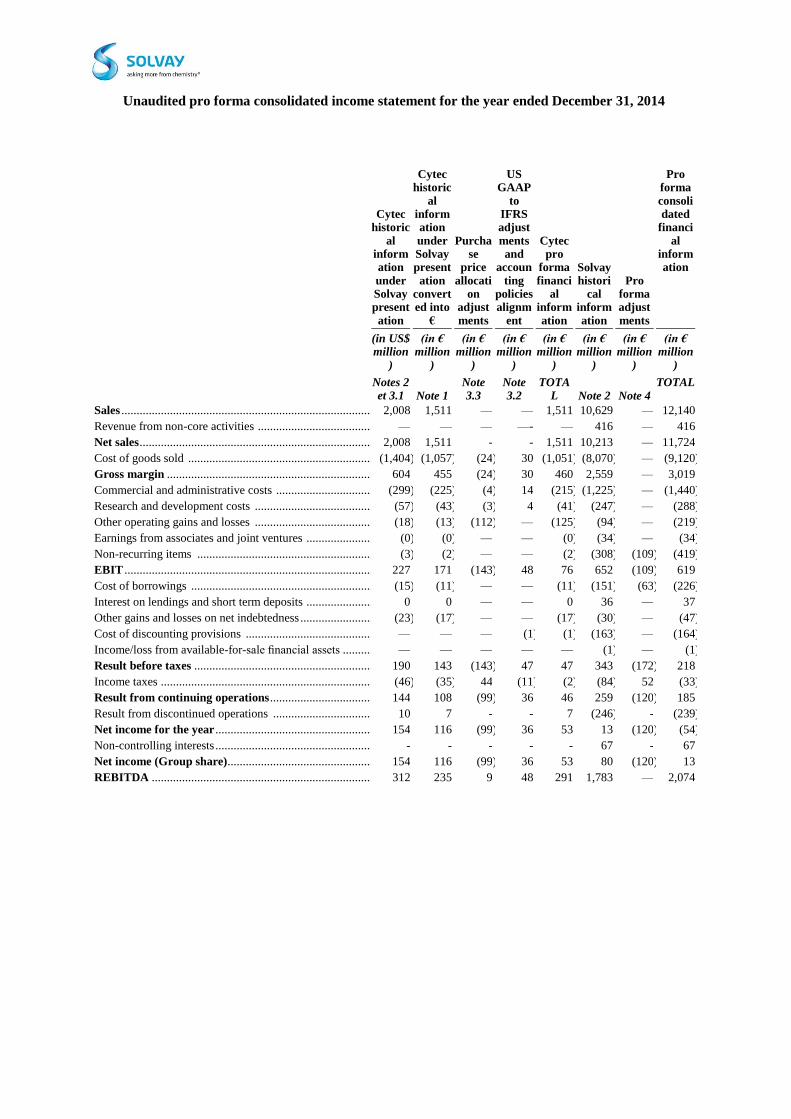
Unaudited pro forma consolidated income statement for the year ended December 31, 2014
Cytec historic
al information
under Solvay present
ation
Cytec historic
al information
under Solvay present
ation converted into
€
Purchase
price
allocation
adjust
ments
US GAAP
to IFRS adjust
ments and
accoun
ting policies alignm
ent
Cytec pro
forma
financial
inform
ation
Solvay histori
cal inform
ation
Pro forma adjust
ments
Pro forma
consolidated
financi
al information
(in US$ million
)
(in € million
)
(in € million
)
(in € million
)
(in € million
)
(in € million
)
(in € million
)
(in € million
)
Notes 2 et 3.1 Note 1
Note 3.3
Note 3.2
TOTAL Note 2 Note 4
TOTAL
Sales .................................................................................................................................................... 2,008 1,511 — — 1,511 10,629 — 12,140
Revenue from non-core activities ....................................................................................................... — — — —- — 416 — 416
Net sales .............................................................................................................................................. 2,008 1,511 - - 1,511 10,213 — 11,724
Cost of goods sold .............................................................................................................................. (1,404 ) (1,057 ) (24 ) 30 (1,051 ) (8,070 ) — (9,120 )
Gross margin ..................................................................................................................................... 604 455 (24 ) 30 460 2,559 — 3,019
Commercial and administrative costs ................................................................................................. (299 ) (225 ) (4 ) 14 (215 ) (1,225 ) — (1,440 )
Research and development costs ........................................................................................................ (57 ) (43 ) (3 ) 4 (41 ) (247 ) — (288 )
Other operating gains and losses ........................................................................................................ (18 ) (13 ) (112 ) — (125 ) (94 ) — (219 )
Earnings from associates and joint ventures ....................................................................................... (0 ) (0 ) — — (0 ) (34 ) — (34 )
Non-recurring items ........................................................................................................................... (3 ) (2 ) — — (2 ) (308 ) (109 ) (419 )
EBIT ................................................................................................................................................... 227 171 (143 ) 48 76 652 (109 ) 619
Cost of borrowings ............................................................................................................................. (15 ) (11 ) — — (11 ) (151 ) (63 ) (226 )
Interest on lendings and short term deposits ....................................................................................... 0 0 — — 0 36 — 37
Other gains and losses on net indebtedness ......................................................................................... (23 ) (17 ) — — (17 ) (30 ) — (47 )
Cost of discounting provisions ........................................................................................................... — — — (1 ) (1 ) (163 ) — (164 )
Income/loss from available-for-sale financial assets ........................................................................... — — — — — (1 ) — (1 )
Result before taxes ............................................................................................................................ 190 143 (143 ) 47 47 343 (172 ) 218
Income taxes ....................................................................................................................................... (46 ) (35 ) 44 (11 ) (2 ) (84 ) 52 (33 )
Result from continuing operations ................................................................................................... 144 108 (99 ) 36 46 259 (120 ) 185
Result from discontinued operations .................................................................................................. 10 7 - - 7 (246 ) - (239 )
Net income for the year ..................................................................................................................... 154 116 (99 ) 36 53 13 (120 ) (54 )
Non-controlling interests ..................................................................................................................... - - - - - 67 - 67
Net income (Group share)................................................................................................................. 154 116 (99 ) 36 53 80 (120 ) 13
REBITDA .......................................................................................................................................... 312 235 9 48 291 1,783 — 2,074

Unaudited pro forma consolidated income statement for the nine months ended September 30,
2015
Cytec historic
al
information under
Solvay presentation
Cytec historic
al
information under
Solvay presentation
converted into
€
Purchase
price allocati
on adjustments
US GAAP
to
IFRS adjustments
and accoun
ting
policies alignm
ent
Cytec pro
forma financi
al information
Solvay histori
cal information
Pro forma adjustments
Pro forma consoli
dated financi
al
information
(in US$ million
)
(in € million
)
(in € million
)
(in € million
)
(in € million
)
(in € million
)
(in € million
)
(in € million
)
Notes 2 et 3.1 Note 1
Note 3.3
Note 3.2 Total Note 2 Note 4
Total
Sales .................................................................................................................................................... 1,521 1,365 — — 1,365 8,374 — 9,739
Revenue from non-core activities ....................................................................................................... — — — — — 338 — 338
Net sales .............................................................................................................................................. 1,521 1,365 — — 1,365 8,036 —— 9,401
Cost of goods sold .............................................................................................................................. (1,040 ) (934 ) (3 ) 14 (923 ) (6,241 ) — (7,164 )
Gross margin ..................................................................................................................................... 480 431 (3 ) 14 442 2,133 — 2,574
Commercial and administrative costs ................................................................................................. (198 ) (177 ) 4 3 (170 ) (985 ) — (1,155 )
Research and development costs ........................................................................................................ (37 ) (33 ) (0 ) 0 (33 ) (204 ) — (237 )
Other operating gains and losses ........................................................................................................ (12 ) (11 ) (101 ) — (112 ) (74 ) — (186 )
Earnings from associates and joint ventures ....................................................................................... — — — — — (8 ) — (8 )
Non-recurring items ........................................................................................................................... (6 ) (5 ) — — (5 ) (126 ) 41 (90 )
EBIT ................................................................................................................................................... 227 204 (100 ) 16 120 737 41 898
Cost of borrowings ............................................................................................................................. (12 ) (11 ) - - (11 ) (81 ) (56 ) (148 )
Interest on lendings and short term deposits ....................................................................................... 1 1 — — 1 7 — 8
Other gains and losses on net indebtedness ......................................................................................... — — — — — (27 ) — (27 )
Cost of discounting provisions ........................................................................................................... — — — (2 ) (2 ) (66 ) — (68 )
Income/loss from available-for-sale financial assets ........................................................................... — — — — — (0 ) — (0 )
Result before taxes ............................................................................................................................ 216 194 (100 ) 15 108 570 (15 ) 663
Income taxes ....................................................................................................................................... (58 ) (52 ) 30 (4 ) (25 ) (204 ) 20 (209 )
Result from continuing operations ................................................................................................... 158 142 (70 ) 11 83 366 6 455
Result from discontinued operations .................................................................................................. (1 ) (1 ) — — (1 ) 50 — 49
Net income for the year ..................................................................................................................... 157 141 (70 ) 11 82 416 6 503
Non-controlling interests ..................................................................................................................... — — — — — (48 ) — (48 )
Net income (Group share)................................................................................................................. 157 141 (70 ) 11 82 368 6 456
REBITDA .......................................................................................................................................... 299 268 9 16 293 1,526 — 1,819

Unaudited pro forma consolidated statement of comprehensive income for the year ended
December 31, 2014.
Cytec
historical
informatio
n under
Solvay
presentati
on
Cytec
historical
informatio
n under
Solvay
presentati
on
converted
into €
Purchase
price
allocation
adjustmen
ts
US GAAP
to IFRS
adjustmen
ts and
accounting
policies
alignment
Cytec pro
forma
financial
informatio
n
Solvay
historical
informatio
n
Pro forma
adjustmen
ts
Pro forma
consolidat
ed
financial
informatio
n
(in US$
million)
(in €
million)
(in €
million)
(in €
million)
(in €
million)
(in €
million)
(in €
million)
(in €
million)
(1) (2) (3) (3)(4) Total (5) (3) Total
Net income ................................................................................................................................................... 154 116 (99) 36 53 13 (120) (54)
Hyperinflation ............................................................................................................................................... - - - - - (11) - (11)
Available-for-sale financial assets ................................................................................................................ - - - - - 1 - 1
Cash flow hedge derivatives ......................................................................................................................... - - - - - (60) - (60)
Currency translation differences ................................................................................................................... - - - - - 231 - 231
Unrecognised actuarial gains and losses
on defined pension plans ........................................................................................................................... (4) (3) - (47) (50) (497) -
(547)
Income tax relating to items of other
comprehensive income .............................................................................................................................. 1 1 - 11 12 72 -
85
Other comprehensive income, net of
related tax effects ..................................................................................................................................... (2) (2) - (36) (37) (264) -
(301)
Total comprehensive income ...................................................................................................................... 152 114 (99) - 15 (251) (120) (355)
Notes:—
(1) Cytec historical consolidated statement of comprehensive income excluding the historical currency translation differences.
(2) Cytec historical consolidated statement of comprehensive income excluding any currency translation differences, converted to € based on the average rate mentioned in note 1.
(3) No translation adjustment computed as the Acquisition is assumed to have occurred on September 30, 2015 for the statement of financial position and on January 1, 2014 for the income statements.
(4) Recognition of the re-measurement of the net defined liability related to pension plans in Other Comprehensive Income under IFRS – See note 3.2.1
(5) Solvay historical consolidated statement of comprehensive income.

Unaudited pro forma consolidated statement of comprehensive income for the nine months
ended September 30, 2015.
Cytec
historical
informatio
n under
Solvay
presentati
on
Cytec
historical
informatio
n under
Solvay
presentati
on
converted
into €
Purchase
price
allocation
adjustmen
ts
US GAAP
to IFRS
adjustmen
ts and
accountin
g policies
alignment
Cytec pro
forma
financial
informatio
n
Solvay
historical
informatio
n
Pro forma
adjustmen
ts
Pro forma
consolidat
ed
financial
informatio
n
(in US$
million)
(in €
million)
(in €
million)
(in €
million)
(in €
million)
(in €
million)
(in €
million)
(in €
million)
(1) (2) (3) (3)(4) Total (5) (3) Total
Net income ................................................................................................................................................... 157 141 (70) 11 82 416 6 503
Hyperinflation ............................................................................................................................................... - - - - - - - - 21 - 21
Available-for-sale financial assets ................................................................................................................ - - - - - - - - 4 - 4
Cash flow hedge derivatives ......................................................................................................................... - - - - - - - - (22) - (22)
Currency translation differences ................................................................................................................... - - - - - - - - 103 - 103
Unrecognised actuarial gains and losses on
defined pension plans ................................................................................................................................ (2) (2) - (14) (16) 285 -
269
Income tax relating to items of other
comprehensive income .............................................................................................................................. 1 1 - 4 5 (19) -
(14)
Other comprehensive income, net of
related tax effects ..................................................................................................................................... (1) (1) - (10) (12) 372 -
360
Total comprehensive income ...................................................................................................................... 155 140 (70) 0 70 788 6 864
Notes:—
(1) Cytec historical consolidated statement of comprehensive income excluding the historical currency translation differences.
(2) Cytec historical consolidated statement of comprehensive income excluding any currency translation differences, converted to € based on the average rate mentioned in note 1.
(3) No translation adjustment computed as the Acquisition is assumed to have occurred on September 30, 2015 for the statement of financial position and on January 1, 2014 for the income statements.
(4) Recognition of the re-measurement of the net defined liability related to pension plans in Other Comprehensive Income under IFRS – See note 3.2.1
(5) Solvay historical consolidated statement of comprehensive income.

Unaudited pro forma consolidated statement of financial position as of September 30, 2015
Cytec historic
al inform
ation under Solvay
presentation
Cytec historic
al inform
ation under Solvay
presentation
convert
ed into €
Purchase price allocati
on
adjustments
US GAAP
to IFRS
adjustments and
accounting
policies
alignment
Cytec pro
forma financi
al
information
Solvay historic
al
information
Pro forma
adjustments
Pro forma consolidated
financial
inform
ation
(in US$ million)
(in € million)
(in € million)
(in € million)
(in € million
)
(in € million
) (in €
million)
(in € million)
Notes 2 and 3.1 Note 1
Note 3.3
Note 3.2 TOTAL Note 2 Note 4
TOTAL
Non-current assets ............................................................................................................................. 1,933 1,726 4,519 (46 ) 6,198 11,985 — 18,183
Intangible assets .................................................................................................................................. 186 166 2,279 — 2,446 1,480 — 3,926
Goodwill .............................................................................................................................................. 502 448 2,072 — 2,520 3,201 — 5,721
Tangible assets .................................................................................................................................... 1,111 991 114 — 1,106 5,623 — 6,729
Available-for-sale financial assets ....................................................................................................... — — — — — 42 — 42
Investments in associates and joint ventures ....................................................................................... 0 0 — — 0 363 — 363
Other investments ................................................................................................................................ 0 0 — — 0 84 — 84
Deferred tax assets .............................................................................................................................. 72 64 53 (24 ) 94 710 — 804
Loans and other non-current assets ..................................................................................................... 63 56 — (23 ) 33 482 — 515
Current assets .................................................................................................................................... 875 781 42 (29 ) 795 5,309 1,242 7,346
Inventories ........................................................................................................................................... 322 288 — — 288 1,521 — 1,808
Trade receivables................................................................................................................................. 286 255 — — 255 1,575 — 1,831
Income tax receivables ........................................................................................................................ 5 5 — — 5 69 21 96
Dividends receivables.......................................................................................................................... — — — — — 0 — 0
Other current receivables - Financial instruments ............................................................................... 6 5 — — 5 89 — 94
Other current receivables - Other ........................................................................................................ 84 75 — (29 ) 47 632 (10 ) 669
Cash and cash equivalents ................................................................................................................... 171 153 42 — 195 1,132 1,230 2,558
Assets held for sale .............................................................................................................................. — — — — —— 291 — 291
Total assets ......................................................................................................................................... 2,808 2,507 4,561 (75 ) 6,993 17,294 1,242 25,529
Total equity ........................................................................................................................................ 1,298 1,158 3,840 (32 ) 4,965 7,227 (2,542 ) 9,650
Equity group share .............................................................................................................................. 1,298 1,158 3,840 (32 ) 4,965 6,957 (2,542 ) 9,380
Non-controlling interests ..................................................................................................................... — — — — — 271 — 271
Non-current liabilities ....................................................................................................................... 1,160 1,036 686 (48 ) 1,674 5,518 3,677 10,869
Long-term provisions: employee benefits ........................................................................................... 250 223 — — 223 2,871 — 3,094
Other long-term provisions ................................................................................................................. 107 95 — (25 ) 70 810 — 880
Deferred tax liabilities ......................................................................................................................... 35 31 674 (12 ) 693 368 (0 ) 1,060
Long-term financial debt ..................................................................................................................... 740 661 — (5 ) 655 1,243 3,678 5,576
Other non-current liabilities ................................................................................................................ 29 26 12 (6 ) 33 227 — 259
Current liabilities .............................................................................................................................. 350 313 36 6 354 4,549 107 5,010
Other short-term provisions ................................................................................................................. 16 14 — 6 20 347 — 367
Short-term financial debt ..................................................................................................................... 14 13 — —— 13 1,451 — 1,464
Trade liabilities .................................................................................................................................... 179 160 — — 160 1,354 — 1,514
Income tax payable .............................................................................................................................. 9 8 — — 8 173 — 182
Dividends payable ............................................................................................................................... — — — — — 3 — 3
Other current liabilities ........................................................................................................................ 132 118 36 — 154 933 107 1,194
Liabilities associated with assets held for sale..................................................................................... — — — — — 287 — 287
Total equity & liabilities ................................................................................................................... 2,808 2,507 4,561 (75 ) 6,993 17,294 1,242 25,529
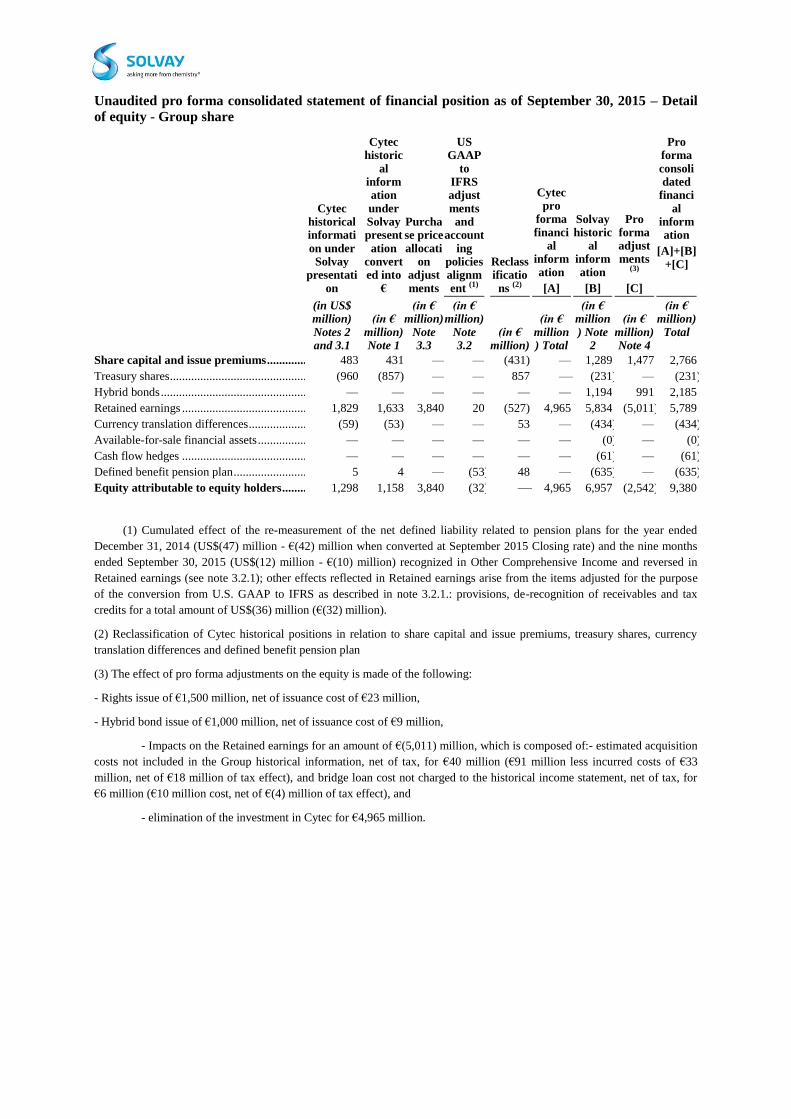
Unaudited pro forma consolidated statement of financial position as of September 30, 2015 – Detail
of equity - Group share
Cytec historical informati
on under Solvay
presentati
on
Cytec historic
al information
under Solvay present
ation converted into
€
Purchase price
allocation
adjust
ments
US GAAP
to IFRS adjust
ments and
account
ing policies alignm
ent (1)
Reclassificatio
ns (2)
Cytec pro
forma
financial
inform
ation
[A]
Solvay historic
al inform
ation
[B]
Pro forma adjustments
(3)
[C]
Pro forma
consolidated
financi
al information
[A]+[B]
+[C]
(in US$ million)
Notes 2 and 3.1
(in €
million) Note 1
(in € million)
Note 3.3
(in € million)
Note 3.2
(in €
million)
(in €
million) Total
(in € million
) Note 2
(in €
million) Note 4
(in € million)
Total
Share capital and issue premiums .................................................................................................... 483 431 — — (431) — 1,289 1,477 2,766
Treasury shares .................................................................................................................................... (960 (857) — — 857 — — (231 ) — (231 )
Hybrid bonds ....................................................................................................................................... — — — — — — 1,194 991 2,185
Retained earnings ................................................................................................................................ 1,829 1,633 3,840 20 (527) 4,965 5,834 (5,011 ) 5,789
Currency translation differences .......................................................................................................... (59) (53) — — 53 — (434 ) — (434 )
Available-for-sale financial assets ....................................................................................................... — — — — — — (0 ) — (0 )
Cash flow hedges ................................................................................................................................ — — — — — — (61 ) — (61 )
Defined benefit pension plan ............................................................................................................... 5 4 — (53 ) 48 — (635 ) — (635 )
Equity attributable to equity holders ............................................................................................... 1,298 1,158 3,840 (32 ) — — 4,965 6,957 (2,542 ) 9,380
(1) Cumulated effect of the re-measurement of the net defined liability related to pension plans for the year ended
December 31, 2014 (US$(47) million - €(42) million when converted at September 2015 Closing rate) and the nine months
ended September 30, 2015 (US$(12) million - €(10) million) recognized in Other Comprehensive Income and reversed in
Retained earnings (see note 3.2.1); other effects reflected in Retained earnings arise from the items adjusted for the purpose
of the conversion from U.S. GAAP to IFRS as described in note 3.2.1.: provisions, de-recognition of receivables and tax
credits for a total amount of US$(36) million (€(32) million).
(2) Reclassification of Cytec historical positions in relation to share capital and issue premiums, treasury shares, currency
translation differences and defined benefit pension plan
(3) The effect of pro forma adjustments on the equity is made of the following:
- Rights issue of €1,500 million, net of issuance cost of €23 million,
- Hybrid bond issue of €1,000 million, net of issuance cost of €9 million,
- Impacts on the Retained earnings for an amount of €(5,011) million, which is composed of:- estimated acquisition
costs not included in the Group historical information, net of tax, for €40 million (€91 million less incurred costs of €33
million, net of €18 million of tax effect), and bridge loan cost not charged to the historical income statement, net of tax, for
€6 million (€10 million cost, net of €(4) million of tax effect), and
- elimination of the investment in Cytec for €4,965 million.

1. Basis of preparation
The Unaudited Pro Forma Consolidated Financial Information has been established in application of
European Commission regulation EC No 809/2004, using the acquisition method in compliance with IFRS.
The Unaudited Pro Forma Consolidated Financial Information has been prepared in millions of euros
(EUR) and gives effect to the Acquisition as if it had occurred on January 1, 2014 for the purposes of the
unaudited pro forma consolidated statements of income for the year ended December 31, 2014 and the nine
months ended September 30, 2015, and on September 30, 2015 for the unaudited pro forma consolidated
statement of financial position.
Only pro forma adjustments that are factually supportable and that can be estimated reliably at the
date the Unaudited Pro Forma Consolidated Financial Information is prepared have been taken into
account. Therefore the Unaudited Pro Forma Consolidated Financial Information does not reflect any
restructuring or integration expenses that may be incurred in connection with the Acquisition and does not
reflect any special items such as payments pursuant to contractual change-of-control provisions, except
share-based payment awards. The Unaudited Pro Forma Consolidated Financial Information also does not
reflect any cost savings potentially realizable from the elimination of certain expenses or from synergies
that may be achieved once the Acquisition is complete. The Unaudited Pro Forma Consolidated Financial
Information does not reflect any tax effect or saving that would result from the integration of Cytec into the
tax consolidation structure of Solvay.
Subsequent to the effective date of the Acquisition, any transaction occurring between the Group and
Cytec will be considered as intercompany transactions and eliminated. Balances and transactions between
the Group and Cytec as of and for the periods presented are not significant and therefore no eliminations
have been made in the Unaudited Pro Forma Consolidated Financial Information.
The income statement of Cytec has been converted into euros using the average USD/EUR exchange
rate for the corresponding periods; the statement of financial position has been converted using the closing
rate at September 30, 20151. The applicable exchange rates are as follows:
Exchange rates used:
Average for the year
ended December 31,
2014
Average for the nine
months ended
September 30, 2015
Closing as of September 30,
2015
USD/EUR ...................................................................................................................... 1.329 1.114 1.120
The Unaudited Pro Forma Consolidated Financial Information reflects the tax effect of the
adjustments described in notes 3 and 4 below:
for Cytec related adjustments except for purchase price allocation adjustments, a tax rate of 24%
has been used for the year ended December 31, 2014 and 27% for the nine-month period ended
September 30, 2015, corresponding to the effective tax rates derived from Cytec historical
financial statements for the same periods;
for Cytec purchase price allocation adjustments for which no push-down to Cytec legal entities
has been performed at this stage, an expected effective tax rate of 30% has been used, in
particular to compute the deferred tax effect on purchase price allocation adjustments; when
adjustments relate to expense incurred in the USA in Cytec historical financial statements, a tax
rate of 37% has been used,
for adjustments related to acquisition and transaction costs, and based on a preliminary allocation
of those costs amongst Solvay legal entities, a tax rate of 0% has been used for the items incurred
at parent company level as Solvay incurred a tax loss over that period and no deferred tax assets
1 As a consequence, no currency translation differences are computed as the Acquisition is assumed to have
occurred on September 30, 2015 for the unaudited pro forma consolidated statement of financial
position. Also, the Cytec historical consolidated statement of comprehensive income excludes any
currency translation differences of the respective periods.

are recognized in Solvay SA, nominal tax rates of 38% and 34% have been used for those
incurred in the USA and France, respectively.
2. Historical financial information
The Unaudited Pro Forma Consolidated Financial Information has been derived from and should be
read in conjunction with the following documents:
the audited consolidated financial statements of Solvay as of and for the year ended
December 31, 2014, prepared in accordance with IFRS as adopted by the EU;
the unaudited consolidated interim financial statements of Solvay as of and for the nine months
ended September 30, 2015, prepared in accordance with IAS 34 Interim Financial Reporting, as
adopted by the EU, which have been reviewed by the Group independent auditors in accordance
with International Standard on Review Engagements (ISRE) 2410 Review of interim financial information performed by the independent auditors of the entity;
the audited consolidated financial statements of Cytec as of and for the year ended December 31,
2014, prepared in accordance with US GAAP; and
the unaudited consolidated interim financial statements of Cytec as of and for the nine months
ended September 30, 2015, prepared in accordance with US GAAP.
3 Adjustments to the historical financial information of Cytec
3.1 Presentation
Certain reclassifications have been made to the Cytec statement of financial position as of September
30, 2015 and statements of income for the year ended December 31, 2014 and for the nine months ended
September 30, 2015 for the purpose of the Unaudited Pro Forma Consolidated Financial Information in
order to align the Cytec presentation to the Solvay consolidated financial statements presentation.
For the statement of financial position as of September 30, 2015, the reclassifications mainly include
the following:
“Intangible assets” as reported in the Solvay financial statements include “Acquisition
intangibles, net” of US$129 million, and US$57 million of “Other assets” (non-current) that
relates to capitalized software, as reported in the Cytec financial statements;
“Long-term provisions: employee benefits” as reported in the Solvay financial statements include
Cytec “Pension and other postretirement benefit liabilities” (US$229 million), and the liability
related to Cytec Supplemental Savings Plan (reported under Other noncurrent liabilities as
reported in the Cytec financial statements) for US$21 million;
“Other long-term provisions” as reported in the Solvay financial statements include the long-term
portion of provisions for environmental, asbestos, asset retirement obligations and restructuring
(US$107 million), which are reported under “Other noncurrent liabilities” in Cytec statement of
financial position; likewise “Other short-term provisions” include the short-term portion of the
similar provisions (US$16 million), which are recorded under “Accrued expenses” as reported in
the Cytec financial statements; and
“Short-term financial debt” as reported in the Solvay financial statements includes US$13
million of accrued interest, which is part of “Accrued expenses” as reported in the Cytec
financial statements; and
Deferred taxes: the classification of deferred tax assets and deferred tax liabilities as reported in
the Cytec financial statements follows the classification of the asset or liability to which they
relate (as either current or non-current). Deferred taxes are presented as non-current on the
balance sheet in the Solvay financial statements. “Deferred tax assets” as reported in the Solvay financial statements include the current portion (US$35 million) and the non-current portion
(US$33 million) of deferred income taxes as reported in the Cytec financial statements, together

with US$4 million of deferred taxes on inter-company inventory transfer that are reported in
“Other current assets” in the Cytec financial statements. “Deferred tax liabilities” as reported in
the Solvay financial statements include the current portion (US$0.4 million) and the non-current
portion (US$34 million) of deferred income taxes as reported in the Cytec financial statements.
The most significant reclassifications made to Cytec income statements for the year ended December
31, 2014 and for the nine months ended September 30, 2015 are the following:
“Other (expense) income, net” under Cytec presentation (US$(6) million and US$(3) million for
the year ended December 31, 2014 and for the nine months ended September 30, 2015,
respectively) has been reclassified to “Other operating gains and losses”, except for items
identified as non-recurring according to the Solvay definition (US$3 million and US$2 million
for the year ended December 31, 2014 and for the nine months ended September 30, 2015,
respectively), which have been classified as “Non-recurring items”;
US$4 million of non-recurring items according to the Solvay definition have been reclassified
from “Administrative and general” as reported in the Cytec financial statements to “Non-
recurring items” as reported in the Solvay financial statements; and
“Amortization of acquisition intangibles” under the Cytec presentation has been reclassified to
“Other operating gains and losses” (US$14 million and US$10 million for the year ended
December 31, 2014 and for the nine months ended September 30, 2015, respectively).
3.2 Conversion from US GAAP to IFRS and accounting policies alignment
3.2.1 Adjustments
Cytec prepares its financial statements according to US GAAP. For the purpose of preparing the
Unaudited Pro Forma Consolidated Financial Information, Cytec historical financial information has been
adjusted for material known differences between US GAAP and IFRS. Some material differences could not
be estimated reliably; they have been described hereafter as part of the material known differences but have
not resulted in a pro forma adjustment for the reasons detailed below.
In addition, some differences have not been addressed as part of the conversion exercise when they
related to items that have been re-measured to fair value as part of the preliminary purchase price allocation
exercise, as described in Note 3.3.
The main known differences identified in the context of the preparation of the Unaudited Pro Forma
Consolidated Financial Information are the following:
Research and Development costs
Cytec performs research and development activities to develop value-added products and products
based on proprietary technologies.
Under U.S. GAAP, Cytec expenses all costs incurred related to its research and development
activities. Under IFRS, certain development costs may qualify as internally generated intangible assets if
the specific recognition criteria under IAS 38 Intangible Assets are met.
Cytec’s current monitoring and internal reporting processes related to research and development
activities do not allow for a proper tracking of costs incurred in the development phase that may qualify for
capitalization under IAS 38. As a result, the Unaudited Pro Forma Consolidated Financial Information has
not been adjusted to reflect this U.S. GAAP to IFRS difference.
Employee benefits
Cytec offers defined contribution and defined benefit plans to its employees.
Under US GAAP, Cytec elected to recognize the re-measurements of the net defined benefit liability
or asset in earnings and inventory in the period they occur, while under IFRS, re-measurements of the net
defined liability related to Pension Plans (while there is no such difference relating to Other post-
employment benefits) are fully recognized in Other Comprehensive Income (“OCI”). This difference
resulted in an expenses reversal net of tax of €36 million (€29 million in “cost of goods sold”, €14 million
in “commercial and administrative costs”, €4 million in “research and development costs” and a €11
million deferred tax effect) and €10 million (€14 million in “cost of goods sold” and a €4 million deferred
tax effect) in the unaudited pro forma consolidated income statements for the year ended December 31,
2014 and for the nine months ended September 30, 2015, respectively.
Cytec measures the plan assets and benefit obligations of its defined benefit plans only as of each
year-end closing date and as such no re-measurements of the net defined benefit liability or asset were
recognized for the nine months ended September 30, 2015. The €10 million effect in that period
corresponds to the reversal of that part of re-measurement that was recognized in inventory as of December
31, 2014 and was released to the historical income statement in the nine months period ended September
30, 2015.
The Unaudited Pro Forma Consolidated Financial Information has not been adjusted to reflect the
alignment of actuarial assumptions between Cytec and Solvay.
Provisions
Solvay management considers a provision recognized by Cytec in accordance with U.S. GAAP related
to possible claims for damages caused to be a possible obligation, as its existence will be confirmed only by
the occurrence or non-occurrence of one or more uncertain future events not wholly within the control of
Cytec. Consequently, this provision has been derecognized from the unaudited pro forma consolidated
statement of financial position as of September 30, 2015, for a total amount of €29 million in “Other long-
term provisions”.
Under IFRS, the amount recognized as a provision is the best estimate of the expenditure required to
settle the present obligation at the balance sheet date which is the amount that Cytec would rationally pay
to settle the obligation at the balance sheet date or to transfer it to a third party at that time. In instances
where there is a continuous range of possible outcomes, the use of mid-point of the range is used under
IFRS for measuring the provision when there is equal likelihood within the range as is the situation for one
of Cytec’s environmental provisions. As U.S. GAAP requires the use of the lower end of the range, an
additional liability of €4 million has been recognized in “Other long-term provisions” in the unaudited pro
forma consolidation statement of financial position as of September 30, 2015.
The corresponding tax effects of €7 million on the above adjustments have been reported in “deferred
tax assets”.
De-recognition of receivables
Certain long-term receivables representing reimbursements to be received from third parties in
relation to claims against Cytec and compensation for damages do not meet the criteria of virtually certain
under IAS 37 Provisions, contingent liabilities and contingent assets. These receivables have been
derecognized from the unaudited pro forma consolidated statement of financial position as of September
30, 2015 for a total amount of €46 million, of which €17 million in “loans and other non-current assets”
and €29 million in “other current receivables – Other”.
The corresponding tax effects of €12 million on the above adjustments have been reported in
“deferred tax liabilities”.
The de-recognition of the receivable recognized in “loans and other non-current assets” in the
unaudited pro forma consolidated statement of financial position as of September 30, 2015 resulted in a €2
million expense in “Cost of goods sold” in the unaudited pro forma consolidated income statement for the
nine months ended September 30, 2015, in connection with the reversal of the movement recognized in
Cytec historical income statement.
Share-based payment awards
In the context of the Acquisition, Cytec share-based payment awards outstanding as of the Acquisition
date have been assumed to be settled in cash, as described in note 3.3. Those share-based payment awards
have been analyzed, valued and recognized according to IFRS 3 Business Combinations. Therefore they
are not analyzed as part of the U.S. GAAP to IFRS conversion exercise.

Tax credits
Some deferred tax assets related to tax credits have been derecognized as Solvay considers revenue
forecasts over five years, except for financial companies where ten-year financial revenue forecasts are
highly predictable and are consequently used, while Cytec considered the expiry horizon of the tax credits,
which is longer than five years. This resulted in the de-recognition of deferred tax assets for an amount of
€17 million in the unaudited pro forma consolidated statement of financial position as of September 30,
2015 with no corresponding income statement effect.
3.2.2 Reclassifications
The classification of certain balance sheet positions differs between US GAAP and IFRS. For the
purpose of preparing the Unaudited Pro Forma Consolidated Financial Information, the following
reclassifications have been made to the unaudited pro forma consolidated statement of financial position as
at September 30, 2015:
Uncertain tax positions: under US GAAP, a liability for uncertain tax positions is classified as a
current liability only to the extent that cash payments are anticipated within 12 months of the
reporting date. Otherwise, such amounts are reflected as non-current liabilities. There is no
specific guidance under IFRS on the presentation of liabilities for uncertain tax positions.
Therefore uncertain tax positions balances have been reclassified to “Other short-term
provisions”. The US$6 million (€6 million) balance as at September 30, 2015 has been
reclassified from “other non-current liabilities” to “other short-term provisions”.
Debt issuance costs: under US GAAP, these costs are capitalized while they are presented as a
deduction of the related debt under IFRS. The US$6 million (€5 million) balance as at September
30, 2015 has been reclassified from “loans and other non-current assets” to “long-term financial
debt”.
In addition, interest cost and return on plan asset income in connection with post-employment benefits
have been reclassified from “Cost of goods sold”, “Commercial and administrative costs” and “Research
and development costs” to “Cost of discounting provisions” in the unaudited pro forma consolidated
income statements for the year ended December 31, 2014 for a total amount of US$1 million (€1 million)
and for the nine months ended September 30, 2015 for US$2 million (€2 million).
Subsequent to the Acquisition, further adjustments or reclassifications may prove to be required when
the Group obtains full access to the information of Cytec.
3.3 Preliminary purchase price allocation
The Acquisition has been accounted for as a business combination in accordance with IFRS 3
Business Combinations which requires that identifiable assets acquired and the liabilities assumed be
measured at their fair values as of the acquisition date.
Solvay appointed an external appraiser to perform a preliminary valuation of some of Cytec intangible
and tangible assets, as well as share-based payment awards. At this stage, the purchase price allocation is
preliminary and has not addressed, in particular, inventories and contingent liabilities. The fair value re-
measurement of inventory will affect in full the consolidated income statement after the Acquisition.
Regarding contingent liabilities, based on Cytec’s public disclosures and the limited access to Cytec
information given to Solvay’s advisors, the Group has not identified any material dispute or environmental
risk that would lead them to believe material contingent liabilities would need to be recognized in the
opening balance sheet. However, subsequent to the Acquisition, when the Group obtains full access to the
information of Cytec, recognition of such contingent liabilities in the fields of environmental, asset
retirement obligations and tax contingent risks may be identified and recognized in accordance with the
requirements of IFRS 3 Business Combinations.
The excess of the consideration transferred, as defined in note 4.1, over the fair value of the
identifiable assets acquired and the liabilities assumed has been recognized as goodwill. However, the
purchase price allocation adjustments are preliminary and have been made solely for the purpose of
preparing the Unaudited Pro Forma Consolidated Financial Information, and as such are hypothetical and
subject to revision based on a final determination of fair values after the effective date of the Acquisition.
Intangible and tangible assets
The fair value of the intangible assets recognized in the Unaudited Pro Forma Consolidated Financial
Information mainly consists of acquired customer relationships for €1,758 million and acquired
technologies for €687 million. The related amortization charge is recognized in “Other operating gains and
losses” for €123 million and €109 million, for the year ended December 31, 2014 and the nine months
ended September 30, 2015, respectively. Tangible assets have been revalued for €117 million. The
depreciation charge of tangible assets has been recognized in “Cost of goods sold” and “Research and
development costs” (€22 million and €2 million, respectively, for the year ended December 31, 2014, and
€5 million and €0 million, respectively, for the nine months ended September 30, 2015).
Previous assets recognized in Cytec consolidated financial statements arising, in particular, from
Cytec past acquisitions have been derecognized for €616 million. They consist in goodwill for €448
million, intangible assets for €165 million and tangible assets for €3 million.
Share-based payment awards
At the date of Acquisition, Cytec has outstanding share-based payment transactions in the form of
stock options, equity-settled stock appreciation rights, restricted stocks, restricted stock units and deferred
stocks. Based on the terms of the Agreement and Plan of Merger, those transactions will be cancelled and
converted into a right to receive cash, either on the Acquisition date or on a deferred basis.
In accordance with IFRS 3 Business Combinations, amounts attributable to pre-combination services
have been accounted for as part of the consideration transferred while amounts attributable to post-
combination services have been recognized as expense, classified as Cost of goods sold, Commercial and
administrative costs, and Research and development costs, in the unaudited pro forma consolidated income
statements for the year ended December 31, 2014 and the nine months ended September 30, 2015.
The fair value of the instruments before the modification arising from the Acquisition has been
determined using a standard option pricing model (Black & Scholes) based on a share price of US$75.25,
whereas the fair value of the instruments after the plans modification has been assessed based on the
amount of cash to be received according to the terms of the Agreement and Plan of Merger.
As indicated in note 4.1, the analysis and assessment of the share-based payment awards has resulted
in the recognition of an additional consideration of US$179 million (€160 million), and a compensation
cost of US$19 million (€14 million) for the year ended December 31, 2014 and US$2 million (€2 million)
for the nine months ended September 30, 2015, with a corresponding deferred tax effect of US$7 million
(€5 million) and US$1 million (€1 million), respectively. The compensation cost, gross of tax, has been
recorded in Cost of goods sold for US$6 million (€4 million) for the year ended December 31, 2014 and
US$1 million (€1 million) for the nine months ended September 30, 2015, in Commercial and
administrative costs for US$13 million (€10 million) and US$1 million (€1 million), respectively, and in
Research and development costs for US$1 million (€1 million) and US$0 million (€0 million), respectively.
The majority of payroll charges have been accrued based on a US tax regime where the social security
rate amounts to 6.2% and the social security charges are capped at US$118,500 per year and per
beneficiary, and a rate of 1.45% for the other social charges. Actual amounts may differ from this estimate
when social charges are processed through the payroll, and all the country-specific regimes apply. They
have been recognized in “other current liabilities” for €6 million in the unaudited pro forma consolidated
statement of financial position as of September 30, 2015.
A portion of share-based payment awards that is included in the consideration transferred will not be
settled in cash upon Acquisition. That portion has been classified as “other non-current liabilities” for €12
million and as “other current liabilities” for €30 million in the unaudited pro forma consolidated statement
of financial position as of September 30, 2015, with a counterpart in “Cash and cash equivalents” as they
represent that portion of the consideration transferred that will not be settled in cash on the Acquisition
date.
For the purpose of preparing the Unaudited Pro Forma Consolidated Financial Information, the
historical compensation charge recognized by Cytec in its historical consolidated income statements for the
year ended December 31, 2014 and the nine months ended September 30, 2015 has been eliminated,
resulting in a US$11 million (€9 million) and a US$10 million (€9 million) adjustment, respectively. The
corresponding deferred tax effects amount to US$4 million (€3 million) and US$3 million (€3 million),
respectively. The historical compensation charge, gross of tax, has been eliminated from Cost of goods sold
for US$3 million (€2 million) and US$3 million (€3 million), respectively, in Commercial and

administrative costs for US$8 million (€6 million) and US$6 million (€6 million), respectively, and in
Research and development costs for US$1 million (€1 million) and US$1 million (€0 million), respectively.
Deferred taxes
A net deferred tax liability of €621 million on the above purchase price allocation adjustments (a
deferred tax liability of €769 million on the fair value of intangible assets and the step-up on tangible
assets, a deferred tax asset and reduction of deferred tax liability of €114 million on the de-recognition of
previous assets recognized by Cytec, and a net deferred tax asset of €34 million on share-based payment
awards) have been determined for the purpose of the Unaudited Pro Forma Consolidated Financial
Information based on tax rates described in Note 1.
Goodwill
The resulting preliminary goodwill has been recognized for an amount of €2,520 million,
corresponding to the remaining balance not allocated as part of the preliminary purchase price allocation
exercise, as follows:
(in €million)
Historical net assets of Cytec under IFRS 1,126
De-recognition of historical assets (616)
Fair value adjustments to intangible assets resulting from the preliminary purchase price
allocation
2,445
Fair value adjustments to tangible assets resulting from the preliminary purchase price
allocation
117
Share-based payment awards adjustments (6)
Deferred tax effect on the above adjustments (621)
Total fair value of identifiable assets acquired and liabilities assumed 2,445
Total consideration transferred 4,965
Preliminary goodwill 2,520
4. Pro forma adjustments
Pro forma adjustments are based upon available information and certain preliminary estimates and
assumptions which are believed to be reasonable, as well as certain pro forma assumptions. In particular it
is assumed that the Financing (as defined in note 4.2 of the Unaudited Pro Forma Consolidated Financial
Information) has taken place on January 1, 2014 with respect to the unaudited pro forma consolidated
income statements, and as of September 30, 2015 with respect to the unaudited pro forma consolidated
statement of financial position.
The Unaudited Pro Forma Consolidated Financial Information does not reflect adjustment or tax effect
that would result from either the exit of Cytec entities from their tax consolidation groups, or the
Acquisition, including but not limited to, tax losses carried forward that would be lost upon change of
control or that would, on the contrary, become realizable.
4.1 Determination of the consideration transferred
In the Unaudited Pro Forma Consolidated Financial Information, the consideration transferred for the
Acquisition is based on (i) the outstanding number of Cytec shares as of September 30, 2015 and the share
price that the Group agreed to pay pursuant to the Agreement and Plan of Merger dated July 28, 2015 between Solvay SA and Cytec Industries Inc., and (ii) that portion of the fair value of share-based payment
awards that will be included in the consideration in accordance with IFRS 3 Business Combinations.

As of September 30, 2015, the number of outstanding shares of Cytec’s common stock, other than
shares held by Cytec as treasury stock amounts to 71,547,119. On the date of Acquisition, these shares will
be converted into the right to receive US$75.25 in cash, without interest. The consideration thus determined
amounts to US$5,384 million.
In addition, share-based payment awards have been included in the consideration transferred for an
amount of US$179 million (€160 million), as discussed in note 3.3.
Total consideration used for the preparation of the Unaudited Pro Forma Consolidated Financial
Information amounts to US$5,563 million. In the unaudited pro forma consolidated statement of financial
position as of September 30, 2015, the consideration of US$5,563 million used to determine the
preliminary goodwill has been converted at the closing rate, resulting in a purchase price of €4,965 million.
4.2 Description and accounting treatment of the Financing of the Acquisition
The Unaudited Pro Forma Consolidated Financial Information has been prepared assuming that the
consideration transferred for the Acquisition will be fully financed by the following financing
arrangements:
a rights issue by Solvay SA (the “Rights Issue”) for a total amount of €1,500 million,
Euro hybrid bonds, to be issued by Solvay Finance SA, a French subsidiary of Solvay SA,
with the guarantee of Solvay SA, for a total amount of €1,000 million,
Euro senior notes, to be issued by Solvay SA, for a total amount of €1,100 million, and
US dollar 144A senior notes, to be issued by Solvay Finance (America) LLC, a US subsidiary
of Solvay SA, with a guarantee of Solvay SA, for a total amount of US$1,900 million (€1,696
million),
together referred to as the “Financing”.
An additional €900 million is expected to be issued in the form of Euro senior notes to partially
refinance existing short-term and long-term financial debts. The refinancing has not been reflected in the
unaudited pro forma consolidated statement of financial position as it is not directly attributable to the
Acquisition. As a result, the €900 million have been recognized as a long-term financial debt against an
increase in the cash position of the Group in the unaudited pro forma consolidated statement of financial
position. However the related interest expense has been added to, and the interest expense of the refinanced
debt has been removed from, the unaudited consolidated income statements for the year ended December
31, 2014 (€23 million and €43 million, respectively) and for the nine months ended September 30, 2015
(€18 million and €33 million, respectively).
The excess of the funds raised through the Financing over the consideration transferred is assumed to
finance, in particular, the acquisition costs and the transaction costs, together with that part of share-based
payment awards that will be paid on the Acquisition date but which does not form part of the consideration
transferred (recognized as a post-combination expense).
Assumptions made to reflect the Financing in the Unaudited Pro Forma Consolidated Financial
Information, together with the corresponding accounting treatments are described below.
At the date of issue of the Unaudited Pro Forma Consolidated Financial Information, the funds related
to the Financing have not yet been raised and the rights issue has not yet been approved by Solvay
shareholders meeting to be held on November 17, 2015. Therefore actual amounts may vary from the
estimated amounts depending on several factors, including, among other things, (i) the share price for the
Rights Issue, (ii) differences in the financing conditions eventually obtained for the bonds and notes, (iii)
the timing of realization of each financing arrangement, and (iv) differences between the estimate and
actual fees and expenses.
Rights Issue

Under the assumption that all shares are subscribed, the gross proceeds from the Rights Issue amount
to €1,500 million. Directly attributable transaction costs have been assessed at €23 million and analyzed as
entirely tax deductible but no tax effect has been recognized as discussed in note 1. Transaction costs have
been recognized directly in equity.
The Unaudited Pro Forma Consolidated Financial Information does not reflect the effect of additional
dividends that will be paid to Solvay shareholders as a result of the capital increase arising from the rights
issue.
EUR Hybrid Bonds
These bonds qualify as an equity instrument in accordance with IAS 32 Financial Instruments:
Presentation. The classification of the EUR hybrid bonds in equity is mainly based on the discretionary
nature of all payments:
no maturity (perpetual bond) as, at every reset date, the issuer has a call option, rather than a
contractual obligation, to redeem the instrument;
at the option of the issuer, interest payments can be deferred indefinitely.
Directly attributable transaction costs have been assessed at €9 million and analyzed as entirely tax
deductible but no tax effect has been reflected as discussed in note 1. They have been recognized directly in
equity.
EUR Senior Notes and USD Senior Notes
The issuance of senior notes for an amount of €1,100 million and US$1,900 million (€1,696 million),
respectively have been reflected in the Unaudited Pro Forma Consolidated Financial Information in the
long-term financial debt.
The related interest expense for the EUR Senior Notes and the USD Senior Notes amount to €24
million and €59 million, respectively, for the year ended December 31, 2014, and €18 million and €53
million, respectively, for the nine months ended September 30, 2015. They have been reported in “Cost of
borrowings”.
The transaction costs directly related to the debt issuances have been deducted from the pro forma
long-term financial debt as of September 30, 2015 for €10 million for the EUR Senior Notes and €9 million
for the USD Senior Notes. Transaction costs have been analyzed as entirely tax deductible. However no tax
effect has been recognized on the transaction costs related to the EUR Senior Notes, as discussed in note 1.
With respect to the USD Senior Notes, a deferred tax liability and a current tax receivable of €3 million,
calculated at a 38% tax rate, have been recognized.
The estimated amount of the USD Senior Notes, which are US dollar-denominated, has been
converted into euros using the closing exchange rate at September 30, 2015.
Bridge loan
To secure the financing for the Acquisition of Cytec, a bridge loan agreement was put in place on July
29, 2015 for a maximum amount of US$5,800 million, over a one-year period, with an optional twelve-
month extension. For the purposes of the Unaudited Pro Forma Consolidated Financial Information, it has
been assumed that this Bridge Loan Facility will not be drawn.
However, related underwriting and syndication fees for a total amount of US$20 million (€18 million
converted at the closing exchange rate at September 30, 2015) have been incurred in August 2015 and
spread over the duration of the loan; an amount of €8 million (less a €3 million tax impact) is therefore
included in Solvay historical consolidated financial statements for the nine months ended September 30,
2015. For the purpose of the Unaudited Pro Forma Consolidated Financial Information, the total amount of
fees has been reflected in the unaudited pro forma consolidated income statement for the year ended
December 31, 2014 (€18 million) and €8 million have been eliminated from Solvay’s historical
consolidated income statement for the nine months ended September 30, 2015. These costs are not
expected to have a recurring impact on the Group operating performance going forward. They have been
reported in “Non-recurring items”.
4.3 Acquisition costs

The total estimated costs related to the Acquisition amount to €91 million, before tax, and mainly
include banking, legal, consulting and notary fees, as well as the cost of the contingent forward instrument.
On July 29, 2015, Solvay entered into a foreign exchange forward contract to hedge US$1,880 million
of the expected purchase price, contingent upon the realization of the Acquisition. On the Acquisition date,
Solvay will pay a €33 million contingency premium when it settles the instrument. This hedge matures in
April 2016.
Certain costs were already included in the historical financial statements of the Group. They amounted
to €33 million for the nine months ended September 30, 2015. For the purpose of preparing the Unaudited
Pro Forma Consolidated Financial Information, these costs have been removed from the unaudited pro
forma consolidated income statement for the nine months ended September 30, 2015, and reflected in the
unaudited pro forma consolidated income statement for the year ended December 31, 2014.
Based on a preliminary analysis, €75 million of these costs have been considered tax deductible.
Depending on the country where each cost has been incurred, the corresponding rate as described in note 1
has been applied, resulting in a €18 million tax benefit.
Acquisition costs are recognized as non-recurring items and hence do not impact the Group recurring
operating performance. By their nature, they are not expected to have a recurring impact on the Group
performance going forward.
RESTRICTIONS
This document does not constitute an offer to sell, or a solicitation of offers to purchase or subscribe
for, securities in the United States or any other jurisdiction. The securities referred to herein have not been,
and will not be, registered under the Securities Act of 1933, as amended, and may not be offered, exercised
or sold in the United States or to U.S. persons absent registration or an applicable exemption from
registration requirements. There is no intention to register any portion of the offering in the United States or
to conduct a public offering of securities in the United States.
The issue, exercise or sale of securities in the offering are subject to specific legal or regulatory
restrictions in certain jurisdictions. The Company assumes no responsibility in the event there is a violation
by any person of such restrictions.
The information contained herein shall not constitute or form part of an offer to sell or the solicitation
of an offer to buy, nor shall there be any sale of the securities referred to herein, in any jurisdiction in which
such offer, solicitation or sale would be unlawful.
The Company has not authorized any offer to the public of securities in any Member State of the
European Economic Area. With respect to each Member State of the European Economic Area and which
has implemented the Prospectus Directive (each, a “Relevant Member State”), no action has been
undertaken or will be undertaken to make an offer to the public of securities requiring publication of a
prospectus in any Relevant Member State, other than with respect to the rights offering in Belgium and
France. As a result, other than with respect to the rights offering in Belgium and France, the securities may
only be offered in Relevant Member States (a) to any legal entity which is a qualified investor as defined in
Article 2(1)(e) of the Prospectus Directive; or (b) in any other circumstances which do not require the
publication by the Company of a prospectus pursuant to Article 3 of the Prospectus Directive. For the
purposes of this paragraph, the expression an “offer of securities to the public” means the communication
in any form and by any means of sufficient information on the terms of the offer and the securities to be
offered so as to enable an investor to decide to exercise, purchase or subscribe the securities, as the same
may be varied in that Member State by any measure implementing the Prospectus Directive in that Member
State and the expression “Prospectus Directive” means Directive 2003/71/EC (and amendments thereto,
including the 2010 PD Amending Directive, to the extent implemented in the Relevant Member State), and
includes any relevant implementing measure in the Relevant Member State and the expression “2010 PD
Amending Directive” means Directive 2010/73/EU.
This communication is directed only at (i) persons who are outside the United Kingdom or (ii) in the
United Kingdom, persons who have professional experience in matters relating to investments falling within Article 19(5) of the Financial Services and Markets Act 2000 (Financial Promotion) Order 2005, as
amended (the “Order”), or who are high net worth entities, and other persons to whom it may lawfully be

communicated, falling within Article 49(2) of the Order (all such persons together being referred to as
“relevant persons”). Any investment or investment activity to which this communication relates will only
be available to and will only be engaged in with, relevant persons. Any person who is not a relevant person
must not act or rely on this document or any of its contents.