unaudited consolidated financial statements of the krka ... · unaudited consolidated financial...
TRANSCRIPT

Unaudited consolidated f inancial statements of the Krka Group and unaudited f inancial
statements of Krka, d. d. , Novo mesto for 2017 with relevant notes
Krka, d. d., Novo mesto

Unaudited consolidated financial statements of the Krka Group and unaudited financial statements of Krka, d. d., Novo mesto for 2017
2
CONTENTS
Information on the Krka Group ................................................................................................................................ 3
Financial Highlights of the Krka Group and Krka Company .................................................................................... 4
Business Operations Analysis ................................................................................................................................. 5
Sales ..................................................................................................................................................................... 11
Research and Development .................................................................................................................................. 14
Investments ........................................................................................................................................................... 16
Employees ............................................................................................................................................................. 17
Investor and Share Information ............................................................................................................................. 18
Plans for 2018 ....................................................................................................................................................... 18
Unaudited Consolidated Statement of Financial Position of the Krka Group ......................................................... 19
Unaudited Consolidated Income Statement of the Krka Group ............................................................................. 20
Unaudited Consolidated Statement of Other Comprehensive Income of the Krka Group ..................................... 20
Unaudited Consolidated Statement of Changes in Equity of the Krka Group for 2017 ......................................... 21
Unaudited Consolidated Statement of Changes in Equity of the Krka Group for 2016 ......................................... 22
Unaudited Consolidated Statement of Cash Flows of the Krka Group .................................................................. 23
Unaudited Statement of Financial Position of Krka, d. d., Novo mesto ................................................................. 24
Unaudited Income Statement of Krka, d. d., Novo mesto ...................................................................................... 25
Unaudited Statement of Other Comprehensive Income of Krka, d. d., Novo mesto .............................................. 25
Unaudited Statement of Changes in Equity of Krka, d. d., Novo mesto for 2017 .................................................. 26
Unaudited Statement of Changes in Equity of Krka, d. d., Novo mesto for 2016 .................................................. 27
Unaudited Statement of Cash Flows of Krka, d. d., Novo mesto ........................................................................... 28

Unaudited consolidated financial statements of the Krka Group and unaudited financial statements of Krka, d. d., Novo mesto for 2017
3
Based on provisions of Article 386 of the Financial Instruments Market Act, Krka, d. d., Šmarješka cesta 6, 8501 Novo mesto hereby presents
RELEVANT NOTES TO UNAUDITED CONSOLIDATED FINANCIAL STATEMENTS OF THE KRKA GROUP AND UNAUDITED FINANCIAL STATEMENTS OF
KRKA, D. D., NOVO MESTO FOR 2017
Unaudited consolidated financial statements of the Krka Group and unaudited financial statements of Krka, d. d., Novo mesto for 2017 as well as comparable data for 2016 have been prepared in accordance with the International Financial Reporting Standards (IFRS). The comparable 2016 statements have been audited.
Krka, d. d., Novo mesto has no authorised capital and has not made a conditional share capital increase.
Information on the Krka Group
Krka, d. d., Novo mesto (hereinafter the Krka Company) is the controlling company of the Krka Group, which comprised the following companies on 31 December 2017: Ownership share of the
controlling company 31 Dec 2017 (in %)
TERME KRKA, d. o. o., Novo mesto 100 Farma GRS, d. o. o., Novo mesto 99.7 KRKA-FARMA d.o.o., Zagreb, Croatia 100 KRKA ROMANIA S.R.L., Bucharest, Romania 100 KRKA-FARMA DOO BEOGRAD, Belgrade, Serbia 100 KRKA-FARMA DOOEL Skopje, Skopje, Macedonia 100 KRKA Bulgaria EOOD, Sofia, Bulgaria 100 KRKA FARMA d.o.o., Sarajevo, Sarajevo, Bosnia and Herzegovina 100 KRKA-RUS LLC, Istra, Russian Federation 100 KRKA FARMA LLC, Istra, Russian Federation 100 KRKA UKRAINE LLC, Kiev, Ukraine 100 LLC "KRKA Kazakhstan", Almaty, Kazakhstan 100 KRKA - POLSKA Sp. z o.o., Warsaw, Poland 100 KRKA ČR, s. r. o., Prague, Czech Republic 100 KRKA Magyarország Kft., Budapest, Hungary 100 KRKA Slovensko, s.r.o., Bratislava, Slovakia 100 UAB KRKA Lietuva, Vilnius, Lithuania 100 SIA KRKA Latvija, Riga, Latvia 100 TAD Pharma GmbH, Cuxhaven, Germany 100 Krka Sverige AB, Stockholm, Sweden 100 KRKA Pharma GmbH, Wien, Vienna, Austria 100 KRKA Farmacêutica, Unipessoal Lda., Estoril, Portugal 100 KRKA FARMACÉUTICA, S.L., Madrid, Spain 100 KRKA Farmaceutici Milano S.r.l., Milan, Italy 100 KRKA France Eurl, Paris, France 100 KRKA PHARMA DUBLIN LIMITED, Dublin, Ireland 100 KRKA Belgium, SA, Brussels, Belgium 95 Krka Finland Oy, Espoo, Finland 100 KRKA UK LTD, London, United Kingdom 100 KRKA USA LLC, Wilmington, USA 100 Ningbo Krka Menovo Pharmaceutical Company Limited* 60
* In the process of being established on 31 December 2017, establishment procedure was completed at the beginning of January 2018
The subsidiary Terme Krka, d. o. o., held a 71.1 percent interest in Golf Grad Otočec, d. o. o. at 31 December 2017; Farma GRS, d. o. o. held a 100 percent interest in its subsidiaries GRS TEHFARMA, d. o. o., GRS VIZFARMA, d. o. o., GRS PREK FARMA, d. o. o., GRS EKO FARMA, d. o. o., GRS TREN FARMA, d. o. o., and GRS VRED FARMA, d. o. o.; and the subsidiary Krka France Eurl held a 5 percent interest in subsidiary KRKA Belgium, SA.

Unaudited consolidated financial statements of the Krka Group and unaudited financial statements of Krka, d. d., Novo mesto for 2017
4
Financial Highlights of the Krka Group and Krka Company
Krka Group Krka Company
In € thousand 2017 2016 2017 2016
Revenues 1,266,392 1,174,424 1,197,756 1,071,709 Operating profit (EBIT)1 198,741 122,435 196,953 98,920 EBITDA 306,638 228,238 278,627 180,685 Net profit 152,576 108,456 153,730 102,872 R&D expenses 125,864 117,994 131,201 122,874 Investments 105,088 131,817 85,332 80,663
31 Dec 2017 31 Dec 2016 31 Dec 2017 31 Dec 2016
Non-current assets 1,033,008 1,038,067 1,032,595 1,024,176 Current assets 886,123 873,451 804,887 813,527 Equity 1,487,699 1,444,444 1,493,325 1,440,448 Non-current liabilities 121,182 115,313 87,911 81,691 Current liabilities 310,250 351,761 256,246 315,564
RATIOS 2017 2016 2017 2016
EBIT margin 15.7% 10.4% 16.4% 9.2% EBITDA margin 24.2% 19.4% 23.3% 16.9% Net profit margin 12.0% 9.2% 12.8% 9.6% Return on equity (ROE)2 10.4% 7.6% 10.5% 7.2% Return on assets (ROA)3 8.0% 5.8% 8.4% 5.7% Liabilities/Equity 0.290 0.323 0.230 0.276 R&D expenses/Revenues 9.9% 10.0% 11.0% 11.5%
NUMBER OF EMPLOYEES 2017 2016 2017 2016
Year-end 10,832 10,889 5020 4889 Average 10,823 10,774 4911 4845
SHARE INFORMATION 2017 2016
Total number of shares issued 32,793,448 32,793,448 Earnings per share (EPS) in €4 4.74 3.35 Dividend per share in € 2.75 2.65 Closing price at the end of the period in €5 57.50 52.90 Price/Earnings ratio (P/E) 12.14 15.81 Book value in €6 45.37 44.05 Price/Book value (P/B) 1.27 1.20 Market capitalisation in € thousand (31 Dec) 1,885,623 1,734,773
1 The difference between operating income and expenses
2 Net profit/Average shareholders' equity in the year 3 Net profit/Average total assets in the year 4 Profit of the year attributable to equity holders of the controlling company/Average number of shares issued in the year, exclusive of treasury shares 5 Share price on the Ljubljana Stock Exchange
6 Equity at the end of the year/Total number of shares issued

Unaudited consolidated financial statements of the Krka Group and unaudited financial statements of Krka, d. d., Novo mesto for 2017
5
Business Operations Analysis
Operating income
In 2017, the Krka Group sold products and services worth €1,266.4 million, which is the highest annual sales in its history and €92 million or 8% more than in 2016. Over the past five years, average sales growth reached 5.5% in terms of volume, and 2.1% in terms of value.
Other operating income amounted to €10.4 million, an increase of €2.6 million or 33% compared to 2016.
Operating expenses
The Krka Group incurred operating expenses totalling €1,078.1 million, up €18.2 million or 2% compared to 2016. The Krka Company incurred €1,005.7 million in operating expenses, up 3% compared to 2016.
The Krka Group's operating expenses included costs of goods sold, totalling €538.5 million, selling and distribution expenses of €340.5 million, research and development expenses in the amount of €125.9 million, and general and administrative expenses of €73.2 million. The operating expenses to sales ratio was 85% and, in the past five years, ranged between 82% in 2013 and 90% in 2016.
The biggest operating expense item of the Krka Group is costs of goods sold, which declined by 2% compared to 2016; its ratio to sales was 43%, while it accounted for 47% in 2016. Product portfolio and change in the value of inventories of work in progress and finished products influence the total costs of goods sold. Selling and distribution expenses increased by 7% in comparison to the year before, while accounting for 27% of total sales, which is the same as in 2016. Research and development expenses amounted to 10% of total sales, the same as in 2016 and up 7% compared to 2016. General and administrative expenses amounted to 6% of total sales, a decrease of 5% compared to 2016, while their ratio to sales dropped by one percentage point.
The Krka Company's operating expenses included a total of €511.9 million for costs of goods sold, selling and distribution expenses of €304.0 million, research and development expenses in the amount of €131.2 million, and general and administrative expenses of €58.6 million.
The biggest operating expense item of the Krka Company is costs of goods sold, which remained at the 2016 level; its ratio to sales was 43%, while it accounted for 48% in 2016. Product portfolio and change in the value of inventories of work in progress and finished products primarily influence the total costs of goods sold. Selling and distribution expenses increased by 8% in comparison to the year before, while accounting for 25% of total sales, which is one percentage point less than in 2016. The same as in 2016, research and development expenses amounted to 11% of total sales and were up 7% compared to 2016. General and administrative expenses

Unaudited consolidated financial statements of the Krka Group and unaudited financial statements of Krka, d. d., Novo mesto for 2017
6
amounted to 5% of total sales, a decrease of 5% compared to 2016, while their ratio to sales dropped by one percentage point.
Financial income and expenses
Krka Group Krka Company
In € thousand 2017 2016 2015 2014 2013 2017 2016 2015 2014 2013
Financial income 24,041 65,679 25,561 1,486 2,114 24,908 78,225 36,735 9,178 5,316 Financial expenses
-46,608 -71,816 -44,283 -103,126 -28,361 -46,599 -72,733 -43,524 -112,313 -28,967
Net financial result
-22,567 -6,137 -18,722 -101,640 -26,247 -21,691 5,492 -6,789 -103,135 -23,651
In 2017, the Krka Group's net financial result amounted to €-22.6 million, while the net financial result of the Krka Company totalled €-21.7 million.
Currency exposure arises due to a surplus of assets over liabilities in a particular currency in the financial position statement of the Group, also referred to as the long position. The key accounting categories composing a long position are trade receivables, payables to suppliers, and subsidiary funding by the controlling company.
The Krka Group generally mitigates currency risks by natural hedging, primarily by increasing purchases and liabilities in currencies in which sales invoices are issued. When this is not possible, we use derivative financial instruments, or do not provide hedging for the risk. Generally, forward contracts are used for hedging.
Krka continued with its policy of partial hedging against the rouble-related risk in 2017. It generated negative financial result from the forward contracts. The cost of hedging against the Russian rouble is accrued due to the differences between the interest rates in the rouble and the euro. Partial hedging ensured a more stable net financial result of the Krka Group, while the hedging costs were half lower than they would have been had we used hedging throughout the year.
Due to the fall of the rouble value from the beginning until the end of the year, we generated net foreign exchange losses of €–18.0 million. The exposure to other currencies was not hedged. The currency risk management balance in 2017 totalled €-22.5 million.
Financial income of the Krka Group includes interest income in total of €0.9 million and income from dividends and other shares of the profit in total of €1.0 million. Financial expenses comprise interest expenses for borrowings in the amount of €0.2 million and €1.8 million worth other financial expenses.
Financial income of the Krka Company includes interest income in total of €0.7 million and income from dividends and other shares of the profit in a total of €2.0 million. Financial expenses comprise interest expenses for borrowings in the amount of €0.9 million and €1.4 million of other financial expenses. The currency risk management balance of the Krka Company in 2017 totalled €-22.2 million.

Unaudited consolidated financial statements of the Krka Group and unaudited financial statements of Krka, d. d., Novo mesto for 2017
7
Operating results
Operating profit and net profit
Operating profit (EBIT) of the Krka Group totalled €198.7 million, up €76.3 million or 62% compared to 2016. The reason is relatively higher sales growth against the operating expenses, and product mix. The Krka Group generated operating profit increased by amortisation and depreciation (EBITDA) in the amount of €306.6 million, up by €78.4 million or 34%.
Operating profit (EBIT) of the Krka Company amounted to €197.0 million, while operating profit increased by amortisation and depreciation (EBITDA) of the Krka Company was €278.6 million.
Profit before tax of the Krka Group grew by €59.9 million or 51% and totalled €176.2 million in 2017. The effective tax rate of the Krka Group was 13.4%. Profit before tax of the Krka Company amounted to €175.3 million.
The Krka Group generated net profit of €152.6 million, an increase of € 44.1 million or 41% compared to 2016. Net profit of the Krka Company reached €153.7 million.
Assets
Krka Group Krka Company
In € thousand 2017 Share (in %) 2016
Share (in %)
Index 2017/16 2017
Share (in %) 2016
Share (in %)
Index 2017/16
Non-current assets
1,033,008 53.8 1,038,067 54.3 100 1,032,595 56.2 1,024,176 55.7 101
Property, plant and equipment
864,842 45.0 874,100 45.7 99 611,341 33.3 609,543 33.2 100
Intangible assets 110,992 5.8 113,511 5.9 98 28,299 1.5 29,302 1.6 97 Investments and loans
18,358 1.0 18,939 1.0 97 341,899 18.6 349,623 19.0 98
Other 38,816 2.0 31,517 1.7 123 51,056 2.8 35,708 1.9 143
Current assets 886,123 46.2 873,451 45.7 101 804,887 43.8 813,527 44.3 99
Inventories 310,671 16.2 280,653 14.7 111 264,174 14.4 236,214 12.9 112
Trade receivables 500,735 26.1 510,406 26.7 98 456,265 24.8 479,234 26.1 95
Other 74,717 3.9 82,392 4.3 91 84,448 4.6 98,079 5.3 86
Total assets 1,919,131 100.0 1,911,518 100.0 100 1,837,482 100.0 1,837,703 100.0 100
At the end of 2017, the Krka Group assets amounted to €1,919.1 million, an increase of €7.6 million or 0.4% compared to the end of 2016. The proportion between non-current and current assets in the total asset structure was negligibly different compared to the end of 2016: non-current assets decreased by 0.5 of a percentage point, accounting for 53.8%.

Unaudited consolidated financial statements of the Krka Group and unaudited financial statements of Krka, d. d., Novo mesto for 2017
8
At the end of 2017, the Krka Company’s assets totalled €1,837.5 million, €0.2 million less than at the end of 2016. The proportion between non-current and current assets in total asset structure was slightly different compared to the end of 2016: non-current assets increased by 0.5 of a percentage point, accounting for 56.2%.
Non-current assets of the Krka Group amounted to €1,033.0 million, down €5.1 million or 0.5% compared to the end of 2016. The most important item in the Krka Group's asset structure was property, plant and equipment (PPE) in total of €864.8 million or 45% (of which the Krka Company's PPE accounted for €611.3 million or 71% of the Krka Group's PPE). Intangible assets worth €111.0 million accounted for 6% of total assets (of which the Krka Company's assets accounted for €28.3 million or 25% of the Krka Group's intangible assets). Non-current loans of the Krka Group totalled €9.5 million or 0.5% of the total Krka Group's assets.
Current assets of the Krka Group amounted to €886.1 million, up €12.7 million or 1% compared to the end of 2016. Trade receivables due from customers outside the Krka Group totalled €500.7 million (of which the Krka Company accounted for €191.1 million or 38% of trade receivables due from customers outside the Krka Group), and inventories €310.7 million. In order to ensure sufficient quantities of a large number of various products in accordance with the needs of over 70 markets, the inventories increased. The current loans of the Krka Group amounted to €1.4 million.
Non-current assets of the Krka Company totalled €1,032.6 million, up €8.4 million or 1% compared to the end of 2016. The most important item in the amount of €611.3 million was property, plant and equipment, which accounted for one third of total assets of the Krka Company. Investments in subsidiaries amounted to €321.9 million or 18% of the Krka Company's assets, while trade receivables due from subsidiaries totalled €38.6 million or 2% of the assets of the Krka Company. Intangible assets in the value of €28.3 million accounted for 2% of total assets. Non-current loans of the Krka Company totalled €11.2 million or 0.6% of the total Krka Company's assets.
Current assets of the Krka Company amounted to €804.9 million, €8.6 million or 1% decrease compared to the end of 2016. Trade receivable totalled €456.3 million, while inventories amounted to €264.2 million. Current loans of the Krka Company totalled €34.9 million or 2% of the total Krka Company's assets.
Equity and liabilities
Krka Group Krka Company
In € thousand 2017 Share (in %) 2016
Share (in %)
Index 2017/16 2017
Share (in %) 2016
Share (in %)
Index 2017/16
Equity 1,487,699 77.5 1,444,444 75.6 103 1,493,325 81.3 1,440,448 78.4 104 Non-current liabilities
121,182 6.3 115,313 6.0 105 87,911 4.8 81,691 4.4 108
Current liabilities 310,250 16.2 351,761 18.4 88 256,246 13.9 315,564 17.2 81 Total equity and liabilities
1,919,131 100.0 1,911,518 100.0 100 1,837,482 100.0 1,837,703 100.0 100
As at 31 December 2017, the Krka Group’s equity saw a €43.3 million or 3% increase compared to the end of 2016. The increase was attributed to the Krka Group's net profit of €152.6 million. Equity was reduced by the dividends paid in total of €88.6 million, further repurchase of treasury shares in the amount of €10.9 million, and other comprehensive income after tax totalling €-9.7 million. Translation reserves of €-8.4 million accounted for the largest item of that amount (foreign exchange losses arising from the translation of individual items of the financial statements of foreign operations into the reporting currency).
The provisions of the Krka Group totalled €98.1 million (of which post-employment and other non-current employee benefits accounted for €92.7 million, provisions for lawsuits €4.5 million, and other provisions €0.9 million). Compared to the end of 2016, the 8% increase may be attributed primarily to the actuarial increase of provisions for post-employment and other non-current employee benefits of €2.7 million and provisions for lawsuits of €4.3 million, of which €4.0 million for potential lawsuits relating to intellectual property of the controlling company.

Unaudited consolidated financial statements of the Krka Group and unaudited financial statements of Krka, d. d., Novo mesto for 2017
9
Among current liabilities of the Krka Group, trade payables dropped by €20.1 million (of which payables to foreign suppliers accounted for €16.9 million and payables to domestic suppliers €2.5 million), while other current liabilities decreased by €35.9 million (of which accrued discounts on products sold accounted for €24.4 million and derivative financial instruments €12.4 million).
The Krka Group recorded no current or non-current borrowings at the end of 2017.
As at 31 December 2017, the Krka Company’s equity increased by €52.9 million or 4% compared to the end of 2016. The increase was attributed to the Krka Company's net profit of €153.7 million, while the reduction was attributed to other comprehensive income after tax of €-1.3 million, dividends paid in the amount of €88,6 million, and repurchase of treasury shares in total of €10.9 million.
The provisions of the Krka Company totalled €85.5 million (of which post-employment and other non-current employee benefits accounted for €81.5 million, and provisions for lawsuits €4.0 million) and increased by 8% compared to the end of 2016 due to forming of provisions for potential intellectual property lawsuits in the amount of €4.0 million and due to actuarial increase of provisions for post-employment and other non-current employee benefits of €2.6 million.
Of the Krka Company's current liability items, trade payables rose by €10.6 million, while other current liabilities saw a decrease of €7.3 million. At the end of 2017, the Krka Company's current borrowings from subsidiaries totalled €27.5million.
Cash flow statement
Krka Group Krka Company
In € thousand 2017 2016 2017 2016
Net cash from operating activities 227,827 213,492 272,448 120,082
Net cash used in investing activities -120,132 -115,149 -84,089 -63,440
Net cash used in financing activities -100,091 -95,916 -178,141 -57,809
Net change in cash and cash equivalents 7,604 2,427 10,218 -1,167
Net increase in cash and cash equivalents of the Krka Group (without effect of exchange rate fluctuations) was €7.6 million in 2017, because positive cash flow from operating activities exceeded the negative cash flows from investment and financing activities.
The Krka Group generated profit from operations before changes in net current assets totalling €289.3 million. The changes in current assets that increased profit included changes in trade receivables and provisions, while changes in inventories, trade payables, deferred revenues, and other current liabilities had a negative effect on profit.
Negative cash flow from investing activities totalling €120.1 million were accrued due to the acquisition of property, plant and equipment, net outflows related to derivative financial instruments, acquisition of intangible assets, and non-current loans; positive cash flow were generated by current investments and loans. The negative cash flow from financing activities in the amount of €100.1 million primarily resulted from pay-outs of dividends and other profit shares totalling €88.8 million, and repurchased treasury shares in the amount of €10.9 million.
Net increase in cash and cash equivalents of the Krka Company (without effect of exchange rate fluctuations) was €10.2 million.

Unaudited consolidated financial statements of the Krka Group and unaudited financial statements of Krka, d. d., Novo mesto for 2017
10
Performance ratios
All ratios for 2017 are better than in 2016.
Operating figures of the Krka Group and Krka Company for the past five years
Krka Group Krka Company
In € thousand 2017 2016 2015 2014 2013 2017 2016 2015 2014 2013
Revenues 1,266,392 1,174,424 1,164,607 1,191,614 1,200,827 1,197,756 1,071,709 1,086,526 1,134,169 1,116,339
EBIT 198,741 122,435 199,434 276,953 227,588 196,953 98,920 166,162 257,167 211,527
– EBIT margin 15.7% 10.4% 17.1% 23.2% 19.0% 16.4% 9.2% 15.3% 22.7% 18.9%
EBITDA 306,638 228,238 306,742 374,535 321,732 278,627 180,685 248,998 329,217 282,993 – EBITDA margin
24.2% 19.4% 26.3% 31.4% 26.8% 23.3% 16.9% 22.9% 29.0% 25.4%
Net profit 152,576 108,456 158,185 166,161 172,766 153,730 102,872 146,262 144,385 164,673 – Net profit margin
12.0% 9.2% 13.6% 13.9% 14.4% 12.8% 9.6% 13.5% 12.7% 14.8%
Assets 1,919,131 1,911,518 1,809,204 1,795,745 1,759,884 1,837,482 1,837,703 1,761,712 1,768,487 1,701,235
ROA 8.0% 5.8% 8.8% 9.3% 10.2% 8.4% 5.7% 8.3% 8.3% 10.1%
Equity 1,487,699 1,444,444 1,405,984 1,351,899 1,332,611 1,493,325 1,440,448 1,433,211 1,381,313 1,332,246
ROE 10.4% 7.6% 11.5% 12.4% 13.4% 10.5% 7.2% 10.4% 10.6% 12.8%
Unaudited consolidated financial statements of the Krka Group and unaudited financial statements of Krka, d. d., Novo mesto for 2017
11
Sales
Krka Group and Krka Company sales by Region
Krka Group Krka Company
In € thousand 2017 2016
Index
2017/2016 2017 2016
Index
2017/2016
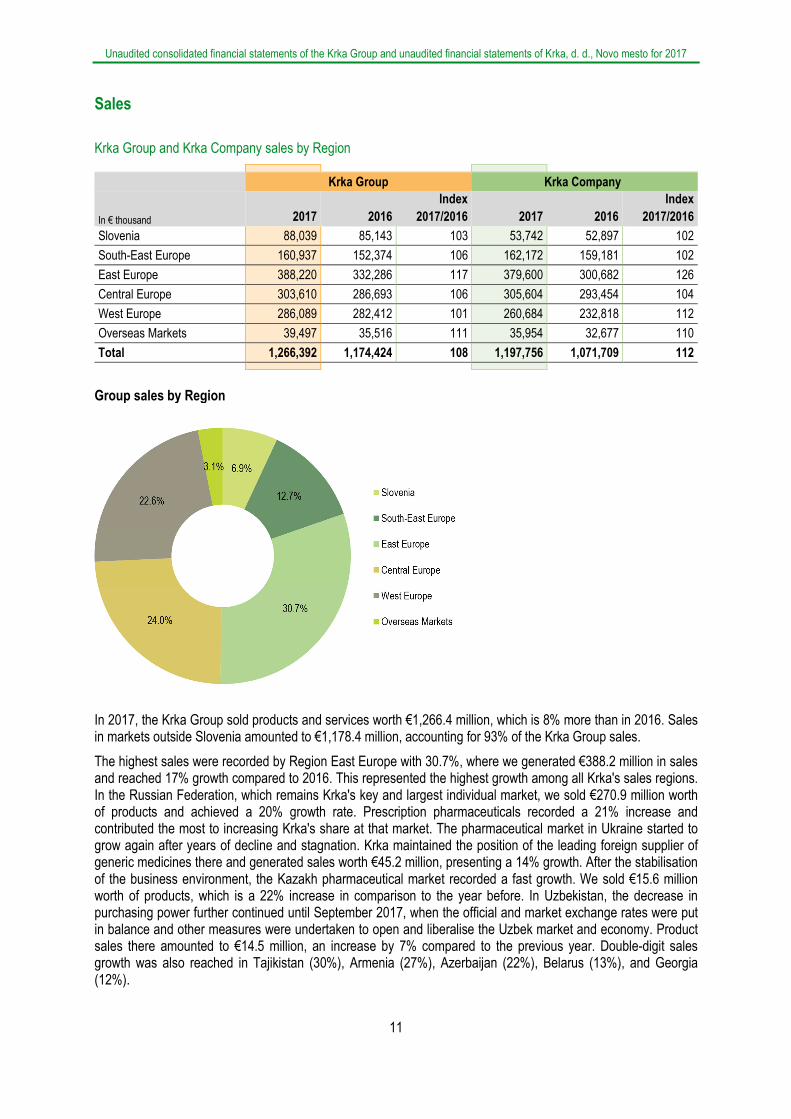
Slovenia 88,039 85,143 103 53,742 52,897 102
South-East Europe 160,937 152,374 106 162,172 159,181 102
East Europe 388,220 332,286 117 379,600 300,682 126
Central Europe 303,610 286,693 106 305,604 293,454 104
West Europe 286,089 282,412 101 260,684 232,818 112
Overseas Markets 39,497 35,516 111 35,954 32,677 110
Total 1,266,392 1,174,424 108 1,197,756 1,071,709 112
Group sales by Region
In 2017, the Krka Group sold products and services worth €1,266.4 million, which is 8% more than in 2016. Sales in markets outside Slovenia amounted to €1,178.4 million, accounting for 93% of the Krka Group sales.
The highest sales were recorded by Region East Europe with 30.7%, where we generated €388.2 million in sales and reached 17% growth compared to 2016. This represented the highest growth among all Krka's sales regions. In the Russian Federation, which remains Krka's key and largest individual market, we sold €270.9 million worth of products and achieved a 20% growth rate. Prescription pharmaceuticals recorded a 21% increase and contributed the most to increasing Krka's share at that market. The pharmaceutical market in Ukraine started to grow again after years of decline and stagnation. Krka maintained the position of the leading foreign supplier of generic medicines there and generated sales worth €45.2 million, presenting a 14% growth. After the stabilisation of the business environment, the Kazakh pharmaceutical market recorded a fast growth. We sold €15.6 million worth of products, which is a 22% increase in comparison to the year before. In Uzbekistan, the decrease in purchasing power further continued until September 2017, when the official and market exchange rates were put in balance and other measures were undertaken to open and liberalise the Uzbek market and economy. Product sales there amounted to €14.5 million, an increase by 7% compared to the previous year. Double-digit sales growth was also reached in Tajikistan (30%), Armenia (27%), Azerbaijan (22%), Belarus (13%), and Georgia (12%).

Unaudited consolidated financial statements of the Krka Group and unaudited financial statements of Krka, d. d., Novo mesto for 2017
12
Region Central Europe recorded the second highest product sales at €303.6 million, which is a 6% increase compared to 2016. In Poland, the key and largest market in the region, we sold €145.0 million worth of products and reached a 3% growth. This ranks us fourth among foreign suppliers of generic medicines. The Czech Republic as the key market in terms of sales, ranks second in the region. As a result of sales that amounted to €45.8 million and was 21% higher than in 2016, we became the third-ranked foreign supplier of generic medicines. In Hungary, which is also one of Krka's major markets, we recorded a 3% sales growth and sales in the amount of €45.1million. This ranks us second among primarily foreign suppliers of generic medicines in this market. We recorded sales growth also in Latvia (16%), Estonia (9%), and Slovakia (5%). Sales increased in all markets in the region except in Lithuania.
The third highest sales were recorded by Region West Europe with €286.1 million or 1% increase over 2016. The largest sales markets were Germany, France and Spain. Sales through subsidiaries remained at the 2016 level and accounted for approximately two thirds of total sales in the region. In Germany, our most important Western European market, we sold €80.8 million worth of products, which is a 13% decrease compared to 2016 due to lower sales of products through public tenders. We generated over 90% of sales in the German market through our subsidiary TAD Pharma. Double-digit market growth was recorded in the United Kingdom (36%), Portugal (19%), Ireland (18%), Italy (16%), Scandinavian countries (13%), and France (11%).
Sales in the markets of South-East Europe in 2017 amounted to €160.9 million worth of products, a 6% increase over 2016. In Romania, the largest and Krka's key market in the region, we sold products worth €54.2 million, which is at the 2016 level. As a result, we are first among mainly foreign providers of generic medicines in the market. In Croatia, which is also Krka's key market, we sold €31.1 million worth of products. With a 12% sales growth, we strengthened our market share and ranked fourth among all manufacturers of generic medicines and second among manufacturers of medicines for veterinary use. Sales growth was recorded in all markets in the region, except for Romania and Bosnia and Herzegovina.
Sales of products and services in Slovenia amounted to €88.0 million (health resort and tourist services yielded €35.7million with growth of 6%) Product sales growth in terms of value accounted for 3%. We maintained the position of the leading supplier of medicines in Slovenia with a 9% market share.
Sales of Krka's products in Region Overseas Markets generated €39.5 million in 2017, an 11% increase. The biggest contribution was made by individual markets of the Middle East, the Far East, and Africa, especially Iran and the Republic of South Africa.
Krka Group and Krka Company sales by product and service group
Krka Group Krka Company
In € thousand 2017 2016
Index
2017/2016 2017 2016
Index
2017/2016
Human health products 1,165,277 1,074,954 108 1,133,407 1,005,442 113 – Prescription pharmaceuticals
1,046,086 963,727 109 1,029,129 908,406 113
– Non-prescription products 119,191 111,227 107 104,278 97,036 107
Animal health products 63,213 62,793 101 60,745 61,861 98 Health resorts and tourist services
35,696 33,708 106
Other 2,206 2,969 74 3,604 4,406 82
Total 1,266,392 1,174,424 108 1,197,756 1,071,709 112

Unaudited consolidated financial statements of the Krka Group and unaudited financial statements of Krka, d. d., Novo mesto for 2017
13 * Products marketed under different brand names in individual markets are marked with an asterisk. Products may be marketed also under the Krka trademark in individual markets.
Krka Group sales by product and service group
Prescription pharmaceuticals remain Krka's most important sales group. Their sales amounted to €1,046.1 million, which is a 9% increase over 2016. Sales of prescription pharmaceuticals exceeded one billion euros for the first time in Krka's history.
Among the ten largest individual markets, sales of prescription pharmaceuticals saw the highest growth in relative terms in the Russian Federation, Czech Republic, and Ukraine, as well as in the United Kingdom, Finland, and Serbia among other markets. Krka's largest individual markets for prescription pharmaceuticals included the Russian Federation, Poland, Germany, Romania, and Hungary.
As far as sales of prescription pharmaceuticals are concerned, medicines for the treatment of cardiovascular diseases remained the key therapeutic group in 2017, followed by pharmaceuticals for diseases of the central nervous system, and medicines for alimentary and metabolic diseases.
In 2017, sales of new products, i.e. products launched in individual markets in the past five years, accounted for 33% of the Krka Group total sales. The most important new products were Pragiola* (pregabalin) launched at the end of 2014, and Dulsevia* (duloxetine) launched in 2015. They ranked among the 20 leading products in terms of 2017 sales. The leading products in terms of absolute sales growth were Vamloset* (valsartan/amlodipine), Meaxin* (imatinib), and Roticox* (etoricoxib), which was launched in 2017.
Medicines containing perindopril (Prenessa*, Co-Prenessa*, Amlessa*, Co-Amlessa*) remained the leading group in terms of sales in 2017. They were followed by medicines containing losartan (Lorista*, Lorista H*, Tenloris*), atorvastatin (Atoris, Atordapin*), pantoprazole (Nolpaza*), and valsartan (Valsacor, Valsacombi*, Vamloset*). Among the ten leading prescription pharmaceuticals in terms of sales were medicines containing esomeprazole (Emanera*), rosuvastatin (Roswera*, Rosudapin*), enalapril (Enap, Enap-H*, Elernap*), tramadol (Doreta*, Tadol), and clopidogrel (Zyllt*).
Sales of non-prescription products amounted to €119.2 million, a 7% increase compared to 2016. Among the ten largest markets, sales saw the highest growth in relative terms in Kazakhstan, the Czech Republic, and Ukraine, and among other markets in Finland, Tajikistan, and Belarus. Herbion, Septolete, Bilobil, and Nalgesin S* are Krka's most important non-prescription product brands.
Animal health product sales totalled €63.2 million, up 1% from 2016. As far as our ten leading markets are concerned, the sales in the Czech Republic, the Russian Federation, and Slovenia increased the most in relative terms. Among other markets, the rise was most notable in Lithuania, Poland, Portugal, and France. Krka's most successful animal health product in terms of sales was Milprazon* (milbemycin oxime/praziquantel), followed by Floron (florfenicol), Enroxil* (enrofloxacin), Fypryst* (fipronil), and Ecocid* S.
Sales of health resort and tourist services increased by 6% and amounted to €35.7 million. Other sales totalled €2.2 million.

Unaudited consolidated financial statements of the Krka Group and unaudited financial statements of Krka, d. d., Novo mesto for 2017
14
Research and Development
In 2017, Krka obtained marketing authorisations for 23 new products (17 prescription pharmaceuticals, three non-prescription products, and three animal health products) in 46 pharmaceutical dosage forms and strengths. A total of 555 new marketing authorisations were obtained for 119 products in various markets in this year.
We submitted patent applications for four inventions and, based on priority applications from 2016, three international patent applications. Krka registered 57 trademarks in Slovenia, and submitted 73 international and 32 national trademark applications in 2017.
New prescription pharmaceuticals
Krka's key therapeutic area of medicines for the treatment of cardiovascular diseases was supplemented with new combinations of amlodipine with olmesartan, candesartan, and perindopril. We obtained marketing authorisations for the combination of olmesartan and amlodipine in film-coated tablets in three strengths. The combination integrates two mechanisms of action to reduce high blood pressure. It contains olmesartan, an angiotensin II receptor antagonist, and amlodipine, a calcium channel blocker. Due to the complementary effect of both active ingredients, the combination reduces the likelihood of certain adverse effects and improves tolerability. Our bioequivalence study demonstrates that the use of the generic medicine Olmita/Olmira (olmesartan/amlodipine) is as safe and effective as the reference medicine. We obtained the marketing authorisation for the medicine under the European decentralised procedure. It may be used by patients who cannot adequately control their blood pressure by taking medicines that contain one active ingredient only. A clinical study demonstrated that the fixed-dose combination is effective also as a replacement therapy. We obtained the marketing authorisation for the medicine OlmeAmlo (olmesartan/amlodipine) for use in patients that already take amlodipine and olmesartan in separate tablets and in the same doses as contained in the fixed-dose combination. The use of the medicine as a replacement therapy optimises the treatment as patients need to take fewer tablets per day, which improves patient compliance.
We obtained the marketing authorisation under the European decentralised procedure for the fixed-dose combination of candesartan/amlodipine in tablets of two strengths. The interaction of two active ingredients with different mechanisms of action is more effective in lowering high blood pressure than the treatment with only one active ingredient, and at the same time it also reduces the risk of adverse effects. The fixed-dose combination is used as a replacement therapy in patients already treated with candesartan and amlodipine in separate tablets and the same doses. The fixed-dose combination of two active ingredients in one tablet improves patient compliance during the treatment, as they need to take fewer tablets per day.
We also obtained marketing authorisations for the fixed-dose combination of perindopril/amlodipine in tablets of four strengths. Perindopril as an ACE inhibitor and amlodipine as a calcium channel blocker are complementary, and the combination is used for the treatment of high blood pressure and/or stable coronary arterial disease. The medicine is one of the basic and most important medicines for treating high blood pressure. In 2017, we obtained the marketing authorisation for Krka's generic variety of the fixed-dose combination, which is an equivalent therapeutic replacement for the originator's.
We obtained marketing authorisations for Krka's medicines for the treatment of erectile dysfunction Viavardis/Vardegin (vardenafil) 5 mg, 10 mg, and 20 mg film-coated tablets, and Tadilecto/Tadagis (tadalafil) 2.5 mg, 5 mg, 10 mg, and 20 mg film-coated tablets. Marketing authorisations for the two medicines were obtained under the European decentralised procedures in several European countries. Both active ingredients are selective enzyme phosphodiesterase type 5 inhibitors (PDE-5) that act quickly and prolong an erection. High efficacy is already evident after the first dose and is maintained after long-term use as well. Vardenafil is an effective and safe medicine intended for patients suffering from diabetes and cardiovascular diseases, and patients after radical prostatectomy. Tadalafil in lower doses is also intended for the treatment of benign prostatic hyperplasia. Both new medicines are vertically integrated, which means that Krka manages processes for preparation and evaluation of the active ingredient and the finished product. Krka's broad range of medicines for the treatment of erectile dysfunction comprises sildenafil, vardenafil, and tadalafil in different pharmaceutical forms and strengths.
We obtained marketing authorisations under the European decentralised procedures for the new medicine Adolax/Oxynador/Nolxado/Dolnada (oxycodone/naloxone) prolonged-release tablets in three strengths. It

Unaudited consolidated financial statements of the Krka Group and unaudited financial statements of Krka, d. d., Novo mesto for 2017
15
contains the combination of an opioid oxycodone and naloxone that bind to opioid receptors. The medicine relieves moderate to severe pain when the treatment with opioids is required.
We obtained the marketing authorisation under the European decentralised procedure for the new strength of Dulsevia/Duloxalta (duloxetine) 90 mg gastro-resistant capsules. This medicine from the group of combined serotonin-noradrenaline reuptake inhibitors is used in the treatment of depression, generalised anxiety disorder, and neuropathic pain associated with diabetes. In addition to 30 mg and 60 mg capsules, a new strength is available allowing for administration of one capsule only in cases when higher doses are required.
New medicines were added to Krka's portfolio of analgesics. We obtained the marketing authorisation for the medicine Dekenor/Dexfenia (dexketoprofen) solution for injection. The product belongs to non-steroidal anti-inflammatory medicines that inhibit the cyclooxygenase pathway and reduce the synthesis of prostaglandins. It is used for the treatment of acute moderately severe to severe pain when oral treatment is not appropriate, e.g. postoperative pain, renal colics, and back pain. Dexketoprofen solution for injection may be given intravenously and intramuscularly. In both cases, the analgesic effect occurs quickly. It may be combined with opioid medicines in patients with postoperative pain. This allows for lower opioid doses, which reduces the risk of adverse effects that depend on the opioid doses.
We updated two medicines from the group of opioid analgesics, tramadol capsules and solution for injection in two strengths. We obtained marketing authorisations for both under the European decentralised procedures. Tramadol belongs to the opioid medicines with an analgesic effect. It binds to opioid receptors in the central nervous system and induces a weak stimulation of the central pain inhibitory system, which reduces the sensation of pain. The medicine is used for the treatment of moderately severe to severe pain. Unlike other opioids, tolerance and physical or psychological dependence do not develop when taking tramadol. Adverse effects are also rare. It is especially suitable for patients for whom non-opioid analgesics are not appropriate. The medicine in capsules is easier to take. It is also available as solution for injection for intravenous, intramuscular, or subcutaneous administration. The analgesic effect occurs quickly.
We obtained marketing authorisations under the European decentralised procedure for the new pharmaceutical forms of Meaxin/Imanivec (imatinib) 100 mg and 400 mg dispersible tablets. It is used for the treatment of chronic myeloid leukemia, acute lymphoblastic leukaemia with the Philadelphia chromosome, myelodysplastic/myeloproliferative diseases, hypereosinophilic syndrome, chronic eosinophilic leukemia, and dermatofibrosarcoma protuberans. Tablets may be dispersed in a small amount of water or apple juice for easier administration. They are suitable for patients who are unable to swallow, suffer from gastrointestinal disorders, in particular children and elderly, and also other patients who prefer liquids.
Two new products were added to Krka's new group of medicines for the treatment of patients infected with human immunodeficiency virus (HIV). We received a positive opinion from the European Medicines Agency (EMA) for Darunavir Krka film-coated tablets in three strengths and Efavirenz/Emtricitabine/Tenofovir disoproxil Krka film-coated tablets. Darunavir belongs to the group of protease inhibitors that form an integral part in combinations of medicines for the treatment of HIV-infected patients. Efavirenz/Emtricitabine/Tenofovir disoproxil Krka film-coated tablets include three antiretroviral agents that inhibit the reverse transcriptase enzyme necessary for viral replication. Efavirenz is a non-nucleoside inhibitor, emtricitabine is a nucleoside inhibitor, and tenofovir a nucleotide reverse transcriptase inhibitor. The combination allows for taking just one tablet a day. This makes administration easier and improves patient compliance, which is very important in the chronic treatment of diseases such as HIV infection.
We obtained the marketing authorisation under the European decentralised procedure for Glypvilo (vildagliptin) tablets. This is the first selective inhibitor of dipeptidyl peptidase-4 enzyme in Krka's portfolio of medicines for the treatment of diabetes. It may be used for the treatment of diabetes already at the earliest stages of the disease as monotherapy or in combination with other medicines. The medicine has a very good safety profile, does not cause hypoglycemia, and, unlike some older medicines, does not impact the body weight.
We obtained marketing authorisations for European markets under the European decentralised procedure for a new formulation of dexamethasone 0.5 mg tablets. Dexamethasone is a corticosteroid with anti-inflammatory, analgesic, and anti-allergic properties with effect on the immune system. It is used for the symptomatic treatment of rheumatic diseases, systemic connective tissue diseases, allergic disorders, and skin conditions, eye disorders, gastrointestinal disorders, respiratory diseases, blood disorders, kidneys, some forms of cancer, and rejection reactions to organ transplants.

Unaudited consolidated financial statements of the Krka Group and unaudited financial statements of Krka, d. d., Novo mesto for 2017
16
We obtained the marketing authorisation under the national procedure for a new medicine strength in Hungary, Kventiax SR (quetiapine) 400 mg prolonged-release tablets, and supplemented our range of medicines containing quetiapine. This broad-spectrum antipsychotic medicine is used for treating mental illnesses (schizophrenia, bipolar disorder, and major depression). The prolonged-release tablets are now available in five strengths. Taking one tablet a day simplifies the treatment.
New non-prescription products
Magnezij Krka 300 water soluble granules are a food supplement containing magnesium citrate and B2. Both ingredients help reduce fatigue and exhaustion, and support normal functioning of the nervous system. Magnesium citrate is also vital for proper functioning of muscles. The product does not contain preservatives, artificial colouring agents, flavours, and sweeteners.
We obtained marketing authorisations under the European decentralised procedure for the new medicine Flebaven/Flebazol/Fladios (diosmin) 500 mg film-coated tablets and 1000 mg tablets in 12 countries. Both dosage forms contain micronised diosmin of the pharmacopoeial quality and are intended for the treatment of symptoms of chronic venous insufficiency in adults, which is manifested as heavy legs, leg pain, and leg cramps at night, and for the symptomatic treatment of deteriorated haemorrhoid-related problems in adults. We obtained marketing authorisations for both products also in the markets of eastern and south-eastern Europe.
We expanded our market opportunities by obtaining new marketing authorisations for Septolete Total/Septabene (benzydamine hydrochloride/cetylpyridinium chloride) lozenges. The product has anti-inflammatory, analgesic, and antiseptic effects, and is used to treat infections and pain in the mouth and throat. We additionally obtained marketing authorisations for the product under the European decentralised procedure in the Czech Republic, Ireland, and Germany, and obtained the status of a non-prescription product.
New animal health products
We obtained marketing authorisations under decentralised procedures for Dehinel/Anthelmin (pyrantel embonate/praziquantel) film-coated tablets in 24 countries. It contains a fixed-dose combination of active ingredients for the treatment of mixed gastrointestinal parasite infestations in cats. It completes Krka's range of modern animal health products for the treatment of parasites in companion animals. We obtained marketing authorisations for the medicine also in Ukraine, Moldova, Bosnia and Herzegovina, and Macedonia.
We supplemented our portfolio of medicines for the treatment of farm animals with the two new medicines. We obtained the marketing authorisation under the European decentralised procedure for Santiola (clozantel) solution for injection, which completes Krka's portfolio of products for the treatment of parasitic infestations. It is indicated for the treatment of fasciolosis, gastrointestinal infestations and Oestridae spp. in cattle and sheep. In Kazakhstan and Azerbaijan, we obtained the marketing authorisations for Toltarox (toltrazuril) oral solution that is added to drinking water. It is used to treat Coccidia spp. infestations in different types of poultry.
Investments
In 2017, the Krka Group allocated €105.1 million to investments, €85.3 million to the controlling company, and €19.8 million to subsidiaries. We invested primarily in increasing and updating the production, and development and research capacities.
In Slovenia, Croatia, and the Russian Federation, approximately thirty investment projects are in progress intended to increase our production capacities.
Krka's key investment is the product development and quality control facility, the Razvojno-kontrolni center 4 (RKC 4), at the production site in Ločna, Novo mesto. The investment is estimated at €54 million. The construction of the 18,000 m² building and external works are in the final stage.
On the same location, we are also building a multipurpose warehouse with additional capacity for the storage of finished products, raw and packaging materials. This will increase the speed and flexibility of the production, and improve the availability of products and market supply. The construction of the building, installation of logistic and other equipment, qualification, and equipment and system start-ups will last two years. The investment is estimated at €31.5 million.

Unaudited consolidated financial statements of the Krka Group and unaudited financial statements of Krka, d. d., Novo mesto for 2017
17
On the same location, you can also find Notol 2, a state-of-the-art facility for the production of solid pharmaceutical dosage forms. The production there was started in January 2015, and the plant was officially opened in November of the same year. The plant has been designed in a way that allows a gradually increase in capacities. To satisfy increasing market demand and set up the production of new products, Krka purchased and installed additional technological equipment totalling €23 million in 2017.
Also in progress is the €11 million project to extend our pellet-coating capacity at OTO, the solid dosage forms production plant, which will be completed in 2018.
The new investment in Krško provided capacities for technologies that require treatment with hydrogen and thus further increased capacities for the independent production of pharmaceutical ingredients. The construction of €4.5 million hydrogenation plant, Hidrogeniranje 2, started in June 2017. By the end of the year, we performed system and equipment qualifications and start-ups. The test production of hydrogenation started at the beginning of 2018.
We are expanding the production plant for animal health products with biocidal effect in Bršljin, Novo mesto. The value of the investment is estimated at €4.6 million and the production with new equipment will start at the end of 2018.
Krka-Rus 2 plant in Istra in the Russian Federation is among the most important investments in Krka's subsidiaries. The second stage of equipment installation in the new plant is finished. All technological production equipment has been assembled and operates. Production capacity has increased to two thirds of the planned final capacity, a total of 2.5 billion tablets and capsules a year. In 2018, we will also built a wastewater treatment plant. Over 60% of products intended for the Russian market are produced by Krka-Rus, giving Krka the status of a domestic producer in the Russian Federation.
We have completed the refurbishment of the production and distribution centre in Jastrebarsko, Croatia and acquired new manufacturing facilities and laboratory capacities for solid dosage forms of oncology medicines.
Completed is the €5.5 million investment in Krka's subsidiary Farma GRS. We have provided additional capacities for research and development in the Chemical development centre, as well as increased capacities for the small-scale production of pharmaceutical ingredients in line with the good manufacturing practice.
Several smaller investments are in progress in all business units of the Terme Krka subsidiary. The heating system was replaced in Strunjan, which will reduce negative environmental impact and provide lower thermal energy prices in accordance with the legislation and the objectives of the Strunjan Nature Reserve. Hotel Laguna is also undergoing renovation. We are expanding accommodation capacities and building a smaller pool. In Šmarješke Toplice, a system for regulating discharge of wastewater was set up and energy system renovated. Completed is the renovation of facilities in the medical rehabilitation centre in Dolenjske Toplice and hotel rooms in Hotel Šport, Otočec. In 2017, investments in Terme Krka totalled €3 million.
Krka established a joint venture with Chinese partner Ningbo Menovo Pharmaceutical, in which Krka holds a 60% share and the partner a 40% share. The agreement establishing Ningbo Krka Menovo Pharmaceutical and its articles of association were signed by the partners on 15 November 2017. Immediately after the signing of the agreement, activities were initiated for the joint venture’s approval by the Chinese authorities and its registration. The company was registered with Chinese authorities on 5 December 2017. In January 2018, Ningbo Krka Menovo Pharmaceutical opened its bank account and a few days later – on 22 January 2018 – the partners paid in the first tranche of subscribed capital. The joint venture is headed by a three-member Board of Directors, in which Krka has two representatives, one being the President. The first meeting of the Board took place on 14 March 2018. The company will initially focus on registering Krka's products in China, as obtaining marketing permits is a prerequisite for selling products at that market. The first major sales results are expected in two to three years.
Employees
At the end of 2017, the Krka Group employed 10,832 people, 5134 (47.4%) in Slovenia and 5698 (52.6%) abroad.
The share of employees with at least university-level qualifications is 55%, or 6,011 employees. They include 175 employees with a doctoral degree and 364 employees with a master's degree or specialisation.
Unaudited consolidated financial statements of the Krka Group and unaudited financial statements of Krka, d. d., Novo mesto for 2017
18
Investor and Share Information
On the last trading date in 2017, the Krka share price on the Ljubljana Stock Exchange totalled €57.50, which is a 9% increase over the 2016 year-end, when it amounted to €52.90. In the same period, the value of the blue-chip index of the Ljubljana Stock Exchange (SBITOP) rose by 12%. At the end of last year, Krka's market capitalisation amounted to €1,886 million.
Krka shares are the most traded security on the Ljubljana Stock Exchange. In 2017, the average daily trading volume of Krka shares on the Ljubljana Stock Exchange reached €0.6 million. In 2017, the company acquired 201,116 treasury shares and held 691,717 treasury shares on 31 December 2017.
Plans for 2018
According to the 2018 plans, sales of the Krka Group are projected at €1.3 billion and net profit at €153 million. The Management Board will strive to exceed Krka's planned goals in case of favourable business conditions. Krka intends to allocate €135 million for investment projects to increase and upgrade production capacities and the infrastructure. In 2018, Krka plans to increase the number of employees in Slovenia and abroad by 2%; the total number of regular employees is projected to exceed 11,200.
The business plan for 2018 was based on the Krka Group development strategy for the period from 2018 to 2022. It was founded on estimates, assessments, projections, and other available data the Management Board had on disposal at the time. The Management Board believed that the estimates were reasonable. If business conditions in 2018 differ significantly from the projections, operation results could also differ from the plan.
Novo mesto, March 2018 Krka, d. d., Novo mesto Management Board

Unaudited consolidated financial statements of the Krka Group and unaudited financial statements of Krka, d. d., Novo mesto for 2017
19
Unaudited Consolidated Statement of Financial Position of the Krka Group
In € thousand 31 Dec 2017 31 Dec 2016
Assets
Property, plant and equipment 864,842 874,100
Intangible assets 110,992 113,511
Loans 9,543 8,801
Investments 8,815 10,138
Deferred tax assets 38,475 31,260
Other non-current assets 341 257
Total non-current assets 1,033,008 1,038,067
Assets held for sale 41 467
Inventories 310,671 280,653
Trade receivables 500,735 510,406
Other receivables 27,302 33,777
Loans 1,426 9,441
Investments 0 77
Cash and cash equivalents 45,948 38,630
Total current assets 886,123 873,451
Total assets 1,919,131 1,911,518
Equity
Share capital 54,732 54,732
Treasury shares -40,588 -29,690
Reserves 111,477 109,678
Retained earnings 1,361,107 1,308,668
Total equity holders of the parent 1,486,728 1,443,388
Non-controlling interests within equity 971 1,056
Total equity 1,487,699 1,444,444
Liabilities
Provisions 98,075 90,807
Deferred revenue 10,953 12,158
Deferred tax liabilities 12,154 12,348
Total non-current liabilities 121,182 115,313
Trade payables 108,340 128,437
Income tax payable 16,142 1,666
Other current liabilities 185,768 221,658
Total current liabilities 310,250 351,761
Total liabilities 431,432 467,074
Total equity and liabilities 1,919,131 1,911,518

Unaudited consolidated financial statements of the Krka Group and unaudited financial statements of Krka, d. d., Novo mesto for 2017
20
Unaudited Consolidated Income Statement of the Krka Group
In € thousand 2017 2016
Revenues 1,266,392 1,174,424
Costs of goods sold -538,540 -547,669
Gross profit 727,852 626,755
Other operating income 10,433 7,863
Selling and distribution expenses -340,455 -317,418
R&D expenses -125,864 -117,994
General and administrative expenses -73,225 -76,771
Operating profit 198,741 122,435
Financial income 24,041 65,679
Financial expenses -46,608 -71,816
Net financial result -22,567 -6,137
Profit before tax 176,174 116,298
Income tax -23,598 -7,842
Net profit 152,576 108,456
Attributable to:
– equity holders of the parent 152,600 108,452
– non-controlling interest -24 4
Basic earnings per share (in €) 4.74 3.35
Diluted earnings per share (in €) 4.74 3.35
Unaudited Consolidated Statement of Other Comprehensive Income of the Krka Group
In € thousand 2017 2016
Net profit 152,576 108,456
Other comprehensive income for the year Other comprehensive income for the year reclassified to profit or loss in future periods
Translation reserve -8,378 26,021
Change in fair value of available-for-sale financial assets -1,345 2,558
Deferred tax effect 256 -581 Net other comprehensive income for the year reclassified to profit or loss in future periods
-9,467 27,998
Other comprehensive income for the year that will not be reclassified to profit or loss in future periods
Recalculation of post-employment benefits -235 -2,961
Deferred tax effect -6 559 Net other comprehensive income for the year that will not be reclassified to profit or loss in future periods
-241 -2,402
Total other comprehensive income for the year (net of tax) -9,708 25,596
Total comprehensive income for the year (net of tax) 142,868 134,052
Attributable to:
– equity holders of the parent 142,892 134,048
– non-controlling interest -24 4

Unaudited consolidated financial statements of the Krka Group and unaudited financial statements of Krka, d. d., Novo mesto for 2017
21
Unaudited Consolidated Statement of Changes in Equity of the Krka Group for 2017
Reserves Retained earnings
In € thousand Share
capital Treasury
shares
Reserves for
treasury shares
Share premium
Legal reserves
Statutory reserves
Fair value
reserve Translation
reserve
Other profit
reserves Retained earnings
Profit for the year
Total equity holders of the parent
Non-controlling
interests within equity
Total equity
Balance at 1 Jan 2017 54,732 -29,690 29,690 105,897 14,990 30,000 -11,802 -59,097 1,102,165 107,670 98,833 1,443,388 1,056 1,444,444
Net profit 0 0 0 0 0 0 0 0 0 0 152,600 152,600 -24 152,576
Total other comprehensive income for the year (net of tax)
0 0 0 0 0 0 -721 -8,378 0 -609 0 -9,708 0 -9,708
Total comprehensive income for the year (net of tax)
0 0 0 0 0 0 -721 -8,378 0 -609 152,600 142,892 -24 142,868
Transactions with owners, recognised in equity
Formation of other profit reserves under the resolution of the Management and Supervisory Boards
0 0 0 0 0 0 0 0 27,007 -27,007 0 0 0 0
Transfer of previous period’s profit to retained earnings
0 0 0 0 0 0 0 0 0 98,833 -98,833 0 0 0
Repurchase of treasury shares 0 -10,898 0 0 0 0 0 0 0 0 0 -10,898 0 -10,898 Formation of reserves for treasury shares
0 0 10,898 0 0 0 0 0 0 0 -10,898 0 0 0
Purchase of a stake in Golf Grad Otočec
0 0 0 0 0 0 0 0 0 -10 0 -10 -61 -71
Dividends paid 0 0 0 0 0 0 0 0 0 -88,644 0 -88,644 0 -88,644
Total transactions with owners, recognised in equity
0 -10,898 10,898 0 0 0 0 0 27,007 -16,828 -109,731 -99,552 -61 -99,613
Balance at 31 Dec 2017 54,732 -40,588 40,588 105,897 14,990 30,000 -12,523 -67,475 1,129,172 90,233 141,702 1,486,728 971 1,487,699

Unaudited consolidated financial statements of the Krka Group and unaudited financial statements of Krka, d. d., Novo mesto for 2017
22
Unaudited Consolidated Statement of Changes in Equity of the Krka Group for 2016
Reserves Retained earnings
In € thousand Share
capital Treasury
shares
Reserves for
treasury shares
Share premium
Legal reserves
Statutory reserves
Fair value
reserve Translation
reserve
Other profit
reserves Retained earnings
Profit for the year
Total equity holders of the parent
Non-controlling
interests within equity
Total equity
Balance at 1 Jan 2016 54,732 -20,071 20,071 105,897 14,990 30,000 -12,453 -85,118 1,051,677 96,160 148,851 1,404,736 1,248 1,405,984
Net profit 0 0 0 0 0 0 0 0 0 0 108,452 108,452 4 108,456
Total other comprehensive income for the year (net of tax)
0 0 0 0 0 0 651 26,021 0 -1,076 0 25,596 0 25,596
Total comprehensive income for the year (net of tax)
0 0 0 0 0 0 651 26,021 0 -1,076 108,452 134,048 4 134,052
Transactions with owners, recognised in equity
Formation of other profit reserves under the resolution of the Management and Supervisory Boards
0 0 0 0 0 0 0 0 50,488 -50,488 0 0 0 0
Transfer of previous period’s profit to retained earnings
0 0 0 0 0 0 0 0 0 148,851 -148,851 0 0 0
Repurchase of treasury shares 0 -9,619 0 0 0 0 0 0 0 0 0 -9,619 0 -9,619 Formation of reserves for treasury shares
0 0 9,619 0 0 0 0 0 0 0 -9,619 0 0 0
Purchase of a stake in Golf Grad Otočec
0 0 0 0 0 0 0 0 0 156 0 156 -196 -40
Dividends paid 0 0 0 0 0 0 0 0 0 -85,933 0 -85,933 0 -85,933 Total transactions with owners, recognised in equity
0 -9,619 9,619 0 0 0 0 0 50,488 12,586 -158,470 -95,396 -196 -95,592
Balance at 31 Dec 2016 54,732 -29,690 29,690 105,897 14,990 30,000 -11,802 -59,097 1,102,165 107,670 98,833 1,443,388 1,056 1,444,444

Unaudited consolidated financial statements of the Krka Group and unaudited financial statements of Krka, d. d., Novo mesto for 2017
23
Unaudited Consolidated Statement of Cash Flows of the Krka Group
In € thousand 2017 2016
CASH FLOWS FROM OPERATING ACTIVITIES
Net profit 152,576 108,456
Adjustments for: 136,751 166,828
– amortisation/depreciation 107,897 105,803 – foreign exchange differences -1,667 4,506 – investment income -25,276 -23,844 – investment expenses 30,328 70,748 – interest expenses and other financial expenses 1,871 1,756 – financial income 0 17 – income tax 23,598 7,842 Operating profit before changes in net operating current assets 289,327 275,284
Change in trade receivables 11,834 -73,529 Change in inventories -30,018 -7,775 Change in trade payables -13,222 14,034 Change in provisions 5,605 1,519 Change in deferred revenues -1,205 -1,223 Change in other current liabilities -23,399 28,703 Income tax paid -11,095 -23,521 Net cash from operating activities 227,827 213,492
CASH FLOWS FROM INVESTING ACTIVITIES Interest received 922 919 Proceeds from sale of current investments 2 0 Dividends received 15 835 Proceeds from sale of property, plant and equipment 1,283 1,197 Purchase of intangible assets -5,385 -4,414 Purchase of property, plant and equipment -106,507 -116,996 Acquisition of subsidiaries and a share of minority interest without obtained assets
-70 -40
Non-current loans -2,386 -2,662 Proceeds from repayment of non-current loans 1,372 1,345 Payments to acquire non-current investments -152 -82 Proceeds from sale of non-current investments 41 68 Proceeds in connection with current investments and loans 8,353 28,430 Payments in connection with derivative financial instruments -27,094 -45,041 Proceeds from derivative financial instruments 9,474 21,292 Net cash used in investing activities -120,132 -115,149
CASH FLOWS FROM FINANCING ACTIVITIES
Interest paid -444 -296 Dividends and other profit shares paid -88,749 -86,001 Repurchase of treasury shares -10,898 -9,619 Net cash used in financing activities -100,091 -95,916 Net increase in cash and cash equivalents 7,604 2,427
Cash and cash equivalents at beginning of the year 38,630 35,826
Effect of exchange rate fluctuations on cash and cash equivalents -286 377 Net cash and cash equivalents at end of the year 45,948 38,630

Unaudited consolidated financial statements of the Krka Group and unaudited financial statements of Krka, d. d., Novo mesto for 2017
24
Unaudited Statement of Financial Position of Krka, d. d., Novo mesto
In € thousand 31 Dec 2017 31 Dec 2016
Assets
Property, plant and equipment 611,341 609,543
Intangible assets 28,299 29,302
Investments in subsidiaries 321,898 321,185
Trade receivables due from subsidiaries 38,644 23,515
Loans 11,187 18,302
Investments 8,814 10,136
Deferred tax assets 12,342 12,101
Other non-current assets 70 92
Total non-current assets 1,032,595 1,024,176
Assets held for sale 41 41
Inventories 264,174 236,214
Trade receivables 456,265 479,234
Other receivables 15,395 21,408
Loans 34,895 52,504
Investments 0 77
Cash and cash equivalents 34,117 24,049
Total current assets 804,887 813,527
Total assets 1,837,482 1,837,703
Equity
Share capital 54,732 54,732
Treasury shares -40,588 -29,690
Reserves 180,779 170,583
Retained earnings 1,298,402 1,244,823
Total equity 1,493,325 1,440,448
Liabilities
Provisions 85,503 78,903
Deferred revenue 2,408 2,788
Total non-current liabilities 87,911 81,691
Trade payables 159,119 148,562
Borrowings 27,525 105,269
Income tax payable 15,127 0
Other current liabilities 54,475 61,733
Total current liabilities 256,246 315,564
Total liabilities 344,157 397,255
Total equity and liabilities 1,837,482 1,837,703

Unaudited consolidated financial statements of the Krka Group and unaudited financial statements of Krka, d. d., Novo mesto for 2017
25
Unaudited Income Statement of Krka, d. d., Novo mesto
In € thousand 2017 2016
Revenues 1,197,756 1,071,709
Costs of goods sold -511,870 -510,131
Gross profit 685,886 561,578
Other operating income 4,879 3,312
Selling and distribution expenses -304,038 -281,290
R&D expenses -131,201 -122,874
General and administrative expenses -58,573 -61,806
Operating profit 196,953 98,920
Financial income 24,908 78,225
Financial expenses -46,599 -72,733
Net financial result -21,691 5,492
Profit before tax 175,262 104,412
Income tax -21,532 -1,540
Net profit 153,730 102,872
Basic earnings per share (in €) 4.77 3.17
Diluted earnings per share (in €) 4.77 3.17
Unaudited Statement of Other Comprehensive Income of Krka, d. d., Novo mesto
In € thousand 2017 2016
Net profit 153,730 102,872
Other comprehensive income for the year Other comprehensive income for the year reclassified to profit or loss in future periods
Change in fair value of available-for-sale financial assets -1,345 2,558
Deferred tax effect 256 -581 Net other comprehensive income for the year reclassified to profit or loss in future periods
-1,089 1,977
Other comprehensive income for the year that will not be reclassified to profit or loss in future periods
Recalculation of post-employment benefits -245 -2,619
Deferred tax effect 23 559 Net other comprehensive income for the year that will not be reclassified to profit or loss in future periods
-222 -2,060
Total other comprehensive income for the year (net of tax) -1,311 -83
Total comprehensive income for the year (net of tax) 152,419 102,789

Unaudited consolidated financial statements of the Krka Group and unaudited financial statements of Krka, d. d., Novo mesto for 2017
26
Unaudited Statement of Changes in Equity of Krka, d. d., Novo mesto for 2017
Reserves Retained earnings
In € thousand
Share capital
Treasury shares
Reserves for
treasury shares
Share
premium Legal
reserves Statutory reserves
Fair value reserve
Other profit
reserves Retained earnings
Profit for the year
Total equity
Balance at 1 Jan 2017 54,732 -29,690 29,690 105,897 14,990 30,000 -9,994 1,102,165 49,405 93,253 1,440,448
Net profit 0 0 0 0 0 0 0 0 0 153,730 153,730
Total other comprehensive income for the year (net of tax)
0 0 0 0 0 0 -702 0 -609 0 -1,311
Total comprehensive income for the year (net of tax)
0 0 0 0 0 0 -702 0 -609 153,730 152,419
Transactions with owners, recognised in equity
Formation of other profit reserves under the resolution of the Annual General Meeting
0 0 0 0 0 0 0 27,007 -27,007 0 0
Transfer of previous period’s profit to retained earnings
0 0 0 0 0 0 0 0 93,253 -93,253 0
Repurchase of treasury shares 0 -10,898 0 0 0 0 0 0 0 0 -10,898
Formation of reserves for treasury shares 0 0 10,898 0 0 0 0 0 0 -10,898 0
Dividends paid 0 0 0 0 0 0 0 0 -88,644 0 -88,644 Total transactions with owners, recognised in equity
0 -10,898 10,898 0 0 0 0 27,007 -22,398 -104,151 -99,542
Balance at 31 Dec 2017 54,732 -40,588 40,588 105,897 14,990 30,000 -10,696 1,129,172 26,398 142,832 1,493,325

Unaudited consolidated financial statements of the Krka Group and unaudited financial statements of Krka, d. d., Novo mesto for 2017
27
Unaudited Statement of Changes in Equity of Krka, d. d., Novo mesto for 2016
Reserves Retained earnings
In € thousand
Share capital
Treasury shares
Reserves for
treasury shares
Share premium
Legal reserves
Statutory reserves
Fair value reserve
Other profit
reserves Retained earnings
Profit for the year
Total
equity
Balance at 1 Jan 2016 54,732 -20,071 20,071 105,897 14,990 30,000 -10,993 1,051,677 50,040 136,868 1,433,211
Net profit 0 0 0 0 0 0 0 0 0 102,872 102,872
Total other comprehensive income for the year (net of tax)
0 0 0 0 0 0 999 0 -1,082 0 -83
Total comprehensive income for the year (net of tax)
0 0 0 0 0 0 999 0 -1,082 102,872 102,789
Transactions with owners, recognised in equity
Formation of other profit reserves under the resolution of the Management and Supervisory Boards
0 0 0 0 0 0 0 50,488 -50,488 0 0
Transfer of previous period’s profit to retained earnings
0 0 0 0 0 0 0 0 136,868 -136,868 0
Repurchase of treasury shares 0 -9,619 0 0 0 0 0 0 0 0 -9,619
Formation of reserves for treasury shares 0 0 9,619 0 0 0 0 0 0 -9,619 0
Dividends paid 0 0 0 0 0 0 0 0 -85,933 0 -85,933 Total transactions with owners, recognised in equity
0 -9,619 9,619 0 0 0 0 50,488 447 -146,487 -95,552
Balance at 31 Dec 2016 54,732 -29,690 29,690 105,897 14,990 30,000 -9,994 1,102,165 49,405 93,253 1,440,448

Unaudited consolidated financial statements of the Krka Group and unaudited financial statements of Krka, d. d., Novo mesto for 2017
28
Unaudited Statement of Cash Flows of Krka, d. d., Novo mesto
In € thousand 2017 2016
CASH FLOWS FROM OPERATING ACTIVITIES
Net profit 153,730 102,872
Adjustments for: 110,280 116,846
– amortisation/depreciation 81,674 81,765 – foreign exchange differences 148 -4,689 – investment income -25,326 -34,836 – investment expenses 30,074 70,391 – interest expenses and other financial expenses 2,178 2,675 – income tax 21,532 1,540 Operating profit before changes in net operating current assets 264,010 219,718
Change in trade receivables 8,193 -88,001 Change in inventories -27,960 -5,646 Change in trade payables 18,131 6,218 Change in provisions 4,927 1,238 Change in deferred revenues -380 -380 Change in other current liabilities 5,234 3,201 Income tax paid 293 -16,266 Net cash from operating activities 272,448 120,082
CASH FLOWS FROM INVESTING ACTIVITIES Interest received 882 1,379 Proceeds from sale of current investments 2 0 Dividends received 15 835 Proportionate profit of subsidiaries 1,027 11,051 Proceeds from sale of property, plant and equipment 581 945 Purchase of intangible assets -4,917 -4,140 Purchase of property, plant and equipment -87,989 -66,201 Acquisition of subsidiaries and a share of minority interest without obtained assets
-951 -19,250
Refund of subsequent payments in subsidiaries 237 79 Non-current loans -2,169 -2,512 Proceeds from repayment of non-current loans 17,221 5,198 Payments to acquire non-current investments -45 -71 Proceeds from sale of non-current investments 40 68 Proceeds in connection with current investments and loans 9,597 32,928 Payments in connection with derivative financial instruments -27,094 -45,041 Proceeds from derivative financial instruments 9,474 21,292 Net cash used in investing activities -84,089 -63,440
CASH FLOWS FROM FINANCING ACTIVITIES Interest paid -839 -1,355 Repayment of non-current borrowings 0 -500 Acquisition/Repayment of current borrowings -77,655 39,666 Dividends and other profit shares paid -88,749 -86,001 Repurchase of treasury shares -10,898 -9,619 Net cash used in financing activities -178,141 -57,809
Net increase/decrease in cash and cash equivalents 10,218 -1,167
Cash and cash equivalents at beginning of the year 24,049 24,622 Effect of exchange rate fluctuations on cash held -150 594 Net cash and cash equivalents at end of the year 34,117 24,049