unaudited interim results of grand parade … · unaudited interim results gnd pde inetent liited...
TRANSCRIPT
UNAUDITED INTERIM RESULTS OF GRAND PARADE INVESTMENTS LIMITED (GPI) FOR THE SIX MONTHS ENDED 31 DECEMBER 2015
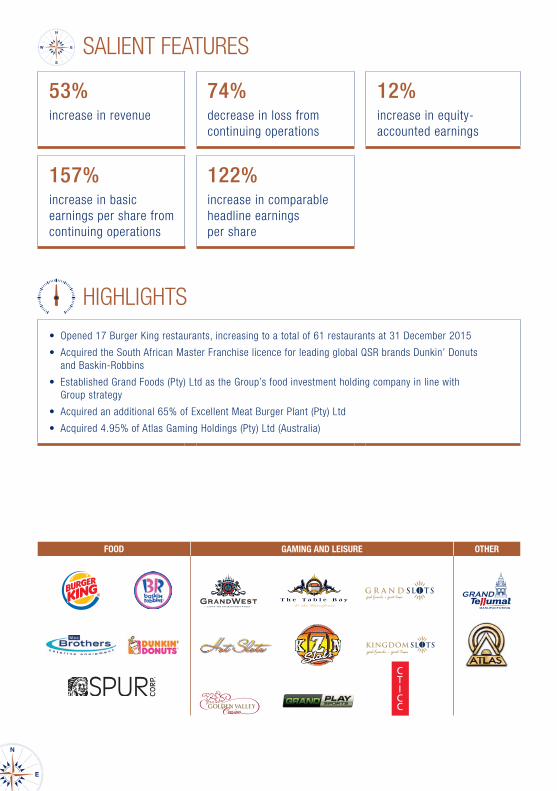
SALIENT FEATURES
53% increase in revenue
74%decrease in loss from continuing operations
12%increase in equity- accounted earnings
157%increase in basic earnings per share from continuing operations
122%increase in comparable headline earnings per share
• Opened 17 Burger King restaurants, increasing to a total of 61 restaurants at 31 December 2015
• Acquired the South African Master Franchise licence for leading global QSR brands Dunkin’ Donuts and Baskin-Robbins
• Established Grand Foods (Pty) Ltd as the Group’s food investment holding company in line with Group strategy
• Acquired an additional 65% of Excellent Meat Burger Plant (Pty) Ltd
• Acquired 4.95% of Atlas Gaming Holdings (Pty) Ltd (Australia)
FOOD OTHERGAMING AND LEISURE
HIGHLIGHTS
UNAUDITED INTERIM RESULTSGrand Parade Investments Limited (GPI) for the six months ended 31 December 2015
1
INTRODUCTIONGrand Parade Investments Limited (GPI) is an active empowerment investment holding company, with its current investments predominantly in the South African Food, Gaming and Leisure sectors.
During the current period, GPI focused on executing its food strategy by establishing Grand Foods (Pty) Ltd (Grand Foods). This entity will act as GPI’s food-related investment holding company, which will hold all of the current and future restaurant brands and supporting supply chain investments. In line with this, Grand Foods acquired the South African Master Franchise licences for Dunkin’ Donuts and Baskin-Robbins, two leading global quick-service restaurant (QSR) brands, to add to its strong Burger King roll-out. In addition, Grand Foods acquired control of Excellent Meat Burger Plant (Pty) Ltd (Excellent Meat Burger Plant) – the production plant that manufactures Burger King’s beef burger patties – to leverage cost synergies and potential foreign demand. Excellent Meat Burger Plant was renamed Grand Foods Meat Plant (Pty) Ltd (GF Meat Plant).
GPI continued to work towards concluding the second tranche disposal of 25% of GPI Slots (Pty) Ltd (GPI Slots) to Sun International Limited (Sun). The final condition required to be fulfilled in order to conclude the transaction is the approval of the transaction by the respective provincial gambling boards as the Competition Commission has approved the transaction.
Despite the weak local economy and the significant pressure on consumers during the period, GPI has reported an improvement in its earnings from continuing operations as a result of a strong improvement in Burger King’s operating results. Basic earnings per share from continuing operations increased by 157% to 5.67 cents per share. In the prior period, basic earnings per share included earnings from discontinued operations of 139.69 cents per share. These earnings represented a gain recognised on the loss of control of GPI Slots when 25.1% of the investment was sold. This one-off gain has resulted in a 96% decrease in basic earnings per share from 129.69 cents in the prior period to 5.67 cents.
Headline earnings per share declined by 35% to 2.05 cents per share. As a result of the staged disposal of GPI Slots, the portion of GPI Slots’ earnings recognised in the Group’s headline earnings has reduced from 100% in the prior period to 30% in the current period. Had the earnings from GPI Slots been reduced to 30% in the prior period, the current period’s headline earnings would have increased by 122%.
REVIEW OF INVESTMENT ACTIVITIESDuring the six months ended 31 December 2015, GPI concluded the following transactions:
• On 3 August 2015, GPI acquired 4.95% of Atlas Gaming Holdings (Pty) Ltd (Atlas) for R5.8 million. Atlas is a gaming software and machine development company based in Melbourne, Australia that designs and sells gaming machines to the Australian casino market. It will expand its operations to Africa through an exclusive licence agreement with GPI. GPI has been granted options that allow for future acquisitions of up to 25.1% of the equity in Atlas.
• On 16 August 2015, GPI entered into a licence and distribution agreement with Atlas which gives GPI the exclusive rights to manufacture and sell gaming machines designed by Atlas in Africa for a three-year period. GPI has established Atlas Gaming South Africa (Pty) Ltd (Atlas SA), a wholly-owned subsidiary, which will sell the machines. The manufacture of the machines will be sub-contracted to Grand Tellumat Manufacturing (Pty) Ltd (GTM).
• On 16 October 2015, GPI acquired an additional 2.6 million shares in Worcester Casino (Pty) Ltd (Worcester Casino) for R30.1 million as part of a rights issue. Worcester Casino raised a total of R120.0 million in terms of the rights issue and utilised the proceeds to reduce its debt facilities. Historically, Worcester Casino’s operating profits have not covered its debt servicing charges, however, the elimination of the debt facility has removed the debt service costs and it is expected to enable the company to report a profit before tax in the future.
• On 26 October 2015, GPI acquired 65.0% of GF Meat Plant from Excellent Holdings (Pty) Ltd and Nadesons Investments (Pty) Ltd (Nadesons Investments) for R35.8 million. The acquisition increased GPI’s effective holding in GF Meat Plant to 96.9% and gave GPI control of the investment. The remaining 35% of GF Meat Plant is held through Burger King, a 91.1% subsidiary of GPI.
SUBSEQUENT EVENTSSubsequent to the six months ended 31 December 2015, GPI concluded the following transactions:
• On 18 January 2016, GPI acquired two industrial properties in Goodwood, Cape Town that are leased by GF Meat Plant, for R30.0 million. A new debt facility was raised to cover the full value of the purchase price.
• On 22 January 2016, GPI acquired the South African Master Franchise licences for Dunkin’ Donuts and Baskin-Robbins for a combined cost of R12.3 million. The licences extend for an initial period of 10 years with an option to extend for a further 10 years. Dunkin’ Donuts is one of the world’s leading coffee and bakery chains, with over 11 500 restaurants in 40 countries. The terms of the Dunkin’ Donuts licence require that GPI opens 80 corporate-owned restaurants and 210 franchised restaurants over 10 years. Baskin-Robbins is the world’s largest chain of speciality ice cream stores, with 7 600 stores in 50 countries. The terms of the Baskin-Robbins licence require that GPI opens 71 corporate-owned stores over a 10-year period. The Master Franchise licences of both Dunkin’ Donuts and Baskin-Robbins give GPI a right of first refusal to enter Namibia, Botswana, Zambia and Mauritius.
• The acquisition of the rights to the Dunkin’ Donuts and Baskin-Robbins brands was a part of creating Grand Foods, which will act as the investment holding company for all of GPI’s food-related investments.
2 UNAUDITED INTERIM RESULTSGrand Parade Investments Limited (GPI) for the six months ended 31 December 2015
FINANCIAL REVIEW
Group Earnings ReviewGPI reported a R24.0 million profit from continuing operations for the period, which is a 150% increase from the R48.1 million loss reported in the prior period. The improvement is a result of the following factors:
• Burger King reduced its loss for the period to R13.9 million, which is a 62% reduction from the R36.8 million loss reported in the prior period. The improvement is a result of GPI’s executive management intervention, a significant improvement in operating margins and the continued roll-out of new restaurants.
• Driven by the improved operating performances of GPI Slots and GTM, earnings from equity-accounted investments increased to R68.7 million for the period, which is 12% higher than the prior period.
• A R18.7 million fair value gain on GPI’s existing 35.0% holding in GF Meat Plant was recognised in profit or loss as a result of acquiring control of the investment.
A R24.1 million fair value loss was recognised in other comprehensive income related to GPI’s investment in Spur Corporation Limited (Spur) as a result of a decrease in the Spur share price on 31 December 2015. This resulted in a total comprehensive loss from the period of R0.1 million.
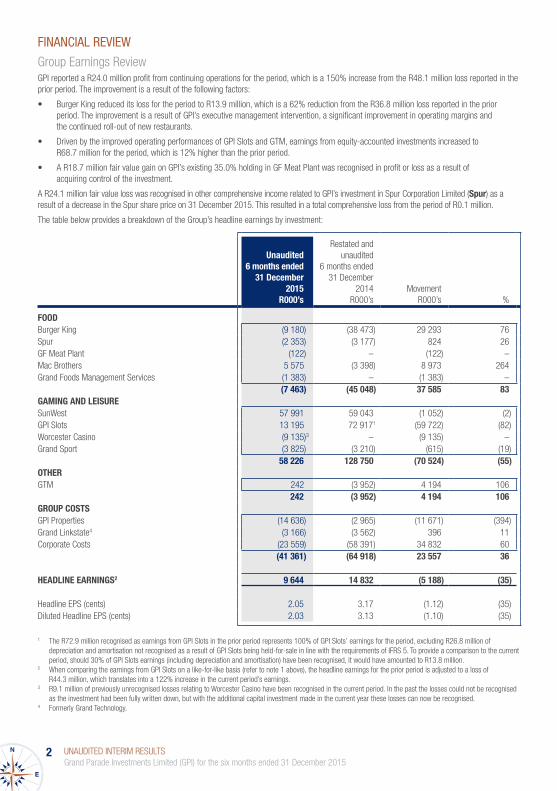
The table below provides a breakdown of the Group’s headline earnings by investment:
Unaudited6 months ended
31 December 2015
R000’s
Restated andunaudited
6 months ended31 December
2014R000’s
MovementR000’s %
FOODBurger King (9 180) (38 473) 29 293 76Spur (2 353) (3 177) 824 26GF Meat Plant (122) – (122) –Mac Brothers 5 575 (3 398) 8 973 264Grand Foods Management Services (1 383) – (1 383) –
(7 463) (45 048) 37 585 83GAMING AND LEISURESunWest 57 991 59 043 (1 052) (2)GPI Slots 13 195 72 9171 (59 722) (82)Worcester Casino (9 135)3 – (9 135) –Grand Sport (3 825) (3 210) (615) (19)
58 226 128 750 (70 524) (55)OTHERGTM 242 (3 952) 4 194 106
242 (3 952) 4 194 106GROUP COSTS GPI Properties (14 636) (2 965) (11 671) (394)Grand Linkstate4 (3 166) (3 562) 396 11Corporate Costs (23 559) (58 391) 34 832 60
(41 361) (64 918) 23 557 36
HEADLINE EARNINGS2 9 644 14 832 (5 188) (35)
Headline EPS (cents) 2.05 3.17 (1.12) (35)Diluted Headline EPS (cents) 2.03 3.13 (1.10) (35)
1 The R72.9 million recognised as earnings from GPI Slots in the prior period represents 100% of GPI Slots’ earnings for the period, excluding R26.8 million of depreciation and amortisation not recognised as a result of GPI Slots being held-for-sale in line with the requirements of IFRS 5. To provide a comparison to the current period, should 30% of GPI Slots earnings (including depreciation and amortisation) have been recognised, it would have amounted to R13.8 million.
2 When comparing the earnings from GPI Slots on a like-for-like basis (refer to note 1 above), the headline earnings for the prior period is adjusted to a loss of R44.3 million, which translates into a 122% increase in the current period’s earnings.
3 R9.1 million of previously unrecognised losses relating to Worcester Casino have been recognised in the current period. In the past the losses could not be recognised as the investment had been fully written down, but with the additional capital investment made in the current year these losses can now be recognised.
4 Formerly Grand Technology.
UNAUDITED INTERIM RESULTSGrand Parade Investments Limited (GPI) for the six months ended 31 December 2015
3
Group Earnings Review (continued)
Headline earnings for the period decreased by 35% to R9.6 million compared to R14.8 million in the prior period. The earnings have decreased as a result of the transaction that was concluded in the prior year to partially dispose of GPI Slots, which resulted in the portion of the GPI Slots’ earnings that GPI recognises decreasing from 100% in the prior year to 30% in the current year.
The headline earnings per share for the period was 2.05 cents, which also decreased by 35% compared to the 3.17 cents reported in the prior period, as a result of the reduced recognition of GPI Slots’ earnings.
The Food investment’s contribution to the Group’s headline earnings improved by 83% as a result of improved operating results from Burger King and Mac Brothers.
The Gaming and Leisure investment’s contribution to the Group’s headline earnings decreased by 55% due to a lower portion of GPI Slots’ earnings being recognised in the current period and R9.1 million in previously unrecognised losses in Worcester that were recognised in the current period.
The other investments, which only contains GTM, reversed its loss contribution of R4.0 million in the prior period to an earnings contribution of R0.2 million in the current period as a result of improved revenues and operating margins in GTM.
The Group costs for the period of R41.3 million have been reduced by 36% when compared to the R64.9 million recognised in the prior period. The reduction is due to a rationalisation of head office employee-related costs and a reduction of the net interest charge at a holding company level.
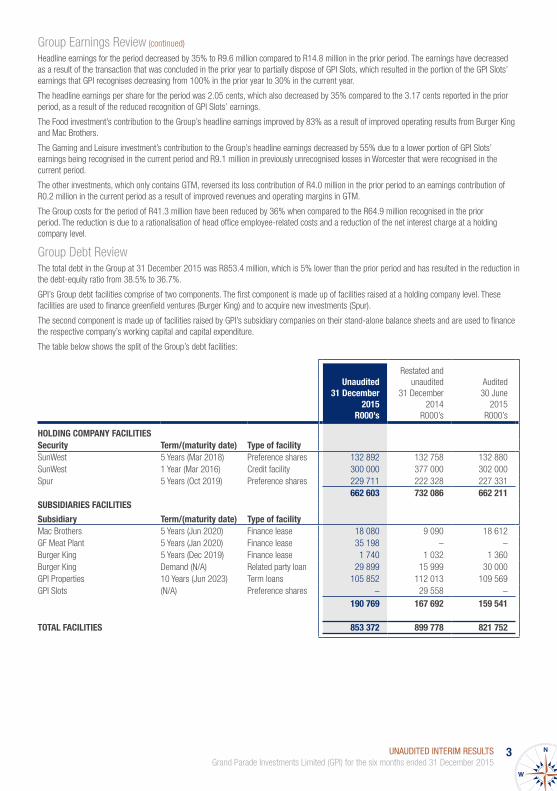
Group Debt Review The total debt in the Group at 31 December 2015 was R853.4 million, which is 5% lower than the prior period and has resulted in the reduction in the debt-equity ratio from 38.5% to 36.7%.
GPI’s Group debt facilities comprise of two components. The first component is made up of facilities raised at a holding company level. These facilities are used to finance greenfield ventures (Burger King) and to acquire new investments (Spur).
The second component is made up of facilities raised by GPI’s subsidiary companies on their stand-alone balance sheets and are used to finance the respective company’s working capital and capital expenditure.
The table below shows the split of the Group’s debt facilities:
Unaudited31 December
2015R000’s
Restated andunaudited
31 December 2014
R000’s
Audited30 June
2015R000’s
HOLDING COMPANY FACILITIESSecurity Term/(maturity date) Type of facilitySunWest 5 Years (Mar 2018) Preference shares 132 892 132 758 132 880SunWest 1 Year (Mar 2016) Credit facility 300 000 377 000 302 000Spur 5 Years (Oct 2019) Preference shares 229 711 222 328 227 331
662 603 732 086 662 211SUBSIDIARIES FACILITIES
Subsidiary Term/(maturity date) Type of facilityMac Brothers 5 Years (Jun 2020) Finance lease 18 080 9 090 18 612GF Meat Plant 5 Years (Jan 2020) Finance lease 35 198 – –Burger King 5 Years (Dec 2019) Finance lease 1 740 1 032 1 360Burger King Demand (N/A) Related party loan 29 899 15 999 30 000GPI Properties 10 Years (Jun 2023) Term loans 105 852 112 013 109 569GPI Slots (N/A) Preference shares – 29 558 –
190 769 167 692 159 541
TOTAL FACILITIES 853 372 899 778 821 752
4 UNAUDITED INTERIM RESULTSGrand Parade Investments Limited (GPI) for the six months ended 31 December 2015
REVIEW OF INVESTMENT PORTFOLIOS’ OPERATIONS
FOOD
BURGER KING (EFFECTIVE HOLDING 91.1%)Burger King delivered a significantly improved performance. During the period it reported a loss after tax of R23.9 million, which is 41% lower than the loss of R40.3 million in the prior period. Revenues increased by 66% to R224.4 million and the four-wall EBITDA (restaurant operating profit before head office cost and franchise fees) increased by 352% to R12.2 million. The total Burger King EBITDA loss of R13.4 million was significantly reduced from the R47.3 million loss in the prior year.
Burger King opened 17 new restaurants during the period at an average cost of R7.9 million per restaurant, taking the total number of restaurants to 61 at 31 December 2015. Burger King is ahead of its development schedule as per its Master Franchise licence which required 23 restaurants to be opened by 31 December 2015.
The effect of the drought throughout South Africa and the related increase in food prices did not affect the margins during the period. It will, however, put significant pressure on the gross margin during the next six months to June 2016.
Burger King will continue with its development schedule and has targeted to have 80 plus restaurants open at 30 June 2016.
There is a clear focus to improve the average monthly restaurant sales and to maintain the current gross margin despite significant increases in food input costs.
SPUR (EFFECTIVE HOLDING 10.0%)
In their own results, Spur delivered solid results against the backdrop of poor economic conditions by increasing its total restaurant sales by 12.6% to R3.5 billion. 51 new restaurants were opened across all their brands, taking the total number of restaurants to 572. Headline earnings increased by 79.6% to R97.9 million and an interim dividend of 67 cents per share was declared in February 2016, which will result in GPI receiving a R7.3 million dividend in March 2016.
GPI’s holding in Spur remained unchanged during the period and received a dividend of R7.6 million. The finance charges related to the Spur funding structure amounted to R9.8 million, which resulted in a R2.4 million shortfall.
GF MEAT PLANT (EFFECTIVE HOLDING 96.9%)GF Meat Plant increased its revenue by 49% to R34.4 million and its EBITDA increased to R4.5 million.
The production plant commenced operations in October 2014 and hence only operated for three months of the prior period. By reason of the abovementioned, depreciation increased by 100% to R4.4 million, which resulted in a loss before tax of R0.9 million, which is, in turn, 31% higher than the prior period.
GPI acquired control of GF Meat Plant on 26 October 2015 and consolidated its results from that date.
MAC BROTHERS (EFFECTIVE HOLDING 100.0%)Mac Brothers increased its net profit after tax for the period by 89% to R7.0 million. Revenue for the period increased by 30.0% to R159.0 million as a result of a 58% increase in sales to Burger King, a 20% increase in South African sales (other than Burger King) and a 17% increase in African sales. EBITDA improved by 62% to R13.0 million and the EBITDA margin improved from 6.6% to 8.2% due to a focus on maintaining controllable costs.
The Mac Brothers’ forward order book at 31 December 2015 is very positive and the business is looking to take advantage of the weak rand by obtaining import replacement orders for its manufacturing division.
GRAND FOODS MANAGEMENT SERVICES (EFFECTIVE HOLDING 100.0%)Grand Foods has been established as the investment holding company for GPI’s food-related investments. Grand Foods has established a wholly-owned subsidiary called Grand Foods Management Services to provide shared services such as finance and accounting, human resources and call centre services to the respective investments under Grand Foods.
It is expected that by sharing certain services across Grand Foods’ businesses, these costs would be able to be maintained at much lower levels than if they were provided in each business separately.
Grand Foods Management Services recognised expenses of R1.4 million during the period, which relate to the establishment of a centralised procurement department (R0.8 million) and transaction costs related to the acquisition of Grand Foods Meat Plant (R0.6 million).
Grand Foods Management Services will enter into service level agreements with the respective businesses during the second half of the financial year, and be will run as a profit centre.
UNAUDITED INTERIM RESULTSGrand Parade Investments Limited (GPI) for the six months ended 31 December 2015
5
GAMING AND LEISURE
SUNWEST (EFFECTIVE HOLDING 25.1%)SunWest increased its revenue by 4.1% to R1.27 billion as a result of a 2.4% increase in GrandWest’s revenue and a 20.2% increase in Table Bay’s revenue. Its net profit after tax reduced by 1.6% to R256.1 million due to an increase in finance costs.
Despite the decrease in earnings, SunWest kept its ordinary dividend constant for the period at R260.0 million and also declared a special dividend of R120.0 million.
GPI recognised R64.3 million in equity-accounted earnings for the period and received R95.4 million in dividends.
GPI SLOTS (EFFECTIVE HOLDING 74.9%)GPI Slots continued to deliver excellent results and reported a 23% increase in its EBITDA to R111.4 million. Revenue for the period increased by 19% to R467.6 million, however, its profit after tax decreased by 4% to R44.3 million as a result of finance costs on shareholder loans. Net profit after tax increased by 25%, excluding interest on shareholder loans.
GPI recognised R13.2 million in equity-accounted earnings, which represents 30.0% of GPI Slots’ earning for the period, and R9.2 million interest from its shareholder loan. In the prior period, GPI recognised 100.0% of GPI Slots earnings, excluding depreciation and amortisation costs of R26.8 million, which amounted to R72.9 million.
WORCESTER CASINO (EFFECTIVE HOLDING 25.1%)
Worcester Casino’s revenue increased by 13% to R82.8 million and its EBITDA improved by 39% to R13.4 million. Finance charges decreased by 15% as a result of a reduction in its debt facilities, which resulted in a net profit after tax of R0.1 million.
Worcester raised R120.0 million via a rights issue that GPI participated in and contributed R30.1 million to – a contribution which is representative of their proportional share in Worcester Casino. The proceeds from the rights issue were used to reduce the debt facilities in the business.
GPI recognised its R30.1 million capital contribution on the statement of financial position and R9.1 million of previously unrecognised losses (relating to Worcester Casino) in profit or loss, which reduced the carrying value of Worcester Casino to R21.0 million.
OTHER INVESTMENTS
GTM (EFFECTIVE HOLDING 51.0%)
GTM’s revenue of R74.3 million for the period was significantly higher than the R19.8 million reported in the prior period (four-month trading period). This resulted in a profit after tax of R0.5 million.
GTM’s order book at 31 December 2015 is very encouraging and includes a contract to manufacture 500 000 set-top boxes.
GROUP COSTS
CENTRAL COSTS
GPI incurred central costs of R23.6 million during the period, which is 60% lower than the prior period. The costs reduction is a result of a R6.8 million saving on head office employee-related costs, and a R11.0 million reduction in the net interest charge at a head office level.
RELATED-PARTY TRANSACTIONS On 26 October 2015, GPI acquired 5.0% of GF Meat Plant from Nadesons Investments for R2.9 million. Hassen Adams and Alan Keet are both executive directors of GPI and are affiliates of Nadesons Investments.
In addition to this transaction, the Group, in the ordinary course of business, entered into various transactions with related parties consistent with those as reported at 30 June 2015. During the year, employees exercised share options with the strike price settled by both loan financing and cash.
DIVIDENDS No dividends were declared during the period as a result of the delay in concluding the second tranche disposal of GPI Slots. GPI is currently reviewing its dividend policy to take into consideration the expansion of its food-related investments. GPI intends to remain a dividend-active company going forward.
DIRECTORATE There were no changes in the directors during the period, save for the appointment of Mr Rasheed Hargey as non-executive director on 1 September 2015.
6 UNAUDITED INTERIM RESULTSGrand Parade Investments Limited (GPI) for the six months ended 31 December 2015
PROSPECTS It is expected that the local economy will continue to come under pressure for the remainder of the financial year with further increases in interest rates, continued food price increases and the weakened rand. These factors will have an effect, both positive and negative, on GPI’s Food and Gaming and Leisure investments and GPI is confident that each investment is being actively managed so as to limit the impact on the respective businesses.
GPI will focus on the following for the remainder of the financial year:
• To continue working on eliminating the discount currently being applied by the market to the fair value of its investment in SunWest as a result of the expiry of GrandWest’s exclusivity term.
• To conclude the second tranche disposal of GPI Slots.
• To continue with the development of Burger King.
• To successfully launch the first Dunkin’ Donuts restaurant in South Africa.
• To reduce the Group’s gearing level to within its targeted debt equity range of between 20% and 35%.
GPI and its management team is in a strong position to navigate their investments through the current economic downturn and are committed to increasing value to shareholders while also creating jobs for the country.
For and on behalf of the Board
H Adams A KeetExecutive Chairman Chief Executive Officer
16 March 2016 16 March 2016
Prepared under the supervision of: Financial Director, D Pienaar CA(SA)
DIRECTORS
H Adams (Executive Chairman), A Abercrombie#, W Geach#*, A Keet (Chief Executive Officer), Dr N Maharaj#*, N Mlambo#*, D Pienaar (Financial Director), C Priem#*, R Hargey#*
(# non-executive * independent)
REGISTERED OFFICE SPONSOR
10th Floor, 33 On Heerengracht PSG Capital (Pty) Ltd Heerengracht Street, Foreshore, Cape Town, 8001(PO Box 6563, Roggebaai, 8012)
TRANSFER SECRETARIES COMPANY SECRETARY
Computershare Investor Services (Pty) Ltd Lazelle Parton70 Marshall Street, Johannesburg, 2001
ATTORNEYS REGISTRATION NUMBER
Bernadt Vukic Potash & Getz Attorneys 1997/003548/06
CORPORATE ADVISORS ISIN
Leaf Capital (Pty) Ltd ZAE000119814
SHARE CODE
GPL
UNAUDITED INTERIM RESULTSGrand Parade Investments Limited (GPI) for the six months ended 31 December 2015
7
Note
Unaudited6 months
ended31 December
2015R000’s
Restated and unaudited6 months
ended31 December
2014R000’s
Audited12 months
ended30 June
2015R000’s
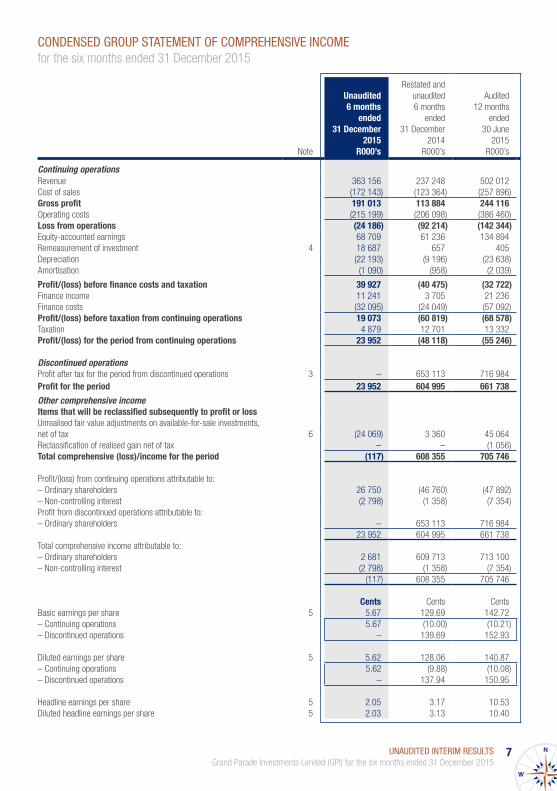
Continuing operationsRevenue 363 156 237 248 502 012Cost of sales (172 143) (123 364) (257 896)Gross profit 191 013 113 884 244 116Operating costs (215 199) (206 098) (386 460)Loss from operations (24 186) (92 214) (142 344)Equity-accounted earnings 68 709 61 236 134 894Remeasurement of investment 4 18 687 657 405Depreciation (22 193) (9 196) (23 638)Amortisation (1 090) (958) (2 039)
Profit/(loss) before finance costs and taxation 39 927 (40 475) (32 722)Finance income 11 241 3 705 21 236Finance costs (32 095) (24 049) (57 092)Profit/(loss) before taxation from continuing operations 19 073 (60 819) (68 578)Taxation 4 879 12 701 13 332Profit/(loss) for the period from continuing operations 23 952 (48 118) (55 246)
Discontinued operationsProfit after tax for the period from discontinued operations 3 – 653 113 716 984Profit for the period 23 952 604 995 661 738
Other comprehensive incomeItems that will be reclassified subsequently to profit or lossUnrealised fair value adjustments on available-for-sale investments, net of tax 6 (24 069) 3 360 45 064Reclassification of realised gain net of tax – – (1 056)Total comprehensive (loss)/income for the period (117) 608 355 705 746
Profit/(loss) from continuing operations attributable to:– Ordinary shareholders 26 750 (46 760) (47 892)– Non-controlling interest (2 798) (1 358) (7 354)Profit from discontinued operations attributable to:– Ordinary shareholders – 653 113 716 984
23 952 604 995 661 738Total comprehensive income attributable to:– Ordinary shareholders 2 681 609 713 713 100– Non-controlling interest (2 798) (1 358) (7 354)
(117) 608 355 705 746
Cents Cents CentsBasic earnings per share 5 5.67 129.69 142.72– Continuing operations 5.67 (10.00) (10.21)– Discontinued operations – 139.69 152.93
Diluted earnings per share 5 5.62 128.06 140.87– Continuing operations 5.62 (9.88) (10.08)– Discontinued operations – 137.94 150.95
Headline earnings per share 5 2.05 3.17 10.53Diluted headline earnings per share 5 2.03 3.13 10.40
CONDENSED GROUP STATEMENT OF COMPREHENSIVE INCOME for the six months ended 31 December 2015
8 UNAUDITED INTERIM RESULTSGrand Parade Investments Limited (GPI) for the six months ended 31 December 2015
Note
Unaudited31 December
2015R000’s
Restated and unaudited*
31 December2014
R000’s
Audited30 June
2015R000’s
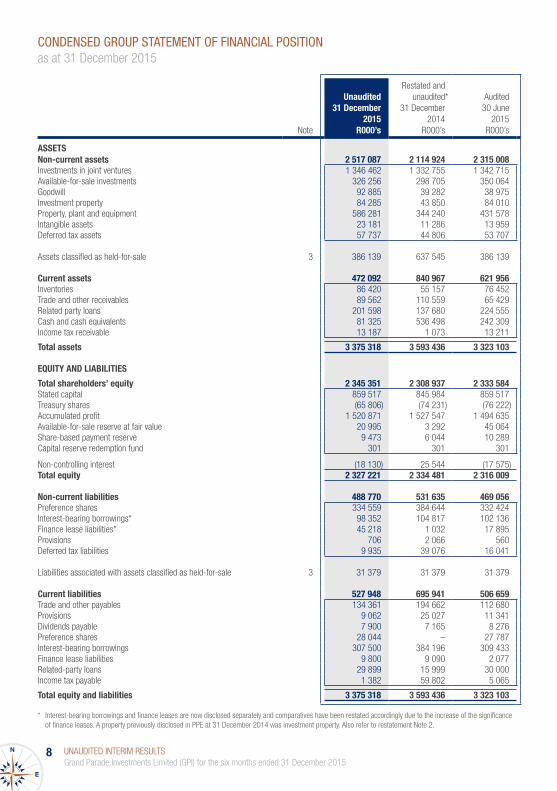
ASSETS Non-current assets 2 517 087 2 114 924 2 315 008Investments in joint ventures 1 346 462 1 332 755 1 342 715Available-for-sale investments 326 256 298 705 350 064Goodwill 92 885 39 282 38 975Investment property 84 285 43 850 84 010Property, plant and equipment 586 281 344 240 431 578Intangible assets 23 181 11 286 13 959Deferred tax assets 57 737 44 806 53 707
Assets classified as held-for-sale 3 386 139 637 545 386 139
Current assets 472 092 840 967 621 956Inventories 86 420 55 157 76 452Trade and other receivables 89 562 110 559 65 429Related party loans 201 598 137 680 224 555Cash and cash equivalents 81 325 536 498 242 309Income tax receivable 13 187 1 073 13 211
Total assets 3 375 318 3 593 436 3 323 103
EQUITY AND LIABILITIES
Total shareholders’ equity 2 345 351 2 308 937 2 333 584Stated capital 859 517 845 984 859 517Treasury shares (65 806) (74 231) (76 222)Accumulated profit 1 520 871 1 527 547 1 494 635Available-for-sale reserve at fair value 20 995 3 292 45 064Share-based payment reserve 9 473 6 044 10 289Capital reserve redemption fund 301 301 301
Non-controlling interest (18 130) 25 544 (17 575)Total equity 2 327 221 2 334 481 2 316 009
Non-current liabilities 488 770 531 635 469 056Preference shares 334 559 384 644 332 424Interest-bearing borrowings* 98 352 104 817 102 136Finance lease liabilities* 45 218 1 032 17 895Provisions 706 2 066 560Deferred tax liabilities 9 935 39 076 16 041
Liabilities associated with assets classified as held-for-sale 3 31 379 31 379 31 379
Current liabilities 527 948 695 941 506 659Trade and other payables 134 361 194 662 112 680Provisions 9 062 25 027 11 341Dividends payable 7 900 7 165 8 276Preference shares 28 044 – 27 787Interest-bearing borrowings 307 500 384 196 309 433Finance lease liabilities 9 800 9 090 2 077Related-party loans 29 899 15 999 30 000Income tax payable 1 382 59 802 5 065
Total equity and liabilities 3 375 318 3 593 436 3 323 103
* Interest-bearing borrowings and finance leases are now disclosed separately and comparatives have been restated accordingly due to the increase of the significance of finance leases. A property previously disclosed in PPE at 31 December 2014 was investment property. Also refer to restatement Note 2.
CONDENSED GROUP STATEMENT OF FINANCIAL POSITION as at 31 December 2015
UNAUDITED INTERIM RESULTSGrand Parade Investments Limited (GPI) for the six months ended 31 December 2015
9
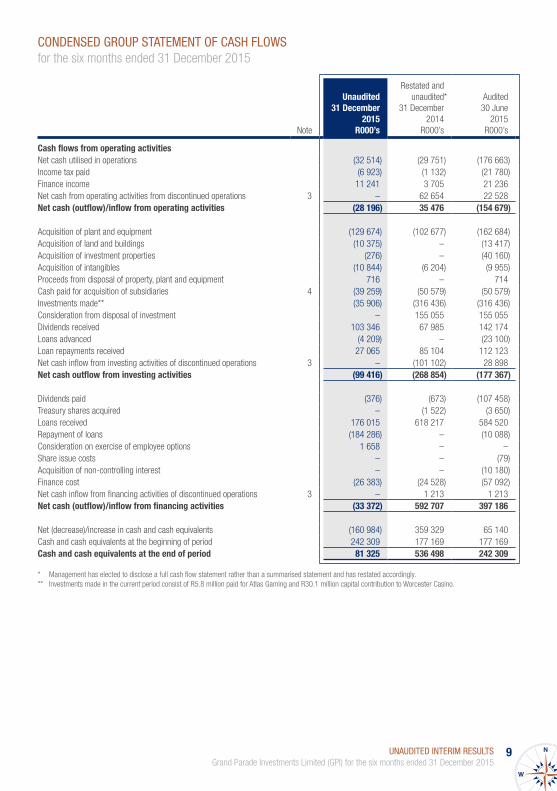
CONDENSED GROUP STATEMENT OF CASH FLOWS for the six months ended 31 December 2015
Note
Unaudited31 December
2015R000’s
Restated andunaudited*
31 December2014
R000’s
Audited30 June
2015R000’s
Cash flows from operating activitiesNet cash utilised in operations (32 514) (29 751) (176 663)Income tax paid (6 923) (1 132) (21 780)Finance income 11 241 3 705 21 236Net cash from operating activities from discontinued operations 3 – 62 654 22 528Net cash (outflow)/inflow from operating activities (28 196) 35 476 (154 679)
Acquisition of plant and equipment (129 674) (102 677) (162 684)Acquisition of land and buildings (10 375) – (13 417)Acquisition of investment properties (276) – (40 160)Acquisition of intangibles (10 844) (6 204) (9 955)Proceeds from disposal of property, plant and equipment 716 – 714Cash paid for acquisition of subsidiaries 4 (39 259) (50 579) (50 579)Investments made** (35 906) (316 436) (316 436)Consideration from disposal of investment – 155 055 155 055Dividends received 103 346 67 985 142 174Loans advanced (4 209) – (23 100)Loan repayments received 27 065 85 104 112 123Net cash inflow from investing activities of discontinued operations 3 – (101 102) 28 898Net cash outflow from investing activities (99 416) (268 854) (177 367)
Dividends paid (376) (673) (107 458)Treasury shares acquired – (1 522) (3 650)Loans received 176 015 618 217 584 520Repayment of loans (184 286) – (10 088)Consideration on exercise of employee options 1 658 – –Share issue costs – – (79)Acquisition of non-controlling interest – – (10 180)Finance cost (26 383) (24 528) (57 092)Net cash inflow from financing activities of discontinued operations 3 – 1 213 1 213Net cash (outflow)/inflow from financing activities (33 372) 592 707 397 186
Net (decrease)/increase in cash and cash equivalents (160 984) 359 329 65 140Cash and cash equivalents at the beginning of period 242 309 177 169 177 169Cash and cash equivalents at the end of period 81 325 536 498 242 309
* Management has elected to disclose a full cash flow statement rather than a summarised statement and has restated accordingly.** Investments made in the current period consist of R5.8 million paid for Atlas Gaming and R30.1 million capital contribution to Worcester Casino.
10 UNAUDITED INTERIM RESULTSGrand Parade Investments Limited (GPI) for the six months ended 31 December 2015
Ordi
nary
sh
are
capi
tal
R000
’s
Trea
sury
sh
ares
R000
’s
Accu
mul
ated
pr
ofits
R000
’s
Avai
labl
e-fo
r-sa
le fa
ir va
lue
rese
rve
R000
’s
Shar
e-ba
sed
paym
ents
re
serv
eR0
00’s
Capi
tal
rede
mpt
ion
rese
rve
fund
R000
’s
Non-
cont
rollin
g in
tere
stR0
00’s
Tota
lR0
00’s
Bala
nce
at 3
0 Ju
ne 2
014
830
230
(72
709)
920
217
1 05
63
620
301
(9 4
07)
1 67
3 30
8To
tal c
ompr
ehen
sive
inco
me/
(loss
) fo
r the
per
iod
––
606
353
3 36
0–
–(1
358
)60
8 35
5–
Loss
for t
he p
erio
d fro
m c
ontin
uing
op
erat
ions
––
(46
760)
––
–(1
358
)(4
8 11
8)–
Profi
t for
the
perio
d fro
m d
isco
ntin
ued
oper
atio
ns–
–65
3 11
3–
––
–65
3 11
3–
Othe
r com
preh
ensi
ve in
com
e–
––
3 36
0–
––
3 36
0Pr
evio
usly
pres
crib
ed d
ivide
nds
paid
––
(147
)–
––
–(1
47)
Acqu
isiti
on o
f sub
sidi
ary
––
––
––
36 3
0936
309
Rele
ase
of a
vaila
ble-
for-
sale
rese
rve
––
1 12
4(1
124
)–
––
–Tr
easu
ry s
hare
s ac
quire
d–
(1 5
22)
––
––
–(1
522
)Sh
ares
issu
ed15
754
––
––
––
15 7
54Sh
are-
base
d pa
ymen
t exp
ense
––
––
2 42
4–
–2
424
Bala
nce
at 3
1 De
cem
ber 2
014
845
984
(74
231)
1 52
7 54
73
292
6 04
430
125
544
2 33
4 48
1To
tal c
ompr
ehen
sive
inco
me/
(loss
) fo
r the
per
iod
––
62 7
3940
648
––
(5 9
96)
97 3
91–
Loss
for t
he p
erio
d fro
m c
ontin
uing
op
erat
ions
––
(1 1
32)
––
–(5
996
)(7
128
)–
Profi
t for
the
perio
d fro
m d
isco
ntin
ued
oper
atio
ns–
–63
871
––
––
63 8
71–
Othe
r com
preh
ensi
ve in
com
e–
––
40 6
48–
––
40 6
48Di
viden
ds d
ecla
red
––
(107
894
)–
––
–(1
07 8
94)
Recy
clin
g of
ava
ilabl
e-fo
r-sa
le re
serv
e–
–(1
124
)1
124
––
––
Trea
sury
sha
res
acqu
ired
–(2
128
)–
––
––
(2 1
28)
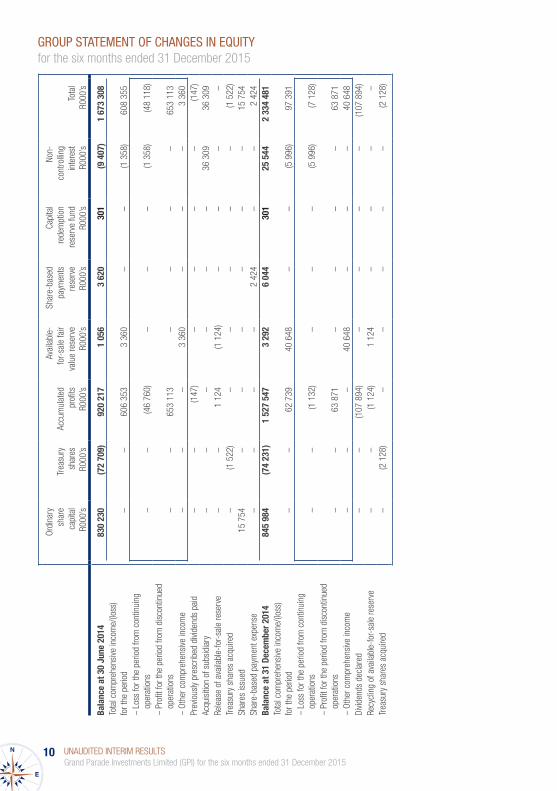
GROUP STATEMENT OF CHANGES IN EQUITY for the six months ended 31 December 2015
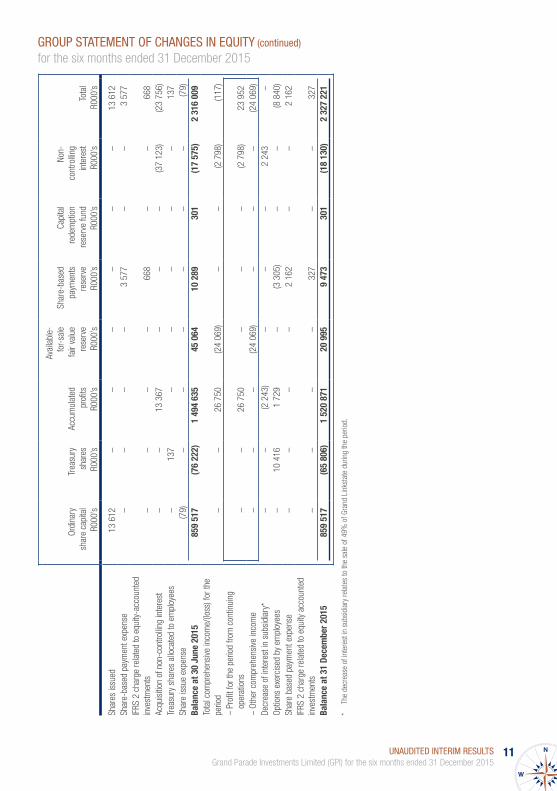
UNAUDITED INTERIM RESULTSGrand Parade Investments Limited (GPI) for the six months ended 31 December 2015
11
Ordi
nary
sh
are
capi
tal
R000
’s
Trea
sury
sh
ares
R000
’s
Accu
mul
ated
pro
fits
R000
’s
Avai
labl
e-fo
r-sa
lefa
ir va
lue
rese
rve
R000
’s
Shar
e-ba
sed
paym
ents
re
serv
eR0
00’s
Capi
tal
rede
mpt
ion
rese
rve
fund
R000
’s
Non-
cont
rollin
g in
tere
stR0
00’s
Tota
lR0
00’s
Shar
es is
sued
13 6
12–
––
––
–13
612
Shar
e-ba
sed
paym
ent e
xpen
se–
––
–3
577
––
3 57
7IF
RS 2
cha
rge
rela
ted
to e
quity
-acc
ount
ed
inve
stm
ents
––
––
668
––
668
Acqu
isiti
on o
f non
-con
trollin
g in
tere
st–
–13
367
––
–(3
7 12
3)(2
3 75
6)Tr
easu
ry s
hare
s al
loca
ted
to e
mpl
oyee
s–
137
––
––
–13
7Sh
are
issu
e ex
pens
e(7
9)–
––
––
–(7
9)Ba
lanc
e at
30
June
201
585
9 51
7(7
6 22
2)1
494
635
45 0
6410
289
301
(17
575)
2 31
6 00
9To
tal c
ompr
ehen
sive
inco
me/
(loss
) for
the
perio
d–
–26
750
(24
069)
––
(2 7
98)
(117
)–
Profi
t for
the
perio
d fro
m c
ontin
uing
op
erat
ions
––
26 7
50–
––
(2 7
98)
23 9
52–
Othe
r com
preh
ensi
ve in
com
e–
––
(24
069)
––
–(2
4 06
9)De
crea
se o
f int
eres
t in
subs
idia
ry*
––
(2 2
43)
––
–2
243
–Op
tions
exe
rcis
ed b
y em
ploy
ees
–10
416
1 72
9–
(3 3
05)
––
(8 8
40)
Shar
e ba
sed
paym
ent e
xpen
se–
––
–2
162
––
2 16
2IF
RS 2
cha
rge
rela
ted
to e
quity
acc
ount
ed
inve
stm
ents
––
––
327
––
327
Bala
nce
at 3
1 De
cem
ber 2
015
859
517
(65
806)
1 52
0 87
120
995
9 47
330
1(1
8 13
0)2
327
221
* Th
e de
crea
se o
f int
eres
t in
subs
idia
ry re
late
s to
the
sale
of 4
9% o
f Gra
nd L
inks
tate
dur
ing
the
perio
d.
GROUP STATEMENT OF CHANGES IN EQUITY (continued)
for the six months ended 31 December 2015
12 UNAUDITED INTERIM RESULTSGrand Parade Investments Limited (GPI) for the six months ended 31 December 2015
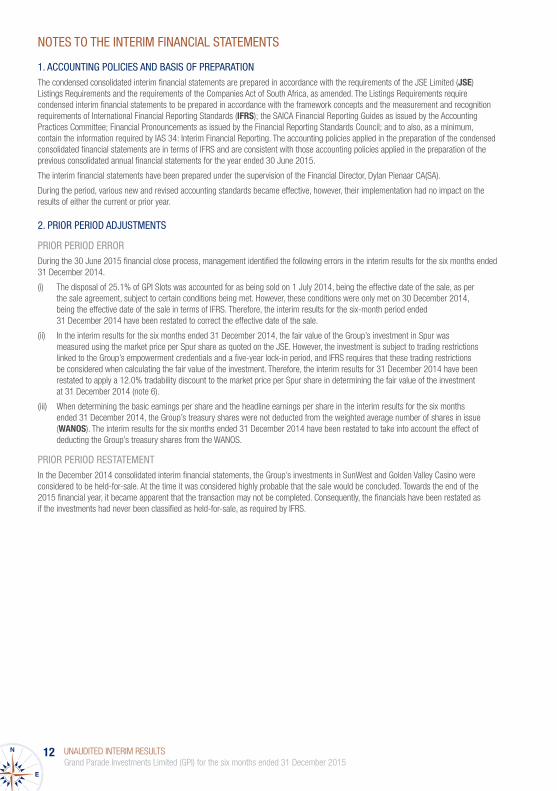
NOTES TO THE INTERIM FINANCIAL STATEMENTS
1. ACCOUNTING POLICIES AND BASIS OF PREPARATIONThe condensed consolidated interim financial statements are prepared in accordance with the requirements of the JSE Limited (JSE) Listings Requirements and the requirements of the Companies Act of South Africa, as amended. The Listings Requirements require condensed interim financial statements to be prepared in accordance with the framework concepts and the measurement and recognition requirements of International Financial Reporting Standards (IFRS); the SAICA Financial Reporting Guides as issued by the Accounting Practices Committee; Financial Pronouncements as issued by the Financial Reporting Standards Council; and to also, as a minimum, contain the information required by IAS 34: Interim Financial Reporting. The accounting policies applied in the preparation of the condensed consolidated financial statements are in terms of IFRS and are consistent with those accounting policies applied in the preparation of the previous consolidated annual financial statements for the year ended 30 June 2015.
The interim financial statements have been prepared under the supervision of the Financial Director, Dylan Pienaar CA(SA).
During the period, various new and revised accounting standards became effective, however, their implementation had no impact on the results of either the current or prior year.
2. PRIOR PERIOD ADJUSTMENTS
PRIOR PERIOD ERROR During the 30 June 2015 financial close process, management identified the following errors in the interim results for the six months ended 31 December 2014.
(i) The disposal of 25.1% of GPI Slots was accounted for as being sold on 1 July 2014, being the effective date of the sale, as per the sale agreement, subject to certain conditions being met. However, these conditions were only met on 30 December 2014, being the effective date of the sale in terms of IFRS. Therefore, the interim results for the six-month period ended 31 December 2014 have been restated to correct the effective date of the sale.
(ii) In the interim results for the six months ended 31 December 2014, the fair value of the Group’s investment in Spur was measured using the market price per Spur share as quoted on the JSE. However, the investment is subject to trading restrictions linked to the Group’s empowerment credentials and a five-year lock-in period, and IFRS requires that these trading restrictions be considered when calculating the fair value of the investment. Therefore, the interim results for 31 December 2014 have been restated to apply a 12.0% tradability discount to the market price per Spur share in determining the fair value of the investment at 31 December 2014 (note 6).
(iii) When determining the basic earnings per share and the headline earnings per share in the interim results for the six months ended 31 December 2014, the Group’s treasury shares were not deducted from the weighted average number of shares in issue (WANOS). The interim results for the six months ended 31 December 2014 have been restated to take into account the effect of deducting the Group’s treasury shares from the WANOS.
PRIOR PERIOD RESTATEMENTIn the December 2014 consolidated interim financial statements, the Group’s investments in SunWest and Golden Valley Casino were considered to be held-for-sale. At the time it was considered highly probable that the sale would be concluded. Towards the end of the 2015 financial year, it became apparent that the transaction may not be completed. Consequently, the financials have been restated as if the investments had never been classified as held-for-sale, as required by IFRS.
UNAUDITED INTERIM RESULTSGrand Parade Investments Limited (GPI) for the six months ended 31 December 2015
13
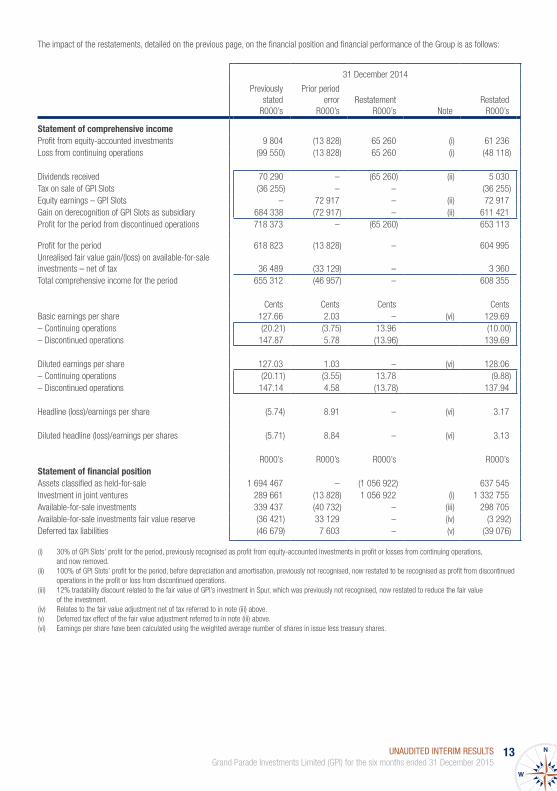
The impact of the restatements, detailed on the previous page, on the financial position and financial performance of the Group is as follows:
31 December 2014
Previously stated
R000’s
Prior period error
R000’sRestatement
R000’s NoteRestated
R000’s
Statement of comprehensive income Profit from equity-accounted investments 9 804 (13 828) 65 260 (i) 61 236Loss from continuing operations (99 550) (13 828) 65 260 (i) (48 118)
Dividends received 70 290 – (65 260) (ii) 5 030Tax on sale of GPI Slots (36 255) – – (36 255)Equity earnings – GPI Slots – 72 917 – (ii) 72 917Gain on derecognition of GPI Slots as subsidiary 684 338 (72 917) – (ii) 611 421Profit for the period from discontinued operations 718 373 – (65 260) 653 113
Profit for the period 618 823 (13 828) – 604 995Unrealised fair value gain/(loss) on available-for-sale investments – net of tax 36 489 (33 129) – 3 360Total comprehensive income for the period 655 312 (46 957) – 608 355
Cents Cents Cents CentsBasic earnings per share 127.66 2.03 – (vi) 129.69– Continuing operations (20.21) (3.75) 13.96 (10.00)– Discontinued operations 147.87 5.78 (13.96) 139.69
Diluted earnings per share 127.03 1.03 – (vi) 128.06– Continuing operations (20.11) (3.55) 13.78 (9.88)– Discontinued operations 147.14 4.58 (13.78) 137.94
Headline (loss)/earnings per share (5.74) 8.91 – (vi) 3.17
Diluted headline (loss)/earnings per shares (5.71) 8.84 – (vi) 3.13
R000’s R000’s R000’s R000’sStatement of financial position Assets classified as held-for-sale 1 694 467 – (1 056 922) 637 545Investment in joint ventures 289 661 (13 828) 1 056 922 (i) 1 332 755Available-for-sale investments 339 437 (40 732) – (iii) 298 705Available-for-sale investments fair value reserve (36 421) 33 129 – (iv) (3 292)Deferred tax liabilities (46 679) 7 603 – (v) (39 076)
(i) 30% of GPI Slots’ profit for the period, previously recognised as profit from equity-accounted investments in profit or losses from continuing operations, and now removed.
(ii) 100% of GPI Slots’ profit for the period, before depreciation and amortisation, previously not recognised, now restated to be recognised as profit from discontinued operations in the profit or loss from discontinued operations.
(iii) 12% tradability discount related to the fair value of GPI’s investment in Spur, which was previously not recognised, now restated to reduce the fair value of the investment.
(iv) Relates to the fair value adjustment net of tax referred to in note (iii) above.(v) Deferred tax effect of the fair value adjustment referred to in note (iii) above.(vi) Earnings per share have been calculated using the weighted average number of shares in issue less treasury shares.
14 UNAUDITED INTERIM RESULTSGrand Parade Investments Limited (GPI) for the six months ended 31 December 2015
Unaudited31 December
2015R000’s
Restated and unaudited
31 December 2014
R000’s
Audited30 June
2015R000’s
STATEMENT OF COMPREHENSIVE INCOMERevenue – 398 306 398 306Cost of sales – (235 415) (235 415)Gross profit – 162 891 162 891Operating costs – (67 070) (67 070)Profit from operations – 95 821 95 821Profit on disposal of investment – – 15 462Gain on loss of control of GPI Slots – 611 421 611 421Profit before finance costs and taxation – 707 242 722 704Finance income – 2 898 2 898Finance costs – (165) (1 755)Profit before taxation – 709 975 723 847Taxation – (56 862) (6 863)Profit for the period from discontinued operations – 653 113 716 984
STATEMENT OF FINANCIAL POSITIONInvestment in jointly controlled entities 386 139 637 545 386 139Assets classified as held-for-sale 386 139 637 545 386 139
Deferred tax liabilities 31 379 31 379 31 379Liabilities associated with assets held-for-sale 31 379 31 379 31 379
Net assets directly associated with discontinued operations 354 760 606 166 354 760
STATEMENT OF CASH FLOWNet cash generated by operations – 80 813 80 813Income tax paid – (21 784) (61 910)Finance income – 3 625 3 625Net cash inflow from operating activities – 62 654 22 528
Acquisition of plant, equipment and intangibles – (54 803) (54 803)Proceeds from disposal of property, plant and equipment – 3 070 3 070Investments made – (55 780) (55 780)Consideration from the disposal of investment – 1 381 131 381Dividends received – 5 030 5 030Net cash (outflow)/inflow from investing activities – (101 102) 28 898
Increase in loans – 1 378 1 378Finance costs – (165) (165)Net cash inflow from financing activities – 1 213 1 213
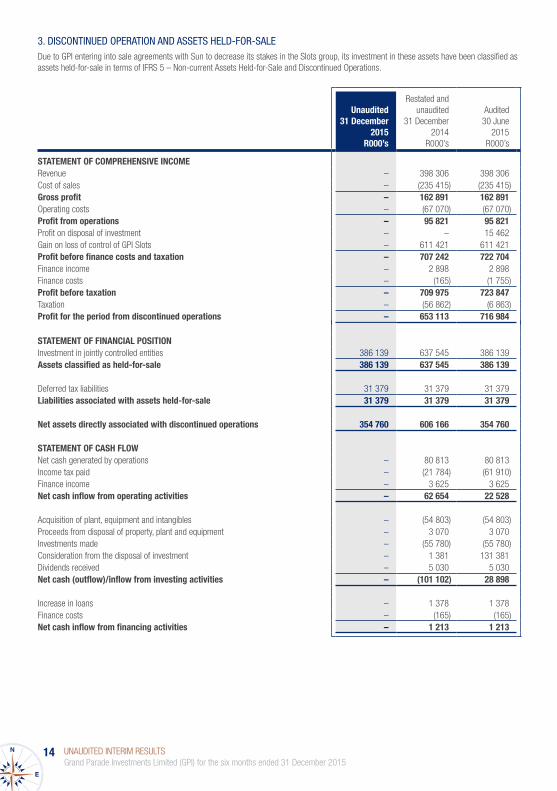
3. DISCONTINUED OPERATION AND ASSETS HELD-FOR-SALEDue to GPI entering into sale agreements with Sun to decrease its stakes in the Slots group, its investment in these assets have been classified as assets held-for-sale in terms of IFRS 5 – Non-current Assets Held-for-Sale and Discontinued Operations.
UNAUDITED INTERIM RESULTSGrand Parade Investments Limited (GPI) for the six months ended 31 December 2015
15
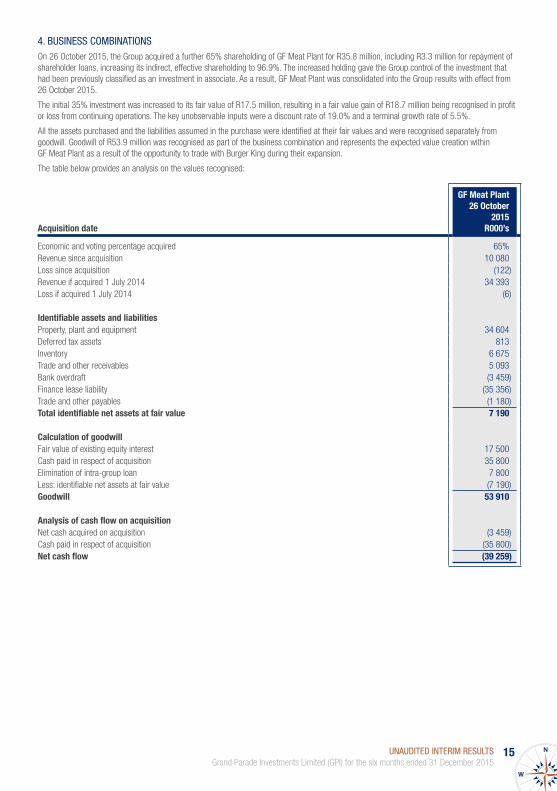
4. BUSINESS COMBINATIONSOn 26 October 2015, the Group acquired a further 65% shareholding of GF Meat Plant for R35.8 million, including R3.3 million for repayment of shareholder loans, increasing its indirect, effective shareholding to 96.9%. The increased holding gave the Group control of the investment that had been previously classified as an investment in associate. As a result, GF Meat Plant was consolidated into the Group results with effect from 26 October 2015.
The initial 35% investment was increased to its fair value of R17.5 million, resulting in a fair value gain of R18.7 million being recognised in profit or loss from continuing operations. The key unobservable inputs were a discount rate of 19.0% and a terminal growth rate of 5.5%.
All the assets purchased and the liabilities assumed in the purchase were identified at their fair values and were recognised separately from goodwill. Goodwill of R53.9 million was recognised as part of the business combination and represents the expected value creation within GF Meat Plant as a result of the opportunity to trade with Burger King during their expansion.
The table below provides an analysis on the values recognised:
Acquisition date
GF Meat Plant26 October
2015R000’s
Economic and voting percentage acquired 65%Revenue since acquisition 10 080Loss since acquisition (122)Revenue if acquired 1 July 2014 34 393Loss if acquired 1 July 2014 (6)
Identifiable assets and liabilitiesProperty, plant and equipment 34 604Deferred tax assets 813Inventory 6 675Trade and other receivables 5 093Bank overdraft (3 459)Finance lease liability (35 356)Trade and other payables (1 180)Total identifiable net assets at fair value 7 190
Calculation of goodwillFair value of existing equity interest 17 500Cash paid in respect of acquisition 35 800Elimination of intra-group loan 7 800Less: identifiable net assets at fair value (7 190)Goodwill 53 910
Analysis of cash flow on acquisitionNet cash acquired on acquisition (3 459)Cash paid in respect of acquisition (35 800)Net cash flow (39 259)
16 UNAUDITED INTERIM RESULTSGrand Parade Investments Limited (GPI) for the six months ended 31 December 2015
5. BASIC AND DILUTED EARNINGS PER SHARE
RECONCILIATION OF HEADLINE EARNINGS
Unaudited31 December
2015R000’s
Restated and unaudited
31 December 2014
R000’s
Audited30 June 2015
R000’s
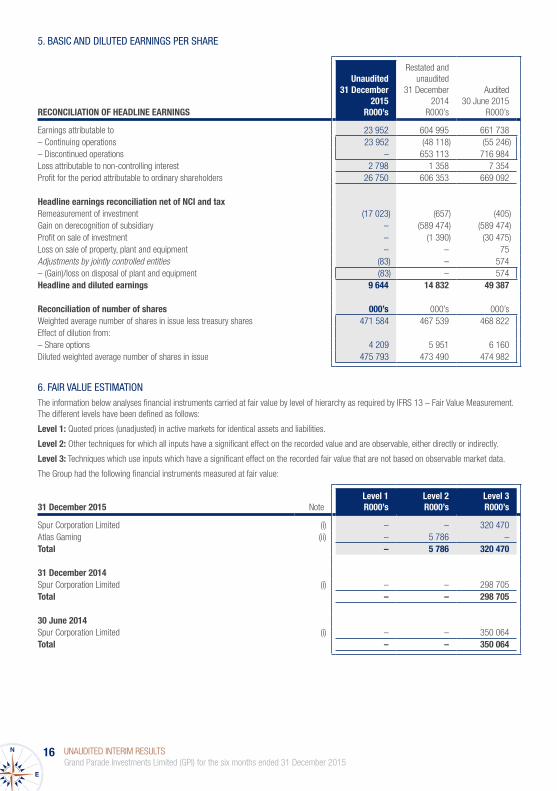
Earnings attributable to 23 952 604 995 661 738– Continuing operations 23 952 (48 118) (55 246)– Discontinued operations – 653 113 716 984Loss attributable to non-controlling interest 2 798 1 358 7 354Profit for the period attributable to ordinary shareholders 26 750 606 353 669 092
Headline earnings reconciliation net of NCI and taxRemeasurement of investment (17 023) (657) (405)Gain on derecognition of subsidiary – (589 474) (589 474)Profit on sale of investment – (1 390) (30 475)Loss on sale of property, plant and equipment – – 75Adjustments by jointly controlled entities (83) – 574– (Gain)/loss on disposal of plant and equipment (83) – 574Headline and diluted earnings 9 644 14 832 49 387
Reconciliation of number of shares 000’s 000’s 000’sWeighted average number of shares in issue less treasury shares 471 584 467 539 468 822Effect of dilution from:– Share options 4 209 5 951 6 160Diluted weighted average number of shares in issue 475 793 473 490 474 982
6. FAIR VALUE ESTIMATIONThe information below analyses financial instruments carried at fair value by level of hierarchy as required by IFRS 13 – Fair Value Measurement. The different levels have been defined as follows:
Level 1: Quoted prices (unadjusted) in active markets for identical assets and liabilities.
Level 2: Other techniques for which all inputs have a significant effect on the recorded value and are observable, either directly or indirectly.
Level 3: Techniques which use inputs which have a significant effect on the recorded fair value that are not based on observable market data.
The Group had the following financial instruments measured at fair value:
31 December 2015 NoteLevel 1R000’s
Level 2R000’s
Level 3R000’s
Spur Corporation Limited (i) – – 320 470Atlas Gaming (ii) – 5 786 –Total – 5 786 320 470
31 December 2014Spur Corporation Limited (i) – – 298 705Total – – 298 705
30 June 2014Spur Corporation Limited (i) – – 350 064Total – – 350 064
UNAUDITED INTERIM RESULTSGrand Parade Investments Limited (GPI) for the six months ended 31 December 2015
17
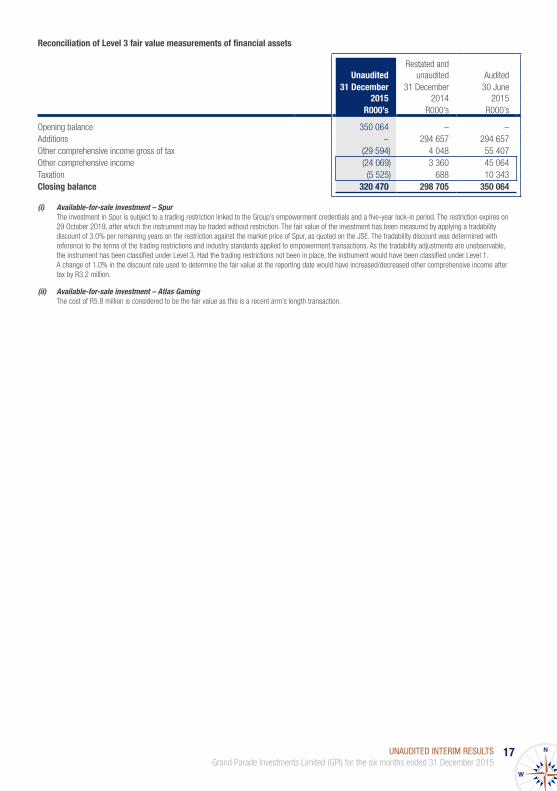
Reconciliation of Level 3 fair value measurements of financial assets
Unaudited Restated and
unaudited Audited 31 December
2015 31 December
2014 30 June
2015 R000’s R000’s R000’s
Opening balance 350 064 – –Additions – 294 657 294 657Other comprehensive income gross of tax (29 594) 4 048 55 407Other comprehensive income (24 069) 3 360 45 064Taxation (5 525) 688 10 343Closing balance 320 470 298 705 350 064
(i) Available-for-sale investment – SpurThe investment in Spur is subject to a trading restriction linked to the Group’s empowerment credentials and a five-year lock-in period. The restriction expires on 29 October 2019, after which the instrument may be traded without restriction. The fair value of the investment has been measured by applying a tradability discount of 3.0% per remaining years on the restriction against the market price of Spur, as quoted on the JSE. The tradability discount was determined with reference to the terms of the trading restrictions and industry standards applied to empowerment transactions. As the tradability adjustments are unobservable, the instrument has been classified under Level 3. Had the trading restrictions not been in place, the instrument would have been classified under Level 1. A change of 1.0% in the discount rate used to determine the fair value at the reporting date would have increased/decreased other comprehensive income after tax by R3.2 million.
(ii) Available-for-sale investment – Atlas GamingThe cost of R5.8 million is considered to be the fair value as this is a recent arm’s length transaction.
18 UNAUDITED INTERIM RESULTSGrand Parade Investments Limited (GPI) for the six months ended 31 December 2015
Exte
rnal
reve
nue
Inte
rseg
men
t rev
enue
Oper
atin
g pr
ofit/
(loss
)Eq
uity
-acc
ount
ed e
arni
ngs
Unau
dite
d31
Dec
embe
r 20
15
Rest
ated and
unau
dite
d 31
Dec
embe
r 20
14
Audi
ted
30 J
une
2015
Unau
dite
d31
Dec
embe
r 20
15
Rest
ated and
unau
dite
d 31
Dec
embe
r 20
14
Audi
ted
30 J
une
2015
Unau
dite
d31
Dec
embe
r 20
15
Rest
ated and
unau
dite
d 31
Dec
embe
r 20
14
Audi
ted
30 J
une
2015
Unau
dite
d31
Dec
embe
r 20
15
Rest
ated and
unau
dite
d 31
Dec
embe
r 20
14
Audi
ted
30 J
une
2015
R000
’sR0
00’s
R000
’sR0
00’s
R000
’sR0
00’s
R000
’sR0
00’s
R000
’sR0
00’s
R000
’sR0
00’s
Food
Burg
er K
ing
224
396
134
488
307
766
– –
–(3
810
)(4
3 85
5)(6
7 87
3)–
––
Mac
Bro
ther
s 10
7 66
676
686
147
949
51 3
7231
104
63 3
187
097
(1 7
29)
1 29
0–
390
389
Spur
7
594
–6
726
––
–7
545
(6)
6 64
6–
––
GF M
eat P
lant
10 0
80–
––
––
1 10
7–
–29
(464
)(7
67)
Gran
d Fo
ods
M
anag
emen
t Ser
vices
––
––
––
(1 3
83)
––
––
–
Gam
ing
and
Leis
ure
SunW
est
––
––
––
––
–64
295
65 2
6012
9 34
7
GPI S
lots
–
––
––
––
––
13 2
78–
9 67
1
Gran
d Sp
ort
484
7654
5–
––
(3 5
67)
(3 0
52)
(7 6
78)
––
–
Wor
cest
er C
asin
o –
––
––
––
––
(9 1
35)
––
Othe
rGT
M
––
––
––
––
–24
2(3
950
)(3
746
)
Grou
p co
sts
Gran
d Li
nkst
ate
5 46
82
655
5 88
12
785
3 44
27
458
(2 7
96)
(2 5
24)
(6 0
80)
––
–
GPI P
rope
rties
6
730
3 02
39
504
31 7
338
369
24 3
01(6
310
)(5
261
)(7
928
)–
––
Cent
ral C
osts
738
20 3
2023
641
195
394
38 8
5141
5 41
6(2
2 06
9)(3
5 78
8)(6
0 72
1)–
––
Cont
inui
ng36
3 15
623
7 24
850
2 01
228
1 28
481
766
510
493
(24
186)
(92
214)
(142
344
)68
709
61 2
3613
4 89
4
Gam
ing
and
Leis
ure
Dolc
oast
–
5 03
05
030
––
––
5 03
013
747
––
–
Natio
nal M
anco
––
––
––
––
1 38
1–
––
GPI S
lots
–
393
276
393
276
––
––
702
212
707
576
––
–
Disc
ontin
ued
–39
8 30
639
8 30
6–
––
–70
7 24
272
2 70
4–
––
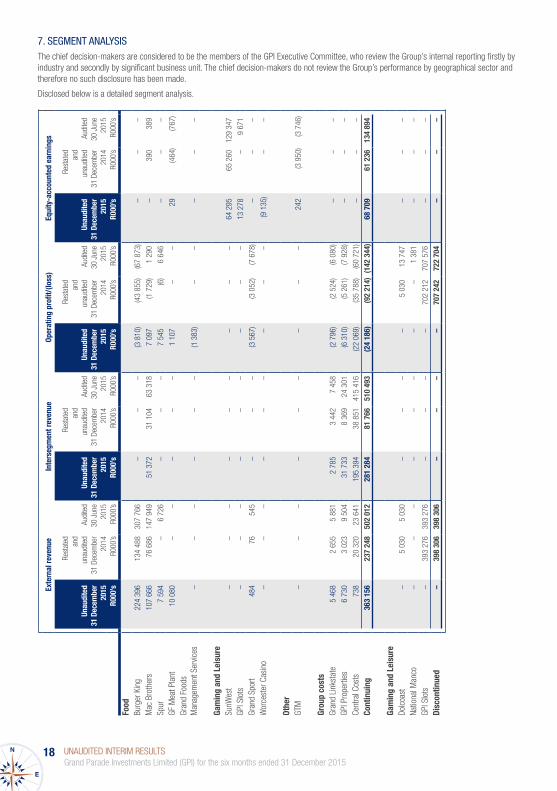
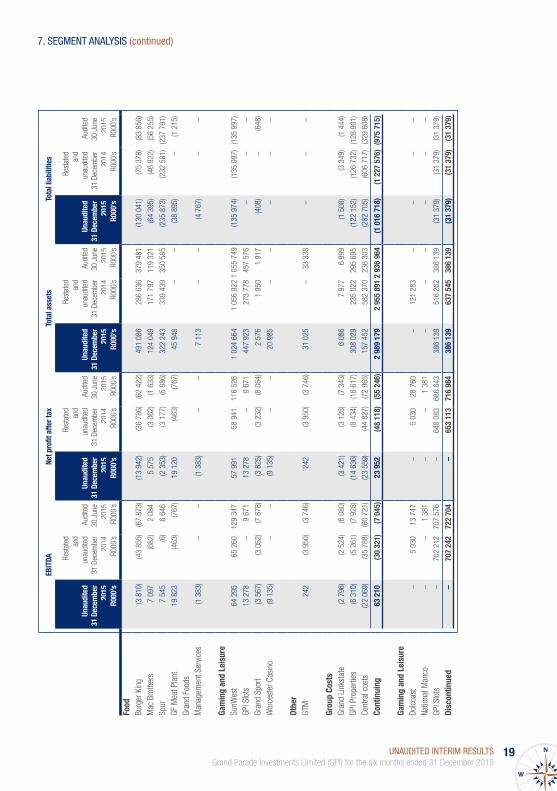
7. SEGMENT ANALYSISThe chief decision-makers are considered to be the members of the GPI Executive Committee, who review the Group’s internal reporting firstly by industry and secondly by significant business unit. The chief decision-makers do not review the Group’s performance by geographical sector and therefore no such disclosure has been made.
Disclosed below is a detailed segment analysis.
UNAUDITED INTERIM RESULTSGrand Parade Investments Limited (GPI) for the six months ended 31 December 2015
19
EBIT
DANe
t pro
fit a
fter t
axTo
tal a
sset
sTo
tal l
iabi
litie
s
Unau
dite
d31
Dec
embe
r 20
15
Rest
ated and
unau
dite
d 31
Dec
embe
r 20
14
Audi
ted
30 J
une
2015
Unau
dite
d31
Dec
embe
r 20
15
Rest
ated and
unau
dite
d 31
Dec
embe
r 20
14
Audi
ted
30 J
une
2015
Unau
dite
d31
Dec
embe
r 20
15
Rest
ated and
unau
dite
d 31
Dec
embe
r 20
14
Audi
ted
30 J
une
2015
Unau
dite
d31
Dec
embe
r 20
15
Rest
ated and
unau
dite
d 31
Dec
embe
r 20
14
Audi
ted
30 J
une
2015
R000
’sR0
00’s
R000
’sR0
00’s
R000
’sR0
00’s
R000
’sR0
00’s
R000
’sR0
00’s
R000
’sR0
00’s
Food
Burg
er K
ing
(3 8
10)
(43
855)
(67
873)
(13
942)
(36
786)
(62
422)
491
086
286
636
379
481
(130
041
)(7
5 37
8)(8
3 85
6)
Mac
Bro
ther
s 7
097
(682
)2
084
5 57
5 (3
062
)(1
633
)12
4 04
9 17
1 79
7 11
9 32
1 (6
4 39
5)(4
6 82
2)(5
6 25
5)
Spur
7
545
(6)
6 64
6 (2
353
)(3
177
)(5
886
)32
2 24
3 33
9 43
9 35
0 58
5 (2
35 8
73)
(232
581
)(2
37 7
91)
GF M
eat P
lant
19 8
23(4
63)
(767
)19
120
(4
63)
(767
)45
948
–
–(3
8 89
5)–
(1 2
15)
Gran
d Fo
ods
Man
agem
ent S
ervic
es(1
383
)–
–(1
383
)–
–7
113
––
(4 7
67)
––
Gam
ing
and
Leis
ure
SunW
est
64 2
9565
260
12
9 34
7 57
991
58
941
11
6 52
6 1
024
664
1 05
6 92
21
055
749
(135
974
)(1
35 9
97)
(135
997
)
GPI S
lots
13
278
–9
671
13 2
78
–9
671
447
923
273
778
457
576
––
–
Gran
d Sp
ort
(3 5
67)
(3 0
52)
(7 6
78)
(3 8
25)
(3 2
32)
(8 0
64)
2 57
6 1
950
1 91
7 (4
08)
–(6
48)
Wor
cest
er C
asin
o (9
135
)–
–(9
135
)–
–20
985
–
––
––
Othe
rGT
M
242
(3 9
50)
(3 7
46)
242
(3 9
50)
(3 7
46)
31 0
25
–33
338
–
––
Grou
p Co
sts
Gran
d Li
nkst
ate
(2 7
96)
(2 5
24)
(6 0
80)
(3 4
21)
(3 1
28)
(7 3
43)
6 08
6 7
977
6 99
9 (1
508
)(3
349
)(1
444
)
GPI P
rope
rties
(6
310
)(5
261
)(7
928
)(1
4 63
6)(8
434
)(1
8 61
7)30
8 02
9 23
5 02
2 29
5 69
5 (1
22 1
52)
(126
732
)(1
28 9
01)
Cent
ral c
osts
(22
069)
(35
788)
(60
721)
(23
559)
(44
827)
(72
965)
157
452
582
370
236
303
(282
705
)(6
06 7
17)
(329
608
)
Cont
inui
ng63
210
(30
321)
(7 0
45)
23 9
52
(48
118)
(55
246)
2 98
9 17
92
955
891
2 93
6 96
4(1
016
718
)(1
227
576
)(9
75 7
15)
Gam
ing
and
Leis
ure
Dolc
oast
–
5 03
0 13
747
–5
030
28 7
60
–12
1 28
3 –
––
–
Natio
nal M
anco
––
1 38
1 –
–1
381
––
––
––
GPI S
lots
–
702
212
707
576
–64
8 08
3 68
6 84
3 38
6 13
9 51
6 26
2 38
6 13
9 (3
1 37
9)(3
1 37
9)(3
1 37
9)
Disc
ontin
ued
–70
7 24
2 72
2 70
4 –
653
113
716
984
386
139
637
545
386
139
(31
379)
(31
379)
(31
379)
7. SEGMENT ANALYSIS (continued)


GREYMATTER & FINCH # 9832
WWW.GRANDPARADE.CO.ZA