unaudited interim report intereuropa group
TRANSCRIPT
Koper, ….. maj 2013
Unaudited
Interim Report
INTEREUROPA Group
January - June 2013
Koper, August 28, 2013
Unaudited Report
2/56
JANUARY – JUNE 2013
The INTEREUROPA d.d. is publishing this Unaudited Report of Intereuropa Group for January - June 2013, in accordance with the Market in Financial Instruments Act (ZTFI). The unaudited consolidated and non-consolidated financial statements have been prepared in accordance with the provisions of International Financial Reporting Standards (IFRS). This Report is available at the Company’s registered office at Vojkovo nabrežje 32, 6504 Koper. The Unaudited Report of Intereuropa Group for January - June 2013 shall also be published on the web site of INTEREUROPA d.d. www.intereuropa.si on August 28, 2013.
C O N T E N T S
PERFORMANCE HIGHLIGHTS ....................................................................................................................... 3
GROUP PROFILE ............................................................................................................................................... 4
STRATEGIC OBJECTIVES ............................................................................................................................... 6
BUSINESS PLAN 2013.................................................................................................................................... 7
MAJOR EVENTS ................................................................................................................................................. 8
BUSINESS REPORT ........................................................................................................................................ 10
1. PERFORMANCE OF INTEREUROPA GROUP ............................................................................................ 10
1.1. Sales achievements ........................................................................................................................... 10
1.2. Financial result ................................................................................................................................... 18
1.3. Investments in fixed assets ............................................................................................................. 19
1.4. Risk management .............................................................................................................................. 20
1.5. Human Resources Management ..................................................................................................... 21
1.6. Total Quality Management ............................................................................................................... 24
1.7. Share IEKG and ownership structure ............................................................................................. 26
2. PERFORMANCE OF THE COMPANY INTEREUROPA D.D. ....................................................................... 30
ACCOUNTING REPORT ................................................................................................................................ 31
1. FINANCIAL REPORT FOR INTEREUROPA GROUP.................................................................................. 34
1.1. Underlying financial statements of the Intereuropa Group ........................................................ 34
1.1. Notes to Financial Statements of the Intereuropa Group ........................................................... 40
2. FINANCIAL REPORT FOR THE PARENT COMPANY INTEREUROPA D.D ............................................... 46
2.1. Underlying financial statements of the parent company Intereuropa d.d................................ 46
2.1. Notes to Financial Statements of the Parent Company Intereuropa d.d. ................................. 51
IN BRIEF … ....................................................................................................................................................... 56
Unaudited Report
3/56
JANUARY – JUNE 2013
PERFORMANCE HIGHLIGHTS
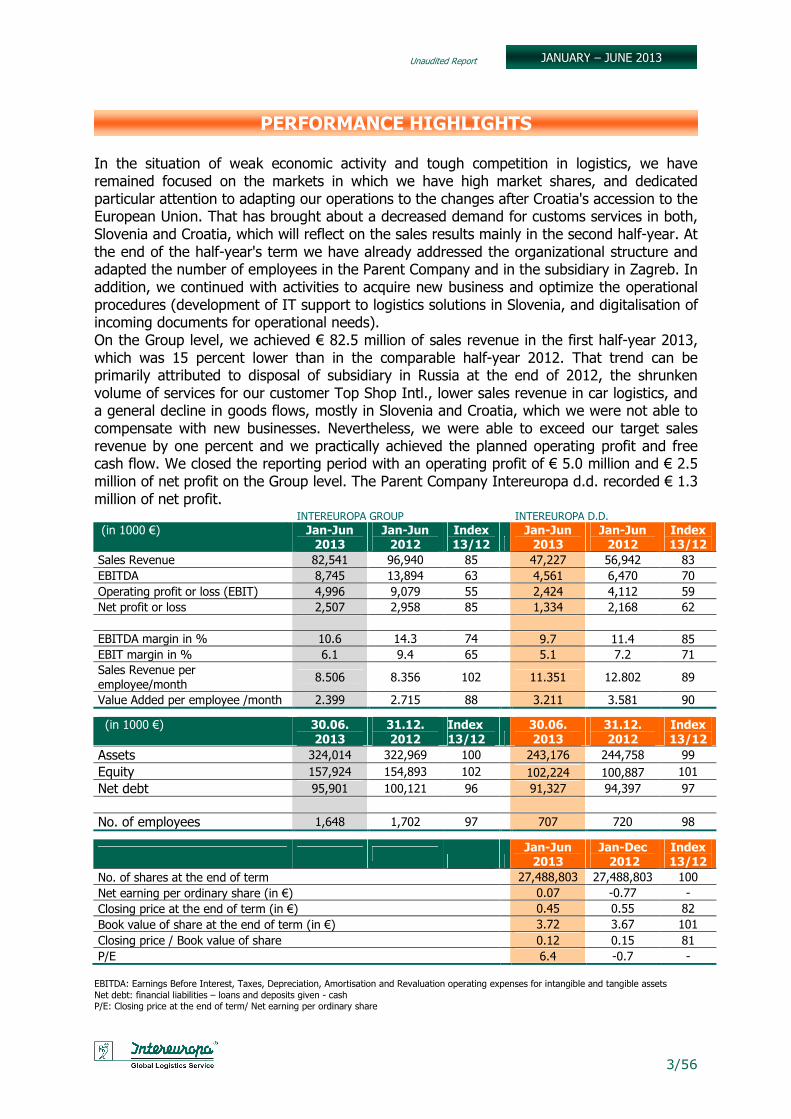
In the situation of weak economic activity and tough competition in logistics, we have remained focused on the markets in which we have high market shares, and dedicated particular attention to adapting our operations to the changes after Croatia's accession to the European Union. That has brought about a decreased demand for customs services in both, Slovenia and Croatia, which will reflect on the sales results mainly in the second half-year. At the end of the half-year's term we have already addressed the organizational structure and adapted the number of employees in the Parent Company and in the subsidiary in Zagreb. In addition, we continued with activities to acquire new business and optimize the operational procedures (development of IT support to logistics solutions in Slovenia, and digitalisation of incoming documents for operational needs). On the Group level, we achieved € 82.5 million of sales revenue in the first half-year 2013, which was 15 percent lower than in the comparable half-year 2012. That trend can be primarily attributed to disposal of subsidiary in Russia at the end of 2012, the shrunken volume of services for our customer Top Shop Intl., lower sales revenue in car logistics, and a general decline in goods flows, mostly in Slovenia and Croatia, which we were not able to compensate with new businesses. Nevertheless, we were able to exceed our target sales revenue by one percent and we practically achieved the planned operating profit and free cash flow. We closed the reporting period with an operating profit of € 5.0 million and € 2.5 million of net profit on the Group level. The Parent Company Intereuropa d.d. recorded € 1.3 million of net profit. INTEREUROPA GROUP INTEREUROPA D.D. (in 1000 €) Jan-Jun
2013 Jan-Jun 2012
Index 13/12
Jan-Jun 2013
Jan-Jun 2012
Index 13/12
Sales Revenue 82,541 96,940 85 47,227 56,942 83 EBITDA 8,745 13,894 63 4,561 6,470 70 Operating profit or loss (EBIT) 4,996 9,079 55 2,424 4,112 59 Net profit or loss 2,507 2,958 85 1,334 2,168 62 EBITDA margin in % 10.6 14.3 74 9.7 11.4 85 EBIT margin in % 6.1 9.4 65 5.1 7.2 71 Sales Revenue per employee/month 8.506 8.356 102 11.351 12.802 89
Value Added per employee /month 2.399 2.715 88 3.211 3.581 90
(in 1000 €) 30.06. 2013
31.12. 2012
Index 13/12
30.06. 2013
31.12. 2012
Index 13/12
Assets 324,014 322,969 100 243,176 244,758 99 Equity 157,924 154,893 102 102,224 100,887 101 Net debt 95,901 100,121 96 91,327 94,397 97 No. of employees 1,648 1,702 97 707 720 98
Jan-Jun 2013
Jan-Dec 2012
Index 13/12
No. of shares at the end of term 27,488,803 27,488,803 100 Net earning per ordinary share (in €) 0.07 -0.77 - Closing price at the end of term (in €) 0.45 0.55 82 Book value of share at the end of term (in €) 3.72 3.67 101 Closing price / Book value of share 0.12 0.15 81 P/E 6.4 -0.7 - EBITDA: Earnings Before Interest, Taxes, Depreciation, Amortisation and Revaluation operating expenses for intangible and tangible assets Net debt: financial liabilities – loans and deposits given - cash P/E: Closing price at the end of term/ Net earning per ordinary share
Unaudited Report
4/56
JANUARY – JUNE 2013
GROUP PROFILE
Parent company Intereuropa, Global Logistics Service, Ltd. Co.
Abbreviated name Intereuropa d.d. Country of the parent company Slovenia Head office of the parent company
Vojkovo nabrežje 32, 6000 Koper
Comp. ID no. 5001684 Tax no. 56405006 Entry in Companies Register Registered with the District Court in Koper, file no. 1/00212/00 Share capital 27,488,803 € Number of of issued and paid-up shares
27,488,803 no-par value shares, of which 16,830,838 ordinary (IEKG) and 10,657,965 preferencial (IEKN)
Share listing Shares designated IEKG are included in blue chips on the Ljubljana Stock Exchange, CEESEG.
Management Board Ernest Gortan, Msc., President of the Management Board Tatjana Vošinek Pucer, Deputy President of the Management Board
Chair of the Supervisory Board Bruno Korelič (until April 11, 2013) Maksimilijan Babič, Deputy President (performed regular duties of president from April 11, 2013)
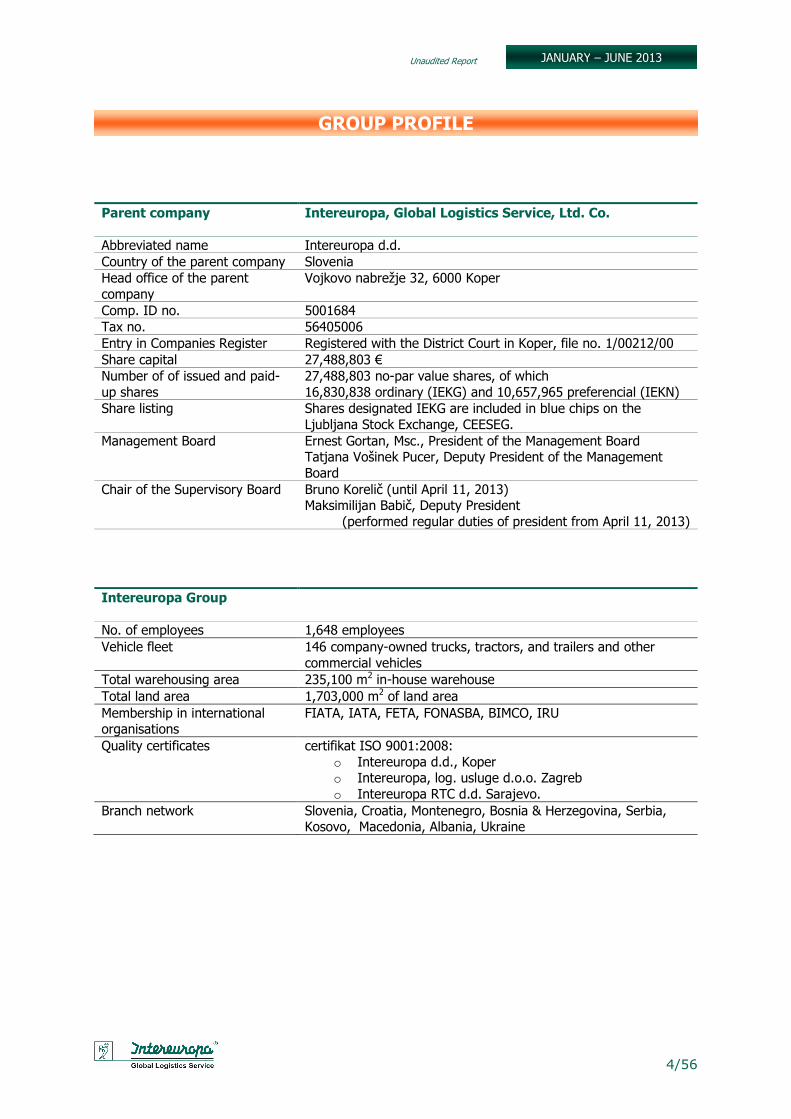
Intereuropa Group No. of employees 1,648 employees Vehicle fleet 146 company-owned trucks, tractors, and trailers and other
commercial vehicles Total warehousing area 235,100 m2 in-house warehouse Total land area 1,703,000 m2 of land area Membership in international organisations
FIATA, IATA, FETA, FONASBA, BIMCO, IRU
Quality certificates certifikat ISO 9001:2008: o Intereuropa d.d., Koper o Intereuropa, log. usluge d.o.o. Zagreb o Intereuropa RTC d.d. Sarajevo.
Branch network Slovenia, Croatia, Montenegro, Bosnia & Herzegovina, Serbia, Kosovo, Macedonia, Albania, Ukraine
Unaudited Report
5/56
JANUARY – JUNE 2013
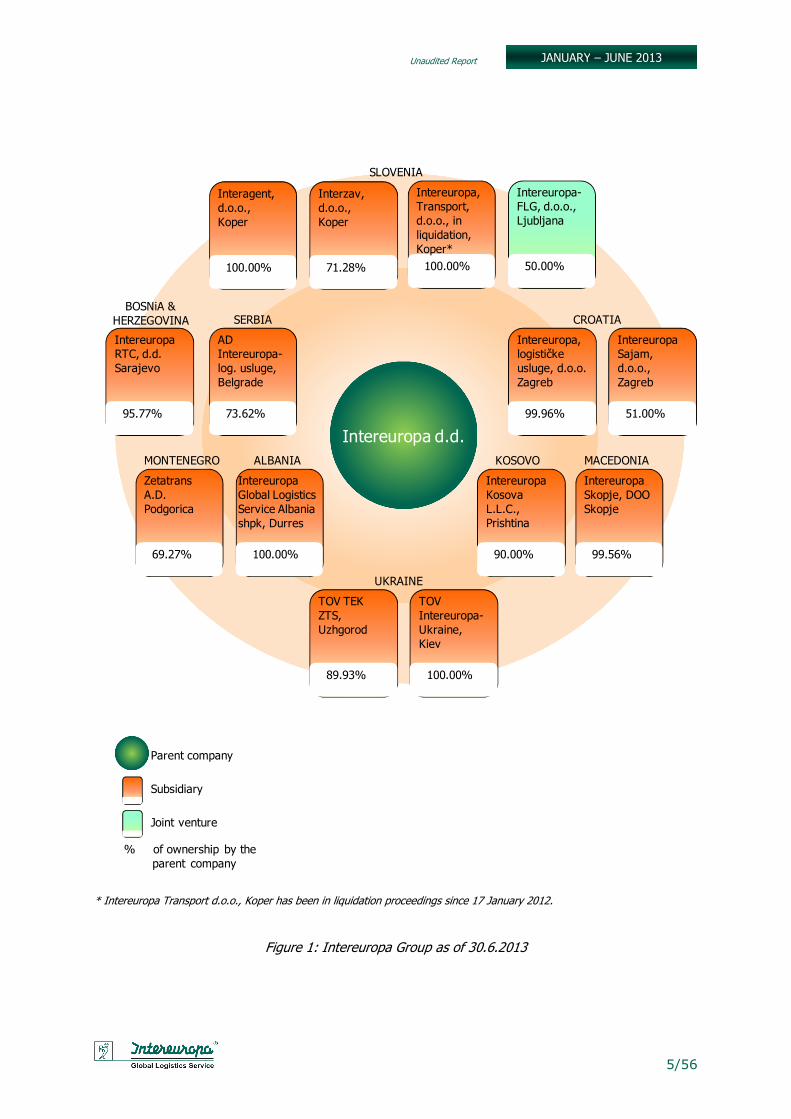
* Intereuropa Transport d.o.o., Koper has been in liquidation proceedings since 17 January 2012.
Figure 1: Intereuropa Group as of 30.6.2013
Intereuropa d.d.
100.00% 71.28% 100.00%
Interagent, d.o.o., Koper
Interzav, d.o.o., Koper
Intereuropa, Transport,d.o.o., in liquidation,Koper*
50.00%
Intereuropa-FLG, d.o.o., Ljubljana
SLOVENIA
99.96% 51.00%
Intereuropa, logističkeusluge, d.o.o. Zagreb
Intereuropa Sajam,d.o.o.,Zagreb
CROATIA
99.56%
Intereuropa Skopje, DOO Skopje
MACEDONIA
95.77%
IntereuropaRTC, d.d.Sarajevo
BOSNiA &HERZEGOVINA
73.62%
AD Intereuropa-log. usluge, Belgrade
SERBIA
90.00%
IntereuropaKosovaL.L.C.,Prishtina
KOSOVO
89.93% 100.00%
TOV TEK ZTS, Uzhgorod
TOVIntereuropa-Ukraine,Kiev
UKRAINE
69.27%
ZetatransA.D.Podgorica
MONTENEGRO
100.00%
Intereuropa Global Logistics Service Albania shpk, Durres
ALBANIA
Parent company
Subsidiary
Joint venture
% of ownership by theparent company
Unaudited Report
6/56
JANUARY – JUNE 2013
STRATEGIC OBJECTIVES
Corporate vision To become a top-ranked provider of integral logistics solutions. Mission The mission of the Intereuropa group is to meet the need for logistics services and provide the optimal functioning of supply chains to the complete satisfaction of our customers, while creating added value for shareholders, employees and other stake-holders in a socially responsible manner. Values Professional attitude towards customers. Our activities seek to offer optimal solutions for the logistics needs of each and every customer, based on advanced logistics know-how. Adaptability and flexibility. Our services are prompt and tailored to customers’ needs. They are based on inventive business solutions and good organization. Responsibility. We are distinguished by a high level of responsibility for all obligations and arrangements undertaken, as well as for both the social and natural environments. Team work and respect for co-workers. The quality of our services is the result of the work of individuals and excellent expert teams. We duly take into account co-workers’ knowledge, experience and views. Our organizational structure and professional competence will enable us to fully realize our competitive advantages: → own network of subsidiaries, → established partnership network, → a wide range of different products and our own infrastructure, → technically qualified staff. The strategic objectives identified in the Strategic Plan of Intereuropa Group for the term 2010 – 2014: → Maintaining and strengthening our position as the leading provider of comprehensive
logistics services in Slovenia and the countries of the former Yugoslavia. → Continuous optimization of processes in all business segments at the group level and
within the consolidated companies. → Ensuring financial stability through divestment, de-leverage, debt rescheduling and
effective management of working capital. → Establishing a strategic partnership in the company Intereuropa East Ltd., Moscow. → Acquiring a strategic partner for Intereuropa d.d. that will carry out recapitalization, thus
contributing to the group’s financial stability as well as the development of our core business.
Unaudited Report
7/56
JANUARY – JUNE 2013
BUSINESS PLAN 2013
The baselines for the 2013 Business Plan of the Intereuropa Group are to retain the leading position in key markets and proceed with the optimization of business processes. The underlying focus remains to assure sufficient cash flows for effective operation of the Group and of the Parent Company. The essential socio-economic factors considered in the preparation of our business plan are: → the company Intereuropa-East Ltd., Moscow, is no longer a member of our Group in
2013, → Accession of Croatia to the EU on 1 July 2013, → Stagnation expected in the majority of geographical markets of the Group, or a minimal
economic growth resp. → Adverse liquidity situation continues on the logistics markets, and the resulting pressures
on price cuts. Accordingly, we have set the following operating and financial goals for the year 2013 on the Group level: → aligning our operations to the EU-accession of Croatia, → continue with the optimization of business processes; → focus on the markets with a high market share, → use the synergies of the corporate network, → we will proceed with the restructuring of our range of services, → increase the share of customers who use integral logistics, → direct the marketing activities towards developing partnerships, i.e. customer relations
management in the long run, → and with upgrading /modernization of information systems, → efficient management with working capital, ensuring adequate liquidity for undisturbed
operation of the Group, → Core Financial Goals:
− Sales: € 156.0 million, − EBITDA: € 15.9 million, − Operating Profit or Loss: € 8.3 million, − Investments: € 3.8 million, − Number of employees at year-end: 1,485.
Unaudited Report
8/56
JANUARY – JUNE 2013
MAJOR EVENTS
MAJOR EVENTS IN THE PERIOD JANUARY – JUNE 2013
January → In January, Intereuropa organized an open-door day for our employees’ children; the aim
was, in addition to presenting them the work environment of their parents, also to provide for the day-care of the children on the day of the announced public servants’ strike.
February → Intereuropa was chosen as the leading partner for the co-financing of the project
»Competence Centre for HR Development in Logistics«. The purpose of the project is primarily to include the employees from partner organizations into a programme to address, by active and systematic approach, their deficiencies in the area of competences (knowledge, skills, qualifications) that are of vital importance for achieving the competitiveness of logistics enterprises. The Project will be co-financed from the dedicated funds of the European Social Fund (85 percent) and from the budget of the Republic of Slovenia (15 percent).
→ Intereuropa provided the comprehensive logistics support to the largest international travelling exhibition Da Vinci – the Genius, which in six years attracted millions of visitors in more than 40 cities worldwide.
March → On 4 March 2013 the Supervisory Board of Intereuropa d.d. was informed on the
performance of the Intereuropa Group in the year 2012. According to unaudited data, the Intereuropa Group recorded a sales revenue at € 188.4 million, which was 2 percent below the sales target.
→ Intereuropa organised the comprehensive logistics support, inclusive of air transport to Rochester, which was the venue of international wine evaluation »Finger Lakes International Wine Competition«. It is the most reputable international assessment of wines on the American Eastern coast, which also has a strong link with charity.
April → The Supervisory Board of Intereuropa d.d. adopted on 9 April 2013 the Audited Annual
Report 2012 for the Intereuropa Group along with the external Certified Auditor's Report. On the same day the Supervisory Board published the invitation of applications for substitute members of Supervisory Board, because the term of office of all the four members representing the shareholders expires this year.
→ On 19 April 2013 Intereuropa d.d. took part in the event for investors Day of Slovenian Capital Market organized by the Ljubljana Stock Exchange, and presented the corporate performance 2012 and the prospects for the future to potential institutional investors.
→ In the international conference ECU AIR / HCL, held from 10 to 13 April in Barcelona, Intereuropa was awarded with the "Best Network Agent in Managerial Reporting 2012" as the most responsive and organised agent in the group for that year.
→ On 19 April 2013 the Montenegrin Chamber of Commerce awarded our subsidiary AD Zetatrans Podgorica for good performance, innovation and successful management in 2012. The guest of honour and official speaker was the President of Montenegro Filip Vujanović.
Unaudited Report
9/56
JANUARY – JUNE 2013
May → On 15 May 2013 the Supervisory Board of Intereuropa d.d. was informed on the
performance of the Intereuropa Group in the period January - March 2013. According to unaudited data, the Intereuropa Group in the first trimester recorded a sales revenue at € 39.8 million and operating profit at € 2.3 million and thereby achieve the planned level. The Group ended the period with € 1.0 million in net profit.
June → On 21 June 2013 has taken place 26th Annual General Meeting of Intereuropa d.d.
Shareholders got acquainted with the audited Annual Report of the Intereuropa Group for 2012. The Management Board and Supervisory Board were awarded the discharge, amendments to the Statute were adopted and the audit firm for the year 2013 was appointed. Based on tender and proposals received new members of the Supervisory Board were elected (Klemen Boštjančič, Igor Mihajlović and Miro Medvešek), Maša Čertalič was elected for another mandate.
MAJOR EVENTS AFTER THE CLOSING OF THE PERIOD
→ With the accession of Croatia to the European Union on 1 July, the demand for Customs
services is estimated to drop considerably; on the other hand new possibilities for a faster flow of goods have opened. Intereuropa was able to reduce the travel time of consignments in the groupage line to/from Croatia, which renders a new quality to this service.
→ Along with Croatia's joining the EU, Intereuropa adapted the operations of the org. units on the border with Croatia to new situation. Customs formalities for the goods bound to/from third countries are still provided on the Slovenian/Croatian border passes Obrežje, Metlika, Gruškovje and Jelšane, for which Intereuropa has adapted the working hours and number of staff in the Intereuropa offices.
→ On 8 July 2013, the President of the government of the Republic of Slovenia Alenka Bratušek, M.A., paid a visit to Intereuropa, accompanied by her team. Ernest Gortan, MSc, presented to the guests the Intereuropa Group, the current recovery process, the implemented strategic goals and new challenges that the Group is facing at present.
→ In July, the present Deputy President of the Supervisory Board Mr. Maksimilijan Babič, who was a representative of employees, declared to resign. It was about compliance with the resolution of the General Meeting relating to decrease the number of Supervisory Board Members - representatives of employees. The Supervisory Board now consists of six members, thereof two members represent the employees.
→ In July the TEN-T (The Trans-European Transport Network Executive Agency) confirmed the B2MoS Project (Business to Motorways of the Sea) for cofinancing on the tender TEN-T Call 2012 in the amount of € 270,000. Regarding the planned developmental activities of information support to logistics processes, Intereuropa and the leading partner on the Project (Port Authority of Valencia) applied for seven areas linked to the information solutions addressing the logistics via port. The purpose of all improvements is to raise the competitiveness of sea-freight transport so as to trigger a large-scale migration from road to sea and thereby contribute to environment protection. This Project that associates 32 partners from Slovenia, Italy, Spain, Germany, Great Britain and Greece is scheduled to be completed by the year-end 2015.
Unaudited Report
10/56
JANUARY – JUNE 2013
BUSINESS REPORT
1. PERFORMANCE OF INTEREUROPA GROUP
1.1. Sales achievements
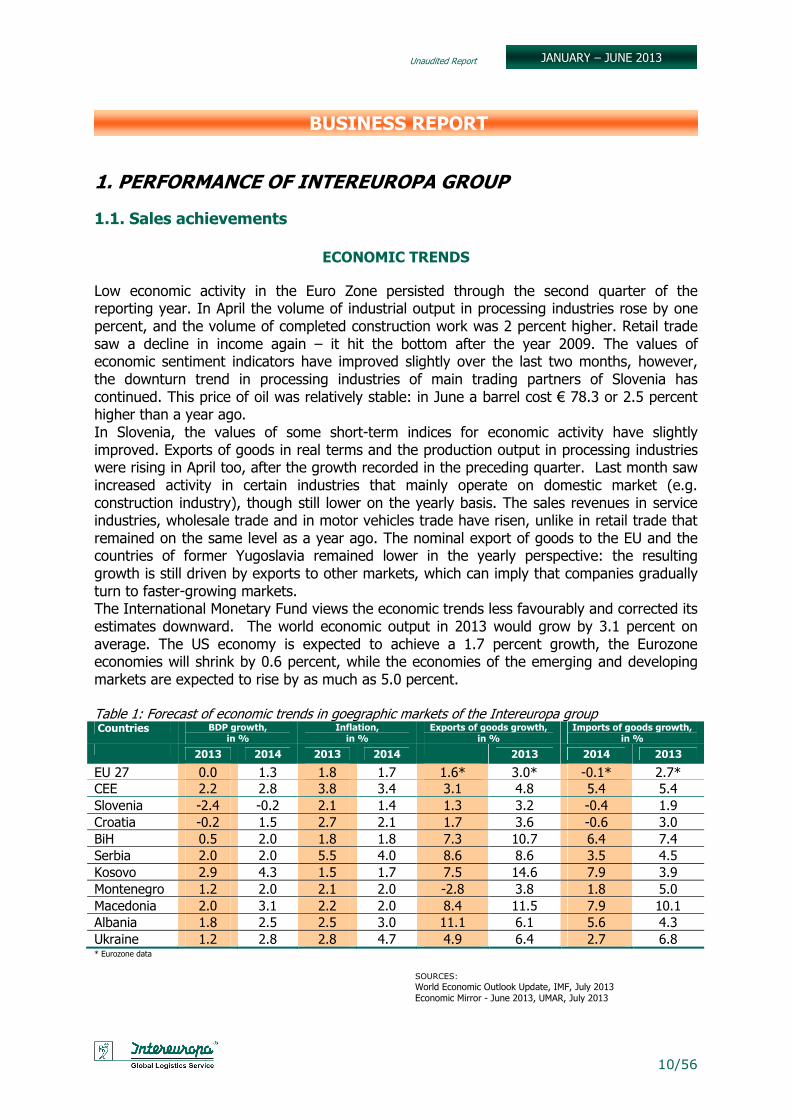
ECONOMIC TRENDS Low economic activity in the Euro Zone persisted through the second quarter of the reporting year. In April the volume of industrial output in processing industries rose by one percent, and the volume of completed construction work was 2 percent higher. Retail trade saw a decline in income again – it hit the bottom after the year 2009. The values of economic sentiment indicators have improved slightly over the last two months, however, the downturn trend in processing industries of main trading partners of Slovenia has continued. This price of oil was relatively stable: in June a barrel cost € 78.3 or 2.5 percent higher than a year ago. In Slovenia, the values of some short-term indices for economic activity have slightly improved. Exports of goods in real terms and the production output in processing industries were rising in April too, after the growth recorded in the preceding quarter. Last month saw increased activity in certain industries that mainly operate on domestic market (e.g. construction industry), though still lower on the yearly basis. The sales revenues in service industries, wholesale trade and in motor vehicles trade have risen, unlike in retail trade that remained on the same level as a year ago. The nominal export of goods to the EU and the countries of former Yugoslavia remained lower in the yearly perspective: the resulting growth is still driven by exports to other markets, which can imply that companies gradually turn to faster-growing markets. The International Monetary Fund views the economic trends less favourably and corrected its estimates downward. The world economic output in 2013 would grow by 3.1 percent on average. The US economy is expected to achieve a 1.7 percent growth, the Eurozone economies will shrink by 0.6 percent, while the economies of the emerging and developing markets are expected to rise by as much as 5.0 percent. Table 1: Forecast of economic trends in goegraphic markets of the Intereuropa group Countries BDP growth,
in % Inflation, in %
Exports of goods growth, in %
Imports of goods growth, in %
2013 2014 2013 2014 2013 2014 2013
EU 27 0.0 1.3 1.8 1.7 1.6* 3.0* -0.1* 2.7* CEE 2.2 2.8 3.8 3.4 3.1 4.8 5.4 5.4 Slovenia -2.4 -0.2 2.1 1.4 1.3 3.2 -0.4 1.9 Croatia -0.2 1.5 2.7 2.1 1.7 3.6 -0.6 3.0 BiH 0.5 2.0 1.8 1.8 7.3 10.7 6.4 7.4 Serbia 2.0 2.0 5.5 4.0 8.6 8.6 3.5 4.5 Kosovo 2.9 4.3 1.5 1.7 7.5 14.6 7.9 3.9 Montenegro 1.2 2.0 2.1 2.0 -2.8 3.8 1.8 5.0 Macedonia 2.0 3.1 2.2 2.0 8.4 11.5 7.9 10.1 Albania 1.8 2.5 2.5 3.0 11.1 6.1 5.6 4.3 Ukraine 1.2 2.8 2.8 4.7 4.9 6.4 2.7 6.8 * Eurozone data
SOURCES:
World Economic Outlook Update, IMF, July 2013 Economic Mirror - June 2013, UMAR, July 2013
Unaudited Report
11/56
JANUARY – JUNE 2013
SALES REVENUE OF INTEREUROPA GROUP
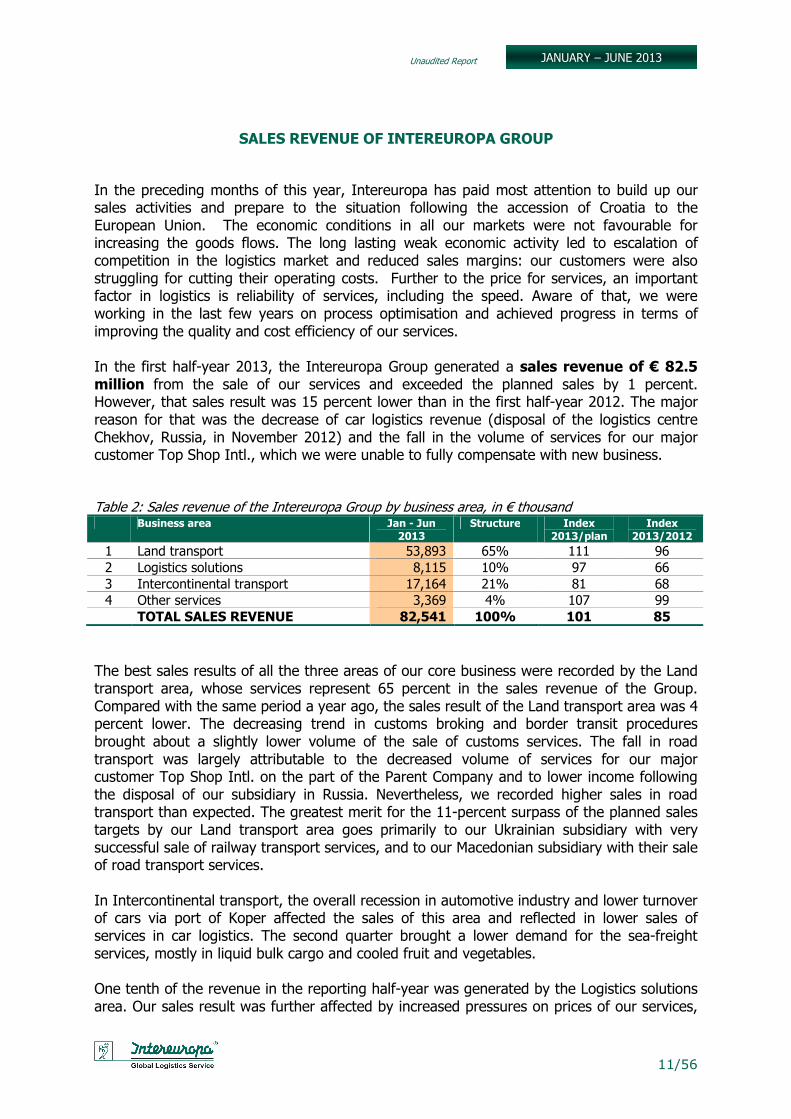
In the preceding months of this year, Intereuropa has paid most attention to build up our sales activities and prepare to the situation following the accession of Croatia to the European Union. The economic conditions in all our markets were not favourable for increasing the goods flows. The long lasting weak economic activity led to escalation of competition in the logistics market and reduced sales margins: our customers were also struggling for cutting their operating costs. Further to the price for services, an important factor in logistics is reliability of services, including the speed. Aware of that, we were working in the last few years on process optimisation and achieved progress in terms of improving the quality and cost efficiency of our services. In the first half-year 2013, the Intereuropa Group generated a sales revenue of € 82.5 million from the sale of our services and exceeded the planned sales by 1 percent. However, that sales result was 15 percent lower than in the first half-year 2012. The major reason for that was the decrease of car logistics revenue (disposal of the logistics centre Chekhov, Russia, in November 2012) and the fall in the volume of services for our major customer Top Shop Intl., which we were unable to fully compensate with new business. Table 2: Sales revenue of the Intereuropa Group by business area, in € thousand Business area Jan - Jun
2013 Structure Index
2013/plan Index
2013/2012
1 Land transport 53,893 65% 111 96 2 Logistics solutions 8,115 10% 97 66 3 Intercontinental transport 17,164 21% 81 68 4 Other services 3,369 4% 107 99
TOTAL SALES REVENUE 82,541 100% 101 85
The best sales results of all the three areas of our core business were recorded by the Land transport area, whose services represent 65 percent in the sales revenue of the Group. Compared with the same period a year ago, the sales result of the Land transport area was 4 percent lower. The decreasing trend in customs broking and border transit procedures brought about a slightly lower volume of the sale of customs services. The fall in road transport was largely attributable to the decreased volume of services for our major customer Top Shop Intl. on the part of the Parent Company and to lower income following the disposal of our subsidiary in Russia. Nevertheless, we recorded higher sales in road transport than expected. The greatest merit for the 11-percent surpass of the planned sales targets by our Land transport area goes primarily to our Ukrainian subsidiary with very successful sale of railway transport services, and to our Macedonian subsidiary with their sale of road transport services. In Intercontinental transport, the overall recession in automotive industry and lower turnover of cars via port of Koper affected the sales of this area and reflected in lower sales of services in car logistics. The second quarter brought a lower demand for the sea-freight services, mostly in liquid bulk cargo and cooled fruit and vegetables. One tenth of the revenue in the reporting half-year was generated by the Logistics solutions area. Our sales result was further affected by increased pressures on prices of our services,
Unaudited Report
12/56
JANUARY – JUNE 2013
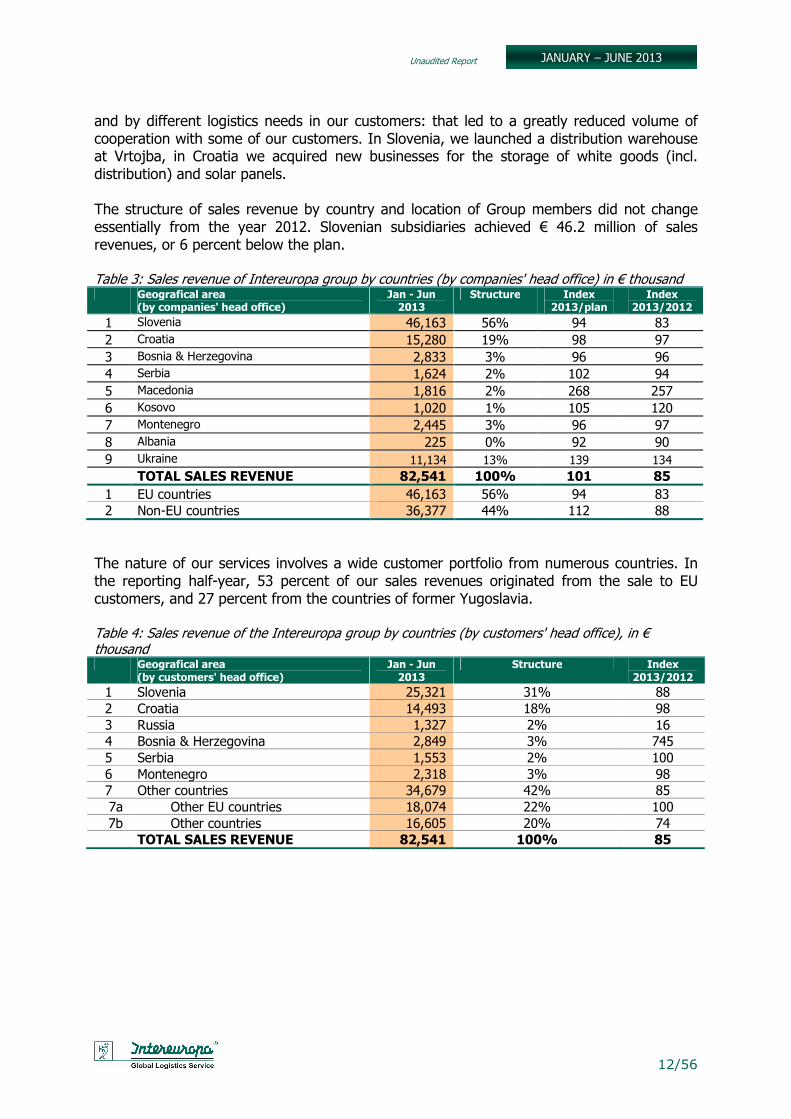
and by different logistics needs in our customers: that led to a greatly reduced volume of cooperation with some of our customers. In Slovenia, we launched a distribution warehouse at Vrtojba, in Croatia we acquired new businesses for the storage of white goods (incl. distribution) and solar panels. The structure of sales revenue by country and location of Group members did not change essentially from the year 2012. Slovenian subsidiaries achieved € 46.2 million of sales revenues, or 6 percent below the plan. Table 3: Sales revenue of Intereuropa group by countries (by companies' head office) in € thousand Geografical area
(by companies' head office) Jan - Jun 2013
Structure Index 2013/plan
Index 2013/2012
1 Slovenia 46,163 56% 94 83 2 Croatia 15,280 19% 98 97 3 Bosnia & Herzegovina 2,833 3% 96 96 4 Serbia 1,624 2% 102 94 5 Macedonia 1,816 2% 268 257 6 Kosovo 1,020 1% 105 120 7 Montenegro 2,445 3% 96 97 8 Albania 225 0% 92 90 9 Ukraine 11,134 13% 139 134
TOTAL SALES REVENUE 82,541 100% 101 85
1 EU countries 46,163 56% 94 83 2 Non-EU countries 36,377 44% 112 88
The nature of our services involves a wide customer portfolio from numerous countries. In the reporting half-year, 53 percent of our sales revenues originated from the sale to EU customers, and 27 percent from the countries of former Yugoslavia. Table 4: Sales revenue of the Intereuropa group by countries (by customers' head office), in € thousand Geografical area
(by customers' head office) Jan - Jun 2013
Structure Index 2013/2012
1 Slovenia 25,321 31% 88 2 Croatia 14,493 18% 98 3 Russia 1,327 2% 16 4 Bosnia & Herzegovina 2,849 3% 745 5 Serbia 1,553 2% 100 6 Montenegro 2,318 3% 98 7 Other countries 34,679 42% 85 7a Other EU countries 18,074 22% 100 7b Other countries 16,605 20% 74
TOTAL SALES REVENUE 82,541 100% 85
Unaudited Report
13/56
JANUARY – JUNE 2013
Land Transport Land transport has the highest share in the Group’s sales structure. This share rose 7 percentage points above the achievement of the comparable term last year. The revenues from services by Land transport amounted to € 53.9 million; thereof, the major share was generated by the Parent Company in Slovenia, which contributed nearly one half of total sales revenue from Land transport. In the reporting half-year the Land transport area exceeded the target sales revenue by 11 percent. The highest overachievement of plan was recorded in the road and railway transport segments, whereas the Groupage services product saw the biggest setback. We also remained behind the target revenue in the border despatch segment. The target volume of services in the Land transport area were exceeded in all our companies but two: the Croatian subsidiary Intereuropa, logističke usluge d.o.o., Zagreb (primarily on account of unrealized plans in Railway Transport product), and Intereuropa RTC d.d. Sarajevo. The highest surplus of plan was recorded by TEK ZTS Uzhgorod and Intereuropa Skopje d.o.o. Compared with the term January - June 2012, the sales revenue was 4 percent lower. A better result than last year was achieved in Railway transport and Express services, and the worst fall was recorded in Customs services and Road transport . We dedicated the first half-year 2013 to intense preparations for the accession of Croatia to the European Union. Parallelly, we proceeded with the activities leading to cost efficiency and operational optimisation. Road transport : → Among the products provided by Intereuropa, Road transport stands for the highest
share in sales revenue structure (approximately one quarter). → In the Group, we surpassed the sales plan by 16 percent, however, our sales revenue
was 8 percent lower than in the comparable half-year 2012, which was attributable to lower volume of services for a major customer (Top Shop Intl.) in the Parent Company, and to loss of income due to disposal of our subsidiary in Russia.
→ Pressures on prices continued and the resulting reduced sales margins persist for quite a long time.
Customs services: → The highest share in the sales revenue of this product was generated in Croatia and
Slovenia (both subsidiaries combined stand for over 80 percent of overall revenues from customs broking in the Group).
→ We recorded a lower volume in customs broking and border transit procedures. → Slovenia saw the biggest setback behind the plan and the results of 2012, primarily due
to fewer transit procedures as an outcome of Croatia’s accession to the NCTS system and due to a decrease in the volume of services for a major customer.
→ Croatia’s accession to the EU will slash the revenues from customs services in both these companies. The key goals for 2013 include the alignment of the Parent Company Intereuropa d.d. and of the subsidiary in Croatia to the EU accession of the latter.
Groupage services:
→ The sales revenues were 7 percent lower than in the comparable half-year of 2012, but only 4 percent behind the plan.
Unaudited Report
14/56
JANUARY – JUNE 2013
→ The major part - more than three quarters of the Group’s sales revenue in Groupage services was generated in Slovenia.
→ Growing sales revenues were recorded in the subsidiaries based in Serbia, Montenegro, Macedonia and Kosovo, on account of increased volume of shipments carried.
→ In view of Croatia joining the EU, activities were conducted in Croatia and Slovenia addressing the alignment of operations to the new market conditions (an even more competitive daily groupage line between Slovenia and Croatia with guaranteed delivery on the next working day).
Express services: → The sales revenue in Express services segment was one percent better than in the first
half-year 2012. → The highest share of sales revenue was still earned by the subsidiary in Croatia (61
percent), followed by the Company in Slovenia (25 percent), the subsidiaries in Bosnia and Herzegovina (10 percent) and Serbia (4 percent). The highest underachievement of the targets was recorded by our subsidiary in Bosnia and Herzegovina, and the widest gap from the previous year’s results was seen in Slovenia.
→ The companies in Slovenia and Croatia dedicated much effort to restructure sales segments and streamline the operations.
→ Based on a new sale concept for smaller shipments between Slovenia and Croatia that was to be applied after Croatia's accession to the EU, we reduced the travel time of such shipments. We wish to get asserted as a provider of parcel distribution between Slovenia and Croatia.
Rail Transport: → We exceeded the planned result for the railway transport product, and also the
achievement of the comparable period 2012. → The present good achievement is primarily attributable to the Ukrainian subsidiary TEK
ZTS, Uzhgorod, which generated 94 percent of all sales revenues in this product. The market development continues towards declining goods flows and increasing competition, which leads to reduced margins. Our customers are anxious to reduce their costs, so it is difficult to compete in international tenders and the earning is getting lower from tender to tender. That compels us to an on-going streamlining of our operations on the one hand, and to continual presence in the market, with blanket coverage, in order to struggle for every shipment. We have witnessed ill payment practices on a large scale and financial difficulties of large and small businesses, and need to be cautious in acquiring new business. In the current year we estimate the sales revenues from our services in land transport to decline further, the highest loss is expected in the product Customs services, attributable to Croatia’s accession to the EU. That impact will be most evident on the results of our companies in Croatia and Slovenia. Compared with the same period last year, we estimate the volume of road transport to decline, too. Logistics Solutions The sales revenue in the Logistics solutions area amounted to € 8.1 million. The unfavourable economic environment in the reporting term persisted, which had an impact on the results of this area. Our customers adapted to the situation by increasing the pressure on
Unaudited Report
15/56
JANUARY – JUNE 2013
prices of services and optimising their inventories in warehouses; some of the customers even changed their logistics concepts. Consequently, we recorded a setback in the sales volume during the reporting half-year, lying 3 percent behind the targets and 34 percent below comparable last year’s results. The fall in the sales revenue has resulted from disposal of the logistics centre in Russia and lower sales in two key markets, i.e. Slovenia and Croatia, which combined represent 84 percent in the sales structure of Logistics solutions and were most exposed to unfavourable economic trends. There was no essential setback behind the planned results in Slovenia, however, the sales revenue was as much as 28 percent below the last year’s achievement. The main reasons for that were the decline in the volume of services for our customer Top Shop Intl., general pressure on reduction of prices of logistics services, and the impacts of weakened economic activity (reduction of inventories, fewer orders for outbound of goods from warehouses, etc.). The sales in the Croatian part of the Group standing for 19 percent share in the sale of logistics solutions, is 4 percent below the plan and 18 percent behind the last year' results, primarily due to unfavourable economic situation in the country. Also in other countries of the Balkans in which our Company operates warehouses, we could still perceive weaker demand for logistics solutions, with considerably stronger competition and excessive, unoccupied storage and industrial capacities. As a result, sales revenues fell below the level of the preceding year in the markets of Bosnia and Herzegovina, Montenegro, Serbia, Macedonia and Kosovo that in total represent 16 percent in the sales structure of this business area. In accordance with the corporate guidelines of the Group we dedicated much effort to target-based sales of logistics solutions, participation in logistic project tenders, and operations streamlining. Accordingly, we successfully launched the distribution warehouse for our Italian customer at Vrtojba and arranged, in part only, a warehouse for automotive industry in Ljubljana (the project is expected to be completed in the first quarter 2014). In Croatia, we acquired new businesses for the storage and distribution of white goods, and a major business for the storage of solar panels. In Serbia, we succeeded to increase the sales to existing major customers. Key activities for the Logistics solutions area in 2013 comprise: → development of partner-like customer relations and enhanced cooperation with current
customers; → winning new logistics projects, primarily aiming to fill the unoccupied storage capacities; → development of new IT support for logistics solutions in Slovenia; → continued specialisation and optimisation of logistic processes by commodity category. Intercontinental Transport The sales revenue in the Intercontinental Transport Area were € 17.2 million, and behind the target. The worst underachievement was recorded in the Car logistics product due to a lower throughput of vehicles via the port of Koper, as a side effect of the general crisis in automotive industry. In the second quarter, a declining volume of sales was observed in the sea-freight segment, too.

Unaudited Report
16/56
JANUARY – JUNE 2013
Sea-Freight: → In the reporting half-year we remained 13 percent behind the sales targets, and 7
percent below the achievement of the preceding year. → Container transport with a 7-percent higher revenue than last year’s comparable term
was the best performing of all the Sea-Freight products. We increased the number of containers handled in import and export, however, a recent decreasing trend was observed in the volume of containers or businesses involving handling/despatch through warehouse and distribution of goods by land. In the Slovenian part of the Group we achieved a 13-percent growth in the sales results, which can be attributed to the development of agency-based despatch of containers in transit for Graz (A) and Budapest (H). An important growth and surplus in the sales was achieved in Serbia, where we acquired a new long-term export business for Africa.
→ In conventional cargo segment we were operating below the targets. Above all, a variance from the target operating output was notable in liquid cargoes and in the cooled fruit and vegetables segment. The season of fruit and vegetables shipped via Koper was below the planned volume, in particular the season of grapes that was expected for the second quarter of the year. Our cooperation with the railway operator was good, additional despatches from Koper are planned for the next term as well.
→ In our RO-RO product, the service between the Koper and Durres ports was terminated on the part of shipowner, and we recorded a great loss of revenue. We mitigated that loss by re-routing certain businesses to alternative transport routes. On other RO-RO destinations along the Mediterranean we were faced with a considerable drop in transportation of construction machinery, plant and other means of transport /vehicles.
→ Except for Serbia and Kosovo, almost all our markets were behind the sales targets of the sea-freight segment. The reporting half-year saw a clear decline in import and export businesses in the Balkans, as well as in transit from/to Austria, Hungary and Slovakia. Smaller quantities of cargo force ship operators to a shift towards all the more integral management of all their businesses, by which they also include the land transport part of the route.
→ In the second half-year we expect an even tougher situation in the sea-freight market of full container loads and LCL containers. Ship operators have announced a raise in freight rates, so the pricing policy is going to be all the tougher. In conventional cargo, the result will very much depend on the quantities of liquid cargo and on the new season of cooled fruit and vegetables. We estimate our sales results to be approximately on the half-year level.
Car logistics: → After disposal of the logistics terminal in Russia, our car logistics is performed mainly in
Slovenia and to a minor extent in Serbia as well. → Car logistics is faced with a major decline in the demand, which is reflected in the
turnover of our customers. In the reporting half-year we handled 23 percent fewer vehicles than in comparable term last year. All car makers have recorded a fall in the sales, with Opel as the only exception, whose new model Mokka is selling very well in Europe.
→ Our car terminals in Koper and Logatec also reported a lower volume of fewer vehicles compared with the first half-year last year.
→ Forecasts for car sales in Europe and the entire car logistics remain pessimistic also for the second half-year: we do not expect any particular positive variances in the revenue from car logistics.
Unaudited Report
17/56
JANUARY – JUNE 2013
Shipping Agency: → Our subsidiary Interagent d.o.o. achieved 2 percent higher sales revenues than last year,
but missed the sales target by 6 percent. → With 129 ships represented in the port of Koper, we maintained our leading position in
terms of the number of ships represented. → We handled the a few tens of containers for the ship operator China Shipping Container
Lines, which is developing the service in the Adriatic, or bound for Koper resp., however, the volume of operations was below the plan. We were therefore behind the target operating results in the first half-year.
→ For Chartering, a better result was primarily attributable to a longer season of salt imports. We closed some major shipments of cars and trailers with our ship-owner.
→ Our focus remains to acquire the agency representation also in other countries of the Balkans (Croatia, Montenegro, Albania) where the sea-freight markets are even worse than in North Adriatic (the container ships operators are cancelling the calling of their own ships /service, e.g. in Bar and Ploče).
→ Similar results are expected for the second half-year of the current year. A major improvement could only be achieved with a more competitive service of the container ship operator.
Air-Freight Transport:
→ Our Air-Freight product recorded 16 percent better sales than in the first half-year ago, but remained behind the sales targets. The markets in Slovenia and Serbia have the highest influence.
→ We are faced with a strong competition in Slovenia, coming from all the more aggressive global logistics players in our domestic market.
→ In Serbia we organised fewer charter flights than a year ago, which resulted in a setback behind the envisioned sales results. In other markets we were doing better, except for Bosnia and Herzegovina.
→ Air-freight rates still remain higher than sea-freight container consolidation transport, but we expect more fierce competition in the second half-year for which a considerable raise in freight rates was already announced.
→ We expect improvement for the second half-year, in particular in the last quarter which is considered as the high season of air-freight services.
Unaudited Report
18/56
JANUARY – JUNE 2013
1.2. Financial result
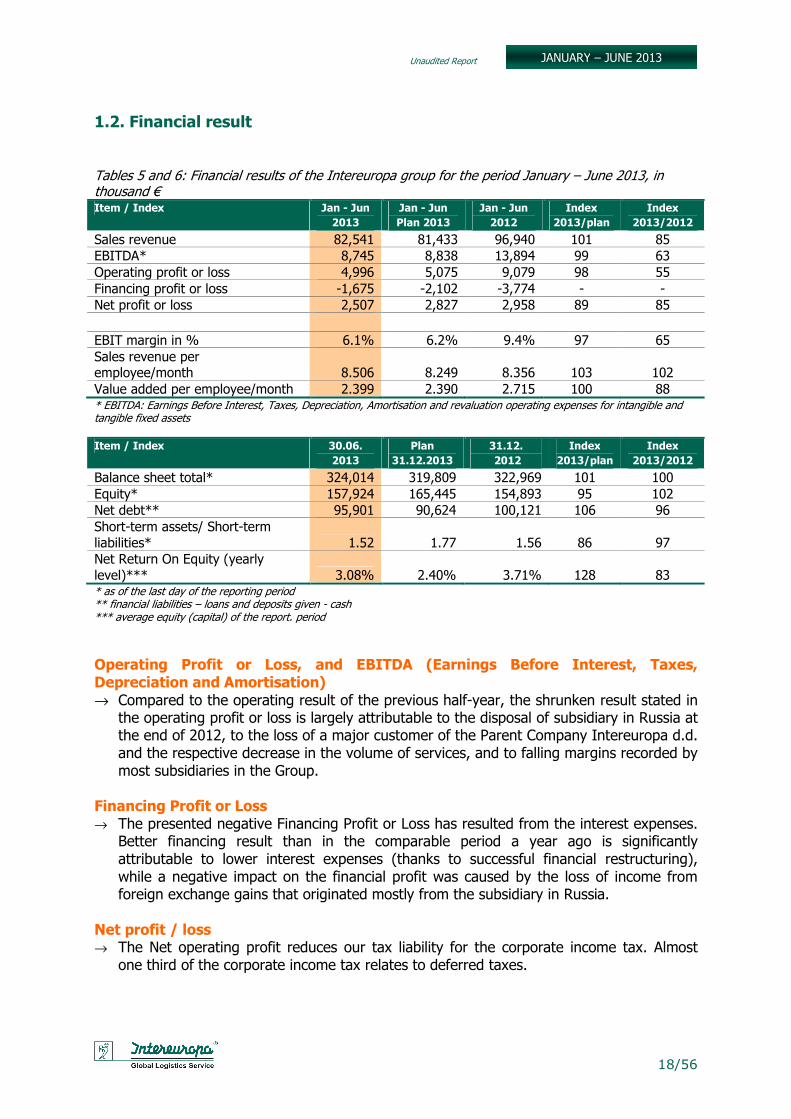
Tables 5 and 6: Financial results of the Intereuropa group for the period January – June 2013, in thousand € Item / Index Jan - Jun
2013
Jan - Jun
Plan 2013
Jan - Jun
2012 Index
2013/plan
Index
2013/2012
Sales revenue 82,541 81,433 96,940 101 85 EBITDA* 8,745 8,838 13,894 99 63 Operating profit or loss 4,996 5,075 9,079 98 55 Financing profit or loss -1,675 -2,102 -3,774 - - Net profit or loss 2,507 2,827 2,958 89 85 EBIT margin in % 6.1% 6.2% 9.4% 97 65 Sales revenue per employee/month 8.506 8.249 8.356 103 102 Value added per employee/month 2.399 2.390 2.715 100 88 * EBITDA: Earnings Before Interest, Taxes, Depreciation, Amortisation and revaluation operating expenses for intangible and tangible fixed assets Item / Index 30.06.
2013
Plan
31.12.2013
31.12.
2012
Index
2013/plan
Index
2013/2012
Balance sheet total* 324,014 319,809 322,969 101 100 Equity* 157,924 165,445 154,893 95 102 Net debt** 95,901 90,624 100,121 106 96 Short-term assets/ Short-term liabilities* 1.52 1.77 1.56 86 97 Net Return On Equity (yearly level)*** 3.08% 2.40% 3.71% 128 83 * as of the last day of the reporting period ** financial liabilities – loans and deposits given - cash *** average equity (capital) of the report. period Operating Profit or Loss, and EBITDA (Earnings Before Interest, Taxes, Depreciation and Amortisation) → Compared to the operating result of the previous half-year, the shrunken result stated in
the operating profit or loss is largely attributable to the disposal of subsidiary in Russia at the end of 2012, to the loss of a major customer of the Parent Company Intereuropa d.d. and the respective decrease in the volume of services, and to falling margins recorded by most subsidiaries in the Group.
Financing Profit or Loss → The presented negative Financing Profit or Loss has resulted from the interest expenses.
Better financing result than in the comparable period a year ago is significantly attributable to lower interest expenses (thanks to successful financial restructuring), while a negative impact on the financial profit was caused by the loss of income from foreign exchange gains that originated mostly from the subsidiary in Russia.
Net profit / loss → The Net operating profit reduces our tax liability for the corporate income tax. Almost
one third of the corporate income tax relates to deferred taxes.
Unaudited Report
19/56
JANUARY – JUNE 2013
Structure of Statement of Financial Position → The current ratio has not changed essentially in the first half-year, nor has the share of
capital in the sources of finance (+ 0.6 percentage point over the first quarter 2013).
1.3. Investments in fixed assets
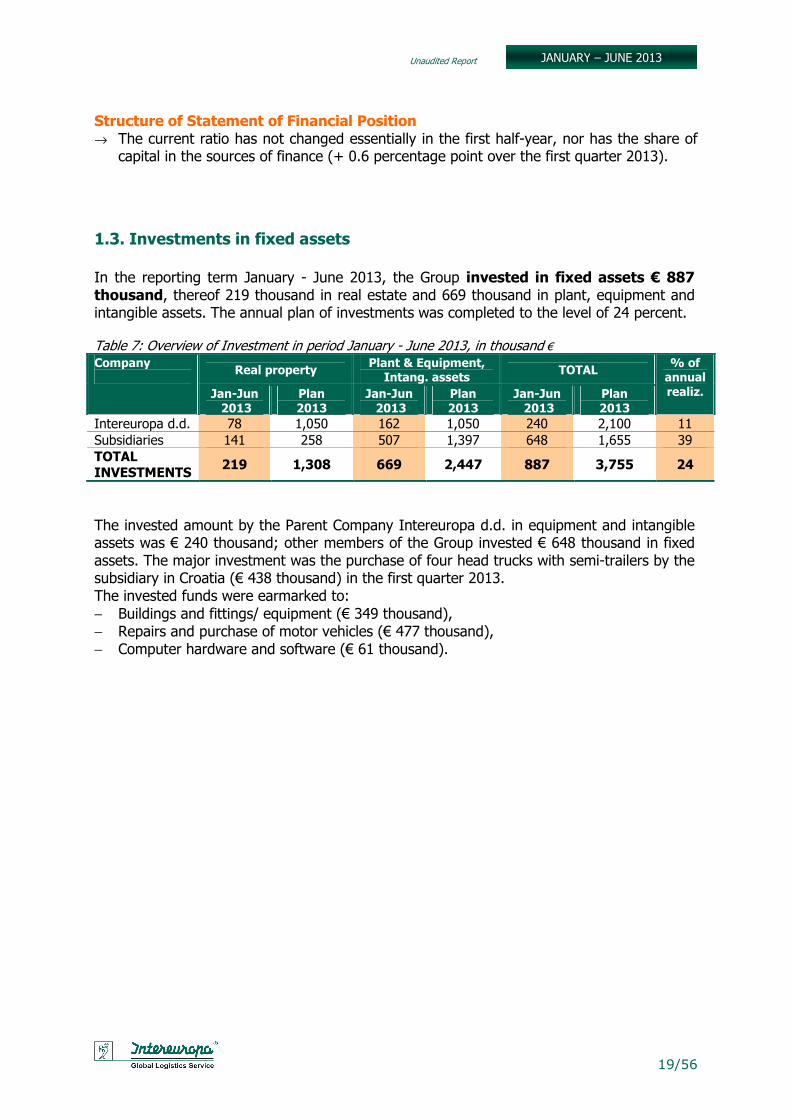
In the reporting term January - June 2013, the Group invested in fixed assets € 887 thousand, thereof 219 thousand in real estate and 669 thousand in plant, equipment and intangible assets. The annual plan of investments was completed to the level of 24 percent. Table 7: Overview of Investment in period January - June 2013, in thousand € Company
Real property Plant & Equipment,
Intang. assets TOTAL
% of annual realiz. Jan-Jun
2013 Plan 2013
Jan-Jun 2013
Plan 2013
Jan-Jun 2013
Plan 2013
Intereuropa d.d. 78 1,050 162 1,050 240 2,100 11 Subsidiaries 141 258 507 1,397 648 1,655 39 TOTAL INVESTMENTS
219 1,308 669 2,447 887 3,755 24
The invested amount by the Parent Company Intereuropa d.d. in equipment and intangible assets was € 240 thousand; other members of the Group invested € 648 thousand in fixed assets. The major investment was the purchase of four head trucks with semi-trailers by the subsidiary in Croatia (€ 438 thousand) in the first quarter 2013. The invested funds were earmarked to: − Buildings and fittings/ equipment (€ 349 thousand), − Repairs and purchase of motor vehicles (€ 477 thousand), − Computer hardware and software (€ 61 thousand).

Unaudited Report
20/56
JANUARY – JUNE 2013
1.4. Risk management
The central goal in risk management is to effectively address and reduce uncertainty in the Company and thereby assure higher operating performance and retain the competitive advantages of the Company. As at the half-year cut-off date, we reviewed the risk types again and identified 63 types of risk (two more than at the end of last year) in the company Intereuropa d.d., thereof ten key risks, two more than last year-end. In the reporting half-year, our highest exposure to risks involved the sales risk, pressure on the prices and the risks for a decreased demand for our services. Nevertheless we were able to make good for the loss of income by enhanced sales activity. The impact of overall economic situation in the country remains to show in poor liquidity and reflects in extended payment terms on the part of our customers. The sales risk is viewed as our most significant risk and enjoys our full attention. In that segment we identified 27 risk types, thereof 4 key risks. Despite increased pressure on our prices and cutting the demand for services in certain customers, we managed to retain the income on the planned level, which is estimated as considerable success. The expectations of our customers primarily involve a reduction in our prices for the same quality level. To compensate that loss of income from our current customers, we offer them additional services. We succeeded to acquire some major businesses and thus compensate for the declining sales volume in some of our customers. Also our further activities are focused on acquiring new business, along with increasing the productivity in our employees. Price sensitivity has been rising, which calls for internal streamlining of processes and cost containment as all the more important. The newly defined sales strategy has already yielded some results in the reporting half-year: our focus remains on effective customer management of key accounts and on the activities to acquire new customers. In view of sales risk management in the coming period, we estimate our exposure to these risks to rise in the Land and Intercontinental transport areas (decline in revenues in the segment of customs services, lower demand on the part of certain customers), while we expect to acquire new businesses or to increase the volume of business with current customers in our Logistics solutions area. The credit risk has increased this year, as a result of overall economic situation in Slovenia, the European Union and also in the countries in which the Intereuropa Group is operating. Higher liquidity risk is shown in higher current ratio of operating receivables turnover rate (i.e., payment). Our activities are increasingly directed to debt collection, which is very difficult to achieve in the face of concurrent pressure to expand, or at least maintain the volume. Observance of the limits for our exposure to certain customers is of key importance. We address and manage the liquidity risk by daily control of working capital and exposure to individual customers and units in the Company. The Management Board controls its financial condition and exposure to certain customers more frequently than earlier. Personnel risk and other operational risks (strategic risks, IT risks, legislation risks and those related to real estate) were maintained on acceptable levels, no significant discrepancy was perceived. Individual risk managers monitor the exposure to risks and manage the risks on the level of the Company, customer, unit or of a concrete business. We estimate for the second half-year that Intereuropa d.d. will continue to be exposed to the sales and credit risks. The measures adopted and activities in implementation we envision to maintain the exposure of the Company to risks on an acceptable level, and to achieve the planned results.
Unaudited Report
21/56
JANUARY – JUNE 2013
1.5. Human Resources Management
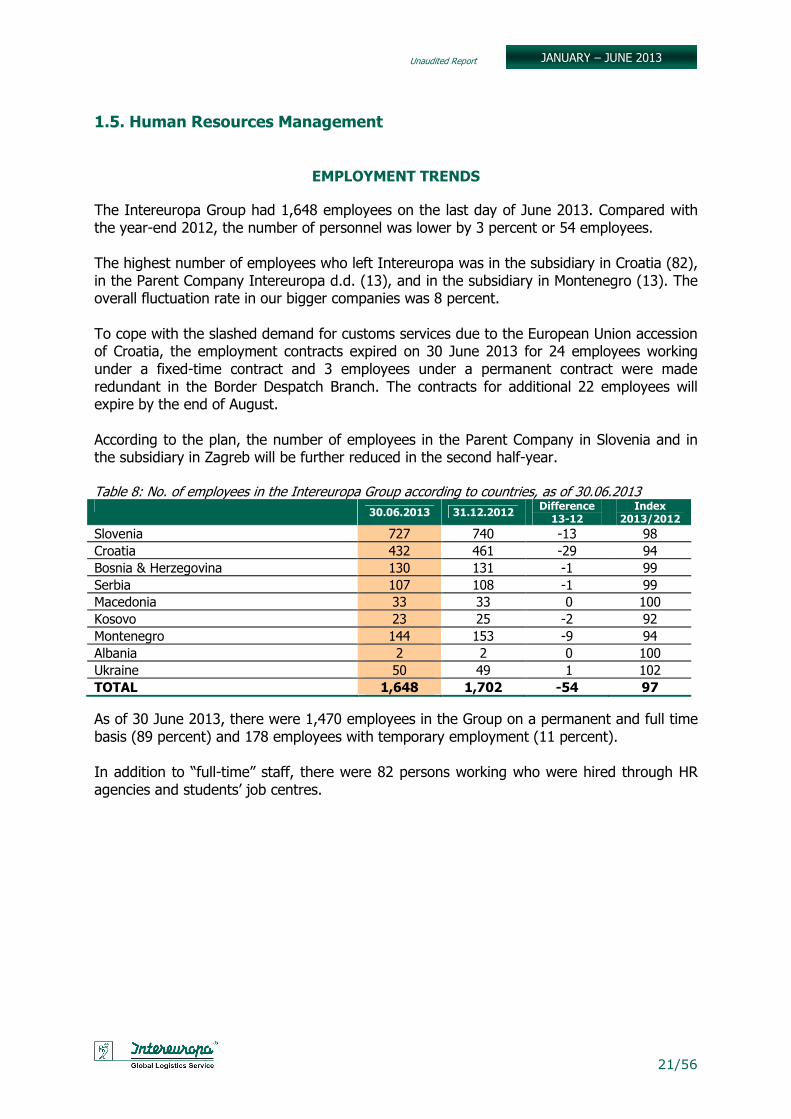
EMPLOYMENT TRENDS The Intereuropa Group had 1,648 employees on the last day of June 2013. Compared with the year-end 2012, the number of personnel was lower by 3 percent or 54 employees. The highest number of employees who left Intereuropa was in the subsidiary in Croatia (82), in the Parent Company Intereuropa d.d. (13), and in the subsidiary in Montenegro (13). The overall fluctuation rate in our bigger companies was 8 percent. To cope with the slashed demand for customs services due to the European Union accession of Croatia, the employment contracts expired on 30 June 2013 for 24 employees working under a fixed-time contract and 3 employees under a permanent contract were made redundant in the Border Despatch Branch. The contracts for additional 22 employees will expire by the end of August. According to the plan, the number of employees in the Parent Company in Slovenia and in the subsidiary in Zagreb will be further reduced in the second half-year. Table 8: No. of employees in the Intereuropa Group according to countries, as of 30.06.2013
30.06.2013 31.12.2012 Difference 13-12
Index 2013/2012
Slovenia 727 740 -13 98 Croatia 432 461 -29 94 Bosnia & Herzegovina 130 131 -1 99 Serbia 107 108 -1 99 Macedonia 33 33 0 100 Kosovo 23 25 -2 92 Montenegro 144 153 -9 94 Albania 2 2 0 100 Ukraine 50 49 1 102 TOTAL 1,648 1,702 -54 97 As of 30 June 2013, there were 1,470 employees in the Group on a permanent and full time basis (89 percent) and 178 employees with temporary employment (11 percent). In addition to “full-time” staff, there were 82 persons working who were hired through HR agencies and students’ job centres.
Unaudited Report
22/56
JANUARY – JUNE 2013
DEVELOPMENT AND TRAINING
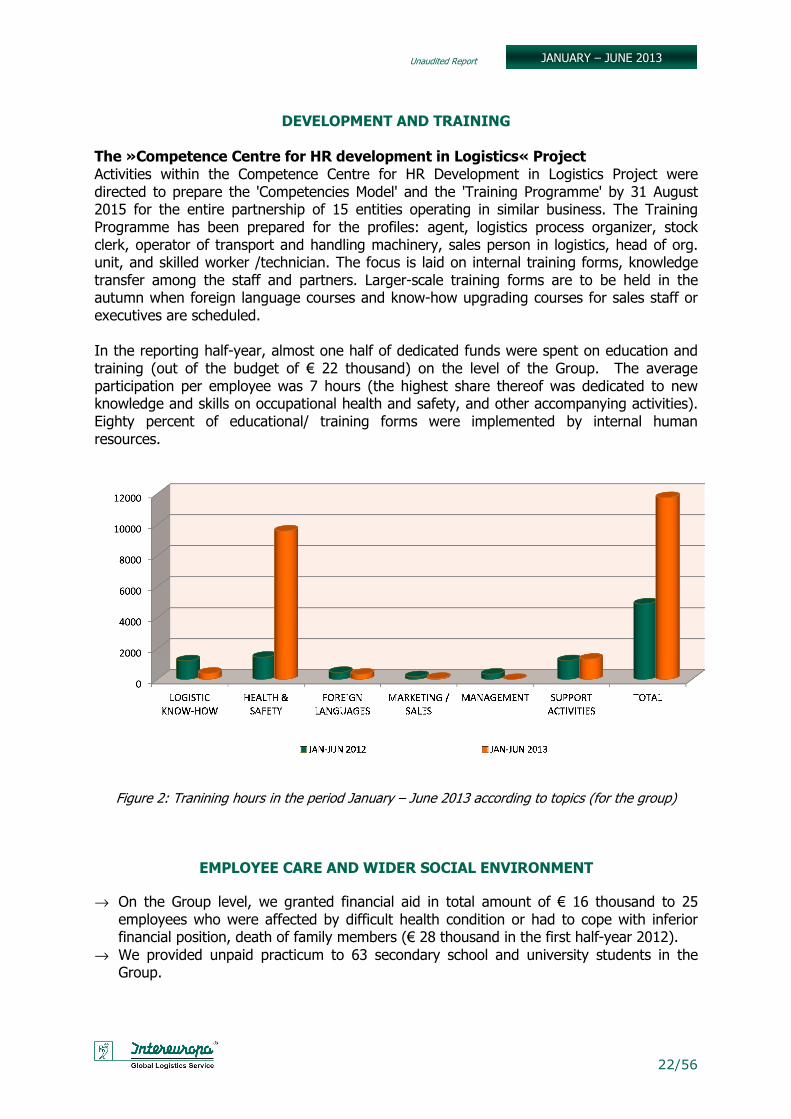
The »Competence Centre for HR development in Logistics« Project Activities within the Competence Centre for HR Development in Logistics Project were directed to prepare the 'Competencies Model' and the 'Training Programme' by 31 August 2015 for the entire partnership of 15 entities operating in similar business. The Training Programme has been prepared for the profiles: agent, logistics process organizer, stock clerk, operator of transport and handling machinery, sales person in logistics, head of org. unit, and skilled worker /technician. The focus is laid on internal training forms, knowledge transfer among the staff and partners. Larger-scale training forms are to be held in the autumn when foreign language courses and know-how upgrading courses for sales staff or executives are scheduled. In the reporting half-year, almost one half of dedicated funds were spent on education and training (out of the budget of € 22 thousand) on the level of the Group. The average participation per employee was 7 hours (the highest share thereof was dedicated to new knowledge and skills on occupational health and safety, and other accompanying activities). Eighty percent of educational/ training forms were implemented by internal human resources.
Figure 2: Tranining hours in the period January – June 2013 according to topics (for the group)
EMPLOYEE CARE AND WIDER SOCIAL ENVIRONMENT
→ On the Group level, we granted financial aid in total amount of € 16 thousand to 25 employees who were affected by difficult health condition or had to cope with inferior financial position, death of family members (€ 28 thousand in the first half-year 2012).
→ We provided unpaid practicum to 63 secondary school and university students in the Group.
Unaudited Report
23/56
JANUARY – JUNE 2013
HEALTH PROTECTION
The following activities were implemented in this area: → 166 preventive medical check-ups, → Preparation of a health-strengthening programme – promoting the occupational health
care in the workplace; → Amending or harmonizing our internal acts/bylaws with the new Occupational Health and
Safety Act, in the Parent Company and the subsidiary Interagent d.o.o.; → Provided training in Occupational Safety to employees working with cash and on the
siding rails. In the field of fire safety and precautions, the following activities were implemented: → Preparation of a training programme for persons responsible for first response to fire and
evacuation, → Amending or harmonizing the internal acts of Interagent d.o.o. with the new Fire Safety
Regulations, → Preparation for training on handling with fire extinguishers and evacuation exercises for
individual business units. There were 687 sets of machines and working assets/ equipment examined in the first half-year on the Group level. Five employees were injured at work (light injuries only).
Unaudited Report
24/56
JANUARY – JUNE 2013
1.6. Total Quality Management
Three companies of the Intereuropa Group (out of 12) hold a certification under the ISO 9001:2008 Standard. Seventy-six percent of all employees work in these certified companies (Intereuropa d.d., Intereuropa, logističke usluge d.o.o., Zagreb, and Intereuropa RTC d.d. Sarajevo). An External Audit of the Quality Management System of Intereuropa d.d. was conducted in the reporting half-year. Maintaining the ISO 9001:2008 Quality Management System → Yearly QMS reports were prepared for the year 2012 and the measures to improve the
QM system were triggered in all the three companies. → A new (second edition) Quality Management System Manual for the company
Intereuropa d.d. was issued. → We modernised the procedures, instructions and circular letters in customs broking. → In the Parent Company we started with assessment of suppliers of road transport
services. → All the procedures, instructions and sales tools are being updated. → The preparation of process-based Key Performance Indicators (KPI) is being prepared. → The instructions on the procedures changing with the accession of Croatia to the EU are
being updated in the subsidiary Intereuropa, logističke usluge d.o.o., Zagreb. Internal auditing of service quality → In the reporting half-year, no internal audit was conducted in Intereuropa d.d. Quality control by QM indicators There were 14 percent fewer complaints than in the comparable term 2012, but the total amount under complaints rose by 3 percent.
No. of complaints
Index 13/12
No. of claims Value
in 1000 €
Index 13/12
Approved Value
in 1000 €
Index 13/12
223 86 95 51 103 19 84 External quality of service audit by the certification authority The results of external audit in Intereuropa d.d. in 2013: → Intereuropa d.d. - the ordinary audit was the fifteenth in sequence. The audit was
conducted in the following organizational units: Management Board, Management of Forwarding and Logistics, the Department for Real Estate Management and Central Purchasing, the Finance Department, local office in Kranj, and BU Jesenice and Ljubljana. Auditors have confirmed that our operations are conducted in compliance with the requirements of the ISO 9001 standard. They did not find any non-compliance, however, they issued 16 recommendations for improvement.
Recommendations by contents/ substance relate to: → Corrective measures > 3 recommendations, → Customer satisfaction > 2 recommendations, → Supplier selection > 2 recommendations, → Process control and measurement > 2 recommendations, → Protection /security of Customers’ property > 1 recommendation, → Internal communication > 1 recommendation, → Internal audits > 1 recommendation, → Other > 4 recommendations.
Unaudited Report
25/56
JANUARY – JUNE 2013
The persons responsible prepared the implementation plan for the recommendations accepted on our part, and substantiated the grounds for any recommendations not accepted. At the beginning of June the report on measures taken was submitted to the certification body.
→ Intereuropa, logističke usluge d.o.o., Zagreb - Upon request of the management
the external audit scheduled for June was postponed for three months due to preparations and organizational changes addressing the European Union accession of Croatia.
Food Safety Management System
→ Intereuropa d.d. - A non-certified system of food safety management under the HACCP system has been in use since 2004. The audit of the HACCP system, comprising the compliance check and updating of all rules and procedures relevant for food safety was done in February.
Unaudited Report
26/56
JANUARY – JUNE 2013
1.7. Share IEKG and ownership structure
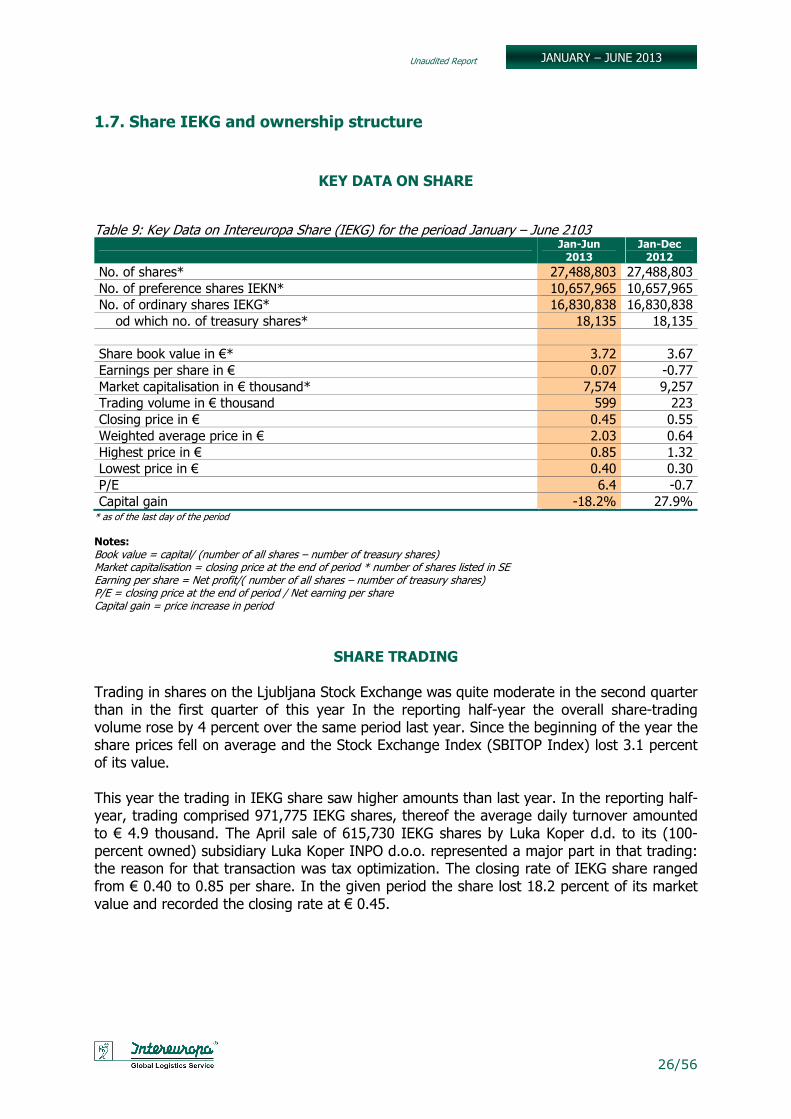
KEY DATA ON SHARE Table 9: Key Data on Intereuropa Share (IEKG) for the perioad January – June 2103
Jan-Jun 2013
Jan-Dec 2012
No. of shares* 27,488,803 27,488,803 No. of preference shares IEKN* 10,657,965 10,657,965 No. of ordinary shares IEKG* 16,830,838 16,830,838 od which no. of treasury shares* 18,135 18,135 Share book value in €* 3.72 3.67 Earnings per share in € 0.07 -0.77 Market capitalisation in € thousand* 7,574 9,257 Trading volume in € thousand 599 223 Closing price in € 0.45 0.55 Weighted average price in € 2.03 0.64 Highest price in € 0.85 1.32 Lowest price in € 0.40 0.30 P/E 6.4 -0.7 Capital gain -18.2% 27.9%
* as of the last day of the period Notes: Book value = capital/ (number of all shares – number of treasury shares) Market capitalisation = closing price at the end of period * number of shares listed in SE Earning per share = Net profit/( number of all shares – number of treasury shares) P/E = closing price at the end of period / Net earning per share Capital gain = price increase in period
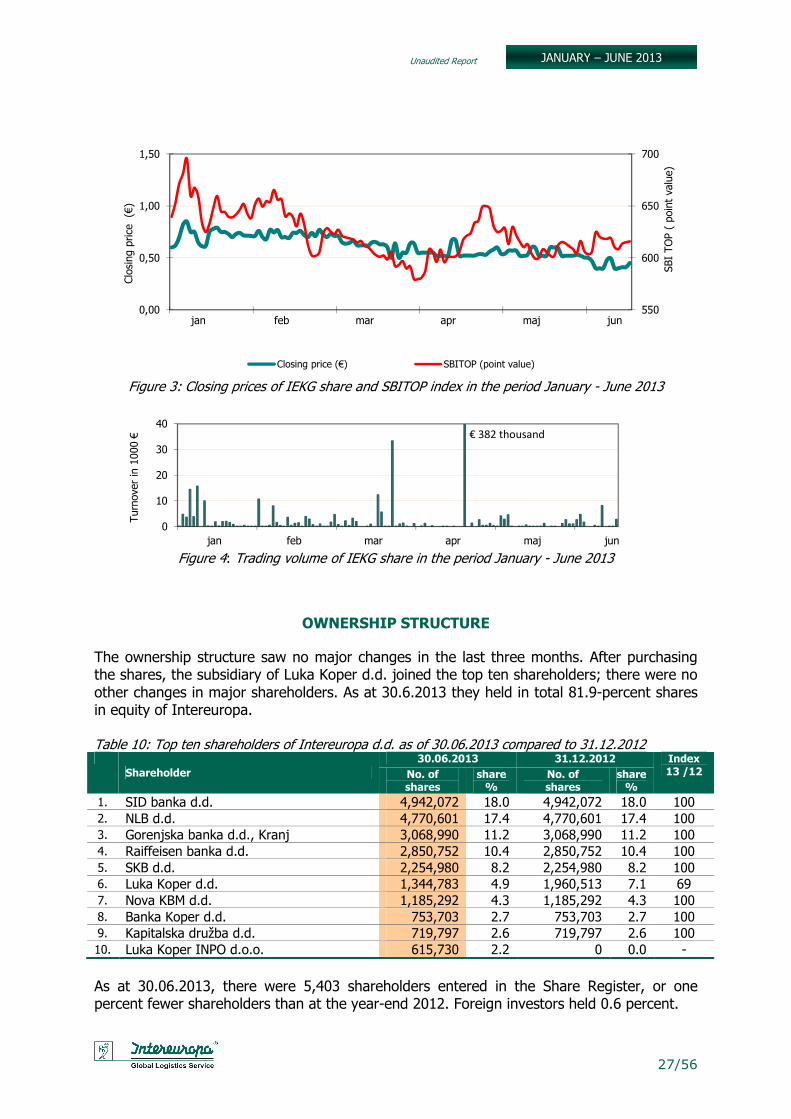
SHARE TRADING Trading in shares on the Ljubljana Stock Exchange was quite moderate in the second quarter than in the first quarter of this year In the reporting half-year the overall share-trading volume rose by 4 percent over the same period last year. Since the beginning of the year the share prices fell on average and the Stock Exchange Index (SBITOP Index) lost 3.1 percent of its value. This year the trading in IEKG share saw higher amounts than last year. In the reporting half-year, trading comprised 971,775 IEKG shares, thereof the average daily turnover amounted to € 4.9 thousand. The April sale of 615,730 IEKG shares by Luka Koper d.d. to its (100-percent owned) subsidiary Luka Koper INPO d.o.o. represented a major part in that trading: the reason for that transaction was tax optimization. The closing rate of IEKG share ranged from € 0.40 to 0.85 per share. In the given period the share lost 18.2 percent of its market value and recorded the closing rate at € 0.45.
Unaudited Report
27/56
JANUARY – JUNE 2013
Figure 3: Closing prices of IEKG share and SBITOP index in the period January - June 2013
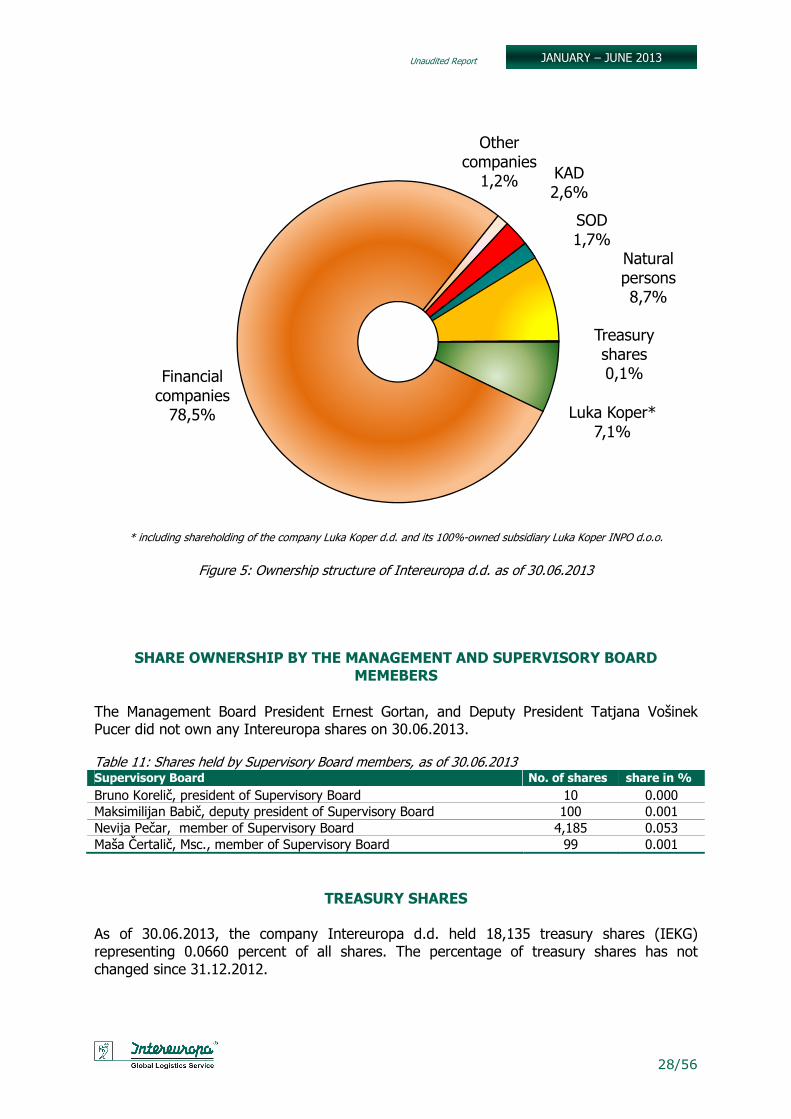
Figure 4: Trading volume of IEKG share in the period January - June 2013
OWNERSHIP STRUCTURE The ownership structure saw no major changes in the last three months. After purchasing the shares, the subsidiary of Luka Koper d.d. joined the top ten shareholders; there were no other changes in major shareholders. As at 30.6.2013 they held in total 81.9-percent shares in equity of Intereuropa. Table 10: Top ten shareholders of Intereuropa d.d. as of 30.06.2013 compared to 31.12.2012
Shareholder
30.06.2013 31.12.2012 Index 13 /12 No. of
shares share %
No. of shares
share %
1. SID banka d.d. 4,942,072 18.0 4,942,072 18.0 100 2. NLB d.d. 4,770,601 17.4 4,770,601 17.4 100 3. Gorenjska banka d.d., Kranj 3,068,990 11.2 3,068,990 11.2 100 4. Raiffeisen banka d.d. 2,850,752 10.4 2,850,752 10.4 100 5. SKB d.d. 2,254,980 8.2 2,254,980 8.2 100 6. Luka Koper d.d. 1,344,783 4.9 1,960,513 7.1 69 7. Nova KBM d.d. 1,185,292 4.3 1,185,292 4.3 100 8. Banka Koper d.d. 753,703 2.7 753,703 2.7 100 9. Kapitalska družba d.d. 719,797 2.6 719,797 2.6 100 10. Luka Koper INPO d.o.o. 615,730 2.2 0 0.0 - As at 30.06.2013, there were 5,403 shareholders entered in the Share Register, or one percent fewer shareholders than at the year-end 2012. Foreign investors held 0.6 percent.
550
600
650
700
0,00
0,50
1,00
1,50
jan feb mar apr maj jun
SBI TO
P ( po
int va
lue)
Clos
ing
price
(€)
Closing price (€) SBITOP (point value)
0
10
20
30
40
jan feb mar apr maj jun
Turn
over
in 1
000 € € 382 thousand
Unaudited Report
28/56
JANUARY – JUNE 2013
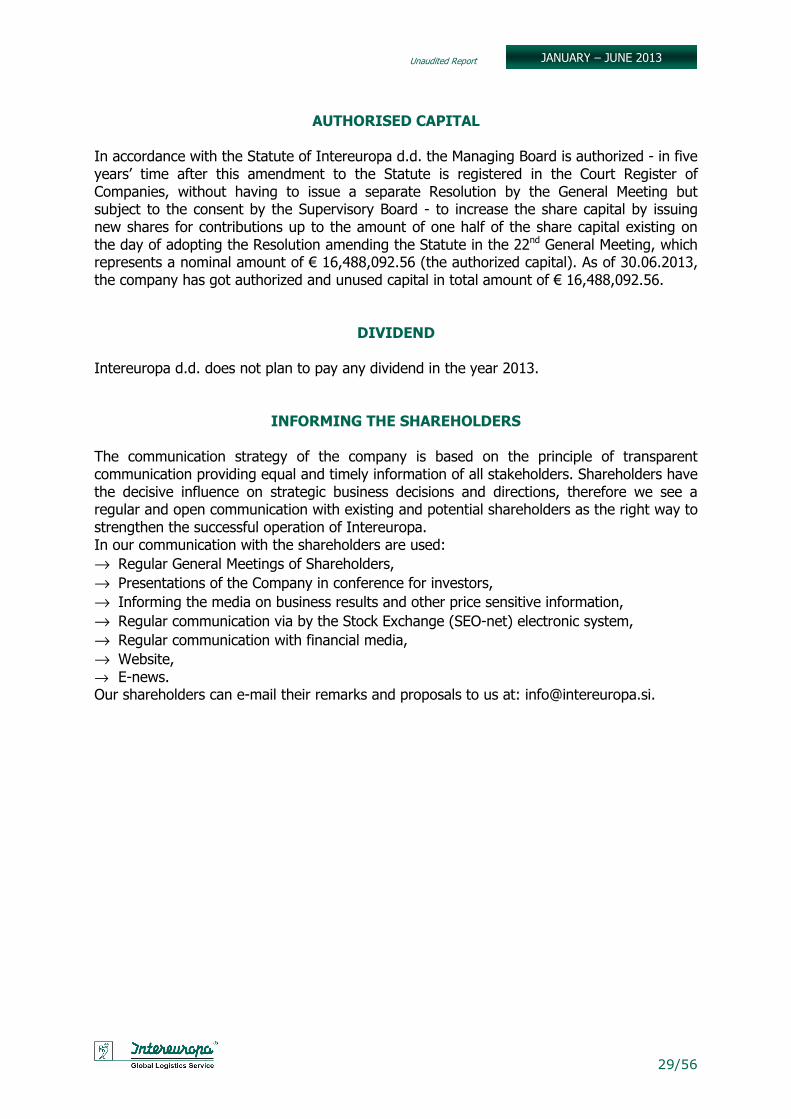
* including shareholding of the company Luka Koper d.d. and its 100%-owned subsidiary Luka Koper INPO d.o.o.
Figure 5: Ownership structure of Intereuropa d.d. as of 30.06.2013
SHARE OWNERSHIP BY THE MANAGEMENT AND SUPERVISORY BOARD MEMEBERS
The Management Board President Ernest Gortan, and Deputy President Tatjana Vošinek Pucer did not own any Intereuropa shares on 30.06.2013. Table 11: Shares held by Supervisory Board members, as of 30.06.2013
TREASURY SHARES As of 30.06.2013, the company Intereuropa d.d. held 18,135 treasury shares (IEKG) representing 0.0660 percent of all shares. The percentage of treasury shares has not changed since 31.12.2012.
Luka Koper*7,1%
Financial companies
78,5%
Other companies
1,2% KAD2,6%
SOD1,7%
Natural persons8,7%
Treasury shares0,1%
Supervisory Board No. of shares share in %
Bruno Korelič, president of Supervisory Board 10 0.000 Maksimilijan Babič, deputy president of Supervisory Board 100 0.001 Nevija Pečar, member of Supervisory Board 4,185 0.053 Maša Čertalič, Msc., member of Supervisory Board 99 0.001
Unaudited Report
29/56
JANUARY – JUNE 2013
AUTHORISED CAPITAL In accordance with the Statute of Intereuropa d.d. the Managing Board is authorized - in five years’ time after this amendment to the Statute is registered in the Court Register of Companies, without having to issue a separate Resolution by the General Meeting but subject to the consent by the Supervisory Board - to increase the share capital by issuing new shares for contributions up to the amount of one half of the share capital existing on the day of adopting the Resolution amending the Statute in the 22nd General Meeting, which represents a nominal amount of € 16,488,092.56 (the authorized capital). As of 30.06.2013, the company has got authorized and unused capital in total amount of € 16,488,092.56.
DIVIDEND Intereuropa d.d. does not plan to pay any dividend in the year 2013.
INFORMING THE SHAREHOLDERS The communication strategy of the company is based on the principle of transparent communication providing equal and timely information of all stakeholders. Shareholders have the decisive influence on strategic business decisions and directions, therefore we see a regular and open communication with existing and potential shareholders as the right way to strengthen the successful operation of Intereuropa. In our communication with the shareholders are used: → Regular General Meetings of Shareholders, → Presentations of the Company in conference for investors, → Informing the media on business results and other price sensitive information, → Regular communication via by the Stock Exchange (SEO-net) electronic system, → Regular communication with financial media, → Website, → E-news. Our shareholders can e-mail their remarks and proposals to us at: [email protected].
Unaudited Report
30/56
JANUARY – JUNE 2013
2. PERFORMANCE OF THE COMPANY INTEREUROPA d.d.
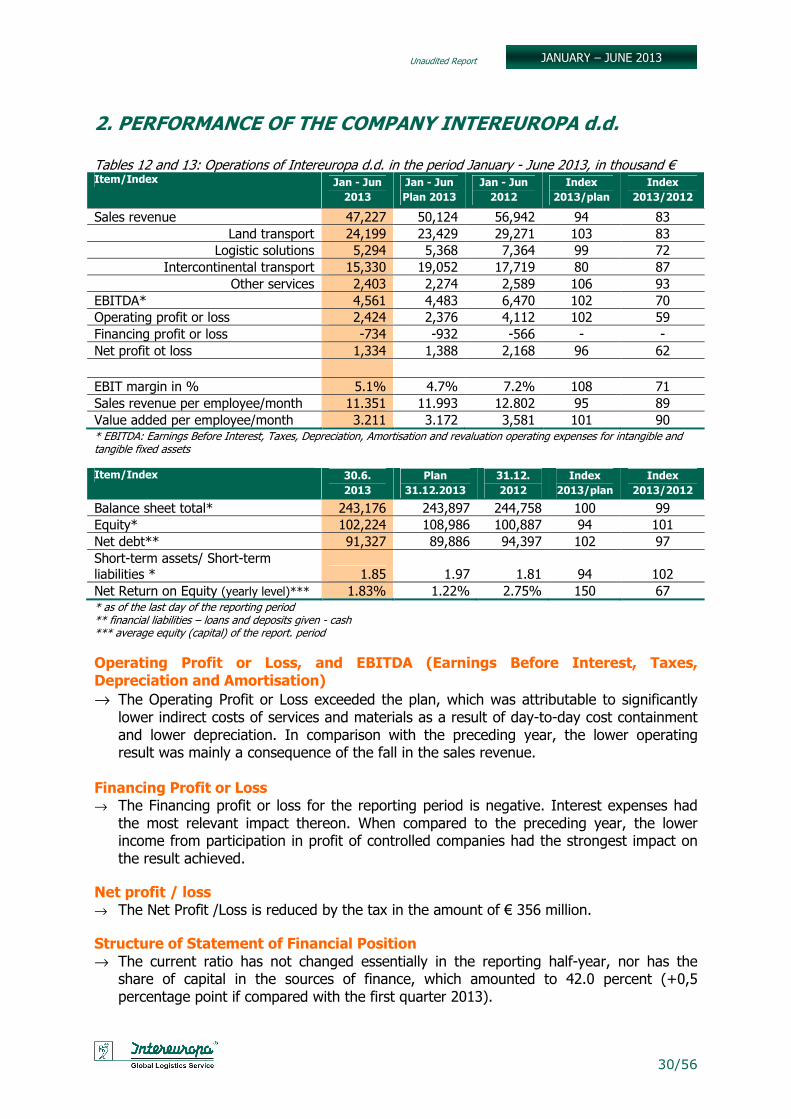
Tables 12 and 13: Operations of Intereuropa d.d. in the period January - June 2013, in thousand € Item/Index Jan - Jun
2013
Jan - Jun
Plan 2013
Jan - Jun
2012 Index
2013/plan
Index
2013/2012
Sales revenue 47,227 50,124 56,942 94 83 Land transport 24,199 23,429 29,271 103 83
Logistic solutions 5,294 5,368 7,364 99 72 Intercontinental transport 15,330 19,052 17,719 80 87
Other services 2,403 2,274 2,589 106 93 EBITDA* 4,561 4,483 6,470 102 70 Operating profit or loss 2,424 2,376 4,112 102 59 Financing profit or loss -734 -932 -566 - - Net profit ot loss 1,334 1,388 2,168 96 62 EBIT margin in % 5.1% 4.7% 7.2% 108 71 Sales revenue per employee/month 11.351 11.993 12.802 95 89 Value added per employee/month 3.211 3.172 3,581 101 90 * EBITDA: Earnings Before Interest, Taxes, Depreciation, Amortisation and revaluation operating expenses for intangible and tangible fixed assets Item/Index 30.6.
2013
Plan
31.12.2013
31.12.
2012
Index
2013/plan
Index
2013/2012
Balance sheet total* 243,176 243,897 244,758 100 99 Equity* 102,224 108,986 100,887 94 101 Net debt** 91,327 89,886 94,397 102 97 Short-term assets/ Short-term liabilities * 1.85 1.97 1.81 94 102 Net Return on Equity (yearly level)*** 1.83% 1.22% 2.75% 150 67 * as of the last day of the reporting period ** financial liabilities – loans and deposits given - cash *** average equity (capital) of the report. period
Operating Profit or Loss, and EBITDA (Earnings Before Interest, Taxes, Depreciation and Amortisation)
→ The Operating Profit or Loss exceeded the plan, which was attributable to significantly lower indirect costs of services and materials as a result of day-to-day cost containment and lower depreciation. In comparison with the preceding year, the lower operating result was mainly a consequence of the fall in the sales revenue.
Financing Profit or Loss → The Financing profit or loss for the reporting period is negative. Interest expenses had
the most relevant impact thereon. When compared to the preceding year, the lower income from participation in profit of controlled companies had the strongest impact on the result achieved.
Net profit / loss → The Net Profit /Loss is reduced by the tax in the amount of € 356 million.
Structure of Statement of Financial Position → The current ratio has not changed essentially in the reporting half-year, nor has the
share of capital in the sources of finance, which amounted to 42.0 percent (+0,5 percentage point if compared with the first quarter 2013).
Unaudited Report
31/56
JANUARY – JUNE 2013
ACCOUNTING REPORT
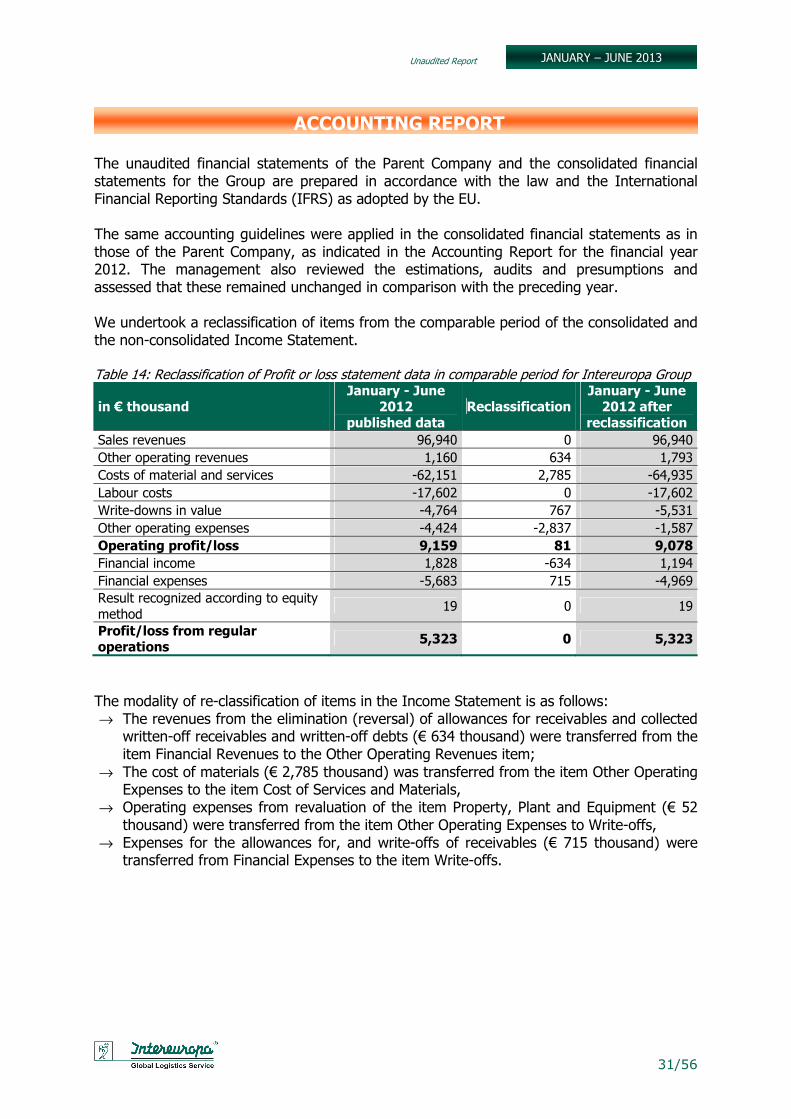
The unaudited financial statements of the Parent Company and the consolidated financial statements for the Group are prepared in accordance with the law and the International Financial Reporting Standards (IFRS) as adopted by the EU. The same accounting guidelines were applied in the consolidated financial statements as in those of the Parent Company, as indicated in the Accounting Report for the financial year 2012. The management also reviewed the estimations, audits and presumptions and assessed that these remained unchanged in comparison with the preceding year. We undertook a reclassification of items from the comparable period of the consolidated and the non-consolidated Income Statement. Table 14: Reclassification of Profit or loss statement data in comparable period for Intereuropa Group
in € thousand January - June
2012 published data
Reclassification January - June 2012 after
reclassification
Sales revenues 96,940 0 96,940 Other operating revenues 1,160 634 1,793 Costs of material and services -62,151 2,785 -64,935 Labour costs -17,602 0 -17,602 Write-downs in value -4,764 767 -5,531 Other operating expenses -4,424 -2,837 -1,587 Operating profit/loss 9,159 81 9,078
Financial income 1,828 -634 1,194 Financial expenses -5,683 715 -4,969 Result recognized according to equity method 19 0 19
Profit/loss from regular operations
5,323 0 5,323
The modality of re-classification of items in the Income Statement is as follows: → The revenues from the elimination (reversal) of allowances for receivables and collected
written-off receivables and written-off debts (€ 634 thousand) were transferred from the item Financial Revenues to the Other Operating Revenues item;
→ The cost of materials (€ 2,785 thousand) was transferred from the item Other Operating Expenses to the item Cost of Services and Materials,
→ Operating expenses from revaluation of the item Property, Plant and Equipment (€ 52 thousand) were transferred from the item Other Operating Expenses to Write-offs,
→ Expenses for the allowances for, and write-offs of receivables (€ 715 thousand) were transferred from Financial Expenses to the item Write-offs.
Unaudited Report
32/56
JANUARY – JUNE 2013
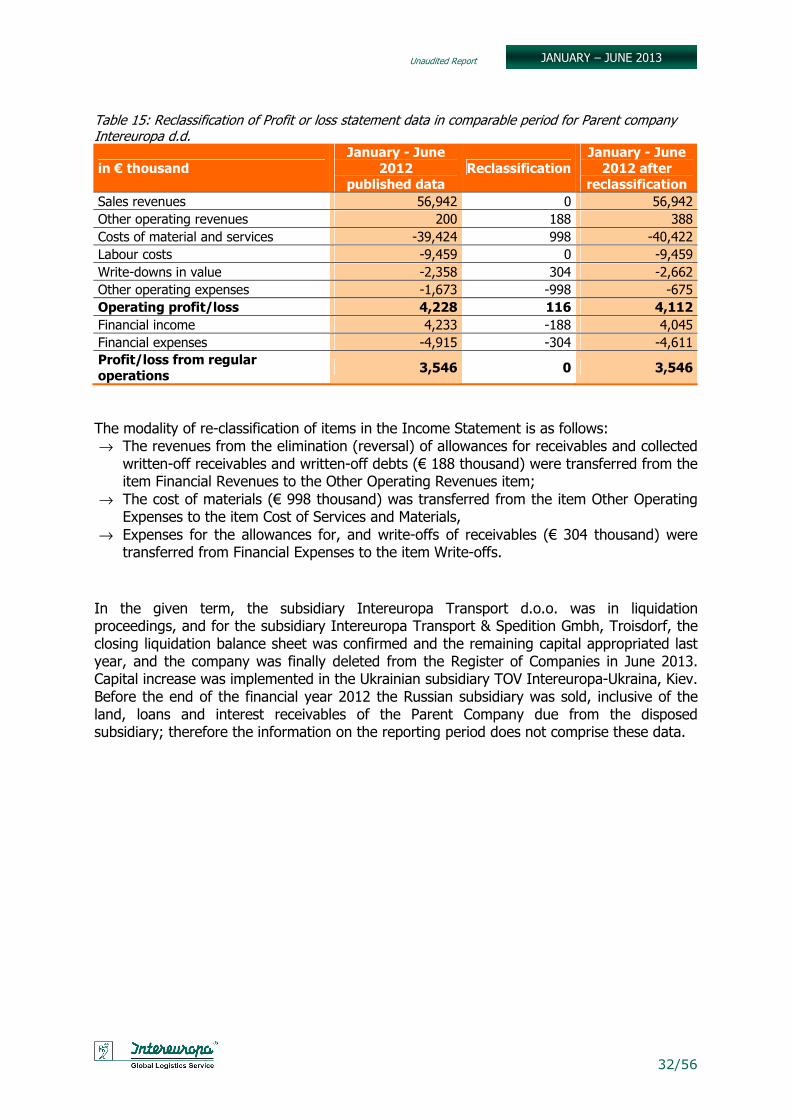
Table 15: Reclassification of Profit or loss statement data in comparable period for Parent company Intereuropa d.d.
in € thousand January - June
2012 published data
Reclassification January - June 2012 after
reclassification
Sales revenues 56,942 0 56,942 Other operating revenues 200 188 388 Costs of material and services -39,424 998 -40,422 Labour costs -9,459 0 -9,459 Write-downs in value -2,358 304 -2,662 Other operating expenses -1,673 -998 -675 Operating profit/loss 4,228 116 4,112
Financial income 4,233 -188 4,045 Financial expenses -4,915 -304 -4,611 Profit/loss from regular operations
3,546 0 3,546
The modality of re-classification of items in the Income Statement is as follows: → The revenues from the elimination (reversal) of allowances for receivables and collected
written-off receivables and written-off debts (€ 188 thousand) were transferred from the item Financial Revenues to the Other Operating Revenues item;
→ The cost of materials (€ 998 thousand) was transferred from the item Other Operating Expenses to the item Cost of Services and Materials,
→ Expenses for the allowances for, and write-offs of receivables (€ 304 thousand) were transferred from Financial Expenses to the item Write-offs.
In the given term, the subsidiary Intereuropa Transport d.o.o. was in liquidation proceedings, and for the subsidiary Intereuropa Transport & Spedition Gmbh, Troisdorf, the closing liquidation balance sheet was confirmed and the remaining capital appropriated last year, and the company was finally deleted from the Register of Companies in June 2013. Capital increase was implemented in the Ukrainian subsidiary TOV Intereuropa-Ukraina, Kiev. Before the end of the financial year 2012 the Russian subsidiary was sold, inclusive of the land, loans and interest receivables of the Parent Company due from the disposed subsidiary; therefore the information on the reporting period does not comprise these data.
Unaudited Report
33/56
JANUARY – JUNE 2013
STATEMENT OF THE MEMBERS OF THE MANAGEMENT The Management Board hereby confirms that according to its best knowledge and conscience, the financial report of the company Intereuropa, Global Logistics Service Ltd. Co., and of the Intereuropa Group has been compiled in accordance with the applicable financial reporting framework and is a true and fair view of the assets and liabilities, the financial position and the profit or loss statement of the company Intereuropa, Global Logistics Service Ltd., and of other companies included in the consolidation. The business report includes a fair view of the information on the material transactions with related parties and has been drawn up in accordance with the relevant accounting standard. INTEREUROPA d.d. The Management Board
Unaudited Report
34/56
JANUARY – JUNE 2013
1. FINANCIAL REPORT FOR INTEREUROPA GROUP
1.1. Underlying financial statements of the Intereuropa Group
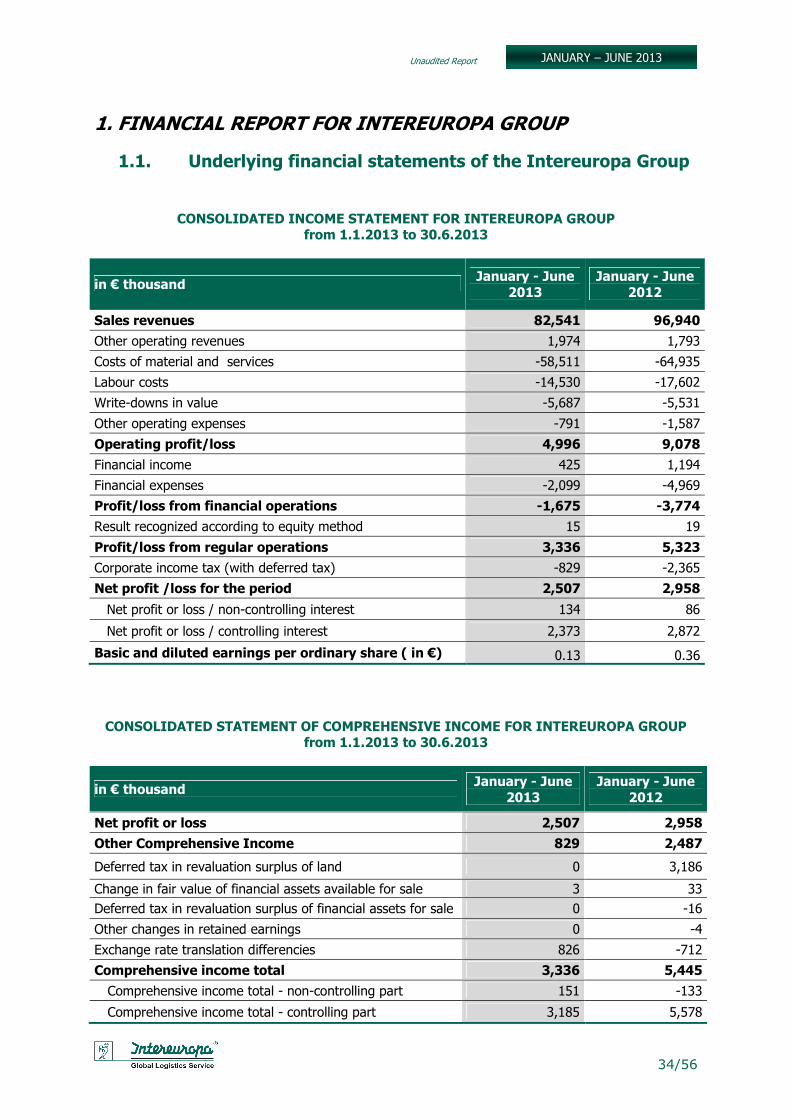
CONSOLIDATED INCOME STATEMENT FOR INTEREUROPA GROUP from 1.1.2013 to 30.6.2013
in € thousand January - June
2013 January - June
2012
Sales revenues 82,541 96,940
Other operating revenues 1,974 1,793
Costs of material and services -58,511 -64,935
Labour costs -14,530 -17,602
Write-downs in value -5,687 -5,531
Other operating expenses -791 -1,587
Operating profit/loss 4,996 9,078
Financial income 425 1,194
Financial expenses -2,099 -4,969
Profit/loss from financial operations -1,675 -3,774
Result recognized according to equity method 15 19
Profit/loss from regular operations 3,336 5,323
Corporate income tax (with deferred tax) -829 -2,365
Net profit /loss for the period 2,507 2,958
Net profit or loss / non-controlling interest 134 86
Net profit or loss / controlling interest 2,373 2,872
Basic and diluted earnings per ordinary share ( in €) 0.13 0.36 CONSOLIDATED STATEMENT OF COMPREHENSIVE INCOME FOR INTEREUROPA GROUP
from 1.1.2013 to 30.6.2013
in € thousand January - June
2013 January - June
2012
Net profit or loss 2,507 2,958
Other Comprehensive Income 829 2,487
Deferred tax in revaluation surplus of land 0 3,186
Change in fair value of financial assets available for sale 3 33 Deferred tax in revaluation surplus of financial assets for sale 0 -16
Other changes in retained earnings 0 -4
Exchange rate translation differencies 826 -712
Comprehensive income total 3,336 5,445
Comprehensive income total - non-controlling part 151 -133
Comprehensive income total - controlling part 3,185 5,578

Unaudited Report
35/56
JANUARY – JUNE 2013
CONSOLIDATED STATEMENT OF FINANCIAL POSITION FOR INTEREUROPA GROUP as at 30.6.2013
in € thousand 30.6.2013 31.12.2012
ASSETS
Tangible fixed assets 233,115 234,727 Investment property 6,465 6,585 Intangible assets 7,244 7,513 Other non-current operating assets 245 317 Deferred tax assets 14,543 14,775 Long-term loans given and deposits 92 54 Investment in a jointly controlled company 150 135 Other financial investments 3,110 3,106 TOTAL NON-CURRENT ASSETS 264,964 267,212
Available-for-sale assets 0 0 Inventories 159 143 Short-term loans given, deposits and cerificates of deposits 10,785 10,779 Short-term operating receivables 37,251 35,630 Short-term income tax receivables 276 815 Cash and cash equivalents 10,579 8,390 TOTAL CURRENT ASSETS 59,050 55,757
TOTAL ASSETS 324,014 322,969
EQUITY
Equity - controlling interest 148,545 145,361
Share capital 27,489 27,489 Equity reserves 18,455 18,455 Revenue reserves 2,831 2,804 Revaluation surplus 71,179 71,176 Translation exchange differencies -5,529 -6,339 Transferred net profit/loss 31,748 38,955 Net profit/loss 2,373 -7,179 Equity - non-controlling interest 9,378 9,532
LIABILITIES
Provisions and long-term deferred revenue 5,705 7,034 Long-term borrowings and financial leases 107,777 111,663 Other long-term financial liabilities 0 0 Long-term operating liabilities 432 434 Deferred tax liabilities 13,260 13,216 TOTAL NON-CURRENT LIABILITIES 127,174 132,347
Short-term borrowings and financial leases 8,210 5,975 Other short-term financial liabilities 1,370 1,706 Short-term operating liabilities 29,032 27,904 Short-term income tax liabilities 304 144 TOTAL CURRENT LIABILITIES 38,916 35,729
TOTAL LIABILITIES 166,090 168,076
TOTAL CAPITAL AND LIABILITIES 324,014 322,969
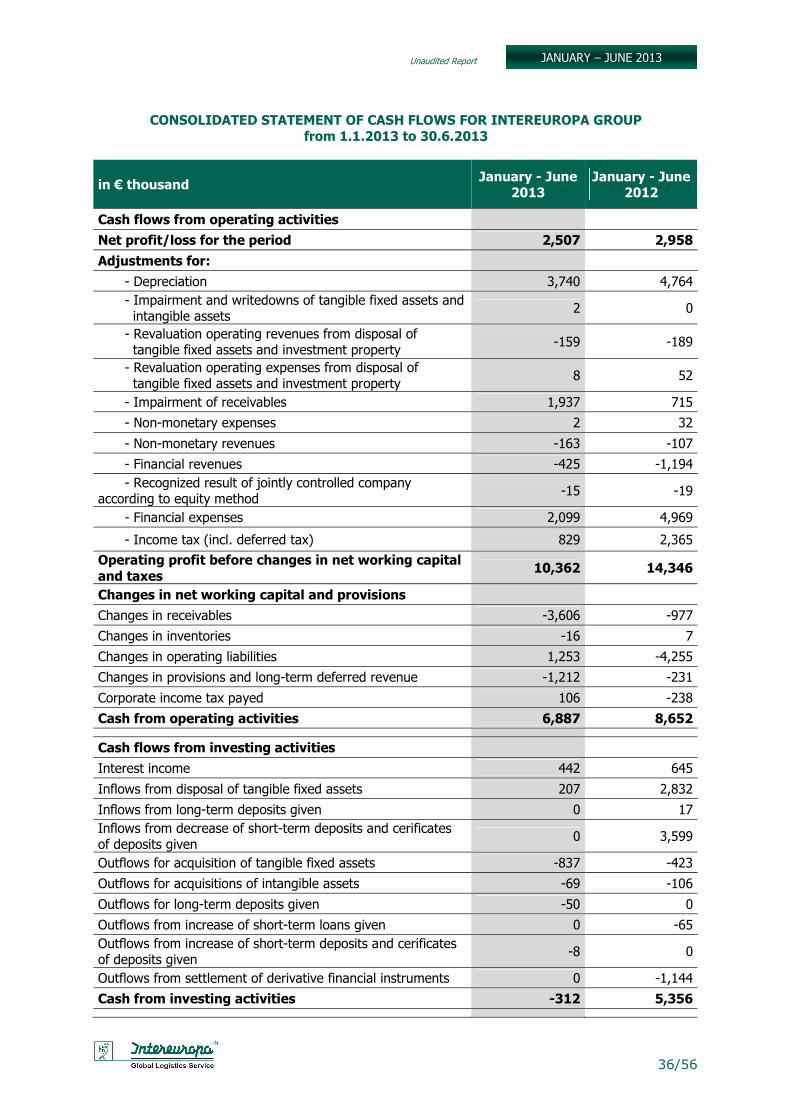
Unaudited Report
36/56
JANUARY – JUNE 2013
CONSOLIDATED STATEMENT OF CASH FLOWS FOR INTEREUROPA GROUP from 1.1.2013 to 30.6.2013
in € thousand January - June
2013 January - June
2012
Cash flows from operating activities
Net profit/loss for the period 2,507 2,958
Adjustments for:
- Depreciation 3,740 4,764 - Impairment and writedowns of tangible fixed assets and intangible assets 2 0
- Revaluation operating revenues from disposal of tangible fixed assets and investment property -159 -189
- Revaluation operating expenses from disposal of tangible fixed assets and investment property 8 52
- Impairment of receivables 1,937 715
- Non-monetary expenses 2 32
- Non-monetary revenues -163 -107
- Financial revenues -425 -1,194 - Recognized result of jointly controlled company
according to equity method -15 -19
- Financial expenses 2,099 4,969
- Income tax (incl. deferred tax) 829 2,365
Operating profit before changes in net working capital and taxes
10,362 14,346
Changes in net working capital and provisions
Changes in receivables -3,606 -977
Changes in inventories -16 7
Changes in operating liabilities 1,253 -4,255
Changes in provisions and long-term deferred revenue -1,212 -231
Corporate income tax payed 106 -238
Cash from operating activities 6,887 8,652
Cash flows from investing activities
Interest income 442 645
Inflows from disposal of tangible fixed assets 207 2,832
Inflows from long-term deposits given 0 17 Inflows from decrease of short-term deposits and cerificates of deposits given 0 3,599
Outflows for acquisition of tangible fixed assets -837 -423
Outflows for acquisitions of intangible assets -69 -106
Outflows for long-term deposits given -50 0
Outflows from increase of short-term loans given 0 -65 Outflows from increase of short-term deposits and cerificates of deposits given -8 0
Outflows from settlement of derivative financial instruments 0 -1,144
Cash from investing activities -312 5,356
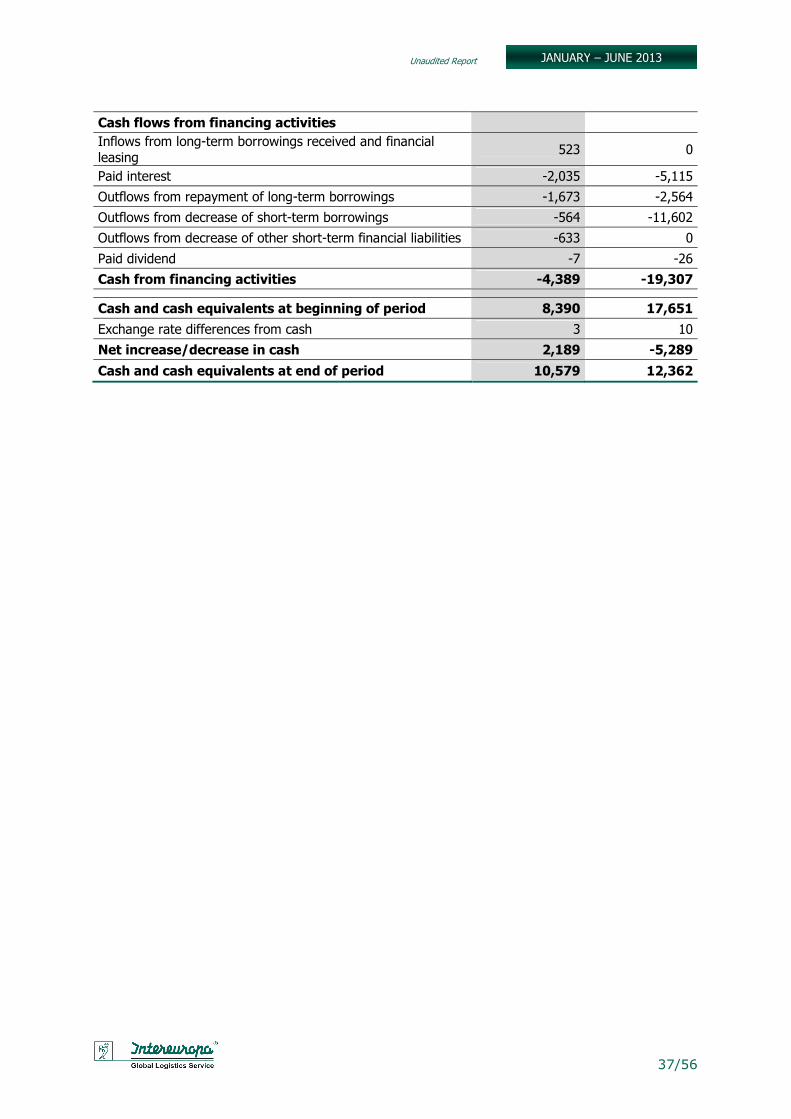
Unaudited Report
37/56
JANUARY – JUNE 2013
Cash flows from financing activities
Inflows from long-term borrowings received and financial leasing 523 0
Paid interest -2,035 -5,115
Outflows from repayment of long-term borrowings -1,673 -2,564
Outflows from decrease of short-term borrowings -564 -11,602
Outflows from decrease of other short-term financial liabilities -633 0
Paid dividend -7 -26
Cash from financing activities -4,389 -19,307
Cash and cash equivalents at beginning of period 8,390 17,651
Exchange rate differences from cash 3 10
Net increase/decrease in cash 2,189 -5,289
Cash and cash equivalents at end of period 10,579 12,362
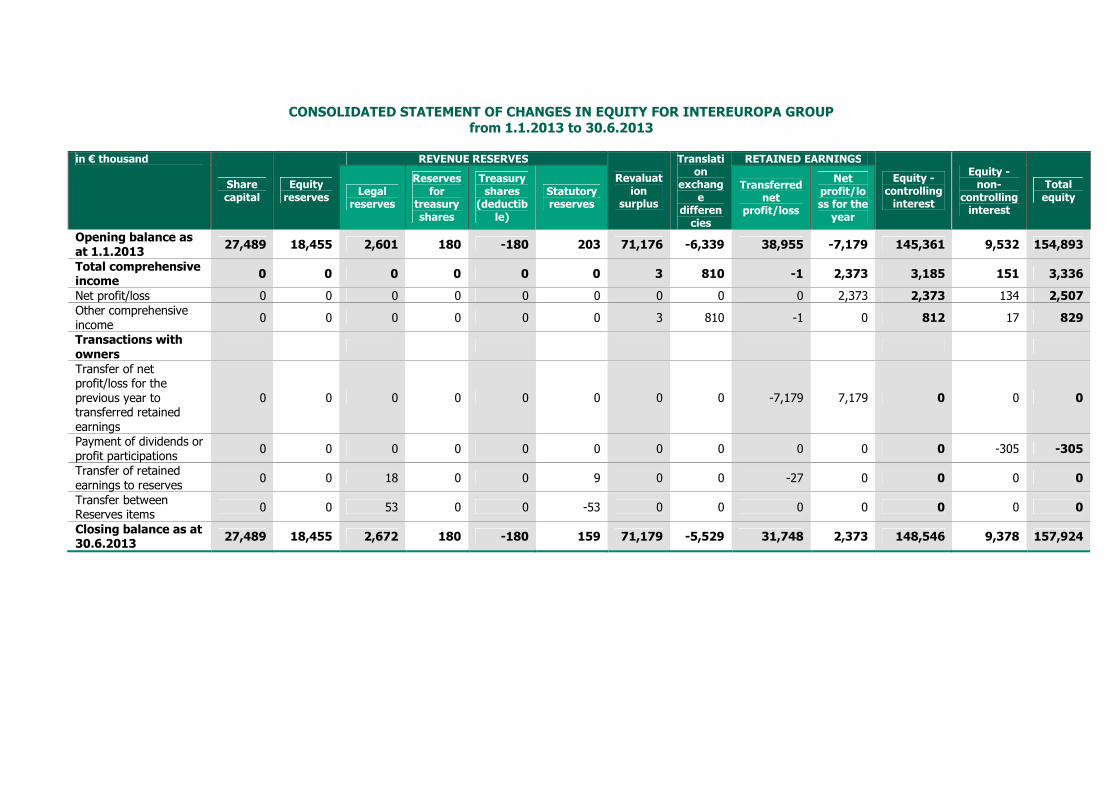
CONSOLIDATED STATEMENT OF CHANGES IN EQUITY FOR INTEREUROPA GROUP from 1.1.2013 to 30.6.2013
in € thousand
Share capital
Equity reserves
REVENUE RESERVES
Revaluation
surplus
Translation
exchange
differencies
RETAINED EARNINGS
Equity - controlling interest
Equity - non-
controlling interest
Total equity
Legal reserves
Reserves for
treasury shares
Treasury shares
(deductible)
Statutory reserves
Transferred net
profit/loss
Net profit/loss for the
year
Opening balance as at 1.1.2013
27,489 18,455 2,601 180 -180 203 71,176 -6,339 38,955 -7,179 145,361 9,532 154,893
Total comprehensive income
0 0 0 0 0 0 3 810 -1 2,373 3,185 151 3,336
Net profit/loss 0 0 0 0 0 0 0 0 0 2,373 2,373 134 2,507 Other comprehensive income 0 0 0 0 0 0 3 810 -1 0 812 17 829
Transactions with owners
Transfer of net profit/loss for the previous year to transferred retained earnings
0 0 0 0 0 0 0 0 -7,179 7,179 0 0 0
Payment of dividends or profit participations 0 0 0 0 0 0 0 0 0 0 0 -305 -305
Transfer of retained earnings to reserves 0 0 18 0 0 9 0 0 -27 0 0 0 0
Transfer between Reserves items 0 0 53 0 0 -53 0 0 0 0 0 0 0
Closing balance as at 30.6.2013
27,489 18,455 2,672 180 -180 159 71,179 -5,529 31,748 2,373 148,546 9,378 157,924
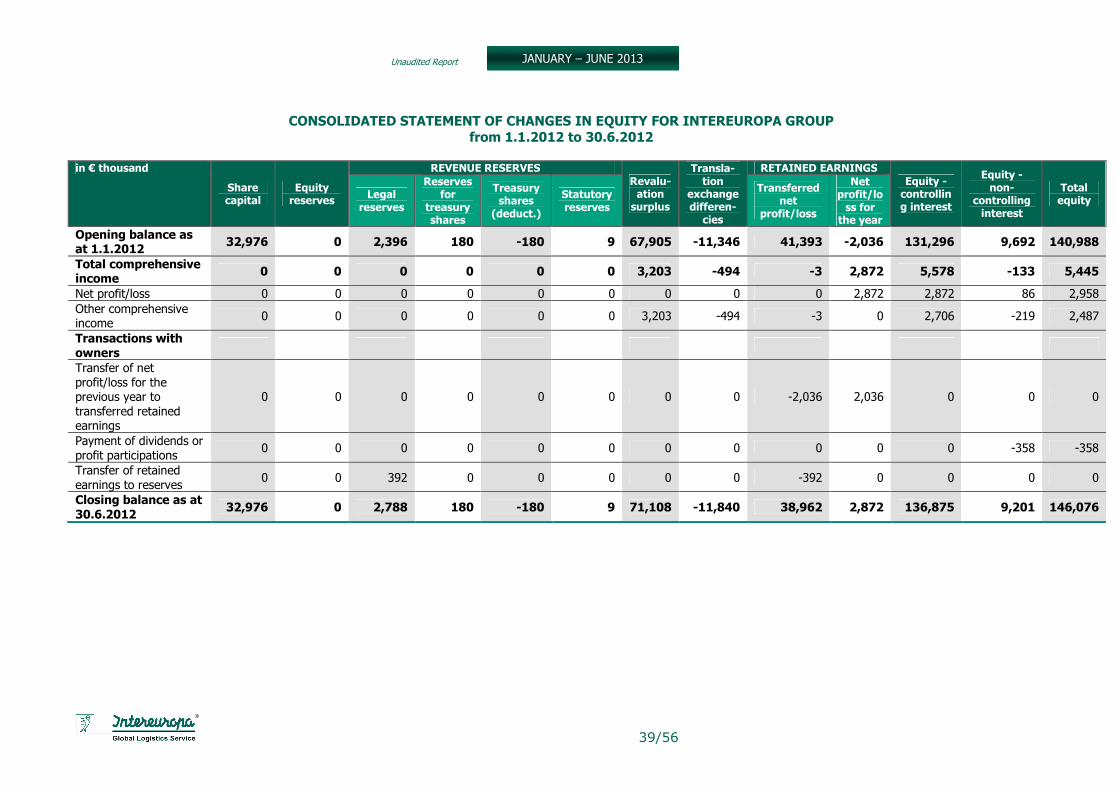
Unaudited Report
39/56
JANUARY – JUNE 2013
CONSOLIDATED STATEMENT OF CHANGES IN EQUITY FOR INTEREUROPA GROUP from 1.1.2012 to 30.6.2012
in € thousand
Share capital
Equity reserves
REVENUE RESERVES Revalu-ation surplus
Transla-tion
exchange differen-
cies
RETAINED EARNINGS Equity - controlling interest
Equity - non-
controlling interest
Total equity
Legal reserves
Reserves for
treasury shares
Treasury shares
(deduct.)
Statutory reserves
Transferred net
profit/loss
Net profit/loss for
the year
Opening balance as at 1.1.2012
32,976 0 2,396 180 -180 9 67,905 -11,346 41,393 -2,036 131,296 9,692 140,988
Total comprehensive income
0 0 0 0 0 0 3,203 -494 -3 2,872 5,578 -133 5,445
Net profit/loss 0 0 0 0 0 0 0 0 0 2,872 2,872 86 2,958 Other comprehensive income 0 0 0 0 0 0 3,203 -494 -3 0 2,706 -219 2,487
Transactions with owners
Transfer of net profit/loss for the previous year to transferred retained earnings
0 0 0 0 0 0 0 0 -2,036 2,036 0 0 0
Payment of dividends or profit participations
0 0 0 0 0 0 0 0 0 0 0 -358 -358
Transfer of retained earnings to reserves 0 0 392 0 0 0 0 0 -392 0 0 0 0
Closing balance as at 30.6.2012
32,976 0 2,788 180 -180 9 71,108 -11,840 38,962 2,872 136,875 9,201 146,076
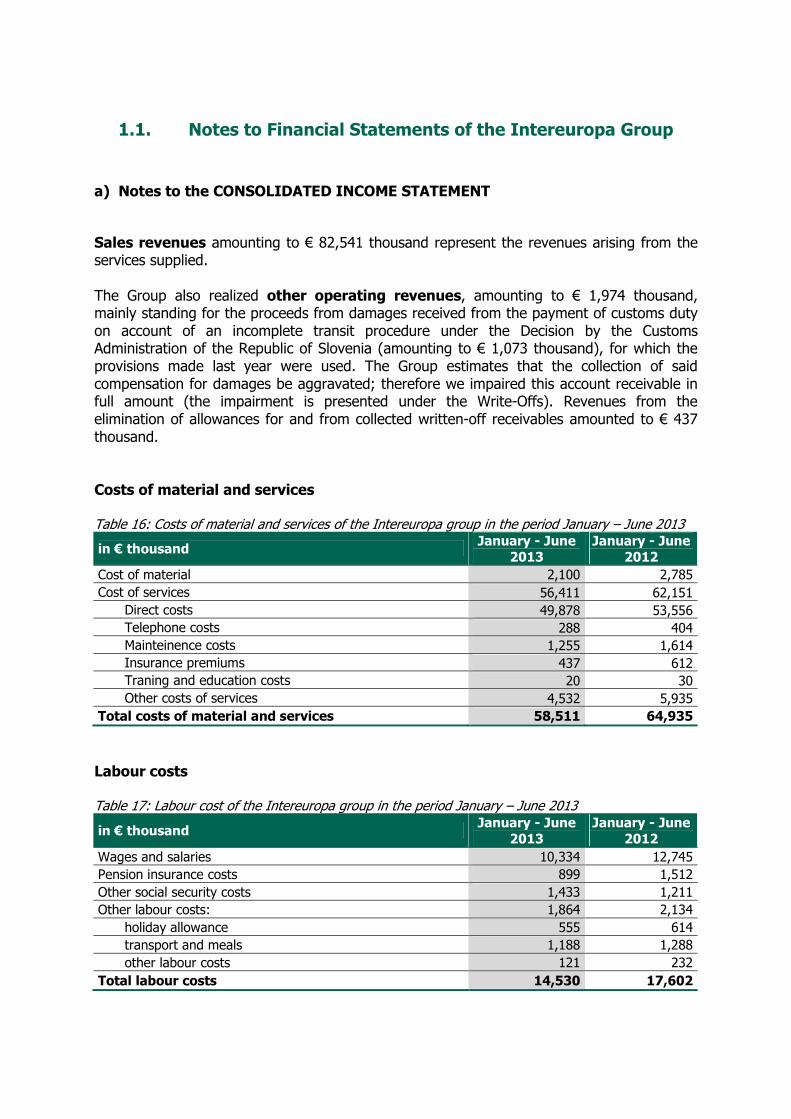
1.1. Notes to Financial Statements of the Intereuropa Group
a) Notes to the CONSOLIDATED INCOME STATEMENT Sales revenues amounting to € 82,541 thousand represent the revenues arising from the services supplied. The Group also realized other operating revenues, amounting to € 1,974 thousand, mainly standing for the proceeds from damages received from the payment of customs duty on account of an incomplete transit procedure under the Decision by the Customs Administration of the Republic of Slovenia (amounting to € 1,073 thousand), for which the provisions made last year were used. The Group estimates that the collection of said compensation for damages be aggravated; therefore we impaired this account receivable in full amount (the impairment is presented under the Write-Offs). Revenues from the elimination of allowances for and from collected written-off receivables amounted to € 437 thousand. Costs of material and services Table 16: Costs of material and services of the Intereuropa group in the period January – June 2013
in € thousand January - June
2013 January - June
2012
Cost of material 2,100 2,785 Cost of services 56,411 62,151
Direct costs 49,878 53,556 Telephone costs 288 404 Mainteinence costs 1,255 1,614 Insurance premiums 437 612 Traning and education costs 20 30 Other costs of services 4,532 5,935
Total costs of material and services 58,511 64,935
Labour costs Table 17: Labour cost of the Intereuropa group in the period January – June 2013
in € thousand January - June
2013 January - June
2012
Wages and salaries 10,334 12,745 Pension insurance costs 899 1,512 Other social security costs 1,433 1,211 Other labour costs: 1,864 2,134
holiday allowance 555 614 transport and meals 1,188 1,288 other labour costs 121 232
Total labour costs 14,530 17,602
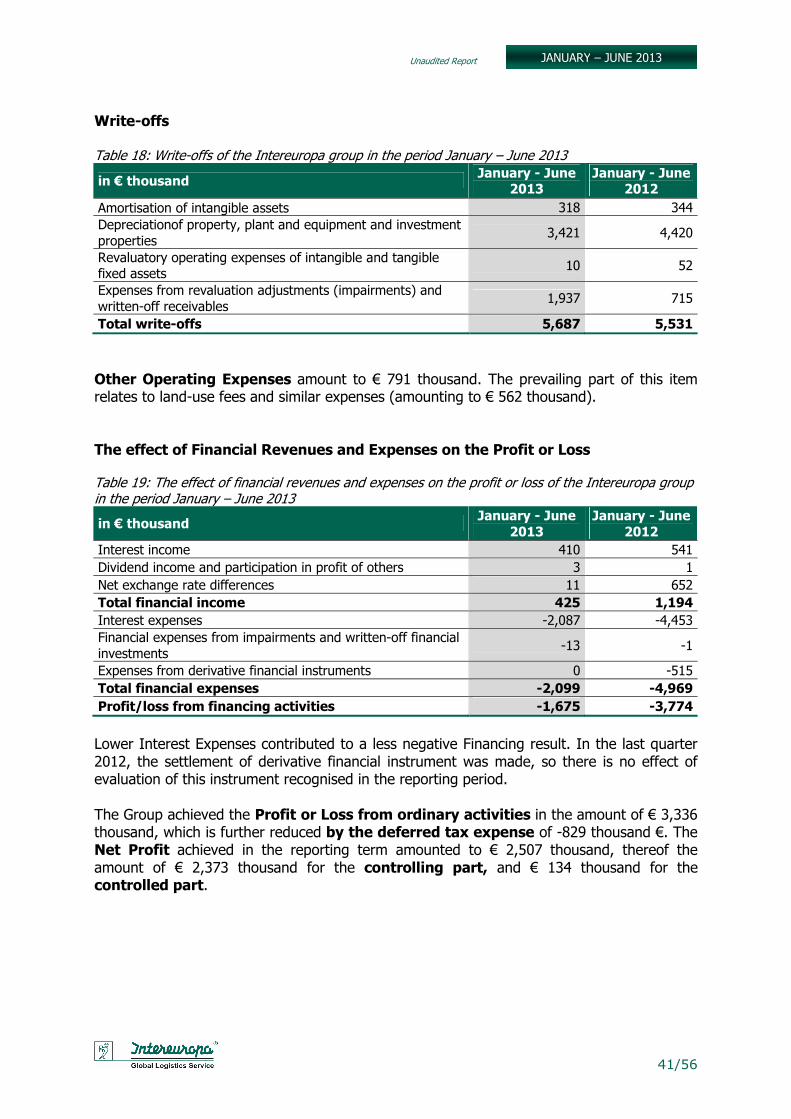
Unaudited Report
41/56
JANUARY – JUNE 2013
Write-offs Table 18: Write-offs of the Intereuropa group in the period January – June 2013
in € thousand January - June
2013 January - June
2012
Amortisation of intangible assets 318 344 Depreciationof property, plant and equipment and investment properties 3,421 4,420
Revaluatory operating expenses of intangible and tangible fixed assets 10 52
Expenses from revaluation adjustments (impairments) and written-off receivables
1,937 715
Total write-offs 5,687 5,531
Other Operating Expenses amount to € 791 thousand. The prevailing part of this item relates to land-use fees and similar expenses (amounting to € 562 thousand). The effect of Financial Revenues and Expenses on the Profit or Loss Table 19: The effect of financial revenues and expenses on the profit or loss of the Intereuropa group in the period January – June 2013
in € thousand January - June
2013 January - June
2012
Interest income 410 541 Dividend income and participation in profit of others 3 1 Net exchange rate differences 11 652 Total financial income 425 1,194
Interest expenses -2,087 -4,453 Financial expenses from impairments and written-off financial investments -13 -1
Expenses from derivative financial instruments 0 -515 Total financial expenses -2,099 -4,969
Profit/loss from financing activities -1,675 -3,774
Lower Interest Expenses contributed to a less negative Financing result. In the last quarter 2012, the settlement of derivative financial instrument was made, so there is no effect of evaluation of this instrument recognised in the reporting period. The Group achieved the Profit or Loss from ordinary activities in the amount of € 3,336 thousand, which is further reduced by the deferred tax expense of -829 thousand €. The Net Profit achieved in the reporting term amounted to € 2,507 thousand, thereof the amount of € 2,373 thousand for the controlling part, and € 134 thousand for the controlled part.
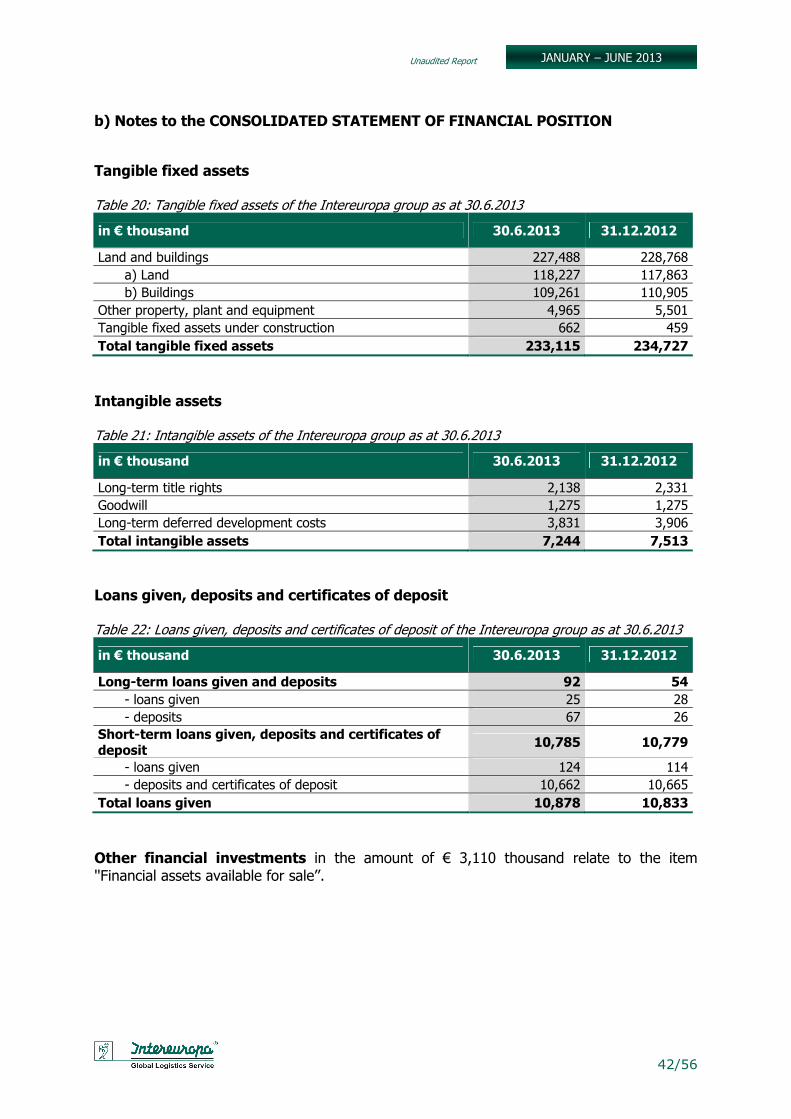
Unaudited Report
42/56
JANUARY – JUNE 2013
b) Notes to the CONSOLIDATED STATEMENT OF FINANCIAL POSITION Tangible fixed assets Table 20: Tangible fixed assets of the Intereuropa group as at 30.6.2013
in € thousand 30.6.2013 31.12.2012
Land and buildings 227,488 228,768 a) Land 118,227 117,863 b) Buildings 109,261 110,905
Other property, plant and equipment 4,965 5,501 Tangible fixed assets under construction 662 459 Total tangible fixed assets 233,115 234,727
Intangible assets Table 21: Intangible assets of the Intereuropa group as at 30.6.2013
in € thousand 30.6.2013 31.12.2012
Long-term title rights 2,138 2,331 Goodwill 1,275 1,275 Long-term deferred development costs 3,831 3,906 Total intangible assets 7,244 7,513
Loans given, deposits and certificates of deposit Table 22: Loans given, deposits and certificates of deposit of the Intereuropa group as at 30.6.2013
in € thousand 30.6.2013 31.12.2012
Long-term loans given and deposits 92 54
- loans given 25 28 - deposits 67 26
Short-term loans given, deposits and certificates of deposit
10,785 10,779
- loans given 124 114 - deposits and certificates of deposit 10,662 10,665
Total loans given 10,878 10,833
Other financial investments in the amount of € 3,110 thousand relate to the item ''Financial assets available for sale’’.
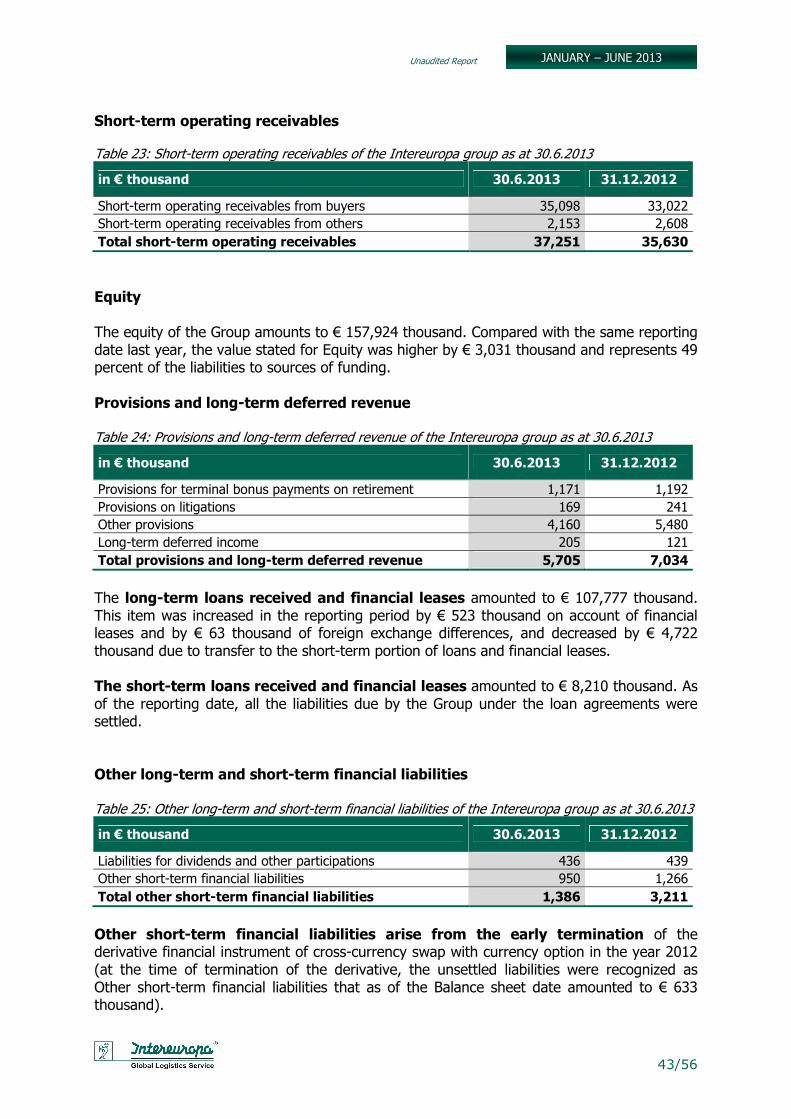
Unaudited Report
43/56
JANUARY – JUNE 2013
Short-term operating receivables Table 23: Short-term operating receivables of the Intereuropa group as at 30.6.2013
in € thousand 30.6.2013 31.12.2012
Short-term operating receivables from buyers 35,098 33,022 Short-term operating receivables from others 2,153 2,608 Total short-term operating receivables 37,251 35,630
Equity The equity of the Group amounts to € 157,924 thousand. Compared with the same reporting date last year, the value stated for Equity was higher by € 3,031 thousand and represents 49 percent of the liabilities to sources of funding. Provisions and long-term deferred revenue Table 24: Provisions and long-term deferred revenue of the Intereuropa group as at 30.6.2013
in € thousand 30.6.2013 31.12.2012
Provisions for terminal bonus payments on retirement 1,171 1,192 Provisions on litigations 169 241 Other provisions 4,160 5,480 Long-term deferred income 205 121 Total provisions and long-term deferred revenue 5,705 7,034
The long-term loans received and financial leases amounted to € 107,777 thousand. This item was increased in the reporting period by € 523 thousand on account of financial leases and by € 63 thousand of foreign exchange differences, and decreased by € 4,722 thousand due to transfer to the short-term portion of loans and financial leases. The short-term loans received and financial leases amounted to € 8,210 thousand. As of the reporting date, all the liabilities due by the Group under the loan agreements were settled. Other long-term and short-term financial liabilities Table 25: Other long-term and short-term financial liabilities of the Intereuropa group as at 30.6.2013
in € thousand 30.6.2013 31.12.2012
Liabilities for dividends and other participations 436 439 Other short-term financial liabilities 950 1,266 Total other short-term financial liabilities 1,386 3,211
Other short-term financial liabilities arise from the early termination of the derivative financial instrument of cross-currency swap with currency option in the year 2012 (at the time of termination of the derivative, the unsettled liabilities were recognized as Other short-term financial liabilities that as of the Balance sheet date amounted to € 633 thousand).
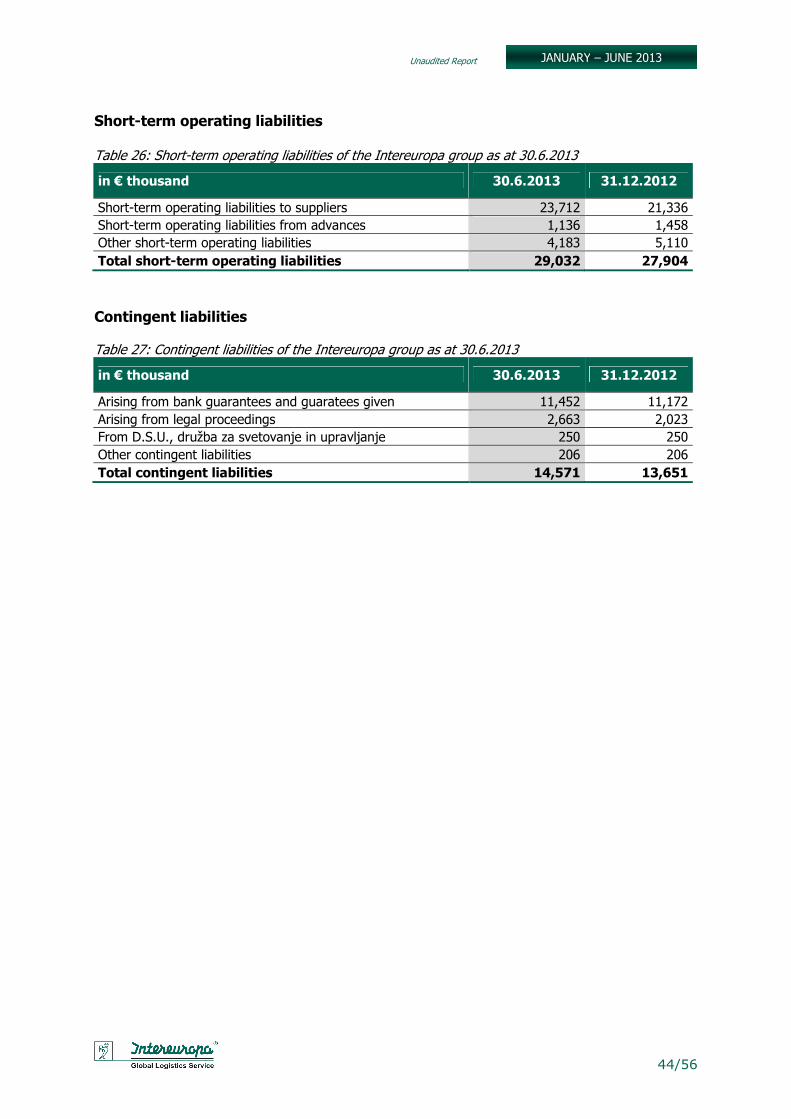
Unaudited Report
44/56
JANUARY – JUNE 2013
Short-term operating liabilities Table 26: Short-term operating liabilities of the Intereuropa group as at 30.6.2013
in € thousand 30.6.2013 31.12.2012
Short-term operating liabilities to suppliers 23,712 21,336 Short-term operating liabilities from advances 1,136 1,458 Other short-term operating liabilities 4,183 5,110 Total short-term operating liabilities 29,032 27,904
Contingent liabilities Table 27: Contingent liabilities of the Intereuropa group as at 30.6.2013
in € thousand 30.6.2013 31.12.2012
Arising from bank guarantees and guaratees given 11,452 11,172 Arising from legal proceedings 2,663 2,023 From D.S.U., družba za svetovanje in upravljanje 250 250 Other contingent liabilities 206 206 Total contingent liabilities 14,571 13,651
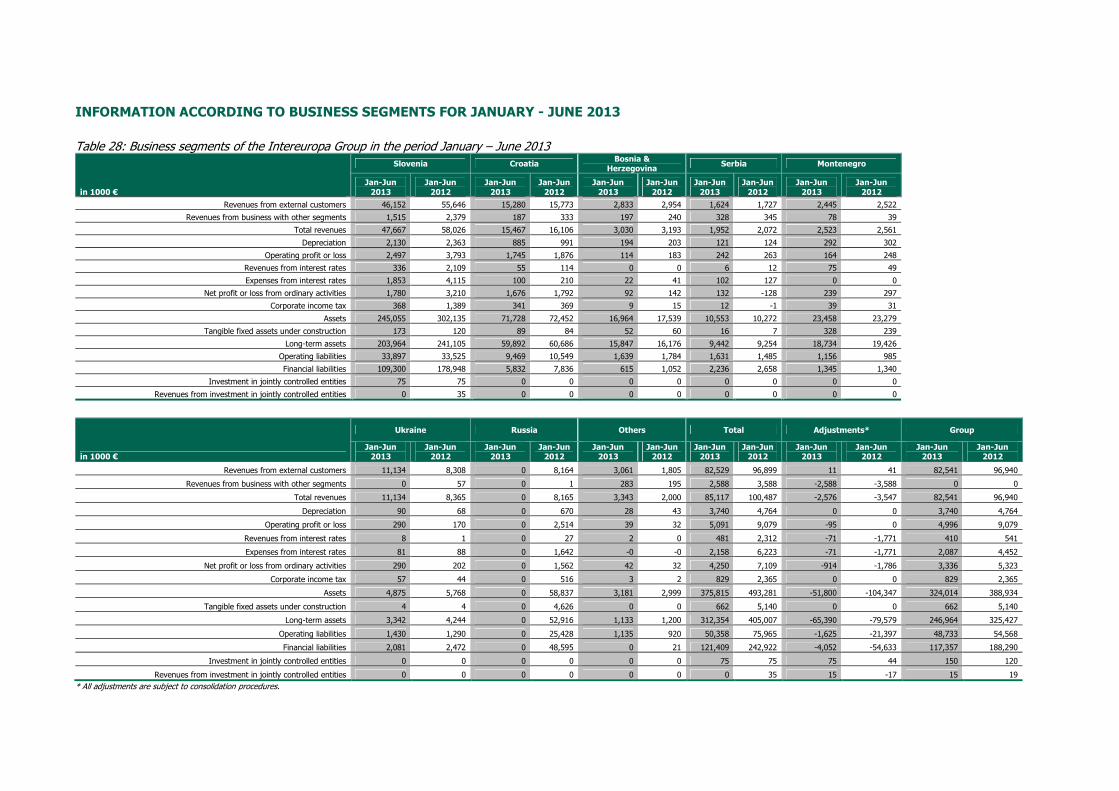
INFORMATION ACCORDING TO BUSINESS SEGMENTS FOR JANUARY - JUNE 2013
Table 28: Business segments of the Intereuropa Group in the period January – June 2013
in 1000 €
Slovenia Croatia Bosnia &
Herzegovina Serbia Montenegro
Jan-Jun 2013
Jan-Jun 2012
Jan-Jun 2013
Jan-Jun 2012
Jan-Jun 2013
Jan-Jun 2012
Jan-Jun 2013
Jan-Jun 2012
Jan-Jun 2013
Jan-Jun 2012
Revenues from external customers 46,152 55,646 15,280 15,773 2,833 2,954 1,624 1,727 2,445 2,522
Revenues from business with other segments 1,515 2,379 187 333 197 240 328 345 78 39
Total revenues 47,667 58,026 15,467 16,106 3,030 3,193 1,952 2,072 2,523 2,561
Depreciation 2,130 2,363 885 991 194 203 121 124 292 302
Operating profit or loss 2,497 3,793 1,745 1,876 114 183 242 263 164 248
Revenues from interest rates 336 2,109 55 114 0 0 6 12 75 49
Expenses from interest rates 1,853 4,115 100 210 22 41 102 127 0 0
Net profit or loss from ordinary activities 1,780 3,210 1,676 1,792 92 142 132 -128 239 297
Corporate income tax 368 1,389 341 369 9 15 12 -1 39 31
Assets 245,055 302,135 71,728 72,452 16,964 17,539 10,553 10,272 23,458 23,279
Tangible fixed assets under construction 173 120 89 84 52 60 16 7 328 239
Long-term assets 203,964 241,105 59,892 60,686 15,847 16,176 9,442 9,254 18,734 19,426
Operating liabilities 33,897 33,525 9,469 10,549 1,639 1,784 1,631 1,485 1,156 985
Financial liabilities 109,300 178,948 5,832 7,836 615 1,052 2,236 2,658 1,345 1,340
Investment in jointly controlled entities 75 75 0 0 0 0 0 0 0 0
Revenues from investment in jointly controlled entities 0 35 0 0 0 0 0 0 0 0
in 1000 €
Ukraine Russia Others Total Adjustments* Group
Jan-Jun 2013
Jan-Jun 2012
Jan-Jun 2013
Jan-Jun 2012
Jan-Jun 2013
Jan-Jun 2012
Jan-Jun 2013
Jan-Jun 2012
Jan-Jun 2013
Jan-Jun 2012
Jan-Jun 2013
Jan-Jun 2012
Revenues from external customers 11,134 8,308 0 8,164 3,061 1,805 82,529 96,899 11 41 82,541 96,940
Revenues from business with other segments 0 57 0 1 283 195 2,588 3,588 -2,588 -3,588 0 0
Total revenues 11,134 8,365 0 8,165 3,343 2,000 85,117 100,487 -2,576 -3,547 82,541 96,940
Depreciation 90 68 0 670 28 43 3,740 4,764 0 0 3,740 4,764
Operating profit or loss 290 170 0 2,514 39 32 5,091 9,079 -95 0 4,996 9,079
Revenues from interest rates 8 1 0 27 2 0 481 2,312 -71 -1,771 410 541
Expenses from interest rates 81 88 0 1,642 -0 -0 2,158 6,223 -71 -1,771 2,087 4,452
Net profit or loss from ordinary activities 290 202 0 1,562 42 32 4,250 7,109 -914 -1,786 3,336 5,323
Corporate income tax 57 44 0 516 3 2 829 2,365 0 0 829 2,365
Assets 4,875 5,768 0 58,837 3,181 2,999 375,815 493,281 -51,800 -104,347 324,014 388,934
Tangible fixed assets under construction 4 4 0 4,626 0 0 662 5,140 0 0 662 5,140
Long-term assets 3,342 4,244 0 52,916 1,133 1,200 312,354 405,007 -65,390 -79,579 246,964 325,427
Operating liabilities 1,430 1,290 0 25,428 1,135 920 50,358 75,965 -1,625 -21,397 48,733 54,568
Financial liabilities 2,081 2,472 0 48,595 0 21 121,409 242,922 -4,052 -54,633 117,357 188,290
Investment in jointly controlled entities 0 0 0 0 0 0 75 75 75 44 150 120
Revenues from investment in jointly controlled entities 0 0 0 0 0 0 0 35 15 -17 15 19 * All adjustments are subject to consolidation procedures.
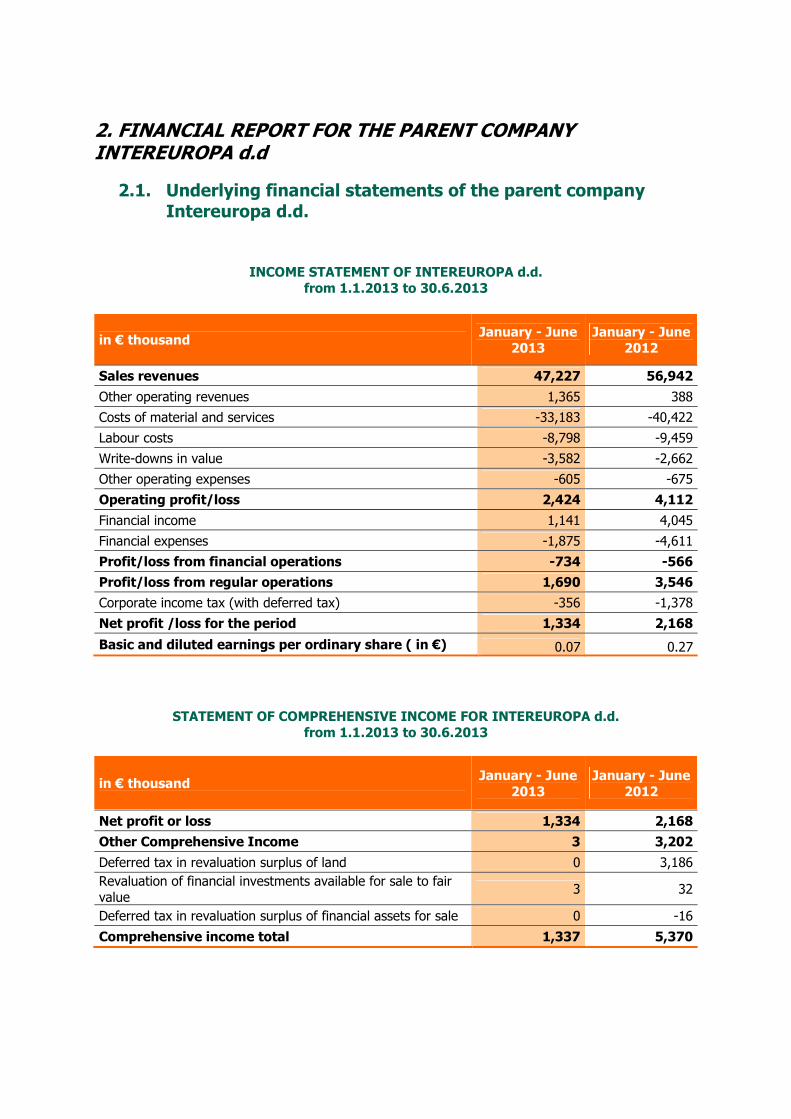
2. FINANCIAL REPORT FOR THE PARENT COMPANY INTEREUROPA d.d
2.1. Underlying financial statements of the parent company Intereuropa d.d.
INCOME STATEMENT OF INTEREUROPA d.d. from 1.1.2013 to 30.6.2013
in € thousand January - June
2013 January - June
2012
Sales revenues 47,227 56,942
Other operating revenues 1,365 388
Costs of material and services -33,183 -40,422
Labour costs -8,798 -9,459
Write-downs in value -3,582 -2,662
Other operating expenses -605 -675
Operating profit/loss 2,424 4,112
Financial income 1,141 4,045
Financial expenses -1,875 -4,611
Profit/loss from financial operations -734 -566
Profit/loss from regular operations 1,690 3,546
Corporate income tax (with deferred tax) -356 -1,378
Net profit /loss for the period 1,334 2,168
Basic and diluted earnings per ordinary share ( in €) 0.07 0.27
STATEMENT OF COMPREHENSIVE INCOME FOR INTEREUROPA d.d. from 1.1.2013 to 30.6.2013
in € thousand January - June
2013 January - June
2012
Net profit or loss 1,334 2,168
Other Comprehensive Income 3 3,202
Deferred tax in revaluation surplus of land 0 3,186 Revaluation of financial investments available for sale to fair value
3 32
Deferred tax in revaluation surplus of financial assets for sale 0 -16
Comprehensive income total 1,337 5,370
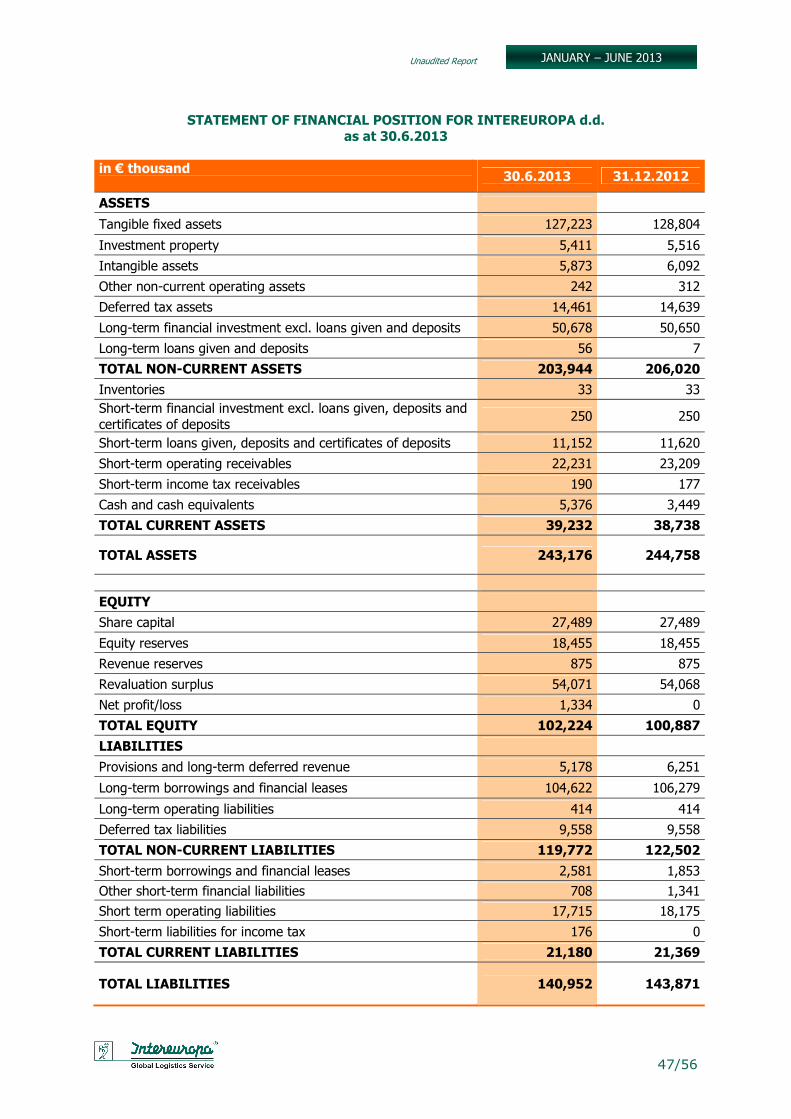
Unaudited Report
47/56
JANUARY – JUNE 2013
STATEMENT OF FINANCIAL POSITION FOR INTEREUROPA d.d. as at 30.6.2013
in € thousand
30.6.2013 31.12.2012
ASSETS
Tangible fixed assets 127,223 128,804
Investment property 5,411 5,516
Intangible assets 5,873 6,092
Other non-current operating assets 242 312
Deferred tax assets 14,461 14,639
Long-term financial investment excl. loans given and deposits 50,678 50,650
Long-term loans given and deposits 56 7
TOTAL NON-CURRENT ASSETS 203,944 206,020
Inventories 33 33 Short-term financial investment excl. loans given, deposits and certificates of deposits
250 250
Short-term loans given, deposits and certificates of deposits 11,152 11,620
Short-term operating receivables 22,231 23,209
Short-term income tax receivables 190 177
Cash and cash equivalents 5,376 3,449
TOTAL CURRENT ASSETS 39,232 38,738
TOTAL ASSETS 243,176 244,758
EQUITY
Share capital 27,489 27,489
Equity reserves 18,455 18,455
Revenue reserves 875 875
Revaluation surplus 54,071 54,068
Net profit/loss 1,334 0
TOTAL EQUITY 102,224 100,887
LIABILITIES
Provisions and long-term deferred revenue 5,178 6,251
Long-term borrowings and financial leases 104,622 106,279
Long-term operating liabilities 414 414
Deferred tax liabilities 9,558 9,558
TOTAL NON-CURRENT LIABILITIES 119,772 122,502
Short-term borrowings and financial leases 2,581 1,853
Other short-term financial liabilities 708 1,341
Short term operating liabilities 17,715 18,175
Short-term liabilities for income tax 176 0
TOTAL CURRENT LIABILITIES 21,180 21,369
TOTAL LIABILITIES 140,952 143,871
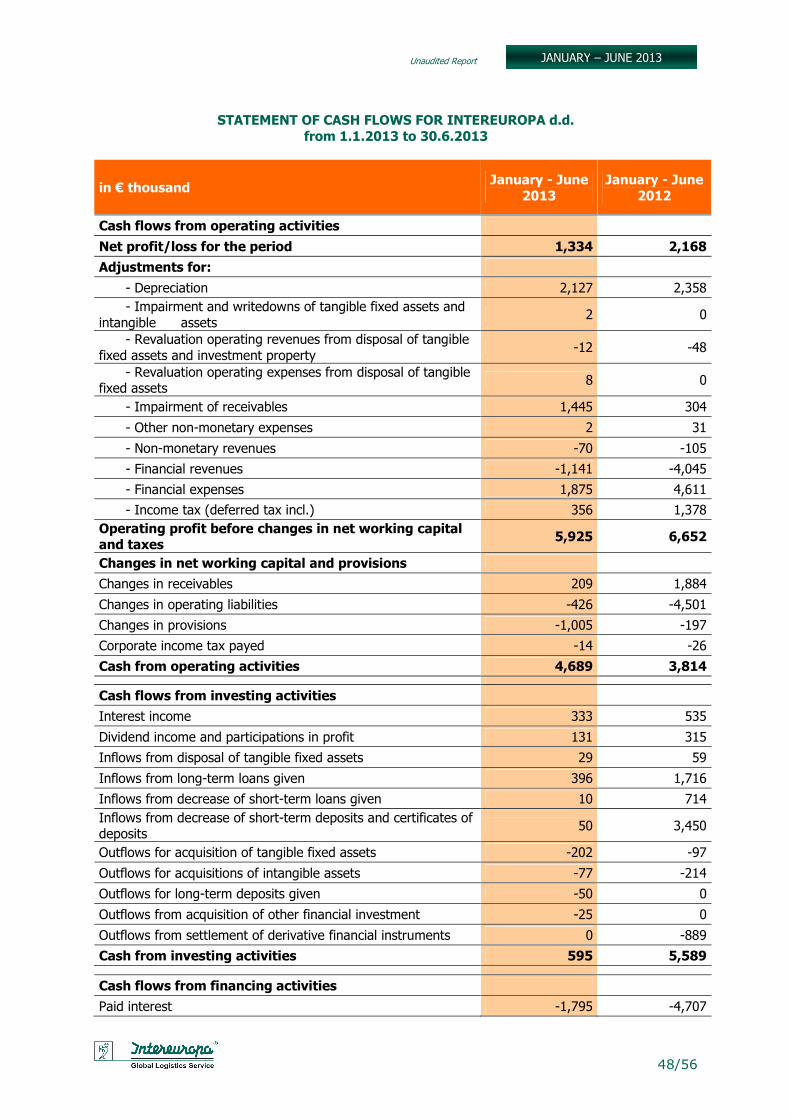
Unaudited Report
48/56
JANUARY – JUNE 2013
STATEMENT OF CASH FLOWS FOR INTEREUROPA d.d. from 1.1.2013 to 30.6.2013
in € thousand January - June
2013 January - June
2012
Cash flows from operating activities
Net profit/loss for the period 1,334 2,168
Adjustments for:
- Depreciation 2,127 2,358 - Impairment and writedowns of tangible fixed assets and
intangible assets 2 0
- Revaluation operating revenues from disposal of tangible fixed assets and investment property -12 -48
- Revaluation operating expenses from disposal of tangible fixed assets 8 0
- Impairment of receivables 1,445 304
- Other non-monetary expenses 2 31
- Non-monetary revenues -70 -105
- Financial revenues -1,141 -4,045
- Financial expenses 1,875 4,611
- Income tax (deferred tax incl.) 356 1,378 Operating profit before changes in net working capital and taxes
5,925 6,652
Changes in net working capital and provisions
Changes in receivables 209 1,884
Changes in operating liabilities -426 -4,501
Changes in provisions -1,005 -197
Corporate income tax payed -14 -26
Cash from operating activities 4,689 3,814
Cash flows from investing activities
Interest income 333 535
Dividend income and participations in profit 131 315
Inflows from disposal of tangible fixed assets 29 59
Inflows from long-term loans given 396 1,716
Inflows from decrease of short-term loans given 10 714 Inflows from decrease of short-term deposits and certificates of deposits 50 3,450
Outflows for acquisition of tangible fixed assets -202 -97
Outflows for acquisitions of intangible assets -77 -214
Outflows for long-term deposits given -50 0
Outflows from acquisition of other financial investment -25 0
Outflows from settlement of derivative financial instruments 0 -889
Cash from investing activities 595 5,589
Cash flows from financing activities
Paid interest -1,795 -4,707
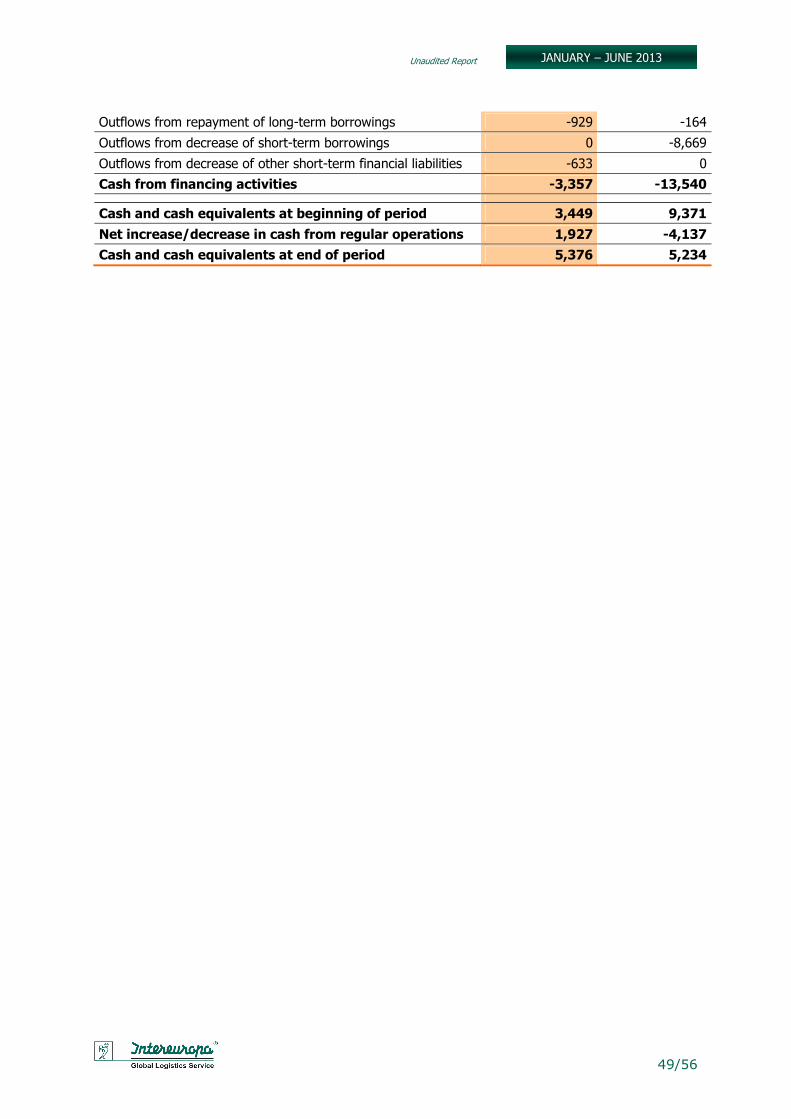
Unaudited Report
49/56
JANUARY – JUNE 2013
Outflows from repayment of long-term borrowings -929 -164
Outflows from decrease of short-term borrowings 0 -8,669
Outflows from decrease of other short-term financial liabilities -633 0
Cash from financing activities -3,357 -13,540
Cash and cash equivalents at beginning of period 3,449 9,371
Net increase/decrease in cash from regular operations 1,927 -4,137
Cash and cash equivalents at end of period 5,376 5,234
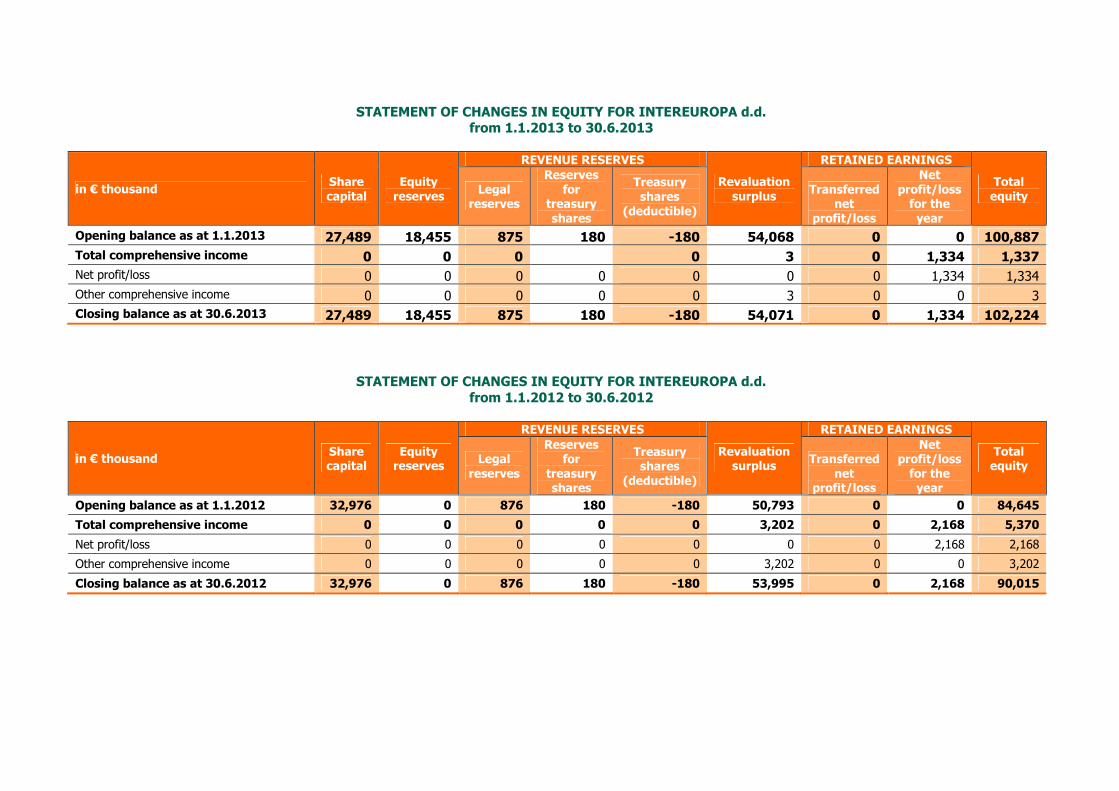
STATEMENT OF CHANGES IN EQUITY FOR INTEREUROPA d.d. from 1.1.2013 to 30.6.2013
in € thousand Share capital
Equity reserves
REVENUE RESERVES
Revaluation surplus
RETAINED EARNINGS
Total equity
Legal reserves
Reserves for
treasury shares
Treasury shares
(deductible)
Transferred net
profit/loss
Net profit/loss for the year
Opening balance as at 1.1.2013 27,489 18,455 875 180 -180 54,068 0 0 100,887
Total comprehensive income 0 0 0 0 3 0 1,334 1,337
Net profit/loss 0 0 0 0 0 0 0 1,334 1,334 Other comprehensive income 0 0 0 0 0 3 0 0 3 Closing balance as at 30.6.2013 27,489 18,455 875 180 -180 54,071 0 1,334 102,224
STATEMENT OF CHANGES IN EQUITY FOR INTEREUROPA d.d. from 1.1.2012 to 30.6.2012
in € thousand Share capital
Equity reserves
REVENUE RESERVES
Revaluation surplus
RETAINED EARNINGS
Total equity
Legal reserves
Reserves for
treasury shares
Treasury shares
(deductible)
Transferred net
profit/loss
Net profit/loss for the year
Opening balance as at 1.1.2012 32,976 0 876 180 -180 50,793 0 0 84,645
Total comprehensive income 0 0 0 0 0 3,202 0 2,168 5,370
Net profit/loss 0 0 0 0 0 0 0 2,168 2,168
Other comprehensive income 0 0 0 0 0 3,202 0 0 3,202
Closing balance as at 30.6.2012 32,976 0 876 180 -180 53,995 0 2,168 90,015
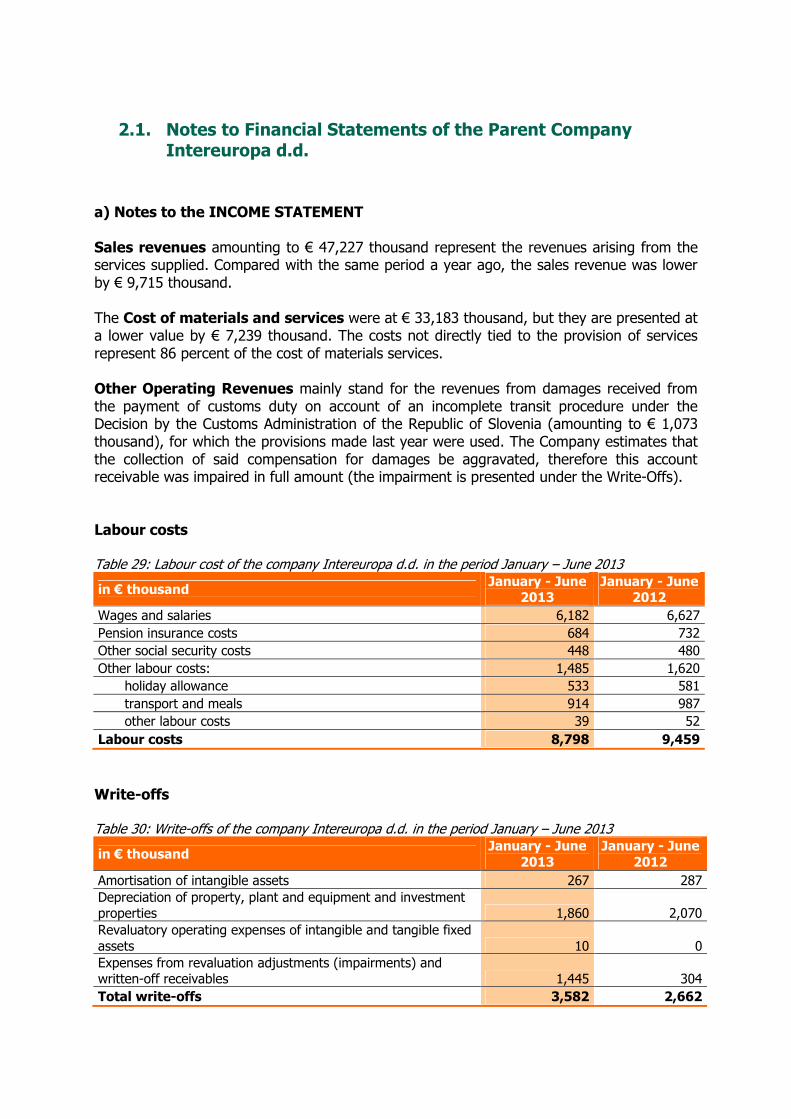
2.1. Notes to Financial Statements of the Parent Company Intereuropa d.d.
a) Notes to the INCOME STATEMENT Sales revenues amounting to € 47,227 thousand represent the revenues arising from the services supplied. Compared with the same period a year ago, the sales revenue was lower by € 9,715 thousand. The Cost of materials and services were at € 33,183 thousand, but they are presented at a lower value by € 7,239 thousand. The costs not directly tied to the provision of services represent 86 percent of the cost of materials services. Other Operating Revenues mainly stand for the revenues from damages received from the payment of customs duty on account of an incomplete transit procedure under the Decision by the Customs Administration of the Republic of Slovenia (amounting to € 1,073 thousand), for which the provisions made last year were used. The Company estimates that the collection of said compensation for damages be aggravated, therefore this account receivable was impaired in full amount (the impairment is presented under the Write-Offs). Labour costs Table 29: Labour cost of the company Intereuropa d.d. in the period January – June 2013
in € thousand January - June
2013 January - June
2012
Wages and salaries 6,182 6,627 Pension insurance costs 684 732 Other social security costs 448 480 Other labour costs: 1,485 1,620
holiday allowance 533 581 transport and meals 914 987 other labour costs 39 52
Labour costs 8,798 9,459
Write-offs Table 30: Write-offs of the company Intereuropa d.d. in the period January – June 2013
in € thousand January - June
2013 January - June
2012
Amortisation of intangible assets 267 287 Depreciation of property, plant and equipment and investment properties 1,860 2,070 Revaluatory operating expenses of intangible and tangible fixed assets 10 0 Expenses from revaluation adjustments (impairments) and written-off receivables 1,445 304 Total write-offs 3,582 2,662
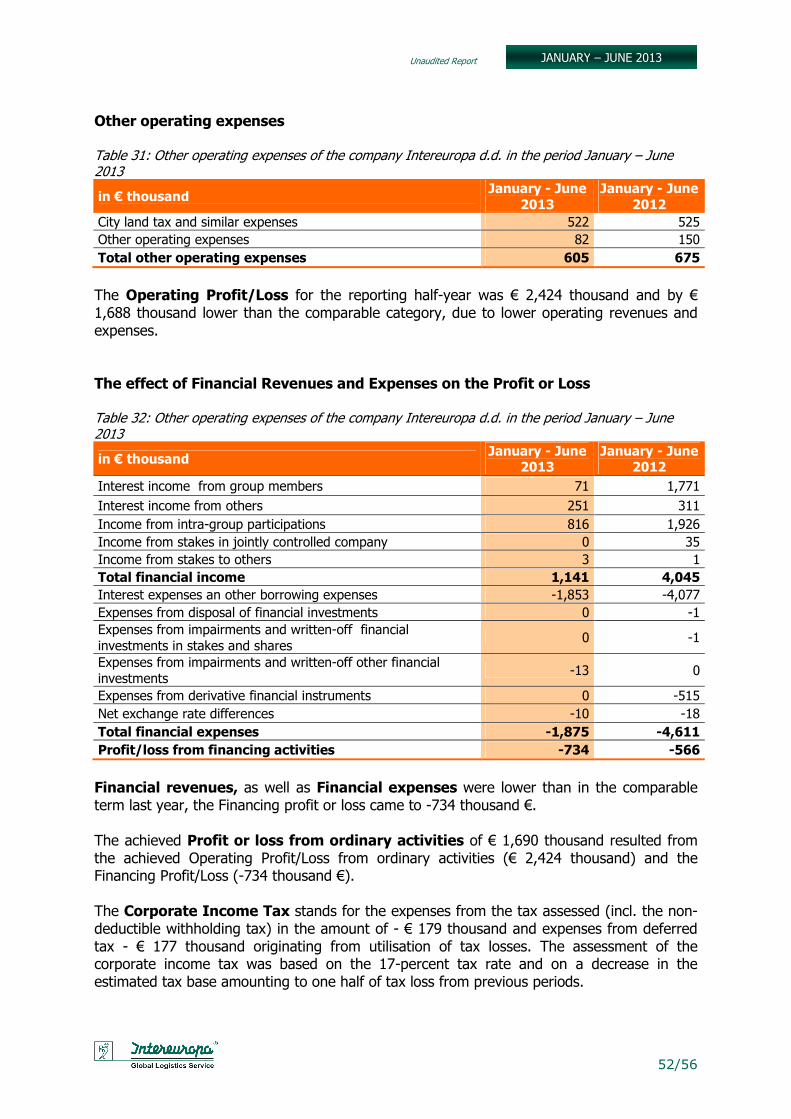
Unaudited Report
52/56
JANUARY – JUNE 2013
Other operating expenses Table 31: Other operating expenses of the company Intereuropa d.d. in the period January – June 2013
in € thousand January - June
2013 January - June
2012
City land tax and similar expenses 522 525 Other operating expenses 82 150 Total other operating expenses 605 675
The Operating Profit/Loss for the reporting half-year was € 2,424 thousand and by € 1,688 thousand lower than the comparable category, due to lower operating revenues and expenses. The effect of Financial Revenues and Expenses on the Profit or Loss Table 32: Other operating expenses of the company Intereuropa d.d. in the period January – June 2013
in € thousand January - June
2013 January - June
2012
Interest income from group members 71 1,771 Interest income from others 251 311 Income from intra-group participations 816 1,926 Income from stakes in jointly controlled company 0 35 Income from stakes to others 3 1 Total financial income 1,141 4,045
Interest expenses an other borrowing expenses -1,853 -4,077 Expenses from disposal of financial investments 0 -1 Expenses from impairments and written-off financial investments in stakes and shares
0 -1
Expenses from impairments and written-off other financial investments -13 0
Expenses from derivative financial instruments 0 -515 Net exchange rate differences -10 -18 Total financial expenses -1,875 -4,611
Profit/loss from financing activities -734 -566
Financial revenues, as well as Financial expenses were lower than in the comparable term last year, the Financing profit or loss came to -734 thousand €. The achieved Profit or loss from ordinary activities of € 1,690 thousand resulted from the achieved Operating Profit/Loss from ordinary activities (€ 2,424 thousand) and the Financing Profit/Loss (-734 thousand €). The Corporate Income Tax stands for the expenses from the tax assessed (incl. the non-deductible withholding tax) in the amount of - € 179 thousand and expenses from deferred tax - € 177 thousand originating from utilisation of tax losses. The assessment of the corporate income tax was based on the 17-percent tax rate and on a decrease in the estimated tax base amounting to one half of tax loss from previous periods.
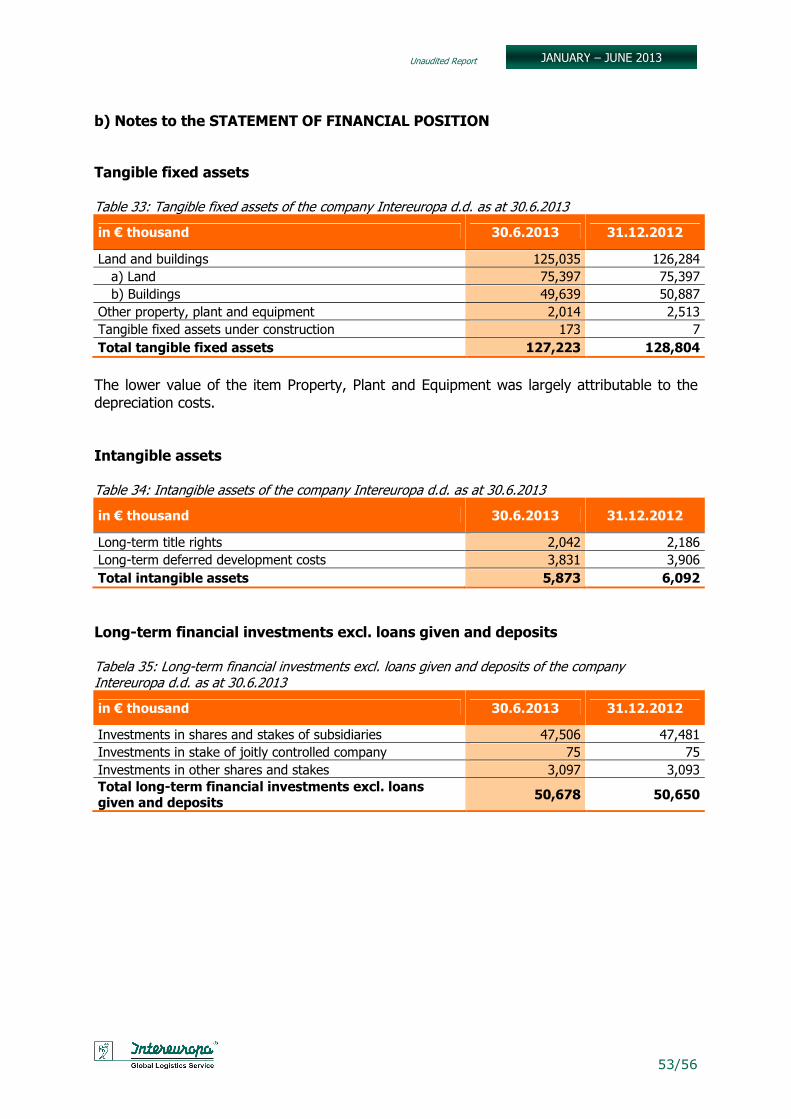
Unaudited Report
53/56
JANUARY – JUNE 2013
b) Notes to the STATEMENT OF FINANCIAL POSITION
Tangible fixed assets Table 33: Tangible fixed assets of the company Intereuropa d.d. as at 30.6.2013
in € thousand 30.6.2013 31.12.2012
Land and buildings 125,035 126,284 a) Land 75,397 75,397 b) Buildings 49,639 50,887
Other property, plant and equipment 2,014 2,513 Tangible fixed assets under construction 173 7 Total tangible fixed assets 127,223 128,804
The lower value of the item Property, Plant and Equipment was largely attributable to the depreciation costs. Intangible assets Table 34: Intangible assets of the company Intereuropa d.d. as at 30.6.2013
in € thousand 30.6.2013 31.12.2012
Long-term title rights 2,042 2,186 Long-term deferred development costs 3,831 3,906 Total intangible assets 5,873 6,092
Long-term financial investments excl. loans given and deposits Tabela 35: Long-term financial investments excl. loans given and deposits of the company Intereuropa d.d. as at 30.6.2013
in € thousand 30.6.2013 31.12.2012
Investments in shares and stakes of subsidiaries 47,506 47,481 Investments in stake of joitly controlled company 75 75 Investments in other shares and stakes 3,097 3,093 Total long-term financial investments excl. loans given and deposits
50,678 50,650
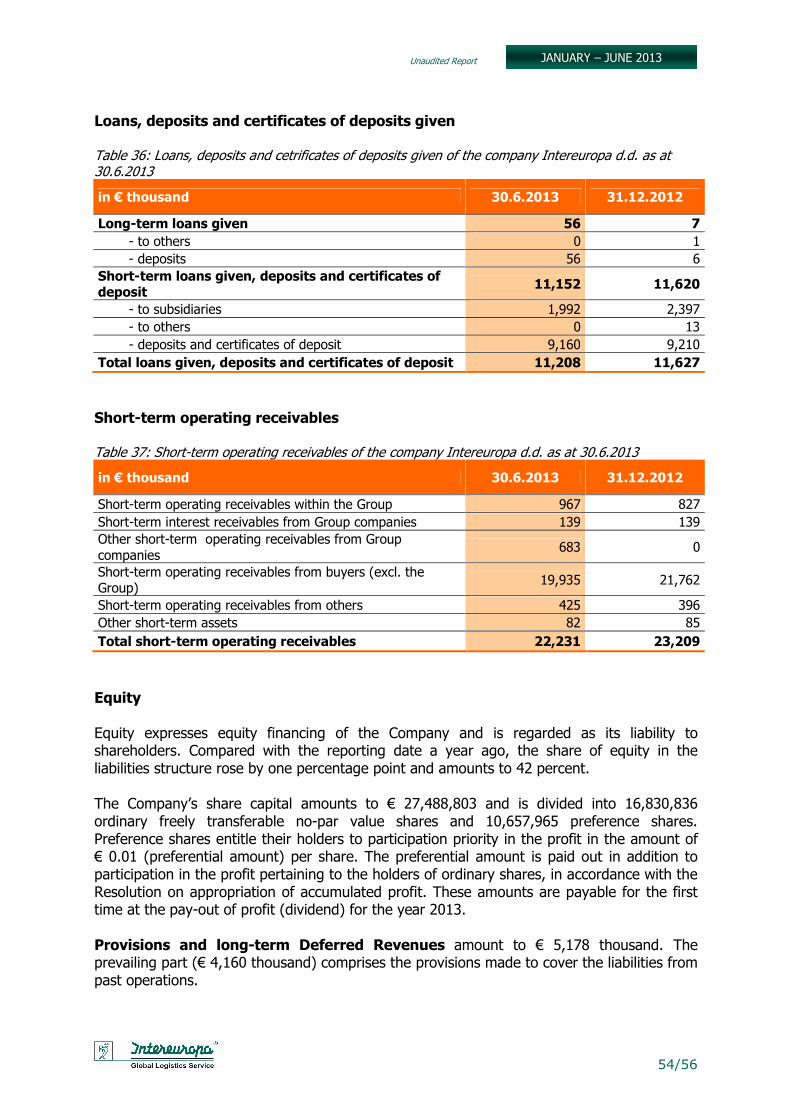
Unaudited Report
54/56
JANUARY – JUNE 2013
Loans, deposits and certificates of deposits given Table 36: Loans, deposits and cetrificates of deposits given of the company Intereuropa d.d. as at 30.6.2013
in € thousand 30.6.2013 31.12.2012
Long-term loans given 56 7
- to others 0 1 - deposits 56 6
Short-term loans given, deposits and certificates of deposit
11,152 11,620
- to subsidiaries 1,992 2,397 - to others 0 13 - deposits and certificates of deposit 9,160 9,210
Total loans given, deposits and certificates of deposit 11,208 11,627
Short-term operating receivables Table 37: Short-term operating receivables of the company Intereuropa d.d. as at 30.6.2013
in € thousand 30.6.2013 31.12.2012
Short-term operating receivables within the Group 967 827 Short-term interest receivables from Group companies 139 139 Other short-term operating receivables from Group companies
683 0
Short-term operating receivables from buyers (excl. the Group) 19,935 21,762
Short-term operating receivables from others 425 396 Other short-term assets 82 85 Total short-term operating receivables 22,231 23,209
Equity Equity expresses equity financing of the Company and is regarded as its liability to shareholders. Compared with the reporting date a year ago, the share of equity in the liabilities structure rose by one percentage point and amounts to 42 percent. The Company’s share capital amounts to € 27,488,803 and is divided into 16,830,836 ordinary freely transferable no-par value shares and 10,657,965 preference shares. Preference shares entitle their holders to participation priority in the profit in the amount of € 0.01 (preferential amount) per share. The preferential amount is paid out in addition to participation in the profit pertaining to the holders of ordinary shares, in accordance with the Resolution on appropriation of accumulated profit. These amounts are payable for the first time at the pay-out of profit (dividend) for the year 2013. Provisions and long-term Deferred Revenues amount to € 5,178 thousand. The prevailing part (€ 4,160 thousand) comprises the provisions made to cover the liabilities from past operations.
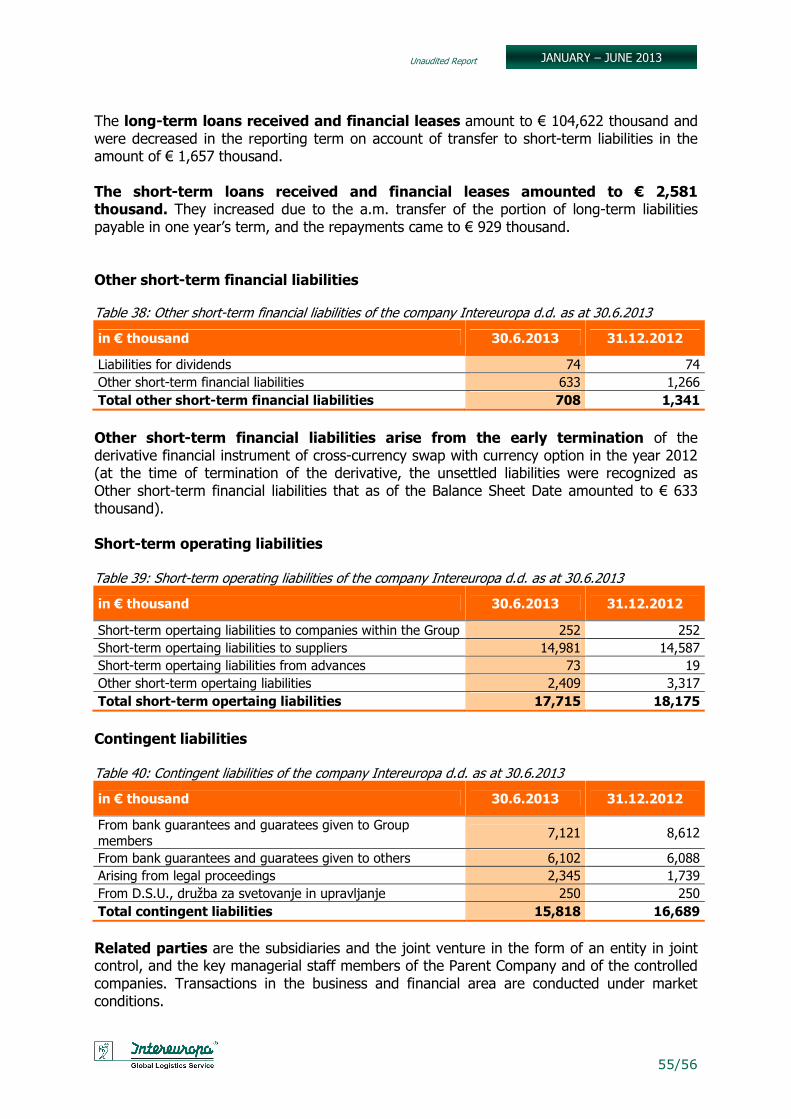
Unaudited Report
55/56
JANUARY – JUNE 2013
The long-term loans received and financial leases amount to € 104,622 thousand and were decreased in the reporting term on account of transfer to short-term liabilities in the amount of € 1,657 thousand. The short-term loans received and financial leases amounted to € 2,581 thousand. They increased due to the a.m. transfer of the portion of long-term liabilities payable in one year’s term, and the repayments came to € 929 thousand. Other short-term financial liabilities Table 38: Other short-term financial liabilities of the company Intereuropa d.d. as at 30.6.2013
in € thousand 30.6.2013 31.12.2012
Liabilities for dividends 74 74 Other short-term financial liabilities 633 1,266 Total other short-term financial liabilities 708 1,341
Other short-term financial liabilities arise from the early termination of the derivative financial instrument of cross-currency swap with currency option in the year 2012 (at the time of termination of the derivative, the unsettled liabilities were recognized as Other short-term financial liabilities that as of the Balance Sheet Date amounted to € 633 thousand). Short-term operating liabilities Table 39: Short-term operating liabilities of the company Intereuropa d.d. as at 30.6.2013
in € thousand 30.6.2013 31.12.2012
Short-term opertaing liabilities to companies within the Group 252 252 Short-term opertaing liabilities to suppliers 14,981 14,587 Short-term opertaing liabilities from advances 73 19 Other short-term opertaing liabilities 2,409 3,317 Total short-term opertaing liabilities 17,715 18,175
Contingent liabilities Table 40: Contingent liabilities of the company Intereuropa d.d. as at 30.6.2013
in € thousand 30.6.2013 31.12.2012
From bank guarantees and guaratees given to Group members 7,121 8,612
From bank guarantees and guaratees given to others 6,102 6,088 Arising from legal proceedings 2,345 1,739 From D.S.U., družba za svetovanje in upravljanje 250 250 Total contingent liabilities 15,818 16,689
Related parties are the subsidiaries and the joint venture in the form of an entity in joint control, and the key managerial staff members of the Parent Company and of the controlled companies. Transactions in the business and financial area are conducted under market conditions.
Unaudited Report
56/56
JANUARY – JUNE 2013
IN BRIEF … Economic movements in the markets of Intereuropa in the first half-year 2013 were not encouraging. The long-lasting weak economic activity continued, leading to escalation of competition and compelling the providers of logistics to reduce their sales margins. Intereuropa was no exception, and we have followed the progress by process optimisation in the last few years to improve the quality and cost efficiency of our services. Lately, we dedicated most of our attention to intensify our sales activities and adapt to new market situation following the EU accession of Croatia, which significantly cut the demand for profitable customs services in Slovenia and in Croatia after 1 July 2013. After our goals for financial stability of the Group were fulfilled last year, we continued to build up our sales activities aiming to acquire new customers, develop the information support for the needs of logistics solutions, digitalise incoming documents for operational needs, and undertook other applicable activities to streamline our operational procedures. In the half-year’s term we achieved the planned sales goals and got into shape for coping with the market conditions that are expected to aggravate in the second half-year. In the first half-year 2013, the Intereuropa Group generated a sales revenue of € 82.5 million and exceeded the planned sales by one percent. However, that sales result was 15 percent lower than in the first half-year 2012. The major reason for that was decrease of car logistics revenue and decreased demand of services by our major customer Top Shop Intl., which we were unable to fully compensate with new business. The envisioned financial results for the reporting half-year were mostly achieved; however, this year’s operations are not comparable with the same term of 2012 because the disposal of logistics centre in Russia in November 2012 affected numerous items in our financial statements. On the Group level, our Operating Profit or Loss came to € 5.0 million and was only 2 percent lower than planned. The share of Operating Profit in the sales revenue (EBIT margin) improved since the first quarter and now achieved 6.1 percent. The Financing profit or loss was negative -1.7 million €, which is entirely attributable to interest expenses. After tax, the Net profit of the Group came to € 2.5 million. At the end of the term the Group recorded a net financial debt at € 95.9 million, which is 4 per cent lower than at the year-end 2012. In the current situation of low economic activity and tough competition, we remain focused on the markets in which we achieve high market shares. In line with the expected sales revenue from customs services in Slovenia and Croatia, which will reflect on the sales results most clearly in the second half-year, we have already started to align our organizational structure and to streamline our processes. Nevertheless, the accession of Croatia to the European Union has some positive aspects too: it simplifies mutual operations and opens new business opportunities, such as higher demand for warehousing and distribution services on the part of foreign companies that are quite aggressively pushing to enter the Croatian market. INTEREUROPA d.d. President of Management Board Ernest Gortan, Msc.