ultrasound and arthropod pest control: hearing is · pdf fileultrasound and arthropod pest...
TRANSCRIPT

Ultrasound and Arthropod Pest Control: Hearing is Believing!
Bhadriraju Subramanyam (Subi)Department of Grain Science and Industry
Kansas State UniversityManhattan, KS 66506

• Introduction
• Summary of published data: efficacy tests
• Results from tests on household pests
• Results from tests on Indian meal moth (Storage pest)
• Overall conclusions
• Future research needs
Seminar outline

Sound sensitivity in different animals (From Dusenbery, 1992)
0.02 0.05 0.1 0.2 0.5 1 2 5 10 20 50 100
344 34.4 3.44 0.344
Man
Bats
RodentsWhales and dolphins
Seals and sea lions
Birds
FrogsFish
Moths
Bush crickets
Crickets
Grasshoppers
Wavelength, cm
Frequency, kHzInfrasound Ultrasound

Insects use specialized organsInsects use specialized organs
• For remote sensing potential predators, prey, mates, or rivals
• To see – eyes• To hear – auditory organs• To smell – olfactory organs• Feel presence of others – proprioreceptors
and cuticular hairs

• An acoustic signal is generated by vibrations of a sound-producing organ
• Mechanoreceptive organs perceive the sound
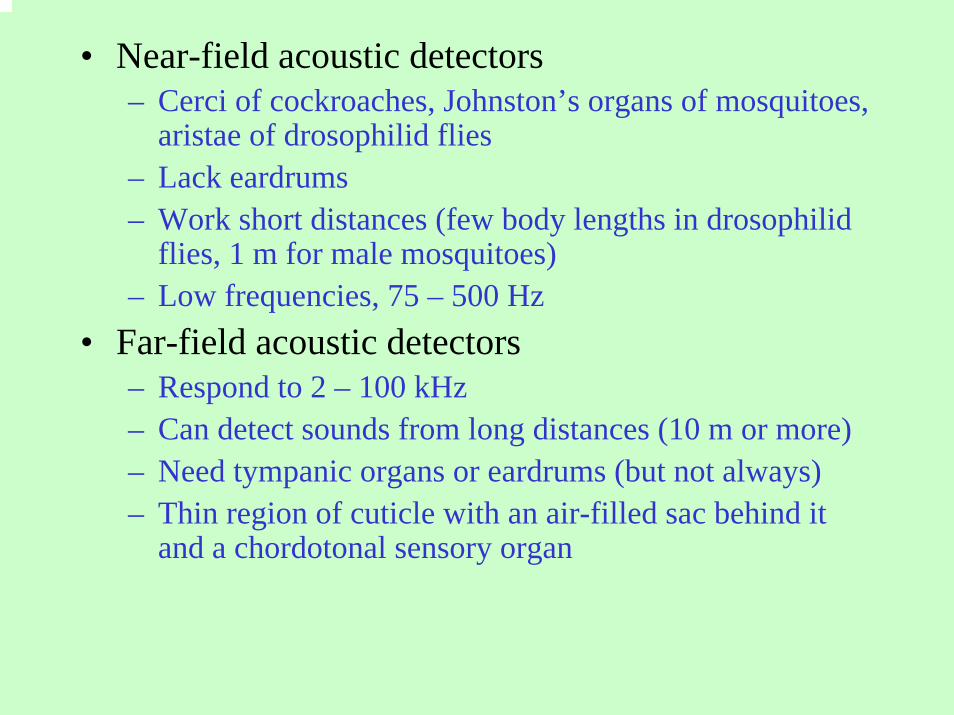
• Near-field acoustic detectors– Cerci of cockroaches, Johnston’s organs of mosquitoes,
aristae of drosophilid flies– Lack eardrums– Work short distances (few body lengths in drosophilid
flies, 1 m for male mosquitoes)– Low frequencies, 75 – 500 Hz
• Far-field acoustic detectors– Respond to 2 – 100 kHz– Can detect sounds from long distances (10 m or more)– Need tympanic organs or eardrums (but not always)– Thin region of cuticle with an air-filled sac behind it
and a chordotonal sensory organ

Tympanal hearing• Present in 7 insect orders• Neuroptera – wing base• Lepidoptera – Abdomen, metathorax, base of fore or
hind wing• Coleoptera – Cervical membranes, abdomen• Dictyoptera – Ventral metathorax, Metathoracic leg• Orthoptera – First abdominal segment, prothoracic leg• Hemiptera – Abdomen, mesothorax• Diptera – Ventral pro-sternum
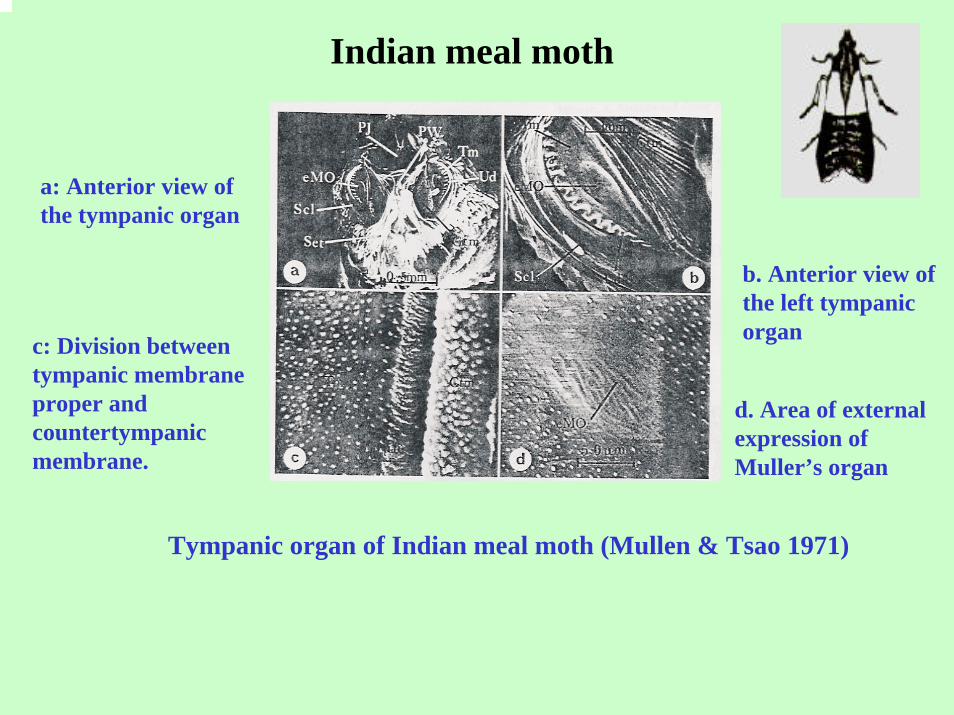
Indian meal moth
Tympanic organ of Indian meal moth (Mullen & Tsao 1971)
a: Anterior view of the tympanic organ
c: Division between tympanic membrane proper and countertympanicmembrane.
b. Anterior view of the left tympanic organ
d. Area of external expression of Muller’s organ

Insects use ultrasound for several purposes• Long-distance mate calling (male calls, female responds--in crickets, katydids, grasshoppers, and cicadas)
• Short distance calling song (by mutual antennation in field crickets)
• Rivarly song or territorial proclamation (male-male aggression)
• Predator detection – night flying moths
• Acoustic parasitism – Field crickets and tachinid fly (Ormea ochracea), 4 – 6 kHz (host 4.8 kHz). Fly also is sensitive to 20 –60 kHz sound
• Male and female insects have different auditory sensitivities (Gypsy moth, tachinid flies, cicadas)
• Intra-specific communication vs prey detection
Auditory capabilities evolved
• To facilitate conspecific communication• To detect predators __________________________________________• Insect’s ability to hear need not be based solely on
organs visible on anatomic examination of the body surface
• Only a few species have been studied • Species that use auditory signals may do it at night
or high in the air—a challenge for us to study!

Echolocating bats• Aerial hawking bats
– Catch flying insects on the wing– Use sonar to target and capture prey– Prefer open habitats– Produce low frequency, high intensity, long duration
pulses• Substrate gleaning bats
– Forage near the ground or surrounding vegetation– Use sonar as a navigational tool to avoid obstacles– Prefer “closed” habitats– Produce high frequency, low intensity, short duration
pulses– Acoustically less “conspicuous” to eared insects
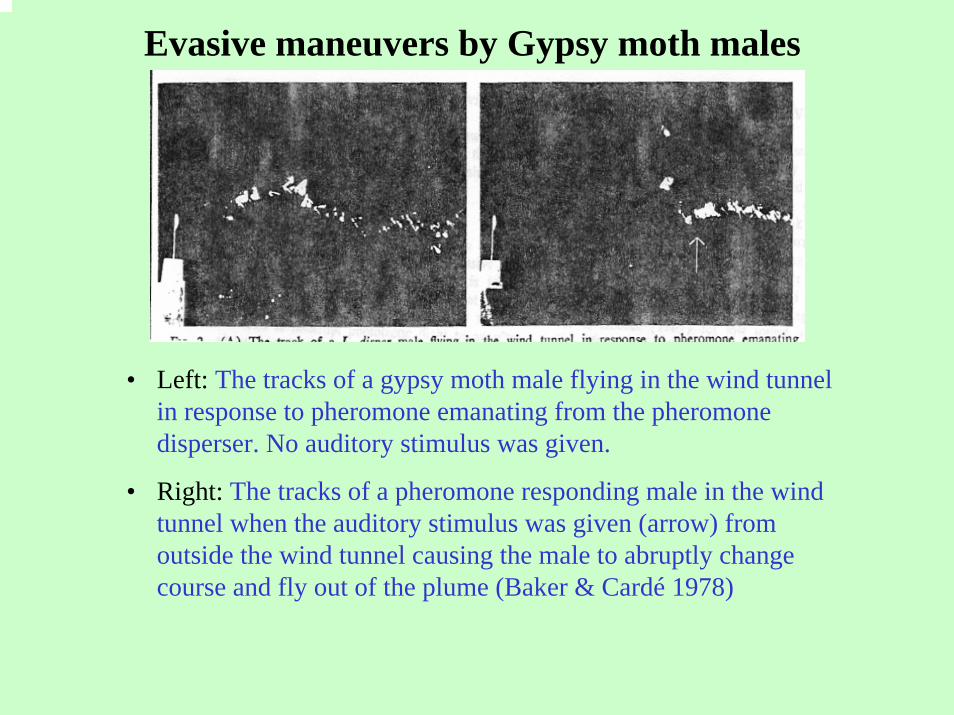
• Left: The tracks of a gypsy moth male flying in the wind tunnel in response to pheromone emanating from the pheromone disperser. No auditory stimulus was given.
• Right: The tracks of a pheromone responding male in the wind tunnel when the auditory stimulus was given (arrow) from outside the wind tunnel causing the male to abruptly change course and fly out of the plume (Baker & Cardé 1978)
Evasive maneuvers by Gypsy moth males

Ultrasonic devices and pest control

United States ultrasound market
• More than 60 manufacturers and retailers
• Estimated market value may be around 100 million• One US company alone has $20 million in sales
annually

Range of available ultrasonic devices marketed in the United States
Target pests
Rats, mice, squirrels, mosquitoes, ants, spiders, cockroaches, flies, fleas, ticks, crickets, yellow jackets, bees, moths,
water bugs, silverfish …
Manufacturers and retailers claim that pests can be repelled by ultrasonic devices!

• Gets rid of household pests without chemicals or poisons
• Our safe Electronic Pest Repellers and Flea Collars use high frequency sound to drive away pests
• Millions of satisfied users report that these products safely chase away fleas, mice, rats, squirrels and other rodents, as well as roaches, moths, ants, spiders, mosquitoes, and many other creepy pests
Source: http://www.hitecpet.com/pestcontrol.html
Preposterous claims by manufacturers and retailers

The DX-610 electronic pest control repeller• Drives away mice and rats, fleas, spiders, bats, ants, cockroaches, moths, water bugs, silverfish, and most other common pests
• Covers 2,000-2,500 square feet
• Environments: Homes, but also in their garages, offices, warehouses, campers, restaurants, schools, and barns
• Marketing: Over 23 countries, including Japan, Australia, Greece, Spain, Brazil, Denmark, Mexico, and Canada
Testimonials
"...could hear the mice running around at night. Well, now they are gone. This product really worked!” ---- Bob G. from Massachusetts
"...I can't believe how good it works. FIRST CLASS PRODUCT!" … Joe J from Nevada
• Source: http://www.msglobaldirect.com/html/electronic_pest_control.html

Published research results
Most tests measured repellent effects

Field and laboratory efficacy tests with ultrasonic devices
Pests Authors Test conditions Frequency,kHz
SPL dB at distance, cm
Effective S/F
Brown & Lewis, 1991
Dryden et. al.,1989
Dryden & Gaafar, 1991
Dryden et al. 2000
Hinkle & Koehler, 1990
Koehler et al., 1989
Schein et al., 1988 Lab -- -- no 0/1
Rust & Parker, 1988
Lab 1 – 20040, 50
-- no 0/1
Koehler et al., 1986
Chamber -- -- no
Summary of successes (S)/failures (F): 0/21
Cage 40 80-92 at 100 no
0/4
0/2
0/1
0/1
0/1
0/1
Cage 40-50 -- no
Cage -- -- no
Cage 35, 39, 41 102 at 584 at 50
no
Lab 40 82 at 5076 at 100
no
0/9Room Chamber 17 - 61 51 – 103 at 100 no
Flea

Pests Authors Test conditions Frequency,kHz
SPL dB at distance, cm
Effective S/F
Brown & Lewis, 1991
Ballard & Gold, 1983
Ballard et al., 1984
Gold et al., 1984
Koehler et al., 1986
Koehler et al., 1989
Schreck et al., 1984 Chamber 1: 44, 532: 30-35, 43
1: 65 at 502: 96 at 0.5
no 0/2
Brown & Lewis, 1991 Chamber -- -- no 0/4
Schein et al., 1988 Lab -- -- no 0/1
Tick
Summary of the successes (S)/failures (F): 13/42
Chamber -- -- no
Summary of the successes (S)/failures (F): 0/5
Chamber 20-60 -- ?
0/4
6/18
4/4
3/4
0/9
Chamber 30-65 60-68.5 at 200 yes
Chamber 40, 20-50 70-110 at 91 ?
Room Chamber 17 - 61 51 – 103 at 100 no
Lab 40 82 at 5076 at 100
no 0/1
Cockroach

Pests Authors Test conditions FrequencykHz
SPL dB at distance cm
Effective Ratio
Gorham, 1974
Kutz, 1974
Mosquito
Garcia et al., 1976 Lab and field -- -- no 0/1
Schreck et al., 1984 Chamber 1: 44, 532: 30-35, 43
1: 65 at 502: 96 at 0.5
no 0/2
Schreiber et al., 1991 Chamber and field - - no 0/5
Sylla et al., 2000 Houses 3-11 -- no 0/4
Summary of the successes (S)/failures (F): 0/14
Belton & Kempster, 1962
Corn field 50 100 at 30 yes 1/1, 50% RdEuropean corn borer
Agee & Webb, 1969 Light traps 20, 25, 30 100 at 100 yes 1/1, Rd by 81%
Cabbage looper
Payne & Shorey, 1968
Lettuce and broccoli fields
20, 30 40 --- yes 2/3, Rd up to 66%
Agee & Webb, 1969 Cotton field 20, 25, 30 100 at 100 no 0/1
Shorey et al., 1972 Corn field 20 60-105 at 25,00-0 no 0/1
Agee & Webb, 1969 Light traps 20, 25, 30 100 at 100 yes 1/1 Rd by 75%
Summary of the successes (S)/failures (F): Moth= 5/8; Overall=18/90
-- -- -- no
Bollworm
-- -- -- no
0/1
0/1
Mosquito
Some field or laboratory efficacy tests of ultrasound to repel insects

2001 FTC Warns Manufacturers and Retailers of Ultrasonic Pest Control Devices
• Efficacy claims about these products must be supported by scientific evidence
• FTC challenged the following types of claims:
-- Eliminates rodent infestations
-- Repels insects
-- Serves as an effective alternative to conventional pest control products
-- Increases or assists the effectiveness of other pest control methods
-- Eliminates fleas on dogs or cats
Source: http://www.ftc.gov/opa/2001/05/fyi0128.htm
Kansas State University (KSU) test results with ultrasonic devices against arthropod pests
(2000-2003)
• 5 commercial devices: A, B, C, D, and E
• 1 random ultrasound-generating unit (developed at KSU)
• 9 groups of arthropod pests

Arthropods used in tests
• Cat fleas, Ctenocephalides felis
• German cockroach, Blattella germanica
• Ants, Camponotus festintatus, C. pennsylvanicus, Formicapallidefulva
• Eastern yellow jacket, Vespula maculifrons

• Long-bodied cellar spiders,Pholcus phalangioides.
• Field and house crickets, Acheta assimilis, A. domestica
• Fly complex: Green bottle fly (Phormia spp.), flesh fly (Sarcophagidae), house fly (Musca domestica), blow fly, and 2 other unknown fly species
• Imperil scorpion, Pandinusimperator
• Indian meal moth, Plodia interpunctella.
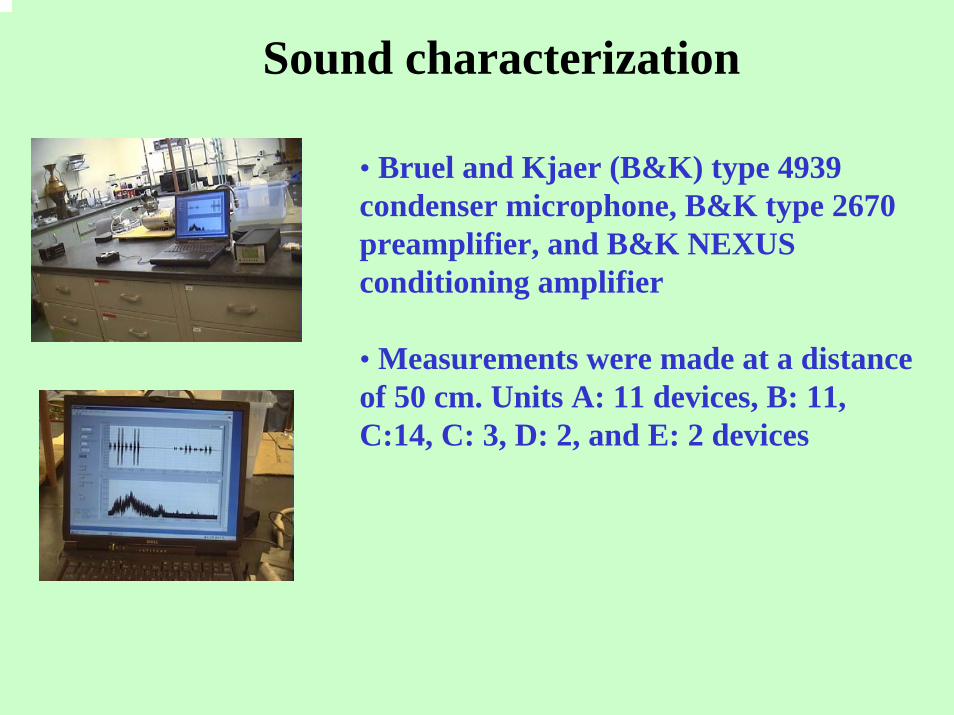
Sound characterization
• Bruel and Kjaer (B&K) type 4939 condenser microphone, B&K type 2670 preamplifier, and B&K NEXUS conditioning amplifier
• Measurements were made at a distance of 50 cm. Units A: 11 devices, B: 11, C:14, C: 3, D: 2, and E: 2 devices
Frequency Spectrum
0102030405060708090
100
0 10 20 30 40 50 60 70 80 90 100
Frequency (kHz)
Sou
nd P
ress
ure
Leve
l (dB
re
20 µ
Pa)
Waveform Graph
-10
-5
0
5
10
15
0 0.02 0.04 0.06 0.08 0.1 0.12
Time (seconds)
Sou
nd P
ress
ure
(Pa)
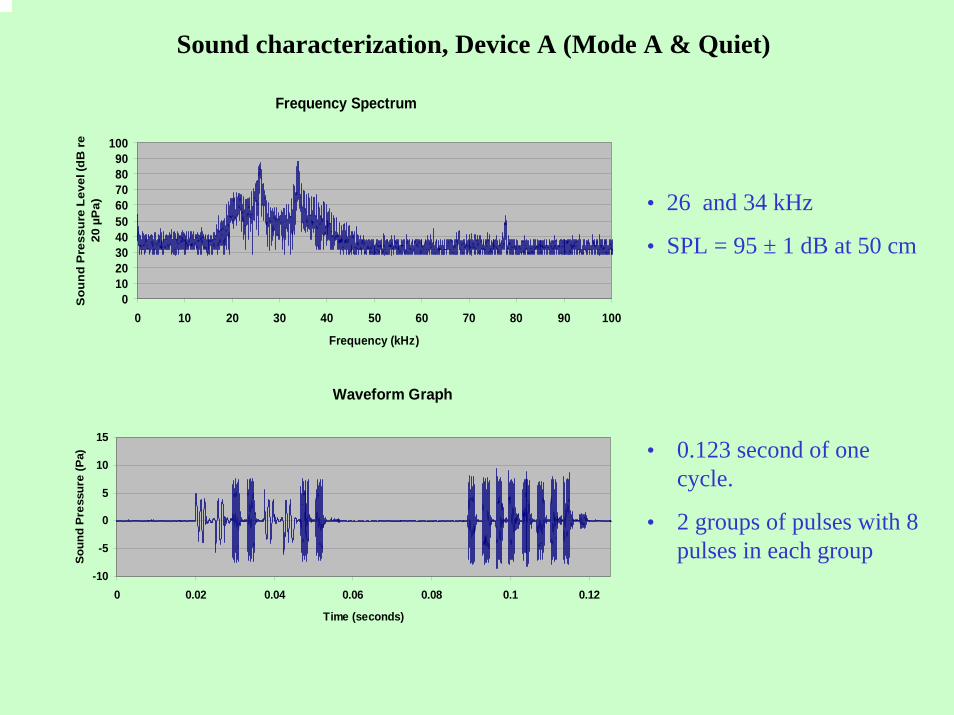
• 26 and 34 kHz
• SPL = 95 ± 1 dB at 50 cm
Sound characterization, Device A (Mode A & Quiet)
• 0.123 second of one cycle.
• 2 groups of pulses with 8 pulses in each group

Frequency Spectrum
0
20
40
60
80
100
0 20 40 60 80 100Frequency (kHz)
Soun
d Pr
essu
re L
evel
(dB
re
20 µ
Pa)
Waveform Graph
-10-8-6-4-202468
10
0 0.02 0.04 0.06 0.08 0.1 0.12Time (seconds)
Soun
d Pr
essu
re (P
a)
• 21 kHz, 35 kHz, and 41 kHz
• SPL = 94 dB (SPL) at 50 cm distance
Sound characterization, Device A (Mode B & Quiet)
• 0.123 second of one cycle of the sound
• 2 groups of pulses with 8 pulses in each group

Frequency Spectrum
0102030405060708090
100
0 20 40 60 80 100Frequency (kHz)
Soun
d Pres
sure
Leve
l (dB r
e 20
µPa)
Waveform
-15
-10
-5
0
5
10
15
0 0.02 0.04 0.06 0.08 0.1 0.12Time (seconds)
Soun
d Pres
sure
(Pa)
• 27 and 35 kHz
• SPL = 92 ± 4 dB
• 0.123 second for one sound cycle
• 2 groups of pulses with 8 pulses in each group
Sound characterization, Device B

Frequency Spectrum
0
20
40
60
80
100
0 20 40 60 80 100Frequency (kHz)
Soun
d Pre
ssur
e Lev
el (d
B re
20
µPa)
Waveform Graph
-6
-4
-2
0
2
4
6
0 0.01 0.02 0.03 0.04 0.05 0.06 0.07
Time (seconds)
Soun
d Pr
essu
re (P
a)
• A wide range of peak frequencies between 27.7 to 42 kHz
• SPL = 88 ± 2 dB at 50 cm
Sound characterization, Device C
• 0.075 second in duration
• 3 groups of pulses, and each group was characterized by multiple pulses

• Small peak at 50-60 kHz • SPL = 70 dB sound pressure level at 50 cm
Sound characterization, Device D (Frequency)

• Several different sound waveform patterns • at least 3 distinct sound patterns
Sound characterization, Device D (Waveform)

• Peak frequencies at 26 to 40 kHz and at 60 to 80 kHz, plus a small peak frequency at 90 kHz
• SPL = 70 dB at 50 cm
Sound characterization, Device E (Frequency)
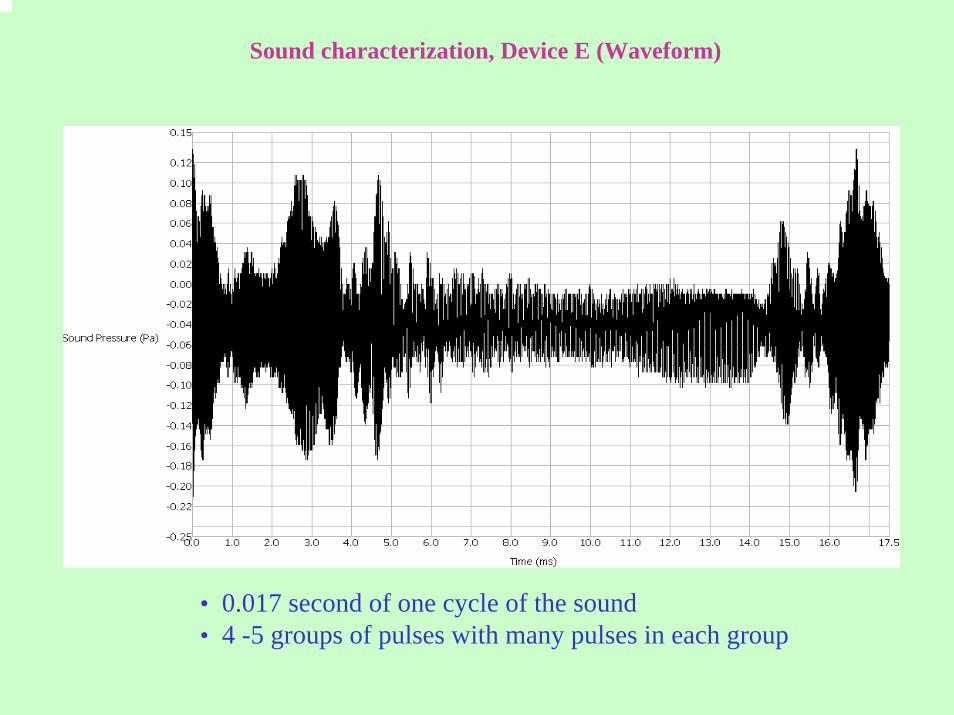
• 0.017 second of one cycle of the sound • 4 -5 groups of pulses with many pulses in each group
Sound characterization, Device E (Waveform)
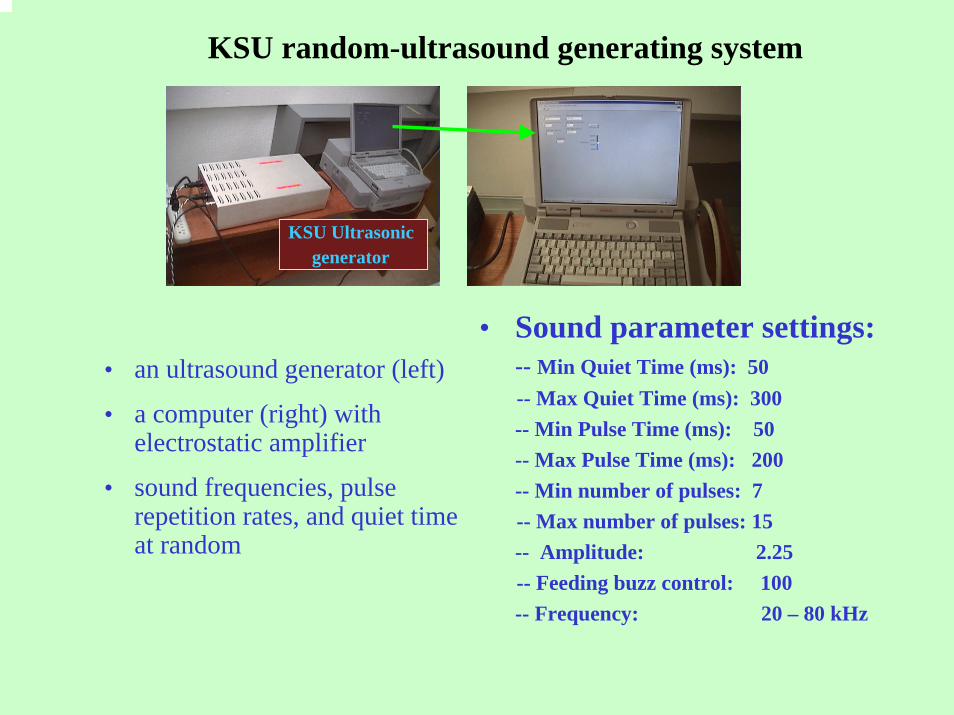
KSU random-ultrasound generating system
• an ultrasound generator (left)
• a computer (right) with electrostatic amplifier
• sound frequencies, pulse repetition rates, and quiet time at random
KSU Ultrasonic generator
• Sound parameter settings:-- Min Quiet Time (ms): 50 -- Max Quiet Time (ms): 300-- Min Pulse Time (ms): 50-- Max Pulse Time (ms): 200-- Min number of pulses: 7-- Max number of pulses: 15-- Amplitude: 2.25-- Feeding buzz control: 100-- Frequency: 20 – 80 kHz

• The computer randomly chooses the pulse length, frequency (20 to100 kHz), and quiet time between pulses across the entire frequencyrange
• One device can drive two ultrasonic emitters simultaneously
• The ultrasonic emitter, on average, produced 95dB at the bottomcenter of the enclosure
• A laptop computer to characterize the output of the ultrasonic emitter
KSU random-ultrasound generating system

Sound frequency spectrum (A) and waveform graph (B) produced by the KSU ultrasonic generator. The figures show change in sound frequencies and waveforms over time
0
1020
30
40
50
60
70
80
90
100
0 10000 20000 30000 40000 50000 60000
0
10
20
30
40
50
60
70
80
90
100
0 10000 20000 30000 40000 50000 60000
Frequency
(Hz)
Soun
d pr
essu
re le
vel (
dB r
e 20
uPa
)
A B
-1.5
-1
-0.5
0
0.5
1
1.5
0 0.01 0.02 0.03 0.04 0.05 0.06
Time (ms)
Soun
d pr
essu
re (p
a)
-1.5
-1
-0.5
0
0.5
1
1.5
0 0.01 0.02 0.03 0.04 0.05 0.06
KSU random-ultrasound generating system
Measurement of sound output inside test enclosures

• 8 Plexiglas enclosures, 4 x 4 x 4 ft • A 2–3 feet long square conduit (3 x 3 x
3 in) • All sides of each enclosure were divided
into 16 equal quadrats• An unit was mounted on the top corner,
diagonally opposite from the conduit openings, or on the center of the top surface and faced the center of the bottom surface of an enclosure
• Sound pressure level (dB) within an enclosure at the bottom, middle, and top levels for the ultrasonic devices A, B, and C were measured
Test enclosures

Device Bottom Middle Top
A 77-80 89-97 74-79
B 78-84 89-96 76-80
C 78-86 89-106 74-91
Sound pressure level (dB) within an enclosure at the bottom, middle, and
top levels for the ultrasonic devices A, B, and C

Mid.
Contour maps showing distribution of sound pressure levels within an enclosure at the bottom, middle, and top levels for the ultrasonic devices A, B, and C. The device position within an enclosure was at (0,0) coordinates near the top
Top
Bot.
Distance from front left (meters)
Dis
tanc
e fr
om fr
ont l
eft (
met
ers)
A B C
7879808182838485868788899091
89
91
93
95
97
99
101
103
105
74
76
78
80
82
84
86
88
90
Cockroach tests
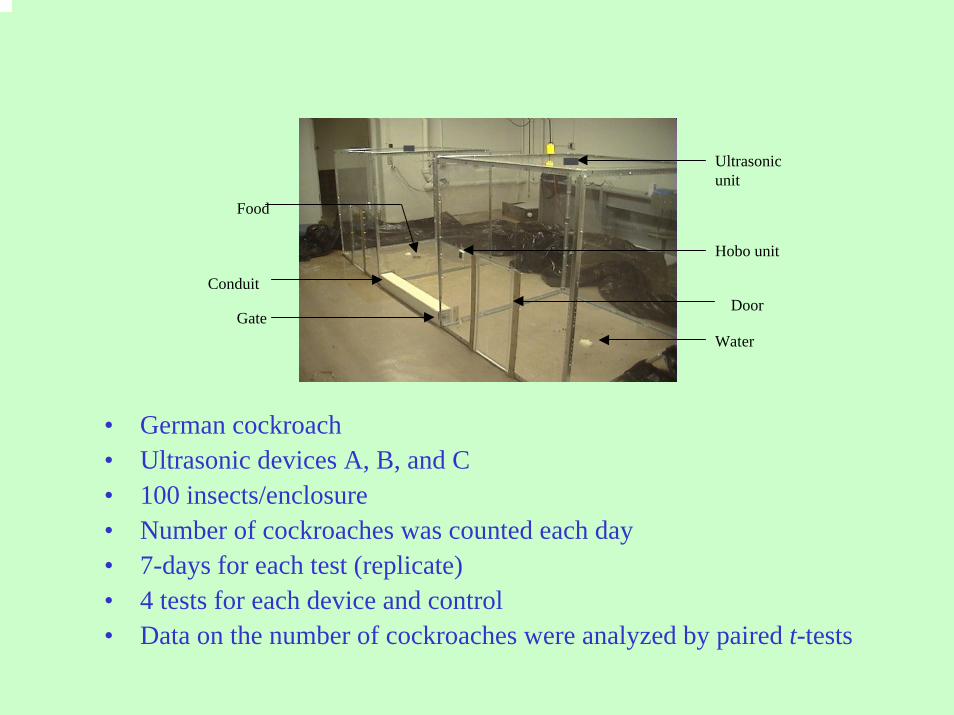
• German cockroach • Ultrasonic devices A, B, and C • 100 insects/enclosure • Number of cockroaches was counted each day • 7-days for each test (replicate)• 4 tests for each device and control • Data on the number of cockroaches were analyzed by paired t-tests
Ultrasonic unit
Conduit
Hobo unit
Food
WaterGate
Door
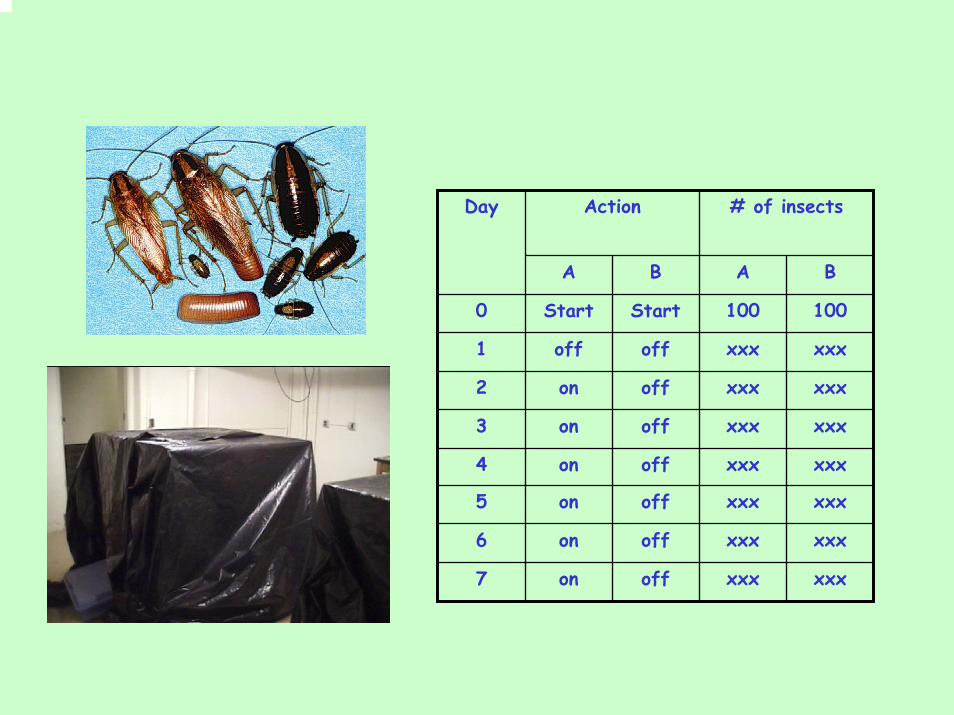
Action # of insects
B A
0 Start Start 100 100
5 on off xxx xxx
6 on off xxx xxx
7 on off xxx xxx
off
off
off
4 on off xxx xxx
xxx
xxx
xxx
Day
A B
1 off xxx
2 on xxx
3 on xxx

No.
coc
kroa
ches
4 05 06 07 08 09 0
1 0 0
W e s t s id eE a s t s id e
4 05 06 07 08 09 0
1 0 0
In a c tiveA c tive
4 05 06 07 08 09 0
1 0 0
In a c tiveA c tive
D a y s a fte r in s e c t re le a s e1 2 3 4 5 6 7
4 0
5 0
6 0
7 0
8 0
9 0
1 0 0
In a c tiveA c tive
C o n tro l
D e v ice A
D e v ive B
D e v ice C
a
a
b
b
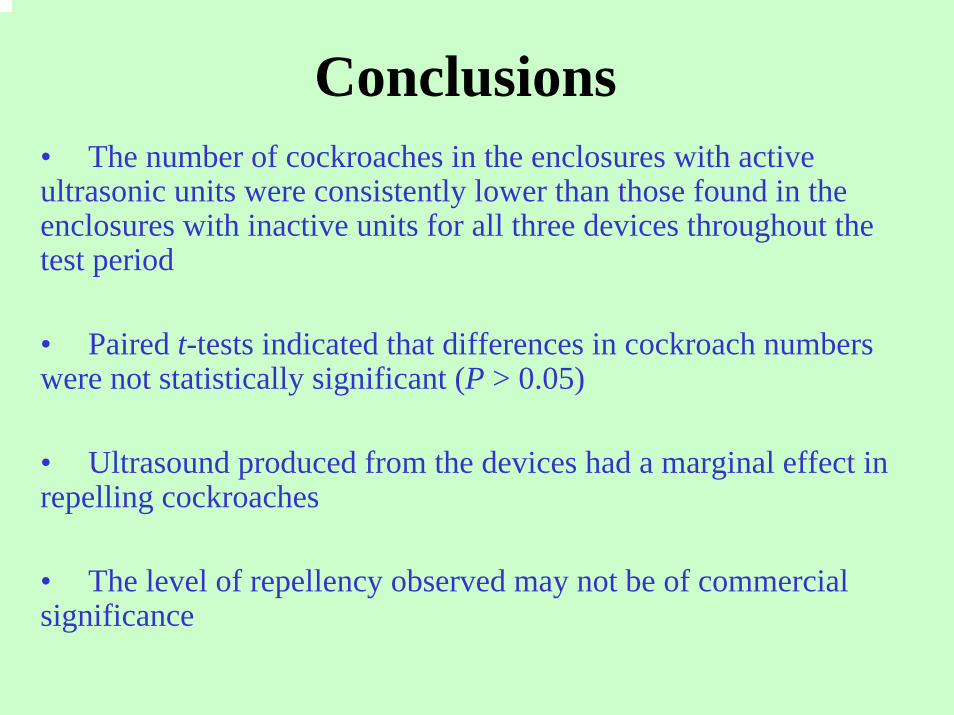
• The number of cockroaches in the enclosures with active ultrasonic units were consistently lower than those found in theenclosures with inactive units for all three devices throughout the test period
• Paired t-tests indicated that differences in cockroach numbers were not statistically significant (P > 0.05)
• Ultrasound produced from the devices had a marginal effect in repelling cockroaches
• The level of repellency observed may not be of commercial significance
Conclusions
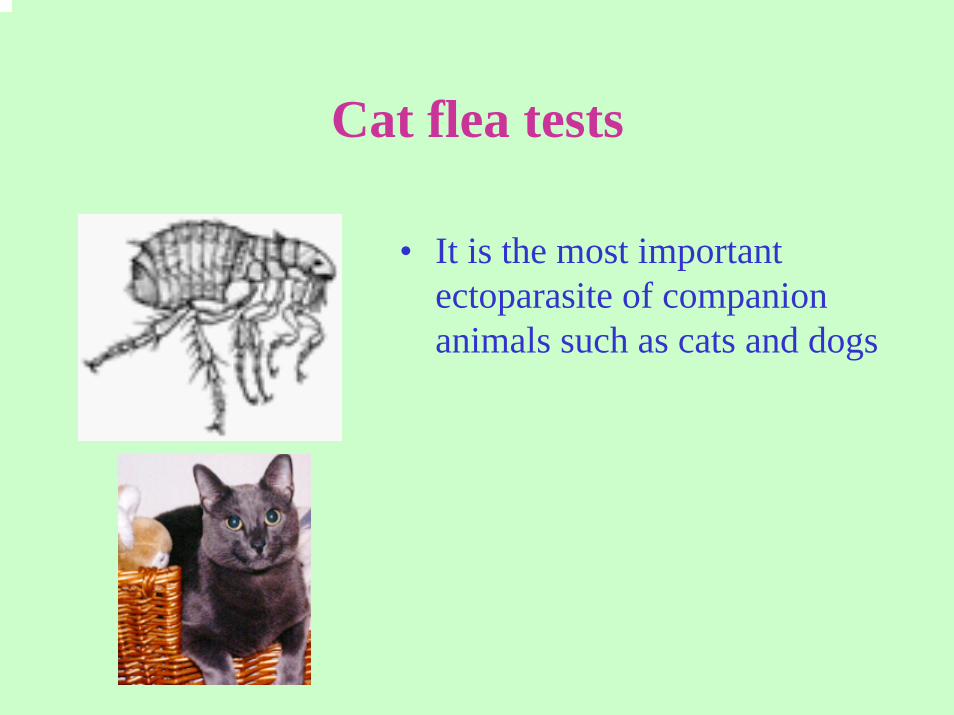
• It is the most importantectoparasite of companion animals such as cats and dogs
Cat flea tests

• Artificial flea blood feeding device
• 6 flea feeding sleeves
Artificial flea feeding device
Feeding cup
Water tank
Transonic device
Water pump
Feeding stage
Immersion heater

• Six 30 ml-plastic cups held the fleas
• Three windows (ca 25 x 15 mm each) were cut around the well of each cup.
• These openings were sealed with a 400-mesh nylon screen to allow ultrasonic pulses to pass through
• Cups were then fitted to the feeding device
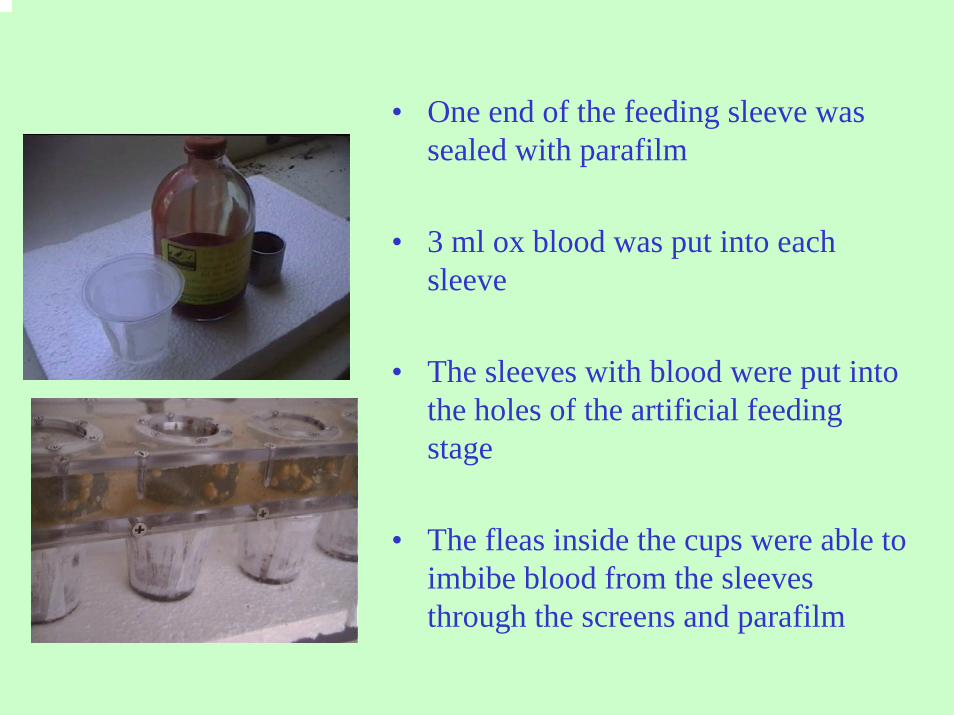
• One end of the feeding sleeve was sealed with parafilm
• 3 ml ox blood was put into each sleeve
• The sleeves with blood were put into the holes of the artificial feeding stage
• The fleas inside the cups were able to imbibe blood from the sleeves through the screens and parafilm
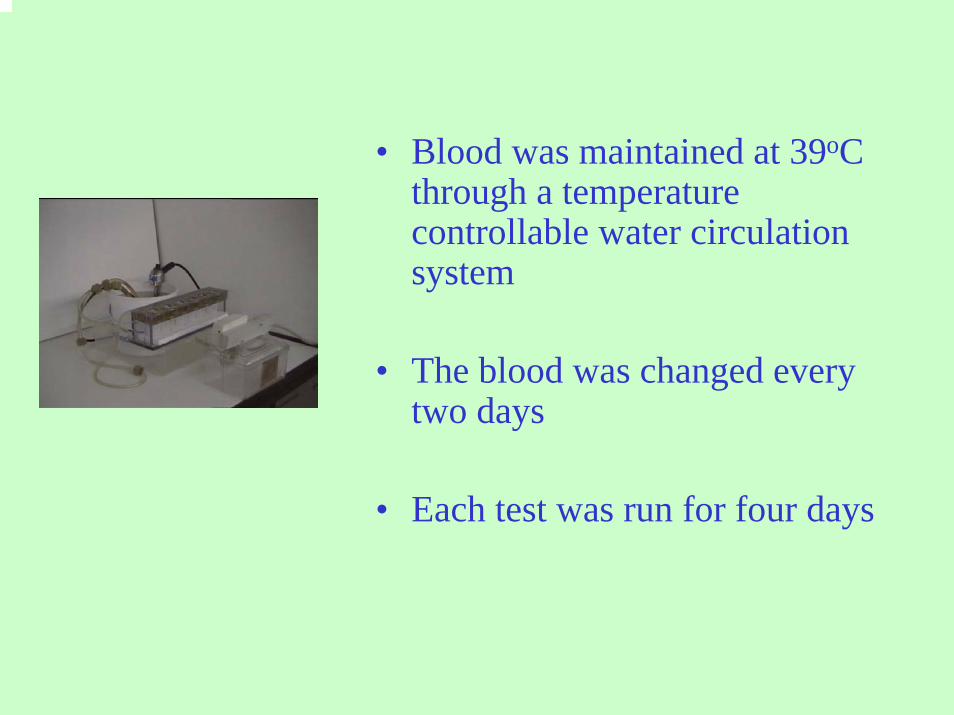
• Blood was maintained at 39oC through a temperature controllable water circulation system
• The blood was changed every two days
• Each test was run for four days

• 9 tests: 2 for control, 2 for device A, 4 for device B, and 1 for device C
• Number of fleas feeding in each cup was counted twice daily
• Biomass (feces + flea bodies + eggs) in each cup was weighed
• Number of eggs in each cup was counted

• Control: 78%
• Treated: 62%
50
55
60
65
70
75
80
Contral T100 T0600 T800
Treatments
% fe
edin
gNumber of fleas feeding

• Control: 22
• Device A: 25
• Device B: 13
• Device C: 19 10
15
20
25
30
Contral Device A Device B Device C
Treatments
Bio
mas
s (m
g/fe
mal
e)
Biomass (mg/female)
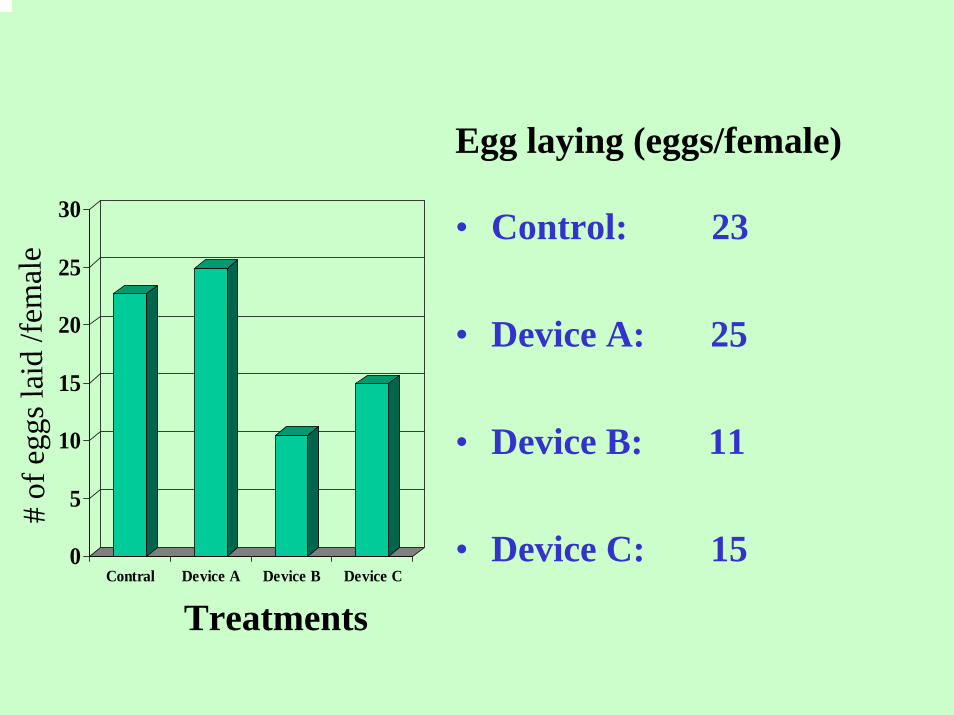
• Control: 23
• Device A: 25
• Device B: 11
• Device C: 150
5
10
15
20
25
30
Contral Device A Device B Device C
Treatments
# of
egg
s lai
d /fe
mal
e
Egg laying (eggs/female)
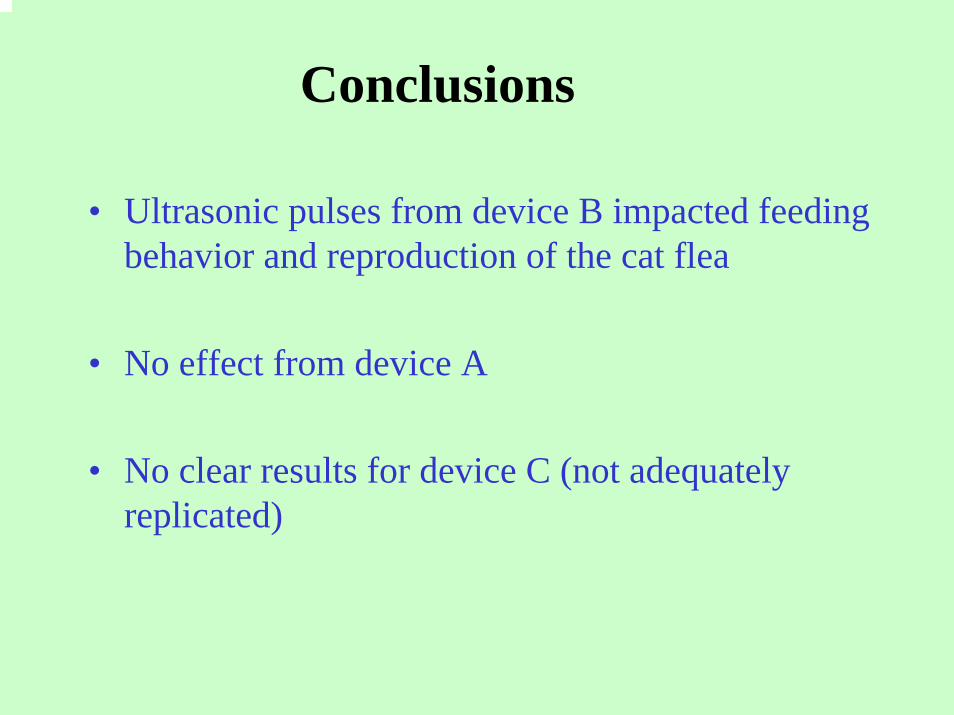
Conclusions
• Ultrasonic pulses from device B impacted feeding behavior and reproduction of the cat flea
• No effect from device A
• No clear results for device C (not adequately replicated)
Spider Tests
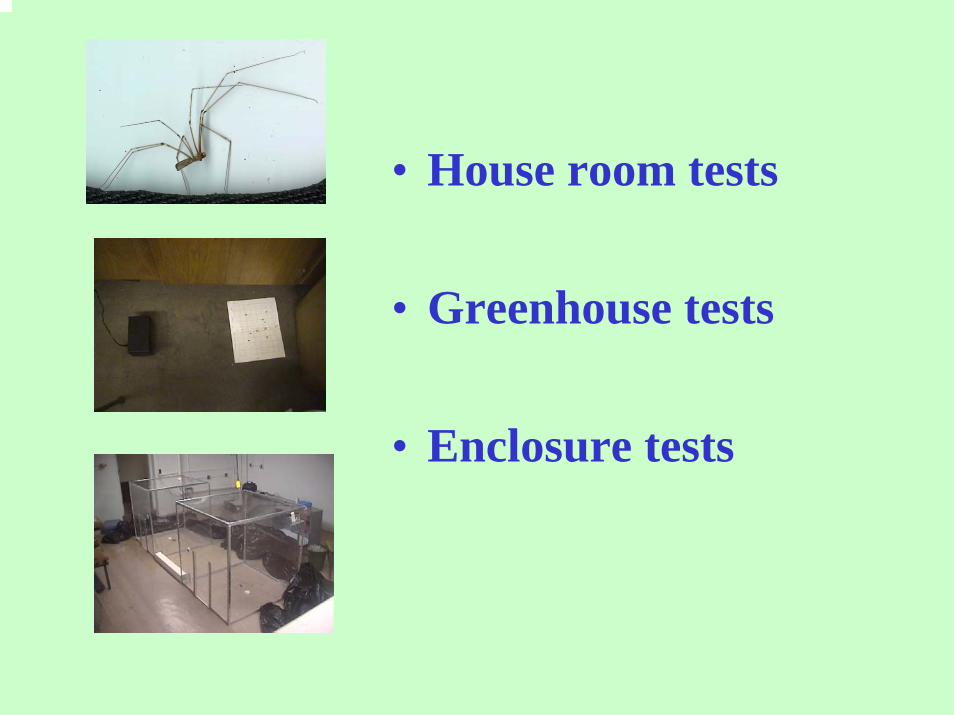
• House room tests
• Greenhouse tests
• Enclosure tests

House room tests
• Devices A, B, C, and a control • 20 rooms • A Pherocon 1C sticky trap was placed on the
floor • An ultrasonic unit was set facing the trap,
about 2 ft away • 5 replications • Number of spiders were checked 5 times

Treatments # of spiders ± SE*
Control 4.2 ± 0.49 aDevice A 2.8 ± 0.80 abDevice B 1.4 ± 0.40 bDevice C 1.6 ± 0.68 b
Number of long-bodied cellar spiders captured per trap and the LSD comparisons
*Values with same letter were not significantly different at the 5% significant level
• About 90% of the spiders captured were long-bodied cellar spiders
• Number of spiders captured with device B and C units was significantly less than the captures from control rooms
• Devices B and C may repel spiders
• Repellent ability of device A was not significant
• Trap captures were low!
Greenhouse paired tests
• Paired design • 9 greenhouse rooms (208 – 625 ft2) • In each room, two sticky traps were placed at the
two corners of the room (pair) • An ultrasonic unit was set facing 1 ft away from
each sticky trap

• Number of spiders were checked at biweekly intervals
• The sticky traps were replaced after each observation

Treatments # of spiders ± MSE difference t-value P-value
Control 2.00 ± 0.00 Device A 1.67 ± 0.88 0.33 ± 0.88 0.3780 0.7418
Control 2.00 ± 0.58 Device B 2.67 ± 1.45 -0.67 ± 1.33 -0.5000 0.6667
Control 4.00 ± 0.58Device C 1.00 ± 0.58 3.00 ± 0.58 5.1962 0.0351
Total number of spiders captured in each spot and the t-test results
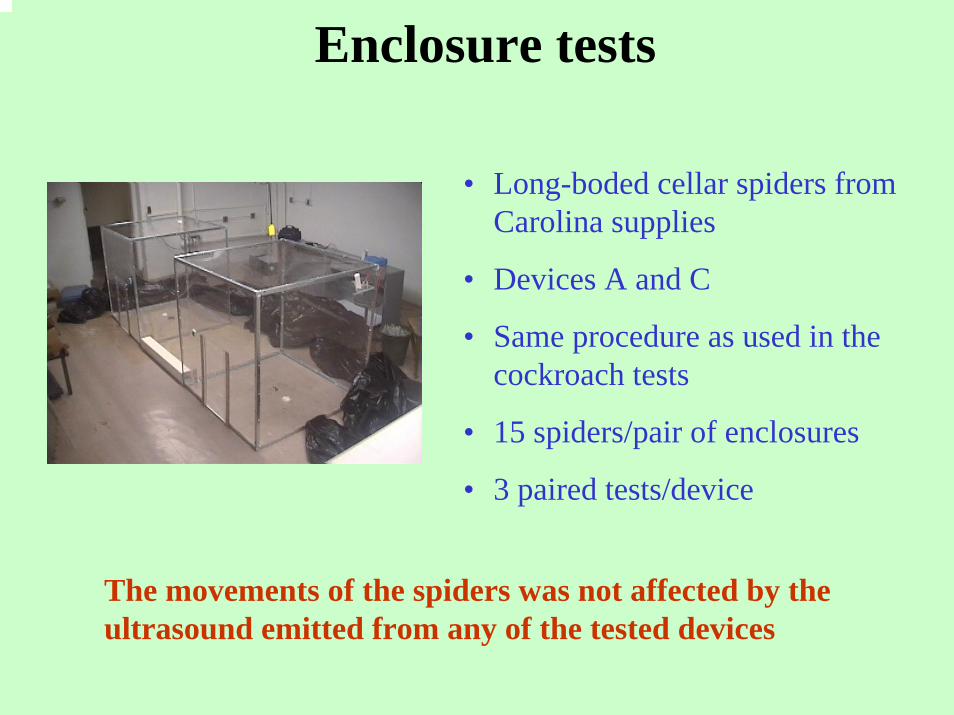
Enclosure tests
• Long-boded cellar spiders from Carolina supplies
• Devices A and C
• Same procedure as used in the cockroach tests
• 15 spiders/pair of enclosures
• 3 paired tests/device
The movements of the spiders was not affected by the ultrasound emitted from any of the tested devices
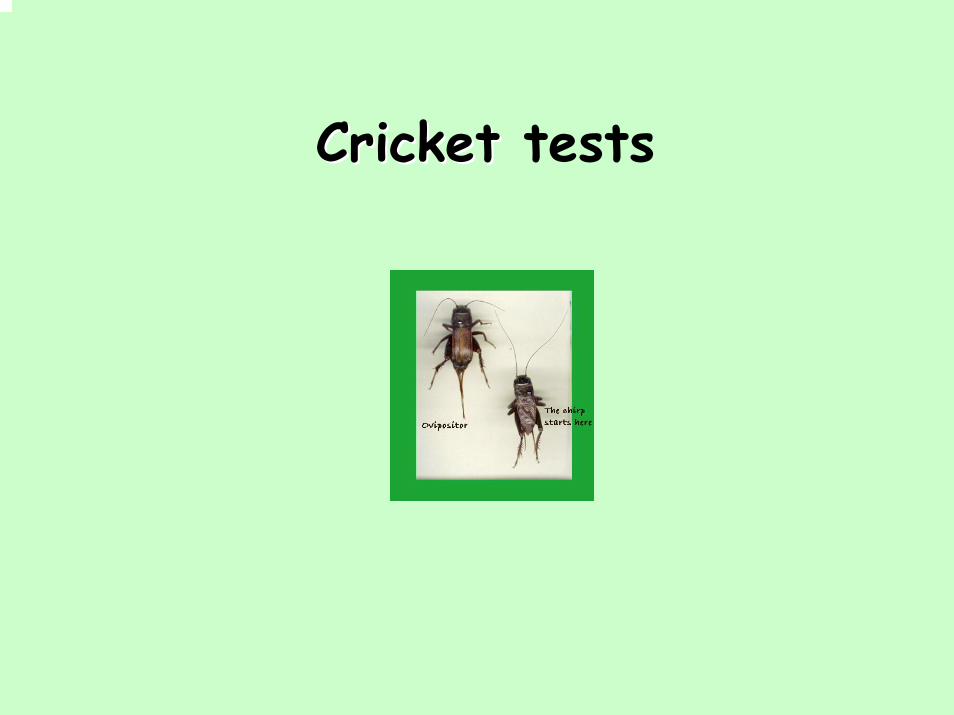
Cricket Cricket tests

• Field cricket and house crickets
• Greenhouse tests, similar to spider tests
• Enclosure tests, similar to cockroach tests

Greenhouse tests
• The ultrasonic units did not repel the field cricket under the greenhouse test conditions
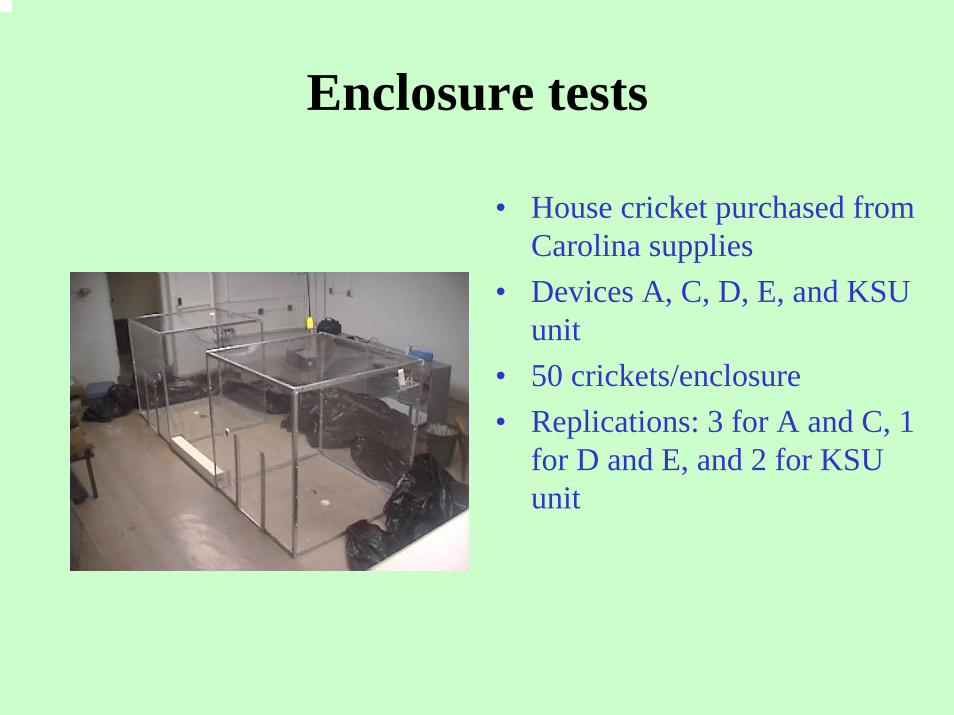
• House cricket purchased from Carolina supplies
• Devices A, C, D, E, and KSU unit
• 50 crickets/enclosure• Replications: 3 for A and C, 1
for D and E, and 2 for KSU unit
Enclosure tests

• Number of crickets were counted daily
• 5-day test was a replicate• Strip-split-plot design
Action # of insects
B A
0 Start Start 100 100
off
off
off
4 off on xxx xxx
on
xxx
xxx
xxx
xxx
Day
A B
1 off xxx
2 on xxx
3 on xxx
5 off xxx
-30
-20
-10
0
10
20
30
1 2 3 4
OffOn
Days
Cha
nge
in n
umb e
r of
cri
cket
s
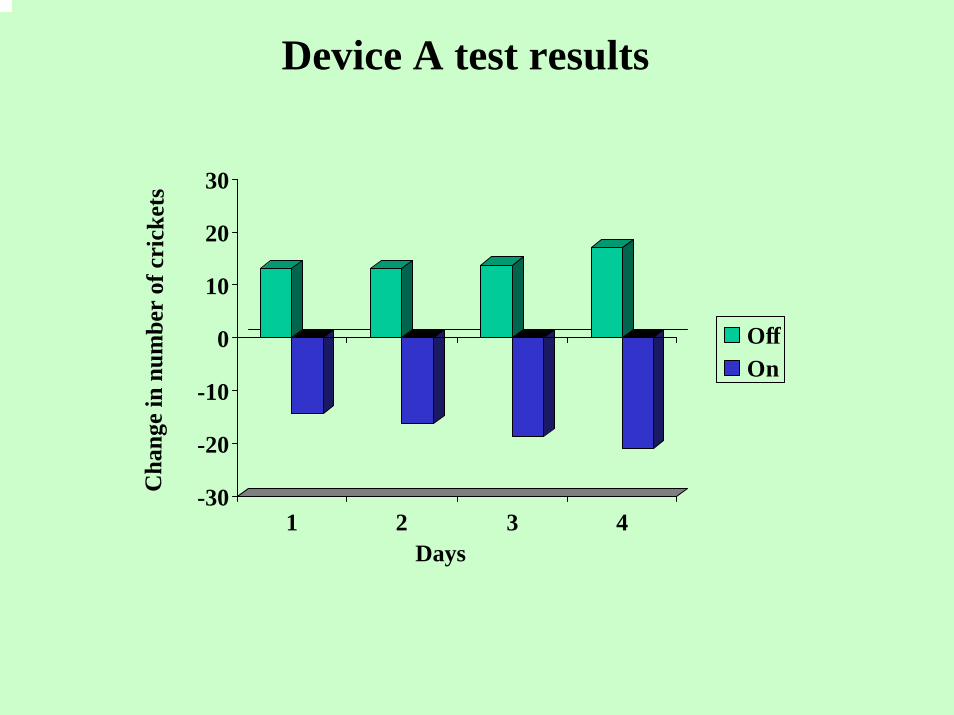
Device A test results
-30
-20
-10
0
10
20
30
1 2 3 4
Off On
Days
Cha
nge
in n
umbe
r o f
cr i
cke t
s
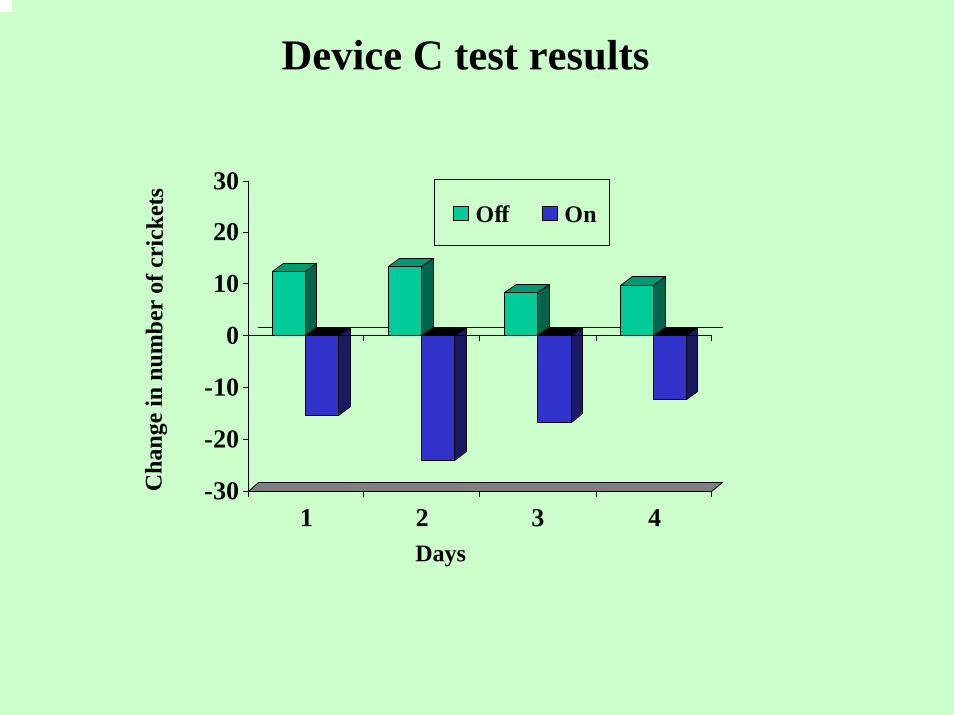
Device C test results

-30-25-20-15-10-505
1015202530
1 2 3 4
Off On
Days
Cha
nge
in n
umbe
r of
cri
cket
s
Device D test results

-30
-20
-10
0
10
20
30
1 2 3 4
Off On
Days
Device E test results
Cha
nge
in n
umbe
r of
cri
cket
s

-30
-20
-10
0
10
20
30
1 2 3 4
Off On
Days
Cha
nge
in n
umbe
r of
cr i
cke t
s
KSU device test results

Conclusions
• Devices A and C significantly repelled crickets. KSU unit repelled more crickets than A and C devices
• Device D and E performed poorly
Field Evaluation of three commercial Field Evaluation of three commercial ultrasonic devices in repelling flies and ultrasonic devices in repelling flies and
the eastern the eastern yellowjacket yellowjacket
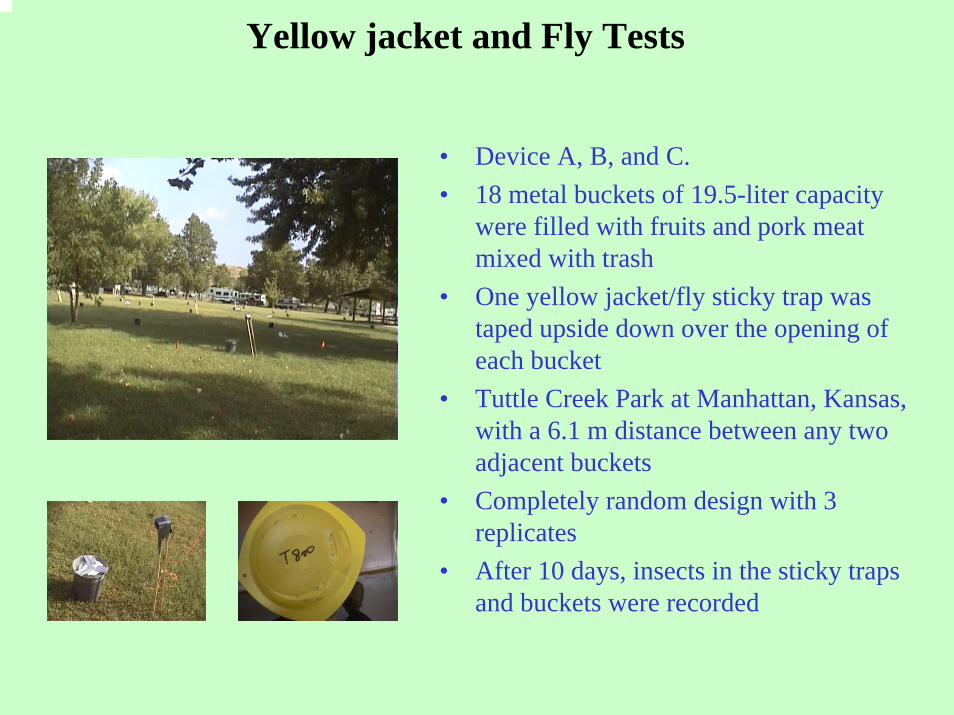
Yellow jacket and Fly Tests
• Device A, B, and C.• 18 metal buckets of 19.5-liter capacity
were filled with fruits and pork meat mixed with trash
• One yellow jacket/fly sticky trap was taped upside down over the opening of each bucket
• Tuttle Creek Park at Manhattan, Kansas, with a 6.1 m distance between any two adjacent buckets
• Completely random design with 3 replicates
• After 10 days, insects in the sticky traps and buckets were recorded
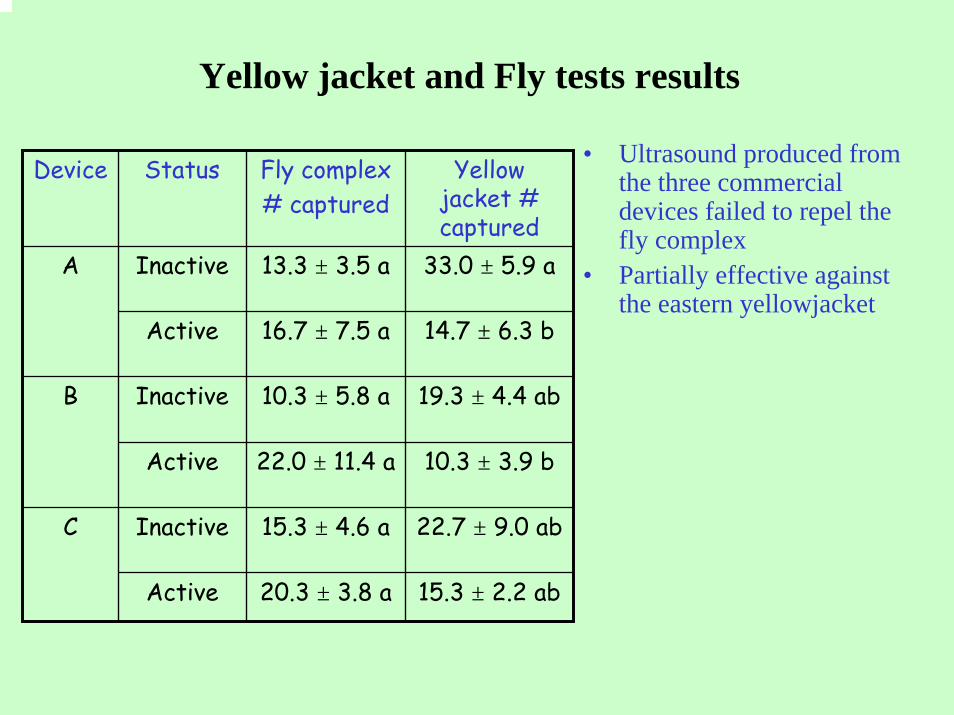
Yellow jacket and Fly tests results
Device Status Fly complex# captured
Yellow jacket # captured
Inactive 13.3 ± 3.5 a 33.0 ± 5.9 a
Active 16.7 ± 7.5 a 14.7 ± 6.3 b
Inactive 10.3 ± 5.8 a 19.3 ± 4.4 ab
Active 22.0 ± 11.4 a 10.3 ± 3.9 b
Inactive 15.3 ± 4.6 a 22.7 ± 9.0 ab
Active 20.3 ± 3.8 a 15.3 ± 2.2 ab
C
B
A
• Ultrasound produced from the three commercial devices failed to repel the fly complex
• Partially effective against the eastern yellowjacket

Ant tests
• Enclosure tests, similar to cockroach tests
• Open field test, similar as fly and yellow jacket tests
Enclosure test results
• No significant ant movement in the enclosures in the presence or absence of ultrasound
• Failed to repel ants

Open field test resultsTreatment Number of ants (Mean + SE)
Device StatusIn trap Inside trashcan Totala
A
B
C
Off
On
Off
On
Off
On
1.7 ± 1.7 8.0 ± 4.0 9.7 ± 5.7
3.3 ± 2.4 6.0 ± 5.5 9.3 ± 7.8
7.0 ± 7.0 7.0 ± 2.6 14.0 ± 7.0
2.0 ± 2.0 7.3 ± 2.6 9.3 ± 1.5
2.7 ± 2.7 10.0 ± 6.2 12.7 ± 8.8
14.3 ± 12.4 11.3 ± 7.0 25.7 ± 12.8
• Failed to repel ants in field trials
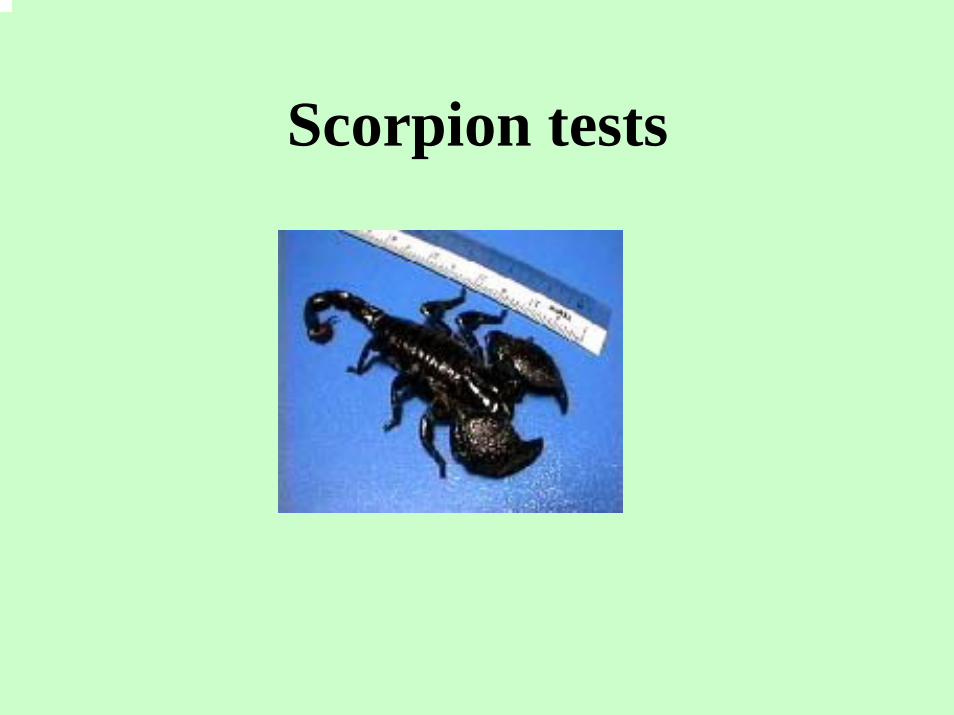
Scorpion tests

Scorpion test procedure
• Enclosure tests
• Imperil scorpion, Pandinus imperator
• Devices A and C
• For each ultrasonic device, 6 separate tests were conducted
• In each test, a scorpion (adult) was released into one of the paired enclosures and allowed to acclimate to the environment for 24 hours (day 0)
• After 24 h, the ultrasonic unit in one of the enclosures, in which the scorpion was located at that time was turned on for 7 days. The ultrasonic unit in the other enclosure remained off for the duration of the test
• The location of the scorpion was observed and recorded once a day

Scorpion test results
Device Status Times found in enclosure
(%)Inactive 68.4
Active 32.6
Inactive 68.4
Active 32.6
B
A
• The scorpions were more frequently found in the enclosure without ultrasound than in the enclosure with ultrasound
• 26 times the scorpions were located in the enclosure without ultrasound and only 12 times they were found in the enclosure with ultrasound across the six tests
• The limited data indicated that scorpions may respond to ultrasound produced by the two devices
Indian meal moth tests: effects on reproductive performance

• Device A and dKSU unit.• Paired plexiglass enclosures • 16 dishes or plastic sheets containing
diet were placed in the base of the enclosures
• 10 pairs of newly emerged adults were released in each enclosure
• One ultrasonic device was turned on all the time and the another one was kept off at the same time or without an ultrasonic unit
• IMM distributions were recorded once or twice a day
• Number of larvae was checked after 18-30 days
• Dead females dissected to count spermatophores

• 2 transducers in one enclosure connected to a rotating arm
• Initial settings:-- Min Quiet Time (ms): 50.00-- Max Quiet Time (ms): 500.00-- Min Pulse Time (ms): 50.00-- Max Pulse Time (ms): 200-- Min Step Size (Hz): 1000-- Max Step Size (Hz): 5000-- Amplitude: 2.25-- Frequency: 20,000-80,000 Hz
KSU unit

Indian meal moth test results, Device A
0
400
800
1200
1600
Off On
# la
rvae
/enc
losu
re
0
800
1600
2400
3200
4000
4800
Off On
Tot
al la
rval
wt /
en (m
g)
0
0.5
1
1.5
2
2.5
3
Off On
Lar
val w
t /L
arva
(mg)
0
0.5
1
1.5
2
2.5
Off On# sp
erm
atop
hore
s/fe
mal
e
Number of larvae (I), larval weight (II & III), and spermatophores (IV) of Indianmeal moth under ultrasound exposure emitted from Device A
I II
IVIII
a
aa
a
ba
bb

Indian meal moth test results, KSU device
0
400
800
1200
1600
2000
no unt On
# la
rvae
/enc
losu
re
0
2000
4000
6000
8000
No unit On
Tot
al la
rval
wt /
en (m
g)
00.5
11.5
22.5
3
3.54
4.55
No unit On
Lar
val w
t /L
arva
(mg)
0
0.5
1
1.5
2
2.5
No nuit On# sp
erm
atop
h ore
s/fe
mal
e
Number of larvae (I), larval weight (II & III), and spermatophores (IV) of Indianmeal moth under ultrasound exposure emitted from KSU unit
I II
IVIII
a
aa
a
b
a
bb

Conclusions
• 46% less number of larvae, and 57 % less total larval weight were observed
• A female had an average of 1.4 spermatophores under ultrasonic exposure compared to 2 spermatophores in the absence of ultrasound (control)
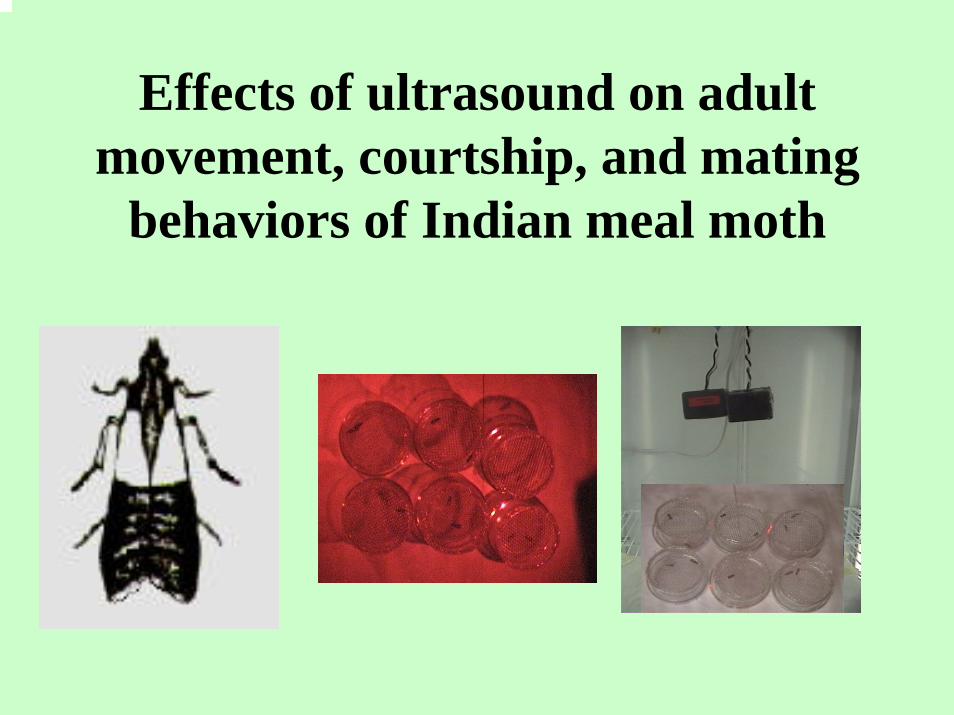
Effects of ultrasound on adult movement, courtship, and mating
behaviors of Indian meal moth

No.
mot
hs in
cal
ling
1
3
5
7
9
11
13
15
Without ultrasoundWith ultrasound
Time
0
2
4
6
8
10
12
14
Without ultrasoundWith ultrasound
21:00 23:00 1:00 3:00 5:00 7:00
Device A
KSU Unit
Results Female calling• Calling occurred at
night
• Less number of females were calling when exposed to ultrasound
• The difference was significant between 11:00 pm to 3:00 am

Adult movements• Very little movement on day 1 and during day time
• Most movement occurred at night
• No obvious difference between control and ultrasound exposed moths
Num
ber o
f ins
ects
0
2
4
6
8ControlDevice AKSU unit
0
2
4
6
8
0
24
6
8
02
46
8
0
2
4
6
8
17:00 19:00 21:00 23:00 1:00 3:00 5:00 7:00 9:00 11:00 13:00 15:00
Tim e (h)
Day 1
Day 5
Day 4
Day 3
Day 2

Day 1N
umbe
r of i
nsec
ts in
mat
ing
01234
ControlDevice AKSU unit
01234 Day 2
01234
01234
01234
ControlCix 0600KSU unit
Day 4
Day 3
Day 5
17:00 19:00 21:00 23:00 1:00 3:00 5:00 7:00 16:00
Time (h)
Mating activity• No mating occurred
during the day time
• Most matings occurred during the first night and between 9 pm and 11 pm
• No clear difference between control and under ultrasound exposed moths

0102030405060
Freq
uenc
y (%
)
0102030405060
Mating duration (min) < 30 min 30 - 60 60 - 90 90 - 120 > 120
0102030405060
• A pair mated 3 times during their life time
• Significantly less number of matings occurred under ultrasound exposures
• Most matings lasted for 30 to 90 min without ultrasound
• More matings lasted for less than 30 min or more than 90 min under ultrasound exposure
Without ultrasound
Device A
KSU unit
2.9 matings/female
2.1 matings/female
1.7 matings/female
Mating duration

0
1
2
3
Control Cix 0600 KSU Unit
No.
sper
mat
opho
res/
fem
ale A
BB
0
50
100
150
200
250
Control Cix 0600 KSU Unit
A
BC
No.
egg
s/fe
mal
e
50
60
70
80
90
100
Control Cix 0600 KSU Unit
AA
B
Egg
via
bilit
y (%
)
• Ultrasound had significant impact on spermatophore transfer, number of eggs laid, and egg viability
Spermatophore transfer and reproduction

Ultrasound as a pest exclusion method

Repellency test resultsDevice Status Without diet With diet
Enclosure A Enclosure B Enclosure A Enclosure B
Control 53.6 ± 6.5 a 53.4 ± 6.8 a 88.6 ± 5.5 a 93.6 ± 4.6 a
Device A A active 68.6 ± 3.2 a 71.8 ± 3.1 a 78.8 ± 11.4 a 107.0 ± 18.1 a
B active 72.0 ± 10.7 a 68.6 ± 3.5 a 124.0 ± 14.4 a 87.0 ± 18.0 a
KSU device A active 70.6 ± 7.8 a 61.6 ± 7.0 a 67.0 ± 7.9 b 98.0 ± 8.0 a
B active 113.8 ± 7.9 a 81.6 ± 4.1 b 109.6 ± 14.9 a 85.0 ± 101.5 a
• The number of moths found in the enclosures with ultrasonic units were consistently fewer than those found in enclosures without ultrasonic units
• For device A, this difference was not significant (P > 0.05).
• For the KSU device, the differences were significant at the 10% level; and 2 out the 4 treatment combinations were significant at the 5% level
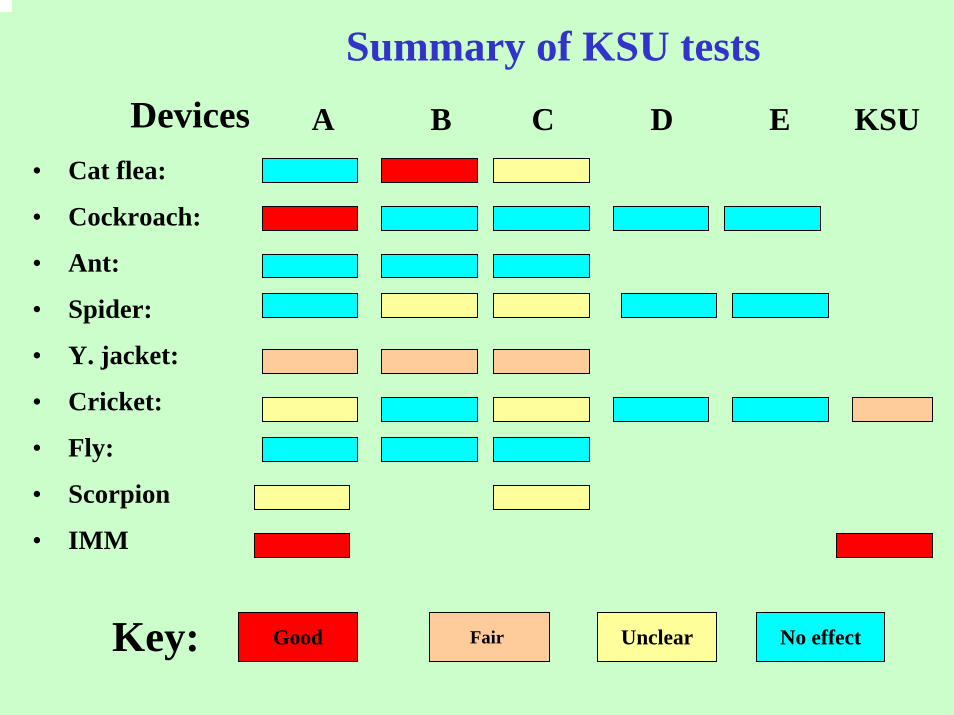
• Cat flea:
• Cockroach:
• Ant:
• Spider:
• Y. jacket:
• Cricket:
• Fly:
• Scorpion
• IMM
Key: Fair No effectUnclearGood
A B C D E KSUDevices
Summary of KSU tests
Overall Conclusions• The effectiveness of devices against arthropod
pests cannot be ascertained without testing specific ultrasonic units
• Effectiveness varies with the protocol used• Most tests are not done under “real world”
conditions (background noises!)• Repellency may not be the only criteria to
evaluate effectiveness of ultrasonic units• Best results were obtained with a tympanate moth

Future research needs• Need to develop protocols for evaluating devices that reflect the
“real world”• Are devices being used for preventing or repelling infestations?• Combination treatments should be explored
– Light + ultrasound; ultrasonic barriers; ultrasound and attractants (push-pull strategy)
• Can environmental conditions within homes be altered for better performance of these devices?
• Need electrophysiological assays to ascertain effects (also for quick screening)
• Need to explore frequency ranges and pulse durations that give the best response (e.g., ranges above 45 kHz)
• May not have a promising future if existing devices are not improved through scientific and market research
