ultrafast excited-state dynamics of donor acceptor biaryls ... · pdf filecomparison between...
TRANSCRIPT

Ultrafast Excited-State Dynamics of Donor−Acceptor Biaryls:Comparison between Pyridinium and Pyrylium PhenolatesRomain Letrun,† Marius Koch,† Marina L. Dekhtyar,‡ Vladimir V. Kurdyukov,‡ Alexei I. Tolmachev,‡
Wolfgang Rettig,§,* and Eric Vauthey†,*†Department of Physical Chemistry, University of Geneva, 30 quai Ernest-Ansermet, CH-1211 Geneva 4, Switzerland‡Institute of Organic Chemistry, National Academy of Sciences of Ukraine, Murmanskaya str. 5, Kiev, 02094, Ukraine§Institut fur Chemie der Humboldt-Universitat Berlin, Brook-Taylor-Strasse 2, D-12489 Berlin, Germany
*S Supporting Information
ABSTRACT: The excited-state dynamics of two donor−accept-or biaryls that differ by the strength of the acceptor, a pyridiniumor a pyrylium moiety, have been investigated using a combinationof steady-state solvatochromic absorption, ultrafast fluorescence,as well as visible and infrared transient absorption spectroscopies.The negative solvatochromic behavior of pyridinium phenolateindicates that the permanent electric dipole moment experiencesa decrease upon S1 ← S0 excitation, implying that the groundstate possesses more zwitterionic character than the excited state.In contrast, pyrylium phenolate exhibits a weakly positivesolvatochromic behavior corresponding to a small increase inthe dipole moment upon excitation, implying more zwitterioniccharacter in the excited than the ground state. Both compoundsare therefore situated at different sides of the cyanine-limit structure, which has equally polar ground and excited states. Despitethese differences, both molecules exhibit qualitatively similar excited-state properties. They are characterized by a very shortfluorescence lifetime, increasing from about 1 to 20 ps, when varying solvent viscosity from 0.4 to 11 cP. There are, however,characteristic differences between the two compounds: The excited-state lifetimes of the pyrylium dye are shorter and alsodepend somewhat on polarity. The ensemble of spectroscopic data can be explained with a model where the emitting Franck−Condon excited state relaxes upon twisting around the single bond between the aryl units to a point where the excited- andground-state surfaces are very close or intersect. After internal conversion to the ground state, the distorted molecule relaxes backto its equilibrium planar configuration, again largely dependent upon solvent viscosity. However, in this case, the kinetics for thepyrylium dye are slower than for the pyridinium dye and the polar solvent-induced acceleration is significantly stronger than inthe excited state. This difference of kinetic behavior between the two compounds is a direct consequence of the change of theelectronic structure from a normal to an overcritical merocyanine evidenced by steady-state spectroscopy.
■ INTRODUCTION
Donor−acceptor biaryls are push−pull molecules that, becauseof their large hyperpolarizability, offer promising perspectivesfor the development of nonlinear optical materials.1−6 For suchapplications, a deep understanding of the structure-propertiesrelationship is required. Betaine-30, also known as Reichardt’sdye, is the most famous example of this family. Its renowncomes from the huge solvent dependence of its S1 ← S0transition energy, which is being used as the ET(30) empiricalpolarity scale.7 This very large solvatochromism arises from thezwitterionic character of its ground state and from the smallelectric dipole moment of its S1 state, resulting in a strongcharge-transfer character of this transition, the phenolate andpyridinium units acting as electron donor and acceptor,respectively. The lack of fluorescence of betaine-30 hasattracted the attention of several groups, which haveinvestigated its excited-state dynamics by ultrafast optical
spectroscopy and quantum chemistry calculations.8−15 Forexample, Barbara and co-workers have rationalized the transientabsorption dynamics measured at a single wavelength with amodel where the nonradiative deactivation of the excited stateis a charge separation process whose dynamics is entangledwith that of solvent relaxation.8−10 The slowing down of thedynamics observed by decreasing temperature and going fromethanol to longer alcohols was explained in terms of longersolvent relaxation times. Subsequent investigations by Ernstingand co-workers using broadband transient absorption revealedcomplex dynamics that could not be fully captured by previoussingle wavelength experiments and evidenced the importance ofstructural rearrangements.12 Indeed, the excited-state dynamics
Received: September 27, 2013Revised: November 16, 2013Published: November 19, 2013
Article
pubs.acs.org/JPCA
© 2013 American Chemical Society 13112 dx.doi.org/10.1021/jp409646g | J. Phys. Chem. A 2013, 117, 13112−13126

of betaine-30 involves conformational changes during itsevolution from the Franck−Condon excited state populatedupon photoexcitation to a twisted relaxed excited state,characterized by a close to 90° dihedral angle between thedonor and acceptor rings, that decays to the unrelaxed groundstate, itself reverting to the original planar conformation. Asimilar behavior has been observed with various zwitterionicpyridinium phenolates and with their cationic phenol counter-parts.16,17 It has been shown that it is possible to modulate theexcited-state dynamics of these molecules by using sterichindrance to introduce a twist in their ground-statestructure.16,17 Increasing the pretwist leads to a shortening ofthe excited-state lifetime as the Franck−Condon excited-statestructure is getting more similar to that of the twisted relaxedexcited state.In this contribution, we report on our investigation of the
excited-state dynamics of two newly synthesized donor−acceptor biaryl systems that are characterized by bulkysubstituents and by a difference in their acceptor strength(Scheme 1) using a combination of steady-state and femto-second time-resolved spectroscopic techniques covering thevisible and infrared domains, and quantum chemical calcu-lations. The main aim of this study was to investigate the effectof the donor−acceptor strength that increases when going frompyridinium (1) to pyrylium phenolate (2) on the excited-statedynamics of donor−acceptor biaryl systems. We will show thattheir different donor−acceptor strength leads to substantialdissimilarities in the nature of both the ground and excitedstates. As a result, the excited-state dynamics of the structuralchanges, though dominated by similar steric parameters,quantitatively differs for the two compounds.
■ EXPERIMENTAL SECTION
Synthesis of the dyes. 2,6-Di-tert-butyl-4-(1-methyl-2,6-diphenylpyridinium-4-yl)benzenolate (1). To a solution of0.322 g (0.6 mmol) of 4-(3,5-di-tert-butyl-4-hydroxyphenyl)-2,6-diphenylpyrylium perchlorate18 in 2 mL of acetonitrile, 1.5mL of a methanol solution of methylamine was added. Afterheating at 80 °C for 1 h and cooling, the salt was precipitatedby a saturated aqueous solution of sodium perchlorate, filtered,washed with water, and dissolved in acetonitrile. Then 1 mL oftriethylamine was added, and the mixture was stirred for 10 minand poured into 120 mL of water. After 12 h, the precipitatewas filtered, washed with water, and dried. The product waspurified by column chromatography on alumina from chloro-form. Crystallized from acetonitrile. Yield: 0.124 g (46%). Mp:259−262 °C. λmax (ε × 10−4 M−1 cm−1) in CH3CN: 274(1.41);
517(5.72). 1H NMR in CDCl3, δ, ppm: 1.389 (s, 18H, t-Bu);3.187 (s, 3H, NMe); 7.070 (s, 2H, β-H); 7.437 (s, 2H, β′-H);7.453−7.500 (m, 4H, Ar−H); 7.551−7.572 (m, 6H, Ar−H).Anal. Found: C, 85.26; H, 7.75; N, 3.19. Calcd for C32H35NO:C, 85.48; H, 7.85; N, 3.12. m/z = [M + 1]+ = 450.3; m/z = [M+ 2]+ = 451.2; calculated for C32H35NO, 449.27; found, 449.3.
2,6-Di- tert -buty l -4- (2 ,6-diphenylpyry l ium-4-y l ) -benzenolate (2). To a solution of 0.322 g (0.6 mmol) of 4-(3,5-di-tert-butyl-4-hydroxyphenyl)-2,6-diphenylpyrylium per-chlorate18 in 6 mL of acetonitrile, 1 mL of triethylamine wasadded. The reaction mixture was stirred for 10 min and pouredinto 120 mL of water. After 12 h, the precipitate was filtered,washed with water, and dried. The dye was purified by columnchromatography on alumina from chloroform. Crystallizedfrom acetonitrile. Yield: 0.194 g (74%). Mp: 248−250 °C. λmax(ε × 10−4 M−1 cm−1) in CH3CN: 323 (1.83); 482 (3.72); 510(4.04); 550 (2.48, shoulder). 1H NMR in acetone-d6, δ, ppm:1.319 (s, 18H, t-Bu); 7.508−7.542 (m, 6H, Ar−H); 7.589 (s,2H, β-H); 7.667 (s, 2H, β′-H); 8.010−8.042 (m, 4H, Ar−H).Anal. Found C, 85.07; H, 7.29. Calcd for C31H32O2: C, 85.26;H, 7.39. m/z = [M + 1]+ = 437.3; calculated for C31H32O2,436.27; found, 436.3.
Solvents. The solvents, acetonitrile (ACN, Roth, ≥99.9%),ethanol (EtOH, Fluka, ≥99.8%), 1-pentanol (PeOH, Sigma-Aldrich, ≥99%), 1-octanol (OcOH, Fluka, ≥99.5%), 1-decanol(DeOH, Alfa Aesar, ≥98%), tetrahydrofuran (THF, Sigma-Aldrich, ≥99.9%), chloroform (CHCl3, Sigma-Aldrich, ≥99%),diethyl ether (Et2O, Sigma-Aldrich, ≥99.8%), dibutyl ether(Bu2O, Acros Organics, ≥99%), cyclohexane (CHX, AcrosOrganics, ≥99.5%) and dodecane (DD, Acros Organics, ≥99%)were used as received.
Steady-State Spectroscopy. Electronic absorption spectrawere recorded on a Cary 50 spectrophotometer.
Fluorescence Up-Conversion (FU). The up-conversionsetup has been described in detail previously.16,19 Excitationwas performed at 500 nm using the frequency doubled outputof a Kerr lens mode locked Ti:sapphire laser (Mai Tai HP,Spectra Physics). The polarization of the pump pulses was atmagic angle relative to that of the probe pulses at 1000 nm. Thepump intensity on the sample was about 5 μJ cm−2 and the fullwidth at half-maximum (fwhm) of the instrument responsefunction was ca. 230 fs. The samples were placed in a 0.4 mmrotating cell and had an absorbance between 0.2 and 0.5 at theexcitation wavelength. No sample degradation was observedthroughout the measurements.
Visible Transient Absorption (TA). The femtosecondvisible TA setup has been described in detail previously.20,21
Scheme 1. Structure of the Pyridinium Phenolate (1), Its Desphenyl Analogue (1a), and Pyrylium Phenolate (2)a
aThe structure of betaine-30 is also given for comparison.
The Journal of Physical Chemistry A Article
dx.doi.org/10.1021/jp409646g | J. Phys. Chem. A 2013, 117, 13112−1312613113

Excitation was carried out at 500 or 520 nm with a home-builttwo-stage noncollinear optical parametric amplifier. The pumpintensity on the sample was about 1 mJ cm−2. The polarizationof the pump pulses was at magic angle relative to that of theprobe pulses. All spectra were corrected for the group velocitydispersion of the white light continuum. The fwhm of theresponse function was ca. 200 fs. The samples were located in a1 mm quartz cell, continuously stirred by nitrogen bubbling,and their absorbance was between 0.2 and 0.5 at the excitationwavelength. No significant degradation of the samples wasobserved throughout the measurements.Infrared Transient Absorption (IR TA). The femtosecond
visible pump/mid-IR probe transient absorption setup is basedon an amplified Ti:sapphire system (800 nm, 1 kHz repetitionrate and 100 fs pulse width, Solstice, Spectra Physics). Part ofthis output was frequency doubled to provide pump pulses at400 nm with an energy between 2 and 4 μJ. The pulses werefocused to a 300 μm diameter spot on the sample. Another partof the amplifier output was used to pump an optical parametricamplifier (TOPAS-C, Light Conversion), whose output wasdifference-frequency mixed (NDFG module, Light Conver-sion) to generate mid-IR probe pulses centered at 6.21 μm witha width of 400 nm. The horizontally polarized mid-IR pulseswere split into two and focused to a 140 μm diameter spot onthe sample. One of the mid-IR beams was overlapped with thepump beam at magic angle, whereas the second one was used asreference beam. Both probe beams were dispersed with aspectrograph (Triax 190, 150 lines/mm, Horiba) equipped witha liquid nitrogen cooled 2 × 64 element MCT array (InfraredSystems Development) giving a resolution of 1−2 cm−1. Thesample area and the detection system were located in a box thatwas purged with dry air for at least 45 min before eachexperiment. Throughout the measurements, every secondpump pulse was blocked and the average of 5000 signal shotswas taken to collect one data point. At least 15 measurementsfor each system were averaged to reconstruct the spectra. Toprovide a new sample solution for each shot, a flow cell asdescribed in ref 22 was used. The absorbance at the excitationwavelength was below 0.15 on 200 μm, the sample cellthickness.Quantum Chemistry Calculations. Ground-state gas-
phase geometry optimization was performed at the densityfunctional level of theory (DFT) using the CAM-B3LYPfunctional and the cc-pVDZ basis set. Electronic verticalexcitation energies were computed with time-dependentdensity functional theory (TD-DFT) using the same functionaland basis set. The calculations were carried out using theGaussian 09 package.23
■ RESULTSSteady-State Spectroscopy. The stationary electronic
absorption spectra of 1 and 2 in solvents of varying polarity areshown in Figure 1. The absorption spectrum of 1 in the visibleregion consists of a single broad band with a maximum between510 and 535 nm. The shape of this band that can be ascribed tothe S1 ← S0 transition exhibits a significant solvent dependence:it is broad and structureless in CHX and becomes structuredwith a ∼1300 cm−1 vibrational progression in low polaritysolvents, such as Et2O and CHCl3. The relative intensity of the0−0 vibronic band decreases considerably when increasingsolvent polarity further. In polar solvents, i.e., EtOH and ACN,the vibronic structure is no longer visible and the band is abouttwice as narrow as in CHX. The apparent solvatochromic
behavior of the absorption maximum for 1 is complicated, firstpositive and then negative, corresponding first to a red shiftupon increasing the dielectric constant of the solvent, and thento a blue shift when going to the most polar solvents (Table 1).
Relying on band maxima only is dangerous and can lead toincorrect conclusions if the spectral shape changes with solventpolarity. This problem can be avoided by using instead the 0−0transition energy, ν00. To determine ν00 and its solventdependence, the band shape was analyzed using a sum ofGaussian functions. A plot of the so-obtained 0−0 transitionenergy vs. [f(εs) − f(n2)], where f(x) = (x − 1)/(x + 2) and εsand n are the static dielectric constant and the refractive index,respectively, exhibits a reasonably linear dependence with aslope of 1605 ± 165 cm−1 for compound 1, indicating amoderately negative solvatochromic behavior, i.e. a blue shiftupon increasing solvent polarity, in the whole range of solvent
Figure 1. Absorption spectra of 1 (A) and 2 (B) in various solvents.The labels (b) and (a) refer to basic and acidic forms, respectively.
Table 1. Solvent Dielectric Constant (εs)a, Viscosity (η/
cP)a, Absorption Maximum (νmax/103 cm−1), and 0−0
Absorption Maximum (ν00/103 cm−1) Obtained from
Bandshape Analysis
1 2
solvent εs η νmax ν00 νmax ν00
dodecane (DD) 2.01 1.38 19.5 18.1 21.2 18.4cyclohexane (CHX) 2.02 0.89 19.6 18.2 21.2 18.5dibutyl ether (Bu2O) 3.08 0.64 19.5 18.2 21.1 18.4diethyl ether (Et2O) 4.27 0.22 18.8 18.8 20.0 18.6chloroform (CHCl3) 4.81 0.54 18.7 18.7 19.5 18.1tetrahydrofuran (THF) 7.52 0.46 18.8 18.8 19.6 18.3decanol (DeOH) 7.93 10.9 18.8 18.8 19.4 18.0octanol (OcOH) 10.30 7.3 18.9 18.9 19.7 18.4pentanol (PeOH) 15.13 3.6 19.0 19.0 19.4 18.0ethanol (EtOH) 25.30 1.08 19.3 19.3 19.4 18.1acetonitrile (ACN,basic)
36.64 0.37 19.3 19.3 19.5 18.2
acetonitrile (acidic) 36.64 0.37 28.0 28.0 23.2 21.9aFrom ref 26.
The Journal of Physical Chemistry A Article
dx.doi.org/10.1021/jp409646g | J. Phys. Chem. A 2013, 117, 13112−1312613114

polarities (Figure S1, Supporting Information). Such a behavioris indicative of a reduction of the dipole moment uponphotoexcitation and is typical for molecules with a predom-inantly zwitterionic ground state.7,24
The negative solvatochromism of 1 is much weaker than thatof betaine-30, for which the slope of the transition energy vs[f(εs)-f(n
2)], determined with the same solvents, amounts to10060 ± 1700 cm−1. It is also substantially smaller than for 1a,the analogue of 1 without the two phenyl substituents, forwhich a solvatochromic slope of 2400 cm−1 has beenreported.25
The absorption spectrum of 1 in EtOH and other proticsolvents exhibits a second, less intense, band at ∼370 nm,which is assigned to the protonated form, H-1, of 1. Indeed,addition of NaOH to the solution (100 μL 1 M NaOH in 3mL) leads to the suppression of this band. On the other hand,addition of HCl to an ACN solution of 1 (100 μL 1 M HCl in 3mL) results in a totally new absorption spectrum with a broadband culminating around 360 nm. Protonation of the phenolatemoiety diminishes its electron-donating ability and conse-quently leads to a blue shift of the absorption transition asoutlined in detail in the discussion section.Only very weak stationary fluorescence with a quantum yield
below 10−4 was measured for 1. The fluorescence band is verybroad and unstructured and extends from ∼570 to 800 nm inCHX (Figure S2). As will be shown below, this very smallfluorescence quantum yield is due to the ultrafast decay of theemitting population. The solvatochromism of the fluorescencewas not investigated because a large fraction of the emissionoccurs from the nonrelaxed excited state (see below).The absorption spectrum of 2 consists of two bands, with the
most intense one around 500 nm assigned to the S1 ← S0transition and a further band around 320 nm. Contrary to 1,the vibrational progression can be easily observed in allsolvents. This makes it easy to see that the relative intensity ofthe vibronic bands depends on the solvent, with the 0−0 bandrising in relative intensity for an increase of polarity. The S1 ←S0 band maximum coincides with the second vibronic transition(1−0 band) in polar solvents and with the third one in the lesspolar solvents. This suggests substantial variation of theFranck−Condon factor with solvent polarity that could beindicative of a solvent dependence of the ground-state structurelike, e.g., a more quinoid structure in nonpolar and low tomedium polarity solvents and an equalized-bond structure insolvents of high polarity. Bandshape analysis using a sum ofGaussian functions reveals that the S1 ← S0 0−0 transitionenergy, ν 00, decreases only weakly with increasing the dielectricconstant of the solvent (weak positive solvatochromism). Theplot of ν 00vs [f(εs)-f(n2)] shows a substantial scattering and alinear fit yields a slope of −539 ± 216 cm−1 (Figure S1,Supporting Information). Therefore, compounds 1 and 2exhibit an opposite solvatochromism. Whereas the ground stateof 1 is predominantly zwitterionic, that of 2 is rather non polar.These aspects will be discussed in more detail below using thecyanine limit model.27
The absorption band of the protonated form of 2, H-2, peaksat 430 nm, i.e., is closer to the band of the phenolate form thanin the case of 1. This smaller energy difference between theacidic and basic forms of 2 is in agreement with the strongeracceptor character of the pyrylium moiety, as will be outlinedbelow. Like for 1, only very weak emission was found with 2(Figure S3), indicative of the existence of very efficientnonradiative deactivation pathways of the excited state.
Time-Resolved Fluorescence. Figure 2 shows fluores-cence time profiles recorded at various wavelengths with 1 in
ACN. These profiles could be analyzed globally using the sumof two exponential functions with 0.43 and 1.2 ps timeconstants and with the amplitudes illustrated in the inset ofFigure 2. The amplitude of the short component decreasesstrongly with increasing wavelength and almost vanishes at 650nm, suggesting a dynamic red shift of the emission band. Noreliable time profile above 650 nm, where a 0.43 ps risingcomponent could be anticipated, could be recorded because ofthe weakness of the signal. Such a rise time combined with afast decay time, i.e., 1.2 ps, could explain the weakness of theFU signal. As a consequence, the short time constant isassigned to a dynamic Stokes shift due to solvent relaxation,whereas the longer time constant is ascribed to the decay of thepopulation of the emitting state. This interpretation issupported by the charge-transfer character of the transitionand by the similarity of the 0.43 ps time constant with that of0.63 ps reported for the diffusive solvation time of ACN.28 Aqualitatively similar behavior was measured with 2 in ACN witha 0.39 ps component decreasing in relative amplitude withincreasing wavelength, ascribed to solvent relaxation as well,and a 0.83 ps component, assigned to population decay. Giventhat excitation was performed above the 0−0 transition,vibrational relaxation most probably also contributes to theobserved fluorescence time profiles.29 However, its dynamicsdoes not differ enough from those of solvation and populationrelaxation to be properly disentangled.Similar measurements with both 1 and 2 were performed in
other solvents of varying polarity and viscosity (Figure 3). Foreach solvent, the time profiles recorded at 3 to 5 differentwavelengths were analyzed globally and could be wellreproduced using the sum of two or three exponentialfunctions, with the time constants listed in Table 2. Innonpolar solvents, the fluorescence dynamics of both 1 and 2exhibited a subpicosecond component with an amplitudedecreasing with increasing wavelength. As nonpolar solvation isknown to cause minor spectral dynamics, this short componentis ascribed to vibrational relaxation. A dynamic Stokes shift wasobserved with 1 and 2 in all polar solvents. In the long alcohols,PeOH to DeOH, this process was found to be biphasic with 1,with time constants in good agreement with the solvation timesreported in the literature.28 Because of the shorter excited-state
Figure 2. Fluorescence time profiles measured with 1 in ACN atseveral wavelengths and best multiexponential global fits (solid lines).Inset: wavelength dependence of the amplitudes associated with thefast (0.43 ps) and with the slow (1.2 ps) components.
The Journal of Physical Chemistry A Article
dx.doi.org/10.1021/jp409646g | J. Phys. Chem. A 2013, 117, 13112−1312613115
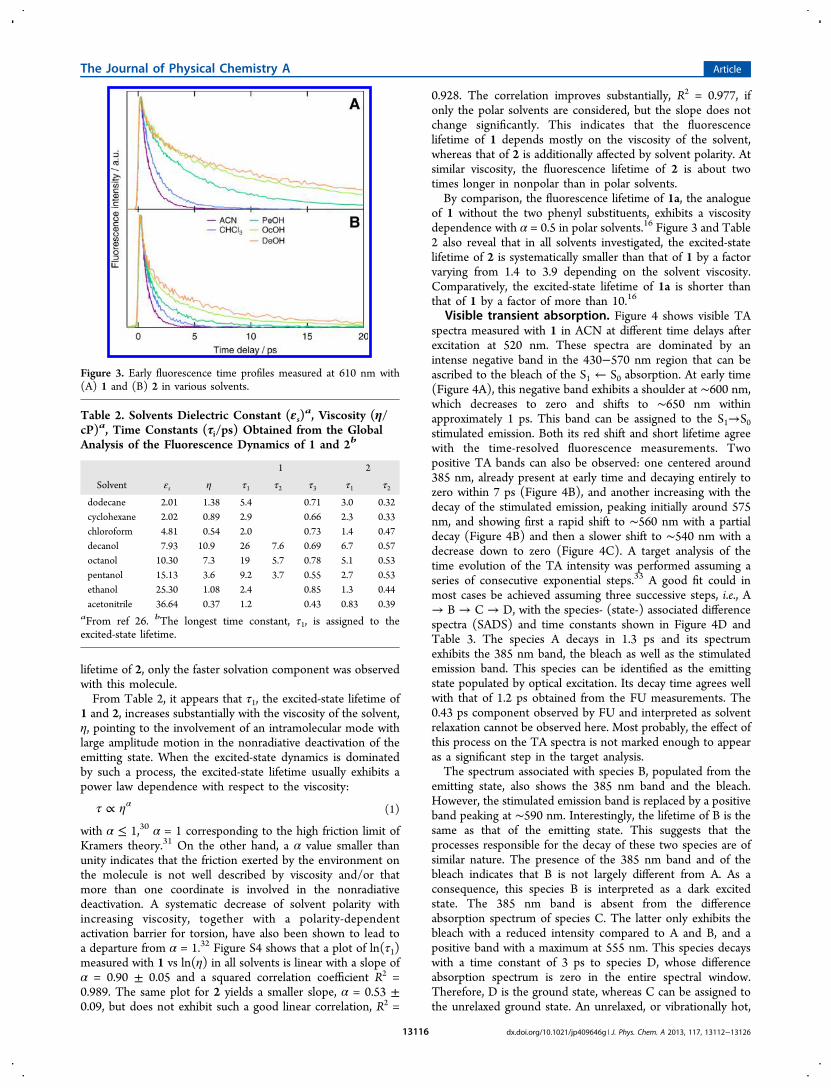
lifetime of 2, only the faster solvation component was observedwith this molecule.From Table 2, it appears that τ1, the excited-state lifetime of
1 and 2, increases substantially with the viscosity of the solvent,η, pointing to the involvement of an intramolecular mode withlarge amplitude motion in the nonradiative deactivation of theemitting state. When the excited-state dynamics is dominatedby such a process, the excited-state lifetime usually exhibits apower law dependence with respect to the viscosity:
τ η∝ α(1)
with α ≤ 1,30 α = 1 corresponding to the high friction limit ofKramers theory.31 On the other hand, a α value smaller thanunity indicates that the friction exerted by the environment onthe molecule is not well described by viscosity and/or thatmore than one coordinate is involved in the nonradiativedeactivation. A systematic decrease of solvent polarity withincreasing viscosity, together with a polarity-dependentactivation barrier for torsion, have also been shown to lead toa departure from α = 1.32 Figure S4 shows that a plot of ln(τ1)measured with 1 vs ln(η) in all solvents is linear with a slope ofα = 0.90 ± 0.05 and a squared correlation coefficient R2 =0.989. The same plot for 2 yields a smaller slope, α = 0.53 ±0.09, but does not exhibit such a good linear correlation, R2 =
0.928. The correlation improves substantially, R2 = 0.977, ifonly the polar solvents are considered, but the slope does notchange significantly. This indicates that the fluorescencelifetime of 1 depends mostly on the viscosity of the solvent,whereas that of 2 is additionally affected by solvent polarity. Atsimilar viscosity, the fluorescence lifetime of 2 is about twotimes longer in nonpolar than in polar solvents.By comparison, the fluorescence lifetime of 1a, the analogue
of 1 without the two phenyl substituents, exhibits a viscositydependence with α = 0.5 in polar solvents.16 Figure 3 and Table2 also reveal that in all solvents investigated, the excited-statelifetime of 2 is systematically smaller than that of 1 by a factorvarying from 1.4 to 3.9 depending on the solvent viscosity.Comparatively, the excited-state lifetime of 1a is shorter thanthat of 1 by a factor of more than 10.16
Visible transient absorption. Figure 4 shows visible TAspectra measured with 1 in ACN at different time delays afterexcitation at 520 nm. These spectra are dominated by anintense negative band in the 430−570 nm region that can beascribed to the bleach of the S1 ← S0 absorption. At early time(Figure 4A), this negative band exhibits a shoulder at ∼600 nm,which decreases to zero and shifts to ∼650 nm withinapproximately 1 ps. This band can be assigned to the S1→S0stimulated emission. Both its red shift and short lifetime agreewith the time-resolved fluorescence measurements. Twopositive TA bands can also be observed: one centered around385 nm, already present at early time and decaying entirely tozero within 7 ps (Figure 4B), and another increasing with thedecay of the stimulated emission, peaking initially around 575nm, and showing first a rapid shift to ∼560 nm with a partialdecay (Figure 4B) and then a slower shift to ∼540 nm with adecrease down to zero (Figure 4C). A target analysis of thetime evolution of the TA intensity was performed assuming aseries of consecutive exponential steps.33 A good fit could inmost cases be achieved assuming three successive steps, i.e., A→ B → C → D, with the species- (state-) associated differencespectra (SADS) and time constants shown in Figure 4D andTable 3. The species A decays in 1.3 ps and its spectrumexhibits the 385 nm band, the bleach as well as the stimulatedemission band. This species can be identified as the emittingstate populated by optical excitation. Its decay time agrees wellwith that of 1.2 ps obtained from the FU measurements. The0.43 ps component observed by FU and interpreted as solventrelaxation cannot be observed here. Most probably, the effect ofthis process on the TA spectra is not marked enough to appearas a significant step in the target analysis.The spectrum associated with species B, populated from the
emitting state, also shows the 385 nm band and the bleach.However, the stimulated emission band is replaced by a positiveband peaking at ∼590 nm. Interestingly, the lifetime of B is thesame as that of the emitting state. This suggests that theprocesses responsible for the decay of these two species are ofsimilar nature. The presence of the 385 nm band and of thebleach indicates that B is not largely different from A. As aconsequence, this species B is interpreted as a dark excitedstate. The 385 nm band is absent from the differenceabsorption spectrum of species C. The latter only exhibits thebleach with a reduced intensity compared to A and B, and apositive band with a maximum at 555 nm. This species decayswith a time constant of 3 ps to species D, whose differenceabsorption spectrum is zero in the entire spectral window.Therefore, D is the ground state, whereas C can be assigned tothe unrelaxed ground state. An unrelaxed, or vibrationally hot,
Figure 3. Early fluorescence time profiles measured at 610 nm with(A) 1 and (B) 2 in various solvents.
Table 2. Solvents Dielectric Constant (εs)a, Viscosity (η/
cP)a, Time Constants (τi/ps) Obtained from the GlobalAnalysis of the Fluorescence Dynamics of 1 and 2b
1 2
Solvent εs η τ1 τ2 τ3 τ1 τ2
dodecane 2.01 1.38 5.4 0.71 3.0 0.32cyclohexane 2.02 0.89 2.9 0.66 2.3 0.33chloroform 4.81 0.54 2.0 0.73 1.4 0.47decanol 7.93 10.9 26 7.6 0.69 6.7 0.57octanol 10.30 7.3 19 5.7 0.78 5.1 0.53pentanol 15.13 3.6 9.2 3.7 0.55 2.7 0.53ethanol 25.30 1.08 2.4 0.85 1.3 0.44acetonitrile 36.64 0.37 1.2 0.43 0.83 0.39
aFrom ref 26. bThe longest time constant, τ1, is assigned to theexcited-state lifetime.
The Journal of Physical Chemistry A Article
dx.doi.org/10.1021/jp409646g | J. Phys. Chem. A 2013, 117, 13112−1312613116

ground state is characterized by a positive band located on thered edge of the bleach,35,36 and is generally observed when thenonradiative deactivation of an excited to the ground stateoccurs on a faster or similar time scale than that of relaxation.The TA spectra recorded with 1 in other solvents are
qualitatively similar to those in ACN, the main difference beingthe time scale of the spectral evolution. In all solventsinvestigated, these TA spectra could also be analyzed using asequential reaction scheme, with the time constants listed inTable 3. In EtOH, the SADS are mostly the same as in ACNand thus the A−D species can be interpreted alike. In thelonger alcohols, i.e., PeOH and DeOH, the spectra of A and Bcontain the stimulated emission band, that of A being blue-shifted relative to that of B. Moreover, no species without thestimulated emission band but with the 385 nm band could beobserved. Therefore, in these two solvents, A is interpreted asthe emitting state prior to solvent relaxation, B as the solvatedemitting state and C as the unrelaxed ground state. The absenceof a dark excited species could be explained by a decay shorterthan its formation. The solvation times as well as the lifetimesof the emitting state populations differ from those obtainedfrom the analysis of the FU data, but their orders of magnitude
are similar. This difference most certainly arises from thecrudeness of the model used for the analysis, which assumesthat each species is in quasi-equilibrium and follows a first orderkinetics. This is of course not the case here, as populationtransfer occurs on similar time scales as solvent and vibrationalrelaxation. As these phenomena appear differently in FU and inTA, their relative contribution to a given time constant in ananalysis assuming exponential dynamics may differ. As aconsequence, a time constant assigned here as a populationdecay may also be partially due to a relaxation process with anamount that might depend on whether it has been extractedfrom fluorescence or TA data.In nonpolar solvents, species A and B also show the
stimulated emission band. In this case, however, the transitionfrom A to B is not ascribed to solvent relaxation but tovibrational relaxation as discussed above.Figure 5 shows TA spectra recorded with 2 in ACN at
different time delays after 500 nm excitation. These spectra aresimilar to those recorded with 1, the main difference being thevibrational structure of the bleach and the more intensestimulated emission band. These spectra could also be analyzedwith the three consecutive steps, the SADS being shown in
Figure 4. (A−C) Visible TA spectra measured with 1 in ACN and (D) species-associated difference absorption spectra obtained from target analysis.The dashed black line and the dashed gray line represent the scaled stationary absorption and stimulated emission spectra (calculated by multiplyingthe stationary fluorescence intensity by λ4),34 respectively.
Table 3. Time Constants (τXY/ps) Obtained from the Target Analysis of the Visible and IR TA Spectra Measured with 1 and 2Assuming 3 or 4 Successive Exponential Stepsb
1 2
solvent τAB τBC τCD τDE τAB τBC τCD τDE
dodecane 0.85 2.6 13 0.59 2.5 ∼42cyclohexane 0.96 1.6 5.4 0.58 1.9 6.8 ∼27decanol 1.9 15 48 0.43 3.1 14 109a
pentanol 2.5 6.3 21 0.56 2.1 8.6 19a
ethanol 1.0 3.5 6.2 0.92 0.92 7.1acetonitrile 1.3 1.3 3.0 41a 0.72 0.72 4.3 21a
aPresent in the IR TA data only. bThe time constants obtained from visible TA data were kept fixed for the analysis of the IR TA data. Theinterpretation of the time constants is also indicated: bold, emissive excited-state lifetime; italic, time constant of ground-state relaxation by back-twist; plain, solvent/vibrational relaxation time or dark excited-state lifetime.
The Journal of Physical Chemistry A Article
dx.doi.org/10.1021/jp409646g | J. Phys. Chem. A 2013, 117, 13112−1312613117

Figure 5D and the time constants listed in Table 3. Thesespectra can be interpreted as those of 1 in ACN, namely thefirst observed species is the emitting state that evolves to a darkexcited state, which itself undergoes nonradiative deactivationto the unrelaxed ground state that finally equilibrates.Like with 1, the dark excited state cannot be seen in the long
alcohols and in DD and the earliest species is the unrelaxedemitting state. In CHX, an additional step had to be included,as both unrelaxed emitting state and dark excited state can beobserved.Infrared Transient Absorption. Transient IR spectra in
the CC stretch region have been recorded with 1 in ACN,PeOH and DeOH, those in ACN and PeOH being shown inFigure 6. No measurement could be performed in the nonpolarsolvents, because of the limited solubility of 1. In all threesolvents, the IR TA spectra exhibit two negative bands due tothe bleach of the ground-state population. The most intenseone is around 1580 cm−1 and is ascribed, on the basis of DFTcalculations, to the interring C−C stretch, whereas the otherone is at 1635 cm−1 and assigned to the aromatic CC stretch.Considering the zwitterionic character of the ground state of 1in sufficiently polar solvents, the high intensity of the 1580cm−1 band is in agreement with the large variation of
permanent electric dipole moment associated with the interringstretch.Between these negative bands, broad positive features that
are more intense in PeOH than in ACN are also present. Besidethe decay of all bands within a few tens of picoseconds, themost prominent dynamic feature is the continuous ∼15 cm−1
frequency upshift of the positive band located around 1610cm−1. Target analysis of the IR TA spectra was performed usinga series of consecutive first-order steps as well. In PeOH andDeOH, a good fit was obtained using three steps with the sametime constants as those obtained from the visible TAmeasurements. The spectra associated with A and B (FigureS6) exhibit the bleach and the positive features, the most visibledifference being that the main positive band shifts from 1602 to1610 cm−1 by going from A to B. This small difference pointsto minor structural changes, in agreement with our assignmentof this process to solvent relaxation. Whereas the negativebands decrease in intensities by a factor of ∼2 when going fromB to C, the positive bands exhibit a stronger decrease, especiallythat above 1640 cm−1, which almost totally vanishes. Moreover,the two other positive bands shift substantially toward thenegative bands. This spectrum is typical of a hot ground state.In this case, the high frequency mode that is monitored is in the
Figure 5. (A−C) Visible TA spectra measured with 2 in ACN and (D) species-associated difference absorption spectra obtained from target analysis.The dashed black line and the dashed gray line represent the scaled stationary absorption and stimulated emission spectra, respectively.
Figure 6. IR TA spectra measured with 1 in (A) ACN and (B) PeOH.
The Journal of Physical Chemistry A Article
dx.doi.org/10.1021/jp409646g | J. Phys. Chem. A 2013, 117, 13112−1312613118

ground state but anharmonically couples with excited lowfrequency modes.37,38
Analysis of the IR TA spectra in ACN points to the presenceof a slow component that is absent in the visible TA spectra.Target analysis was performed using either (i) the three-stepsmodel and fixing the first two time constant to 1.3 and 3 ps, or(ii) using a four steps model fixing the first three time constantsto the values found by visible TA. Good fit to the data wasobtained in both cases with a time constant associated with theslow component of 36 and 41 ps for i and ii, respectively. Inboth cases, the spectrum of species A exhibits the main positivefeatures with a maximum at 1600 cm−1 which is assigned to theemitting state. In the spectrum of B, this band is weaker andpeaks at 1615 cm−1. Finally the spectra of C (model i) and Cand D (model ii) are all very similar and resemble thoseassigned above to the unrelaxed, hot ground state.Assignment of the positive TA bands to a specific vibrational
mode of 1 is difficult. Nevertheless, the very large width ofthese positive features suggests an inhomogeneous broadeningpossibly due to a distribution of geometries in the excited state.This, together with the temporal frequency upshift, indicatesthat the excited-state dynamics of this molecule is associatedwith substantial structural changes. This is in full agreementwith the viscosity dependence of the fluorescence lifetime thatpoints to the involvement of modes with large amplitudemotion.Figure 7 shows IR TA spectra measured in the same spectral
region with 2 in ACN, PeOH, and CHX upon 400 nmexcitation. These spectra are strongly solvent dependent,contrary to what was observed with 1. All of them aredominated by negative bands due to the depletion of the
ground-state population. Those observed in ACN aretentatively ascribed to the interring C−C stretch (1570cm−1) and to aromatic CC stretches (1602 and 1655cm−1). The intensity of all three bands decreases continuouslywith time and, after about 1 ps, small positive features start torise on their high-frequency side until about 4 ps beforedecaying to zero on the ∼20 ps time scale. Target analysis wasperformed using the time constants measured by visible TA(Table 3). Like for 1, a fourth step, with a 21 ps time constant,had to be added to account for the slow decay component thatdoes not appear in the visible TA, the SADS being depicted inFigure S7. The spectra associated with A and B are identicaland exhibit only negative bands. This confirms our assignmentof species B to an excited state. If B were a highly vibrationallyhot or unrelaxed ground state, its IR spectrum would showweaker bleach bands with positive bands on their low-frequencyside. Such features are precisely appearing in the spectraassociated with the last two species. The bleaches are moreintense and the positive bands more frequency down-shifted inthe spectrum of C than in that of D, indicating that C and Dboth correspond to the unrelaxed ground state but at differentstages of its equilibration. In CHX, the two bands at lowfrequency are substantially narrower, closer to each other andhave different relative intensities than in ACN (Figure 7B).This points to markedly different ground-state structures of 2 inthese two solvents. Target analysis could be performed with thethree steps model, but the first step observed in the visible TAcould not be seen in the IR, in agreement with the absence ofexcited-state vibrational band in this spectral region. Thespectra associated with the next two species correspond to theunrelaxed ground state as in ACN.The IR TA spectra in PeOH (Figure 7C) and DeOH (not
shown) look almost like the composite of those in ACN andCHX. This could indicate that two different forms of 2 thatdominate in ACN and in CHX are coexisting in these mediumpolarity solvents. Addition of a base to a solution of 2 in PeOH(100 μL 1 M NaOH in 3 mL) did not result in significantlydifferent IR TA spectra, indicating that the protonated form, H-2, does not contribute to these spectra.The IR TA spectra measured with 2 in PeOH and DeOH
show a broad positive band around 1620 cm−1 already at earlytimes, contrary to those measured in ACN and CHX. Targetanalysis could be performed with the three steps model like inCHX. The spectrum of the first species exhibits the 1620 cm−1
band ascribed to the emitting state. The spectrum of the thirdspecies is typical of the unrelaxed ground state, whereas that ofthe second species, which decays with a 8.6 ps time constant,contains both excited- and ground-state features, indicating thattwo different processes might be associated with a similar timeconstant. Such an explanation would be compatible with twocoexisting structures undergoing different nonradiative deacti-vation.
■ DISCUSSIONQualitative Considerations. All the data presented above
indicate that the excited-state dynamics of both 1 and 2 isassociated with substantial structural changes, involving a modewith large amplitude motion. One evident candidate for suchmode is the torsion around the interring bond. This wouldexplain the approximately 10 times shorter fluorescence lifetimeof analogue 1a, which lacks the phenyl substituents.According to DFT calculations, the ground-state minimum
of 1 and 2 is nearly planar. An increase of the dihedral angleFigure 7. IR TA spectra measured with 2 in (A) ACN, (B) CHX, and(C) PeOH.
The Journal of Physical Chemistry A Article
dx.doi.org/10.1021/jp409646g | J. Phys. Chem. A 2013, 117, 13112−1312613119

between the two rings, θ, up to 90° raises the ground-stateenergy by more than 1.5 eV (Figure 8). The same approach forthe S1 state using TD-DFT shows that the energy of this statedecreases by about the same amount upon varying θ from 0 to90°.
Although the results of these calculations should only beconsidered on a qualitative basis, as the experimental transitionenergy is not well reproduced, they reveal a strong decrease ofthe S1−S0 gap upon increasing θ. Application of the 6-31G(d)basis set instead of the cc-pVDZ does not have a significantinfluence on the S1−S0 gap at 0°, but reduces it further at 90°for 1 and even predicts a state crossing for 2 at ∼85°. Even ifthese states do not cross upon twisting, distortion alongadditional intramolecular modes can be expected to narrowfurther the energy gap and to even give access to a conicalintersection (COI). The α value of 0.9 obtained for 1 indicatesthat the excited-state decay of this molecule is essentiallycontrolled by this torsional mode. The smaller value found for2, i.e., α = 0.53, may seem surprising, considering the verysimilar volume displacement involved in the torsion around theinterring bond. However, this difference might be due to amore important participation of other modes to the internalconversion and/or due to polarity effects. Both these factorsmay play a role: the maximum of the absorption bandcorresponds to higher vibronic values for 2 indicating a largerFranck−Condon displacement and the involvement of a furthercoordinate in addition to twisting, and the larger influence ofpolarity on the excited-state dynamics of 2 also signifies a moreimportant involvement of a further mode, the solventrelaxation.It appears from what precedes that the excited-state
dynamics of 1 and 2 can be qualitatively well accounted forby the scheme illustrated in Figure 9. It is similar to thatproposed to explain the ultrafast nonradiative deactivation oftriphenylmethane dyes.39 In this scheme, the transient observedin the visible TA spectra and ascribed to a dark excited statemost probably corresponds to a twisted form of the excitedstate ’on the way’ toward a COI or to a region of reduced S1−S0gap. Indeed, its TA spectrum shows the same features as theemitting state except for the stimulated emission band, which ismissing. Moreover, its lifetime is close to that of the emittingstate.The absence of emission can be accounted for by a small
transition dipole moment due the twist angle between the tworings. This ’state’ was not evidenced in the highly viscous longalcohols and the nonpolar solvents when using the three-stepmodel. Most probably, addition of a fourth step to the analysis
would allow its observation. However, as the three-step modelresulted in a very good fit to the data, we preferred not to addany unnecessary step. According to the scheme shown in Figure9, a twisted ground-state structure is reached after internalconversion. Relaxation to the planar equilibrium geometryinvolves a back-twist and should thus depend on solventviscosity as well. Table 3 shows that the lifetime of species Cobtained from the three-step analysis of the visible TA data of 1indeed increases with solvent viscosity. A log−log plot of thistime constant vs. viscosity reveals a quasi-linear dependence, asexpected from eq 1 with a α value of 0.84 ± 0.08 (Figure S8).This is close to the value of 0.90 found for the lifetime of theexcited state, indicating that similar large amplitude motion isinvolved in both processes. From Tables 2 and 3, it appears thatthis process is slower by a factor of ∼2 in the ground-state thanthe excited-state twist. This difference, that has also beenobserved with malachite green,39 could be accounted for by asteeper excited-state potential. The resemblance of the TAspectrum of the twisted ground state with that of a vibrationallyhot ground state is consistent with the fact that the S1−S0energy gap is narrower for the twisted than for the planarmolecule. This assignment does not preclude the occurrence ofvibrational cooling on the same time scale as back-twist.However, this process has not been shown to depend onsolvent viscosity.29 Vibrational cooling cannot be associatedwith a single time scale and depends on which vibrational modeis monitored. In visible TA, only the Franck−Condon activemodes are observed, whereas all the IR active vibrations can bemonitored in IR TA. This explains why the slowest componentobserved in the IR TA experiment is, in some cases, notobservable in the visible TA. This process can be ascribed tothe cooling of some vibrational modes that are still non-equilibrated after the back-twist of the molecule.For 2, contrary to 1, the time constant assigned to back-twist
does not only depend on viscosity but also on solvent polarity,as judged from the very long time constants for CHX and DD(Figure S8). If only the polar solvents are considered, an αvalue of 0.33 ± 0.04 is obtained. This value does not differmuch from that obtained for the excited state, especiallyconsidering the limited number of solvents. In nonpolarsolvents, this time constant is larger by a factor ofapproximately two and seems also to increase with viscosity.This solvent polarity dependence of the back-twist of 2 isstronger than that observed for its excited-state twist. Indeed,the excited-state dynamics is slower in nonpolar than in polarsolvents by a factor of less than 2, whereas this differenceamounts to a factor of about 4 for the ground-state dynamics.Whereas for 1, the ensemble of experimental data is
consistent with a more zwitterionic, i.e. more aromatic, ground
Figure 8. Calculated relative energy of 1 in the S0 and S1 states as afunction of the interring torsion angle, θ.
Figure 9. Schematic energy diagram accounting for the excited-statedynamics observed with 1 and 2.
The Journal of Physical Chemistry A Article
dx.doi.org/10.1021/jp409646g | J. Phys. Chem. A 2013, 117, 13112−1312613120

state, the data obtained for 2 are more consistent with aground-state structure of less polar, more quinoid, nature innonpolar solvent which gains an increasingly zwitterioniccharacter as solvent polarity rises. In an electron donor−acceptor picture, this difference in behavior can be accountedfor by the stronger electron acceptor character of the pyryliumgroup compared to the pyridinium group. Because of this,optical excitation to the S1 state results in an opposite change ofdipole moment for 1 and 2 (negative vs positive solvatochrom-ism). However, despite this marked difference, the excited-statedynamics of both molecules are not largely different, which isprobably due to their close structural similarity. At the sametime, some quantitative distinctions may be due to thedifference in their excited-state electron density distributions.Application of the Cyanine Limit Model and the
Spectroscopic Hyperbola. Some features revealed in theoptical properties of compounds 1 and 2 can be rationalizedusing the cyanine limit (CL) model,27 in terms of the so-calledspectroscopic hyperbola.40,41 Both experimentally and compu-tationally derived S1 ← S0 transition energies, ν 00, ofmerocyanines, if plotted versus the donor−acceptor strengthof their end substituents, SDA, represent a quasi-hyperboliccurve, with the position of a given merocyanine on the SDA axisspecified by the difference between the HOMO energy of thedonor moiety, D, and the LUMO energy of the acceptormoiety, A.42,43 The vertical offset of the hyperbola bottom fromthe abscissa is related to the mesomeric interaction between theD and A units of the compounds,40,41 and therefore depends onthe twist angle of the ground-state equilibrium. This depend-ence can be substantiated analytically in the framework of thevalence bond model,44 assuming that the ground- and excited-state wave functions of the D−A molecules, ψDA(S0) andψDA(S1) can be described by the linear combination of the wavefunctions of two main resonance structures, zwitterionic (Z)and non-charge-separated (N), ψZ and ψN, with the mixingcoefficient c:
ψ ψ ψ= + −c c(S ) (1 )Z NDA 02 1/2
(2a)
ψ ψ ψ= − −c c(S ) (1 ) Z NDA 12 1/2
(2b)
For larger systems, where the aromatic character plays a role,further resonance structures become significant but are notrelevant for the CL model and the spectroscopic hyperbola, iftheir relative contributions are the same in both states. In thiscase, the CL is still defined by equal N and Z contributions, andequal dipole moments in both states. Depending on which of
the N or Z form is aromatic, the merocyanines belong to class Ior II, respectively, as exemplified in Scheme 2.As shown previously,40,41 eqs 2a and 2b specify the
hyperbolic dependence of the S1−S0 energy difference, ν00,on SDA (Figure 10). It follows from the Z−N interrelations that
class I and II compounds should exhibit some mirror-like π-electronic properties. In the normal region (Figure 10), themain ground-state valence bond wave function is of aromaticcharacter for both classes. Therefore, class I compounds areweakly polar (more N character), whereas class II compoundsare strongly polar (more Z character). The opposite holds forthe excited-state wave function, hence class I compounds showpositive (S1 more polar than S0) and class II compoundsnegative (S1 less polar than S0) solvatochromism in the normalregion. Well-known representatives for class I compounds arethe so-called twisted-intramolecular charge-transfer (TICT)compounds,45,46 whereas the classical merocyanines orbetaines, including compounds 1 and 2, belong to class II.Although negative solvatochromic behavior is observed for themajority of class II dyes (normal region), some compoundswith very strong D−A character exhibit a solvatochromicinversion, with positive solvatochromism over a variablefraction of the solvent polarity scale.47 For these compounds,which belong to the overcritical region of the hyperbola, theground state is less polar than the excited state. Therefore, thepolarity of the ground state and, accordingly, the c2 valueincrease with SDA for class I compounds and decrease for classII compounds (Figure 10).
Scheme 2. Main Resonance Structures of Two Classes of Donor−Acceptor Merocyanines, Z Denoting the Zwitterionic and Nthe Non-Charge-Separated Character of the Corresponding Electronic Distribution, and hp and dd Standing for the Hole−Pairand Dot−Dot States in the Biradicaloid Model (See Text)a
aClass I is characterized by the aromatic (ar) N and class II by the aromatic Z form.
Figure 10. S1 ← S0 transition energy, ν00, vs the donor−acceptorstrength of the end substituents, SDA, for classes I and II merocyaninesand estimated locations of compounds 1 and 2 and of their protonatedderivatives H-1 and H-2 on the hyperbolic curve.
The Journal of Physical Chemistry A Article
dx.doi.org/10.1021/jp409646g | J. Phys. Chem. A 2013, 117, 13112−1312613121

Because of the polarizing effect of the solvent, increasingsolvent polarity has a similar effect as rising SDA for class Icompounds and an opposite effect for class II compounds asindicated by the horizontal arrows in Figure 10, the changesbeing in both cases in the direction of increasing the Zcharacter of the ground state. For both classes, the CL pointcharacterized by c2 = 0.5 implies the minimum energyseparation of the ground and excited state. The CL is thereforecharacterized by the most red-shifted absorption/emission andthe absence of solvatochromism because the ground andexcited states are equally polar.The steady-state absorption spectra of 1 and 2, which belong
to class II, can be readily explained within this hyperbolicmodel. From its weak negative solvatochromism and small 0−0energies, 1 belongs to the normal region and should be locatednear the CL point (see Figure 10). On the other hand, as 2 hasa stronger acceptor and hence a larger SDA, it is located on theright side of 1, in the overcritical region and closer to the CL, inagreement with the weak positive solvatochromism and lower0−0 transition energy. The SDA values of both 1 and 2drastically decrease upon protonation, which converts their verystrong phenolate donor to a much weaker phenol donor. As aresult, both protonated compounds are located significantlyfurther in the normal region. Their relative location remains,however, unchanged, thus giving rise to an increased excitationenergy for both compounds and to a lower-energy absorptionfor H-2 (Figure 10). The same difference in SDA between 1 and2 and H-1 and H-2 does not result in the same difference intransition energy, because the unprotonated compounds arelocated near the flat bottom of the hyperbola, whereas theprotonated forms are on the steep left wing. These trends in theoptical behavior of 1 and 2 are very similar to those of theirhigher vinylogues reported previously.40
Connection between the Spectroscopic Hyperbolaand the Biradicaloid Model. The discussion based on Figure10 is valid for near-planar dyes, i.e., with large electronicinteraction and strong mixing between the N and Z wavefunctions. The so-called biradicaloid model is more relevant formolecules which spontaneously twist in the excited state asthose investigated here.48,49 At 90°, the D and A units aredecoupled, and, for a normal system, the ground state is a so-
called hole-pair, hp, state, with the doubly occupied HOMOlocalized on D. The excited state is associated with the transferof one electron from D to A and corresponds to a dot-dot, dd,state, with an odd number of electrons on both units. Theinteraction between the hp and dd states is zero at 90° butincreases strongly as the twist angle decreases. This results in amixing of the frontier orbitals, which become delocalized overD and A at 0°, as well as in an energetic “repulsion” betweenthe two states, which is at the origin of the shape of the S1 andS0 state potentials, the first going uphill and the seconddownhill when moving from 90° to 0° (see Figure 8). Theinteraction of the dd and hp states is equivalent to the mixing ofthe N and Z valence-bond functions employed in the CLmodel. We can therefore connect the CL model to thebiradicaloid model and describe the electronic changes, e.g.,dipole moments, as the angular relaxation takes place. In thebiradicaloid picture, both class I and II compounds in thenormal region have a hp ground state at any twist angle, butwith predominant N and Z character for class I and II,respectively (Scheme 2, l.h.s. resonance structure). Thesituation is the opposite in the dd excited state. On the otherhand, class II compounds in the overcritical region arecharacterized by a dd ground state with predominant Ncharacter at any twist angle and a hp excited state withpredominant Z character (Scheme 2, r.h.s. resonancestructure). Because of the strong aromatic stabilization oftheir hp form, class I compounds are never found in theovercritical region.An additional distinctive difference between class I and class
II compounds is the dual fluorescence of TICT compounds,which necessitates a sizable energy gap not only at 0°, but alsoat 90°. For class II compounds, on the other hand, the S1 and S0states generally come very close at 90° (Figure 11A) such thatfluorescence from the twisted conformation is not observed. Inthis case, sufficiently strong D and A moieties can even lead toan energy reversal of the states at 90°, i.e. the dd state is belowthe hp state (Figure 11B). Such an open-shell ground state is,of course, not stable and is therefore prone to very fast angularrelaxation and development into the stable closed-shell, hp stateat 0°. In such case, the system is called overcritical, in referenceto the critical cases where the hp and dd states are isoenergetic
Figure 11. Electronic nature and relaxation paths for class II merocyanines 1 and 2 in the (A) normal and in the (B) overcritical region. For details,see text.
The Journal of Physical Chemistry A Article
dx.doi.org/10.1021/jp409646g | J. Phys. Chem. A 2013, 117, 13112−1312613122
and the normal cases where the dd state is higher than the hpstate.48,49
For a class II compound in the overcritical region, the backtwist from perpendicular to planar geometry involves a realstate crossing connecting the two open-shell (opsh) states at 0°and 90°, as well as the two closed-shell (clsh) ones, if only thetwist as single coordinate is considered. Coupling with a furtherrelaxation coordinate which destroys the high symmetry of thepurely twisted system, e.g. bending or unsymmetric stretching,leads to electronic coupling and avoidance of the crossing. In atwo-dimensional representation, i.e. the twist and one furthercoordinate, this corresponds to a COI (Figure 11B).50,51
Merocyanines exhibiting this behavior can be easily recognizedexperimentally by their positive solvatochromic behavior.47,52
On the other hand, normal merocyanines, characterized by theirnegative solvatochromism, show no COI on their excited-staterelaxation before reaching the S1 dd-minimum, from whereultrafast nonradiative relaxation to the hp ground-state occurs,due to their energetic proximity (Figure 11A).It can be argued that, since overcritical merocyanines reach
the ground-state surface at angles smaller than 90°, they do nothave to relax to the dd-minimum at 90° but reverse theirrelaxational motion before. This is unlikely as torsional motion(or motion along any relaxation coordinate) possesses a certaininertia, and crossing a COI preferentially continues thetrajectories in the forward direction (see, e.g., ref 50). Thishas also been discussed as a reason for the high quantum yieldof product formation in the visual chromophore.48,53
Interpretation of the Kinetic Observations. The simplehyperbolic model comprising the CL model linked to thebiradicaloid model as sketched in Figure 11 helps us tounderstand the photophysical behavior of compounds 1 and 2.In this case, both planar and perpendicular forms have to beconsidered together with their wave function and dipolarcharacter.The main kinetic results, illustrated in Figures S4 and S8, can
be summarized as follows:
• R1: there is a significant kinetic enhancement for 2 inpolar solvents in both excited- and ground-staterelaxations, which is essentially absent for 1;
• R2: compared to 1, 2 has a reduced sensitivity to viscousfriction indicative of the involvement of a furtherrelaxation coordinate in addition to the twist;
• R3: the angular relaxation is faster for 2 than for 1 in theexcited state and slower in the ground state;
• R4: the relaxation in the ground state is slower than inthe excited state for both 1 and 2.
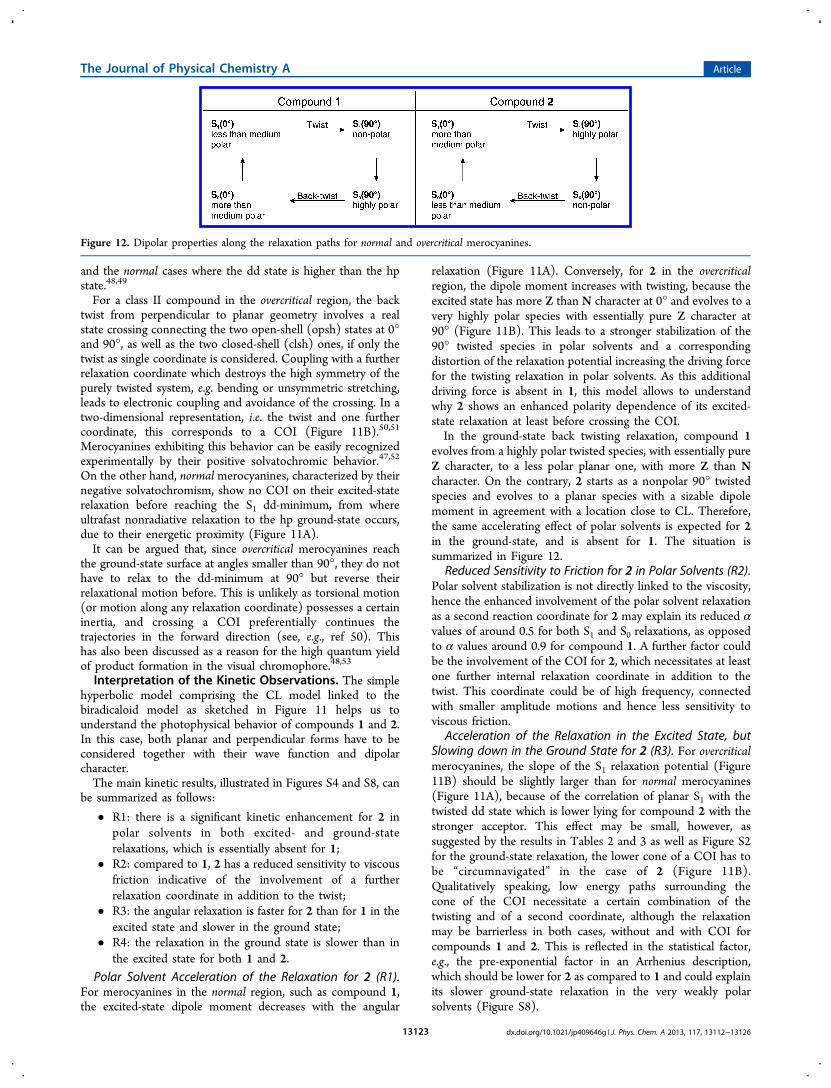
Polar Solvent Acceleration of the Relaxation for 2 (R1).For merocyanines in the normal region, such as compound 1,the excited-state dipole moment decreases with the angular
relaxation (Figure 11A). Conversely, for 2 in the overcriticalregion, the dipole moment increases with twisting, because theexcited state has more Z than N character at 0° and evolves to avery highly polar species with essentially pure Z character at90° (Figure 11B). This leads to a stronger stabilization of the90° twisted species in polar solvents and a correspondingdistortion of the relaxation potential increasing the driving forcefor the twisting relaxation in polar solvents. As this additionaldriving force is absent in 1, this model allows to understandwhy 2 shows an enhanced polarity dependence of its excited-state relaxation at least before crossing the COI.In the ground-state back twisting relaxation, compound 1
evolves from a highly polar twisted species, with essentially pureZ character, to a less polar planar one, with more Z than Ncharacter. On the contrary, 2 starts as a nonpolar 90° twistedspecies and evolves to a planar species with a sizable dipolemoment in agreement with a location close to CL. Therefore,the same accelerating effect of polar solvents is expected for 2in the ground-state, and is absent for 1. The situation issummarized in Figure 12.
Reduced Sensitivity to Friction for 2 in Polar Solvents (R2).Polar solvent stabilization is not directly linked to the viscosity,hence the enhanced involvement of the polar solvent relaxationas a second reaction coordinate for 2 may explain its reduced αvalues of around 0.5 for both S1 and S0 relaxations, as opposedto α values around 0.9 for compound 1. A further factor couldbe the involvement of the COI for 2, which necessitates at leastone further internal relaxation coordinate in addition to thetwist. This coordinate could be of high frequency, connectedwith smaller amplitude motions and hence less sensitivity toviscous friction.
Acceleration of the Relaxation in the Excited State, butSlowing down in the Ground State for 2 (R3). For overcriticalmerocyanines, the slope of the S1 relaxation potential (Figure11B) should be slightly larger than for normal merocyanines(Figure 11A), because of the correlation of planar S1 with thetwisted dd state which is lower lying for compound 2 with thestronger acceptor. This effect may be small, however, assuggested by the results in Tables 2 and 3 as well as Figure S2for the ground-state relaxation, the lower cone of a COI has tobe “circumnavigated” in the case of 2 (Figure 11B).Qualitatively speaking, low energy paths surrounding thecone of the COI necessitate a certain combination of thetwisting and of a second coordinate, although the relaxationmay be barrierless in both cases, without and with COI forcompounds 1 and 2. This is reflected in the statistical factor,e.g., the pre-exponential factor in an Arrhenius description,which should be lower for 2 as compared to 1 and could explainits slower ground-state relaxation in the very weakly polarsolvents (Figure S8).
Figure 12. Dipolar properties along the relaxation paths for normal and overcritical merocyanines.
The Journal of Physical Chemistry A Article
dx.doi.org/10.1021/jp409646g | J. Phys. Chem. A 2013, 117, 13112−1312613123

Slower Ground-State than Excited-State Relaxation forboth 1 and 2 (R4). Whereas the slower ground-state relaxationof 2 can be accounted for by the presence of a COI (Figure11B), another factor, which could also be operative for 2,should be invoked for 1 (Tables 2 and 3; Figures S4 and S8).According to Figure 11A, the shapes of the excited- andground-state potentials for twist and back-twist could beidentical and consequently, both processes might take placewith a similar rate. However, it should be kept in mind that themodel used to deduce these schemes only allows a qualitativediscussion of the relaxation dynamics. Most probably, thesepotentials are not identical and the potential for excited-statetwisting should be steeper than that for the ground-state back-twist. A definitive answer would require intensive quantumchemical calculations of both ground- and excited-statehypersurfaces, that are beyond the scope of the presentinvestigation.
■ CONCLUDING REMARKS
The present study shows that for both the pyridinium andpyrylium phenolates investigated here, optical population of theFranck−Condon S1 state is followed by torsional motionaround the single bond between the two rings toward a conicalintersection with the ground state or a region with a narrow gapbetween the excited- and ground-state potential energysurfaces. After internal conversion, the distorted moleculerelaxes back to the planar ground state via a reverse twistmotion. The excited-state dynamics of these donor−acceptorbiaryls, though strongly dominated by structural dynamics, isalso notably tuned by variations of the donor−acceptorstrength of the end substituents. The close structural similarityof biaryls 1 and 2, giving rise to qualitatively much the samestructural dynamics, enables to single out the effect of donor−acceptor strength on the twisting relaxation in the excited andground state. Other factors being equal, the following points areimportant: (i) the downhill slope for the twisting relaxation (asa dominating factor leading to the strong viscosity depend-ence); (ii) bulky substituents which can slow down the twistingrelaxation; (iii) the prevailing nature of the ground- andexcited-state wave functions, Z > N or Z < N; (iv) polaritychanges upon excitation/de-excitation as well as upon angulartwisting in both ground and excited state which can lead toadditional polarity effects.The solvatochromism is opposite for the two dyes, negative
for 1 and positive for 2. This suggests that the two compoundsare found on different sides of the cyanine limit, the former inthe normal (Z prevailing) and the latter in the overcritical region(N prevailing) of the spectroscopic hyperbola. As aconsequence, the molecular polarity changes upon excitation/de-excitation and upon angular relaxation are also opposite andlead to enhanced polarity dependences for compound 2 forboth excited- and ground-state twisting.Overcritical merocyanines have larger donor−acceptor
strength of the end substituents and, accordingly, a lower-lying twisted dd state than normal merocyanines. Since theplanar S1 state is correlated with the twisted dd state, overcriticalmerocyanines exhibit a steeper slope of the S1 relaxationpotential and, hence, faster excited-state twisting dynamics thannormal merocyanines, as found for compound 2. On the otherhand, the S0-S1 conical intersection which is predicted for 2slows down its ground-state relaxation kinetics as compared to1.
■ ASSOCIATED CONTENT*S Supporting InformationSolvatochromic plots, fluorescence emission and excitationspectra, viscosity dependence of the fluorescence lifetime and ofthe back-twist time constant, stationary IR spectra, and species-associated difference IR spectra. This material is available freeof charge via the Internet at http://pubs.acs.org.
■ AUTHOR INFORMATIONCorresponding Authors*E-mail: (W.R.) [email protected].*E-mail: (E.V.) [email protected].
NotesThe authors declare no competing financial interest.
■ ACKNOWLEDGMENTSThe authors wish to thank the Fonds National Suisse de laRecherche Scientifique (Projects Nr. 200020-124393 and200020_147098) as well as the University of Geneva forfinancial support.
■ REFERENCES(1) Blanchard-Desce, M.; Alain, V.; Bedworth, P. V.; Marder, S. R.;Fort, A.; Runser, C.; Barzoukas, M.; Lebus, S.; Wortmann, R. LargeQuadratic Hyperpolarizabilities with Donor−Acceptor PolyenesExhibiting Optimum Bond Length Alternation: Correlation BetweenStructure and Hyperpolarizability. Chem.Eur. J. 1997, 3, 1091−1104.(2) Boeglin, A.; Barsella, A.; Fort, A.; Mancois, F.; Rodriguez, V.;Diemer, V.; Chaumeil, H.; Defoin, A.; Jacques, P.; Carre, C. OpticalProperties and Progressive Sterical Hindering in PyridiniumPhenoxides. Chem. Phys. Lett. 2007, 442, 298−301.(3) Kang, H.; Facchetti, A.; Zhu, P.; Jiang, H.; Yang, Y.; Cariati, E.;Righetto, S.; Ugo, R.; Zuccaccia, C.; Macchioni, A.; et al. ExceptionalMolecular Hyperpolarizabilities in Twisted π-Electron SystemChromophores. Angew. Chem., Int. Ed. 2005, 44, 7922−7925.(4) Isborn, C. M.; Davidson, E. R.; Robinson, B. H. Ab InitioDiradical/Zwitterionic Polarizabilities and Hyperpolarizabilities inTwisted Double Bonds. J. Phys. Chem. A 2006, 110, 7189−7196.(5) Kang, H.; Facchetti, A.; Jiang, H.; Cariati, E.; Righetto, S.; Ugo,R.; Zuccaccia, C.; Macchioni, A.; Stern, C. L.; Liu, Z.; et al. UltralargeHyperpolarizability Twisted π-Electron System Electro-Optic Chro-mophores: Synthesis, Solid-State and Solution-Phase StructuralCharacteristics, Electronic Structures, Linear and Nonlinear OpticalProperties, and Computational Studies. J. Am. Chem. Soc. 2007, 129,3267−3286.(6) Liu, L.; Xue, Y.; Wang, X.; Chu, X.; Yang, M. Theoretical Study ofStatic (Hyper)polarizabilities of Twisted Intramolecular ChargeTransfer Chromophores. Int. J. Quantum Chem. 2011, 112, 1086−1096.(7) Reichardt, C. Solvatochromic Dyes as Solvent Polarity Indicators.Chem. Rev. 1994, 94, 2319−2358.(8) Barbara, P. F.; Walker, G. C.; Smith, T. P. Vibrational Modes andthe Dynamic Solvent Effect in Electron and Proton Transfer. Science1992, 256, 975−981.(9) Johnson, A. E.; Levinger, N. E.; Jarzeba, W.; Schlief, R. E.; Kliner,D. A. V.; Barbara, P. F. Experimental and Theoretical Study ofInhomogeneous Electron Transfer in Betaine: Comparison ofMeasured and Predicted Spectral Dynamics. Chem. Phys. 1993, 176,555−574.(10) Reid, P. J.; Barbara, P. F. Dynamic Solvent Effect on Betaine-30Electron Transfer Kinetics in Alcohols. J. Phys. Chem. 1995, 99, 3554−3565.(11) Lobaugh, J.; Rossky, P. J. Computer Simulation of the ExcitedState Dynamics of Betaine-30 in Acetonitrile. J. Phys. Chem. A 1999,103, 9432−9447.
The Journal of Physical Chemistry A Article
dx.doi.org/10.1021/jp409646g | J. Phys. Chem. A 2013, 117, 13112−1312613124

(12) Kovalenko, S. A.; Eilers-Konig, N.; Senyushkina, T.; Ernsting, N.P. Charge Transfer and Solvation of Betaine-30 in Polar Solvents: AFemtosecond Broadband Transient Absorption Study. J. Phys. Chem. A2001, 105, 4834−4843.(13) Zhao, X.; Burt, J. A.; McHale, J. L. Resonance Raman Analysis ofNonlinear Solvent Dynamics: Betaine-30 in Ethanol. J. Chem. Phys.2004, 121, 11195−11201.(14) Ishida, T.; Rossky, P. J. Consequences of Strong Couplingbetween Solvation and Electronic Structure in the Excited State of aBetaine Dye. J. Phys. Chem. B 2008, 112, 11353−11360.(15) Kharlanov, V.; Rettig, W. Experimental and Theoretical Study ofExcited-State Structure and Relaxation Processes of Betaine-30 and ofPyridinium Model Compounds. J. Phys. Chem. A 2009, 113, 10693−10703.(16) Duvanel, G.; Grilj, J.; Chaumeil, H.; Jacques, P.; Vauthey, E.Ultrafast Excited-State Dynamics of a Series of ZwitterionicPyridinium Phenoxides with Increasing Sterical Hindering. Photochem.Photobiol. Sci. 2010, 9, 908−915.(17) Malval, J.-P.; Chaumeil, H.; Rettig, W.; Kharlanov, V.; Diemer,V.; Ay, E.; Morlet-Savary, F.; Poizat, O. Excited-State Dynamics ofPhenol-Pyridinium Biaryl. Phys. Chem. Chem. Phys. 2012, 14, 562−574.(18) Nekhoroshev, M. V.; Okhlobystin, O. Y. Sterically HinderedPhenols in a Series of Pyrylium Salts. Oxidative Dehydrogenation ofPyrans. Zh. Org. Khim. (Russ. J. Org. Chem.) 1977, 13, 1294−1300.(19) Morandeira, A.; Engeli, L.; Vauthey, E. Ultrafast ChargeRecombination of Photogenerated Ion Pairs to an Electronic ExcitedState. J. Phys. Chem. A 2002, 106, 4833−4837.(20) Duvanel, G.; Banerji, N.; Vauthey, E. Excited-State Dynamics ofDonor-Acceptor Bridged Systems Containing a Boron-Dipyrrome-thene Chromophore: Interplay between Charge Separation andReorientational Motion. J. Phys. Chem. A 2007, 111, 5361−5369.(21) Banerji, N.; Duvanel, G.; Perez-Velasco, A.; Maity, S.; Sakai, N.;Matile, S.; Vauthey, E. Excited-State Dynamics of Hybrid Multi-chromophoric Systems: Toward an Excitation Wavelength Control ofthe Charge Separation Pathways. J. Phys. Chem. A 2009, 113, 8202−8212.(22) Bredenbeck, J.; Hamm, P. Versatile Small Volume Closed-CycleFlow Cell System for Transient Spectroscopy at High RepetitionRates. Rev. Sci. Instrum. 2003, 74, 3188−3189.(23) Frisch, M. J.; Trucks, G. W.; Schlegel, H. B.; Scuseria, G. E.;Robb, M. A.; Cheeseman, J. R.; Scalmani, G.; Barone, V.; Mennucci,B.; Petersson, G. A.; et al. Gaussian 09 (revision A1), Gaussian:Wallingford, CT, 2009.(24) Suppan, P.; Ghoneim, N. Solvatochromism; The Royal Society ofChemistry: Cambridge, U.K., 1997.(25) Jacques, P.; Graff, B.; Diemer, V.; Ay, E.; Chaumeil, H.; Carre,C.; Malval, J.-P. Negative Solvatochromism of a Series of PyridiniumPhenolate Betaine Dyes with Increasing Steric Hindrance. Chem. Phys.Lett. 2012, 531, 242−246.(26) Lide, D. R., Handbook of Chemistry and Physics, 90th ed.; CRCPress: Boca Raton, FL, 1009.(27) Bourhill, G.; Bredas, J.-L.; Cheng, L.-T.; Marder, S. R.; Meyers,F.; Perry, J. W.; Tiemann, B. G. Experimental Demonstration of theDependence of the First Hyperpolarizability of Donor-Acceptor-Substituted Polyenes on the Ground-State Polarization and BondLength Alternation. J. Am. Chem. Soc. 1994, 116, 2619−2620.(28) Horng, M. L.; Gardecki, J. A.; Papazyan, A.; Maroncelli, M.Subpicosecond Measurements of Polar Solvation Dynamics: Coumar-in 153 Revisited. J. Phys. Chem. 1995, 99, 17311−17337.(29) Pigliucci, A.; Duvanel, G.; Daku, L. M. L.; Vauthey, E.Investigation of the Influence of Solute-solvent Interactions on theVibrational Energy Relaxation Dynamics of Large Molecules inLiquids. J. Phys. Chem. A 2007, 111, 6135−6145.(30) Velsko, S. P.; Fleming, G. R. Solvent Influence on Photo-chemical Isomerisations: Photophysics of DODCI. Chem. Phys. 1982,65, 59−70.(31) Kramers, H. A. Brownian Motion in a Field of Force and theDiffusion Model of Chemical Reactions. Physica 1940, 7, 284−304.
(32) Hicks, J.; Vandersall, M.; Babarogic, Z.; Eisenthal, K. B. TheDynamics of Barrier Crossings in Solution: The Effect of a SolventPolarity-Dependent Barrier. Chem. Phys. Lett. 1985, 116, 18−24.(33) van Stokkum, I. H. M.; Larsen, D. S.; van Grondelle, R. Globaland Target Analysis of Time-Resolved Spectra. Biochim. Biophys. Acta,Bioenerg. 2004, 1657, 82−104.(34) Perez-Lustres, J. L.; Rodriguez-Prieto, F.; Mosquera, M.;Senyushkina, T. A.; Ernsting, N. P.; Kovalenko, S. A. Ultrafast ProtonTransfer to Solvent: Molecularity and Intermediates from Solvation-and Diffusion-Controlled Regimes. J. Am. Chem. Soc. 2007, 129,5408−5418.(35) Grilj, J.; Zonca, C.; Daku, L. M. L.; Vauthey, E. Photophysics ofthe Galvinoxyl Free Radical Revisited. Phys. Chem. Chem. Phys. 2012,14, 6345−6351.(36) Grilj, J.; Buchgraber, P.; Vauthey, E. Excited-State Dynamics ofWurster’s Salts. J. Phys. Chem. A 2012, 116, 7516−7522.(37) Hamm, P.; Ohline, S. M.; Zinth, W. Vibrational Cooling afterUltrafast Photoisomerisation of Azobenzene Measured by fs InfraredSpectroscopy. J. Chem. Phys. 1997, 106, 519−529.(38) Koch, M.; Rosspeintner, A.; Adamczyk, K.; Lang, B.; Dreyer, J.;Nibbering, E. T. J.; Vauthey, E. Real-Time Observation of theFormation of Excited Radical Ions in Bimolecular PhotoinducedCharge Separation: Absence of the Marcus Inverted Region Explained.J. Am. Chem. Soc. 2013, 135, 9843−9848.(39) Fita, P.; Punzi, A.; Vauthey, E. Local Viscosity of Binary Water +Glycerol Mixtures at Liquid/Liquid Interfaces Probed by Time-Resolved Surface Second Harmonic Generation. J. Phys. Chem. C2009, 113, 20705−20712.(40) Rettig, W.; Dekhtyar, M. L.; Tolmachev, A. I.; Kurdyukov, V. V.Two Heterocyclic Merocyanine Classes and their Optical Properties inRelation to the Donor-Acceptor Strength of End Substituents. Chem.Heterocycl. Compd. 2012, 47, 1244−1257.(41) Lasogga, L.; Rettig, W.; Otto, H.; Wallat, I.; Bricks, J. ModelSystems for the Investigation of the Opsin Shift in Bacteriorhodopsin.J. Phys. Chem. A 2010, 114, 2179−2188.(42) Dekhtyar, M.; Rettig, W. Polyenic/Polymethinic Relationshipsfor Donor-Acceptor Substituted Stilbenoids: Structural, Electronic andSpectroscopic Aspects. Phys. Chem. Chem. Phys. 2001, 3, 1602−1610.(43) Rettig, W.; Dekhtyar, M. Merocyanines: polyene−polymethinetransition in donor-acceptor-substituted stilbenes and polyenes. Chem.Phys. 2003, 293, 75−90.(44) Platt, J. R. Wavelength Formulas and Configuration Interactionin Brooker Dyes and Chain Molecules. J. Chem. Phys. 1956, 25, 80−105.(45) Grabowski, Z. R.; Rotkiewicz, K.; Rettig, W. Structural ChangesAccompanying Intramolecular Electron Transfer: Focus on TwistedIntramolecular Charge-Transfer States and Structures. Chem. Rev.2003, 103, 3899−4031.(46) Rettig, W. Charge Separation in Excited States of DecoupledSystemsTICT Compounds and Implications Regarding theDevelopment of New Laser Dyes and the Primary Process of Visionand Photosynthesis. Angew. Chem., Int. Ed. 1986, 25, 971−988.(47) Domínguez, M.; Rezende, M. C. Towards a Unified View of theSolvatochromism of Phenolate Betaine Dyes. J. Phys. Org. Chem. 2010,23, 156−170.(48) Bonacic-Koutecky, V.; Koutecky, J.; Michl, J. Neutral andCharged Biradicals, Zwitterions, Funnels in S1, and Proton Trans-location: Their Role in Photochemistry, Photophysics, and Vision.Angew. Chem., Int. Ed. 1987, 26, 170−189.(49) Michl, J.; Bonacic-Koutecky, V., Electronic Aspects of OrganicPhotochemistry. Wiley: New York, 1990.(50) Sanchez-Galvez, A.; Hunt, P.; Robb, M. A.; Olivucci, M.;Vreven, T.; Schlegel, H. B. Ultrafast Radiationless Deactivation ofOrganic Dyes: Evidence for a Two-State Two-Mode Pathway inPolymethine Cyanines. J. Am. Chem. Soc. 2000, 122, 2911−2924.(51) Bernardi, F.; Olivucci, M.; Robb, M. A. Potential Energy SurfaceCrossings in Organic Photochemistry. Chem. Soc. Rev. 1996, 25, 321−328.
The Journal of Physical Chemistry A Article
dx.doi.org/10.1021/jp409646g | J. Phys. Chem. A 2013, 117, 13112−1312613125

(52) Kulinich, A. V.; Ishchenko, A. A. Merocyanine Dyes: Synthesis,Structure, Properties, Application. Russ. Chem. Rev. 2009, 78, 141−164.(53) Honig, B.; Warshel, A.; Karplus, M. Theoretical Studies of theVisual Chromophore. Acc. Chem. Res. 1975, 8, 92−100.
The Journal of Physical Chemistry A Article
dx.doi.org/10.1021/jp409646g | J. Phys. Chem. A 2013, 117, 13112−1312613126