ultrafast electron--phonon coupling at metal-dielectric ... ultrafast electron... · ultrafast...
TRANSCRIPT
Full Terms & Conditions of access and use can be found athttp://www.tandfonline.com/action/journalInformation?journalCode=uhte20
Heat Transfer Engineering
ISSN: 0145-7632 (Print) 1521-0537 (Online) Journal homepage: http://www.tandfonline.com/loi/uhte20
Ultrafast Electron–Phonon Coupling at Metal-Dielectric Interface
Qiaomu Yao, Liang Guo, Vasudevan Iyer & Xianfan Xu
To cite this article: Qiaomu Yao, Liang Guo, Vasudevan Iyer & Xianfan Xu (2018): UltrafastElectron–Phonon Coupling at Metal-Dielectric Interface, Heat Transfer Engineering, DOI:10.1080/01457632.2018.1457281
To link to this article: https://doi.org/10.1080/01457632.2018.1457281
Accepted author version posted online: 26Mar 2018.Published online: 10 Apr 2018.
Submit your article to this journal
Article views: 7
View related articles
View Crossmark data

HEAT TRANSFER ENGINEERING, VOL. , NO. , –https://doi.org/./..
Ultrafast Electron–Phonon Coupling at Metal-Dielectric Interface
Qiaomu Yao, Liang Guo, Vasudevan Iyer, and Xianfan Xu
School of Mechanical Engineering, Birck Nanotechnology Center, Purdue University, West Lafayette, Indiana, USA
ABSTRACTEnergy transfer from photo-excited electrons in a metal thin film to the dielectric substrate is impor-tant for understanding theultrafast heat transfer process across the twomaterials. Substantial researchhas been conducted to investigate heat transfer in a metal-dielectric structure. In this work, a two-temperature model in metal was used to analyze the interface electron and dielectric substratecoupling. An improved temperature and wavelength-dependent Drude–Lorentz model was imple-mented to interpret the signals obtained in optical measurements. Ultrafast pump-and-probe mea-surements on Au-Si samples were carried out, where the probe photon energywas chosen to be closeto the interband transition threshold of gold to minimize the influence of non-equilibrium electronson the optical response and maximize the thermal modulation to the optical reflectance. Electron-substrate interface thermal conductance at different pump laser fluences was obtained, and wasfound to increase with the interface temperature.
Introduction
Electron–phonon coupling in metals [1], semiconductors[2], and across metal-dielectric interfaces is an impor-tant phenomenon in ultrafast heat transfer experiments.When an ultrafast laser beam is focused on a metal,the photon energy is absorbed first by free electrons,and it takes a few tens to a few hundreds of femtosec-onds for electrons to reach thermal equilibrium. Theelectron–phonon energy coupling also heats up the lat-tice of the metal. For thin metal films on a dielectricsubstrate, there can be electron–phonon coupling acrossthe metal-dielectric interface as well, which spreads theenergy into the substrate through heat diffusion. Muchwork have been carried out to quantify the electron–phonon coupling, characterized by a coupling factorG, particularly in gold. For example, Holfeld, et al. [1]found G is independent of the electron temperature in10 nm–100 nm gold films and is independent of the filmthickness within a 20% uncertainty. Other investigationsconsidered the electron–phonon coupling factor G asfilm thickness and/or pump fluence dependent, andfitted the value of G to the measured thermal reflectancevariation [3]–[5]. During the electron relaxation processafter the laser irradiation, the excited electrons relax tothe Fermi–Dirac distribution mainly through electron–electron collisions and electron–phonon scattering [6].
CONTACT Professor Xianfan Xu [email protected] School of Mechanical Engineering, Birck Nanotechnology Center, West State Street, WestLafayette, Indiana, USA -.Color versions of one or more of the figures in this paper can be found online at www.tandfonline.com/uhte.
This thermalization process of excited electrons caninfluence the optical response, which can be manifestedby varying the probe wavelength. Sun et al. [7] foundthat the optical response is largely influenced by thenon-thermalized electrons when probing with wave-lengths far from the inter-band transition threshold (ITT,2.47 eV for gold), but the non-thermalized electronscontributed much less to the optical response at probeenergy close to ITT. Guo and Xu [8] confirmed the probewavelength-dependent optical responses in gold. Theyused a probe of 490 nm wavelength (2.53 eV), slightlyabove the ITT of gold, and found the electron–phononcoupling G in gold to be 1.5 × 10¹⁶ W/(m3K), which isless than values using other probe wavelengths. A recentstudy showed the electron–phonon coupling factor Gwas less influenced by non-thermalized electrons at highpump fluences (up to 10.7 J/m2) because of the higherrate of electron–electron scattering [9]. Energy couplingbetween electrons and phonons across interface has alsobeen studied, and a linear relation between the electron–phonon interfacial thermal conductance and the electrontemperature was found in Au films using both 800 nm aspump and probe wavelengths [10].
This work investigates interface electron–phonon cou-pling across the gold-silicon interface. Electron and latticetemperatures in gold together with the lattice temperature
© Taylor & Francis Group, LLC
2 Q. YAO ET AL.
in silicon aremodeled to account for the electron–phononcoupling in gold and across the interface. The opticalresponse is computed using a modified temperature-dependent Drude–Lorentz model. The probe photonenergy is chosen as 2.53 eV to minimize the effect of non-thermalized electrons on the optical response and maxi-mize the effect of thermal modulation. The temperature-dependent electron–phonon coupling factor G is firstobtained from the experimental data on bulk gold. Thiscoupling factor is assumed independent of the thin filmthickness, and is used to find the temperature-dependentinterface resistance or conductance based on the experi-mental data on gold thin films.
Ultrafast optical measurements
We first discuss the transient reflectivity signals obtainedin the pump-and-probe experiments and their depen-dence on the probe wavelength in gold. Gold has beenwidely used as the temperature transducer in the stud-ies of ultrafast heat transfer. During femtosecond pump-probe experiments, the laser pulses interact with goldwith the following steps [1]: at the time when the pumppulse hits the gold surface, some of the electrons absorbphotons. These excited electrons can move into thematerial ballistically without interacting with the lattice.The initially photo-excited electrons are not in thermalequilibrium. The collisions among these thermally non-equilibrium electrons and with the un-excited electronsform an equilibrium Fermi–Dirac distribution, typicallywithin 10 s to 100 s of femtoseconds. This equilibriumstate can then be represented using an electron tempera-ture. Through the electron–phonon coupling process, theelectron temperature will decrease and the lattice tem-perature will increase. This electron–phonon interactiontypically takes several picoseconds until electrons andphonons reach thermal equilibrium.
The optical response resulting from the energy trans-fer process described above can be explained by the bandstructure of gold. Gold has a typical band structure as anoble metal. The free electrons in the s/p band follow theFermi–Dirac distribution [6]:
f (E,T ) = 1e(E−E f )/kBT + 1
(1)
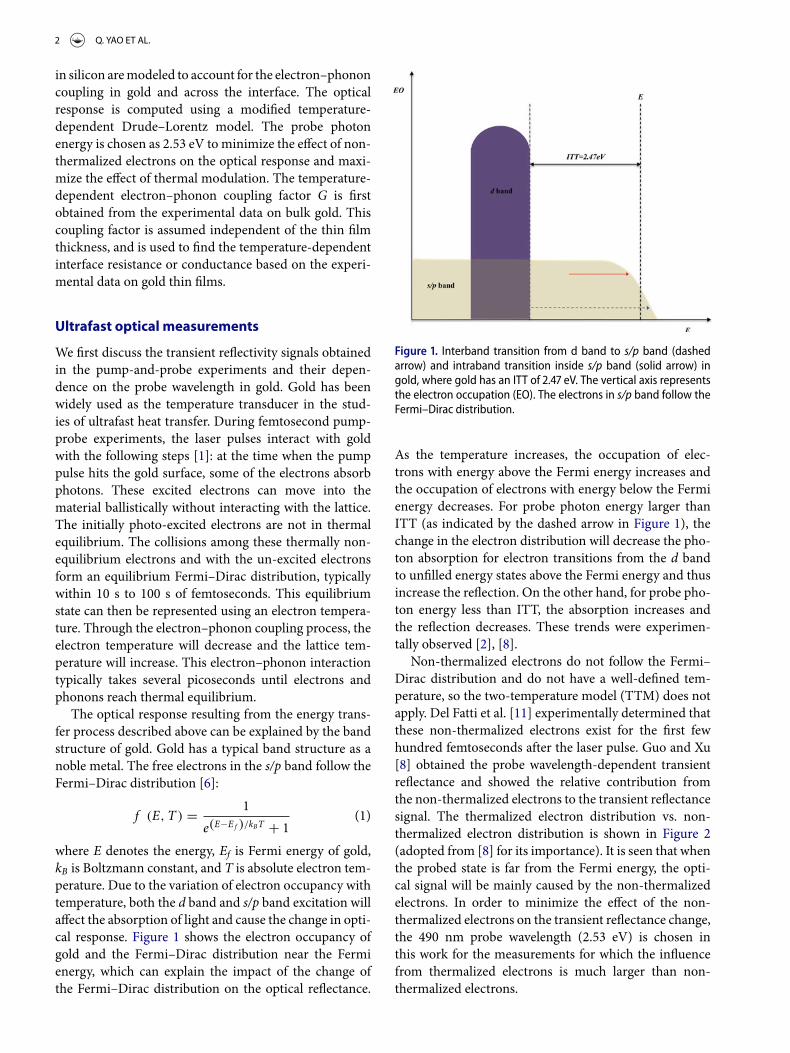
where E denotes the energy, Ef is Fermi energy of gold,kB is Boltzmann constant, and T is absolute electron tem-perature. Due to the variation of electron occupancy withtemperature, both the d band and s/p band excitation willaffect the absorption of light and cause the change in opti-cal response. Figure 1 shows the electron occupancy ofgold and the Fermi–Dirac distribution near the Fermienergy, which can explain the impact of the change ofthe Fermi–Dirac distribution on the optical reflectance.
Figure . Interband transition from d band to s/p band (dashedarrow) and intraband transition inside s/p band (solid arrow) ingold, where gold has an ITT of . eV. The vertical axis representsthe electron occupation (EO). The electrons in s/p band follow theFermi–Dirac distribution.
As the temperature increases, the occupation of elec-trons with energy above the Fermi energy increases andthe occupation of electrons with energy below the Fermienergy decreases. For probe photon energy larger thanITT (as indicated by the dashed arrow in Figure 1), thechange in the electron distribution will decrease the pho-ton absorption for electron transitions from the d bandto unfilled energy states above the Fermi energy and thusincrease the reflection. On the other hand, for probe pho-ton energy less than ITT, the absorption increases andthe reflection decreases. These trends were experimen-tally observed [2], [8].
Non-thermalized electrons do not follow the Fermi–Dirac distribution and do not have a well-defined tem-perature, so the two-temperature model (TTM) does notapply. Del Fatti et al. [11] experimentally determined thatthese non-thermalized electrons exist for the first fewhundred femtoseconds after the laser pulse. Guo and Xu[8] obtained the probe wavelength-dependent transientreflectance and showed the relative contribution fromthe non-thermalized electrons to the transient reflectancesignal. The thermalized electron distribution vs. non-thermalized electron distribution is shown in Figure 2(adopted from [8] for its importance). It is seen that whenthe probed state is far from the Fermi energy, the opti-cal signal will be mainly caused by the non-thermalizedelectrons. In order to minimize the effect of the non-thermalized electrons on the transient reflectance change,the 490 nm probe wavelength (2.53 eV) is chosen inthis work for the measurements for which the influencefrom thermalized electrons is much larger than non-thermalized electrons.

HEAT TRANSFER ENGINEERING 3
Figure . Electron distribution change for non-thermalized elec-trons and thermalized electrons created by an nm pulse, thedashed line indicates the detected state by the probe energy of. eV ( nm) and therefore the change from non-thermalizedelectrons is much less than that from thermalized electrons(adopted from []).
Experiment configuration
ATi-Sapphire amplified femtosecond laser is used to gen-erate laser pulses with 100 fs pulse width, central wave-length at 800 nm, and repetition rate of 5 kHz. A collinearpump and probe technique is used by dividing the laserbeam into a relatively weak probe beam and higher powerpump beam. The pump beam is focused to a 29.8 μmradius on the sample. The probe beam is sent to an opti-cal parametric amplifier (OPA), which generates tunablewavelengths with nonlinear processes. The output fromthe OPA is fixed at the 490 nm wavelength in order toreduce the effect of non-thermalized electrons as dis-cussed above. The probe spot radius is 13.8 μm, smallerthan half of the pump spot radius. A computer-controlledmechanical delay stage is used to adjust the time delaybetween the pump and the probe beams in femtosecondtime step.
Gold films were deposited on silicon substrates usingelectron beam evaporation. The substrates were cleanedusing toluene, acetone, methanol, and isopropanol beforethe gold deposition. Thin gold films with thicknessesof 24 nm, 39 nm, and 65 nm, and bulk gold (>1 µmthick gold film on silicon) are measured at varyingpump fluences. The bulk gold sample is used to identifythe interface-independent factors such as the electron–phonon coupling within the gold film, and helps to dis-tinguish thermal conductance across the interface andthe electron–phonon coupling within the films. The oxidelayer that develops over the silicon substrate is extremelythin and electrons are assumed to tunnel through thislayer and couple with the silicon phonons.
Numerical models
The two-temperaturemetal-dielectric interfacemodel
The interaction between electrons and phonons, whenthere exists thermal non-equilibrium between electronsand phonons within the metal, can be described by theTTM [12]–[14]:
Ce∂Te∂t
= ke∂2Te∂x2
− G(Te − Tp) + S (2a)
Cp∂Tp
∂t= kp
∂2Tp
∂x2+ G(Te − Tp) (2b)
Cs∂Ts∂t
= ks∂2Ts∂x2
(2c)
With interface conditions [15]:
−ke∂Te∂x
∣∣∣∣∣∣x=L
= Te − TsRes
∣∣∣∣∣∣x=L
(3a)
−kp∂Tp
∂x
∣∣∣∣∣∣x=L
= Tp − TsRps
∣∣∣∣∣∣x=L
(3b)
−ks∂Ts∂x
∣∣∣∣∣∣x=L
= Te − TsRes
∣∣∣∣∣∣x=L
+ Tp − TsRps
∣∣∣∣∣∣x=L
(3c)
The subscripts e, p, and s stand for electrons, phononsand substrate, respectively. R is the thermal resistancebetween interfaces. Ce and Cp are the respective heatcapacities of electrons and lattice and ke, kp denote thethermal conductivity of electrons and phonons. Withthis formulation, the interaction between electrons andphonons in gold is represented using the coupling factorG, while the possible interaction between electrons in thinfilms with phonons in the substrate is accounted for in theinterface energy transport, Eq. (3a). Hence,G is treated asindependent of the film thickness.
The laser source term S is given as [16]:
S = 0.941 − R
(δ + δb)(1 − e−L/(δ+δb)
).Jtpexp
[−x
δ + δb− 2.77
(ttp
)2]
(4)
This equation represents a temporal Gaussian pulsewith the consideration of the ballistic motion of electronsand thermal absorption in the x-direction. tp is the fullwidth at half maximum of the laser pulse, R is the reflec-tivity of gold film at the pump wavelength calculatedusing the multilayer approach, L denotes the thicknessof sample, δb is the ballistic range of electrons which istaken as 100 nm [16], J is the fluence of laser beam, andδ is the optical absorption depth.

4 Q. YAO ET AL.
The Drude–Lorentzmodel for optical responses
As discussed earlier, a close to ITT probe beam witha wavelength of 490 nm is used in order to mini-mize the effects from the non-thermalized electrons. TheDrudemodel combinedwith Lorentz oscillators is neededto describe the interband transition in metal, and isimplemented here to describe the relation among theelectron temperature, the phonon temperature, and theprobewavelengthwith the temperature dependent dielec-tric function and the resulting temperature dependentreflectance. Earlier studies applied only the Drude modelto bridge TTM with reflectance signals [5], [10], [15]where 800 nm probe photon energy was used for intra-band transition of electrons. It should be noted that inter-band transition could happen even with the probe energyless than ITT to states below the Fermi energy, whereholes are formed in the s/p band due to excitations of thesestates to higher states.
The combined Drude–Lorentz model for gold consid-ers two Lorentz oscillators at 330 nm and 470 nm to pro-duce a close agreement with the dielectric constant atroom temperature [17]. This model is expressed as:
ε = ε∞ − ω2p
ω (ω + i�0)+ L1 (ω) + L2 (ω) (5)
where the first two terms are the contributions of theDrude model. L1 and L2 are the Lorentz oscillators thatdescribe the contributions of interband transitions. ε� isthe high frequency limit of dielectric constant, �0 is theDrude damping term which stands for the scattering rateof free electrons, ωp is the plasma frequency (1.37 × 10¹⁶
rad/s in Au [6]). The two interband transition terms areexpressed as [17]:
Li (ω) = Di [eiφi (ωi − ω − i�i)μi + e−iφi (ωi + ω + i�i)
μi ](6)
Di is the amplitude for the oscillator, ωi is the resonantfrequency, φi is the phase,μi is the order of pole, which isused to characterize the dielectric constant involving sev-eral close transitions (-1 for both transitions of gold), and�i is the damping factor. Thismodel has proven to be con-sistent with the Kramers–Kronig relation [17], [18].
The damping factor can be described as a result ofelectron–electron scattering and electron–phonon scat-tering and is expressed as [6], [15], [19]:
�i = Aeei T 2e + BepiTp +Yi (7)
The subscripts i are 0, 1, and 2 for the Drude termand the two Lorentz terms, respectively. For the damp-ing factor in the Drude model �0, the coefficient describ-ing electron–electron scattering Aee0 is taken as 1.2 ×10⁷ s−1K−2 which is obtained from the low tempera-ture Fermi liquid theory [20]. Bep0 is chosen as 3.6 ×
1011 s−1K−1 which is predicted by matching the experi-mental results of dielectric constant at room temperature[21]. The electron–electron scattering rate of Lorentzianoscillators Aee1, Aee2 are assumed to be the same as thosein the Drude model Aee0. Bep1, Bep2 are determined usingroom temperature optical constants with Eq. (7) [17]. Wealso found that a temperature-independent term Yi needsto be included for the Lorentzian oscillators (Y0 is taken tobe 0), in order to fit the entire optical response. Y1, Y2 arefound to be 7.9 × 10¹⁴ rad/s and 1.9 × 10¹⁵ rad/s, respec-tively. All the parameters are listed in Table 1.
The calculated dielectric constant (ε = ε1 + iε2) atroom temperaturematches with what is given in [17], andthis model also provides a temperature- and wavelength-dependent dielectric constant as shown in Figure 3. Acloser examination of the difference between the dielec-tric constant at elevated temperaures and room temper-ature shows that the change of the real part of dielectricconstant ε1 at 490 nm is more significant compared withthose at the neighboring wavelengths (Figure 3a). Thus,the transient reflectance is largely influenced by the realpart of the dielectric constant ε1. The reflectivity is calcu-lated from the dielectric function as [22]:
R = |ε| − √2 (ε1 + |ε|) + 1
|ε| + √2 (ε1 + |ε|) + 1
(8a)
|ε|2 = ε21 + ε22 (8b)
The depth-dependent temperature of the film andhence the depth-dependent dielectric constant is takeninto account using the multilayer approach. A larger vari-ation of the reflectivity at 490 nm than the neighboringwavelengths was observed in [8]. Thus, using the probewavelength near ITT not only minimizes the effect ofnon-thermalized electrons, but also provides the largestoptical response for improving the signal-to-noise ratio.
The electron–phonon coupling factor G is regarded astemperature dependent. Its relation with Aee0 and Bep0 inthe Drude model can be expressed as [23]:
G (T ) = G0
(Aee0Bep0
(Te + Tp
) + 1)
(9)
Table . Summary of the parameters in the Drude–Lorentz model.
Value Parameter (units) Value
Aee, Aee, Aee (s−K−) .× Y (rad/s)
Bep (s−K−) .× Y (rad/s) .×
Bep (s−K−) .× Y (rad/s) .×
Bep (s−K−) .× D (m
−) .×
φ, φ (rad) −π / D (m−) .×
� (rad/s) .× μ ,μ (rad) −ε� . ω (rad/s) .×
ωp (rad/s) .× ω (rad/s) .×

HEAT TRANSFER ENGINEERING 5
Figure. Calculated real part (a) and imaginarypart (b) of dielec-tric constant ε and ε vs. wavelength and temperature using theDrude–Lorentz model.
where G0 can be considered as the room temperatureelectron–phonon coupling factor. Eq. (9) is valid underthe conditions of Aee0 << Bep0, Te, Tp >TD and Te < TFwhere TD is the Debye temperature and TF is the Fermitemperature [23]. Te and Tp in our measurement rangefrom 300 K to 6000 K, TD is 170 K, and TF is 6.39 × 10⁴
K for gold, which satisfy these conditions.
Experiment results and discussions
The experiments are carried out on Au-Si samples withdifferent thicknesses of gold (24 nm, 39 nm, 65 nm, and1 µm (bulk)) and different pump fluences (33.0 J/m2,74.3 J/m2, and 116 J/m2). In Figure 4, the data of the bulkgold film is shown and is used to find the coupling fac-tor G0. For these pump fluences, as Figure 4a shows, thecoupling between electrons and phonons within the goldfilm is almost fluence independent. This is because ballis-tic transport exists in bulk gold. Photo-excited electronsare transferred deep into the material and the tempera-ture rise is lower. The value of G0 is found to be 1.4 ×
Figure . (a) Experiment result of bulk gold using nm probeand nm pump with pump fluence at ., ., and J/m.(b) Fitting result of bulk Au at . J/m with electron–phonon cou-pling Go as .× W/(mK).
1016 W/(m3K). This value is similar to that found in [8](1.5 × 1016 W/(m3K)), the difference being that animproved dielectric constant model is used in this work,resulting in an excellent fit to the experimental data for theentire duration of the measurement as seen in Figure 4b.The maximum electron temperatures obtained at thesefluences are 463 K, 620 K, and 751 K. These temperaturesare relatively low, and thus result in almost the same Gaccording to Eq. (9) and almost the same cooling ratesshown in Figure 4a.
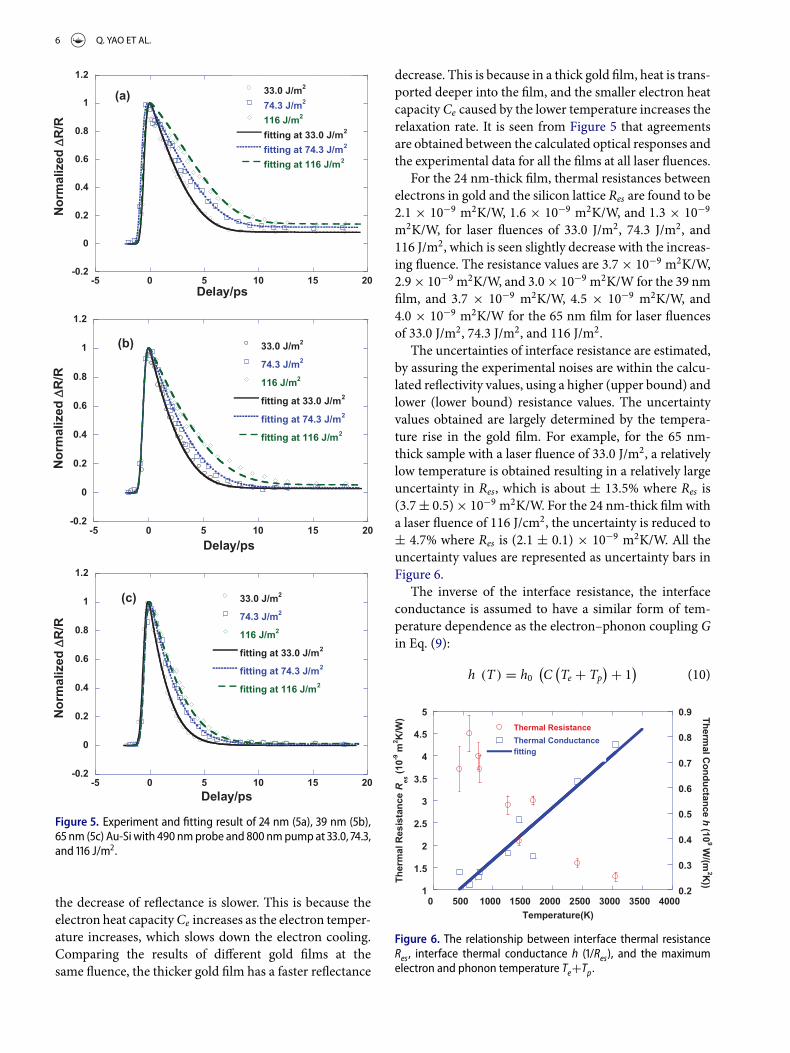
Figure 5 shows the measurement data for the 24 nm,39 nm, and 65 nm thick films, using pump fluences of33.0, 74.3, and 116 J/m2. For calculations, G0 is fixed as1.4 × 1016 W/(m3K), and the interface resistance Resbetween electrons and the substrate is taken as the fittingparameters to match the experimental data. Phonon-substrate coupling at the interface does not have influenceon the measured data over a range of three orders of mag-nitude [15], and is taken as 1.0 × 10⁻⁷ m2K/W. It is seenfrom the figures that when the pump fluence increases,
6 Q. YAO ET AL.
Figure . Experiment and fitting result of nm (a), nm (b), nm (c) Au-Si with nmprobe and nmpump at ., .,and J/m.
the decrease of reflectance is slower. This is because theelectron heat capacityCe increases as the electron temper-ature increases, which slows down the electron cooling.Comparing the results of different gold films at thesame fluence, the thicker gold film has a faster reflectance
decrease. This is because in a thick gold film, heat is trans-ported deeper into the film, and the smaller electron heatcapacity Ce caused by the lower temperature increases therelaxation rate. It is seen from Figure 5 that agreementsare obtained between the calculated optical responses andthe experimental data for all the films at all laser fluences.
For the 24 nm-thick film, thermal resistances betweenelectrons in gold and the silicon lattice Res are found to be2.1 × 10−9 m2K/W, 1.6 × 10⁻⁹ m2K/W, and 1.3 × 10⁻⁹
m2K/W, for laser fluences of 33.0 J/m2, 74.3 J/m2, and116 J/m2, which is seen slightly decrease with the increas-ing fluence. The resistance values are 3.7 × 10⁻⁹ m2K/W,2.9× 10−9 m2K/W, and 3.0× 10⁻⁹ m2K/W for the 39 nmfilm, and 3.7 × 10⁻⁹ m2K/W, 4.5 × 10⁻⁹ m2K/W, and4.0 × 10−9 m2K/W for the 65 nm film for laser fluencesof 33.0 J/m2, 74.3 J/m2, and 116 J/m2.
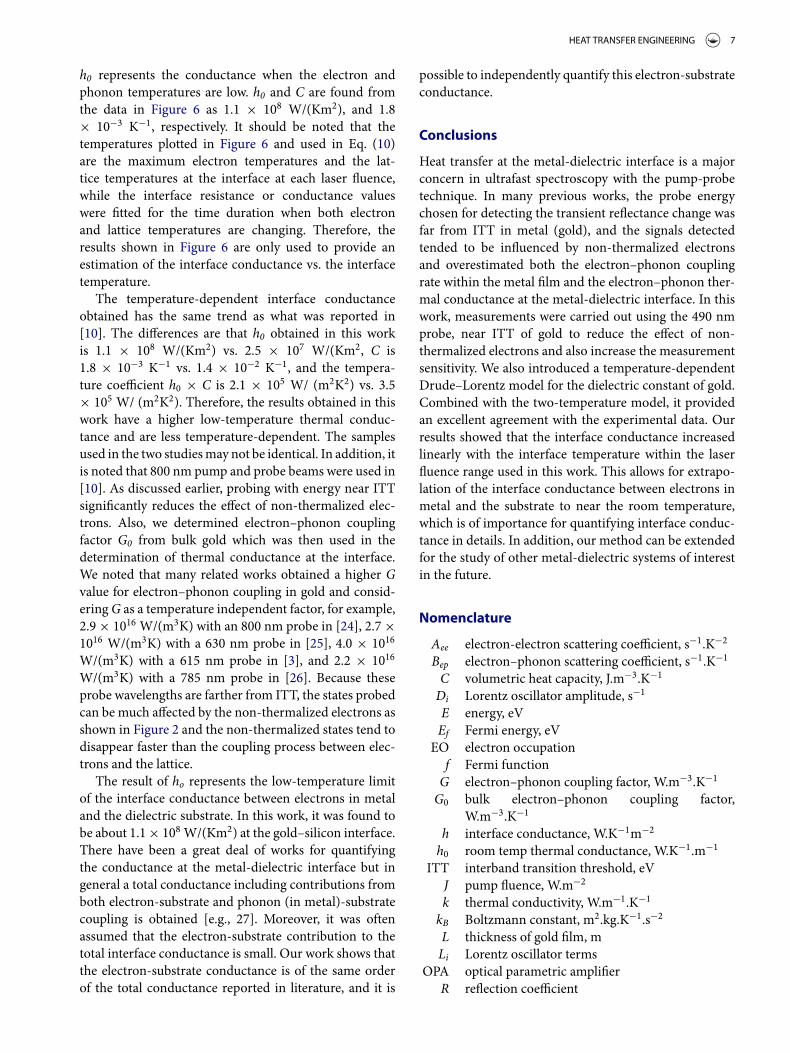
The uncertainties of interface resistance are estimated,by assuring the experimental noises are within the calcu-lated reflectivity values, using a higher (upper bound) andlower (lower bound) resistance values. The uncertaintyvalues obtained are largely determined by the tempera-ture rise in the gold film. For example, for the 65 nm-thick sample with a laser fluence of 33.0 J/m2, a relativelylow temperature is obtained resulting in a relatively largeuncertainty in Res, which is about ± 13.5% where Res is(3.7± 0.5)× 10−9 m2K/W. For the 24 nm-thick film witha laser fluence of 116 J/cm2, the uncertainty is reduced to± 4.7% where Res is (2.1 ± 0.1) × 10−9 m2K/W. All theuncertainty values are represented as uncertainty bars inFigure 6.
The inverse of the interface resistance, the interfaceconductance is assumed to have a similar form of tem-perature dependence as the electron–phonon coupling Gin Eq. (9):
h (T ) = h0(C
(Te + Tp
) + 1)
(10)
Figure . The relationship between interface thermal resistanceRes, interface thermal conductance h (/Res), and the maximumelectron and phonon temperature Te+Tp.
HEAT TRANSFER ENGINEERING 7
h0 represents the conductance when the electron andphonon temperatures are low. h0 and C are found fromthe data in Figure 6 as 1.1 × 10⁸ W/(Km2), and 1.8× 10⁻³ K−1, respectively. It should be noted that thetemperatures plotted in Figure 6 and used in Eq. (10)are the maximum electron temperatures and the lat-tice temperatures at the interface at each laser fluence,while the interface resistance or conductance valueswere fitted for the time duration when both electronand lattice temperatures are changing. Therefore, theresults shown in Figure 6 are only used to provide anestimation of the interface conductance vs. the interfacetemperature.
The temperature-dependent interface conductanceobtained has the same trend as what was reported in[10]. The differences are that h0 obtained in this workis 1.1 × 10⁸ W/(Km2) vs. 2.5 × 10⁷ W/(Km2, C is1.8 × 10−3 K−1 vs. 1.4 × 10⁻² K−1, and the tempera-ture coefficient h0 × C is 2.1 × 10⁵ W/ (m2K2) vs. 3.5× 10⁵ W/ (m2K2). Therefore, the results obtained in thiswork have a higher low-temperature thermal conduc-tance and are less temperature-dependent. The samplesused in the two studiesmay not be identical. In addition, itis noted that 800 nm pump and probe beams were used in[10]. As discussed earlier, probing with energy near ITTsignificantly reduces the effect of non-thermalized elec-trons. Also, we determined electron–phonon couplingfactor G0 from bulk gold which was then used in thedetermination of thermal conductance at the interface.We noted that many related works obtained a higher Gvalue for electron–phonon coupling in gold and consid-eringG as a temperature independent factor, for example,2.9 × 1016 W/(m3K) with an 800 nm probe in [24], 2.7 ×10¹⁶ W/(m3K) with a 630 nm probe in [25], 4.0 × 10¹⁶
W/(m3K) with a 615 nm probe in [3], and 2.2 × 10¹⁶
W/(m3K) with a 785 nm probe in [26]. Because theseprobe wavelengths are farther from ITT, the states probedcan be much affected by the non-thermalized electrons asshown in Figure 2 and the non-thermalized states tend todisappear faster than the coupling process between elec-trons and the lattice.
The result of ho represents the low-temperature limitof the interface conductance between electrons in metaland the dielectric substrate. In this work, it was found tobe about 1.1× 10⁸ W/(Km2) at the gold–silicon interface.There have been a great deal of works for quantifyingthe conductance at the metal-dielectric interface but ingeneral a total conductance including contributions fromboth electron-substrate and phonon (in metal)-substratecoupling is obtained [e.g., 27]. Moreover, it was oftenassumed that the electron-substrate contribution to thetotal interface conductance is small. Our work shows thatthe electron-substrate conductance is of the same orderof the total conductance reported in literature, and it is
possible to independently quantify this electron-substrateconductance.
Conclusions
Heat transfer at the metal-dielectric interface is a majorconcern in ultrafast spectroscopy with the pump-probetechnique. In many previous works, the probe energychosen for detecting the transient reflectance change wasfar from ITT in metal (gold), and the signals detectedtended to be influenced by non-thermalized electronsand overestimated both the electron–phonon couplingrate within the metal film and the electron–phonon ther-mal conductance at the metal-dielectric interface. In thiswork, measurements were carried out using the 490 nmprobe, near ITT of gold to reduce the effect of non-thermalized electrons and also increase the measurementsensitivity. We also introduced a temperature-dependentDrude–Lorentz model for the dielectric constant of gold.Combined with the two-temperature model, it providedan excellent agreement with the experimental data. Ourresults showed that the interface conductance increasedlinearly with the interface temperature within the laserfluence range used in this work. This allows for extrapo-lation of the interface conductance between electrons inmetal and the substrate to near the room temperature,which is of importance for quantifying interface conduc-tance in details. In addition, our method can be extendedfor the study of other metal-dielectric systems of interestin the future.
Nomenclature
Aee electron-electron scattering coefficient, s−1.K−2
Bep electron–phonon scattering coefficient, s−1.K−1
C volumetric heat capacity, J.m−3.K−1
Di Lorentz oscillator amplitude, s−1
E energy, eVEf Fermi energy, eV
EO electron occupationf Fermi functionG electron–phonon coupling factor, W.m−3.K−1
G0 bulk electron–phonon coupling factor,W.m−3.K−1
h interface conductance, W.K−1m−2
h0 room temp thermal conductance, W.K−1.m−1
ITT interband transition threshold, eVJ pump fluence, W.m−2
k thermal conductivity, W.m−1.K−1
kB Boltzmann constant, m2.kg.K−1.s−2
L thickness of gold film, mLi Lorentz oscillator terms
OPA optical parametric amplifierR reflection coefficient

8 Q. YAO ET AL.
Res electron substrate interface resistance, m2.K.W−1
Rps phonon substrate interface resistance, m2.K.W−1
S volumetric heat generation, W.m−3
t time, sT temperature, KT0 room temperature, KTF Fermi temperature, KTD Debye temperature, Ktp pulse duration, s
TTM two temperature modelx x coordinate, mYi temperature independent scattering coefficient,
s−1
Greek symbols
ε dielectric constantε1 real part of dielectric constantε2 imaginary part of dielectric constantε� high frequency permittivity
δ optical penetration depth, mδb electron ballistic length, mφi Lorentz oscillator phase, rad�0 Drude damping term, rad.s−1
�i Lorentz damping term, rad.s−1
μi order of poleω frequency, rad.s−1
ωp plasmon frequency, rad.s−1
ωi Lorentz oscillator resonant frequency, rad.s−1
Subscripts
e electronp phonons substrate0 Drude term1 first Lorentz oscillator term2 second Lorentz oscillator term
Acknowledgments
This work is supported in part byDARPAMESO (grant numberN66001-11-1-4107) and the department of Energy (Award No.DE-EE0005432) through theGeneralMotors.We also thankDr.Xiulin Ruan of the School of Mechanical Engineering, PurdueUniversity for valuable discussions.
Funding
This work is supported in part by DARPA MESO (grant num-ber N66001-11-1-4107), the department of Energy (Award No.DE-EE0005432) through the General Motors, and the NationalScience Foundation (Award No. 1462622-CMMI).
Notes on contributors
Qiaomu Yao received his Bach-elor’s degree in MechanicalEngineering at Xi’an JiaotongUniversity in 2013, and finishedhis Master degree in Mechani-cal Engineering and ComputerEngineering at Purdue Uni-versity at 2015. He worked inProf. Xianfan Xu’s group on theproject about Au-Si interfaceheat transfer on the nanoscalewith ultrafast laser during hisstudy at Purdue University from
2013 to 2015.Liang Guo received his Bach-elor’s degree in MechanicalEngineering at Tsinghua Uni-versity in 2009. He conductedgraduate research on nanoscaleheat transfer in Prof. XianfanXu’s group in Mechanical Engi-neering, Purdue University. Hisprojects include heat transferacross metal-dielectric inter-faces, wavelength tuning effectin TDTR, and phonon dynamicsin thermoelectrics based on
Bi2Te3 and skutterudites. He obtained his Ph.D degree in 2014,after which he utilized femtosecond four-wave mixing (FWMincluding two-pulse photo echo, three-pulse photo echo and2DES) to study energy transfer in novel semiconductors inProf. Graham Fleming’s group in Chemistry, University ofCalifornia, Berkeley. His current project is on exciton dynamicsin monolayer transition metal dichalcogenides (TMDCs).
Vasudevan Iyer received hisBachelor’s degree in Mechan-ical Engineering from IndianInstitute of Technology Madrasin 2014. He is currently pursu-ing his PhD degree at PurdueUniversity in Professor XianfanXu’s group. His research interestsinclude optical techniques usingultrafast lasers to study heat andelectronic transport in metalsand semiconductors.
Xianfan Xu is the James J. andCarol L. Shuttleworth Professorof Mechanical Engineering atPurdue University. He receivedB.Eng. in Engineering Thermo-physics from the University ofScience andTechnology of Chinain 1989, and M.S. and Ph.D. inMechanical Engineering fromthe University of California,Berkeley in 1991 and 1994.His current research is focusedon heat transfer in nanoscale
HEAT TRANSFER ENGINEERING 9
materials, heat transfer in micro and nanoscale materialsprocessing and manufacturing, fundamentals of nanoscaleradiation, and applications in nanoscale materials processingand manufacturing. He has written about 400 publications,including over 170 archival journal papers, 6 book chapters, andmany conference papers and technical reports, and has givenover 100 invited talks. He is a Fellow of ASME and a Fellow ofSPIE – the International Society for Optics and Photonics. Hereceived the ASME Heat Transfer Memorial Award in 2014.
References
[1] J. Hohlfeld et al., “Electron and lattice dynamics fol-lowing optical excitation of metals,” Chem. Phys., vol.251, no. 1, pp. 237–258, Jan. 2000. doi:10.1016/S0301-0104(99)00330-4.
[2] T. Hatakeyama and K. Fushinobu, “Electro-thermalbehavior of a sub-micrometer bulk CMOS device: mod-eling of heat generation and prediction of temperatures,”Heat Transf. Eng., vol. 29, no. 2, pp. 120–133, Feb. 2008.doi:10.1080/01457630701673162.
[3] H. E. Elsayed-Ali, T. Juhasz, G. O. Smith, and W. E.Bron, “Femtosecond thermoreflectivity and thermotrans-missivity of polycrystalline and single-crystalline goldfilms,” Phys. Rev. B, vol. 43, no. 5, pp. 4488–4491, Feb.1991. doi:10.1103/PhysRevB.43.4488.
[4] W. S. Fann, R. Storz, H. W. K. Tom, and J. Bokor, “Directmeasurement of nonequilibrium electron-energy distri-butions in subpicosecond laser-heated gold films,” Phys.Rev. Lett., vol. 68, no. 18, pp. 2834–2837, May. 1992.doi:10.1103/PhysRevLett.68.2834.
[5] A. N. Smith and P. M. Norris, “Influence of intrabandtransitions on the electron thermoreflectance response ofmetals,” Appl. Phys. Lett., vol. 78, no. 9, pp. 1240–1242,Feb. 2001. doi:10.1063/1.1351523.
[6] C. Kittel, Introduction to Solid State Physics. New York,NY, USA: John Wiley & Sons, Inc., 1976.
[7] C. K. Sun, F. Vallée, L. H. Acioli, E. P. Ippen, andJ. G. Fujimoto, “Femtosecond-tunable measure-ment of electron thermalization in gold,” Phys.Rev. B, vol. 50, no. 20, pp. 15337–15348, Nov. 1994.doi:10.1103/PhysRevB.50.15337.
[8] L. Guo and X. Xu, “Ultrafast spectroscopy of electron-phonon coupling in gold,” ASME J. Heat Transf.,vol. 136, no. 12, pp. 122401-122401-6, Sept. 2014.doi:10.1115/1.4028543.
[9] A. Giri, J. T. Gaskins, B. M. Foley, R. Cheaito, and P.E. Hopkins, “Experimental evidence of excited electronnumber density and temperature effects on electron-phonon coupling in gold films,” J. Appl. Phys., vol.117, no. 4, pp. 044305 (8 pages), Jan. 2015. doi:10.1063/1.4906553.
[10] P. E. Hopkins, J. L. Kassebaum, and P. M. Norris, “Effectsof electron scattering at metal–nonmetal interfaces onelectron-phonon equilibration in gold films,” J. Appl.Phys., vol. 105, no. 2, pp. 023710 (8 pages), Jan. 2009.doi:10.1063/1.3068476.
[11] N. Del Fatti et al., “Nonequilibrium electron dynamics innoble metals,” Phys. Rev. B, vol. 61, no. 24, pp. 16956–16966, Jan. 2000. doi:10.1103/PhysRevB.61.16956.
[12] S. I. Anisimov, B. L. Kapeliovich, and T. L. Perel’man,“Electron emission from metal surfaces exposed to
ultrashort laser pulses,” Sov. Phys. JETP, vol. 39, no. 2, pp.375–377, Aug. 1974.
[13] T. Q. Qiu and C. L. Tien, “Heat transfer mechanismsduring short-pulse laser heating of metals,” ASME J.Heat Transf., vol. 115, no. 4, pp. 835–841, Nov. 1993.doi:10.1115/1.2911377.
[14] A. Khadrawi and M. Al-Nimr, “Microscopic vs. macro-scopic hyperbolic heat conduction: validation criterionunder the effect of a moving heating source,” HeatTransfer Eng., vol. 26, no. 10, pp. 73–79, Oct. 2005.doi:10.1080/01457630500248703.
[15] L. Guo, S. L. Hodson, T. S. Fisher, and X. Xu, “Heat trans-fer acrossmetal-dielectric interfaces during ultrafast-laserheating,”ASME J. Heat Transf., vol. 134, no. 4, pp. 042402-042402-5, Feb. 2012. doi:10.1115/1.4005255.
[16] I. H. Chowdhury and X. Xu, “Heat transfer in fem-tosecond laser processing of metal,” Numer. HeatTransf., Part A, vol. 44, no. 3, pp. 219–232, Mar. 2003.doi:10.1080/716100504.
[17] P. G. Etchegoin, E. C. Le Ru, and M. Meyer, “An ana-lytic model for the optical properties of gold,” J. Chem.Phys, vol. 125, no. 16, pp. 164705 (3 pages), Oct. 2006.doi:10.1063/1.2360270.
[18] D. Barchiesi and T. Grosges, “Fitting the optical con-stants of gold, silver, chromium, titanium, and alu-minum in the visible bandwidth,” J. Nanophoton.,vol. 8, no. 1, pp. 083097 (16 pages), Jan. 2014. doi:10.1117/1.JNP.8.083097.
[19] N. W. Ashcroft and N. D. Mermin, Solid State Physics.Philadelphia, PA, USA: W. B. Saunders, 1976.
[20] A. H. MacDonald, “Electron-Phonon enhancement ofelectron-electron scattering in Al,” Phys. Rev. Lett., vol. 44,no. 7, pp. 489–493, Feb. 1980. doi:10.1103/PhysRevLett.44.489.
[21] P. B. Johnson, and R.W. Christy, “Optical constants of thenoble metals,” Phys. Rev. B, vol. 6, no. 12, pp. 4370–4379,Dec. 1972. doi:10.1103/PhysRevB.6.4370.
[22] F. L. Pedrotti, L. S. Pedrotti, and L. M. Pedrotti, Intro-duction to Optics. Upper Saddle River, NJ, USA: PearsonPrentice Hall, 2007.
[23] J. K. Chen, W. P. Latham, and J. E. Beraun, “The roleof electron–phonon coupling in ultrafast laser heating,”J. Laser Appl., vol. 17, no. 1, pp. 63–68, Feb. 2005.doi:10.2351/1.1848522.
[24] J. L. Hostetler, A. N. Smith, D. M. Czajkowsky, and P. M.Norris, “Measurement of the electron-phonon couplingfactor dependence on film thickness and grain size in Au,Cr, and Al,” Appl. Opt., vol. 38, no. 16, pp. 3614–3620, Jan.1999. doi:10.1364/AO.38.003614.
[25] S. D. Brorson et al., “Femtosecond room-temperaturemeasurement of the electron-phonon coupling con-stant λ in metallic superconductors,” Phys. Rev.Lett., vol. 64, no. 18, pp. 2172–2175, Apr. 1990.doi:10.1103/PhysRevLett.64.2172.
[26] G.-M. Choi, R. B. Wilson, and D. G. Cahill, “Indi-rect heating of Pt by short-pulse laser irradiationof Au in a Nanoscale Pt/Au Bilayer,” Phys. Rev.B, vol. 89, no. 6, pp. 064307 (7 pages), Jan. 2014.doi:10.1103/PhysRevB.89.064307.
[27] H.-K. Lyeo and D. G. Cahill, “Thermal conductanceof interfaces between highly dissimilar materials,” Phys.Rev. B, vol. 73, no. 14, pp. 144301 (6 pages), Apr. 2006.doi:10.1103/PhysRevB.73.144301.