electron-phonon coupling and superconductivity in the
TRANSCRIPT

PHYSICAL REVIEW B 102, 104511 (2020)
Electron-phonon coupling and superconductivityin the doped topological crystalline insulator (Pb0.5Sn0.5)1−xInxTe
A. Sapkota ,1 Y. Li,1 B. L. Winn,2 A. Podlesnyak ,2 Guangyong Xu,3 Zhijun Xu,3,4 Kejing Ran,5 Tong Chen,6 Jian Sun ,6,7
Jinsheng Wen,6,7 Lihua Wu ,8 Jihui Yang,8 Qiang Li,1 G. D. Gu,1 and J. M. Tranquada 1
1Condensed Matter Physics and Materials Science Division, Brookhaven National Laboratory, Upton, New York 11973, USA2Neutron Scattering Division, Oak Ridge National Laboratory, Oak Ridge, Tennessee 37831, USA
3National Institute of Standards and Technology Center for Neutron Research, National Institute of Standards and Technology,Gaithersburg, Maryland 20899, USA
4Department of Materials Science and Engineering, University of Maryland, College Park, Maryland 20742, USA5School of Physical Science and Technology, ShanghaiTech University, Shanghai 201210, China
6National Laboratory of Solid State Microstructures and Department of Physics, Nanjing University, Nanjing 210093, China7Collaborative Innovation Center of Advanced Microstructures, Nanjing University, Nanjing 210093, China8Materials Science and Engineering Department, University of Washington, Seattle, Washington 98195, USA
(Received 6 July 2020; revised 2 September 2020; accepted 7 September 2020; published 23 September 2020)
We present a neutron-scattering study of phonons in single crystals of (Pb0.5Sn0.5)1−xInxTe with x = 0(metallic, but nonsuperconducting) and x = 0.2 (nonmetallic normal state, but superconducting). We map thephonon dispersions (more completely for x = 0) and find general consistency with theoretical calculations,except for the transverse and longitudinal optical (LO) modes at the Brillouin-zone center. At low temperature,both modes are strongly damped but sit at a finite energy (≈4 meV in both samples), shifting to higher energyat room temperature. These modes are soft due to a proximate structural instability driven by the sensitivity ofPb-Te and Sn-Te p-orbital hybridization to off-center displacements of the metal atoms. The impact of the softoptical modes on the low-energy acoustic modes is inferred from the low thermal conductivity, especially atlow temperature. Given that the strongest electron-phonon coupling is predicted for the LO mode, which shouldbe similar for both studied compositions, it is intriguing that only the In-doped crystal is superconducting. Inaddition, we observe elastic diffuse (Huang) scattering that is qualitatively explained by the difference in Pb-Teand Sn-Te bond lengths within the lattice of randomly distributed Pb and Sn sites. We also confirm the presence ofanomalous diffuse low-energy atomic vibrations that we speculatively attribute to local fluctuations of individualPb atoms between off-center sites.
DOI: 10.1103/PhysRevB.102.104511
I. INTRODUCTION
The system Pb1−ySnyTe has been of recent interest becauseof the theoretical prediction [1] and experimental confirmation[2–5] that this material is a topological crystalline insulator(TCI) [6] (for y � 0.3 [7]). Furthermore, partial substitutionof indium induces superconductivity, with a transition temper-ature, Tc, as high as 4.7 K [8,9], while the normal state, fromwhich the superconductivity develops, is nonmetallic, with alarge resistivity [10].
Calculations of phonons and electron-phonon couplingusing density-functional perturbation theory [11] yield anelectron-phonon coupling constant that is large and suffi-cient to explain the superconducting transition temperature,Tc, in In-doped Pb1−ySnyTe [12] and SnTe [13], assumingthat the assumptions behind the Allen-Dynes modification ofthe McMillan formula [14] are satisfied. There are reasons toquestion that for In-doped Pb1−ySnyTe.
(1) The strongest electron-phonon coupling involves thelongitudinal optical (LO) mode, which has the potential to berelatively soft at the zone center.
(2) The nonmetallic normal state [10,12] is inconsistentwith the assumption of a Fermi liquid.
(3) The value of 1.4 calculated for the electron-phononcoupling constant is near the limit of validity of Migdal-Eliashberg theory [15,16].
Indeed, while the calculated phonon density of states(PDOS) describes most of the experimental features for(Pb0.5Sn0.5)1−xInxTe, the observation of anomalous low-frequency modes [12] provided the motivation for the presentpaper.
In this paper, we apply inelastic neutron scattering (INS)to single-crystal samples of (Pb0.5Sn0.5)1−xInxTe with x = 0and 0.2 and determine their lattice dynamics. With a morecomplete set of measurements on the x = 0 crystal, we findthat its normal modes are reasonably consistent with thephonons calculated by density-functional perturbation theory[12]. An interesting difference is that, while the calculationwas done for an insulating compound which can have a largeLO–transverse optical (TO) splitting, our sample is weaklymetallic (probably due to vacancies), so that the LO and TOenergies must be equal at �. We find this energy is ≈4 meV
2469-9950/2020/102(10)/104511(13) 104511-1 ©2020 American Physical Society

A. SAPKOTA et al. PHYSICAL REVIEW B 102, 104511 (2020)
and that the modes are strongly damped. The x = 0.2 crystalshows a similarly soft TO mode.
Beyond the normal modes, we demonstrate that there areno extra dispersive modes with zone-boundary energies of<3 meV. Nevertheless, we do confirm evidence for diffuseexcitations at energies below ≈2 meV, consistent with theprevious measurements on powder samples [12]. These exci-tations do not exhibit a conventional temperature dependence,having an intensity that appears to remain constant withtemperature. We propose that these excitations are due tooff-center Pb ions independently fluctuating between differentequivalent positions.
In the elastic channel, we observe Huang diffuse scattering.This is qualitatively explained by the differences betweenthe actual Pb-Te and Sn-Te bond lengths and the averagebond length of the lattice. We also present a measurementof the thermal conductivity, κ (T ) for the x = 0 crystal. It isunusually low, especially at low temperature, where the LOand TO zone-center modes are at the minimum energy. Fromthe small value of κ at low T , we infer that interactions of theLO and TO modes with the low-energy acoustic modes causessignificant damping.
The rest of this paper is organized as follows. In the fol-lowing section, we discuss some of the background issues ina bit more detail. Experimental details are given in Sec. III.The results are presented in Sec. IV, where we begin with theconventional aspects of the phonon dispersions, consider thetemperature and doping dependence of the soft zone-centerTO modes, present the thermal conductivity, and analyzethe lowest-energy zone-boundary dispersive modes. We thenpresent results for both elastic and inelastic diffuse scattering.In Sec. V, we discuss the possible causes of the low-energydiffuse scattering, and then consider some of the open ques-tions regarding the nature of the superconductivity in thissystem. A brief conclusion is presented in Sec. VI.
II. BACKGROUND ISSUES IN (Pb1−ySny)1−xInxTe
A. Basic electronic structure
If we consider a typical compound that adopts the rocksaltstructure, such as an alkali-metal halide, the electronicstructure is fairly simple. The alkali-metal ion will transfer itsone outer s electron to the halogen ion, filling the outer p shellof the latter. This results in a large insulating gap of ≈10 eV,reflecting the lack of significant hybridization between thesestates.
In SnTe and PbTe, the situation is different. The Te atomcan accept two electrons, whereas the Sn and Pb each havetwo s and two p electrons in their outer shells. If the Sn (Pb)were to give up all of its outer electrons, it would have avalence of 4+, which would clearly be incompatible with themaximum charge of 2− on Te.
The DFT calculations and analysis of Waghmare et al. [17]provide a helpful picture of what actually happens. The Sn5s (Pb 6s) states hybridize with the Te 5p states. Becausethe binding energy of the s state is relatively high, both thebonding and antibonding states are almost completely filled.In contrast, the hybridization of Sn (Pb) p states with Te 5presults in a filled bonding band and empty antibonding band;
there is a small band gap between these states, where onewould expect the chemical potential to lie.
B. Topological character
In PbTe, the states at the top of the valence band aredominated by Te 5p character, while Pb 6p states dominate thebottom of the conduction band. In SnTe, however, the statesabove the band gap, which occurs at the L points, have Te 5pcharacter. As a result of this inversion of the electronic struc-ture, SnTe is a TCI [1,6]. The topological character derivesfrom the mirror symmetry about a (110) plane. When onedopes with Pb, the symmetry is no longer exact; nevertheless,calculations show that the topological character survives inthe presence of disorder as long as the symmetry survives onaverage [5,7,18]. Studies of Pb1−ySnyTe with angle-resolvedphotoemission spectroscopy indicate that the transition fromtrivial insulator to TCI occurs near y ≈ 0.3 [3,4,19].
It is natural to wonder whether the superconducting statein (Pb0.5Sn0.5)1−xInxTe could be topological. If the supercon-ducting state is time-reversal invariant, then one would expectthe pairing to exhibit odd parity [20]. As already mentioned,scanning tunneling microscopy measurements on supercon-ducting (Pb0.5Sn0.5)0.7In0.3Te indicate a gap with s-wavesymmetry [21]. On the other hand, there is a recent reportof Josephson-junction measurements on SnTe nanowires indi-cating an s ± is′ gap, associated with time-reversal-symmetrybreaking [22], so this issue might not yet be settled.
C. In doping
The atomic orbital energy for In 5s electrons is a couple ofelectron volts higher than that for Sn 5s. As a result, when In issubstituted into SnTe, the antibonding band with Te 5p is ex-pected to sit near the chemical potential [23,24]. If these statesare filled (empty), the In should act as a +1 (+3) ion. Thisis similar to the valence-skipping behavior of Tl dopants inPbTe, which has been of interest for quite some time [25–27],and it is part of a pattern common to other superconductors,such as BaBiO3, as discussed by Varma [28]. Our empiricalobservations suggest that the story is slightly more compli-cated: one has to consider whether or not these states aredelocalized; a gradual crossover from localized to delocalizeddoped electron with increasing In concentration was indicatedby transport measurements on In-doped SnTe [29].
D. Structural instability
The rocksalt structure of SnTe is unstable to a distortion inwhich the Sn sublattice is displaced along a [111] directionrelative to the Te, resulting in a phase with rhombohedralsymmetry, as in GeTe [30,31]. The lattice distortion lowersthe electronic energy [32] by allowing a spatially anisotropicredistribution of the charge in the bands associated with theSn 5s and 5p bands [17]; in particular, there is a maximumof the calculated Sn 5s charge density in the direction of thethree long Sn-Te bonds, which allows enhanced hybridizationof the Sn 5p and Te 5p states along the three short Sn-Tebonds. It follows that the structural transition is electronicallydriven. At the transition, the frequency of the TO mode goes tozero [31]. If the compound is doped away from the insulating
104511-2

ELECTRON-PHONON COUPLING AND … PHYSICAL REVIEW B 102, 104511 (2020)
FIG. 1. Left: Phonon dispersions for (Pb0.5Sn0.5)1−xInxTe withx = 0.3 using density functional perturbation theory and the virtualcrystal approximation [12]. The area of symbols is proportional to thecalculated electron-phonon scattering rate. Right: Curves showingthe calculated phonon density of states (PDOS, blue), the Eliashbergfunction α2F (E ) for E = hω (green), and the electron-phonon cou-pling λ(E ), corresponding to a running integral of 2α2F (E )/E (red).
state, one would expect the soft phonons to show a strongcoupling to electrons. Figure 1 shows the dispersion of thephonons indicated by circles the area of which is propor-tional to the electron-phonon scattering rate, as calculatedfor (Pb0.5Sn0.5)1−xInxTe with x = 0.3 by density functionalperturbation theory, with pseudopotentials determined by thevirtual crystal approximation [33], and described in [12]; sim-ilar results have been reported recently for In-doped SnTe[13]. As one can see, the TO mode and especially the LOmode have a strong electron-phonon coupling in the vicinityof the � point. Moreover, the metallic state causes the TO andLO frequencies to be equal at �, where they are calculated tobe reasonably soft.
PbTe, in contrast, is stable in the rocksalt structure; how-ever, a recent theoretical analysis [34] supports experimentalevidence [35,36] for dynamic off-site Pb-Pb correlations in〈100〉 directions. Again, the calculations show that, withinthese correlated distortions, the Pb 6s charge density tends topile up on the long-bond side [34]. Now, PbTe also exhibitsa reasonably soft TO mode that has anharmonic interactionswith the longitudinal acoustic (LA) mode [37,38]. Severaltheoretical studies have addressed these anharmonic effects[39–41]. The anharmonic effects are particularly relevant toachieving low thermal conductivity and high thermoelectricperformance [42]. In our case, we are interested in supercon-ductivity, and hence the role of electronic states driving, orcoupled to, lattice instabilities is of key relevance.
We are not aware of any experimental reports of diffu-sive phonon modes in excess of the normal modes in eitherPbTe or SnTe. At the same time, we note that the diffuseexcitations were only identified through measurements of thephonon density of states on powders, while studies of phonondispersions have typically been done on single crystals.
III. EXPERIMENTAL DETAILS
Single crystals of (Pb0.5Sn0.5)1−xInxTe x = 0 and 0.2 weregrown using the modified floating-zone technique discussed inRefs. [9,10]. (Pb0.5Sn0.5)1−xInxTe has the cubic rocksalt struc-ture with Fm3m crystal symmetry; room-temperature latticeparameters are a = b = c = 6.392(2) and 6.372(2) Å for x =0 and 0.2, respectively. X-ray-diffraction measurements onpowdered versions of similarly grown crystals, demonstratingthe single-phase character, are shown in Fig. 2 of Ref. [10]and Fig. 1 of Ref. [12]. We will express the momentumtransfer Q = (H, K, L) in reciprocal-lattice units (r.l.u.) givenby (2π/a, 2π/b, 2π/c), and the momentum transfer withinthe first Brillouin zone is q = Q − τ = (ξ, η, ζ ), where τ is areciprocal-lattice vector.
INS measurements were carried out on a nonsuperconduct-ing single crystal Pb0.5Sn0.5Te (mass = 20 g) at the HybridSpectrometer (HYSPEC) at the Spallation Neutron Source(SNS) at Oak Ridge National Laboratory, and on a super-conducting single crystal (Pb0.5Sn0.5)1−xInxTe x = 0.2 (mass= 6 g), with Tc = 3.8 K [10], at the Cold Neutron ChopperSpectrometer (CNCS) [43,44] at SNS and the Spin PolarizedInelastic Neutron Spectrometer (SPINS) at the NIST Centerfor Neutron Research (NCNR). Each crystal was aligned with(H, H, 0) and (0, 0, L) in the horizontal scattering plane; thevertical direction corresponds to [K,−K, 0]. Samples werecooled using a closed-cycle He cryostat at HYSPEC and anorange He-flow cryostat at both CNCS and SPINS.
At HYSPEC, measurements were carried out with incidentenergies of Ei = 20 and 27 meV at T = 5 and 300 K; theyinvolved rotating the sample about its vertical axis in 1◦ stepsover a range of ≈130–135◦. At CNCS, the measurement wascarried out with Ei = 12 meV at T = 1.7 K, and by rotatingthe sample about its vertical axis in 1◦ steps over a range of≈130◦. At SPINS, the measurements were carried out with afixed final energy of 5 meV and using horizontal beam colli-mations of Guide-80′-S-80′-open (S = sample) together witha cooled Be filter after the sample to reduce higher-order neu-trons. Moreover, the measurements were done at T = 1.5, 5,and 20 K. Data were visualized using the DAVE MSLICE [45]and HORACE [46] software packages.
Thermal conductivity of an x = 0 crystal was measured ina physical property measurement system (Quantum Design)using the thermal transport option (TTO) from 2.1 to 300 K.Dynamic mode was used for establishing the steady stateunder a prefixed temperature gradient (�T/T = 1–3%). A Nistandard provided by Quantum Design was used for thermalconductivity calibration. Small humps in the thermal conduc-tivity versus temperature curve, noticeable at the temperaturesaround 75 and 275 K, are related to the change of temperaturegradient and to the relaxation-time fitting constant exceedingthe limit of the time period given by the equipment, a knownartifact in Quantum Design’s TTO.
IV. RESULTS AND ANALYSIS
A. Nuclear Bragg peaks
It is instructive to consider the conditions for Braggscattering in the rocksalt structure. The structure factor is
104511-3

A. SAPKOTA et al. PHYSICAL REVIEW B 102, 104511 (2020)
given by
F (H, K, L) ={4bA + 4bTe, H, K, L all even
4bA − 4bTe, H, K, L all odd0, otherwise
(1)
where bTe is the nuclear scattering length for Te and bA is theappropriate average scattering length for Pb, Sn, and In. Thesetwo distinct characters indicate that, at least for phonons nearthe zone center, the intensities of acoustic modes (whereneighboring atoms are moving in phase) will be largest whenH , K , and L are all even, while the intensities of optical modes(where neighboring atoms move against each other) shouldbe largest when H , K , and L are all odd. Note that if we hadordering of the Pb and Sn atom on the A sublattice it wouldbreak the symmetry and we would have a finite structurefactor for the case of mixed even and odd indices.
Figure 2(a) shows the elastic scattering for the x = 0 sam-ple in the (H, H, L) zone. While there is no intensity atpositions corresponding to mixed even and odd indices, indi-cating a random arrangement of Pb and Sn atoms, we do seeanother set of peaks indicated by white circles, as well as onepeak indicated by a square. Figure 2(b) shows that the white-circle peaks correspond to a second grain that is rotated by≈33◦ with respect to the first grain. The white-rectangle peakappears to be a (3,3,1) reflection from a small third grain witha rather different orientation. While it is not optimal to havethe extra, misoriented grains in the sample, it is neverthelesspossible to identify, with care, the phonon modes of the maingrain, as we will show. A similar situation also applies to thex = 0.2 crystal.
B. Phonon dispersions
1. Normal modes in Pb0.5Sn0.5Te
Figure 3 presents the low-temperature inelastic data forthe Pb0.5Sn0.5Te sample as color contour maps. From top tobottom, we show phonon dispersions along (0, 0, ζ ), (ξ, ξ , 0),and (ξ, ξ , ξ ). From left to right, we plot results measuredtransverse (or close to transverse) to Bragg points (wherethe scattering cross section should select transverse-polarizedmodes), followed by longitudinal measurements. Data ob-tained at Bragg points with all even Miller indices aredominated by the acoustic modes (columns 1 and 3 of Fig. 3),as expected. To see the optical modes, we have to look atthe data obtained near Bragg points with indices that are allodd (columns 2 and 4 of Fig. 3). For comparison, we haveoverplotted, as dashed lines, the relevant calculated phonondispersions.
In the first column, we see that the signal is strongly dom-inated by the TA mode, as expected, and that it is in goodqualitative agreement with the calculated dispersion. The sec-ond column shows the TO mode, as well as some weight fromthe TA. The calculated TO mode has a zone-center energyof just under 1 meV, whereas the data show a broad peakcentered near 4 meV (we will return to this later). Lookingat the measurements of the LA mode in the third column, wesee that there also appears to be significant weight from theTA mode; this is likely due to the coarse vertical resolutionat HYSPEC, associated with vertical focusing of the incidentneutron beam. If we compare the results for the LO mode
FIG. 2. (a) Elastic neutron-scattering spectra for Pb0.5Sn0.5Temeasured with an incident energy Ei = 20 meV at T = 5 K. Peaksenclosed by white circles and rectangles are from the secondarygrains present in the sample. (b) Same data as in (a) but with the co-ordinate grid rotated by ≈33◦ to highlight the indexing of peaks fromthe secondary grain indicated by circles. The weak peak enclosed bya rectangle appears to be from a third grain.
in column 4 with the LA results in column 3, we can seeevidence from the measured intensities that there must be anavoided crossing between the LA and LO modes along the(0, 0, ζ ) and (ξ, ξ , 0) directions. The weight that follows thecalculated LA mode from the zone center appears to matchmore closely the LO branch at the zone boundary [Figs. 3(c)and 3(g)], and the converse jump from LO to LA is apparentin the last column [Figs. 3(d) and 3(h)].
As already mentioned, the model calculation was done foran insulating phase, which allows the LO energy at � tobe large and different from the TO. In contrast, our sampleis metallic, so we expect that the LO and TO modes musthave equal energies at �, which would pull the LO energyfar below the calculated value. Looking at the data, we seerelatively strong LO intensity for intermediate wave vectors,
104511-4

ELECTRON-PHONON COUPLING AND … PHYSICAL REVIEW B 102, 104511 (2020)
FIG. 3. Color contour plots of inelastic-scattering intensity for Pb0.5Sn0.5Te, measured at T = 5 K with either Ei = 20 (a, g) or 27 meV(others), illustrating the phonon dispersions along three high-symmetry directions, (0, 0, ζ ), (ξ, ξ , 0), and (ξ, ξ , ξ ). Lines display the calculatedphonon dispersions [12]. Black, magenta, white, and red lines correspond to transverse acoustic (TA), transverse optical (TO), longitudinalacoustic (LA), and longitudinal optical (LO) modes. Same color dotted and dashed lines represent two branches, that are otherwise degenerate.The Bragg point corresponding to � is listed in the upper right of each panel. Labels at the top of each column (TA, TO, etc.) highlight thedominant phonon branches in the corresponding panels.
but it weakens on approaching �. (Keep in mind that thephonon intensity is inversely proportional to the energy.) Inthat vicinity, we see some distribution of intensity spread overa large energy range. To indicate what we expect might becalculated for a metallic model, we have plotted (with a thindashed line in the fourth column) a steep dispersion down tothe calculated TO energy at �. While the data do not show aclear continuous dispersion of this kind, we do see some extraintensity near � for E � 12 meV.
The qualitative agreement with the calculated dispersionsindicates that the observed normal modes correspond to theaverage lattice. Our data also appear to be a rough interpo-lation between previous results reported for PbTe and SnTe[31,37,38,47].
2. Temperature and doping dependence of the soft TO mode
We compare the doping and temperature dependence ofthe TO mode in Fig. 4. The top row shows color contourmaps of the TO dispersion along a [110] direction for thesuperconducting x = 0.2 sample at 1.7 K, and for the x = 0
sample at 5 and 300 K. To make a quantitative comparison ofthe q = 0 excitations, constant-Q cuts, with fits to a dampedharmonic oscillator, are shown in the bottom row; the resultingpeak energies and widths are listed in Table I. The lowestTO energy occurs for the x = 0 sample at low temperature,where it is overdamped. It hardens by 1.5 meV and sharpenson warming to room temperature. The case of the supercon-ducting sample at 1.7 K is somewhat intermediate with respectto those.
TABLE I. Parameters obtained from fits of the damped-harmonicoscillator formula to the TO minima shown in Figs. 4(d)–4(f).FWHM: full width at half maximum.
Sample T ETO FWHMx (K) (meV) (meV)
0.2 1.7 4.8 ± 0.2 3.6 ± 0.50.0 5 3.6 ± 0.2 4.0 ± 0.70.0 300 5.1 ± 0.2 2.4 ± 0.4
104511-5

A. SAPKOTA et al. PHYSICAL REVIEW B 102, 104511 (2020)
FIG. 4. Color contour maps of χ ′′(Q, E ) for (a) the superconducting x = 0.2 sample at 1.7 K [measured at CNCS with Ei = 12 meV nearQ = (1, 1, −3)], (b) the x = 0 sample at 5 K, and (c) the x = 0 sample at 300 K [measured at HYSPEC with Ei = 27 meV near (1, 1, −5)].[The strong feature near H = 0.5 in (b) and (c) is a TA mode from the (2, 2, −4) peak of the second grain.] Corresponding constant-Q cuts atq = 0 are plotted in (d), (e), and (f). Here, the data are averaged over ±0.05 r.l.u. in each in-plane direction of Q and ±0.07 r.l.u. out of plane,and a constant background, determined from the energy-gain side, has been subtracted. Blue lines show fits to a damped-harmonic-oscillatorfunction; fitting parameters are given in Table I. Error bars represent one standard deviation.
In the case of SnTe, the TO energy at the � point softens tozero at the transition to the ferroelectric state [31]. Based onmeasurements demonstrating the absence of such a displacivetransition in Pb1−ySnyTe at small y, the critical concentrationfor the completed transition was estimated to be near y = 0.5[48]. At the same time, the low-temperature ETO of our y =0.5, x = 0 crystal is slightly larger than that reported for y =0.2, and is actually comparable to that in PbTe [38], indicatingthat the trend is not trivial to estimate simply on the basis ofcomposition.
The measurements on the x = 0 sample in Figs. 4(b) and4(c) are in a zone where the TO structure factor is large butthe TA is small. Hence, it is interesting to note that the χ ′′amplitude of the TA mode near � seems to be enhanced at5 K compared to 300 K, which might indicate some mixing ofthe TO character into the TA as the TO mode softens. Whilepart of the TA amplitude change is partially compensatedby the temperature dependence of the Debye-Waller factor,comparisons of constant-Q cuts suggest that there may be areal effect. This may deserve attention in a future study.
As we have mentioned, our samples are essentially metal-lic, so we expect to have weight from the LO modeoverlapping with the TO at �. Of course, as we have seen forthe x = 0 sample in Fig. 3, the LO mode has to connect to thebranch up at ≈15 meV just a short distance from �. This maytake the form of the “waterfall” effect seen for the TO mode inrelaxor ferroelectrics [49,50]. While we do see hints of weaksignal near � at energies between 7 and 12 meV in Figs. 3(d),3(h) and 3(l), spreading a modest amount of spectral weightover such a large energy range may require more countingtime to detect convincingly.
3. Thermal conductivity
Figure 5 shows the temperature dependence of the thermalconductivity, κ , measured on our sample of Pb1−ySnyTe withy = 0.5, in comparison with reported results for samples withy = 0 [51] and 0.2 [52]. The κ (T ) for our sample does notshow a peak at low T , in contrast to the y = 0.2 data, and itgradually rises with T , becoming comparable in magnitude toκ for PbTe at room temperature.
How do we understand this behavior and what is its sig-nificance? In an insulator or semiconductor, the total thermal
FIG. 5. Temperature dependence of the thermal conductivity forPb1−ySnyTe with y = 0, 0.2, and 0.5. Orange circles, our measure-ment on y = 0.5; purple circles, results for y = 0.2 from Fig. 2 of[52]; gray diamonds, results for y = 0 from Fig. 2 of [51]. Error barsrepresent one standard deviation.
104511-6
ELECTRON-PHONON COUPLING AND … PHYSICAL REVIEW B 102, 104511 (2020)
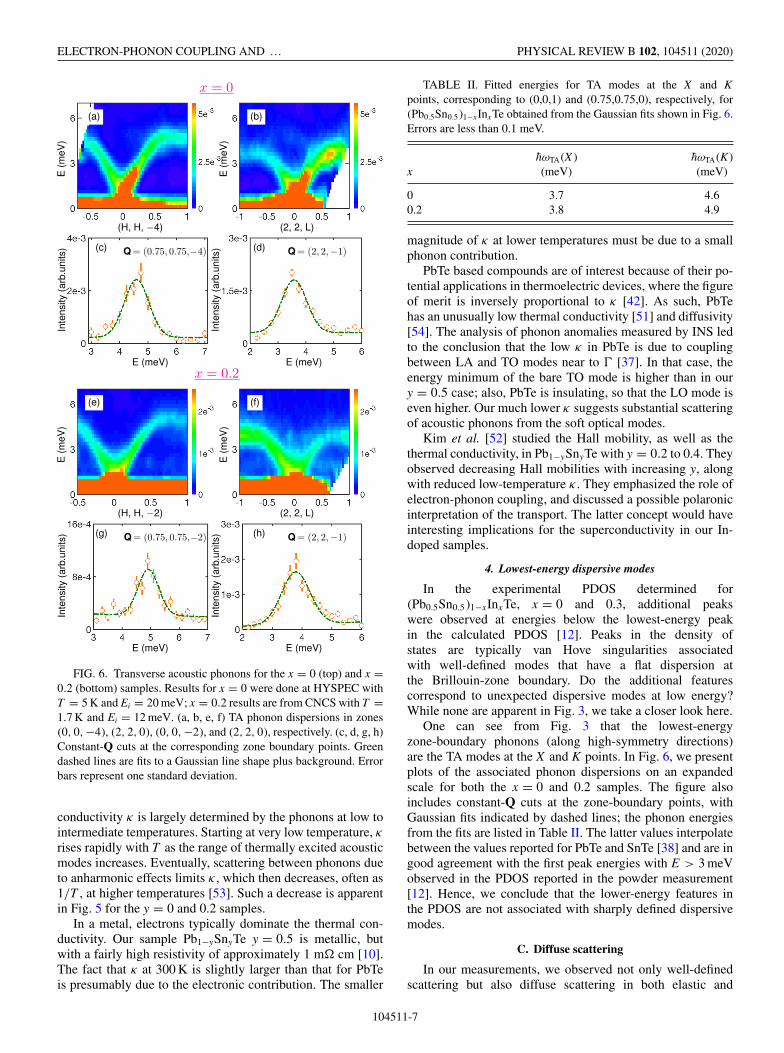
FIG. 6. Transverse acoustic phonons for the x = 0 (top) and x =0.2 (bottom) samples. Results for x = 0 were done at HYSPEC withT = 5 K and Ei = 20 meV; x = 0.2 results are from CNCS with T =1.7 K and Ei = 12 meV. (a, b, e, f) TA phonon dispersions in zones(0, 0, −4), (2, 2, 0), (0, 0, −2), and (2, 2, 0), respectively. (c, d, g, h)Constant-Q cuts at the corresponding zone boundary points. Greendashed lines are fits to a Gaussian line shape plus background. Errorbars represent one standard deviation.
conductivity κ is largely determined by the phonons at low tointermediate temperatures. Starting at very low temperature, κrises rapidly with T as the range of thermally excited acousticmodes increases. Eventually, scattering between phonons dueto anharmonic effects limits κ , which then decreases, often as1/T , at higher temperatures [53]. Such a decrease is apparentin Fig. 5 for the y = 0 and 0.2 samples.
In a metal, electrons typically dominate the thermal con-ductivity. Our sample Pb1−ySnyTe y = 0.5 is metallic, butwith a fairly high resistivity of approximately 1 m cm [10].The fact that κ at 300 K is slightly larger than that for PbTeis presumably due to the electronic contribution. The smaller
TABLE II. Fitted energies for TA modes at the X and Kpoints, corresponding to (0,0,1) and (0.75,0.75,0), respectively, for(Pb0.5Sn0.5)1−xInxTe obtained from the Gaussian fits shown in Fig. 6.Errors are less than 0.1 meV.
hωTA(X ) hωTA(K)x (meV) (meV)
0 3.7 4.60.2 3.8 4.9
magnitude of κ at lower temperatures must be due to a smallphonon contribution.
PbTe based compounds are of interest because of their po-tential applications in thermoelectric devices, where the figureof merit is inversely proportional to κ [42]. As such, PbTehas an unusually low thermal conductivity [51] and diffusivity[54]. The analysis of phonon anomalies measured by INS ledto the conclusion that the low κ in PbTe is due to couplingbetween LA and TO modes near to � [37]. In that case, theenergy minimum of the bare TO mode is higher than in oury = 0.5 case; also, PbTe is insulating, so that the LO mode iseven higher. Our much lower κ suggests substantial scatteringof acoustic phonons from the soft optical modes.
Kim et al. [52] studied the Hall mobility, as well as thethermal conductivity, in Pb1−ySnyTe with y = 0.2 to 0.4. Theyobserved decreasing Hall mobilities with increasing y, alongwith reduced low-temperature κ . They emphasized the role ofelectron-phonon coupling, and discussed a possible polaronicinterpretation of the transport. The latter concept would haveinteresting implications for the superconductivity in our In-doped samples.
4. Lowest-energy dispersive modes
In the experimental PDOS determined for(Pb0.5Sn0.5)1−xInxTe, x = 0 and 0.3, additional peakswere observed at energies below the lowest-energy peakin the calculated PDOS [12]. Peaks in the density ofstates are typically van Hove singularities associatedwith well-defined modes that have a flat dispersion atthe Brillouin-zone boundary. Do the additional featurescorrespond to unexpected dispersive modes at low energy?While none are apparent in Fig. 3, we take a closer look here.
One can see from Fig. 3 that the lowest-energyzone-boundary phonons (along high-symmetry directions)are the TA modes at the X and K points. In Fig. 6, we presentplots of the associated phonon dispersions on an expandedscale for both the x = 0 and 0.2 samples. The figure alsoincludes constant-Q cuts at the zone-boundary points, withGaussian fits indicated by dashed lines; the phonon energiesfrom the fits are listed in Table II. The latter values interpolatebetween the values reported for PbTe and SnTe [38] and are ingood agreement with the first peak energies with E > 3 meVobserved in the PDOS reported in the powder measurement[12]. Hence, we conclude that the lower-energy features inthe PDOS are not associated with sharply defined dispersivemodes.
C. Diffuse scattering
In our measurements, we observed not only well-definedscattering but also diffuse scattering in both elastic and
104511-7

A. SAPKOTA et al. PHYSICAL REVIEW B 102, 104511 (2020)
FIG. 7. (a) Elastic intensity showing diffuse scattering nearBragg peaks measured on the x = 0 sample at 5 K. (b) Modelcalculation, as discussed in the text; red dots indicate Bragg peakpositions.
inelastic channels. Below are the discussions of these diffusescatterings.
1. Diffuse elastic scattering
While the absence of Bragg peaks with mixed (odd andeven) Miller indices indicates that the Pb and Sn atoms arenot ordered, local structural correlations are still possible. Inparticular, extended x-ray-absorption fine-structure studies ofsolid solutions of alkali-metal halides, such as (K1−xRbx)Br[55], and lead chalcogenides, such as Pb(Te1−xSex) [56], haveshown that the nearest-neighbor distances follow a bimodaldistribution. For each distinct pair, the average nearest-neighbor distance is in between that of a pure compoundand the average separation in the solid solution. Because theatomic positions deviate from the average structure, thereshould be diffuse elastic scattering near the Bragg peak po-sitions, commonly known as Huang scattering [57–59].
Figure 7(a) shows the elastic scattering for the x = 0 sam-ple at low temperature, plotted on an expanded intensity scalethat allows one to see the diffuse scattering near the Braggpeaks. Note that this scattering is rather asymmetric, appear-ing to the low-Q side of the Bragg peaks with all-even Millerindices. To model the scattering, we used the cluster shown inFig. 8. This represents a cluster of either SnTe or PbTe; bothare included in the final result. The central four sites have aweight of 1, while the outer 18 sites are weighted by 0.2.The bond length equals half of the lattice parameter, whichis equal to 6.466, 6.392, and 6.318 Å for PbTe, Pb0.5Sn0.5Te,and SnTe, respectively [10,60]. To model the PbTe and SnTebond lengths in the solid solution, we took the values of
FIG. 8. Illustration of the cluster used to calculate the diffusescattering due to bond-length variations. Magenta, Sn or Pb; blue,Te. Smaller spheres are weighted as a fraction of the large spheres.
the pure materials and adjusted them to symmetrically re-duce the difference by 40%. Starting with SnTe, we calculatethe structure factor for the cluster with the appropriate bondlength, and then subtract the structure factor for the averagecomposition and bond length. We then repeat this for PbTe,and for the different possible orientations of Q with respect tothe clusters. The sum of the squared structure factors for eachof the clusters and orientations is plotted in Fig. 7(b).
The calculation agrees qualitatively with the data. For morequantitative agreement, one would likely need to do a calcu-lation that does an appropriate average over all possible localclusters. Such a calculation is beyond the scope of this paper;a qualitative understanding is judged to be sufficient for ourpurposes.
2. Diffuse vibrational modes
As mentioned in the Introduction, an important motivationof the present paper is to identify the nature of the unexpectedlow-energy features in the PDOS [12] and their possible con-nection with superconductivity. We have already shown thatthey are not associated with standard dispersive modes. Herewe look at the inelastic diffuse scattering.
To test for the anomalous features in the single-crystaldata for our x = 0 sample, Fig. 9(a) shows the range of ourmeasurements and three boxes in which we evaluated theeffective PDOS G(E ) using the formula
〈S(Q, E )〉 ∼ Q2 G(E )
E[1 + n(E )] (2)
where the angle brackets indicate an average over the directionof Q and n(E ) is the Bose factor. Before extracting G(E ) fromthe angle-averaged data, a constant background determinedfrom the energy-gain region of −10 to −5 meV for the 5 Kdata (where the phonon signal is negligible) was subtracted(from both the 5 and 300 K data), and the elastic scatter-ing was fit with a Gaussian and subtracted, as illustrated inFigs. 9(b) and 9(c).
The effective PDOS obtained from the regions A, B, and Care compared for temperatures of 5 and 300 K in Figs. 9(f),9(d) and 9(e), respectively. In each case, we see a low-energyenhancement at 5 K compared to 300 K. The energy rangeof extra weight is consistent with the results from powdersamples [12], but the fact that the contribution to the PDOSis reduced at 300 K is different.
A striking feature in Ref. [12] is that, for a supercon-ducting sample with x = 0.3, the lowest-energy features inQ-integrated χ ′′(E ) increase on cooling below Tc. To test forsuch behavior in our superconducting x = 0.2 crystal, mea-surements were performed on the triple-axis SPINS on thecold source at the NCNR. This was not an optimal measure-ment for diffuse vibrational scattering because the momentumrange that could be explored was limited by the availableneutron energies and only a single point can be measured atone time; nevertheless, the results shown in Fig. 10 provideimportant clues.
For Q = (0, 0, 2.5) and (1.7,1.7,0), well separated fromBragg points, we observe excitations at energies below 1 meV.When converted to χ ′′(Q, E ) (panels at right), these exci-tations appear to grow as the temperature goes down, but
104511-8

ELECTRON-PHONON COUPLING AND … PHYSICAL REVIEW B 102, 104511 (2020)
FIG. 9. PDOS for nonsuperconducting sample x = 0. (a) Map ofelastic scattering with boxes (labeled A, B, C) indicating regions usedto evaluate the effective PDOS, as discussed in the text. (b) S(E ) ob-tained from an average over box B for T = 5 K; constant backgroundestimated from the energy-gain side has been subtracted. The greensolid line is a Gaussian fit to the elastic peak. (c) Phonon density ofstates (PDOS) obtained from S(E ) (b) using Eq. (2), after subtractingthe fit to the elastic scattering. (d)–(f) Temperature dependence ofeffective PDOS evaluated for boxes B, C, and A, respectively; blue(red) symbols, T = 5 K (300 K). Error bars represent one standarddeviation.
this occurs above as well as below Tc. If we look insteadat S(Q, E ) (middle panels), the intensity of the excitationsappears to be independent of temperature. The weight at lowenergy is stronger than in the PDOS, because, as one can seefrom Eq. (2), G(E ) is corrected for the 1/E cross section forphonons. But G(E ) is also corrected for the thermal factor,which makes its temperature dependence similar to χ ′′(Q, E ).If the anomalous low-energy features have an intensity thatdoes not change with temperature, then in G(E ) they wouldappear to decrease substantially on warming to 300 K, as weobserve.
V. DISCUSSION
A. Interpreting the diffuse excitations
We have confirmed that the unexpected low-energyfeatures previously discovered in the PDOS of(Pb0.5Sn0.5)1−xInxTe [12] are diffuse; they cannot beexplained as some sort of unanticipated normal modes. These
diffuse excitations are likely to be local atomic fluctuationsthat are made possible by atomic disorder. They are not atrivial consequence of the disorder of Pb and Sn atoms onone sublattice of the crystal, as the collective behavior is welldescribed by the six normal modes expected for the rocksaltstructure.
As already mentioned, SnTe goes through a ferroelectrictransition at low temperature, with Sn atoms displaced ina [111] direction. On warming, the lattice expands and thestructure returns to the higher-symmetry cubic phase. WithPb substitution, we expect the Sn-Te bond length to expandsomewhat. The elastic diffuse scattering provides evidencethat Sn-Te and Pb-Te bond lengths are different, but studiesof mixed compounds with the rocksalt structure have demon-strated that the bimodal bond lengths tend to be in betweenthose of the pure compounds and the average of the mixedphase [55,56]. By this argument, the Sn-Te bond length shouldbe expanded relative to the pure compound, which wouldmove these bonds away from structural instability.
The situation goes in the opposite direction for Pb-Tebonds. PbTe has no structural transition; however, calculationsindicate that the Pb atoms have a tendency to move off centerin the [100] direction [34]. Under pressure, PbTe transforms toan orthorhombic phase with significant displacements along[100] and a splitting of nearest-neighbor bond lengths [61].Hence, the reduced Pb-Te bond lengths induced by alloyingwith Sn are likely to result in Pb moving to off-center po-sitions; they enhance the electronic hybridization which canthen favor modulated Pb-Te bond lengths. Because of thelack of order on the Pb/Sn sites, collective displacementsof Pb atoms are destabilized. Thus, each Pb site may havemultiple energetically equivalent off-center sites. It is thenplausible that Pb atoms are perpetually hopping or tunnelingamong these equivalent sites. If there is never any order-ing, then the intensity of these fluctuations will not changewith temperature. This anomalous temperature dependencehas similarities to certain octahedral tilt fluctuations observedin La2−xSrxCuO4 [62].
The low-frequency weight in the PDOS is enhanced by Indoping [12]. The In substitution results in a further reductionin average bond length [10], and this may increase the fractionof Pb sites that exhibit off-center fluctuations.
B. Implications for superconductivity
Our understanding of the diffuse modes suggests that theiranomalous temperature dependence in the density-of-statesstudy [12] is not directly connected to the superconduct-ing transition. Instead, our single-crystal study has exposedfeatures that were hidden in the powder study, such as thezone-center optical modes, where the LO mode is predictedto have the strongest coupling to the electrons.
Our measurements show that the TO mode is fairly soft at� in both our superconducting and nonsuperconducting sam-ples. Calculations (Fig. 1) indicate that the electron-phononcoupling is significant for the TO mode, but it is even strongerfor the LO mode, especially near �. We have not attemptedto analyze the phonon linewidths here, because it is not clearthat we can distinguish contributions due to electrons fromeffects of intrinsic elemental disorder. Nevertheless, the small
104511-9

A. SAPKOTA et al. PHYSICAL REVIEW B 102, 104511 (2020)
FIG. 10. Inelastic-scattering results on the superconducting x = 0.2 sample (Tc = 3.8 K) measured at SPINS. (a, b) Constant-Q scans withGaussian fits (green dashed lines) to the elastic scattering. Black dotted lines are background obtained from −E (energy gain) data points. (c,d) S(Q, E ) vs E for (0, 0, 2.5) and (1.7, 1.7, 0), respectively, for several temperatures (legend at top). (e, f) χ ′′(Q, E ) vs E for (0, 0, 2.5) and(1.7, 1.7, 0), respectively. The indicated 2�(0) (dotted maroon lines) is twice the superconducting gap at zero temperature estimated from Tc.Error bars represent one standard deviation.
magnitude of the thermal conductivity indicates significantscattering of the acoustic modes, likely from the soft opticalmodes. It is important to keep in mind that the soft TO andLO modes are due to an electronically driven structural nearinstability, so that interactions that can be characterized asanharmonic are also relevant to electronic response.
Looking back at measurements of phonon linewidths inthe related superconductor, Sn0.8In0.2Te, broadening of TAphonons at small q was observed [63]. This would be consis-tent with coupling to the soft zone-center TO and LO modes.To the extent that it involves electron coupling, it would sug-gest an interaction that involves electrons on the same smallFermi pocket, and not “intervalley” interactions (scatteringbetween pockets) as originally proposed [64].
Measurements of the resistivity for our sample compo-sitions show that x = 0 is more metallic [65]. Adding asmall amount of In initially causes the compound to becomeextremely insulating, followed by a drop in resistivity andappearance of superconductivity; however, the superconduc-tivity appears in the presence of a nonmetallic normal state[9]. The substantial resistivity could be evidence of signif-icant electron-phonon coupling, but the lack of coherenceraises questions about the applicability of the conventionalmodel for superconductivity. Recent studies have made thecase for the “unreasonable effectiveness” of Eliashberg theoryfor non-Fermi-liquid systems [66,67]. Even in cases of lowcarrier density, where Migdal-Eliashberg theory breaks down,appropriate solutions to the pairing gap equations have beenfound [68]. So the superconductivity in our x = 0.2 sampleappears to be covered by recent theoretical developments.
One thing that these analyses do not trivially explain, how-ever, is why our x = 0 sample is not superconducting. Thiscomposition (probably doped through vacancies) is metallic
and appears to have similar phonon character to the super-conducting case of x = 0.2. The difference seems to be thepresence of In, which also causes the sample to have holelike,rather than electronlike, charge carriers. Hirsch [69,70] hasargued that holelike carriers are a requirement for supercon-ductivity. Could (Pb0.5Sn0.5)1−xInxTe be a demonstration ofthat? Alternatively, does the valence-skipping character of Inprovide a negative-U effect that drives the pairing [28]? Or isanother option needed?
VI. SUMMARY
We have used INS to investigate the lattice vibrations incrystals of (Pb0.5Sn0.5)1−xInxTe, one superconducting (x =0.2) and one nonsuperconducting (x = 0). From the measure-ments on the x = 0 sample, we have identified the expectedset of normal modes, which are in qualitative agreement withcalculated dispersions. For both samples, we have found thatthe zone-center TO mode is fairly soft. In addition, we havedemonstrated that the low-energy features (below 3 meV)found previously in PDOS of powder samples correspond toweak diffuse scattering that appears below the lowest-energyTA modes at the zone boundary. We have proposed that theinelastic diffuse scattering is associated with local vibrationsof Pb atoms between off-center sites. The thermal conductiv-ity in the x = 0 sample is unusually low, even compared withPbTe, which indicates significant phonon scattering, whichmay involve interactions with both the soft optical modes andthe local atomic vibrations.
The incipient instabilities that drive the phonon anomaliesare driven by electronic hybridization effects associated withunfilled p states on the Sn and Pb atoms [71]. These interac-tions are significant in both of our samples; however, only one
104511-10

ELECTRON-PHONON COUPLING AND … PHYSICAL REVIEW B 102, 104511 (2020)
is superconducting. We have discussed possible explanationsof this result; however, further research is required to reach aunique conclusion.
ACKNOWLEDGMENTS
The work at Brookhaven National Laboratory was sup-ported by the Office of Basic Energy Sciences, MaterialsSciences and Engineering Division, U.S. Department ofEnergy (DOE) under Contract No. DE-SC0012704. This re-search used resources at the Spallation Neutron Source, aDOE Office of Science User Facility operated by the Oak
Ridge National Laboratory. We acknowledge the support ofthe National Institute of Standards and Technology, U.S. De-partment of Commerce, in providing the neutron researchfacilities used in this work. J.S.W. was supported by the Na-tional Natural Science Foundation of China under Grants No.11822405 and No. 11674157, and the Natural Science Foun-dation of Jiangsu Province under Grant No. BK20180006.L.W. and J.Y. acknowledge the National Science Foundationfor its support on this project with award No. 1915933.
Any mention of commercial products within this paper isfor information only; it does not imply recommendation orendorsement by NIST.
[1] T. H. Hsieh, H. Lin, J. Liu, W. Duan, A. Bansil, and L. Fu,Topological crystalline insulators in the SnTe material class,Nat. Commun. 3, 982 (2012).
[2] Y. Tanaka, Z. Ren, T. Sato, K. Nakayama, S. Souma, T.Takahashi, K. Segawa, and Y. Ando, Experimental realizationof a topological crystalline insulator in SnTe, Nat. Phys. 8, 800(2012).
[3] S.-Y. Xu, C. Liu, N. Alidoust, M. Neupane, D. Qian, I.Belopolski, J. D. Denlinger, Y. J. Wang, H. Lin, L. A. Wray, G.Landolt, B. Slomski, J. H. Dil, A. Marcinkova, E. Morosan, Q.Gibson, R. Sankar, F. C. Chou, R. J. Cava, A. Bansil, and M. Z.Hasan, Observation of a topological crystalline insulator phaseand topological phase transition in Pb1−xSnxTe, Nat. Commun.3, 1192 (2012).
[4] Y. Tanaka, T. Sato, K. Nakayama, S. Souma, T. Takahashi, Z.Ren, M. Novak, K. Segawa, and Y. Ando, Tunability of the k-space location of the Dirac cones in the topological crystallineinsulator Pb1−xSnxTe, Phys. Rev. B 87, 155105 (2013).
[5] Y. Ando and L. Fu, Topological crystalline insulators and topo-logical superconductors: From concepts to materials, Annu.Rev. Condens. Matter Phys. 6, 361 (2015).
[6] L. Fu, Topological Crystalline Insulators, Phys. Rev. Lett. 106,106802 (2011).
[7] D. Varjas, M. Fruchart, A. R. Akhmerov, and P. M. Perez-Piskunow, Computation of topological phase diagram ofdisordered Pb1−xSnxTe using the kernel polynomial method,Phys. Rev. Research 2, 013229 (2020).
[8] R. V. Parfen’ev, D. V. Shamshur, and S. A. Nemov, Supercon-ductivity of (Sn1−zPbz )1−xInxTe alloys, Phys. Solid State 43,1845 (2001).
[9] R. Zhong, J. Schneeloch, Q. Li, W. Ku, J. Tranquada, and G.Gu, Indium Substitution Effect on the Topological CrystallineInsulator Family (Pb1−xSnx )1−yInyTe: Topological and Super-conducting Properties, Crystals 7, 55 (2017).
[10] R. D. Zhong, J. A. Schneeloch, T. S. Liu, F. E. Camino, J. M.Tranquada, and G. D. Gu, Superconductivity induced by In sub-stitution into the topological crystalline insulator Pb0.5Sn0.5Te,Phys. Rev. B 90, 020505(R) (2014).
[11] S. Baroni, S. de Gironcoli, A. Dal Corso, and P. Giannozzi,Phonons and related crystal properties from density-functionalperturbation theory, Rev. Mod. Phys. 73, 515 (2001).
[12] K. Ran, R. Zhong, T. Chen, Y. Gan, J. Wang, B. L. Winn,A. D. Christianson, S. Li, Z. Ma, S. Bao, Z. Cai, G. Xu, J. M.Tranquada, G. Gu, J. Sun, and J. Wen, Unusual phonon density
of states and response to the superconducting transition in theIn-doped topological crystalline insulator Pb0.5Sn0.5Te, Phys.Rev. B 97, 220502(R) (2018).
[13] T. Nomoto, M. Kawamura, T. Koretsune, R. Arita, T. Machida,T. Hanaguri, M. Kriener, Y. Taguchi, and Y. Tokura, Micro-scopic characterization of the superconducting gap function inSn1−xInxTe, Phys. Rev. B 101, 014505 (2020).
[14] P. B. Allen and R. C. Dynes, Transition temperature of strong-coupled superconductors reanalyzed, Phys. Rev. B 12, 905(1975).
[15] I. Esterlis, B. Nosarzewski, E. W. Huang, B. Moritz, T. P.Devereaux, D. J. Scalapino, and S. A. Kivelson, Breakdown ofthe Migdal-Eliashberg theory: A determinant quantum MonteCarlo study, Phys. Rev. B 97, 140501(R) (2018).
[16] I. Esterlis, S. A. Kivelson, and D. J. Scalapino, Pseudogapcrossover in the electron-phonon system, Phys. Rev. B 99,174516 (2019).
[17] U. V. Waghmare, N. A. Spaldin, H. C. Kandpal, and R.Seshadri, First-principles indicators of metallicity and cationoff-centricity in the IV-VI rocksalt chalcogenides of divalentGe, Sn, and Pb, Phys. Rev. B 67, 125111 (2003).
[18] A. Łusakowski, P. Bogusławski, and T. Story, Alloy broad-ening of the transition to the nontrivial topological phase ofPb1−xSnxTe, Phys. Rev. B 98, 125203 (2018).
[19] C. Yan, J. Liu, Y. Zang, J. Wang, Z. Wang, P. Wang,Z.-D. Zhang, L. Wang, X. Ma, S. Ji, K. He, L. Fu, W.Duan, Q.-K. Xue, and X. Chen, Experimental Observationof Dirac-like Surface States and Topological Phase Transi-tion in Pb1−xSnxTe(111) Films, Phys. Rev. Lett. 112, 186801(2014).
[20] K. Michaeli and L. Fu, Spin-Orbit Locking as a ProtectionMechanism of the Odd-Parity Superconducting State againstDisorder, Phys. Rev. Lett. 109, 187003 (2012).
[21] G. Du, Z. Du, D. Fang, H. Yang, R. D. Zhong, J. Schneeloch,G. D. Gu, and H.-H. Wen, Fully gapped superconductivity in In-doped topological crystalline insulator Pb0.5Sn0.5Te, Phys. Rev.B 92, 020512(R) (2015).
[22] C. J. Trimble, M. T. Wei, N. F. Q. Yuan, S. S. Kalantre, P.Liu, H. J. Han, M. G. Han, Y. Zhu, J. J. Cha, L. Fu, and J. R.Williams, Josephson detection of time reversal symmetry bro-ken superconductivity in SnTe nanowires, arXiv:1907.04199.
[23] X. J. Tan, G. Q. Liu, J. T. Xu, H. Z. Shao, J. Jiang, and H. C.Jiang, Element-selective resonant state in M-doped SnTe (M =Ga, In, and Tl), Phys. Chem. Chem. Phys. 18, 20635 (2016).
104511-11

A. SAPKOTA et al. PHYSICAL REVIEW B 102, 104511 (2020)
[24] X. Tan, H. Wang, G. Liu, J. G. Noudem, H. Hu, J. Xu, H. Shao,and J. Jiang, Designing band engineering for thermoelectricsstarting from the periodic table of elements, Mater. Today Phys.7, 35 (2018).
[25] Y. Matsushita, H. Bluhm, T. H. Geballe, and I. R. Fisher, Ev-idence for Charge Kondo Effect in Superconducting Tl-DopedPbTe, Phys. Rev. Lett. 94, 157002 (2005).
[26] T. H. Geballe, R. H. Hammond, and P. M. Wu, What Tc tells,Physica C 514, 9 (2015).
[27] P. Giraldo-Gallo, P. Walmsley, B. Sangiorgio, S. C. Riggs, R. D.McDonald, L. Buchauer, B. Fauqué, C. Liu, N. A. Spaldin, A.Kaminski, K. Behnia, and I. R. Fisher, Evidence of IncoherentCarriers Associated with Resonant Impurity Levels and TheirInfluence on Superconductivity in the Anomalous Supercon-ductor Pb1−xTlxTe, Phys. Rev. Lett. 121, 207001 (2018).
[28] C. M. Varma, Missing Valence States, Diamagnetic Insulators,and Superconductors, Phys. Rev. Lett. 61, 2713 (1988).
[29] C. Zhang, X.-G. He, H. Chi, R. Zhong, W. Ku, G. Gu,J. M. Tranquada, and Q. Li, Electron and hole contribu-tions to normal-state transport in the superconducting systemSn1−xInxTe, Phys. Rev. B 98, 054503 (2018).
[30] G. S. Pawley, W. Cochran, R. A. Cowley, and G. Dolling,Diatomic Ferroelectrics, Phys. Rev. Lett. 17, 753 (1966).
[31] C. D. O’Neill, D. A. Sokolov, A. Hermann, A. Bossak, C.Stock, and A. D. Huxley, Inelastic x-ray investigation of theferroelectric transition in SnTe, Phys. Rev. B 95, 144101 (2017).
[32] K. M. Rabe and J. D. Joannopoulos, Ab initio relativistic pseu-dopotential study of the zero-temperature structural propertiesof SnTe and PbTe, Phys. Rev. B 32, 2302 (1985).
[33] L. Bellaiche and D. Vanderbilt, Virtual crystal approximationrevisited: Application to dielectric and piezoelectric propertiesof perovskites, Phys. Rev. B 61, 7877 (2000).
[34] B. Sangiorgio, E. S. Bozin, C. D. Malliakas, M. Fechner, A.Simonov, M. G. Kanatzidis, S. J. L. Billinge, N. A. Spaldin, andT. Weber, Correlated local dipoles in PbTe, Phys. Rev. Materials2, 085402 (2018).
[35] E. S. Božin, C. D. Malliakas, P. Souvatzis, T. Proffen, N. A.Spaldin, M. G. Kanatzidis, and S. J. L. Billinge, EntropicallyStabilized Local Dipole Formation in Lead Chalcogenides,Science 330, 1660 (2010).
[36] K. M. O. Jensen, E. S. Božin, C. D. Malliakas, M. B. Stone,M. D. Lumsden, M. G. Kanatzidis, S. M. Shapiro, and S. J. L.Billinge, Lattice dynamics reveals a local symmetry breakingin the emergent dipole phase of PbTe, Phys. Rev. B 86, 085313(2012).
[37] O. Delaire, J. Ma, K. Marty, A. F. May, M. A. McGuire, M.-H.Du, D. J. Singh, A. Podlesnyak, G. Ehlers, M. D. Lumsden, andB. C. Sales, Giant anharmonic phonon scattering in PbTe, Nat.Mater. 10, 614 (2011).
[38] C. W. Li, O. Hellman, J. Ma, A. F. May, H. B. Cao, X. Chen,A. D. Christianson, G. Ehlers, D. J. Singh, B. C. Sales, and O.Delaire, Phonon Self-Energy and Origin of Anomalous NeutronScattering Spectra in SnTe and PbTe Thermoelectrics, Phys.Rev. Lett. 112, 175501 (2014).
[39] Y. Zhang, X. Ke, P. R. C. Kent, J. Yang, and C. Chen, Anoma-lous Lattice Dynamics near the Ferroelectric Instability in PbTe,Phys. Rev. Lett. 107, 175503 (2011).
[40] Y. Chen, X. Ai, and C. A. Marianetti, First-Principles Approachto Nonlinear Lattice Dynamics: Anomalous Spectra in PbTe,Phys. Rev. Lett. 113, 105501 (2014).
[41] G. A. S. Ribeiro, L. Paulatto, R. Bianco, I. Errea, F. Mauri, andM. Calandra, Strong anharmonicity in the phonon spectra ofPbTe and SnTe from first principles, Phys. Rev. B 97, 014306(2018).
[42] L.-D. Zhao, G. Tan, S. Hao, J. He, Y. Pei, H. Chi, H. Wang, S.Gong, H. Xu, V. P. Dravid, C. Uher, G. J. Snyder, C. Wolverton,and M. G. Kanatzidis, Ultrahigh power factor and thermoelec-tric performance in hole-doped single-crystal SnSe, Science351, 141 (2016).
[43] G. Ehlers, A. A. Podlesnyak, J. L. Niedziela, E. B. Iverson, andP. E. Sokol, The new cold neutron chopper spectrometer at theSpallation Neutron Source: Design and performance, Rev. Sci.Instrum. 82, 085108 (2011).
[44] G. Ehlers, A. Podlesnyak, and A. I. Kolesnikov, The cold neu-tron chopper spectrometer at the Spallation Neutron Source - Areview of the first 8 years of operation, Rev. Sci. Instrum. 87,093902 (2016).
[45] R. T. Azuah, L. R. Kneller, Y. Qiu, P. L. W. Tregenna-Piggott,C. M. Brown, J. R. D. Copley, and R. M. Dimeo, DAVE: Acomprehensive software suite for the reduction, visualization,and analysis of low energy neutron spectroscopic data, J. Res.Natl. Inst. Stand. Technol. 114, 341 (2009).
[46] R. A. Ewings, A. Buts, M. D. Le, J. van Duijn, I. Bustinduy, andT. G. Perring, Horace: Software for the analysis of data fromsingle crystal spectroscopy experiments at time-of-flight neu-tron instruments, Nuclear Instruments and Methods in PhysicsResearch Section A 834, 132 (2016).
[47] E. R. Cowley, J. K. Darby, and G. S. Pawley, The lattice dy-namics of tin telluride, J. Phys. C: Solid State Phys. 2, 1916(1969).
[48] W. J. Daughton, C. W. Tompson, and E. Gurmen, Lattice in-stability and phonon lifetimes in Pb1−xSnxTe alloys, J. Phys. C:Solid State Phys. 11, 1573 (1978).
[49] P. M. Gehring, S.-E. Park, and G. Shirane, Soft Phonon Anoma-lies in the Relaxor Ferroelectric Pb(Zn1/3Nb2/3)0.92Ti0.08O3,Phys. Rev. Lett. 84, 5216 (2000).
[50] C. Stock, P. M. Gehring, R. A. Ewings, G. Xu, J. Li, D.Viehland, and H. Luo, Spontaneous decay of a soft opticalphonon in the relaxor ferroelectric PbMg1/3Nb2/3O3, Phys. Rev.Materials 2, 024404 (2018).
[51] D. T. Morelli, V. Jovovic, and J. P. Heremans, Intrinsically Min-imal Thermal Conductivity in Cubic I-V-VI2 Semiconductors,Phys. Rev. Lett. 101, 035901 (2008).
[52] G. Kim, J. H. Yun, and J.-S. Rhyee, Anomalous thermoelectricpower and polaronic transport in the vicinity of topologicalphase transition of Pb1−xSnxTe, J. Phys. Chem. Solids 126, 11(2019).
[53] N. W. Ashcroft and N. D. Mermin, Solid State Physics (Holt,Rinehart and Winston, New York, 1976).
[54] V. Martelli, J. L. Jiménez, M. Continentino, E. Baggio-Saitovitch, and K. Behnia, Thermal Transport and PhononHydrodynamics in Strontium Titanate, Phys. Rev. Lett. 120,125901 (2018).
[55] J. B. Boyce and J. C. Mikkelsen, Local structure of ionic solidsolutions: Extended x-ray-absorption fine-structure study, Phys.Rev. B 31, 6903 (1985).
[56] A. I. Lebedev, I. A. Sluchinskaya, V. N. Demin, and I. Munro,EXAFS studies of the local environment of lead and seleniumatoms in PbTe1−xSex solid solutions, Phys. Solid State 41, 1275(1999).
104511-12

ELECTRON-PHONON COUPLING AND … PHYSICAL REVIEW B 102, 104511 (2020)
[57] K. Huang, X-ray reflexions from dilute solid solutions, Proc. R.Soc. A 190, 102 (1947).
[58] W. Cochran, Scattering of X-rays by defect structures, ActaCrystallogr. 9, 259 (1956).
[59] B. Borie, X-ray diffraction effects of atomic size in alloys. II,Acta Crystallogr. 12, 280 (1959).
[60] R. D. Zhong, J. A. Schneeloch, X. Y. Shi, Z. J. Xu, C. Zhang,J. M. Tranquada, Q. Li, and G. D. Gu, Optimizing the super-conducting transition temperature and upper critical field ofSn1−xInxTe, Phys. Rev. B 88, 020505(R) (2013).
[61] G. Rousse, S. Klotz, A. M. Saitta, J. Rodriguez-Carvajal, M. I.McMahon, B. Couzinet, and M. Mezouar, Structure of the in-termediate phase of PbTe at high pressure, Phys. Rev. B 71,224116 (2005).
[62] H. Jacobsen, I. A. Zaliznyak, A. T. Savici, B. L. Winn, S. Chang,M. Hücker, G. D. Gu, and J. M. Tranquada, Neutron scatteringstudy of spin ordering and stripe pinning in superconductingLa1.93Sr0.07CuO4, Phys. Rev. B 92, 174525 (2015).
[63] Z. Xu, J. A. Schneeloch, R. D. Zhong, J. A. Rodriguez-Rivera,L. W. Harriger, R. J. Birgeneau, G. D. Gu, J. M. Tranquada,and G. Xu, Low-energy phonons and superconductivity inSn0.8In0.2Te, Phys. Rev. B 91, 054522 (2015).
[64] P. B. Allen and M. L. Cohen, Carrier-Concentration-DependentSuperconductivity in SnTe and GeTe, Phys. Rev. 177, 704(1969).
[65] R. Zhong, X. He, J. A. Schneeloch, C. Zhang, T. Liu,I. Pletikosic, T. Yilmaz, B. Sinkovic, Q. Li, W. Ku,T. Valla, J. M. Tranquada, and G. Gu, Surface-state-dominated transport in crystals of the topological crystallineinsulator In-doped Pb1−xSnxTe, Phys. Rev. B 91, 195321(2015).
[66] I. Esterlis and J. Schmalian, Cooper pairing ofincoherent electrons: An electron-phonon version of theSachdev-Ye-Kitaev model, Phys. Rev. B 100, 115132(2019).
[67] D. Chowdhury and E. Berg, The unreasonable effectiveness ofEliashberg theory for pairing of non-Fermi liquids, Ann. Phys.(NY) 417, 168125 (2020).
[68] M. N. Gastiasoro, A. V. Chubukov, and R. M. Fernandes,Phonon-mediated superconductivity in low carrier-density sys-tems, Phys. Rev. B 99, 094524 (2019).
[69] J. E. Hirsch, Hole superconductivity, Phys. Lett. A 134, 451(1989).
[70] J. E. Hirsch, Dynamic Hubbard model: Kinetic energydriven charge expulsion, charge inhomogeneity, hole super-conductivity and Meissner effect, Phys. Scr. 88, 035704(2013).
[71] P. B. Littlewood and V. Heine, The infrared effective charge inIV-VI compounds. I. A simple one-dimensional model, J. Phys.C 12, 4431 (1979).
104511-13