ultra-high-speed 3d astigmatic ptv in supersonic...
TRANSCRIPT

17th Int Symp on Applications of Laser Techniques to Fluid MechanicsLisbon, Portugal, July 7-10, 2014
Ultra-High-Speed 3D Astigmatic PTV in SupersonicUnderexpanded Impinging Jets
Christian Cierpka1, Nicolas A. Buchmann1,2, Julio Soria2 and Christian J. Kahler1
1Institute of Fluid Mechanics and Aerodynamics, Bundeswehr University Munich, Werner-Heisenberg-Weg 39,85577 Neubiberg, Germany, [email protected]
2Laboratory of Turbulence Research in Aerospace and Combustion, Monash University,Melbourne, 3800 Victoria, Australia
Abstract Ultra-high-speed three-component, three-dimensional (3C3D) velocity measurements of micron-sized particles suspended in a supersonic impinging jet flow are presented. Understanding the dynamics ofindividual particles in such flows is important for the design of particles impactors for drug delivery or cold gasdynamic spray processing. The underexpanded jet flow is produced via a converging nozzle and micron-sizedparticles (dp = 110 µm) are introduced into the gas flow. The supersonic jet impinges onto a flat surface and theparticle impact velocity and particle impact angle are studied for a range of flow conditions and impingementdistances. The imaging system consist of an ultra-high-speed digital camera (Shimadzu HPV-1) capable ofrecording rates of up to 1 Mfps. Astigmatism particle tracking velocimetry (APTV) is used to measure the3D particle position [6] by coding the particle depth location in the 2D images by adding a cylindrical lens tothe high-speed imaging system. Based on the reconstructed 3D particle positions the particle trajectories areobtained via a higher-order tracking scheme that takes advantage of the high temporal resolution to increaserobustness and accuracy of the measurement. It is shown how the particle velocity and impingement angle de-pend on the nozzle pressure ratio and stand-off distance and that higher pressure ratios and stand-off distanceslead to higher impact velocities and larger impact angles.
1. Introduction
High-speed particle laden flows can be found in a number of applications such as particle impactors[7], needle free drug delivery systems [12] or cold gas dynamic spray processes [9–11]. Commonto all these processes is the acceleration of micron-sized particles (1−100 µm) to very high particlevelocities (300− 1200 m/s) via a high-speed gas flow such that the particles attain sufficient kineticenergy to penetrate or deposit onto a solid substrate upon impaction. The optimal application of theseprocesses is characterised by a critical particle impact velocity and particle impact angle, both ofwhich are a complex function of the fluid dynamics of the impinging supersonic jet flow. Understand-ing how the particle motion is affected by the highly unsteady, turbulent and three-dimensional natureof the supersonic gas flow and its complex shock structure requires experimental data to resolve theindividual three-component, three-dimensional (3C3D) particle velocity over time and length scalescomparable to their velocity and size. However, this is exceedingly difficult to achieve at supersonicspeeds due to the large dimensional difference between the very small particles ((O(10−6) m) andtheir very large velocities (O(103) m/s). In order to resolve the 3D motion of these particles ultra-high-speed imaging methods are required.The present paper presents measurements of the 3C3D particle velocities in a particle-laden super-sonic jet flow by means of astigmatism particle tracking velocimetry (APTV) [5, 6]. By using a singleultra-high-speed CCD camera capable of recording one million frame per second combined with along distance microscope and pulsed LED light illumination the 3C3D particle motions is determined

with
• up to 1 Mfps temporal resolution and nano-second exposure times
• high spatial resolution and high signal-to-noise level
• no need for complex camera calibration procedures
The first part of the paper discusses the experimental setup and 3C3D particle velocity determination.The second part assesses the calibration of the proposed method, which is then applied to measure the3C3D particle velocity in a supersonic particle-laden gas flow. The paper concludes with a discussionof the measurement results and some remarks.
2. Experimental Methods
2.1 Experimental Setup
The particle-laden high-speed gas flow is produced via a converging nozzle of diameter D = 2 mm.The gas velocity is adjusted by changing the nozzle pressure ratio NPR, which is defined as the ratiobetween the static pressure upstream of the nozzle and the ambient pressure (NPR = p0/p∞). ForNPR ≥ 1.9 the flow in the nozzle becomes choked and the nozzle reaches its maximum exit velocityof approximately 313 m/s. For higher NPRs the flow at the nozzle exit is underexpanded and charac-terised by a series of shock and expansion waves (see [2] for details). The solid particles (Vestosint1301) with a mean diameter of dP = 110 µm and a specific density of ρ = 1.06 g/cm2 are suspendedin the airflow co-axially via a purpose-built seeding system. The particle-laden jet exhausts into anoctagonal flow chamber as shown in Figure 1 from which the particles are extracted via a vacuumpump.The optical arrangement consists of an ultra-high-speed CCD camera of type Shimadzu HPV-1 capa-ble of recording 102 successive images at a frame rate of up to 1,000,000 fps and 250 ns exposuretime. The digital CCD array has a size of 312×269 pixel2, a spatial resolution of 66.3 µm and a 10 bitdynamic intensity range. In order to increase the spatial resolution of the current system, the camerais equipped with a custom-built long-distance microscope consisting of a Micro Nikkor lens with afocal length of 105 mm and an extension tube. The magnification is set to M = 2.1, which yields aneffective spatial resolution of 31.5 µm/pixel and a diffraction limit of 44.3 µm (or 1.4 pixel).Illumination of the spray particles is provided by a current-pulsed high-power LED (Luminus CBT-120, λ = 532 nm) that is mounted inline with the high-speed camera. The light of the LED ishighly divergent and therefore collimated by a set of spherical lenses. Overdriving the LED withhigh current pulses at short durations produces light pulses with sufficient energy to achieve largesignal-to-noise levels even at high framing rates [3, 13]. The LED is operated with a drive current ofI f ,max = 100−150 A with a 1 µs pulse width at 250 kHz repetition rates. Higher repetition rates arepossible (see [13]), but drastically reduce the lifetime of the LED at high pulse-currents. The advan-tage of the present high-speed LED illumination is the high degree of spatial and temporal uniformityof the illumination and the ability to reduce the exposure time below the limit of the high-speedcamera (e.g. pulse width less than 250 ns are possible).
2.2 3D Astigmatism Particle Reconstruction
The depth position of the particles is coded onto the 2D image by placing a standard cylindrical lenswith focal length fcyl = 200 mm in front of the high-speed camera sensor as shown in Figure 1. Thecylindrical lens is positioned such that its curvature acts in the y− z−plane of the imaging system.The focal plane Fxz in the x− z−plane is determined by the long-distance microscope whereas in
2

z
yhigh-speedCamera
cylindrical lens
lens + bellowassemblypulsed high-
power LED
collimation lens
particle extraction
viewingwindows
jet nozzle
Figure 1: Schematic of the experimental setup.
Figure 2: Ray tracing schematic of astigmatism PTV (APTV). The distance to the in-focus plane Fxzis shortened by the additional lens in the y− z−plane producing a new focal plane Fyz (after [6]).
the y − z−plane the cylindrical lens causes a shortening of the distance between the camera andFxz to create a second focal plane Fyz in the y− z−plane. This is shown schematically in Figure 2,which shows the optical arrangement from the top and side view and is explained in more detail in[5, 6]. Consequently, the images of the particles located between the two focal planes will be distortedaccording to their depth position. Particles close to Fxz will appear elongated along the x−direction,while particles located closer to Fyz will be distorted in the y−direction. Thus, the particles appearelliptical in the image plane. The depth of the measurement volume is related, but not limited by thedistance between the two in-focus planes δz = Fxz −Fyz and corresponds to approximately 5.1 mmfor the current setup. Using appropriate image pre-processing and calibration [5], the particle depthlocation is obtained with sub-pixel accuracy from the elliptical particle image shape at each time-step.
2.3 Higher-Order 3C3D Particle Tracking
The 3C3D particle velocity is determined by tracking the particles between consecutive time stepsusing a probabilistic approach where the particle velocity is given as u(x,y,z) = ∆x/(t2 − t1). Theprobabilistic particle tracking takes the motion of neighbouring particles into account and computesthe most probable particle trajectory in conjunction with a temporal predictor to decrease the searchradius in the second frame using information from the previous frames. This method yields veryreliable results even for high seeding concentrations. For the current investigation velocity vectorsare only accepted if the trajectory exists for at least four consecutive time steps. A second order curveis fitted to the trajectory at the four time steps and the velocity vector is determined by integrationof the particle path [4]. This procedure decreases both random and systematic errors due to vectorreallocation in the case of curved trajectories and reliably removes outliers.
3
3. Results
3.1 Calibration using Stationary Particles
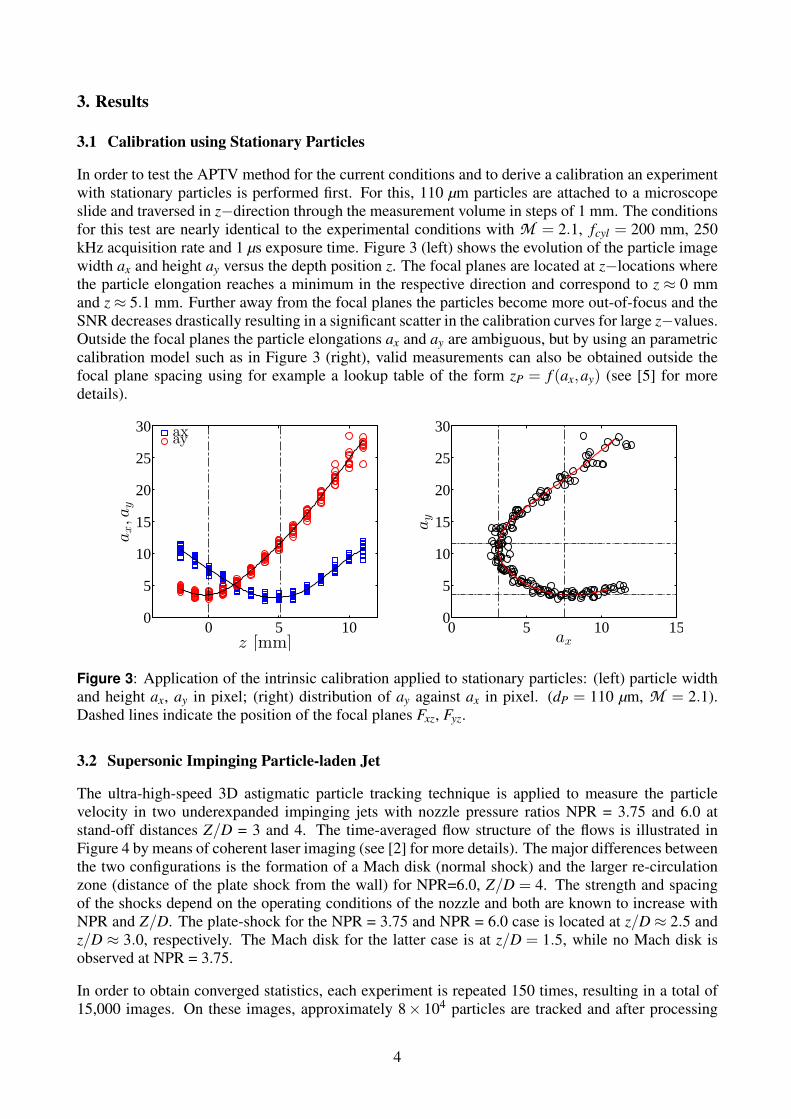
In order to test the APTV method for the current conditions and to derive a calibration an experimentwith stationary particles is performed first. For this, 110 µm particles are attached to a microscopeslide and traversed in z−direction through the measurement volume in steps of 1 mm. The conditionsfor this test are nearly identical to the experimental conditions with M = 2.1, fcyl = 200 mm, 250kHz acquisition rate and 1 µs exposure time. Figure 3 (left) shows the evolution of the particle imagewidth ax and height ay versus the depth position z. The focal planes are located at z−locations wherethe particle elongation reaches a minimum in the respective direction and correspond to z ≈ 0 mmand z ≈ 5.1 mm. Further away from the focal planes the particles become more out-of-focus and theSNR decreases drastically resulting in a significant scatter in the calibration curves for large z−values.Outside the focal planes the particle elongations ax and ay are ambiguous, but by using an parametriccalibration model such as in Figure 3 (right), valid measurements can also be obtained outside thefocal plane spacing using for example a lookup table of the form zP = f (ax,ay) (see [5] for moredetails).
0 5 100
5
10
15
20
25
30
z [mm]
ax,ay
axay
0 5 10 150
5
10
15
20
25
30
ax
ay
Figure 3: Application of the intrinsic calibration applied to stationary particles: (left) particle widthand height ax, ay in pixel; (right) distribution of ay against ax in pixel. (dP = 110 µm, M = 2.1).Dashed lines indicate the position of the focal planes Fxz, Fyz.
3.2 Supersonic Impinging Particle-laden Jet
The ultra-high-speed 3D astigmatic particle tracking technique is applied to measure the particlevelocity in two underexpanded impinging jets with nozzle pressure ratios NPR = 3.75 and 6.0 atstand-off distances Z/D = 3 and 4. The time-averaged flow structure of the flows is illustrated inFigure 4 by means of coherent laser imaging (see [2] for more details). The major differences betweenthe two configurations is the formation of a Mach disk (normal shock) and the larger re-circulationzone (distance of the plate shock from the wall) for NPR=6.0, Z/D = 4. The strength and spacingof the shocks depend on the operating conditions of the nozzle and both are known to increase withNPR and Z/D. The plate-shock for the NPR = 3.75 and NPR = 6.0 case is located at z/D ≈ 2.5 andz/D ≈ 3.0, respectively. The Mach disk for the latter case is at z/D = 1.5, while no Mach disk isobserved at NPR = 3.75.
In order to obtain converged statistics, each experiment is repeated 150 times, resulting in a total of15,000 images. On these images, approximately 8× 10⁴ particles are tracked and after processing
4

Figure 4: Coherent light visualisations of the gas phase of the underexpanded jet; (left) NPR = 3.75,Z/D = 3; (right) NPR = 6, Z/D = 4. Flow is from top to bottom.
approximately 3.5×10⁴ individual valid measurements are accepted to compile the statistical results.The time averaged particle distribution and particle velocity for NPR = 6.0, Z/D = 4 is shown inFigure 5 using laboratory coordinates (x,y,z). The distribution of the reconstructed particle positionsis symmetric with respect to the jet centre axis as is expected for an axis-symmetric jet (Fig. 5 right).Two distinct velocity regions are noticeable; the first region corresponds to high-speed particles thatexit the nozzle at x/D = 0 and impinge at the substrate at x/D = 4. Under the present conditions
−2 −1 0 1 2
0
0.5
1
1.5
2
2.5
3
3.5
4
y/D
x/D
ux(m/s)
0
50
100
150
200
−0.5 0 0.5
−0.5
0
0.5
y/D
z/D
Figure 5: Instantaneous particle distribution and streamwise particle velocity ux. The existence ofimpinging high-speed and deflected low-speed particles is clearly visible; (left) x− y− plane; (right)y− z−plane, only the high-speed particle are shown. Flow is from top to bottom.
5

the spray particles do not reach the critical velocity required to adhere or coat the surface and aretherefore deflected at the impingement surface to form a second region of low-speed particles.
The distribution of streamwise particle velocity uz(z) integrated in the azimuthal direction is illustratedin Figure 6 (left). The polydisperse particle size distribution (110± 32 µm) causes a relatively largedata scatter since the particles reach different velocities according to their inertia. Furthermore, as willbe shown later, the streamwise particle velocity also depends on the radial position of the particles,which further contributes to the data scatter in Figure 6 (left). The uncertainty in the streamwiseparticle velocity is estimated to 2δx/∆t ≈ 1.3 m/s and thus is significantly smaller than the observeddata scatter. Therefore, the observed variations in particle velocity are attributed to true physicaleffects of the gas flow and particle dynamics. From the instantaneous data ensemble averaged profilesare determined by binning the data into intervals of 0.2D with 75% overlap. Figure 6 (right) illustratesthe averaged velocity profile for NPR = 3.75 and NPR = 6.0 where the error bars correspond to onestandard deviation above the mean for all cases presented.
Depending on NPR, the particles leave the nozzle with an average velocity of approximately 100−120 m/s, which is significantly lower than the local gas velocity of 345 m/s (speed of sound) at thenozzle exit. In principle, the smaller the particles and the longer the nozzle, the higher the particleexit velocity. In the present case the nozzle has a fixed length of L = 120 mm and due to the relativelylarge particle response time (τp = 10−3 s), the particles are not sufficiently accelerated within thenozzle to reach the gas velocity at the nozzle exit. As a consequence, the averaged particle Machnumber at the nozzle exit Map = 1− u/c is as high as 0.65-0.7 meaning that shocks may form atthe trailing end of the particles (see [1] and [8] for visualisations of the particle flow interaction).After leaving the nozzle the particles are continuously accelerated in the streamwise direction by thesurrounding gas flow and reach average impact velocities of 150 and 180 m/s for NPR = 3.75 and6.0. Note that instantaneous impact velocities can be as high as 225 m/s. Yet, these velocities areinsufficient to achieve measurable deposition of the spray particles. In fact, the particles tend to breakup upon impact and are deflected in radial direction as discussed before. Both flow cases exhibit aqualitative similar evolution of streamwise particle velocity with the NPR = 6.0 case reaching higherimpact velocities due to the greater pressure ratio and stand-off distance.
The particle displacement between two consecutive image frames is u∆t ≈ 0.25−0.45D, which con-
0 1 2 3 475
125
175
225
z/D
uz(m
/s)
0 1 2 3 4100
125
150
175
200
z/D
uz(m
/s)
NPR=6, Z/D = 4
NPR=3.75, Z/D = 3
Figure 6: Particle velocity uz against streamwise distance z/D: (left) Time averaged velocity forNPR = 6.0, Z/D = 4; (right) ensemble averaged velocity for NPR = 3.75, Z/D = 3 and NPR = 6.0,Z/D = 4. Errorbars are one standard deviation from the mean.
6

stitutes the effective spatial resolution of the velocity measurement close to the impingement surface.As a result, velocity measurements close to the substrate are less frequent and the statistical uncer-tainty in this region is higher. Increasing the camera frame rate would improve the spatial velocityresolution, but also increase thermal stresses on the high-speed LED illumination and an acquisi-tion rate of f = 250 kHz presents an acceptable comprise between hardware limitations and requiredtemporal resolution.
4. Concluding Remarks
This paper demonstrates three-dimensional ultra-high-speed measurements of micron-sized particlesin a supersonic underexpanded gas flow using astigmatism particle tracking velocimetry (APTV). Inthe present case a highly magnified high-speed imaging system employed in order to mitigate thelimited spatial resolution modern ultra-high-speed digital recording arrays. By introducing controlledimage distortions to the imaging system it is possible to code the 3D particle position onto a 2Dimage requiring only a single camera to measure the 3C3D particle velocity field. This is achievedby including a cylindrical lens in front of the high-speed recording array that causes an ellipticaldistortion of the particle images according to their depth position in the measurement volume. Usinga high power LED the illumination is sufficient to record particle images with a SNR that allowsreliable determination of the particle image position and shape. From the reconstructed 3D particleposition the 3C3D particle trajectories are obtained using a higher-order particle tracking schemethat takes into account the high temporal resolution of the measurement to improve the robustnessand accuracy of the tracking. The paper demonstrates the applicability of high-speed imaging andAPTV to measure the particle velocity in a supersonic underexpanded impinging jet. The particlesleave the nozzle at subsonic speed and are continuously accelerated by the surrounding gas flow in amanner depending on the local flow structure (i.e. NPR, Z/D). It is also shown, that the flow structureinfluences the impingement angle of the particles and that a recirculation region forms above the flatplate.
References
[1] N. A. Buchmann, C. Atkinson, D. Honnery, and J. Soria. High-speed 3d particle tracking usingtomographic holographic reconstruction. In 10th International Symposium on Particle ImageVelocimetry, Delft, Netherlands, 2013.
[2] N. A. Buchmann, C. Atkinson, and J. Soria. Ultra-high-speed tomographic digital holo-graphic velocimetry in supersonic particle-laden jet flows. Measurement Science & Technology,24:024005(14pp), 2013.
[3] N. A. Buchmann, C. E. Willert, and J. Soria. Pulsed, high-power led illumination for tomo-graphic particle image velocimetry. Experiments in Fluids, 53:1545–1560, 2012.
[4] C. Cierpka, B. Lutke, and C. J. Kahler. Higher order multi-frame particle tracking velocimetry.Experiments in Fluids, 54:1533, 2013.
[5] C. Cierpka, M. Rossi, R. Segura, and C. J. Kahler. On the calibration of astigmatism particletracking velocimetry for microflows. Measurement Science & Technology, 22:01540, 2011.
[6] C. Cierpka, R. Segura, R. Hain, and C. J. Kahler. A simple single camera 3C3D velocity mea-surement technique without errors due to depth of correlation and spatial averaging for microflu-idics. Measurement Science & Technology, 21:045401, 2010.
[7] L. J. Forney. Particle impaction in axially symmetric supersonic flow. Aerosol Science andTechnology, 15:49–59, 1991.
7

[8] K. M. Ingvorsen, N. A. Buchmann, and J. Soria. Ultra-high-speed digital in-line holographysystem applied to particle-laden supersonic underexpanded jet flows. In 28th AIAA Aerody-namic Measurement Technology, Ground Testing, and Flight Testing Conference, New Orleans,Louisiana, 2012.
[9] B. Jodoin, F. Raletz, and M. Vardelle. Cold spray modeling and validation using an opticaldiagnostic method. Surf. Coat. Tech., 200:4424–4432, 2006.
[10] A. Papyrin, V. Kosarev, S. Klinkov, A.Alkimov, and V. Fomin. Cold Spray Technology. Elsevier,2007.
[11] S. P. Pardhasaradhi, V. Venkatachalapathy, S. V. Joshi, and S. Govindan. Optical diagnosticsstudy of gas particle transport phenomena in cold gas dynamic spraying and comparison withmodel predictions. J. Therm. Spray Technol., 17(4):551–563, 2008.
[12] N. Quinlan, M. Kendall, B. Bellhouse, and R. Ainsworth. Investigations of gas and particledynamics in first generation needle-free drug delivery devices. Shock Waves, 10:395–404, 2001.
[13] C. E. Willert, D. M. Mitchell, and J. Soria. An assessment of high-power light-emitting diodesfor high frame rate schlieren imaging. Experiments in Fluids, 53(2):413–421, 2012.
8