ultra-high-performance concrete and advanced manufacturing...
TRANSCRIPT

Ultra-High-Performance Concrete and Advanced Manufacturing Methods for Modular
Construction
NEET-1 Annual Meeting
September 29, 2015
Research Team
Y. L. Mo and Mo Li – University of Houston
James G. Hemrick – Oak Ridge National Lab
Maria Guimaraes – Electrical Power Research Institute
Project Monitoring Team
Alison Hahn (Krager) (Project Manager)
Jack Lance (Technical POC)

Self-consolidating Ultra-High Performance Concrete (UHPC)
• A new type of UHPC which features a compressive strength higher than 150 MPa.
• Self-consolidating characteristics
• Desired for SMR modular construction • Facilitate rapid construction of steel plate-concrete (SC) beams and
walls
• Thinner and lighter modules
• Withstands the harsh environments and mechanical loads anticipated during the service life of nuclear power plants
2

Previous Work and Gaps
• More than two decades of research work on high strength concrete with fc’ more than 100 MPa.
• Direct application in nuclear power plant construction does not yet exist.
• Attaining compressive strengths over 150 MPa without special treatment such as high pressure curing, heat curing and extensive vibration, has remained a challenge
• Lack of standardized processing and quality control methods to produce robust HPC materials in large quantities has limited its application in factory prefabrication.
3

Experimental Program
• The UHPC material development approach integrates • Micromechanics theory
• Hydration chemistry
• Rheology tailoring methods
• Time-dependent computed micro-tomography (Micro-CT)
4
Fundamental Principles for developing UHPC
Optimum packing density by selecting ingredients such that all the voids are densely packed.
A low w/b ratio. Pozzolanic ingredients (e.g. fly ash) with spherical particles to improve
workability. Application of round quartz crystalline silica as high strength
aggregates. Achieving an optimum amount of HRWR.

Materials • The UHPC developed in this study contains cement, silica fume, fly ash, fine
sand, aggregates, fine grain silica , high-range water reducer (HRWR) and water.
• Cement: Type I Portland cement (ASTM C150) and Class-H cement
• Class-H has zero Calcium Aluminate (C3A) content • Class-H has coarser particle size compared to Type I ordinary Portland cement • Type I ordinary Portland cement has higher (C3S) content
• Silica Fume: regular densified silica fume (DSF), undensified silica fume (USF) and white silica fume (WSF)
• Fly ash: Low calcium Type-F • Aggregates: round quartz crystalline silica that is chemically inert with
>99.7% silicon dioxide content. Unground silica passing the sieve size of 850 micron is used as coarse sand Ground silica (GS) passing the sieve size of 212 micron is used as fine sand
• Fine grain silica (FGS): Median diameter of the fine ground silica is 1.6 micron, and 96% of the powder has a diameter smaller than 5 micron
• HRWR (High-range water reducer): Three different types of Polycarboxylate-based HRWR that are commercially available in the U.S. were investigated, with different amounts of dosage
5
6
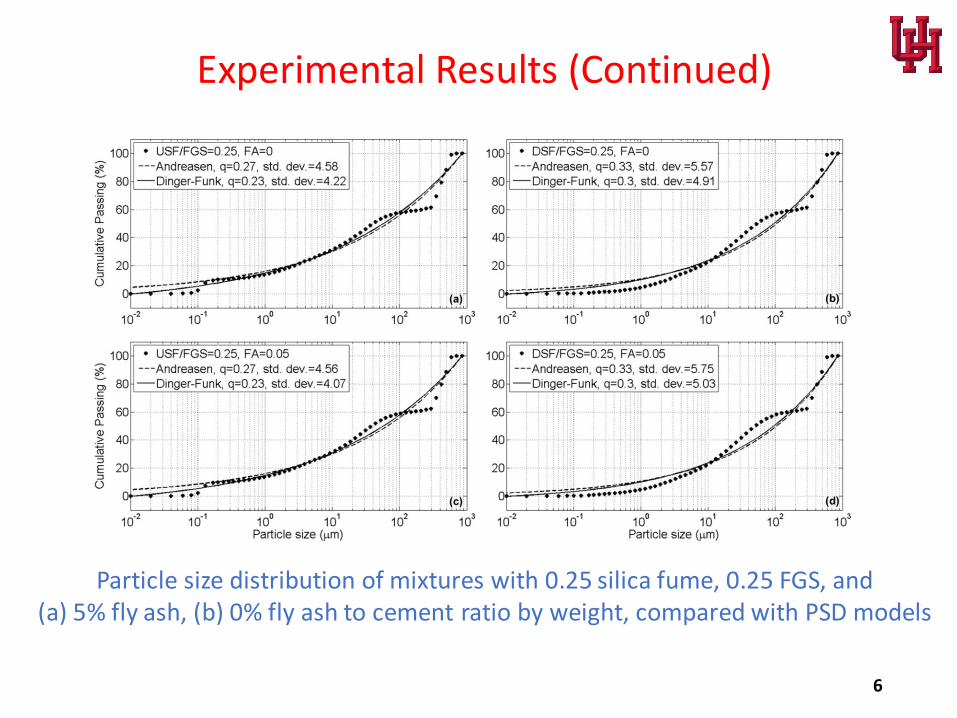
Experimental Results (Continued)
Particle size distribution of mixtures with 0.25 silica fume, 0.25 FGS, and (a) 5% fly ash, (b) 0% fly ash to cement ratio by weight, compared with PSD models
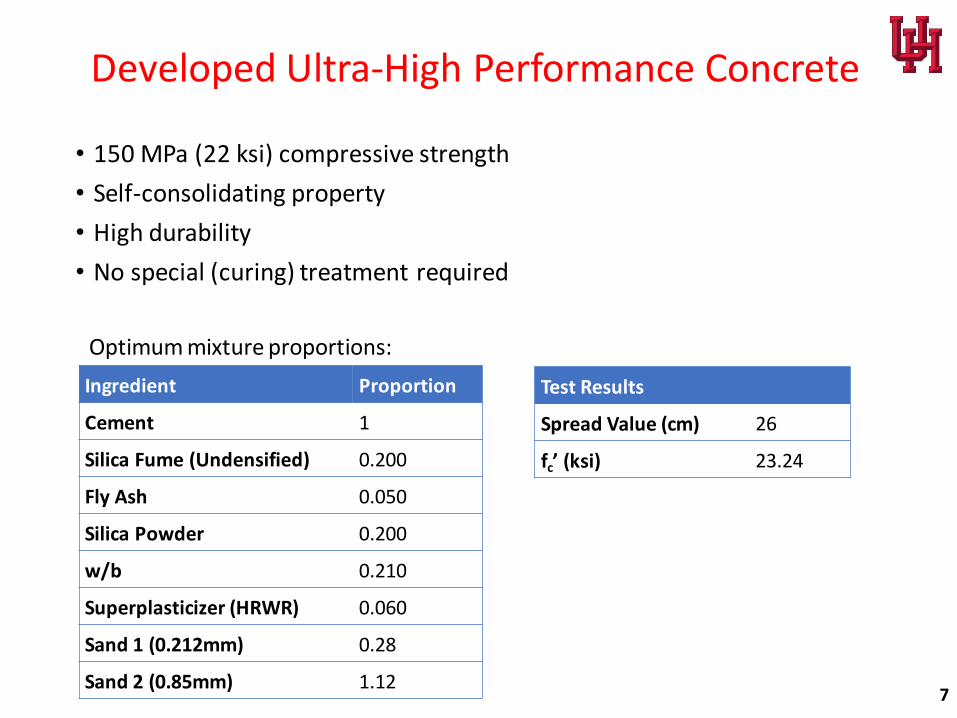
• 150 MPa (22 ksi) compressive strength
• Self-consolidating property
• High durability
• No special (curing) treatment required
7
Developed Ultra-High Performance Concrete
Ingredient Proportion
Cement 1
Silica Fume (Undensified) 0.200
Fly Ash 0.050
Silica Powder 0.200
w/b 0.210
Superplasticizer (HRWR) 0.060
Sand 1 (0.212mm) 0.28
Sand 2 (0.85mm) 1.12
Test Results
Spread Value (cm) 26
fc’ (ksi) 23.24
Optimum mixture proportions:
8
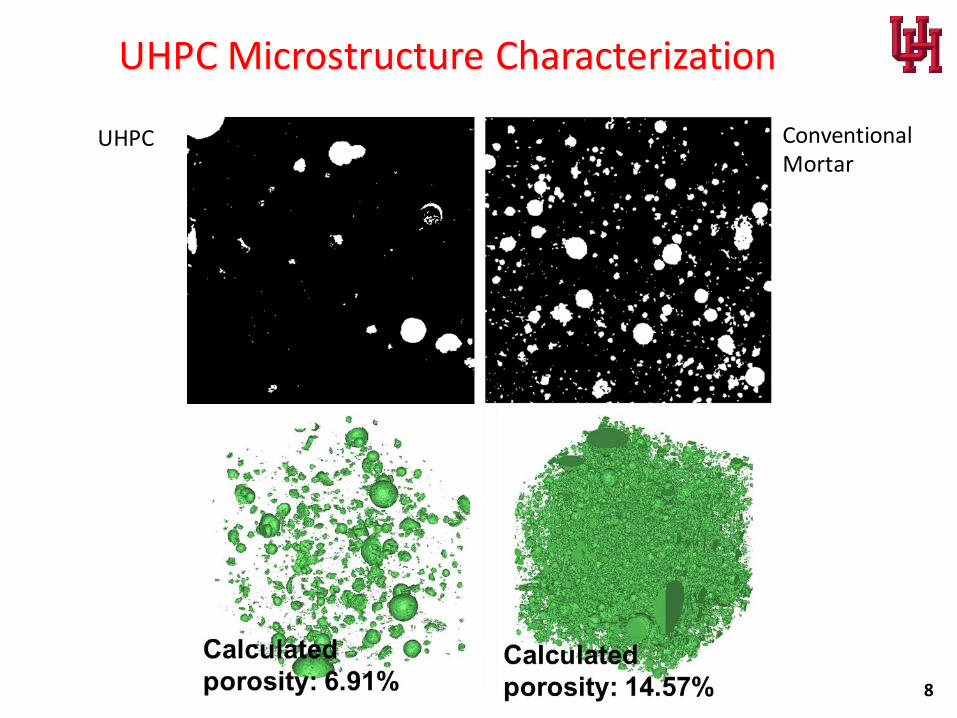
UHPC Conventional Mortar
UHPC Microstructure Characterization
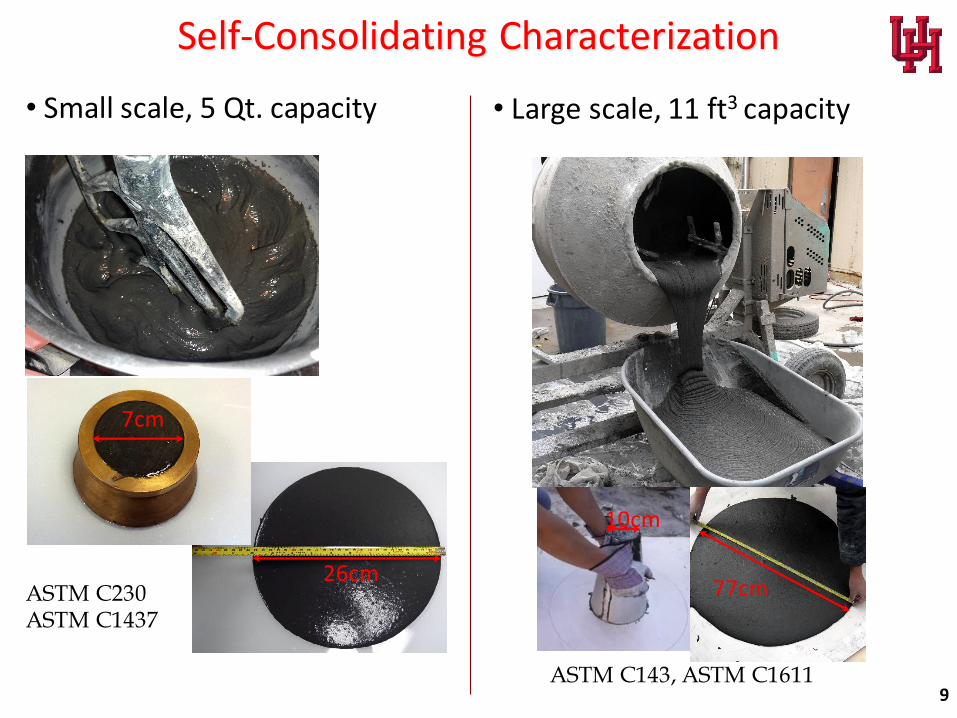
Self-Consolidating Characterization
• Small scale, 5 Qt. capacity • Large scale, 11 ft3 capacity
9
26cm
7cm
77cm
10cm
ASTM C230 ASTM C1437
ASTM C143, ASTM C1611

10
Self-consolidating UHPC
V-funnel test
Passing ability test (J-ring)
During casting of Steel-plate UHPC beam, good flowability demonstrated without vibration

11
Self-consolidating UHPC (Continued)
• UHPC self-consolidating properties (fc’ = 22.34 ksi)
Test UHPC EFNARC
Slump flow by Abram’s cone 77 cm 65-85 cm
T50cm slump flow 4 sec 2-5 sec
J-ring, height difference 0-2 mm 0-10 mm
V-funnel 10 sec 6-12 sec
V-funnel increase time at T5min 7 sec 3 sec
J-ring, spread difference 0 cm N/A
Visual stability index (ASTM C1611) 0 N/A
Air content 4.8% N/A
Note: EFNARC: The European Guidelines for Self-Compacting Concrete

Structural Behavior of S-UHPC Modules
• Integrity between two distinct materials (UHPC and steel-plate) is essential.
• Integrity through effective shear transfer mechanism
• Shear transfer mechanisms:
a) Tie bars (Cross Ties)
b) Shear studs
c) J-hook
d) Profiled and surfaced preparation
12
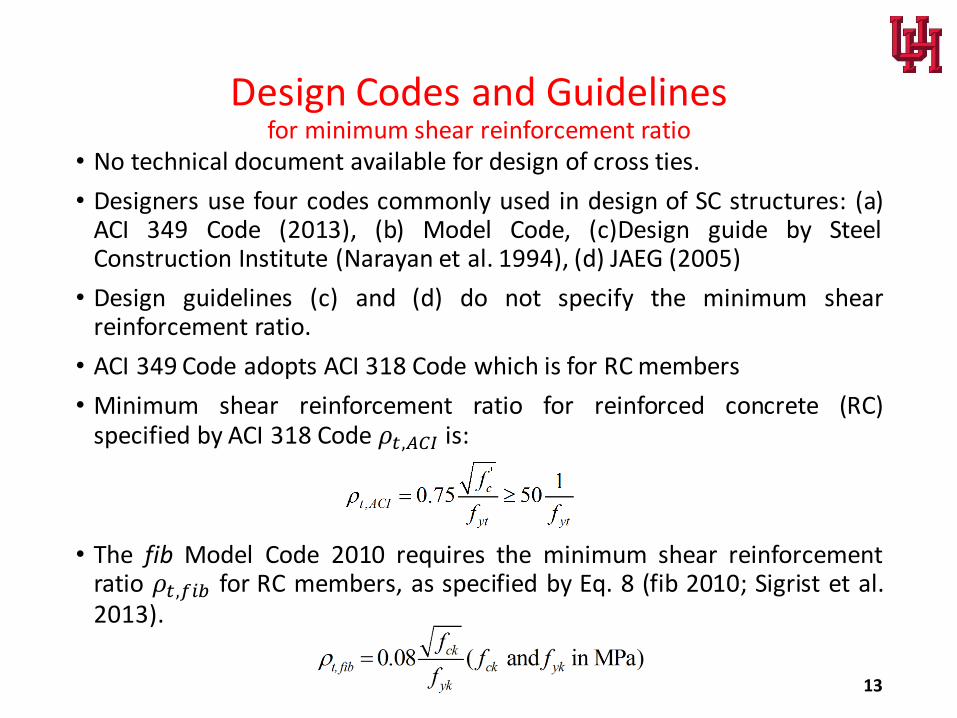
Design Codes and Guidelines for minimum shear reinforcement ratio
• No technical document available for design of cross ties.
• Designers use four codes commonly used in design of SC structures: (a) ACI 349 Code (2013), (b) Model Code, (c)Design guide by Steel Construction Institute (Narayan et al. 1994), (d) JAEG (2005)
• Design guidelines (c) and (d) do not specify the minimum shear reinforcement ratio.
• ACI 349 Code adopts ACI 318 Code which is for RC members
• Minimum shear reinforcement ratio for reinforced concrete (RC) specified by ACI 318 Code 𝜌𝑡,𝐴𝐶𝐼 is:
• The fib Model Code 2010 requires the minimum shear reinforcement ratio 𝜌𝑡,𝑓𝑖𝑏 for RC members, as specified by Eq. 8 (fib 2010; Sigrist et al. 2013).
13
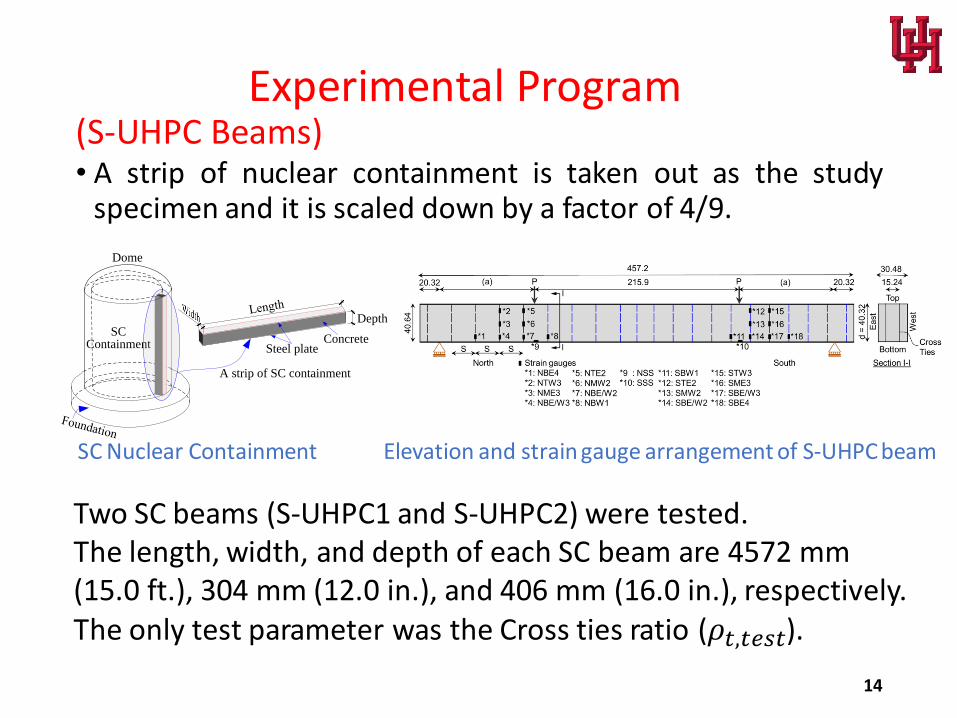
Experimental Program (S-UHPC Beams) • A strip of nuclear containment is taken out as the study
specimen and it is scaled down by a factor of 4/9.
14
SCContainment
Dome
Concrete
Depth
A strip of SC containment
Steel plate
SC Nuclear Containment Two SC beams (S-UHPC1 and S-UHPC2) were tested. The length, width, and depth of each SC beam are 4572 mm (15.0 ft.), 304 mm (12.0 in.), and 406 mm (16.0 in.), respectively. The only test parameter was the Cross ties ratio (𝜌𝑡,𝑡𝑒𝑠𝑡).
Elevation and strain gauge arrangement of S-UHPC beam

Test Setup
15
Loading arrangement Setup of LVDT

Instrumentation
16
Typical SC beam and arrangement of strain gauges and SAs
Unit: inch
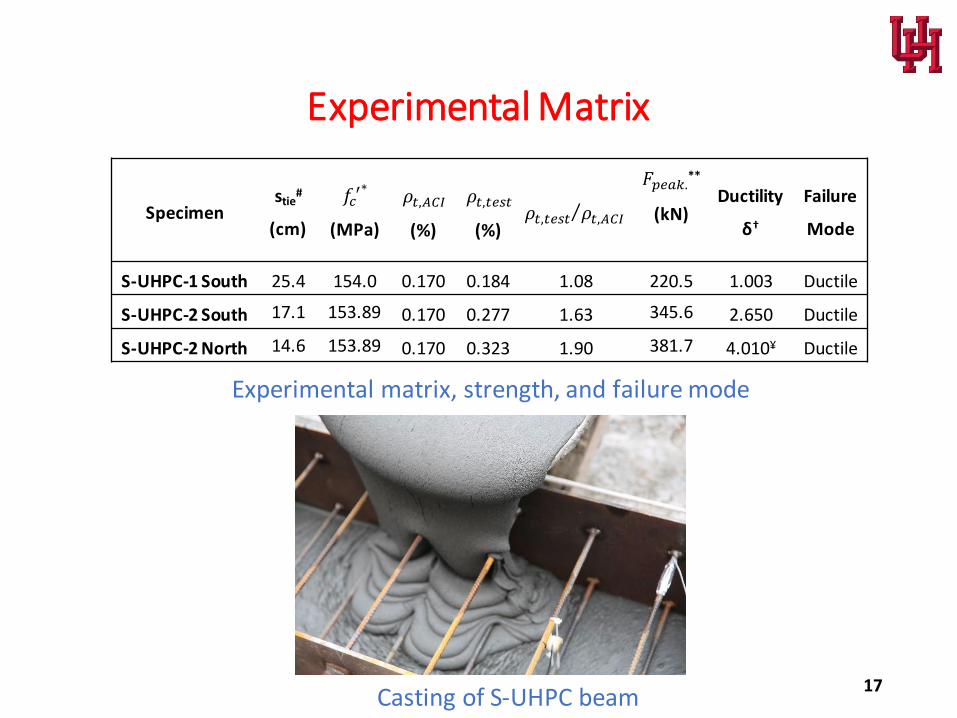
Experimental Matrix
Specimen stie
#
(cm)
𝑓𝑐′∗
(MPa)
𝜌𝑡,𝐴𝐶𝐼
(%)
𝜌𝑡,𝑡𝑒𝑠𝑡
(%) 𝜌𝑡,𝑡𝑒𝑠𝑡 𝜌𝑡,𝐴𝐶𝐼
𝐹𝑝𝑒𝑎𝑘.**
(kN)
Ductility
δ†
Failure
Mode
S-UHPC-1 South 25.4 154.0 0.170 0.184 1.08 220.5 1.003 Ductile
S-UHPC-2 South 17.1 153.89 0.170 0.277 1.63 345.6 2.650 Ductile
S-UHPC-2 North 14.6 153.89 0.170 0.323 1.90 381.7 4.010¥ Ductile
17
Experimental matrix, strength, and failure mode
Casting of S-UHPC beam
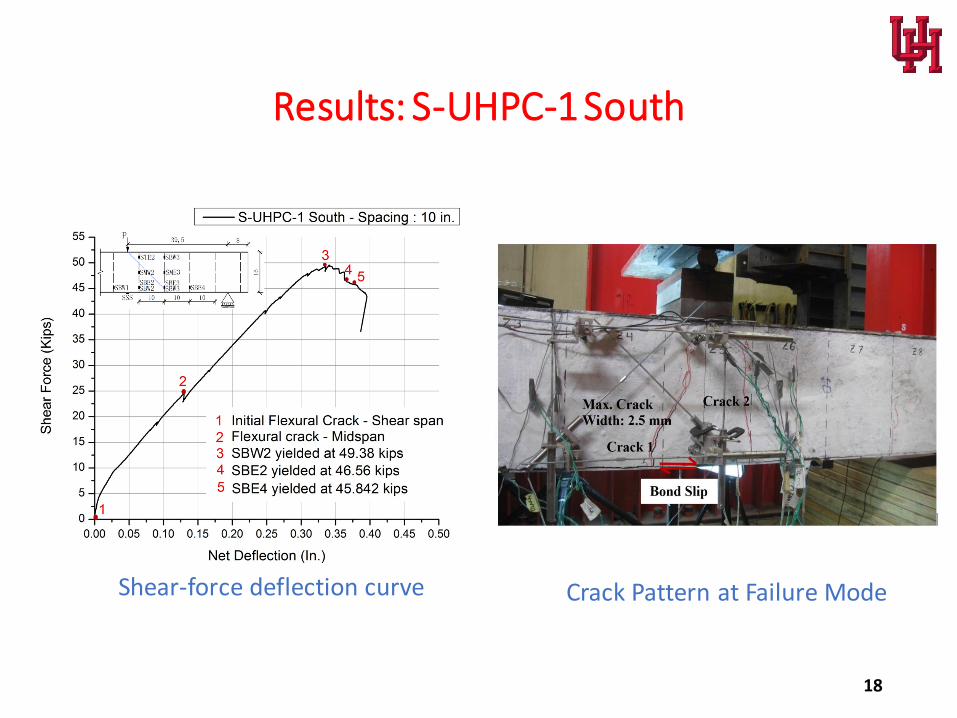
Results: S-UHPC-1 South
18
Shear-force deflection curve Crack Pattern at Failure Mode

S-UHPC-2 (North)
19
Shear-force deflection curve
Crack Pattern at Failure Mode
Spalling of concrete

S-UHPC-2 (South)
20
Shear-force deflection curve Crack Pattern at Failure Mode

(SC Beams) as reference of S-UHPC beams • To evaluate the effect of concrete strength on the structural
performance of Steel plate Concrete (SC) beams with conventional concrete, six SC beams were tested
• Same size as S-UHPC beams
21
tie tie
Elevation view of SC beam specimens Cross section
Dimensions of SC beam specimens (unit: inch)

Experimental Matrix
22
Normal strength concrete
Specimen a/d Stie
(in.)
f’c
(ksi)
𝜌𝑡,𝐴𝐶𝐼
(%)
𝜌𝑡,𝑡𝑒𝑠𝑡
(%) 𝜌𝑡,𝑡𝑒𝑠𝑡 𝜌𝑡,𝐴𝐶𝐼
𝐹𝑢𝑙𝑡.
(kips)
Ductility
δ
Failure
Mode
SC1 north 2.5 8.00 8.13 0.111 0.102 0.92 27.4 —— Brittle
SC1 south 2.5 8.00 8.13 0.111 0.102 0.92 26.1 —— Brittle
SC2 south 2.5 7.00 5.80 0.094 0.117 1.25 26.9 0.730 Brittle
SC3 north 2.5 6.00 5.82 0.094 0.137 1.45 31.7 1.17 Ductile
SC3 south 2.5 6.00 5.82 0.094 0.137 1.45 34.9 1.79 Ductile
SC4 north 2.5 5.00 7.37 0.106 0.164 1.54 42.7 1.58 Ductile
SC4 south 2.5 4.00 7.37 0.106 0.205 1.93 53.0 1.65 Ductile
SC5 south 1.5 6.00 8.00 0.110 0.137 1.25 55.9 1.43 Ductile
SC5 north 1.5 5.00 8.00 0.110 0.164 1.49 64.7 1.48 Ductile
SC6 5.2 6.00 8.00 0.110 0.137 1.25 29.3 1.99 Ductile
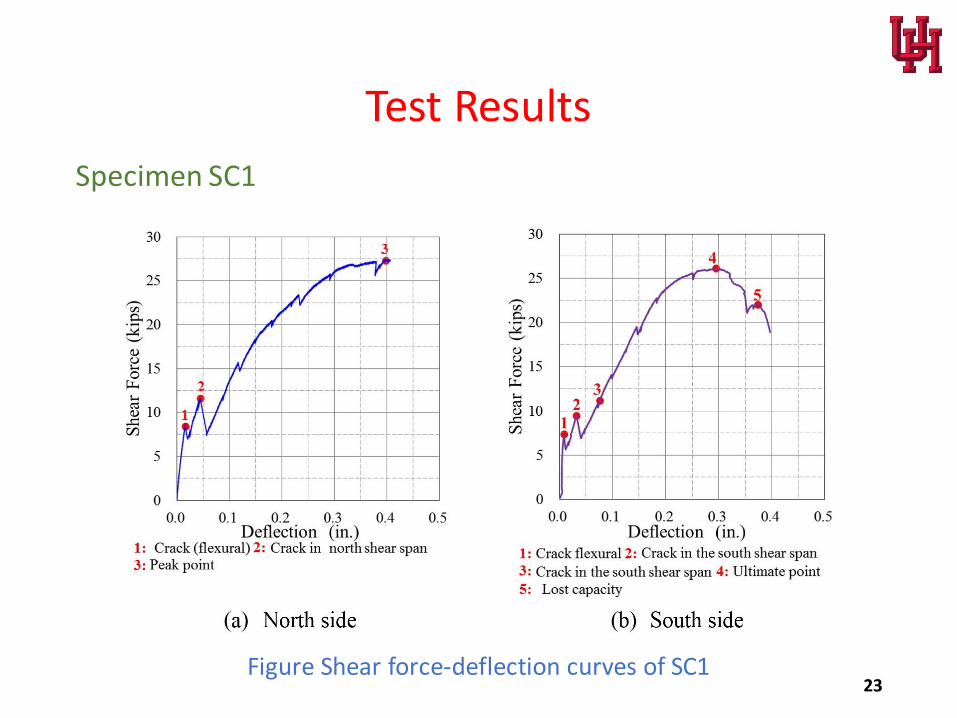
Test Results
Specimen SC1
23 Figure Shear force-deflection curves of SC1

Specimen SC2 South
24
Shear force-deflection curve of SC2 South
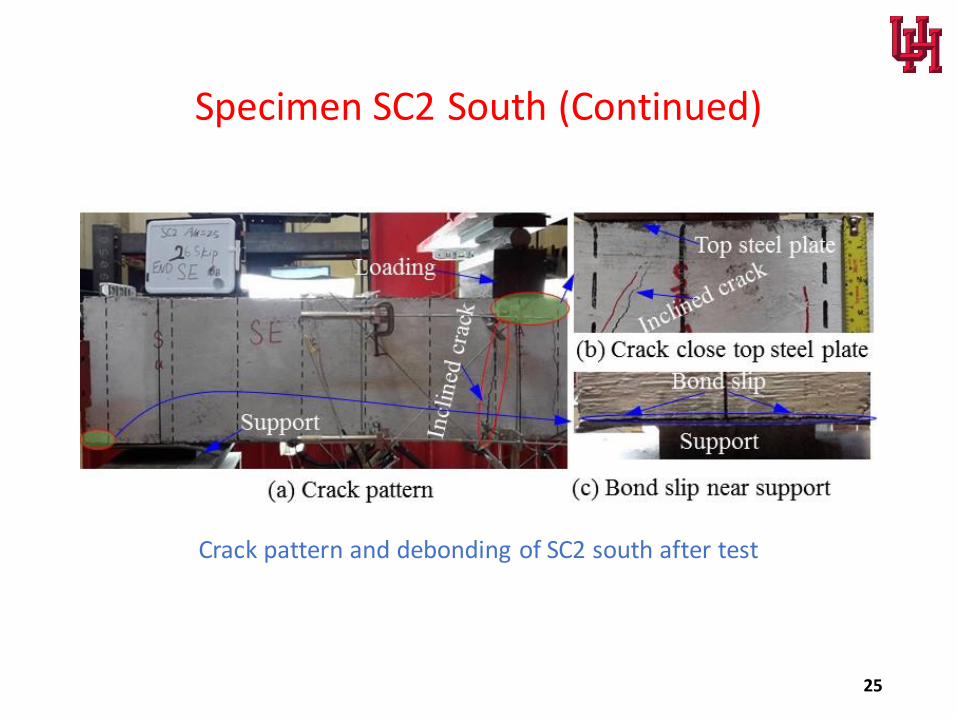
Specimen SC2 South (Continued)
25
Crack pattern and debonding of SC2 south after test
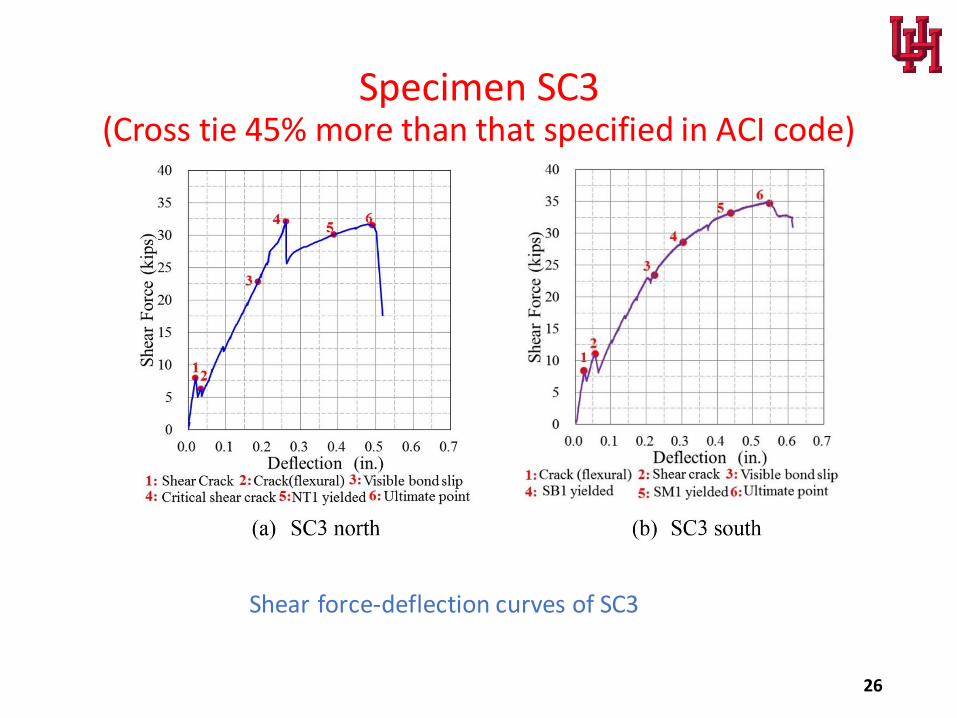
Specimen SC3 (Cross tie 45% more than that specified in ACI code)
26
Shear force-deflection curves of SC3
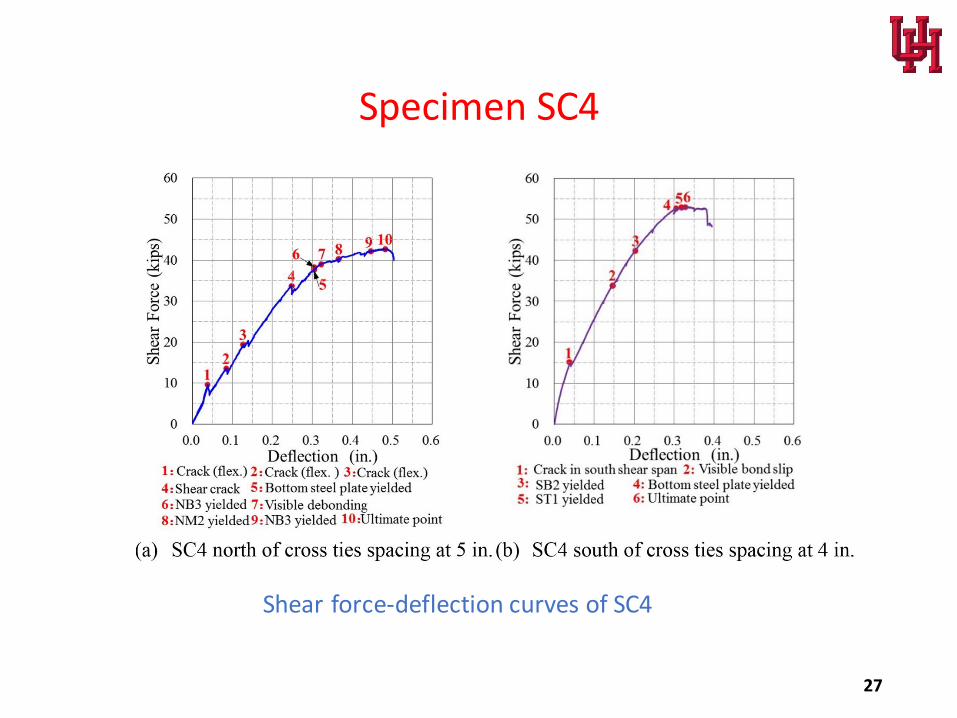
Specimen SC4
27
Shear force-deflection curves of SC4
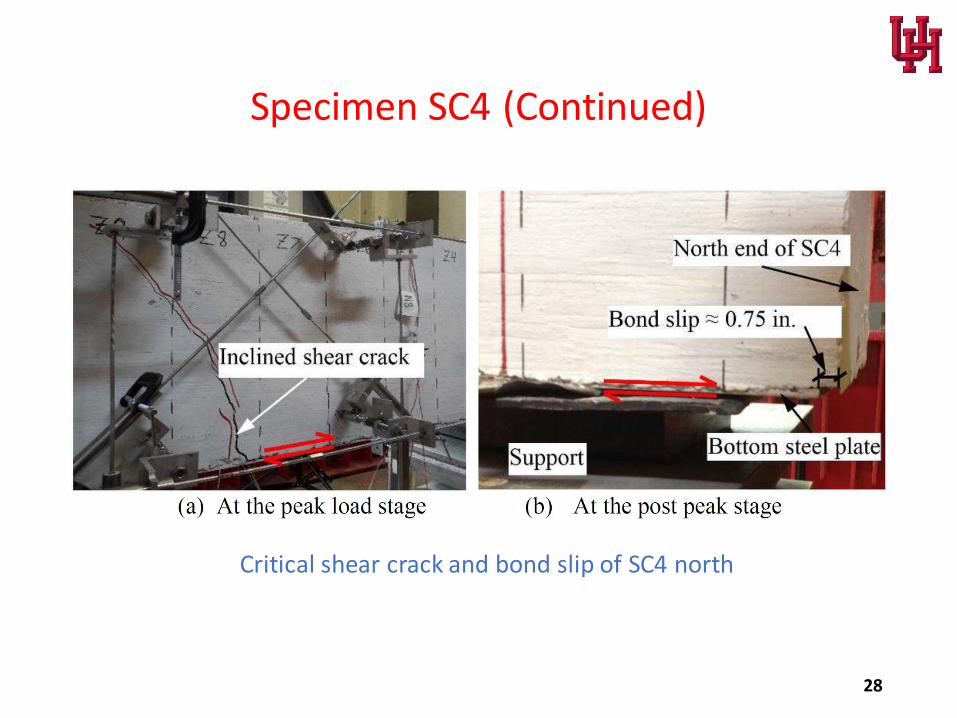
Specimen SC4 (Continued)
28
Critical shear crack and bond slip of SC4 north

Specimen SC5
29 Shear force-deflection curves of SC5
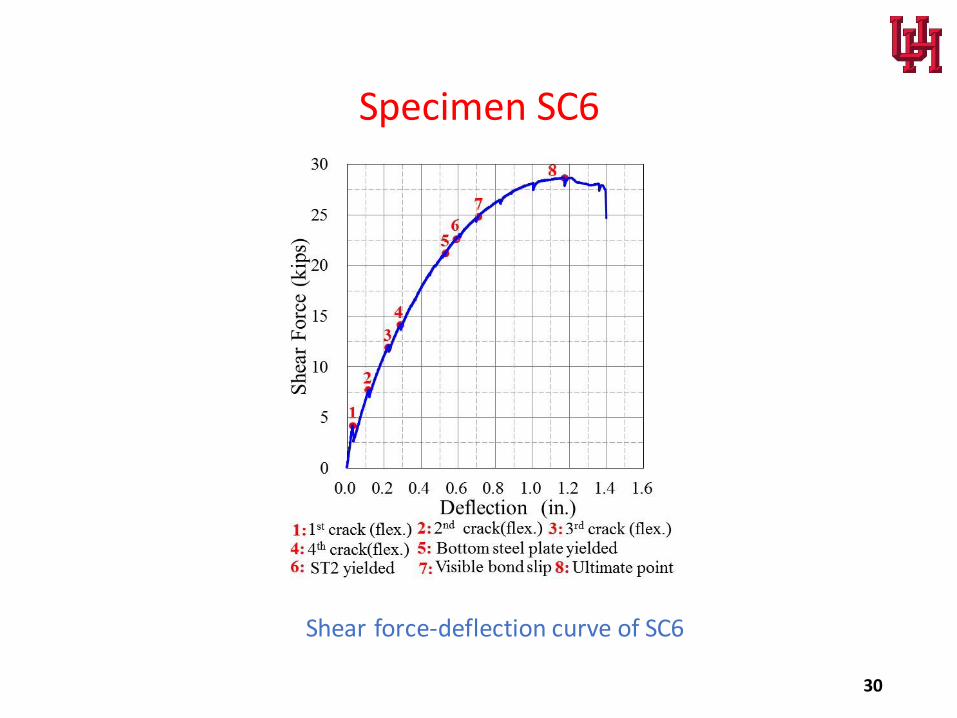
Specimen SC6
30
Shear force-deflection curve of SC6
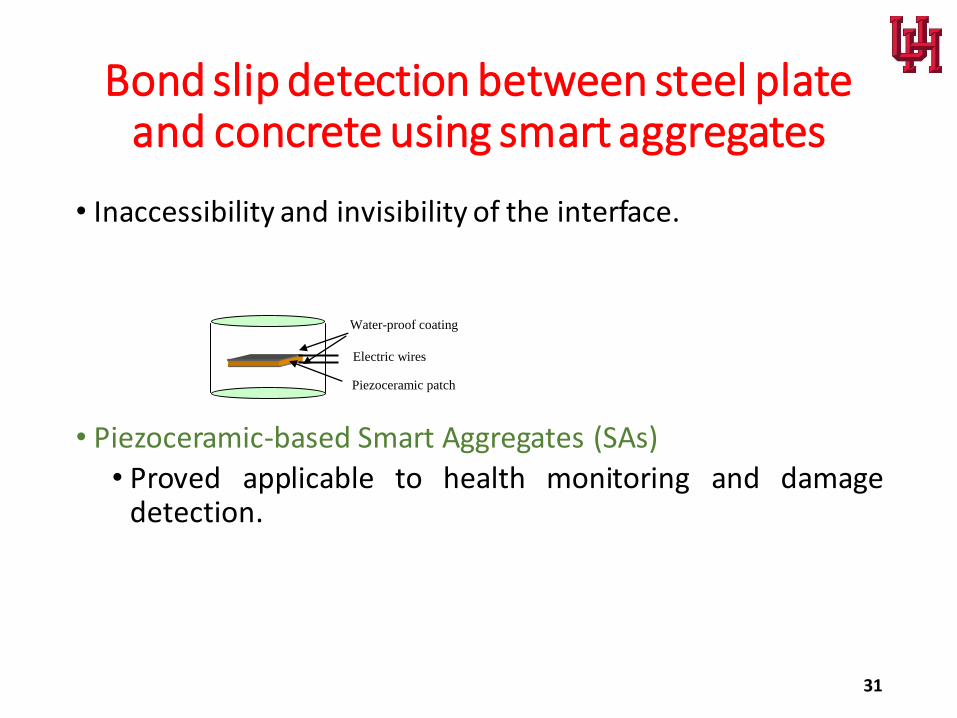
Bond slip detection between steel plate and concrete using smart aggregates
• Inaccessibility and invisibility of the interface.
• Piezoceramic-based Smart Aggregates (SAs)
• Proved applicable to health monitoring and damage detection.
31
Water-proof coating
Electric wires
Piezoceramic patch

Detection principles
32
Actuator
Sensors
Signal received S0
Signal sent-out
Concrete
Actuator
SensorsSignal received Si
Signal sent-out
Steel plate
ConcreteDebonding
Bond slip Bond slipSteel plate
Developed smart aggregate based active sensing approach to detect bond slip between steel plate and concrete

Test details
Specimen a/d Stie
# (in.)
𝑓𝑐′∗
(ksi) 𝐹𝑢𝑙𝑡.** (kips)
𝜌𝑡,𝐴𝐶𝐼 (%)
𝜌𝑡,𝑡𝑒𝑠𝑡 (%)
𝜌𝑡,𝑡𝑒𝑠𝑡 𝜌𝑡,𝐴𝐶𝐼
SC1 North 2.50 8.00 8.13 27.4 0.111 0.102 0.92 SC1 South 2.50 8.00 8.13 26.1 0.111 0.102 0.92 SC4 North 2.50 5.00 7.37 42.7 0.106 0.164 1.54 SC4 South 2.50 4.00 7.37 53.0 0.106 0.205 1.93
# Stie = the spacing of cross ties. * 𝑓𝑐
′ = the concrete compression strength from concrete cylinders (152.4 mm ×304.8 mm). ** 𝐹𝑢𝑙𝑡. = ultimate shear capacity
33
Two selected SC beams

Installation and location of SAs
34
Figure Arrangement of SAs in SC1 (unit: inch)
180.0
16.0
8.0
16.0
39.5
5.0
2.5
8.0
39.5 2.0
4.0 4.0 5.0
SA 1
SA 3
SA 4 SA 6
SA 2
P P 4572
5 4 4 • 8
2 2 39.5 39.5
5 8 SA 5
Top steel plate
Bottom steel plate
Cross ties
16
.0 1
6.0
No
rth So
uth
SA 1
SA 3
SA 4 SA 6
SA 5
SA 2
P P 180
39.5
8
39.5 2
8
8
2
Cross ties
Top steel plate
Bottom steel plate
8
16
.0
16.0
Sou
th
No
rth
Figure Arrangement of SAs in SC4 (unit: inch)

Apparatus
• Function Generator
• Power Amplifier
• Data Acquisition board
35
Function generator Power amplifier
Actuator
Sensor
Acquisition boardLaptop with supporting software
Signal generated Signal amplified
Signal received
Medium
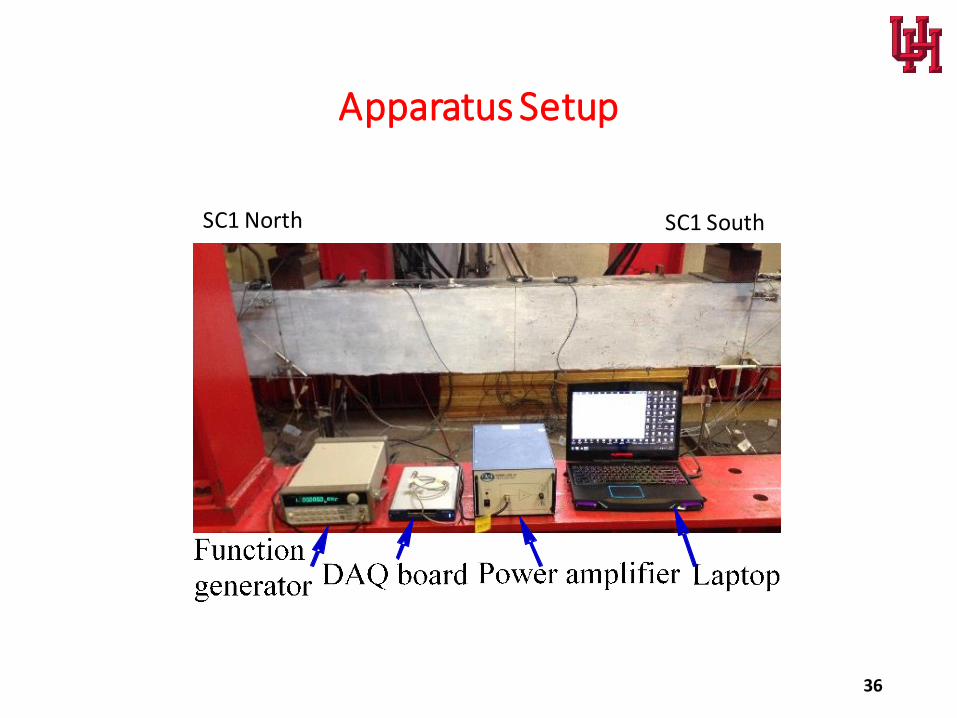
Apparatus Setup
36
SC1 North SC1 South

Sample Test Result (SC4 North)
37
P
4th crack
SA4
SA3
2nd crack
3rd crack
SA1
So
uth
1st crack5th crack
Bond slip
No
rth
(a) Location of bond slip and crack
Bond slip5th crack
Bottom Steel plate
Concrete
(b) Crack and bond slipBond slipBottom Steel plate
Concrete
(c) Bond slip at north end (side)
19.0 mm
Bond slip and crack patterns in SC2 north after test
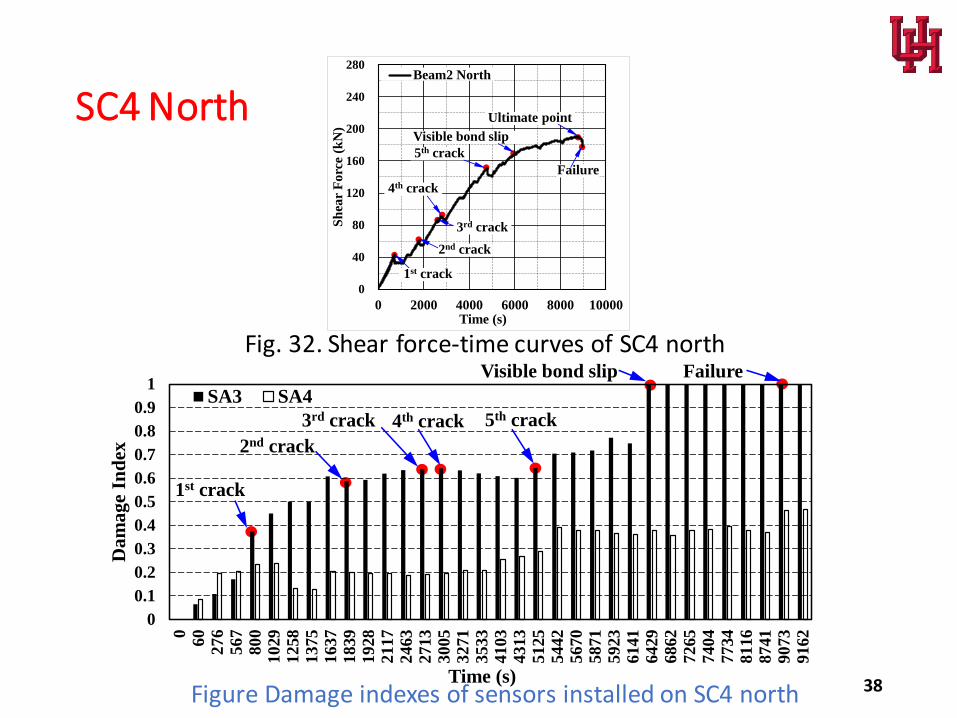
SC4 North
38
0
40
80
120
160
200
240
280
0 2000 4000 6000 8000 10000
Sh
ear
Fo
rce
(kN
)
Time (s)
Beam2 North
3rd crack
1st crack
2nd crack
4th crack
5th crack
Visible bond slip
Ultimate point
Failure
0
0.1
0.2
0.3
0.4
0.5
0.6
0.7
0.8
0.9
1
060
276
567
800
1029
1258
1375
1637
1839
1928
2117
2463
2713
3005
3271
3533
4103
43
13
5125
5442
56
70
5871
5923
6141
6429
6862
7265
7404
7734
8116
8741
9073
9162
Dam
age
Ind
ex
Time (s)
SA3 SA4
1st crack
2nd crack
3rd crack 4th crack 5th crack
FailureVisible bond slip
Figure Damage indexes of sensors installed on SC4 north
Fig. 32. Shear force-time curves of SC4 north

Digital Image Correlation-Based Debonding Detection
Instrumentation
39
X
Y
Z
Cameras
External Lights
DAQ
Computer
(b) (a)
DIC system setup, (a) Schematic illustration, (b) Pictorial illustration

Test Setup
40
The results from DIC is used to compute: 1. Beam deflection 2. Strain contour map 3. Point-to-point average strain 4. Crack opening 5. Steel concrete debonding 6. Final localization with ±5 µm accuracy

Discussion on Debonding
41
Interface
Interface
(a)
(b)
Concrete
Steel-plate
Concrete
Steel-plate
1 inch
Crack
High–resolution images (a) and DIC image (f) of SC3 at north–end corresponding to point 3 in Figs. (c) and (d). (b) and (g) right after point 3 in Figs. (c) and (d).
0.0 0.1 0.2 0.3 0.4 0.5 0.6 0.7 0
10
20
30
40
4 5 3
2
1 1: Crack (Flexural) 2: Visible Bond Slip 3: Inclined Crack & Peak Point
4: 1 st Cross Tie Yielded 5: Ultimate Point
DIC North End LVDT North End
Sh
ea
r F
orc
e (k
ips
)
Deflection (in)
(c)
0.00 0.04 0.08 0.12 0.16 0.20 0
10
20
30
40
Bond Slip
5 4 3
2
1 1: Crack (Flexural) 2: Visible Bond Slip 3: Inclined Crack & Peak Point
4: 1 st Cross Tie Yielded 5: Ultimate Point
Sh
ea
r F
orc
e (k
ips
)
Bond Slip (in)
(d) Debonding
(a)
(f)
(b)
(g)
Discussion on Debonding (Continued)
42
Concrete
Steel-Plate
Concrete
Steel-Plate
Concrete
Steel-Plate
Concrete
Steel-Plate
Concrete
Steel-Plate
Concrete
Steel-Plate
Concrete
Steel-Plate
1 inch
(a)
(b)
(c)
(d)
(g)
(f)
(e)
Strain Concentration
Visible Crack
0.1
2
0.0
8
0.0
4
(%)0.0
0
0.2
8
0.2
4
0.2
0
0.1
6
0.4
0
0.3
6
0.3
2
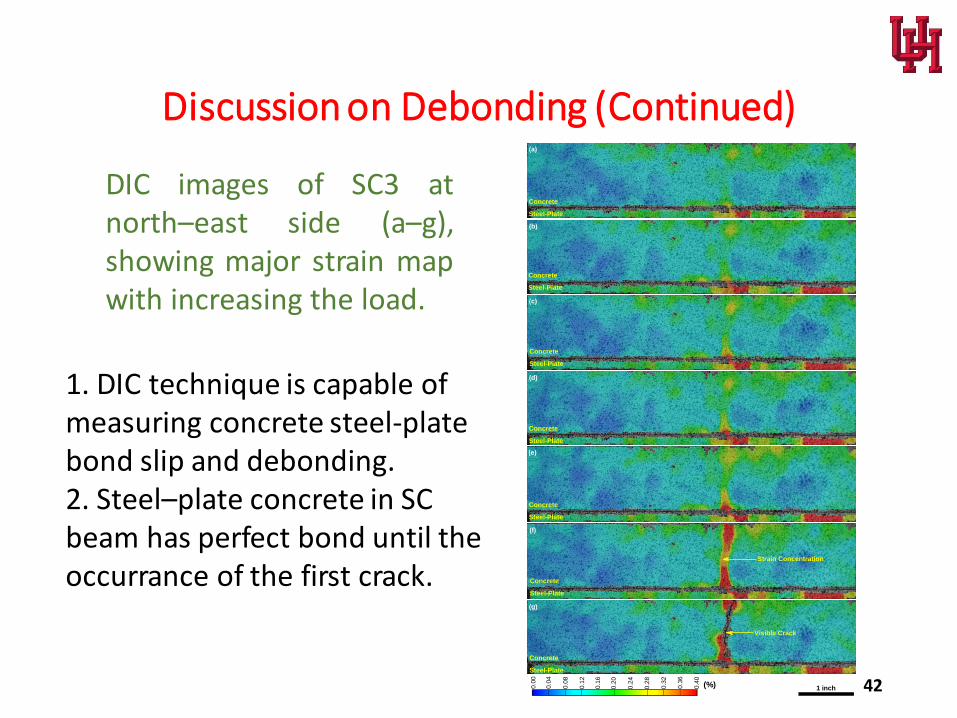
DIC images of SC3 at north–east side (a–g), showing major strain map with increasing the load.
1. DIC technique is capable of measuring concrete steel-plate bond slip and debonding. 2. Steel–plate concrete in SC beam has perfect bond until the occurrance of the first crack.

Calibrated Finite Element Model for S-UHPC Beam
b = 12 "
P P Steel Plate UHPC
Cross ties
43

Slip-Steel Truss
Element
CSMM Membrane
ElementP
y
x
1
2
3
4
5
6
7
8
9
10
11
12
13
14
15
16
17
18
19
20
P
21
22
23
24
25
26
27
28
29
30
31
32
33
34
35
36
37
38
39
40
41
42
L = 164"
DL = 0.5d
a = 2.5d a = 2.5d
d =
16
"A
A
43
44
45
46
d =
16"
ts = 3/16"
ts
Steel Plate
(Truss Element)
Reinforced Concrete
(CSMM Membrane
Element)
Steel Plate
(Truss Element)
b = 12"
Finite Element Mesh
Cross Section A-A 44

Constitutive Model for Concrete
cf
'
cf
c
00 0
'
cf
Normal Concrete
Softened Concrete
02 04
cf
crf
c
0.4
crc cr
c
f f
cr
In Compression In Tension
/0.31 (MPa)cr cf f
0.00008cr
= cracking stress
= cracking strain
= compressive strength
= strain at maximum stress
'
cf
0
= softening coefficient
'
5.8 11 0.9
241 400(MPa)o
Tcf
45

Calibration of the maximum bond strength between concrete and steel plate
V
z aV
jdK1 K1 K1 K1 K1 K1
T
Free-body Diagram
max 1 0.8 v yvT K f b z a
Equilibrium equation:
max maxV a jd T (Eq. 1)
(Eq. 2)
From Eq. (1) & (2) gives:
max
1 0.8 sv yv
V aK f
jdb z a
(Eq. 3)
= the maximum bond strength between concrete and steel plate

47
Specimen b
(mm)
t
(mm)
a/d
%
fy
(MPa)
fc
(Mpa)
jd
(mm)
Vmax
(kN)
0.8fy
(MPa)
T
(kN)
K1
(MPa)
S-UHPC1 South 305 6.350 2.5 0.184 413 154 402 220.47 0.608 612.4 1.060
S-UHPC2 South 305 6.350 2.5 0.274 413 154 402 345.66 0.905 960.2 1.709
S-UHPC2 North 305 6.350 2.5 0.321 413 154 402 382.21 1.061 1061.7 1.830
Specimen b
(mm)
t
(mm)
a/d
%
fy
(MPa)
fc
(Mpa)
jd
(mm)
Vmax
(kN)
0.8fy
(MPa)
T
(kN)
K1
(MPa)
SC1 North 305 4.763 2.5 0.102 413 56 402 121.71 0.337 338.1 0.584
SC1 South 305 4.763 2.5 0.102 413 56 402 116.37 0.337 323.3 0.543
SC3 North 305 4.763 2.5 0.137 413 40 402 155.35 0.453 431.5 0.722
SC3 South 305 4.763 2.5 0.137 413 40 402 143.45 0.453 398.5 0.632
SC4 North 305 4.763 2.5 0.164 413 51 402 190.04 0.542 527.9 0.896
SC4 South 305 4.763 2.5 0.205 413 51 402 235.69 0.677 654.7 1.105
SC5 South 305 4.763 1.5 0.137 413 55 402 248.77 0.453 414.6 1.241
SC5 North 305 4.763 1.5 0.164 413 55 402 287.99 0.542 480.0 1.419
SC6 305 4.763 5.2 0.137 413 55 402 127.58 0.453 737.1 0.604
Calibration (Continued)
S-UHPC Beams
SC Beams

10.8yslip sv yv
z af f K
t
0.89 0.073slip s
aE E
d
Calibrated Constitutive Model for Slip Steel Plate
1K = the maximum bond strength between concrete and steel plate
a = shear span of the beam
d = depth of the beam
sv = percentage of transverse steel bar
yvf = yielding stress of transverse steel bar
z = distance from center of support to the end beam
yslipf = yielding stress of the slip steel plate
slipE = elastic modulus of the slip steel plate
0.7
'
1 0.89 v c
aK f
d
= deterioration rate
sf
yf
y
Normal Steel
yslip
sE
slipE
yslipf
3 yslip
Slip Steel
s
0.2 yslipf
10 yslip
48
0.7
'
1 1.54 v c
aK f
d
S-UHPC Beams
SC Beams

Comparison of Analytical Results with Experimental Outcomes
P1 P2
V1 V2D
Deflection)Shear Force) Shear Force)
49

Comparison (Continued)
S-UHPC-1 (South) S-UHPC-2 (North)
Deflection (mm)
Sh
ear
Forc
e (k
N)
0 5 10 15 20 25 30 35 40 45
0
40
80
120
160
200
240
280
320
360
400
S-UHPC2-North (Test)
S-UHPC2-North (Analysis)
Deflection (mm)
Shea
r F
orc
e (k
N)
0 5 10 15 20 25 30 35 40 45
0
40
80
120
160
200
240
280
320
360
400
S-UHPC2-South (Test)
S-UHPC2-South (Analysis)
Deflection (mm)
Sh
ear
Forc
e (k
N)
0 2 4 6 8 10 12 14 16 18 20 22 24 26 28 30 32 34 36 38 40
0
40
80
120
160
200
240
280
320
360
400
S-UHPC1-South (Test)
S-UHPC1-South (Analysis)
S-UHPC-2 (South)
50

Beam SC1
Beam SC3
Deflection (mm)
Sh
ear
Forc
e (k
N)
0 1 2 3 4 5 6 7 8 9 10 11 12 13 14 15 16 17 18 19 20
0
30
60
90
120
150
180
210
240
270
300
SC3 (Test)
SC3 (Analysis)
Deflection (mm)
Sh
ear
Forc
e (k
N)
0 1 2 3 4 5 6 7 8 9 10 11 12 13 14 15 16 17 18 19 20
0
30
60
90
120
150
180
210
240
270
300
SC1 (Test)
SC1 (Analysis)
Deflection (mm)
Sh
ear
Forc
e (k
N)
0 5 10 15 20 25 30 35 40 45
0
30
60
90
120
150
180
210
240
270
300
SC6 (Test)
SC6 (Analysis)
Beam SC6
51
Comparison (Continued)

Beam SC4 (North) Beam SC5 (North)
Deflection (mm)
Sh
ear
Forc
e (k
N)
0 1 2 3 4 5 6 7 8 9 10 11 12 13 14 15 16 17 18 19 20
0
30
60
90
120
150
180
210
240
270
300
SC4-North (Test)
SC4-North (Analysis)
Deflection (mm)
Sh
ear
Forc
e (k
N)
0 1 2 3 4 5 6 7 8 9 10 11 12 13 14 15 16 17 18 19 20
0
30
60
90
120
150
180
210
240
270
300
CS4-South (Test)
CS4-South (Analysis)
Deflection (mm)
Shea
r F
orc
e (k
N)
0 1 2 3 4 5 6 7 8 9 10 11 12
0
30
60
90
120
150
180
210
240
270
300
SC5-North (Test)
SC5-North (Analysis)
Deflection (mm)
Sh
ear
Forc
e (k
N)
0 1 2 3 4 5 6 7 8 9 10 11 12
0
30
60
90
120
150
180
210
240
270
300
SC5-South (Test)
SC5-South (Analysis)
Beam SC4 (South) Beam SC5 (South)
52
Comparison (Continued)
Conclusions
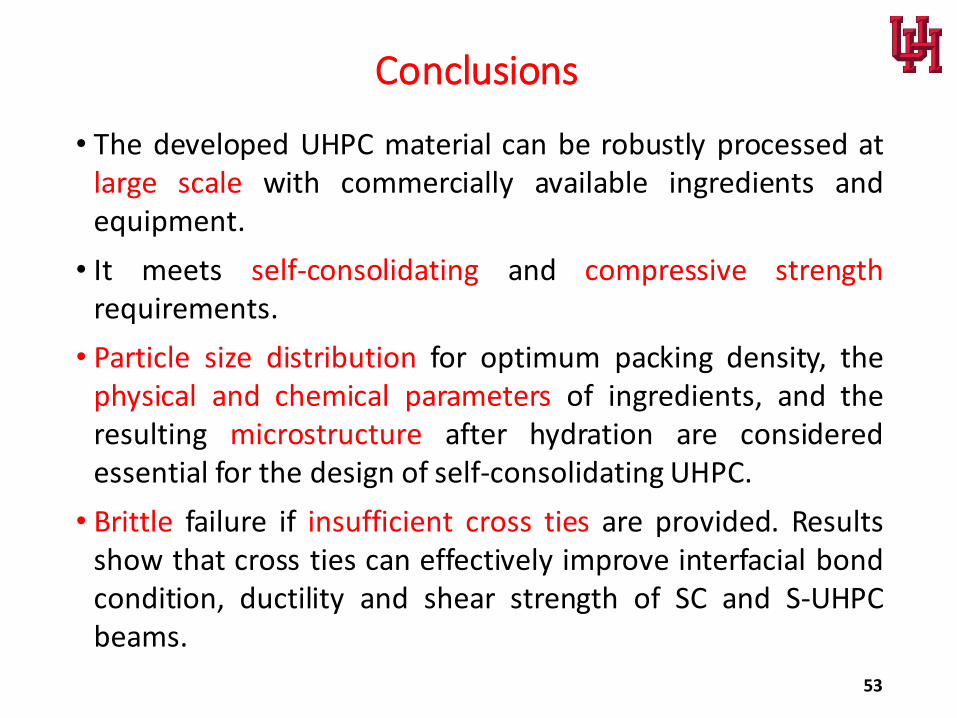
• The developed UHPC material can be robustly processed at large scale with commercially available ingredients and equipment.
• It meets self-consolidating and compressive strength requirements.
• Particle size distribution for optimum packing density, the physical and chemical parameters of ingredients, and the resulting microstructure after hydration are considered essential for the design of self-consolidating UHPC.
• Brittle failure if insufficient cross ties are provided. Results show that cross ties can effectively improve interfacial bond condition, ductility and shear strength of SC and S-UHPC beams.
53

Conclusions
• For S-UHPC Beams: 10% more than that specified in ACI
code when a/d=2.5.
• For SC Beams:
• DIC technique is capable of measuring concrete steel-plate bond slip and debonding.
• PZT smart aggregates provide early warning about the debonding of the steel plate and the concrete in SC beams before structural failure happens.
• The bond slip based stress-strain curve of steel plate is
developed that can be used to accurately predict the shear
force deflection relationship of SC beams.
54

Thank you.
55