uk unemployment in the great recession …blnchflr/papers/bell-blanchflower.pdf · bell and...
TRANSCRIPT

BELL AND BLANCHFLOWER UK UNEMPLOYMENT IN THE GREAT RECESSION R3
UK UNEMPLOYMENT IN THE GREAT RECESSION
David N.F.Bell* and David G. Blanchflower**
This paper considers some of the implications of the increase in UK unemployment since the beginning of the GreatRecession. The major finding is that the sharp increase in unemployment and decrease in employment is largely concen-trated on the young. This has occurred at a time when the size of the youth cohort is large. As a response to a lack of jobsthere has been a substantial increase in applications to university, although there has only been a small rise in the numberof places available. Further we find evidence that the unemployed have particularly low levels of well-being, are depressed,have low levels of life satisfaction, have difficulties paying their bills and are especially likely to be in financial difficulties.
Keywords: Unemployment; youth unemployment and unhappiness
JEL Classifications: D1; I31; E300; E320; J110; J210
*University of Stirling and IZA. E-mail: [email protected]. **Dartmouth College, University of Stirling, IZA, CESifo and NBER. E-mail:[email protected].
1. IntroductionThe UK economy went into recession during the secondquarter of 2008 based both on declines in output andincreases in unemployment. In this recession the labourmarket was not a lagging indicator. From peak totrough, real output fell by 6.4 per cent. By the secondquarter of 2010 GDP had grown 1.9 per cent from thetrough.
This was the most substantial shock to UK output sincethe Great Depression. Most developed countries alsoexperienced significant reductions in output. It istherefore not surprising that this collapse has beentermed the ‘Great Recession’. It came about as a result ofgovernment inaction to correct long-standing economicimbalances and from a systematic misperception of riskby almost all actors in the financial sector.
It was inevitable that these events would have labourmarket consequences. In previous recessions,particularly that of the early 1980s, the UK labourmarket took a long time to recover from demand shocks.Yet the UK is now widely viewed as having a highlyflexible labour market, at least in relation to otherWestern European economies. Hence one might expectthat the impact of the Great Recession on employment,unemployment and other real labour market variablesmight be limited in both size and duration.
UK government policy over the course of the recessionsuggested, at least implicitly, an acceptance that labourmarket flexibility would play a major role in returningthe labour market to equilibrium. Thus, unlike someother developed countries affected by the recession, suchas the USA, the UK did not introduce a major counter-cyclical package of discretionary fiscal measures. Andunlike countries such as Germany, it did not bringforward labour market policies specifically designed tomoderate the effects of the recession on the labourmarket.
However, the increase in unemployment has been lessthan some commentators, including the authors of thispaper, initially expected. In part this has been becausefirms have hoarded labour, cut hours and lowered pay.Nevertheless for some groups, particularly the young, itseffects have been very negative. In this paper, we reviewsome of the evidence on the increase in unemploymentduring the Great Recession and examine its effects.
This paper builds on a number of our earlier papers (Belland Blanchflower, 2009a,b,c, 2010) which demonstratethat unemployment increases have been particularlyconcentrated on young people. We provide new micro-econometric evidence from a number of surveysincluding the Labour Force Surveys and the

R4 NATIONAL INSTITUTE ECONOMIC REVIEW No. 214 OCTOBER 2010
Eurobarometers. We document the characteristics of theunemployed and how hard the young have been hit.
We consider the characteristics of the youth labourmarket. We first document the changes that haveoccurred in the UK over recent years, and in particularthe growth in the unemployment rate of the young andthe substantial rise in the size of the cohort. We thenplace these changes in international context, and showin particular how the ratio of youth to adult rates is veryhigh in the UK compared to most other countries,developed and developing, in the world. Third, we showthat youth labour markets are highly cyclically volatile.Fourth, we find that youths do not appear to have pricedthemselves out of jobs. Finally, we outline evidence thatunemployment while young creates permanent scars.
Furthermore, we find evidence that the unemployed haveparticularly low levels of happiness, have a tendency tobe depressed, have difficulties paying their bills and areespecially likely to be in financial difficulties.
A particular worry going forward is that the recoverymay be jobless as firms increase hours but do not raisetheir headcount. Fears about rising unemployment arelikely to be exacerbated by the austerity package ofpublic spending cuts and tax increases beingimplemented by the new coalition government. This islikely to increase unemployment significantly despiteclaims by the Office of Budget Responsibility (OBR) thatunemployment will fall. We fundamentally disagreewith the OBR’s view that private sector job creation willbe able to create 2.5 million jobs net, absorbing thepublic sector job loss and bringing down unemploymentsharply. In contrast, NIESR is currently forecasting thatunemployment will peak at 2.7 million in 2011. Worldgrowth appears to be slowing, the Baltic Dry Index hasfallen 50 per cent since the middle of May 2010 asconsumer confidence in the US, the UK and the EuroArea starts to slide. There are tough times ahead, and asa result the NIESR projection may be too low.
Section 2 reports the main labour market changes thatoccurred between 2008 and 2010. Section 3 providesdetails from the Labour Force Surveys on thecharacteristics of the new unemployed. Section 4 looksat the causes of unemployment while section 5 outlinesthe consequences. Section 6 examines the youth labourmarket. Section 7 presents new evidence onunemployment. Section 8 provides evidence on theimpact of unemployment on health and wellbeing.Section 9 concludes.
2. Rising unemploymentWe set the context by looking at the main changes thattake place in the UK labour market between 2008 andearly 2010. These are set out in table 1. A number of keydevelopments are apparent:
• Employment fell by 580,000 between the beginningof 2008 and early 2010. Nevertheless, this was not aslarge a decline in employment as in the 1980srecession, when it fell by 1.6 million betweenNovember 1980 and May 1983. And in the recessionof the early 1990s, employment fell by 1.7 millionbetween May 1990 and February 1993.
• The decline in employment is more concentratedamong men. Male employment has fallen by 3 percent while that of women has only fallen by 0.7 percent. The decline in male employment accounts for84 per cent of the overall fall in employment.However, this is not uncharacteristic of UK recessions.Falling male employment accounted for 78 per centof employment losses in the recession of the early1980s, and 81 per cent of job reductions in the early1990s recession.
• The young have also suffered disproportionately.Although they comprise only 19.5 per cent of the UKworking age population, 74 per cent of the decline inemployment has been among those aged 16 to 24.Consistent with the overall gender bias in job losses,males account for 44 per cent of the decline andfemales for 30 per cent. By contrast, employmentincreased by 173,000 among men and women overpension age.
• Data on redundancies show that at their peak, in 2009Q1, the redundancy rate for those aged 16–24 was17.7 per thousand workers, compared with 11.8 forthe population as a whole.1 Throughout the recession,redundancy rates among the young have exceededthose of other age groups.
• While full-time employment has declined, there havebeen offsetting increases in other forms of employment.Self-employment has increased by 91,000, while thenumber of temporary workers, who say they couldnot find permanent jobs, increased by 200,000. Thenumber of part-time workers who say they cannot findfull-time jobs increased by 400,000.
• Over the course of the Great Recession in the UK, the

BELL AND BLANCHFLOWER UK UNEMPLOYMENT IN THE GREAT RECESSION R5
high, at 35.6 per cent for 16–17 year olds, and 17.1per cent for 18–24 year olds. There has also been amarked drop in the employment to population rates(EPOP) of the young.
• The inactivity rate has risen, which implies adiscouraged worker effect. In part this also reflects anincrease in the number of students, but also an increasein the number of people who are inactive but ‘want ajob’.
Table 2 puts the UK unemployment rates intointernational context.
• The UK unemployment rate of 7.8 per cent puts it inthe middle of the pack. It is well below countries such
Table 1. Changes in the UK labour market since the startof the recession, thousands
2008 2009 2010 Δ2008–10
Working age population 37,699 37,885 38,065 +366Activity rate =(U+E)/P 63.6% 63.5% 63.2%Employed 29,564 28,989 28,984 –580Emp. rate (E/P) 74.9% 72.9% 72.3%16–17 546 452 392 –15416–17 emp. rate 34.4% 29.0% 25.8%18–24 3,701 3,476 3,425 –27618–24 emp. rate 64.8% 60.0% 58.7%Men 15,972 15,550 15,483 –489Women 13,592 13,439 13,501 –91Full–time 22,075 21,449 21,166 –909Part–time 6,408 6,426 6,634 226Employees 25,490 24,954 24,838 –652 FT 19,083 18,527 18,205 –878 PT 6,408 6,426 6,634 +226Self–employed 3,841 3,838 3,932 +91 FT 2,924 2,873 2,910 –14 PT 917 965 1,023 +106Temporary workers 1,424 1,412 1,539 +115Could not find
permanent job 357 418 552 +195PT because no FT
available 666 934 1,067 +401Total hours worked
(millions) 944.1 918.4 911.4Unemployed 1,611 2,376 2,468 +857Unemployment rate
(U/U+E) 5.2% 7.6% 7.8% 16–17 184 202 216 32 18–24 494 723 707 +213 25–49 702 1,089 1,156 +454 50+ 230 362 389 +159 16–17 unemp. rate 25.2% 30.8% 35.6% 18–24 unemp. rate 11.8% 17.2% 17.1% 25–49 unemp. rate 3.9% 6.0% 6.3% 50+ unemp. rate 2.8% 4.4% 4.6%% unemployed >12
months 25.0% 22.5% 31.9%Inactive (OLF) 7,864 7,917 8,097 +233Inactivity Rate (I/P) 20.9% 20.9% 21.3% Student 1,942 2,110 2,254 +312 LT sick 2,020 1,996 2,075 +55 Does not want a job 5,709 5,796 5,815 +106 Wants a job 2,155 2,120 2,282 +127
Source: ONS and ‘Labour market statistics’, July 2010. Notes: EPOP isthe employment to population ratio. Data are March–May averages.
unemployment rate rose from 5.2 per cent to 7.8 percent. The number of unemployed increased by857,000, exceeding the fall in employment by morethan 200,000. This is due to people, particularly theyoung, moving from inactivity directly tounemployment.
• The unemployment rate of young people is extremely
Table 2. International comparisons of unemploymentrates, May 2010
All Male Female Under 25s Ratio<25/all
EA16 10.0 9.9 10.2 19.9 1.99EU27 9.6 9.7 9.5 20.5 2.14Austria 4.0 3.9 4.2 9.5 2.38Belgium 8.6 8.2 9.0 23.8 2.77Bulgaria 9.7 10.4 9.0 22.5 2.32Cyprus 7.2 7.2 7.1 18.4 2.56Czech Republic 7.5 6.5 8.7 19.4 2.59Denmark 6.8 7.9 5.5 12.4 1.82Estonia 19.0 23.8 14.4 39.8 2.09Finland 8.6 9.6 7.6 22.2 2.58France 9.9 9.6 10.2 22.6 2.28Germany 7.0 7.6 6.4 9.4 1.34Greece 11.0 8.3 14.8 29.5 2.68Hungary 10.4 10.6 10.2 24.5 2.36Ireland 13.3 16.8 8.9 26.5 1.99Italy 8.7 7.7 10.1 29.2 3.36Japan 5.2 5.5 4.8 n/a n/aLatvia 20.0 24.6 15.5 39.7 1.99Lithuania 17.4 22.2 12.6 34.4 1.98Luxembourg 5.2 4.3 6.4 15.8 3.04Malta 6.7 6.7 6.7 14.9 2.22Netherlands 4.3 4.4 4.2 8.1 1.88Norway 3.7 4.0 3.1 9.8 2.65Poland 9.8 9.4 10.3 23.5 2.40Portugal 10.9 9.9 12.0 22.1 2.03Romania 7.4 8.0 6.5 20.9 2.82Slovakia 14.8 14.4 15.2 35.1 2.37Slovenia 7.1 7.1 7.0 12.8 1.80Spain 19.9 19.7 20.2 40.5 2.04Sweden 8.8 8.9 8.6 25.9 2.94UK 7.8 8.9 6.6 19.7 2.53USA 9.7 10.5 8.8 18.1 1.87
Source: Eurostat.http://epp.eurostat.ec.europa.eu/cache/ITY_PUBLIC/3-02072010-AP/EN/3-02072010-AP-EN.PDF

R6 NATIONAL INSTITUTE ECONOMIC REVIEW No. 214 OCTOBER 2010
as Latvia and Spain with rates around 20 per cent butwell above Austria (4.0 per cent), the Netherlands (4.3per cent), Norway (3.7 per cent) and Japan (5.2 percent).
• Even though male rates are higher than female ratesin the UK, this pattern is not repeated everywhere. Ineleven countries female rates are higher than malerates (e.g. Austria, Belgium, France, Italy, Greece,Portugal and Spain).
• Youth unemployment rates in the UK are especiallyhigh, particularly in relation to overall rates, with aratio of youth to adult rates of 2.53. This is higherthan the vast majority of countries, with the majorexceptions being Belgium (2.77), Greece (2.68), Italy(3.36) and Sweden (2.94).
The concern is that unemployment will start to riserapidly if this coalition government goes ahead with itsmisguided plans to cut public spending and raise taxes.More on that below.
3. What are the characteristics of the newunemployed?
Another key comparison with past recessions is how theincidence of unemployment is distributed across thepopulation. Historically, the unemployed have beenconcentrated in particular regions or industries; it has
fallen most heavily on particular groups in society suchas the young, the old, those with a non-white ethnicbackground and those whose partner was not working.Are these patterns being repeated in this recession? Sometrends are emerging in the claimant countunemployment data that are already worthy ofcomment.
Because recessions influence the components of demanddifferently, their effects are rarely uniform acrossindustrial sectors. Thus, if investment falls more rapidlythan other components of demand, the construction andinvestment goods industries are likely to be moreaffected than other sectors. Since industries are notuniformly distributed across the country, particularregions and localities will experience a more rapid risein unemployment than elsewhere. In this section, weexamine the incidence of unemployment categorised byage, region, ethnicity and household composition.
Micro-data at the level of the individual are used, drawnfrom separate Labour Force Surveys for 1984, 1993 and2006–10 up to March. Initially we focus on the mostcurrent unemployment rates. Below are the weightedrates (per cent) by sub-group for the period January 2009– March 2010. Youth rates (18–24) are generally morethan double the overall rates.
It is apparent that unemployment rates decline with age,are higher among men, minorities and the least
Table 3. Characteristics of the new unemployed
All ages 16-24 yrs All ages 18-24 yrs
Overall 7.7 19.2 Rest of North 7.6 19.8Male 8.7 22.1 South Yorkshire 9.6 21.7Female 6.5 16.0 West Yorkshire 9.0 19.7White 7.1 18.1 Rest Yorks/Humber 8.1 20.0Black 17.3 38.6 East Midlands 7.3 17.7Asian 11.5 28.9 East Anglia 6.1 17.7No qualifications 14.9 40.6 Inner London 9.5 25.4Apprenticeship 11.6 15.0 Outer London 8.6 21.0O-level 9.7 21.7 Rest of South East 6.2 16.4ONC/OND 8.7 15.8 South West 6.2 16.1A-level 7.1 13.4 West Midlands 12.7 29.5HNC/HND 5.1 12.3 Rest West Midlands 7.0 18.4Degree 3.9 13.2 Greater Manchester 9.5 21.0
First 4.1 12.8 Merseyside 9.4 25.0IIi 3.8 11.6 Rest of North West 7.2 18.4IIii 4.4 14.5 Wales 8.4 21.5III 5.2 18.6 Strathclyde 8.4 17.0Pass 2.9 6.2 Rest of Scotland 6.4 16.6
Higher degree 3.2 10.4 Northern Ireland 6.6 16.6Tyne & Wear 11.0 25.7
Source: Labour Force Survey.

BELL AND BLANCHFLOWER UK UNEMPLOYMENT IN THE GREAT RECESSION R7
educated. Unemployment rates for 18–24 year olds arelower the higher the class of degree obtained andespecially so for those with a first. Unemployment isespecially prevalent among those aged 16–24 who donot have any qualifications. Youth unemployment ratesare highest in the regions that have the highest overallrates of unemployment (West Midlands, Merseyside,South Yorkshire, Wales and Inner London) and viceversa. The distribution of highest educationqualifications (per cent) in 2008 is reported in table 4.
The employed are more highly educated but what standsout is that just over a third of the unemployed have A-levelsor higher. This contrasts sharply with 1984 when, based onour examination of the LFS, at that time more than half ofthe unemployed had no qualifications while only 2 per centof the unemployed had a degree or higher degree.
The current downturn is not just a blue-collar recession.
This is confirmed when one looks at the occupationdistributions. In table 5 we report the distributions (percent) of the current occupations of the employed and thelast occupation of the unemployed in 2008. Note thatone fifth of the unemployed (21 per cent) had not had anoccupation in the preceding eight years, and these areexcluded from the distribution. We are struck by thedifferences in the distributions; the unemployed are morelikely to be from the least skilled occupations.
If we examine the most recent data on the reduction inworkforce jobs, it is apparent that there has been adecline in the numbers employed in Finance, Businessand Services and Distribution, Hotels and Restaurants.A puzzle in the data is the fact that there has been nocontraction in the numbers working in construction.This may in part be explained by the fact thatapproximately 40 per cent of the most recent increase inunemployment is from the self-employed whodisproportionately work in construction. In the LFS theunemployed report their last industry and thedistributions are in table 6, for those who have everworked (per cent) alongside the employed for 2008. Thepuzzle is also there in the unemployment data becausethe construction industry proportion seems low. Theimportant role played by migrants in this sector and theextent to which they are adequately sampled in the LFSmay also contribute to an explanation.
A comparison of how unemployment rates have changedover time are reported in table 7 in the first row using
Table 4. Distribution of highest education qualifications,2008, per cent
Employed Unemployed
Degree or equivalent 15 9Higher education 5 3A level 36 24O-level 31 37Other qualifications 8 14No qualifications 5 13
Source: Labour Force Survey.
Table 5. Distributions of the current occupations of theemployed and the last occupation of the unemployed,2008, per cent
Current Unem- Unemployedworkers ployed age <25
Managers and seniorofficials 16 8 2
Professional occupations 14 5 1Associate professional
and technical 15 9 6Administrative and
secretarial 11 14 8Skilled trades occupations 11 6 12Personal service
occupations 9 11 7Sales and customer service
occupation 7 11 20Process, plant and machine
operatives 7 11 7Elementary occupations 11 25 36
Source: Labour Force Survey.
Table 6. Distribution of last industry worked by unem-ployed and employed, 2008, per cent
Employed Unemployed
Agriculture, hunting & forestry 0.7 1.3Mining, quarrying 0.4 0.3Manufacturing 10.7 14.7Electricity gas & water supply 0.7 0.7Construction 7.7 13.4Wholesale, retail & motor trade 14.0 18.1Hotels & restaurants 4.6 9.3Transport, storage & communication 6.3 6.8Financial intermediation 4.0 3.3Real estate, renting etc 12.5 13.3Public administration & defence 7.1 2.9Education 10.3 4.3Health & social work 13.7 6.2Other community, social & personal 5.7 5.3Private households with employed persons 0.2 0.2Extra-territorial organisations 0.1 0.1
Source: Labour Force Survey.

R8 NATIONAL INSTITUTE ECONOMIC REVIEW No. 214 OCTOBER 2010
ONS data. The remaining rows report on the changingcharacteristics based on the (unweighted) means fromour LFS data files. The earlier two years of 1984 and1993 were chosen, as these were the high points ofunemployment in earlier cycles and thus the depth of thetwo prior recessions and hence provide a useful basis forcomparison.2
The main points that stand out are that unemployment ishigher among the less educated, the young and blacks andespecially young blacks. That pattern is consistent in eachof the years. Unemployment starts to rise for all groups in2008. Unemployment for blacks was considerably worse in1984 and 1993. Somewhat surprisingly the unemploymentrate of young blacks in 2009/10 is higher already than in1998. This is worrying.
4. Causes of unemploymentThe orthodox explanation of unemployment that arguesthat institutions matter (Layard et al., 2005; Nickell,2006) has been subject to fairly extensive econometrictesting and, in recent years, the validity of the empiricalresults supporting this view has been called intoquestion. It has proved difficult to estimate a set of cross-country panel unemployment regressions that contain alagged unemployment rate and a full set of year andcountry dummies and show that any of the labourmarket rigidity variables work. This is the first mainsimilarity between European labour markets; labourmarket institutions do not tend to cause unemployment.
The major exception is changes in the replacement rate,which, in some specifications, do appear to benegatively correlated with changes in the unemploymentrate. Blanchard and Wolfers (2000) have argued that“the interaction of shocks and institutions does a goodstatistical job of fitting the evolution of unemployment
both over time and across countries”. This result isquestionable because it is obtained in an over-fittedmodel – few data points and lots of variables – and theresults appear to be driven by the cross-section variationrather than by any time series changes. There are onlyeight time series data points as they use five-yearaverages from 1960–95.
The increase in unemployment we have observed in theUK over the past year or so is not due to decreases inlabour market flexibility. It is not that frictions in themarket have increased; rather, there has been a collapsein the demand for labour as product demand has fallen,which in turn reflects severe credit rationing, fallingconsumer confidence, responses to transitory shocks inraw materials prices and delayed response by monetaryauthorities to these developments. None of these issuesdirectly impinge on the labour market or on the extent towhich institutional arrangements affect its efficiency.
5. The consequences of unemployment?The major reasons cited in the literature for why we careabout unemployment are as follows:
1) Because of the lost output involved. During a longperiod of unemployment, workers can lose their skills,causing a loss of human capital.
2) Unemployment is a stressful life event that makespeople unhappy (Winkelmann and Winkelmann,1998; Clark and Oswald, 1994; Frey and Stutzer, 2002;Ahn et al., 2004).
3) Unemployment increases susceptibility tomalnutrition, illness, mental stress, and loss of self-esteem, leading to depression (Linn et al., 1985; Freseand Mohr, 1987; Jackson and Warr, 1987; Banks andJackson, 1982; Darity and Goldsmith, 1996;Goldsmith et al., 1996; Brenner and Mooney, 1983).Goldsmith et al. (1996, 1997) found, for example,using data from the NLSY, that being jobless injuresself-esteem and fosters feelings of externality andhelplessness among youths. Moreover, they also foundevidence that the psychological imprint of joblessnesspersists.
4) Increases in the unemployment rate tend to be associatedwith increases in the suicide rate (Platt, 1984; Pritchard,1992; Blakeley et al., 2003; Hamermesh and Soss, 1974;Daly et al. 2008). The unemployed appear to have ahigher propensity to commit suicide.
Table 7. Unemployment rates 1984–2010
1984 1993 2007 2008 2009/10
Overall 11.8 10.4 5.3 5.8 7.7Degree 4.2 4.5 2.5 2.9 3.9O-level 9.4 9.8 6.3 6.5 9.8No qualifications 13.9 14.6 10.2 10.6 14.916-17 21.3 24.0 26.4 25.5 32.018-24 18.0 17.6 12.1 12.9 17.4Black 20.8 27.2 12.2 12.5 17.3Asian 19.3 20.2 9.6 9.8 11.5Black<25 yrs of age 31.5 44.9 33.7 33.4 38.6
Source: Labour Force Survey.

BELL AND BLANCHFLOWER UK UNEMPLOYMENT IN THE GREAT RECESSION R9
5) Being unemployed can also reduce the life expectancyof workers (Brenner and Mooney, 1983; Moser et al.,1987, 1990).
6) Unemployment increases the probability of poorphysical health outcomes such as heart attacks in laterlife (Beale and Nethercott, 1987; Iverson and Sabroe1988; Mattiasson et al., 1990).
7) The long-term unemployed are at a particulardisadvantage trying to find work (Machin andManning, 1999). The effects of unemployment appearto depend a lot on how long the person has beenunemployed for. People’s morale sinks as the durationof unemployment rises. Long-term unemployment isespecially harmful. “The long-term unemployed havelargely given up hope” (Layard, 1986, p.96).
8) Unemployment while young, especially of longduration, causes permanent scars rather thantemporary blemishes (Ellwood, 1982).
9) As unemployment rates increase, crime rates tend torise, especially property crime. Thornberry andChristensen (1984), for example, find evidence that acycle develops whereby involvement in crime reducessubsequent employment prospects which then raises thelikelihood of participating in crime. Fougere et al. (2006)find that increases in youth unemployment causeincreases in burglaries, thefts and drug offences. Hansenand Machin (2002) find a statistically significant negativerelationship between the number of offences reported bythe police over a two-year period for property and vehiclecrime and the proportion of workers paid beneath theminimum before its introduction. Hence, there are morecrime reductions in areas that, initially, had more lowwage workers.
Falk and Zweimuller (2005) find a significant positiverelation between unemployment and right-wing criminalactivities. Carmichael and Ward (2001) found in GreatBritain that youth unemployment and adultunemployment are both significantly and positivelyrelated to burglary, theft, fraud and forgery and totalcrime rates. For each of these offence categories therelationship between youth unemployment and thespecific crime was found to be somewhat stronger.Carmichael and Ward (2000) found that there is asystematic positive relationship between burglary ratesand male unemployment regardless of age.
Unemployed people, it turns out, are more likely than
other people to be the victims of crime. Unemployedpeople are more than twice as likely to be the victims ofviolent crime as employed people; they are also more atrisk of burglary, theft from the person and at greater riskof vandalism and vehicle theft.
10)Increases in the unemployment rate lower thehappiness of everyone, not just the unemployed. Thefear of becoming unemployed in the future lowers aperson’s subjective wellbeing (Di Tella et al., 2001,2003; Blanchflower, 2007; Knabe and Rätzel, 2008).
We deal in more detail with a number of these issuesbelow. In particular we look at the health and well-beingof the unemployed and how increases in the aggregateunemployment rate lower national well-being. First, were-examine the youth labour market.
6. More on the youth labour marketThe majority of measured youth unemployment in theUK primarily relates to 18–24 year olds (the young)rather than to 16–17 year olds (the very young). Forexample, in March–May 2010 there were 216,000unemployed 16 and 17 year olds compared with 707,00018–24 year olds. There were 416,000 claimants in June2010 who were 18–24 but none who were 16–17 as theyare not eligible to claim unemployment benefits. Therepresentation of youngsters under the age of twenty fiveamong the unemployed is much greater than theirrepresentation in the overall population.3
The unemployed ages 18–24 have occupied a rising shareof overall unemployment since the turn of the millennium.As can be seen from table 8, between 1993 and 2004 wesaw declining rates of unemployment overall, and for theyoung, but since then their unemployment rate has beenrising. Moreover, their share of unemployment has risensteadily from 21.7 per cent in 1999 to 30.8 per cent in 2009but then fell back slightly in 2010.
A particular concern is also that youth unemploymentrates are high for racial minorities. As we noted above,black unemployment rates ages 18–24 were 26.3 percent and for Asians were 21.3 per cent. The rate for thosewithout qualifications in the 2008 LFS was also high at28.9 per cent and 47.4 per cent for young blacks, 30.0per cent for young whites and 38.3 per cent for Asiansrespectively, without qualifications. We have specialconcerns regarding the employment prospects of theseyoung people without qualifications – the disadvantagedyoung – going forward.

R10 NATIONAL INSTITUTE ECONOMIC REVIEW No. 214 OCTOBER 2010
Part of the explanation for the rise in youthunemployment in the UK has been the recent rise in thesize of the youth cohort. This is illustrated in table 9.
From 1980 to 2000 the absolute and relative size of theyouth cohort shrank. However, since 2000 the size of theyouth cohort – the children of the baby boomers – hasgrown steadily, from 6.4 million (10.8 per cent of thepopulation) in 2000 to 7.4 million (12.1 per cent) in2007. The growth of the 16–24 cohort has only recentlybeen faster than the overall growth in the population.The number of 16–24 year olds in 2007 is still aroundseven hundred thousand less than the number in 1981(8.1 million). However, the growth of the age 16–24cohort is a temporary phenomenon. It will start todecline in absolute and relative size from 2009 onwardsas the larger older cohorts drop out and the youngersmaller ones are added. For example, in 2009 there areapproximately 825,000 24 year olds (age 21 in 2006)who will drop out and will be replaced by 749,000 15year olds (aged 12 in 2006) so the cohort will shrink byaround 75,000. Analogously, it will drop by a similarnumber the next year.
Of particular concern is the high proportion of youngpeople in the UK who are either not in educationemployment or training (NEET) or not in education andtraining (NET). In 2009 Q4 there were 895,000 of those
aged 16–24 years classified as NEET (http://www.dcsf.gov.uk/rsgateway/DB/STR/d000913/NEETQBQ42009final.pdf). Low-skilled youths whobecome NEET find it more difficult to re-engage inemployment and learning than 16–24 year olds onaverage and there is evidence that they may becometrapped in NEET. Godfrey et al. (2002) estimated thecosts of being NEET for the Department for Educationand Skills. They considered social costs as well as publicfinance costs over the current, medium and long term.These included estimates of the costs of educationalunderachievement, unemployment, inactivity, crime andhealth. The authors were not able to make estimates ofthe costs of the lowering of the skills base and hence theirfindings may underestimate the full costs. Their majorfinding was that the 157,000 NEETs aged 16–18 presentin the UK population in 1999 would accrue additionallifetime costs of around £7bn (2001 prices) in resourceterms and £8.1bn in additional public spending. The percapita equivalents are £45,000 in resource costs and£52,000 in public finance costs.
It is also notable that the proportion of the young who arein full-time education has increased over time. This hasincreased from 26 per cent in 1993 to 38 per cent in 2007. Itis apparent though that the proportion is still well belowthat of many other countries. It is also clear that workingwhile in school is becoming a more important part ofschool-to-work transition than the traditional model ofschool, then work. Data available from the OECD suggestthat the proportion of the young who are in school isconsiderably higher in, for example, Belgium (60 per cent);Finland (56 per cent); France (61 per cent), Italy (57 percent); Luxembourg (69 per cent) and Sweden (57 per cent).
Table 9. Rise in size of youth cohort
Total UK No. of 16–24 16–24 as %population year olds of total
(‘000s) (‘000s)
1981 56,357 8,079 14.31986 56,684 8,332 14.71991 57,439 7,491 13.01996 58,164 6,495 11.22000 58,886 6,383 10.82001 59,113 6,504 11.02002 59,323 6,632 11.22003 59,557 6,785 11.42004 59,846 6,960 11.62005 60,238 7,099 11.82006 60,587 7,221 11.92007 60,975 7,368 12.1
Source: Population Trends, 134, Winter 2008, Table 1.4.
Table 8. Youth unemployment and its share of overallunemployment 1993–2010
Unemploy- 18–24 unemploy- 18–24 asment rate ment rate % overall
1993 10.4 17.5 25.01994 9.5 16.3 23.91995 8.6 15.0 23.11996 8.1 14.3 22.71997 6.9 12.9 22.31998 6.3 12.0 22.81999 6.0 11.2 21.72000 5.4 10.6 22.42001 5.1 10.4 23.92002 5.2 10.5 23.82003 5.1 10.6 24.82004 4.8 10.4 26.22005 4.9 11.0 27.82006 5.4 12.2 27.72007 5.3 12.3 28.32008 March–May 5.2 11.8 30.72009 March–May 7.6 17.2 30.82010 March–May 7.8 17.1 28.7
Source: Office of National Statistics, Economic and Labour Market Review,July 2010.

BELL AND BLANCHFLOWER UK UNEMPLOYMENT IN THE GREAT RECESSION R11
One response to rising unemployment on the part of youthhas been to return to full-time education (Blanchflower andFreeman, 2000; Rice, 1999). Indeed, there has been adramatic increase in the number of applications touniversity in the UK since the onset of recession. UCAS datasuggest the number of applications have increased by70,000 (11.6 per cent) in 2010 on the previous year, with anincrease of 16 per cent from those aged 21–24.
The OECD (2008b) recently also noted that, even beforethe slowing of the UK labour market in the spring of2008, a variety of indicators of youth performancebetween 2005 and 2007 do paint a more mixed picture.On the one hand, they noted that the youth employmentrate is 12 percentage points higher than in the OECD onaverage and long-term unemployment has decreased byover 7 percentage points over the past decade. Theyoung in the UK are less likely to be in temporary workbut more likely to be part time than in the OECD as awhole. Dropout rates continue to be below the OECDaverage. Low-paid employment is still common amongyouth but its persistence has halved since the early1990s. On the other hand, the OECD report a number ofproblems related to youth labour market performance.
There is a considerable body of evidence suggesting thatthe young, the least educated and especially minoritiesare hardest hit in a recession (Blanchflower andFreeman, 2000; Freeman and Wise, 1982). Youthunemployment rates continue to be more sensitive tobusiness-cycle conditions than the adult unemploymentrate, as many studies have shown (OECD, 2008a).Young unskilled men from minority groups are thusparticularly hard hit. This is true around the world.
Clark and Summers (1982), in their classic study of thedynamics of youth joblessness, argue that the problem ofteenage unemployment arises from a shortage of jobs.“Aggregate demand has a potent impact on the jobprospects and market experience of teenagers” (1982, p.230). Freeman and Wise (1982) found in their study ofyouth joblessness in the 1970s that it was concentrated,by and large, among a small group who lacked work forextended periods of time. Over half of the male teenageunemployment they examined was among those whowere out of work for over six months, a groupconstituting less than 10 per cent of the youth labor forceand only 7 per cent of the youth population. The youthswho make up the relatively small group that waschronically without work, Freeman and Wise reportedhad distinct characteristics. They weredisproportionately black; disproportionately high school
dropouts, and disproportionately residents of poor areas.
Blanchflower and Freeman (2000) identified one basicpattern in the job market for young workers: thedisproportionately large response of youth employmentor unemployment to changes in overall unemployment.They argued that the sensitivity of youth employmentand unemployment to the overall rate of unemploymentdominate sizable demographic and structural changesfavourable to youth in determining how youths fare inthe job market. This was also confirmed in Blanchflowerand Freeman (1996) and Makeham (1980). RecentlyOECD (2008a) confirmed this conclusion; “Youthunemployment rates are more sensitive to business-cycleconditions than the adult unemployment rate and thishigh-sensitivity tends to decline progressively with age”.
There is also evidence that young people do especiallywell in booms. Freeman and Rodgers (1999) analysedthe 1990s boom in the United States and found that itsubstantially improved the position of non-collegeeducated young men, especially young AfricanAmericans who are the most disadvantaged and troubledgroup in the US. Young men in tight labour marketsexperienced a substantial boost in both employment andearnings. Adult men had no gains and their earningsbarely changed even in areas where unemployment rateswere below 4 per cent. Youths did particularly well inareas that started the boom at lower jobless ratessuggesting they would “benefit especially fromconsistent full employment” (Freeman and Rodgers,1999, p.2).
As unemployment amongst the young goes down and theattractiveness of work increases, because there are morejobs and better paying jobs out there, it becomes avirtuous cycle. Freeman and Rodgers found evidencethat once that occurred in the US the crime rate dropped.Increase aggregate demand and youths, especiallydisadvantaged youths, seem to do best.
There has been considerable interest in the possibilitythat youths have priced themselves out of jobs. Wells(1983) examined the relative pay and employment ofyoung people for the period 1952–79. During the earlierperiod the pay of boys as a percentage of that of menincreased from 42.0 in 1952 to 46.9 in 1969 and for girlsto men it fell from 34.0 to 32.4. However, during theperiod 1969–81 the boys to men ratio rose from 46.9 to56.2 while the girls to men ratio increased from 32.5 to40.4. Econometric analysis confirmed the finding andfound that the pay and employment of young people

R12 NATIONAL INSTITUTE ECONOMIC REVIEW No. 214 OCTOBER 2010
under the age of 18 for the period 1969–81 “appears tohave been reduced by increases in their relative earningsrelative to the average earnings of adults....No sucheffect could be found for the period 1952–1969” (p.1).
Subsequently the relative earnings of youths havedeclined steadily. OECD (1986) found that from the1970s through the early 1980s the earnings of youths fellrelative to the earnings of adults in several countries.The finding that youths were overpriced relative toadults has not been replicated in subsequent periods, asyouth relative wages have fallen steadily. Blanchflowerand Freeman (2000) examined the relative earnings ofyouths aged 16–19 and 20–24 to those of adults ineleven OECD countries (Australia, Canada, Denmark,France, Germany, Italy, Japan, Norway, Sweden, theUnited Kingdom and the United States) and found thatthere were declines in the relative earnings of the youngthroughout the 1990s in each of these countries exceptSweden, despite the fact that the size of the youth cohortwas shrinking. O’Higgins (1997) also concluded thatthere was no close relationship between the relativewages of youths and their unemployment rates. “Indeed,the impression is that, more often than not,unemployment and relative wage rates appear to bemoving in opposite directions to each other”.
The finding that the relative pay of the young has continuedto decline over the past decade or so is confirmed in table10 using data from Annual Survey of Hours and Earnings
(ASHE) – previously the New Earnings Survey (NES).Gross hourly earnings of 18–21 year olds are compared tooverall earnings and adults age 40–49 for the period 1997–2008. It is clear that the relative earnings of the young havefallen steadily since 1997 when the youth share of totalunemployment started to rise.
OECD (2008a) presented evidence on youth (20–24)earnings relative to adult earnings across countries. Theevidence is presented below and suggests that a) thisratio in the UK has fallen over time and b) now is belowthe OECD average but was above it in 1996.
Such evidence there is that the high relative wages of theyoung are responsible for pricing them out of jobs comesonly from the 1970s. Interestingly, that is the period ofmost rapid increase in union activity. Union membershippeaked in the 1970s with union density – the proportionof workers who are members of trade unions – at a littleover 50 per cent (Lindsay, 2003). Since that time unionmembership numbers and density rates have fallen. In2007 union density in Great Britain had fallen to 25 percent. In the same year the union density rate for privatesector employees fell to 15.9 per cent. Unions generallyoperate rates for the job, which would have the effect ofraising the relative wages of the young, and hencemaking them relatively less attractive, and thenlowering their employment. Union membership ratesamong the young in the UK are especially low.Blanchflower (2007) shows, using data from the LabourForce Survey, the union density rate for 16–19 year oldsin 2004 was 4.3 per cent. In 2007 the union density ratesfor 16–24 year olds was 9.8 per cent (Mercer andNotley, 2008, Table 25). It does not appear that youthsare pricing themselves out of work currently, unless their
Table 10. Gross hourly earnings of 18–21 years oldscompared with overall earnings and adults age 40–49,1997–2008
18–21/total 18–21/40–49 years(per cent) (per cent)
2009 51.3 45.52008 51.8 45.82007 52.5 46.62006 51.3 45.32005 51.1 45.02004 52.0 46.22003 52.6 46.22002 52.8 47.62001 53.7 48.42000 53.7 47.81999 55.6 49.61998 54.6 48.51997 54.9 48.6
Source: ASHE.http://www.statistics.gov.uk/StatBase/Product.asp?vlnk=13101&Pos=1&ColRank=1&Rank=208
Table 11. Youth (20–24) earnings relative to adultearnings in the OECD
2006 1996
Australia 0.73 0.74Canada 0.64 0.62Denmark 0.65 0.72Finland 0.68 0.70Germany 0.61 0.62Ireland 0.67 0.61Japan 0.60 0.62New Zealand 0.75 0.75Sweden 0.68 0.73UK 0.60 0.68USA 0.57 0.58OECD 0.64 0.67
Source: OECD.

BELL AND BLANCHFLOWER UK UNEMPLOYMENT IN THE GREAT RECESSION R13
relative productivity is falling especially sharply, but wehave no evidence to suggest that this is the case.
A further possibility is that the introduction of theNational Minimum Wage, which was introduced in1997, might have reduced employment of the young.There is little or no evidence to sustain that claim either(Metcalf, 2008; Dickens and Draca, 2005; Dickens andManning, 2003; Stewart, 2002a, b, 2004). There is alittle evidence to suggest that the influx of workers, whowere generally working in less skilled jobs, from the tenAccession countries did have some negative impact inthe period since 2004 on the employment of the leastskilled young people (Blanchflower and Shadforth,2009; Nickell and Saleheen, 2008). But these effects areusually insignificant or, when significant, quite small.
In an important early contribution Ellwood (1982)examined the persistence and long-term impacts of earlylabour force experiences. The paper reports a rise inemployment rates for a cohort of young men as they age,but points out that those persons with poor employmentrecords early have comparatively poor records later.The paper found that the effects of a period without workdo not end with that spell. A teenager who spends timeout of work in one year will probably spend less timeworking in the next than he would have had he workedthe entire year. Furthermore, the lost work experienceEllwood concluded was reflected in considerably lowerwages. The reduced employment effects Ellwoodexamined appeared to die off very quickly. Whatappeared to persist were effects of lost work experienceon wages.
More recently Mroz and Savage (2006) reached asimilar conclusion using data from the NLSY for the USand also found evidence of long-lived blemishes fromunemployment. A six month spell of unemployment atage 22 would result in an 8 per cent lower wage at 23and even at ages 30 and 31 wages were 2–3 per centlower than they otherwise would have been. Fairlie andKletzer (1999), also using data for the US, estimate thatfor young unemployed workers the costs of job loss interms of annual earnings are 8.4 per cent and 13.0 percent, for boys and girls, respectively.
Gregg and Tominey (2005) found, using data from theNCDS for the UK, that there was a significant wagepenalty of youth unemployment even after controlling foreducation, region and a wealth of family and personalcharacteristics. Their results suggested a scar from youthunemployment of 13–21 per cent age 41 although this
penalty was lower at 9–11 per cent if individuals avoidrepeat exposure. Gregg (2001) also used NCDS data toshow that unemployment experience up to the age of 23drives unemployment in subsequent years.
Arulampalam (2001) found that joblessness leavespermanent scars on people and reduces both theprobability of future employment and the level of futureearnings and increases the risk of future unemployment.She found that a spell of unemployment carries a wagepenalty of 6 per cent upon re-entry in Britain, with thepenalty rising to 14 per cent after three years.Arulampalam et al. (2000) also found evidence ofunemployment persistence, especially for young men.
Narendranathan and Elias (1993) also find evidence ofstate dependence and report that “the odds of becomingunemployed are 2.3 times higher for youths who wereunemployed last year than for youths who were notunemployed” (p.183). Arulampalam et al. (2001) reportthat the best predictor of an individual’s future risk ofunemployment is his past history of unemployment.They find that unemployment has a scarring effect forboth future unemployment and future earnings. Inaddition Burgess et al. (2003) find that unemploymentwhile young raises the probability of subsequentunemployment, but the size of any effect varies by skilllevel.
Bell and Blanchflower (2010) show, using data from theNational Child Development Study to examine fouroutcomes in 2004/5 when the respondents were aged 46–47 years, a) life satisfaction b) self-reported health statusand two for workers only c) job satisfaction and d) (logof) gross weekly wages in 2004/5 in NCDS7. The issue iswhether a period of unemployment when young haslasting effects; it turns out that it does. Spells ofunemployment before the respondent was 23 lowered lifesatisfaction, heath status, job satisfaction and wagesover twenty years later.
There is new evidence that even youngsters who chooseto go to college or university are hurt if they enter thelabour market during a recession. Lisa Kahn (2010) hasrecently shown that the labour market consequences ofgraduating from college in a bad economy have large,negative and persistent effects on wages. Lifetimeearnings are substantially lower than they would havebeen if the graduate had entered the labour market ingood times. Furthermore, cohorts who graduate in worsenational economies tend to end up in lower-leveloccupations.

R14 NATIONAL INSTITUTE ECONOMIC REVIEW No. 214 OCTOBER 2010
Work by Giuliano and Spilimbergo (2009) suggests thatthe period of early adulthood (between 18 and 25) seemsto be the age range during which people are moresensitive to macroeconomic conditions. They found thatbeing exposed to a recession before age 17 or after age25 has no impact on beliefs about life chances. However,youngsters growing up during recessions tend to believethat success in life depends more on luck than on effort;they support more government redistribution, but haveless confidence in public institutions. Recessions seem toaffect adversely youngsters’ beliefs.
There is also recent evidence on the consequences of risingunemployment on young people from the UK. The Prince’sTrust, which was established by the Prince of Wales,conducted a survey of two thousand young people inDecember 2009. In comparison with other young people,the young unemployed were found to be significantly morelikely to feel ashamed, rejected, lost, anxious, insecure,down and depressed, isolated and unloved. They were alsosignificantly less happy with their health, friendships andfamily life than those in work or studying, much lessconfident of the future and more likely to say that they hadturned to drugs, that they had nothing to look forward toand that their life had no direction. And many reportedhaving suicidal thoughts (Blanchflower, 2010).
7. Empirical estimates of the probability ofbeing unemployed
We now turn to examine recent econometric evidence onunemployment in the UK. For purposes of comparison itmakes sense to start out with the characteristics of theunemployed in previous recessions. Column 1 of table12 is for 1984 and column 2 for 1993. In both cases themarginal rather than average effects from an estimatedprobit model are reported. The marginal effect is thechange in the probability for an infinitesimal change ineach independent, continuous variable and, by default,reports the discrete change in the probability for dummyvariables. We are modelling the probability that amember of the labour force (unemployed or working)will be unemployed conditional on their characteristics.The probability of being unemployed was especiallyhigh, in both 1984 and 1993 among the young, men,blacks and Asians, the foreign born, the least educatedand those living in Tyne and Wear and Merseyside.
Table 13 repeats the exercise presented in table 12, butnow with the most recent data available. As in the twoprevious recessions in the 1980s and 1990s, there are broadsimilarities. Unemployment is high among the young, men,
Table 12. Probability of being unemployed, marginaleffects, 1984 and 1993 (ages 16–64)
1984 1993
Age 16–17 0.1552 (16.71) 0.1788 (35.60)Age 18–24 0.1331 (23.49) 0.1196 (43.51)Age 25–29 0.0766 (13.44) 0.0505 (20.01)Age 30–34 0.0425 (7.90) 0.0308 (12.65)Age 35–39 0.0086 (1.76) 0.0183 (7.60)Age 45–49 –0.0164 (3.36) –0.0075 (3.32)Age 50–54 –0.0204 (4.12) 0.0034 (1.36)Age 55–59 –0.0063 (1.21) 0.0143 (5.21)Age 60–64 –0.0027 (0.39) 0.0029 (0.91)Male 0.0115 (5.05) 0.0437 (38.59)Black 0.0789 (6.50) 0.1329 (24.64)Asian 0.0612 (6.12) 0.0556 (13.13)Chinese –0.0348 (1.55) –0.0158 (1.53)Other race 0.0919 (5.97) 0.0753 (11.19)UK born –0.0248 (4.37) –0.0127 (5.12)Higher degree –0.0761 (9.30) –0.0735 (25.80)Degree –0.0701 (16.34) –0.0686 (39.83)Other degree –0.0664 (9.04) –0.0666 (22.65)HND/HNC –0.0733 (12.29) –0.0695 (31.66)Teacher secondary –0.0535 (5.16) –0.0603 (8.24)Teacher primary –0.0539 (5.18) –0.0596 (9.62)Nursing –0.0612 (9.62) –0.0743 (24.18)OND/ONC –0.0656 (11.56) –0.0641 (25.41)City & Guilds –0.0599 (17.91) –0.0540 (19.56)A–level –0.0590 (14.80) –0.0564 (29.12)O–level –0.0540 (19.59) –0.0519 (35.61)CSE –0.0319 (8.06) –0.0256 (11.56)Other qualifications –0.0173 (3.52) –0.0326 (16.63)Rest of North –0.0164 (2.11) –0.0208 (5.11)South Yorkshire –0.0153 (1.82) –0.0061 (1.32)West Yorkshire –0.0404 (5.77) –0.0341 (8.99)Rest Yorks & Humber –0.0396 (5.45) –0.0338 (8.33)East Midlands –0.0471 (7.60) –0.0400 (11.79)East Anglia –0.0570 (8.75) –0.0375 (10.03)London –0.0502 (8.34) –0.0113 (3.05)Rest South East –0.0629 (10.83) –0.0377 (11.26)South West –0.0491 (7.98) –0.0357 (10.41)West Midlands –0.0203 (2.78) –0.0098 (2.43)Rest West Midlands –0.0322 (4.61) –0.0369 (10.25)Greater Manchester –0.0225 (3.08) –0.0228 (5.85)Merseyside 0.0185 (2.02) 0.0079 (1.62)Rest North West –0.0344 (4.88) –0.0371 (10.07)Wales –0.0198 (2.72) –0.0278 (7.37)Scotland –0.0135 (1.97) –0.0232 (6.41)N 66,778 284,047Pseudo R2 0.0790 0.0704
Source: Labour Force Surveys 1984 & 1993.Notes: Excluded categories Northern region/Tyne & Wear; white; 40–44 & no qualifications. In 1993 equations include a total of 31qualifications dummies. T–statistics in parentheses. Estimation usingDprobits.

BELL AND BLANCHFLOWER UK UNEMPLOYMENT IN THE GREAT RECESSION R15
Table 13. Probability of being unemployed, marginal effects, 2006–2010 (March)
2006 2007 2008 2009/2010
Age 16–17 0.1994 (45.78) 0.2215 (49.32) 0.2087 (45.41) 0.2561 (51.32)Age 18–24 0.0839 (37.83) 0.0902 (39.36) 0.0948 (39.93) 0.1243 (48.83)Age 25–29 0.0205 (10.80) 0.0213 (11.00) 0.0255 (12.52) 0.0422 (18.58)Age 30–34 0.0090 (5.21) 0.0134 (7.39) 0.0120 (6.29) 0.0229 (10.76)Age 35–39 0.0012 (0.80) 0.0041 (2.55) 0.0042 (2.47) 0.0063 (3.26)Age 45–49 –0.0057 (3.64) –0.0044 (2.78) –0.0060 (3.65) –0.0049 (2.68)Age 50–54 –0.0087 (5.43) –0.0077 (4.74) –0.0067 (3.94) –0.0096 (5.13)Age 55–59 –0.0109 (6.71) –0.0034 (2.05) –0.0061 (3.42) –0.0095 (4.85)Age 60–64 –0.0222 (11.81) –0.0194 (10.56) –0.0185 (9.83) –0.0200 (9.43)Male 0.0067 (8.58) 0.0042 (5.56) 0.0074 (9.12) 0.0187 (20.46)Mixed 0.0352 (7.24) 0.0274 (5.80) 0.0341 (6.82) 0.0397 (7.45)Asian 0.0327 (13.55) 0.0305 (13.00) 0.0311 (12.82) 0.0322 (12.61)Black 0.0609 (17.76) 0.0578 (17.40) 0.0668 (18.29) 0.0922 (23.52)Chinese 0.0277 (3.92) 0.0269 (4.07) 0.0201 (3.03) 0.0000 (0.00)Other races 0.0463 (11.33) 0.0427 (10.94) 0.0458 (11.00) 0.0390 (8.67)UK born –0.0013 (0.90) –0.0011 (0.79) 0.0043 (2.92) 0.0058 (3.60)DDA disabled & work 0.0726 (35.62) 0.0748 (36.57) 0.0753 (35.32) 0.0705 (32.10)DDA disabled 0.0002 (0.12) 0.0046 (2.38) 0.0033 (1.68) 0.0013 (0.64)Work limiting disabled 0.0472 (18.05) 0.0536 (19.72) 0.0495 (17.73) 0.0532 (18.17)Higher degree –0.0326 (24.75) –0.0311 (24.56) –0.0354 (26.89) –0.0540 (37.23)NVQ level 5 –0.0271 (4.20) –0.0318 (5.24) –0.0326 (5.52) –0.0489 (7.50)First degree –0.0331 (29.95) –0.0349 (32.94) –0.0375 (33.25) –0.0573 (44.64)Other degree –0.0329 (12.56) –0.0301 (11.77) –0.0347 (11.72) –0.0457 (14.42)NVQ level 4 –0.0294 (8.90) –0.0312 (10.12) –0.0310 (9.90) –0.0466 (13.92)Diploma in HE –0.0271 (11.54) –0.0274 (12.64) –0.0292 (12.59) –0.0433 (17.55)HNC, HND, BTEC –0.0302 (19.78) –0.0289 (19.34) –0.0341 (21.64) –0.0437 (24.48)Teaching, FE –0.0340 (5.26) –0.0241 (4.23) –0.0310 (5.33) –0.0390 (5.74)Teaching, secondary –0.0243 (3.38) –0.0265 (3.56) –0.0330 (4.24) –0.0517 (4.96)Teaching, primary –0.0329 (5.05) –0.0300 (4.78) –0.0246 (3.82) –0.0417 (5.10)Teaching foundation stage –0.0302 (2.14) –0.0113 (0.75) –0.0164 (1.00) –0.0446 (2.66)Teaching, level not stated –0.0325 (3.37) –0.0279 (2.86) –0.0264 (2.63) –0.0487 (4.45)Nursing –0.0338 (14.86) –0.0321 (14.50) –0.0355 (14.89) –0.0524 (18.73)Other HE <degree –0.0219 (5.39) –0.0245 (6.99) –0.0256 (6.80) –0.0341 (8.54)NVQ level 3 –0.0287 (18.74) –0.0282 (19.66) –0.0324 (22.23) –0.0460 (28.30)GNVQ/GSVQ advanced –0.0289 (9.26) –0.0298 (10.16) –0.0304 (9.21) –0.0408 (9.55)A level or equivalent –0.0264 (21.17) –0.0273 (23.06) –0.0307 (24.47) –0.0442 (30.20)OND, ONC, BTEC national –0.0260 (12.80) –0.0244 (12.24) –0.0267 (13.07) –0.0348 (14.72)City & Guilds advanced craft –0.0267 (14.00) –0.0259 (13.83) –0.0322 (11.73) –0.0392 (17.88)SCE higher –0.0310 (12.60) –0.0278 (11.18) –0.0146 (1.44) –0.0437 (14.12)A, S level or equivalent –0.0312 (15.18) –0.0298 (14.88) –0.0308 (13.94) –0.0431 (15.93)Trade apprenticeship –0.0264 (18.76) –0.0257 (17.92) –0.0282 (18.41) –0.0357 (20.04)NVQ level 2 or equivalent –0.0169 (10.38) –0.0193 (12.71) –0.0215 (13.58) –0.0301 (16.94)GNVQ/GSVQ intermediate –0.0223 (6.68) –0.0148 (4.17) –0.0219 (5.27) –0.0355 (7.01)City & guilds craft/part 2 –0.0134 (4.02) –0.0172 (5.29) 0.0184 (5.43) –0.0283 (7.69)BTEC, SCOTVEC first –0.0103 (1.88) –0.0114 (2.19) –0.0236 (5.10) –0.0249 (4.61)O level, GCSE grade A–C –0.0253 (23.24) –0.0236 (22.16) –0.0264 (23.02) –0.0373 (27.63)NVQ level 1 or equivalent 0.0125 (2.83) 0.0078 (1.85) 0.0046 (1.04) 0.0068 (1.37)GNVQ/GSVQ foundation –0.0101 (0.93) 0.0039 (0.32) 0.0054 (0.38) –0.0241 (1.47)CSE below grade 1 –0.0117 (6.39) –0.0110 (6.09) –0.0120 (6.25) –0.0196 (8.87)RSA other –0.0133 (2.87) –0.0255 (5.41) –0.0091 (1.71) –0.0230 (3.55)City & Guilds foundation 0.0016 (0.23) 0.0064 (0.88) –0.0011 (0.15) 0.0067 (0.81)Key skills qualification 0.0096 (0.91) 0.0076 (0.71) 0.0455 (2.86) 0.0325 (4.39)Basic skills qualification 0.0197 (2.41) 0.0325 (4.62) 0.0383 (5.37) –0.0321 (19.94)Other qualification –0.0189 (13.92) –0.0198 (15.26) –0.0218 (15.71) –0.0370 (11.16)Rest of North –0.0075 (2.60) –0.0042 (1.37) –0.0083 (2.77) –0.0185 (5.69)South Yorkshire –0.0030 (0.92) –0.0030 (0.89) –0.0001 (0.04) –0.0097 (2.61)West Yorkshire –0.0121 (4.52) –0.0072 (2.46) –0.0116 (4.13) –0.0132 (4.10)Rest Yorks & Humber –0.0122 (4.22) –0.0072 (2.29) –0.0204 (7.18) –0.0157 (4.62)East Midlands –0.0124 (5.08) –0.0084 (3.13) –0.0139 (5.44) –0.0224 (8.07)

R16 NATIONAL INSTITUTE ECONOMIC REVIEW No. 214 OCTOBER 2010
with the lowest ranks 17th, is shown in table 14 usingdata from table 12. Here we re-estimated the data for2009/2010 from table 13 by merging Inner and OuterLondon to form ‘London’ and Strathclyde and the Restof Scotland to form ‘Scotland’.
Regions with the lowest rates in all three years are theRest of the South East, East Anglia and the South West.Those with the highest are Merseyside and the Northernregion. The most notable difference is that the 2008recession is increasing unemployment in London, withits dependence on the financial sector, as it did in 1993.The biggest difference is that unemployment in Scotlandappears to be much less cyclically sensitive than in thepast.
8. The impact of unemployment on healthand wellbeing
In this section we review the evidence of the impact ofunemployment on individual health and well-being. Wealso present econometric evidence of our own on theconsequences of unemployment on health and well-beingin the UK.
It is notable that the unemployed are especially likely toreport having a mental illness, although it should be saidthat the direction of causation is unclear. For example,
East Anglia –0.0128 (4.79) –0.0105 (3.67) –0.0177 (6.60) –0.0278 (9.45)Inner London 0.0045 (1.43) 0.0099 (2.85) –0.0017 (0.56) –0.0052 (1.51)Outer London –0.0047 (1.76) –0.0060 (2.17) –0.0096 (3.52) –0.0147 (4.86)Rest South East –0.0143 (6.14) –0.0095 (3.71) –0.0187 (7.75) –0.0270 (10.16)South West –0.0182 (7.86) –0.0135 (5.33) –0.0198 (8.23) –0.0240 (8.71)West Midlands –0.0031 (1.09) 0.0044 (1.36) 0.0003 (0.12) 0.0022 (0.66)Rest West Midlands –0.0166 (6.60) –0.0084 (2.92) –0.0177 (6.72) –0.0213 (7.17)Greater Manchester –0.0113 (4.16) –0.0026 (0.87) –0.0047 (1.60) –0.0101 (3.14)Merseyside –0.0030 (0.90) 0.0109 (2.76) 0.0126 (3.20) –0.0056 (1.45)Rest North West –0.0163 (6.24) –0.0081 (2.77) –0.0134 (4.78) –0.0209 (6.82)Wales –0.0107 (4.06) –0.0057 (1.96) –0.0098 (3.45) –0.0121 (3.77)Strathclyde –0.0020 (0.66) –0.0029 (0.92) –0.0097 (3.17) –0.0107 (3.17)Rest Scotland –0.0110 (4.09) –0.0080 (2.78) –0.0161 (5.78) –0.0214 (7.09)Northern Ireland –0.0157 (6.01) –0.0127 (4.47) –0.0194 (7.30) –0.0267 (8.87)2010 0.0107 (7.31)N 229,143 227,586 221,653 265,761Pseudo R2 0.1191 0.1279 0.1240 0.1119
Source: Labour Force Surveys.Notes: excluded categories January; no qualifications; white: Tyne & Wear. T–statistics in parentheses. Ages 16–64. Dummies also included forInternational baccalaureate; RSA Diploma & RSA Advanced Diploma, YT and YTP certificate, Scottish CSYS; SCOTVEC modules, BTEC,SCOTVEC First; Access qualifications, Don’t know and entry level qualifications but results not reported but mostly insignificant. Excludedcategories, Tyne & Wear; ages 40–44; no qualifications; white and January. Month dummies also included. T–statistics in parentheses. Estimationusing Dprobits.
Table 13. (Continued)
Table 14. Ranking of regional patterns
1984 1993 2009
East Anglia 16 15 17East Midlands 13 17 14Greater Manchester 8 7 5London 15 5 8Merseyside 1 1 2North/Tyne & Wear 2 2 3Rest North West 10 14 11Rest of North 5 6 10Rest South East 17 16 16Rest West Midlands 9 13 13Rest Yorks & Humber 11 10 9South West 14 12 15South Yorkshire 4 3 4Scotland 3 8 12Wales 6 9 6West Midlands 7 4 1West Yorkshire 12 11 7
Asians and blacks, the least educated. It is also high for thedisabled, and there is a specific effect raisingunemployment in 2010. On this occasion theunemployment rate is highest in the West Midlands.
It is notable that the regional pattern of coefficients in2009/2010 is similar to the prior recessions. Theranking, where the highest rate ranks first and the one

BELL AND BLANCHFLOWER UK UNEMPLOYMENT IN THE GREAT RECESSION R17
in the Labour Force Surveys in 2010 Q1, 2.7 per cent ofthe unemployed reported their most important healthproblem, if they had one, was depression or bad nervescompared with 1 per cent of the employed.
There is a growing body of literature that suggests thatthe unemployed are especially unhappy (Clark andOswald, 1994; Winkelmann and Winkelmann, 1998;Blanchflower and Oswald, 2004). The evidence fromaround the world is that unemployment has notincreased because the unemployed are lazy and havechosen not to work because benefits are too high. Thereserve army of the unemployed is a conscript armyrather than a volunteer army.
When unemployment rises, happiness of both workersand non-workers falls. Unemployment affects not onlythe mental well-being of those concerned, but also thatof their families, colleagues, neighbours and others whoare in direct or indirect contact with them. Jones andFletcher (1993), for example, provide evidence that theoccupational stress and distress from unemployment canbe transmitted between partners.
There is a body of literature that suggests individualwell-being is related also to aggregate macroeconomicvariables such as the unemployment rate, inflation, andthe interest rate (Di Tella et al. 2001; Blanchflower2007a). This literature suggests that a 1 percentage pointincrease in unemployment reduces overall happinesstwice as much as an equivalent 1 percentage pointincrease in inflation – the so-called misery index.Moreover, increases in aggregate unemployment seemindirectly to reduce the well-being of not just theunemployed but also that of the employed and those outof the labour force such as students, the retired and thoselooking after the home.
Di Tella et al. (2001) find that increases in the nationalunemployment rate have much larger effects on thehappiness of the unemployed than they do for theemployed, using the Eurobarometer life satisfaction datafor twelve EU countries from 1975–92. This result,however, contrasts with the findings of Clark (2003), usingBHPS panel data for the UK, and Clark et al. (2008) usingdata from the German Socio-Economic Panel. They arguethat the well-being of the unemployed is less affected byunemployment if they live in a region with a highunemployment rate, thus narrowing the well-being gapbetween the employed and unemployed in such regions.
Blanchflower (2007) estimated a misery index of 1.62,
which is the marginal rate of substitution betweeninflation and unemployment. Hence a 1 percentagepoint increase in unemployment lowers well-being by1.62 times the impact of a 1 percentage point increase ininflation. Empirically it seems that people care moreabout unemployment than they do about inflation.
Interestingly Luechinger et al. (2008) also used the GSSdata to show that the sensitivity of subjective well-beingto fluctuations in unemployment rates is much loweramong employees in the public sector than in the privatesector. They found a similar result using individualpanel data for Germany from the GSOEP 1984–2004and repeated cross-sectional data for thirteen Europeancountries from the Eurobarometers 1989–94. The fear ofunemployment is, as expected, greater for workers in theprivate sector than in the public sector. This, the authorsargue, suggests that “increased economic insecurityconstitutes an important welfare loss associated withhigh general unemployment” (p.1).
In the Labour Force Surveys, individuals are askedabout their health and which if any conditions impactedon them the most. One of these options was ‘depression,bad nerves, or anxiety’ which covers approximately 1per cent of respondents. In table 15 we examine theprobability an individual falls in this category, that is,we estimate unhappiness equations. In the first columnwe restrict ourselves only to the employed and examinemeasures of underemployment among workers which, astable 1 made clear, have risen sharply during thisrecession. We find that the underemployed, andespecially those who say they are part-time because theycould not find full-time work or that they would prefermore hours, have significantly higher probabilities ofbeing depressed, and the effects are large.
There is a U-shaped pattern in age confirming resultsfound by Blanchflower and Oswald (2008) for 2004Q2–2007Q1 also using the LFS data. Citizens from theStrathclyde area of Scotland also have very highprobabilities of being depressed, confirming earlierevidence in Bell and Blanchflower (2007).
Column 2 now adds the unemployed to the sample andshows that individuals who are unemployed or on agovernment scheme are also likely to be depressed.Column 3 then separates the unemployed into twogroups according to whether they have been unemployedfor less than twelve months or for longer. It is apparentthat both the short-term and long-term unemployed areespecially likely to report being depressed, but with

R18 NATIONAL INSTITUTE ECONOMIC REVIEW No. 214 OCTOBER 2010
Table 15. Probability of having ‘depression or bad nerves’ as main health problem, marginal effects
Employed Workforce Workforce
Part–time no full–time 0.0074 (6.29)Prefers more hours 0.0042 (5.81)Temporary – no permanent 0.0015 (0.96)Employee 0.0010 (0.26) 0.0010 (0.24) 0.0010 (0.24)Self–employed 0.0017 (0.40) 0.0019 (0.40) 0.0019 (0.41)Govt. program 0.0272 (2.97) 0.0287 (2.93) 0.0286 (2.92)Unemployed 0.0249 (3.20)Short term unemployed 0.0215 (2.86)Long–term unemployed 0.0372 (3.87)Male –0.0050 (11.70) –0.0056 (12.97) –0.0056 (13.04)Age 16–17 –0.0063 (4.61) –0.0077 (7.26) –0.0076 (7.00)Age 18–24 –0.0051 (7.37) –0.0059 (9.01) –0.0058 (8.84)Age 25–29 –0.0019 (2.56) –0.0025 (3.43) –0.0025 (3.36)Age 30–34 –0.0013 (1.85) –0.0017 (2.31) –0.0017 (2.27)Age 35–39 –0.0005 (0.77) –0.0003 (0.53) –0.0003 (0.51)Age 45–49 –0.0015 (2.31) –0.0017 (2.51) –0.0017 (2.53)Age 50–54 –0.0006 (0.86) –0.0010 (1.42) –0.0010 (1.45)Age 55–59 –0.0028 (3.93) –0.0038 (5.24) –0.0038 (5.23)Age 60–64 –0.0040 (4.81) –0.0048 (5.83) –0.0048 (5.79)Mixed race 0.0000 (0.04) –0.0015 (0.70) –0.0016 (0.71)Asian –0.0046 (4.28) –0.0055 (5.19) –0.0055 (5.22)Black –0.0050 (3.42) –0.0041 (3.03) –0.0042 (3.08)Chinese –0.0056 (1.79) –0.0016 (0.49) –0.0015 (0.46)Other race –0.0056 (2.93) –0.0028 (1.48) –0.0029 (1.51)UK born 0.0015 (1.97) 0.0024 (3.06) 0.0023 (3.02)Rest of North –0.0002 (0.13) –0.0000 (0.02) 0.0000 (0.00)South Yorkshire 0.0017 (0.90) 0.0009 (0.48) 0.0009 (0.51)West Yorkshire 0.0040 (2.18) 0.0038 (2.09) 0.0038 (2.12)Rest Yorks. & Humber –0.0018 (1.15) –0.0015 (0.93) –0.0014 (0.89)East Midlands –0.0024 (1.77) –0.0022 (1.58) –0.0021 (1.55)East Anglia –0.0006 (0.41) –0.0002 (0.16) –0.0002 (0.14)Inner London –0.0008 (0.48) –0.0008 (0.50) –0.0008 (0.52)Outer London –0.0029 (2.04) –0.0018 (1.21) –0.0017 (1.18)Rest South East –0.0022 (1.65) –0.0021 (1.56) –0.0020 (1.51)South West –0.0013 (0.95) –0.0003 (0.24) –0.0002 (0.18)West Midlands –0.0000 (0.03) 0.0013 (0.78) 0.0013 (0.77)Rest West Midlands –0.0013 (0.87) –0.0003 (0.23) –0.0002 (0.17)Greater Manchester –0.0020 (1.35) –0.0017 (1.12) –0.0017 (1.11)Merseyside –0.0014 (0.78) –0.0001 (0.09) –0.0001 (0.09)Rest North West –0.0027 (1.82) –0.0027 (1.83) –0.0026 (1.79)Wales –0.0002 (0.17) 0.0007 (0.45) 0.0007 (0.48)Strathclyde 0.0036 (1.94) 0.0037 (1.99) 0.0037 (2.01)Rest Scotland 0.0001 (0.06) 0.0000 (0.05) 0.0001 (0.08)Northern Ireland –0.0050 (3.63) –0.0046 (3.22) –0.0048 (3.35)Higher degree –0.0012 (1.35) –0.0029 (3.29) –0.0027 (3.07)NVQ level 5 –0.0008 (0.22) –0.0016 (0.40) –0.0014 (0.37)First/foundation degree –0.0019 (2.38) –0.0031 (4.13) –0.0030 (3.89)Other degree –0.0038 (2.05) –0.0044 (2.43) –0.0042 (2.33)NVQ level 4 –0.0033 (1.78) –0.0043 (2.37) –0.0042 (2.29)Diploma in higher educ. 0.0000 (0.04) –0.0007 (0.48) –0.0005 (0.39)HNC, HND, BTEC higher –0.0025 (2.28) –0.0035 (3.34) –0.0033 (3.16)Teaching, further 0.0035 (1.01) 0.0013 (0.39) 0.0015 (0.44)Teaching, secondary –0.0037 (0.75) –0.0047 (0.92) –0.0045 (0.88)Teaching, primary 0.0075 (1.84) 0.0084 (2.00) 0.0086 (2.04)Teaching, level not stated –0.0061 (1.16) –0.0073 (1.36) –0.0072 (1.35)Nursing etc 0.0007 (0.48) –0.0006 (0.41) –0.0004 (0.28)Other higher educ. <degree 0.0028 (1.17) 0.0002 (0.11) 0.0004 (0.21)NVQ level 3 –0.0020 (1.99) –0.0032 (3.34) –0.0031 (3.16)International bac’te 0.0029 (0.28) –0.0013 (0.15) –0.0010 (0.11)

BELL AND BLANCHFLOWER UK UNEMPLOYMENT IN THE GREAT RECESSION R19
an effect for the long-term unemployed nearly twicethe size as for the short-term. Unemployment is badfor an individual’s mental health especially if thatspell of unemployment is long. The worry then is thatlong spells of unemployment in particular will woundthe individual’s job and earnings prospects in thefuture.
Table 16 moves on to examine individual level datafrom 2009 and 2010 from two Eurobarometer surveys,which report on various aspects of an individual’s well-being. These surveys are taken in all EU countries. Ineach case we examine how the well-being of theunemployed compares with workers, the retired, those inschool, plus home workers. We also include aninteraction term between the UK and unemployment todetermine if the jobless in the UK are different, in termsof well-being, than in other countries. Controls includecountry dummies, gender, schooling and marital statusdummies.
Column 1 uses data from Eurobarometer #73.1, from
January–February 2010, to estimate an ordered logit tomodel responses to the question Q1 ‘During the lasttwelve months, would you say you had difficulties topay your bills at the end of the month...? ‘almostnever\never’, ‘from time to time’ or ‘most of the time?’.A positive coefficient then implies difficulty paying theirbills. It is apparent that the unemployed are struggling,along with the least educated. Problems rise with age,reaching a maximum in the early thirties and decliningthereafter. The country ranked highest in terms ofhaving difficulty making ends meet, is Bulgariafollowed by Greece, that has already been hit by avariety of austerity measures. Despite austeritymeasures having been undertaken in Ireland, to thispoint they do not seem to have impacted on well-being.Denmark ranks best with the UK ranked sixth. The UKinteraction term is insignificant.
Columns 2–5 of table 16 make use of data fromEurobarometer #72.1 from August–September 2009.Column 2 estimates an OLS regression where thedependent variable is a measure of happiness – Q2 ‘All
GNVQ/GSVQ advanced 0.0018 (0.57) 0.0016 (0.53) 0.0017 (0.57)A level or equivalent 0.0021 (1.93) 0.0003 (0.33) 0.0006 (0.58RSA advanced diploma –0.0058 (1.05) 0.0005 (0.09) 0.0008 (0.14)OND, ONC, BTEC 0.0024 (1.50) 0.0013 (0.88) 0.0015 (1.02)City & guilds advanced #1 –0.0032 (2.46) –0.0050 (4.05) –0.0049 (3.91)Scottish CSYS 0.0016 (0.16) –0.0000 (0.01) 0.0001 (0.02)SCE higher or equivalent 0.0005 (0.29) –0.0000 (0.04) 0.0001 (0.09)Access qualifications –0.0002 (0.04) –0.0040 (0.70) –0.0039 (0.67)A, S level or equivalent –0.0007 (0.26) –0.0018 (0.77) –0.0017 (0.69)Trade apprenticeship –0.0031 (2.86) –0.0045 (4.44) –0.0044 (4.27)NVQ level 2 or equivalent 0.0011 (1.03) 0.0005 (0.54) 0.0007 (0.70)GNVQ/GSVQ intermediate 0.0048 (1.19) 0.0031 (0.82) 0.0031 (0.82)RSA diploma 0.0046 (0.91) 0.0069 (1.37) 0.0073 (1.43)City & guilds craft/part 2 0.0020 (0.90) 0.0004 (0.21) 0.0005 (0.27)BTEC, SCOTVEC first –0.0060 (1.63) –0.0071 (2.18) –0.0070 (2.13)O level, GCSE grade A–C –0.0019 (2.43) –0.0033 (4.54) –0.0032 (4.31)NVQ level 1 or equivalent –0.0006 (0.25) 0.0028 (1.15) 0.0029 (1.17)CSE <1, GCSE<C 0.0014 (1.08) 0.0002 (0.17) 0.0003 (0.25)BTEC, SCOTVEC first 0.0744 (3.64) 0.0980 (4.83) 0.0969 (4.78)SCOTVEC modules 0.0403 (2.37) 0.0442 (2.65) 0.0441 (2.64)RSA other –0.0050 (1.77) –0.0047 (1.72) –0.0046 (1.68)City & guilds foundation 0.0003 (0.07) –0.0008 (0.21) –0.0008 (0.21)YT, YTP certificate 0.0307 (2.62) 0.0344 (3.23) 0.0347 (3.26)Basic skills qualification 0.0001 (0.04) –0.0033 (1.01) –0.0034 (1.02)Entry level qualification 0.0281 (2.25) 0.0113 (1.23) 0.0113 (1.23)Other qualification –0.0035 (3.69) –0.0046 (5.22) –0.0045 (5.09)Don’t know –0.0034 (1.59) –0.0048 (2.42) –0.0048 (2.38)Pseudo R2 0.0301 0.0408 0.0413N 210,120 226,993 226,962
Source: Labour Force Surveys, 2009–2010Q1 – ages 16–64. Notes: excluded categories – 40–44; unpaid family worker; white; Tyne & Wear; noqualifications. T-statistics in parentheses. Estimation using Dprobits.
Table 15. (Continued)

R20 NATIONAL INSTITUTE ECONOMIC REVIEW No. 214 OCTOBER 2010
Table 16. Attitudes of the unemployed in Europe, 2009 and 2010
Trouble paying bills Life satisfaction Family life Health Living standards
Unemployed 0.9639 (18.45) –1.3136 (26.86) –0.4693 (9.38) –0.3960 (7.89) –1.4398 (29.82)UK*unemployed –0.0908 (0.43) –0.0110 (0.06) –0.2974 (1.45) –0.8089 (3.92) 0.3031 (1.53)Retired 0.2181 (4.53) –0.3785 (8.93) –0.0959 (2.21) –1.0997 (25.23) –0.5587 (13.33)Home worker 0.3621 (6.83) –0.3159 (6.25) –0.1158 (2.25) –0.3705 (7.14) –0.3703 (7.43)Still studying –0.8290 (11.01) 0.8332 (12.09) 0.5647 (8.01) 0.4507 (6.37) 0.9294 (13.65)ALS 16–19 –0.4102 10.40) 0.2737 (7.54) 0.1935 (5.21) 0.3897 (10.45) 0.3817 (10.64)ALS 20+ –0.9638 (21.09) 0.7783 (19.35) 0.3676 (8.94) 0.6628 (16.03) 0.8688 (21.85)No FT education 0.3295 (1.84) –0.1562 (1.06) –0.1528 (0.98) 0.1856 (1.19) –0.2313 (1.53)Married –0.1852 (4.34) 0.4952 (12.97) 1.2086 (30.90) 0.3792 (9.68) 0.5390 (14.30)Living together 0.1536 (2.87) 0.2245 (4.50) 0.7438 (14.59) 0.2490 (4.87) 0.2113 (4.29)Divorced/separated 0.5742 (9.50) –0.2651 (4.67) –0.5094 (8.77) –0.1866 (3.21) –0.2829 (5.06)Widowed 0.3200 (5.01) –0.1186 (2.10) –0.2732 (4.70) –0.2583 (4.44) 0.0134 (0.24)Age 0.0332 (6.31) –0.0814 (17.84) –0.0675 (14.44) –0.0981 (20.92) –0.0780 (17.30)Age2 –0.0005 (10.99) 0.0008 (17.67) 0.0006 (13.05) 0.0007 (15.66) 0.0007 (17.56)Male –0.1259 (4.47) –0.0709 (2.79) –0.0735 (2.83) 0.1495 (5.72) 0.0060 (0.24)Austria –0.1686 (1.68) –0.2037 (2.30) –0.4702 (5.21) –0.4100 (4.51) –0.2470 (2.83)Bulgaria 2.1304 (22.32) –2.8696 (32.44) –1.5173 (16.53) –1.4900 (16.31) –2.9264 (33.21)Cyprus 0.7580 (6.58) –0.4919 (4.57) 0.3203 (2.92) 0.1084 (0.98) –0.6094 (5.74)Czech Republic 0.0797 (0.82) –0.6836 (7.70) –0.3325 (3.68) –0.3837 (4.22) –0.8211 (9.40)Denmark –1.4824 (10.93) 0.6663 (7.49) 0.7754 (8.47) 0.2348 (2.55) 0.5793 (6.51)East Germany –0.0693 (0.58) –0.5790 (5.40) –0.1618 (1.47) –0.5332 (4.85) –0.7700 (7.29)Estonia 0.1347 (1.36) –1.1091 (12.51) –0.2118 (2.34) –0.7454 (8.21) –0.9636 (11.03)Finland –0.4767 (4.41) 0.4969 (5.62) 0.3154 (3.50) 0.2154 (2.38) 0.1619 (1.86)France 0.2252 (2.29) –0.5028 (5.73) 0.1993 (2.23) 0.1452 (1.62) –0.6125 (7.09)Greece 1.2823 (13.63) –0.8470 (9.52) –0.1861 (2.06) 0.1980 (2.17) –0.7078 (8.09)Hungary 0.6338 (6.64) –2.0424 (22.99) –0.6845 (7.57) –0.8116 (8.92) –1.9807 (22.66)Ireland 0.4676 (4.79) 0.1427 (1.61) 0.5128 (5.68) 0.4319 (4.75) –0.0090 (0.10)Italy 0.6508 (6.85) –0.7893 (8.98) –0.6960 (7.78) –0.2745 (3.05) –0.5996 (6.93)Latvia 1.0000 (10.58) –1.9511 (22.23) –0.6331 (7.08) –0.8377 (9.32) –2.0016 (23.18)Lithuania 0.9277 (9.81) –1.2355 (13.99) –0.4051 (4.48) –0.7829 (8.66) –1.3087 (15.06)Luxembourg –0.7204 (5.28) 0.2974 (2.76) 0.4723 (4.30) 0.3720 (3.36) 0.7516 (7.07)Malta 0.9757 (8.48) –0.3226 (2.96) 0.2497 (2.25) 0.3336 (2.98) –0.3986 (3.71)Netherlands –0.4833 (4.46) 0.3325 (3.77) –0.0113 (0.13) 0.0731 (0.81) 0.2904 (3.35)Poland –0.0839 (0.83) –0.7096 (8.00) –0.1198 (1.33) –0.7553 (8.31) –1.2006 (13.74)Portugal 1.0089 (10.39) –1.4480 (16.17) –0.8815 (9.67) –1.1453 (12.48) –1.5017 (17.03)Romania 0.5377 (5.55) –1.5898 (18.04) –0.5020 (5.56) –0.6781 (7.47) –1.4723 (16.89)Slovakia –0.1402 (1.42) –0.8783 (9.99) –0.4298 (4.81) –0.4895 (5.44) –0.8220 (9.50)Slovenia 0.4493 (4.67) –0.3817 (4.36) –0.1647 (1.85) –0.0251 (0.28) –0.5732 (6.65)Spain 0.0600 (0.61) –0.2113 (2.38) –0.0999 (1.11) –0.1821 (2.01) –0.3994 (4.58)Sweden –1.5337 (10.97) 0.4002 (4.52) 0.4202 (4.66) 0.1535 (1.69) 0.4840 (5.55)UK –0.3650 (3.66) 0.2011 (2.37) 0.5253 (6.07) 0.3520 (4.05) 0.3075 (3.68)West Germany –0.5921 (5.56) –0.0324 (0.37) –0.0772 (0.87) –0.1963 (2.19) –0.2707 (3.14)cut1 0.2993 8.6851 8.6800 9.9253 8.4071cut2 20.3278N 26,056 26,653 26,392 26,549 26,492Pseudo/Adjusted R2 0.1217 0.2407 0.1550 0.2482 0.2525
Source: column 1 – Eurobarometer #73.1, January–February 2010 and columns 2–5 Eurobarometer #72.1, August – September 2009.Notes: excluded categories: Belgium; workers; single; Age left school<age 15. T–statistics in parentheses.Questions:Column 1. During the last twelve months, would you say you had difficulties to pay your bills at the end of the month...? ‘almostnever\never’, ‘from time to time’ or ‘most of the time’? (estimated using a logit model).Column 2. All things considered, how satisfied would you say you are with your life these days? Please use a scale from 1 to 10where [1] means ‘very dissatisfied’ and [10] means ‘very satisfied’ (estimated using OLS).Columns 3–5. Could you please tell me on a scale of 1 to 10 how satisfied you are with each of the following items, where ‘1’means you are “very dissatisfied” and ‘10’ means you are “very satisfied”? a) Your family life? b) Your health? c) Your presentstandard of living? (estimated using OLS).
BELL AND BLANCHFLOWER UK UNEMPLOYMENT IN THE GREAT RECESSION R21
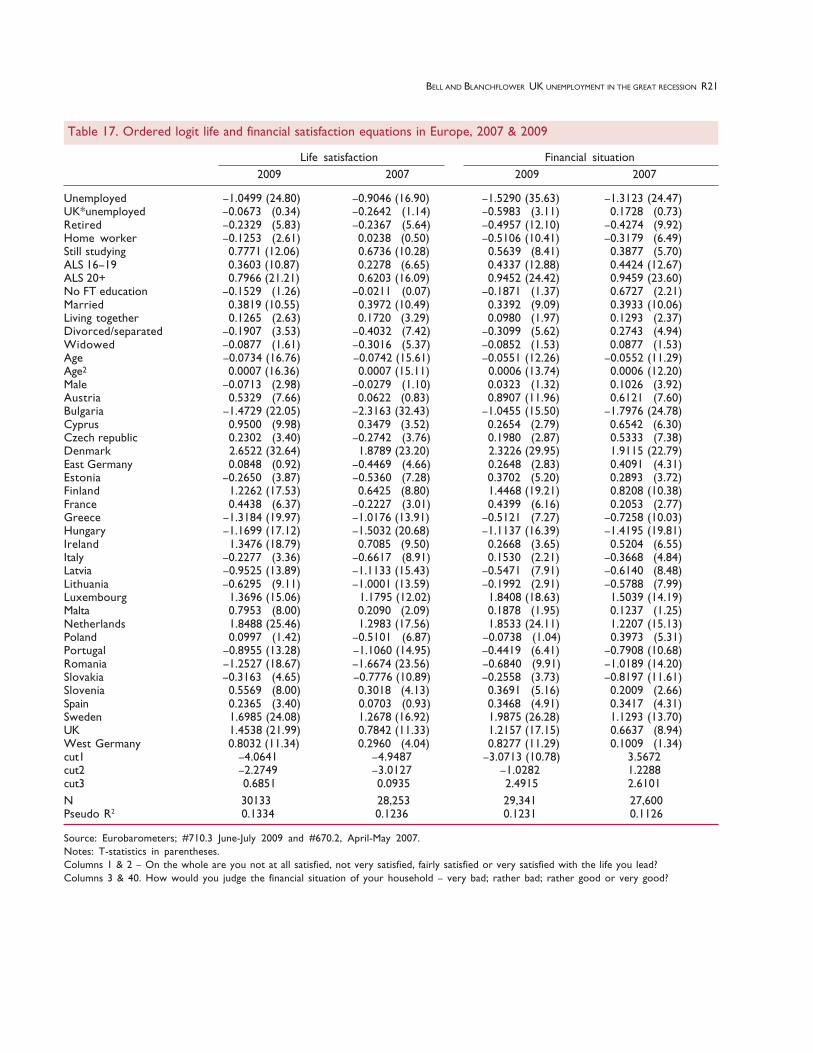
Table 17. Ordered logit life and financial satisfaction equations in Europe, 2007 & 2009
Life satisfaction Financial situation2009 2007 2009 2007
Unemployed –1.0499 (24.80) –0.9046 (16.90) –1.5290 (35.63) –1.3123 (24.47)UK*unemployed –0.0673 (0.34) –0.2642 (1.14) –0.5983 (3.11) 0.1728 (0.73)Retired –0.2329 (5.83) –0.2367 (5.64) –0.4957 (12.10) –0.4274 (9.92)Home worker –0.1253 (2.61) 0.0238 (0.50) –0.5106 (10.41) –0.3179 (6.49)Still studying 0.7771 (12.06) 0.6736 (10.28) 0.5639 (8.41) 0.3877 (5.70)ALS 16–19 0.3603 (10.87) 0.2278 (6.65) 0.4337 (12.88) 0.4424 (12.67)ALS 20+ 0.7966 (21.21) 0.6203 (16.09) 0.9452 (24.42) 0.9459 (23.60)No FT education –0.1529 (1.26) –0.0211 (0.07) –0.1871 (1.37) 0.6727 (2.21)Married 0.3819 (10.55) 0.3972 (10.49) 0.3392 (9.09) 0.3933 (10.06)Living together 0.1265 (2.63) 0.1720 (3.29) 0.0980 (1.97) 0.1293 (2.37)Divorced/separated –0.1907 (3.53) –0.4032 (7.42) –0.3099 (5.62) 0.2743 (4.94)Widowed –0.0877 (1.61) –0.3016 (5.37) –0.0852 (1.53) 0.0877 (1.53)Age –0.0734 (16.76) –0.0742 (15.61) –0.0551 (12.26) –0.0552 (11.29)Age2 0.0007 (16.36) 0.0007 (15.11) 0.0006 (13.74) 0.0006 (12.20)Male –0.0713 (2.98) –0.0279 (1.10) 0.0323 (1.32) 0.1026 (3.92)Austria 0.5329 (7.66) 0.0622 (0.83) 0.8907 (11.96) 0.6121 (7.60)Bulgaria –1.4729 (22.05) –2.3163 (32.43) –1.0455 (15.50) –1.7976 (24.78)Cyprus 0.9500 (9.98) 0.3479 (3.52) 0.2654 (2.79) 0.6542 (6.30)Czech republic 0.2302 (3.40) –0.2742 (3.76) 0.1980 (2.87) 0.5333 (7.38)Denmark 2.6522 (32.64) 1.8789 (23.20) 2.3226 (29.95) 1.9115 (22.79)East Germany 0.0848 (0.92) –0.4469 (4.66) 0.2648 (2.83) 0.4091 (4.31)Estonia –0.2650 (3.87) –0.5360 (7.28) 0.3702 (5.20) 0.2893 (3.72)Finland 1.2262 (17.53) 0.6425 (8.80) 1.4468 (19.21) 0.8208 (10.38)France 0.4438 (6.37) –0.2227 (3.01) 0.4399 (6.16) 0.2053 (2.77)Greece –1.3184 (19.97) –1.0176 (13.91) –0.5121 (7.27) –0.7258 (10.03)Hungary –1.1699 (17.12) –1.5032 (20.68) –1.1137 (16.39) –1.4195 (19.81)Ireland 1.3476 (18.79) 0.7085 (9.50) 0.2668 (3.65) 0.5204 (6.55)Italy –0.2277 (3.36) –0.6617 (8.91) 0.1530 (2.21) –0.3668 (4.84)Latvia –0.9525 (13.89) –1.1133 (15.43) –0.5471 (7.91) –0.6140 (8.48)Lithuania –0.6295 (9.11) –1.0001 (13.59) –0.1992 (2.91) –0.5788 (7.99)Luxembourg 1.3696 (15.06) 1.1795 (12.02) 1.8408 (18.63) 1.5039 (14.19)Malta 0.7953 (8.00) 0.2090 (2.09) 0.1878 (1.95) 0.1237 (1.25)Netherlands 1.8488 (25.46) 1.2983 (17.56) 1.8533 (24.11) 1.2207 (15.13)Poland 0.0997 (1.42) –0.5101 (6.87) –0.0738 (1.04) 0.3973 (5.31)Portugal –0.8955 (13.28) –1.1060 (14.95) –0.4419 (6.41) –0.7908 (10.68)Romania –1.2527 (18.67) –1.6674 (23.56) –0.6840 (9.91) –1.0189 (14.20)Slovakia –0.3163 (4.65) –0.7776 (10.89) –0.2558 (3.73) –0.8197 (11.61)Slovenia 0.5569 (8.00) 0.3018 (4.13) 0.3691 (5.16) 0.2009 (2.66)Spain 0.2365 (3.40) 0.0703 (0.93) 0.3468 (4.91) 0.3417 (4.31)Sweden 1.6985 (24.08) 1.2678 (16.92) 1.9875 (26.28) 1.1293 (13.70)UK 1.4538 (21.99) 0.7842 (11.33) 1.2157 (17.15) 0.6637 (8.94)West Germany 0.8032 (11.34) 0.2960 (4.04) 0.8277 (11.29) 0.1009 (1.34)cut1 –4.0641 –4.9487 –3.0713 (10.78) 3.5672cut2 –2.2749 –3.0127 –1.0282 1.2288cut3 0.6851 0.0935 2.4915 2.6101N 30133 28,253 29,341 27,600Pseudo R2 0.1334 0.1236 0.1231 0.1126
Source: Eurobarometers; #710.3 June-July 2009 and #670.2, April-May 2007.Notes: T-statistics in parentheses.Columns 1 & 2 – On the whole are you not at all satisfied, not very satisfied, fairly satisfied or very satisfied with the life you lead?Columns 3 & 40. How would you judge the financial situation of your household – very bad; rather bad; rather good or very good?

R22 NATIONAL INSTITUTE ECONOMIC REVIEW No. 214 OCTOBER 2010
things considered, how satisfied would you say you arewith your life these days? Please use a scale from 1 to 10where [1] means ‘very dissatisfied’ and [10] means ‘verysatisfied’. The results are standard – the unemployed areespecially unhappy, there is a U-shape in age minimisingaround 50, women are happier than men, married areespecially happy and happiness rises with educationalattainment. Interestingly, the pattern of countrydummies is similar to that in column 1 – Bulgarians arethe least happy and Danes the most, with the UK againranked sixth. Greeks, even though they are havingtrouble paying their bills, remain reasonably happy. TheUK interaction term is again insignificant.
Columns 3–5 estimate OLS equations modellinganswers to the question in relation to three aspects ofwell-being; ‘Could you please tell me on a scale of 1 to10 how satisfied you are with each of the followingitems, where ‘1’ means you are “very dissatisfied” and‘10’ means you are “very satisfied”? a) Your family life?b) Your health? c) Your present standard of living?’
The patterns in the data are broadly similar – well-beingis U-shaped in age, Bulgarians rank worst, Daneshighest; married people are contented. Men arehealthier. The unemployed report low levels of well-being whatever aspect is being modelled , whether it isfamily life, health or living standards. The UK rankstowards the top of EU countries. The significant andvery large coefficient on the UK interaction in the healthequation implies that the unemployed in the UK reportbeing especially unhealthy.
Table 17 also uses data from Eurobarometers tocompare how well-being has changed with the onset ofrecession. It uses data from Eurobarometer #71.1,January–February 2009 and #67.2, April–May 2007.These two sweeps of the survey have the benefit that theyasked two identical questions which allow us to examinechanges. Firstly, they asked a slightly different and morestandard life satisfaction question – Q3. On the whole,are you very satisfied, fairly satisfied, not very satisfied
or not at all satisfied with the life you lead? Not at allsatisfied, not very satisfied, fairly satisfied, or verysatisfied?
Secondly, respondents were asked Q4 ‘how would youjudge the current situation in each of the following? Thefinancial situation of your household – very bad, ratherbad, good or very good?’ Each is modelled as an orderedlogit. The results on life satisfaction are essentially thesame as in table 17. It is noticeable how happiness inGreece has deteriorated between 2007 and 2009.Particularly noticeable in the financial situationequations is the fact that the unemployed in the UKappear to be having an especially difficult timefinancially.
Unemployment appears to lower well-being, not only ofthe individuals who are unemployed, but also makeseveryone else unhappy, although to a lesser degree.Unemployment hurts.
9. ConclusionsThis paper has considered some of the implications ofthe increase in UK unemployment since the beginning ofthe Great Recession. The major finding is that the sharpincrease in unemployment and decrease in employmentis largely concentrated on the young. This has occurredat a time when the size of the youth cohort is large. Thefact that the youth labour market tends to be highlycyclically volatile is a phenomenon that was welldocumented in earlier recessions (Freeman and Wise,1982, and Blanchflower and Freeman, 2000). As aresponse to a lack of jobs there has been a substantialincrease in applications to university, although there hasonly been a small rise in the number of places available.Going forwards, a big concern is that the recovery willdeliver few jobs. In part this may arise because of labourhoarding, which has prevented unemployment rising asmuch as most forecasters expected. Rather than firingpeople, firms responded by freezing or even cutting pay,reducing hours and instigating hiring moratoria.
Table 18. Labour market projections
2009 2010 2011 2012 2013 2014 2015
Employment (millions) 29.0 28.8 28.9 29.2 29.5 29.8 30.1ILO unemployment (% rate) 7.6 8.1 8.0 7.6 7.0 6.5 6.1Claimant count (Q4, millions) 1.6 1.5 1.5 1.4 1.3 1.2 1.1
Source: Office of Budget Responsibility, Budget forecast, June 2010, Table C2.

BELL AND BLANCHFLOWER UK UNEMPLOYMENT IN THE GREAT RECESSION R23
Unemployment has also been kept down by fiscalstimulus by the Labour government and measures toboost employment, especially among the young.
The new coalition government has reduced the numberof university places, removed schemes to help the youngfind work and announced a series of public spending cutsand tax increases that are likely to result in a loss of atleast 600,000 jobs in the public sector and perhaps asmany as three quarters of a million lost in the privatesector, because of its reliance on work from the publicsector. Despite this the recently created Office of BudgetResponsibility has astonishingly forecast thatunemployment will fall every year through 2015 andtotal employment will rise by 1.3 million as shown intable 18.
This would imply that the private sector would have tocreate over 2.5 million jobs, which it has to do if it is tomake up for the 1.3 million the new government plans todestroy. Job creation on this scale seems wildly unlikelygiven that between 2000 and 2008 the private sectoronly created 1.6 million jobs, mostly in the financialsector and construction.4
It remains uncertain where all of these new jobs mightcome from. Firstly, with almost all G20 memberstightening fiscal policy at the same time, it will be “hardto deliver on improving growth for all, or possibly any”,as the chief economist at Goldman Sachs, Jim O’Neill,has warned. Adding to that worry, O’Neill notes, is thegrowing evidence that both the US and Chineseeconomies are slowing. Second, it seems unlikely thatpeople fired from the public sector, such as careassistants, police officers and local authority workers,can simply jump to jobs in the private sector.Occupational differences between any new jobs and jobseekers will be a problem – a skills mismatch. Third, thechances are that most people who lose their jobs in thepublic sector will live in regions that are heavilydependent on the public sector, such as the north, whileany new private sector jobs are likely to be in differentregions, especially the south, where access to housingwill be a problem – a regional mismatch. Fourth, anyincrease in jobs will lure back workers from EasternEurope, who left Britain when job opportunities began todisappear. In such circumstances, measured employmentwill not rise as the OBR expects. Fifth, bank lending isstill compromised especially among SMEs, which willrestrict job opportunities still further.
The rise in unemployment that has happened during this
Great Recession is unlikely to go away quickly. Theworry is that it will get much worse before it gets better.Our fear is that the nearly one million jobless youngstersthat currently exist will simply become a lostgeneration, which hurts everyone. Unemployment hasdevastating and long-lasting social and economiceffects, especially on the young, and lowers nationalwell-being and output. Reducing unemployment shouldbe the new government’s number one priority.Unfortunately it is not. That needs to change and quicklyif the coalition is to survive.
NOTES1 Source: Employment and Labour Market Review, August 2010.2 ILO unemployment rates (%) from the ONS were as follows1971 4.1 1977 5.6 1983 11.5 1989 7.2 1995 8.6 2001 5.1 2007 5.31972 4.3 1978 5.5 1984 11.8 1990 7.1 1996 8.1 2002 5.2 2008 5.81973 3.7 1979 5.4 1985 11.4 1991 8.9 1997 6.9 2003 5.1 2009 6.11974 3.7 1980 6.8 1986 11.3 1992 9.9 1998 6.3 2004 4.8 2010
April 7.81975 4.5 1981 9.6 1987 10.4 1993 10.4 1999 6.0 2005 4.91976 5.4 1982 10.7 1988 8.6 1994 9.5 2000 5.4 2006 5.4
3 In 2007 15–24 year olds constituted 13.37 per cent of theoverall population and 20.15 per cent of the working agepopulation (15–64M/59F). See Table 1.4, Population Trends,134, Winter 2008.http://www.statistics.gov.uk/StatBase/Product.asp?vlnk=6303
4 Considerable concerns have been expressed regarding theindependence of the OBR and hence on the credibility of itsforecasts, not least by Lars Calmfors, ex member of the NobelPrize Committee for Economics and head of the Swedishequivalent of the OBR, in an article in the Guardian on 28 July2010. “Generating credibility for a fiscal watchdog means takinggreat care, from the outset, over its reputation. To rush things– by setting up an interim office before thinking about its roleand the composition of its directing committee (the budgetresponsibility committee) had been completed – is the exactopposite of this. Instead, it seems to reflect the politicalconvenience of quickly providing ammunition for swift fiscalconsolidation”. The OBR’s forecasts are unreliable.
REFERENCESAhn, N., García, J.R. and Jimeno, J.F. (2004), ‘The impact of
unemployment on individual well-being in the EU’, EuropeanNetwork of Economic Policy Institutes, Working Paper No29.
Arulampalam, W. (2001), ‘Is unemployment really scarring? Effectsof unemployment experiences on wages’, EconomicJournal, 111, November, pp. F585–F606.
Arulampalam, W., Booth, A. and Taylor, M. (2000),‘Unemployment persistence’, Oxford Economic Papers, 52, pp.24–50.
Banks, M.H. and Jackson, P.R. (1982), ‘Unemployment and therisk of minor psychiatric disorder in young people: cross-sectional and longitudinal evidence’, Psychological Medicine, 12,pp. 789–98.

R24 NATIONAL INSTITUTE ECONOMIC REVIEW No. 214 OCTOBER 2010
Beale, N. and Nethercott, S. (1987), ‘The health of industrialemployees four years after compulsory redundancy’, Journalof the Royal College of General Practitioners, 37 pp. 390–4.
Bell, D.N.F and Blanchflower D.G. (2007) ‘The Scots may be bravebut they are neither healthy nor happy,’ Scottish Journal of PoliticalEconomy, May, 54, 2, pp. 166–94.
—(2009a), ‘What should be done about rising unemployment inthe UK?’, Stirling Economics Discussion Paper 2009–06,February 2009.
—(2009b), ‘Youth unemployment: déjà vu?’, mimeo.—(2009c), ‘What should be done about rising unemployment in
the OECD?’, mimeo.—(2010), ‘Recession and Unemployment in the OECD’, CESifo
Forum, Issue 1, March.Blakely, T.A., Collings, S.C.D. and Atkinson, J. (2003),
‘Unemployment and suicide. Evidence for a causal association?’,Journal of Epidemiology and Community Health, 57, pp. 594–600.
Blanchard, O. and Wolfers, J. (2000), ‘The role of shocks andinstitutions in the rise of European unemployment: theaggregate evidence’, Economic Journal, 110, 462, pp. 1–33.
Blanchflower, D. G. (2007a), ‘Is unemployment more costly thaninflation?’, NBER Working Paper W13505, October.
—(2007), ‘International patterns of union membership’, BritishJournal of Industrial Relations, March, 45(1), pp. 1–28.
—(2010), ‘The wellbeing of the young’, British Journal of IndustrialRelations, forthcoming.
Blanchflower, D.G. and Freeman, R.B. (1996), ‘Growing into work:youth and the labour market over the 1980s and 1990s’, OECDEmployment Outlook, Paris, OECD.
—(2000), ‘The declining economic status of young workers inOECD countries’, in Blanchflower, D.G. and Freeman, R.B.(eds), Youth Employment and Joblessness in Advanced Countries,University of Chicago Press and NBER.
Blanchflower, D.G. and Oswald, A.J. (2004), ‘Well-being overtime in Britain and the United States’, Journal of Public Economics,Volume 88, Issues 7–8, July, pp. 1359–86.
—(2008), ‘Is well-being U-Shaped over the life cycle?’, Social Science& Medicine, 66, 6, pp. 1733–1749.
Blanchflower, D. G. and Shadforth, C. (2009), ‘Fear, unemploymentand migration’, Economic Journal, 119(535), February, F136–F182.
Brenner, M.H. and Mooney, A. (1983), Unemployment and healthin the context of economic change’, Social Science and Medicine,17, 16, pp. 1125–38.
Burgess, S., Propper, C., Rees, H. and Shearer, A. (2003), ‘Theclass of 1981: the effects of early career unemployment onsubsequent unemployment experiences, Labour Economics, 10,3, June, pp. 291–309.
Carmichael, F. and R. Ward (2000), ‘Youth unemployment andcrime in the English regions and Wales’, Applied Economics,32(5), April, pp. 559–71.
—(2001), ‘Male unemployment and crime in England and Wales’,Economics Letters, 73, pp. 111–5.
Clark, A.E. (2003), ‘Unemployment as a social norm: psychologicalevidence from panel data’, Journal of Labor Economics, 21, pp.323–51.
Clark, A.E., Knabe, A. and Rätzel, S. (2008), ‘Boon or bane? Others’unemployment, well-being and job insecurity’, CESIFO workingpaper No. 2501, December.
Clark, A.E. and Oswald, A.J. (1994), ‘Unhappiness andunemployment’, Economic Journal, 104, 424, pp. 648–59.
Clark, K.B. and Summers, L.H. (1982), ‘The dynamics of youthunemployment’ in Freeman, R.B. and Wise, D.A. (eds), The
Youth Labor Market Problem: Its Nature, Causes, and Consequences,University of Chicago Press and NBER.
Daly, M.C., Wilson, D.J. and Johnson, N.J. (2008), ‘ Relative statusand well-being: evidence from U.S. suicide deaths’, FederalReserve Bank of San Francisco Working Paper 2007–12.
Darity, W. and Goldsmith, A.H. (1996), ‘Social psychology,unemployment and macroeconomics’, Journal of EconomicPerspectives, 10, 1, Winter, pp. 121–40.
Di Tella, R., MacCulloch, R. and Oswald, A. (2001), ‘Preferencesover inflation and unemployment: evidence from surveys ofhappiness’, American Economic Review, 91, pp. 335–41.
—(2003), ‘The macroeconomics of happiness’, Review of Economicsand Statistics, 85, pp. 809–27.
Dickens, R. and Draca, M. (2005), ‘The employment effects of theOctober 2003 increase in the National Minimum Wage’, CEP,February.
Dickens, R., and Manning, A. (2003) ‘Minimum wage – minimumimpact’, in Dickens, R., Gregg, P. and Wadsworth, J. (eds),The State of Working Britain, Basingstoke, Palgrave McMillan,pp. 17–31, Report prepared for Low Pay Commission.
Ellwood, D. (1982), ‘Teenage unemployment: permanent scars ortemporary blemishes?’ in Freeman, R.B. and Wise, D.A. (eds),The Youth Labor Market Problem: Its Nature, Causes and Consequences,Chicago, University of Chicago Press, pp. 349–90.
Fairlie, R. and Kletzer, L.G. (2003), ‘The long-term costs of jobdisplacement among young workers,’ Industrial and LaborRelations Review, 56, 4, pp. 682–98.
Falk, A. and Zweimuller, J. (2005), ‘Unemployment and right-wingextremist crime’, CEPR Discussion Paper No. 4997.
Fougere, D., Kramarz, F. and Pouget, J. (2006), ‘Youthunemployment and crime in France’, CEPR Discussion paperNo. 5600.
Freeman, R.B. (1999), ‘The economics of crime’, in Ashenfelter,O.C. and Card, D. (eds), Handbook of Labor Economics, Volume3C, North Holland.
Freeman, R.B. and Rodgers, W.B. (1999), ‘Area economicconditions and the labor market outcomes of young men inthe 1990s expansion’, NBER Working Paper No. 7073,Cambridge, MA.
Freeman, R.B. and Wise, D.A. (eds) (1982), The Youth Labor MarketProblem: Its Nature, Causes, and Consequences, University ofChicago Press and NBER.
Frese, M. and Mohr, G. (1987), ‘Prolonged unemployment anddepression in older workers: a longitudinal study of interveningvariables, Social Science and Medicine, 25, pp. 173–8.
Frey, B.S. and Stutzer, A. (2002), Happiness and Economics,Princeton University Press.
Giuliano, P. and Spilimbergo, A. (2009), ‘Growing up in arecession: beliefs and the macroeconomy’, NBER WorkingPaper No. 15321, September.
Godfrey, C., Hutton, S., Bradshaw, J., Coles, B., Craig, G. andJohnson, J. (2002), ‘Estimating the cost of being ‘Not inEducation, Employment or Training’ at age 16–18’, ResearchReport 346, Department for Education and Skills.
Goldsmith, A.H., Veum, J.R. and Darity, W. (1996), ‘Thepsychological impact of unemployment and joblessness’,Journal of Socio-Economics, 25, 3, April, pp. 333–58.
—(1997), ‘Unemployment, joblessness, psychological well-beingand self-esteem: theory and evidence’, Journal of Socio-Economics, 26(2), April, pp. 133–58.
Gregg, P.A. (2001), ‘The impact of youth unemployment on adultunemployment in NCDS’, Economic Journal, 111, 475, pp. F623–53.

BELL AND BLANCHFLOWER UK UNEMPLOYMENT IN THE GREAT RECESSION R25
Gregg, P.A. and Tominey, E. (2005), ‘The wage scar from maleyouth unemployment’, Labour Economics, 12, pp. 487–509.
Hamermesh, D.S and Soss, N.M. (1974), ‘An economic theory ofsuicide’, Journal of Political Economy, January/February, 82(1),pp. 83–98.
Hansen, K. and Machin, S. (2002), ‘Spatial crime patterns and theintroduction of the UK Minimum Wage’, Oxford Bulletin ofEconomics and Statistics, 64, pp. 677–99.
Iverson, L. and Sabroe, S. (1988), ‘Participation in a follow-upstudy of health among unemployed and employed people aftera company closedown: drop outs and selection bias,’ Journalof Epidemiology and Community Health, 42, pp. 396–401.
Jackson, P. and Warr, P. (1987), ‘Mental health of unemployedmen in different parts of England and Wales’, British MedicalJournal, 295, p. 525.
Jones, F. and Fletcher, B. (1993),: ‘An empirical study ofoccupational stress transmission in working couples’, HumanRelations, 46, pp. 881–903.
Kahn, L.B. (2010), ‘The long-term labor market consequences ofgraduating from college in a bad economy’, Labour Economics,17, 2, April, pp. 303–16.
Knabe, A. and Rätzel, S. (2008), ‘Scarring or scaring? Thepsychological impact of past and future unemployment’, Otto-von-Guericke-University Magdeburg, February 21.
Layard, R. (1986), How to Beat Unemployment, Oxford UniversityPress.
Layard, R., Nickell, S.N. and Jackman, R. (2005), Unemployment,Macroeconomic Performance and the Labour Market, OxfordUniversity Press, 2nd edition.
Lindsay, C. (2003), ‘A century of labour market change: 1900-2000’, Labour Market Trends, March, pp. 133–44.
Linn, M., Sandifer, R. and Stein, S. (1985), ‘Effects of unemploymenton mental and physical health’, American Journal of Public Health,75, pp. 502–6.
Luechinger, S., Meier, S. and Stutzer, A. (2008), ‘Why doesunemployment hurt the employed? Evidence from the lifesatisfaction gap between the public and the private sector?’,IZA DP No. 3385, March.
Machin, S. and Manning, A. (1999), ‘The causes and consequencesof long-term unemployment in Europe’, in Ashenfelter, O.C.and Card, D. (eds), Handbook of Labor Economics, Volume 3C,North Holland.
Makeham, P. (1980), ‘Youth unemployment. An examination ofevidence on youth unemployment using national statistics’,London, Department of Employment Research Paper No. 10.
Mattiasson, I., Lindgarde, F., Nilsson, J.A. and Theorell, T. (1990),‘Threats of unemployment and cardiovascular risk factors:longitudinal study of quality of sleep and serum cholesterolconcentrations in men threatened with redundancy’, BritishMedical Journal, 301, pp. 461–6.
Mercer, S. and Notley, R. (2008), ‘Trade union membership, 2007’,July, Department of Business, Enterprise and RegulatoryReform,
Metcalf, D. (2008), ‘Why has the British National Minimum Wagehad little or no impact on employment?’, Journal of IndustrialRelations, 50, 3, June.
Moser, K.A., Goldblatt, P.O., Fox A.J. and Jones D.R. (1987),‘Unemployment and mortality: comparison of the 1971 and1981 longitudinal study census samples’, British Medical Journal,1, pp.86–90.
—(1990), ‘Unemployment and mortality’ in Goldblatt P.O. (Ed.),Longitudinal Study: Mortality and Social Organisation, London,OPCS, 1990 (Series LS No. 6).
Mroz, T.A. and Savage, T.H. (2006), ‘The long-term effects ofyouth unemployment’, Journal of Human Resources, Spring, 41,2, pp. 259–93.
Narendranathan, W. and Elias, P. (1993), ‘Influences of past historyon the incidence of youth unemployment: empirical findingsfor the UK’, Oxford Bulletin of Economics and Statistics, 55, pp.161–85.
Nickell, S.N. (2006), ‘A picture of European unemployment: successand failure’, in Werding, M. (Ed.), Structural unemployment inWestern Europe, CESifo Seminar Series, Cambridge, MA, MITPress.
Nickell, S. and Saleheen, J. (2008), ‘The impact of immigration onoccupational wages: evidence from Britain’, Federal ReserveBank of Boston, Working Paper No. 08–6.
OECD (1986), OECD Employment Outlook, Paris, OECD.—(2008a), ‘Off to a good start? Youth labour market transitions
in OECD countries’, OECD Employment Outlook, 2008, pp. 25–77, Paris, OECD.
—(2008b), Jobs for Youth – United Kingdom, Paris, OECD.O’Higgins, N. (1997), ‘The challenge of youth unemployment’,
Employment and labour market policies branch actionprogramme on youth unemployment ‘, Geneva, ILO.
Platt, S. (1984), ‘Unemployment and suicidal behaviour: a reviewof the literature’, Social Science and Medicine, 19, 2, pp. 93–115.
Pritchard, C. (1992), ‘ Is there a link between suicide in youngmen and unemployment? A comparison of the UK with otherEuropean Community Countries?’, The British Journal ofPsychiatry, 160, pp. 750–6.
Rice, P. (1999), ‘The impact of local labour markets on investmentin higher education: evidence from the England and WalesYouth Cohort Studies’, Journal of Population Economics, 12, pp.287–312.
Stewart, M. (2002a) ‘Estimating the impact of the minimum wageusing geographical wage variation’, Oxford Bulletin of Economicsand Statistics, 64, pp. 583–605.
—(2002b), ‘The employment effects of the National MinimumWage’, Economic Journal, 114, March, pp. C110–C116.
—(2004), ‘The impact of the introduction of the UK minimumwage on the employment probabilities of low wage workers’,Journal of the European Economic Association, 2, pp. 67–97.
Thornberry, T. and Christensen, R. (1984), ‘Unemployment andcriminal involvement. An investigation of reciprocal causalstructures’, American Sociological Review, 56, pp. 609–27.
Wells, W. (1983), ‘The relative pay and employment of youngpeople’, Department of Employment Occasional Paper No.42.
Winkelmann, L. and Winkelmann, R. (1998), ‘Why are theunemployed so unhappy? Evidence from panel data’, Economica,65, 257, pp. 1–15.