uk mortgages limited (ukml)
TRANSCRIPT
A BOUTIQUE OF VONTOBEL
ASSET MANAGEMENT
This presentation is for professional investors only / not for public viewing or distribution
UK Mortgages Limited (UKML)Credit Performance Update
November 2019
2
This presentation is for professional investors only / not for public viewing or distribution
Contents
UKML Recap
Update on Share Price and Buybacks
Investment Environment
Credit Performance
Outlook
Investment Information
3
This presentation is for professional investors only / not for public viewing or distribution
UKML at a Glance
Source: TwentyFour
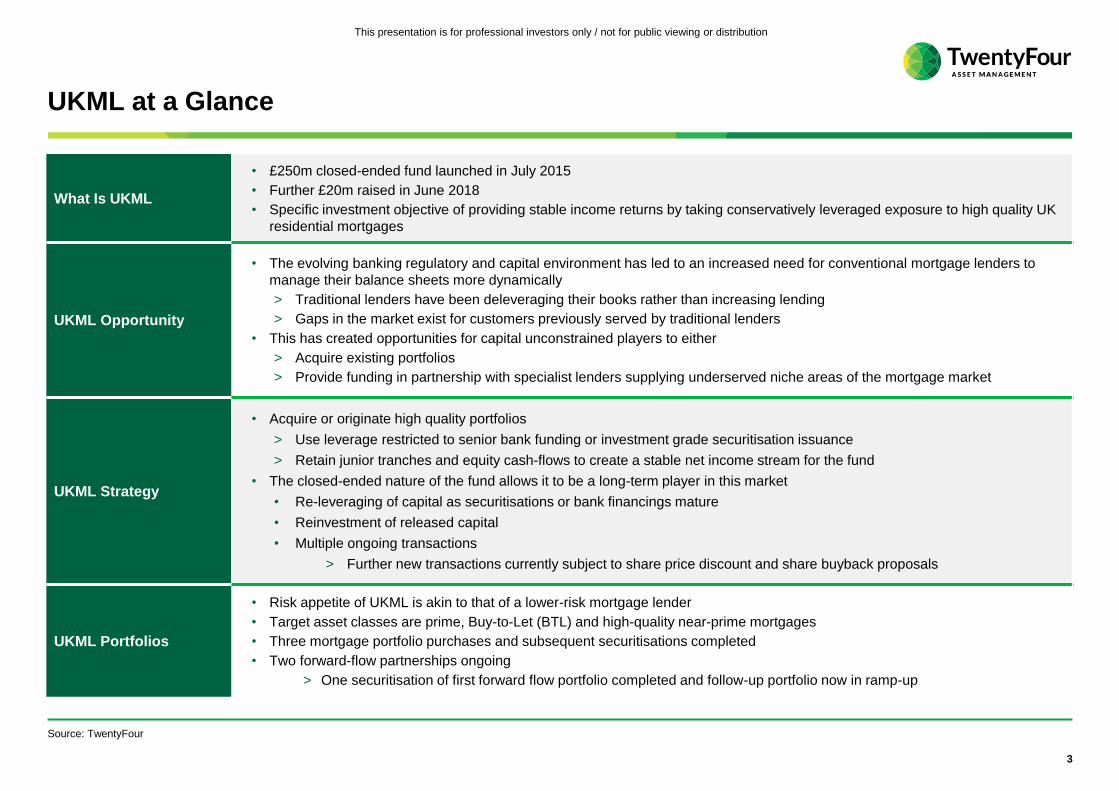
What Is UKML
• £250m closed-ended fund launched in July 2015
• Further £20m raised in June 2018
• Specific investment objective of providing stable income returns by taking conservatively leveraged exposure to high quality UK
residential mortgages
UKML Opportunity
• The evolving banking regulatory and capital environment has led to an increased need for conventional mortgage lenders to
manage their balance sheets more dynamically
> Traditional lenders have been deleveraging their books rather than increasing lending
> Gaps in the market exist for customers previously served by traditional lenders
• This has created opportunities for capital unconstrained players to either
> Acquire existing portfolios
> Provide funding in partnership with specialist lenders supplying underserved niche areas of the mortgage market
UKML Strategy
• Acquire or originate high quality portfolios
> Use leverage restricted to senior bank funding or investment grade securitisation issuance
> Retain junior tranches and equity cash-flows to create a stable net income stream for the fund
• The closed-ended nature of the fund allows it to be a long-term player in this market
• Re-leveraging of capital as securitisations or bank financings mature
• Reinvestment of released capital
• Multiple ongoing transactions
> Further new transactions currently subject to share price discount and share buyback proposals
UKML Portfolios
• Risk appetite of UKML is akin to that of a lower-risk mortgage lender
• Target asset classes are prime, Buy-to-Let (BTL) and high-quality near-prime mortgages
• Three mortgage portfolio purchases and subsequent securitisations completed
• Two forward-flow partnerships ongoing
> One securitisation of first forward flow portfolio completed and follow-up portfolio now in ramp-up

4
This presentation is for professional investors only / not for public viewing or distribution
Contents
UKML Recap
Update on Share Price and Buybacks
Investment Environment
Credit Performance
Outlook
Investment Information
5
This presentation is for professional investors only / not for public viewing or distribution
Share price discount and buyback policy
Past performance is not a reliable indicator of future performance.
Source: UKML company information
• Share price has been at a substantial discount following changes to investment guidelines in June 2019
• This level of discount is normally associated with a credit issue
> That’s NOT the case here – we have an extremely high quality portfolio – performing exceptionally
• If a discount of >5% persists the board will not allow the reinvestment of further capital beyond existing
commitments
• Excess cash will instead be used to buy back shares
> Offers value to shareholders and is instantly accretive
• Expectations are that cash will first become available at the refinancing of Oat Hill No.1 in May-2020
> Amount available for buybacks expected to be between £30m and £50m
> Depending on structure, cost of new debt and prepayments etc.
• A material amount relative to current market cap of £184m
> Not limited to the 5% discount
> Further buybacks can also be considered if non-investable cash remains
6
This presentation is for professional investors only / not for public viewing or distribution
Contents
UKML Recap
Update on Share Price and Buybacks
Investment Environment
Credit Performance
Outlook
Investment Information
7
This presentation is for professional investors only / not for public viewing or distribution
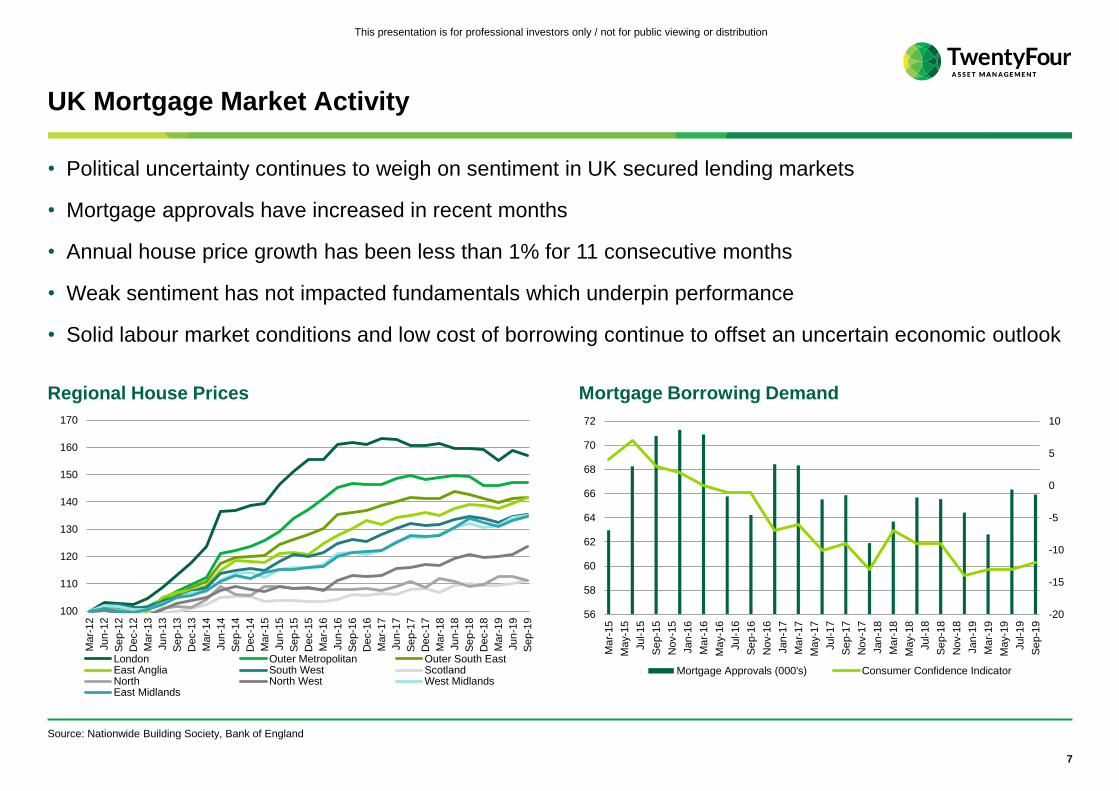
UK Mortgage Market Activity
• Political uncertainty continues to weigh on sentiment in UK secured lending markets
• Mortgage approvals have increased in recent months
• Annual house price growth has been less than 1% for 11 consecutive months
• Weak sentiment has not impacted fundamentals which underpin performance
• Solid labour market conditions and low cost of borrowing continue to offset an uncertain economic outlook
Source: Nationwide Building Society, Bank of England
Regional House Prices Mortgage Borrowing Demand
100
110
120
130
140
150
160
170
Ma
r-12
Jun
-12
Se
p-1
2
Dec-1
2
Ma
r-13
Jun
-13
Se
p-1
3
Dec-1
3
Ma
r-14
Jun
-14
Se
p-1
4
Dec-1
4
Ma
r-15
Jun
-15
Se
p-1
5
Dec-1
5
Ma
r-16
Jun
-16
Se
p-1
6
Dec-1
6
Ma
r-17
Jun
-17
Se
p-1
7
Dec-1
7
Ma
r-18
Jun
-18
Se
p-1
8
Dec-1
8
Ma
r-19
Jun
-19
Se
p-1
9
London Outer Metropolitan Outer South EastEast Anglia South West ScotlandNorth North West West MidlandsEast Midlands
-20
-15
-10
-5
0
5
10
56
58
60
62
64
66
68
70
72
Ma
r-15
Ma
y-1
5
Jul-1
5
Se
p-1
5
Nov-1
5
Jan
-16
Ma
r-16
Ma
y-1
6
Jul-1
6
Se
p-1
6
Nov-1
6
Jan
-17
Ma
r-17
Ma
y-1
7
Jul-1
7
Se
p-1
7
Nov-1
7
Jan
-18
Ma
r-18
Ma
y-1
8
Jul-1
8
Se
p-1
8
Nov-1
8
Jan
-19
Ma
r-19
Ma
y-1
9
Jul-1
9
Se
p-1
9
Mortgage Approvals (000's) Consumer Confidence Indicator
8
This presentation is for professional investors only / not for public viewing or distribution
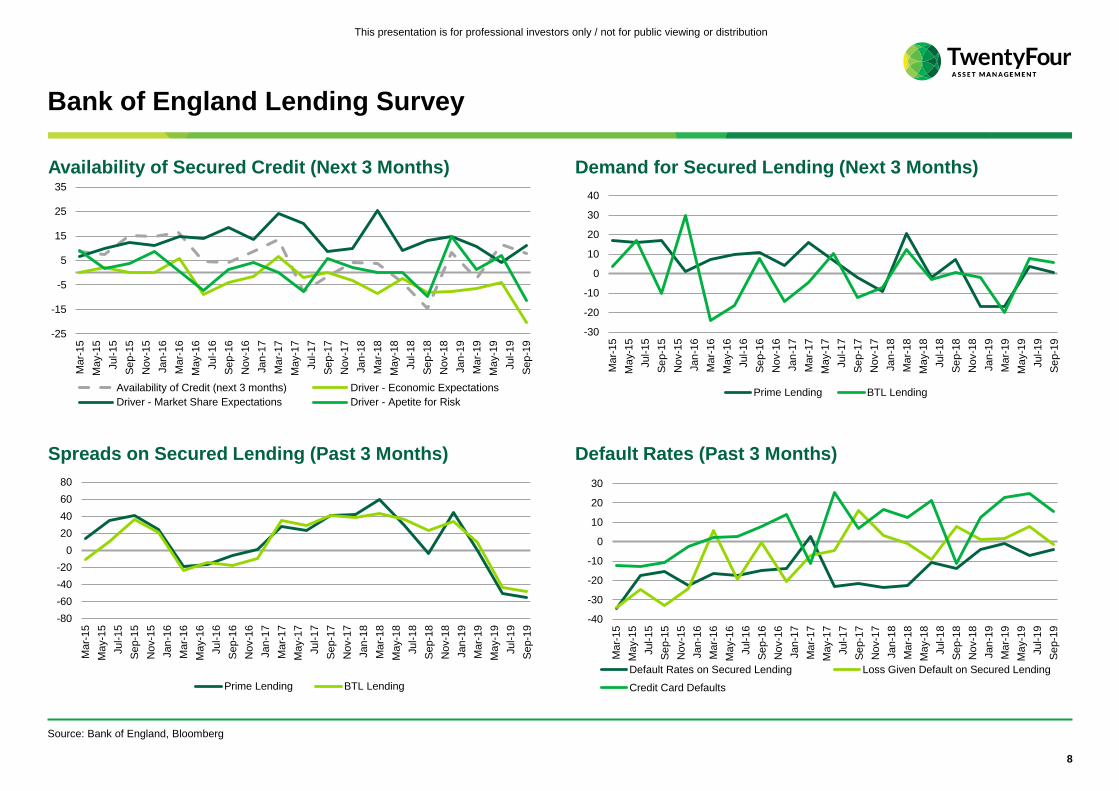
Bank of England Lending Survey
Demand for Secured Lending (Next 3 Months)Availability of Secured Credit (Next 3 Months)
Default Rates (Past 3 Months)Spreads on Secured Lending (Past 3 Months)
Source: Bank of England, Bloomberg
-25
-15
-5
5
15
25
35
Ma
r-15
Ma
y-1
5
Jul-1
5
Se
p-1
5
Nov-1
5
Jan
-16
Ma
r-16
Ma
y-1
6
Jul-1
6
Se
p-1
6
Nov-1
6
Jan
-17
Ma
r-17
Ma
y-1
7
Jul-1
7
Se
p-1
7
Nov-1
7
Jan
-18
Ma
r-18
Ma
y-1
8
Jul-1
8
Se
p-1
8
Nov-1
8
Jan
-19
Ma
r-19
Ma
y-1
9
Jul-1
9
Se
p-1
9
Availability of Credit (next 3 months) Driver - Economic Expectations
Driver - Market Share Expectations Driver - Apetite for Risk
-30
-20
-10
0
10
20
30
40
Ma
r-15
Ma
y-1
5
Jul-1
5
Se
p-1
5
Nov-1
5
Jan
-16
Ma
r-16
Ma
y-1
6
Jul-1
6
Se
p-1
6
Nov-1
6
Jan
-17
Ma
r-17
Ma
y-1
7
Jul-1
7
Se
p-1
7
Nov-1
7
Jan
-18
Ma
r-18
Ma
y-1
8
Jul-1
8
Se
p-1
8
Nov-1
8
Jan
-19
Ma
r-19
Ma
y-1
9
Jul-1
9
Se
p-1
9
Prime Lending BTL Lending
-80
-60
-40
-20
0
20
40
60
80
Ma
r-15
Ma
y-1
5
Jul-1
5
Se
p-1
5
Nov-1
5
Jan
-16
Ma
r-16
Ma
y-1
6
Jul-1
6
Se
p-1
6
Nov-1
6
Jan
-17
Ma
r-17
Ma
y-1
7
Jul-1
7
Se
p-1
7
Nov-1
7
Jan
-18
Ma
r-18
Ma
y-1
8
Jul-1
8
Se
p-1
8
Nov-1
8
Jan
-19
Ma
r-19
Ma
y-1
9
Jul-1
9
Se
p-1
9
Prime Lending BTL Lending
-40
-30
-20
-10
0
10
20
30
Ma
r-15
Ma
y-1
5
Jul-1
5
Se
p-1
5
Nov-1
5
Jan
-16
Ma
r-16
Ma
y-1
6
Jul-1
6
Se
p-1
6
Nov-1
6
Jan
-17
Ma
r-17
Ma
y-1
7
Jul-1
7
Se
p-1
7
Nov-1
7
Jan
-18
Ma
r-18
Ma
y-1
8
Jul-1
8
Se
p-1
8
Nov-1
8
Jan
-19
Ma
r-19
Ma
y-1
9
Jul-1
9
Se
p-1
9
Default Rates on Secured Lending Loss Given Default on Secured Lending
Credit Card Defaults
9
This presentation is for professional investors only / not for public viewing or distribution
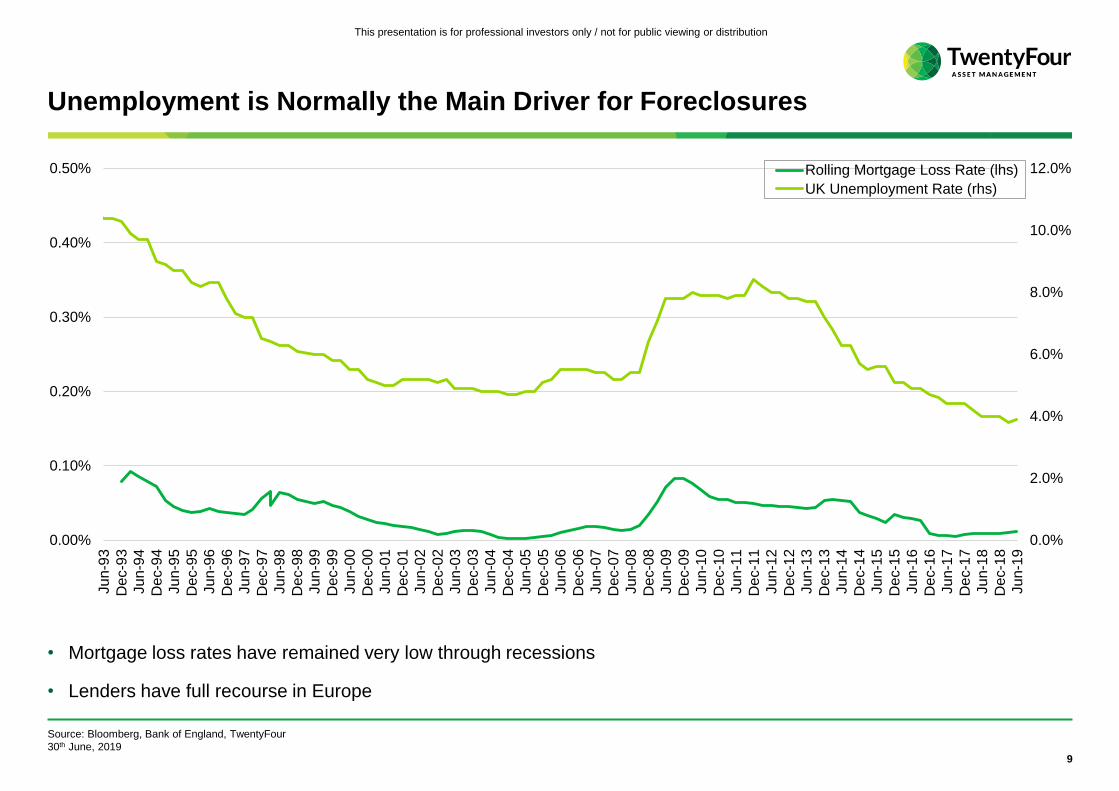
Unemployment is Normally the Main Driver for Foreclosures
• Mortgage loss rates have remained very low through recessions
• Lenders have full recourse in Europe
Source: Bloomberg, Bank of England, TwentyFour
30th June, 2019
0.0%
2.0%
4.0%
6.0%
8.0%
10.0%
12.0%
0.00%
0.10%
0.20%
0.30%
0.40%
0.50%
Ju
n-9
3
De
c-9
3
Ju
n-9
4
De
c-9
4
Ju
n-9
5
De
c-9
5
Ju
n-9
6
De
c-9
6
Ju
n-9
7
De
c-9
7
Ju
n-9
8
De
c-9
8
Ju
n-9
9
De
c-9
9
Ju
n-0
0
De
c-0
0
Ju
n-0
1
De
c-0
1
Ju
n-0
2
De
c-0
2
Ju
n-0
3
De
c-0
3
Ju
n-0
4
De
c-0
4
Ju
n-0
5
De
c-0
5
Ju
n-0
6
De
c-0
6
Ju
n-0
7
De
c-0
7
Ju
n-0
8
De
c-0
8
Ju
n-0
9
De
c-0
9
Ju
n-1
0
De
c-1
0
Ju
n-1
1
De
c-1
1
Ju
n-1
2
De
c-1
2
Ju
n-1
3
De
c-1
3
Ju
n-1
4
De
c-1
4
Ju
n-1
5
De
c-1
5
Ju
n-1
6
De
c-1
6
Ju
n-1
7
De
c-1
7
Ju
n-1
8
De
c-1
8
Ju
n-1
9
Rolling Mortgage Loss Rate (lhs)
UK Unemployment Rate (rhs)
10
This presentation is for professional investors only / not for public viewing or distribution
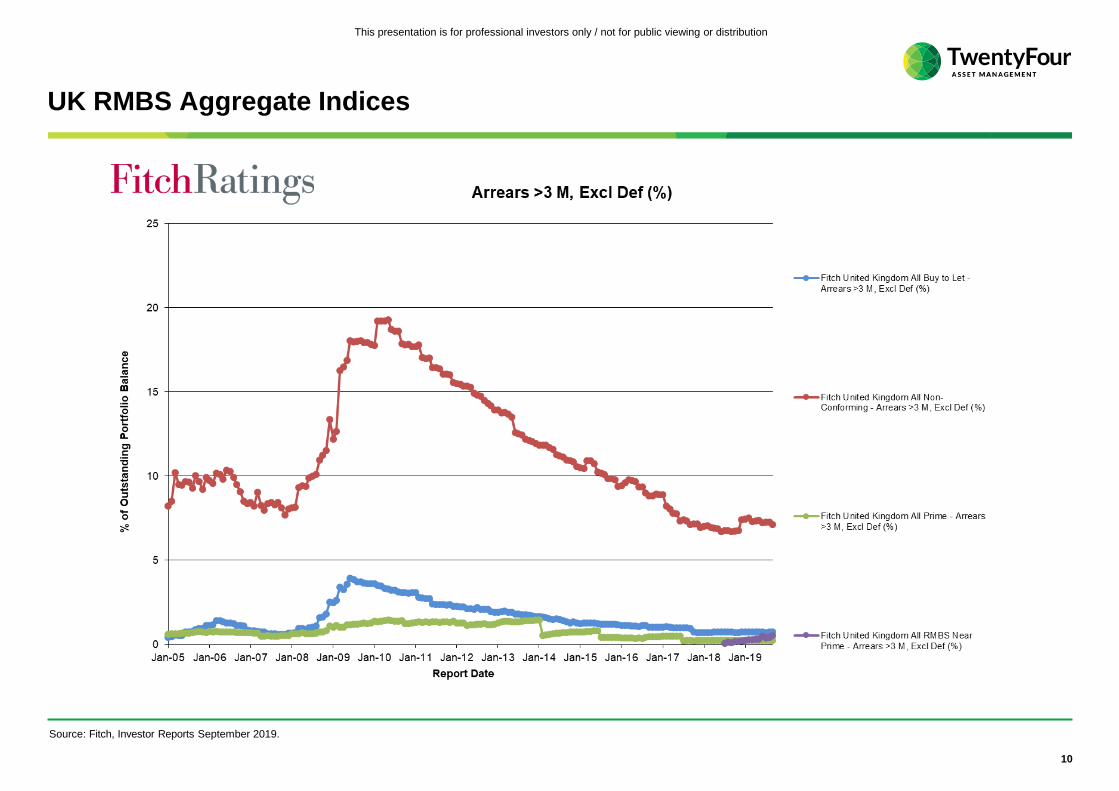
UK RMBS Aggregate Indices
Source: Fitch, Investor Reports September 2019.
11
This presentation is for professional investors only / not for public viewing or distribution
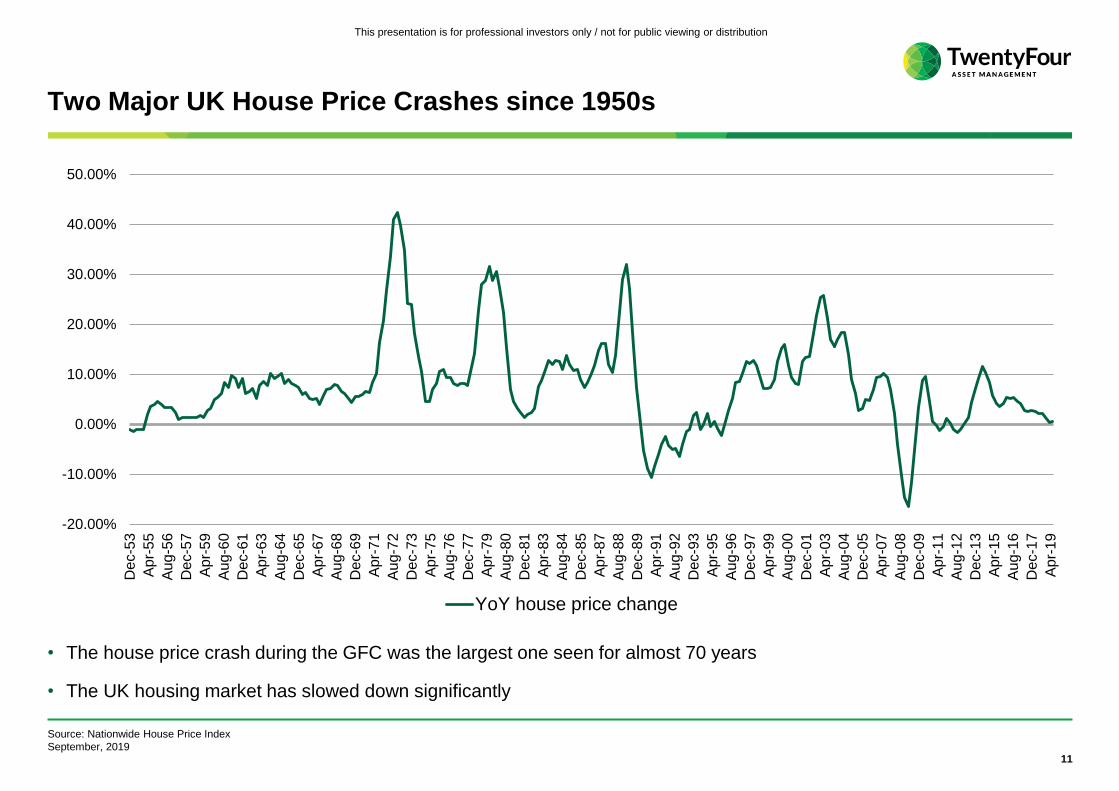
Two Major UK House Price Crashes since 1950s
-20.00%
-10.00%
0.00%
10.00%
20.00%
30.00%
40.00%
50.00%
De
c-5
3
Ap
r-5
5
Aug-5
6
De
c-5
7
Ap
r-5
9
Au
g-6
0
De
c-6
1
Ap
r-6
3
Au
g-6
4
De
c-6
5
Ap
r-6
7
Au
g-6
8
De
c-6
9
Ap
r-7
1
Au
g-7
2
De
c-7
3
Ap
r-7
5
Au
g-7
6
De
c-7
7
Ap
r-7
9
Au
g-8
0
De
c-8
1
Ap
r-8
3
Au
g-8
4
De
c-8
5
Apr-
87
Au
g-8
8
De
c-8
9
Ap
r-9
1
Au
g-9
2
De
c-9
3
Ap
r-9
5
Au
g-9
6
De
c-9
7
Ap
r-9
9
Au
g-0
0
De
c-0
1
Ap
r-0
3
Aug-0
4
De
c-0
5
Ap
r-0
7
Au
g-0
8
De
c-0
9
Ap
r-1
1
Au
g-1
2
De
c-1
3
Ap
r-1
5
Au
g-1
6
De
c-1
7
Ap
r-1
9
YoY house price change
• The house price crash during the GFC was the largest one seen for almost 70 years
• The UK housing market has slowed down significantly
Source: Nationwide House Price Index
September, 2019

12
This presentation is for professional investors only / not for public viewing or distribution
UK Recessions vs. Current
1989-1993 Global Financial Crisis Current
Unemployment 10.7% 8.5% peak 3.8%
Real Income Change N/A -6.5% peak to trough 1.9%
Interest Rates 14.88% 5.75% 0.75%
House Price Peak to Trough* -19.5% -20.6% -0.1%
House Price to Earnings Peak 5.78 8.47 8.39
Loan Default 0.77% 0.43% 0.07%
Assumed Loss Severity 25% 25% 25%
Resulting Losses 0.19% 0.11% 0.02%
Past performance is not a reliable indicator of future performance.
*Through recessionary period.
Source: Nationwide House Price Index (quarterly data for 1989-1993, monthly thereafter), Council of Mortgage Lenders, Bloomberg, ONS
September 2019
Regional differences exist, peak to trough decline in London and South East reached ~30% in 1992
13
This presentation is for professional investors only / not for public viewing or distribution
Contents
UKML Recap
Update on Share Price and Buybacks
Investment Environment
Credit Performance
Outlook
Investment Information
14
This presentation is for professional investors only / not for public viewing or distribution
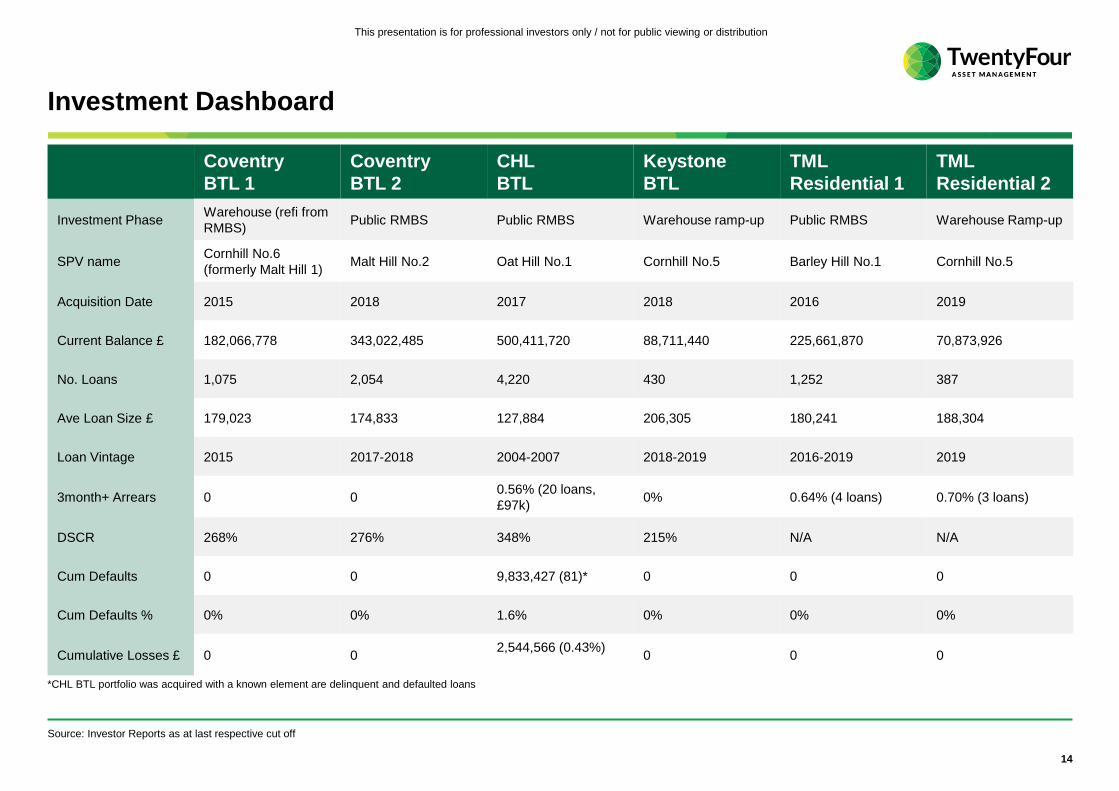
Investment Dashboard
Coventry
BTL 1
Coventry
BTL 2
CHL
BTL
Keystone
BTL
TML
Residential 1
TML
Residential 2
Investment PhaseWarehouse (refi from
RMBS)Public RMBS Public RMBS Warehouse ramp-up Public RMBS Warehouse Ramp-up
SPV nameCornhill No.6
(formerly Malt Hill 1)Malt Hill No.2 Oat Hill No.1 Cornhill No.5 Barley Hill No.1 Cornhill No.5
Acquisition Date 2015 2018 2017 2018 2016 2019
Current Balance £ 182,066,778 343,022,485 500,411,720 88,711,440 225,661,870 70,873,926
No. Loans 1,075 2,054 4,220 430 1,252 387
Ave Loan Size £ 179,023 174,833 127,884 206,305 180,241 188,304
Loan Vintage 2015 2017-2018 2004-2007 2018-2019 2016-2019 2019
3month+ Arrears 0 00.56% (20 loans,
£97k)0% 0.64% (4 loans) 0.70% (3 loans)
DSCR 268% 276% 348% 215% N/A N/A
Cum Defaults 0 0 9,833,427 (81)* 0 0 0
Cum Defaults % 0% 0% 1.6% 0% 0% 0%
Cumulative Losses £ 0 02,544,566 (0.43%)
0 0 0
Source: Investor Reports as at last respective cut off
*CHL BTL portfolio was acquired with a known element are delinquent and defaulted loans
15
This presentation is for professional investors only / not for public viewing or distribution
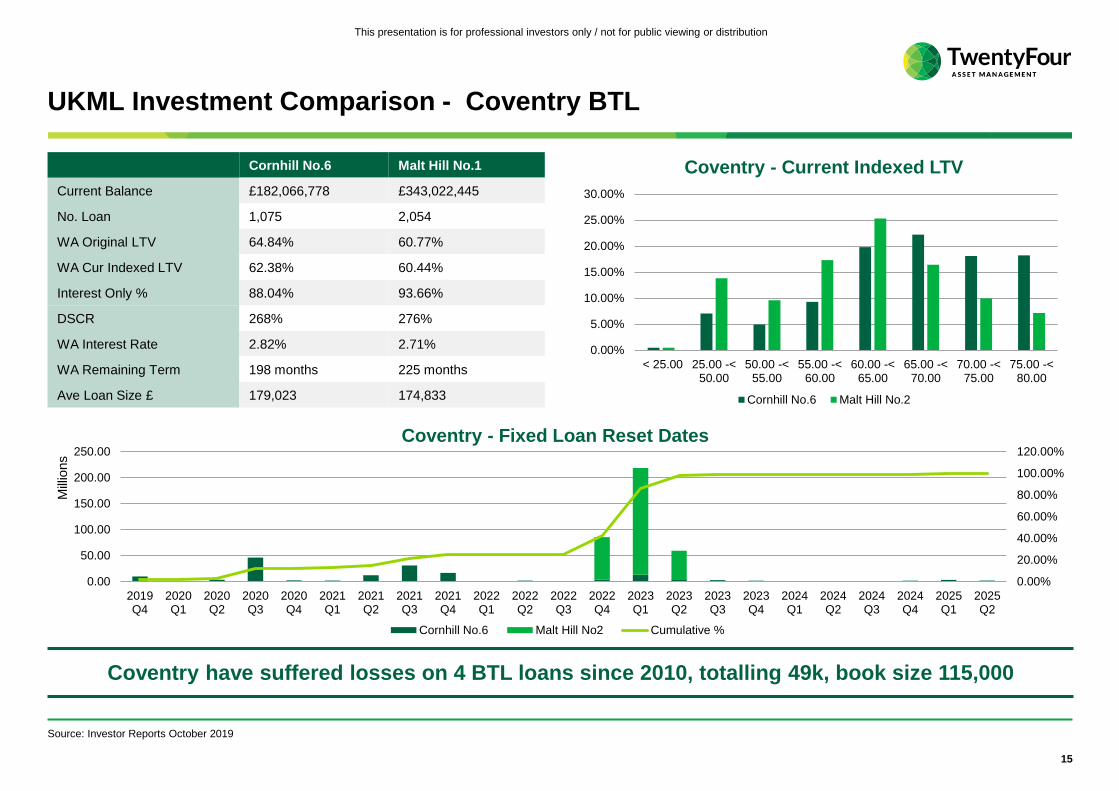
UKML Investment Comparison - Coventry BTL
Source: Investor Reports October 2019
Coventry have suffered losses on 4 BTL loans since 2010, totalling 49k, book size 115,000
0.00%
5.00%
10.00%
15.00%
20.00%
25.00%
30.00%
< 25.00 25.00 -<50.00
50.00 -<55.00
55.00 -<60.00
60.00 -<65.00
65.00 -<70.00
70.00 -<75.00
75.00 -<80.00
Coventry - Current Indexed LTV
Cornhill No.6 Malt Hill No.2
0.00%
20.00%
40.00%
60.00%
80.00%
100.00%
120.00%
0.00
50.00
100.00
150.00
200.00
250.00
2019Q4
2020Q1
2020Q2
2020Q3
2020Q4
2021Q1
2021Q2
2021Q3
2021Q4
2022Q1
2022Q2
2022Q3
2022Q4
2023Q1
2023Q2
2023Q3
2023Q4
2024Q1
2024Q2
2024Q3
2024Q4
2025Q1
2025Q2
Mill
ions
Coventry - Fixed Loan Reset Dates
Cornhill No.6 Malt Hill No2 Cumulative %
Cornhill No.6 Malt Hill No.1
Current Balance £182,066,778 £343,022,445
No. Loan 1,075 2,054
WA Original LTV 64.84% 60.77%
WA Cur Indexed LTV 62.38% 60.44%
Interest Only % 88.04% 93.66%
DSCR 268% 276%
WA Interest Rate 2.82% 2.71%
WA Remaining Term 198 months 225 months
Ave Loan Size £ 179,023 174,833
16
This presentation is for professional investors only / not for public viewing or distribution
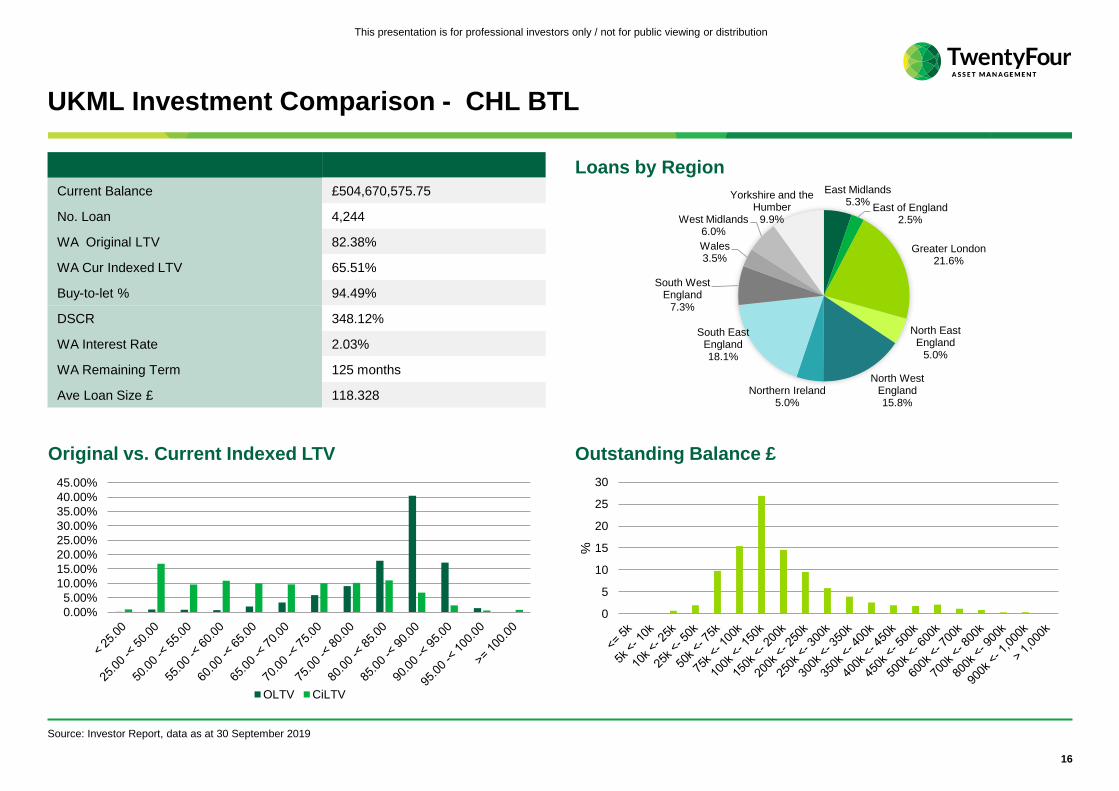
Current Balance £504,670,575.75
No. Loan 4,244
WA Original LTV 82.38%
WA Cur Indexed LTV 65.51%
Buy-to-let % 94.49%
DSCR 348.12%
WA Interest Rate 2.03%
WA Remaining Term 125 months
Ave Loan Size £ 118.328
UKML Investment Comparison - CHL BTL
Loans by Region
Outstanding Balance £Original vs. Current Indexed LTV
Source: Investor Report, data as at 30 September 2019
East Midlands5.3%
East of England2.5%
Greater London21.6%
North East England
5.0%
North West England15.8%
Northern Ireland5.0%
South East England18.1%
South West England
7.3%
Wales3.5%
West Midlands6.0%
Yorkshire and the Humber
9.9%
0.00%
5.00%
10.00%
15.00%
20.00%
25.00%
30.00%
35.00%
40.00%
45.00%
OLTV CiLTV
0
5
10
15
20
25
30
%

17
This presentation is for professional investors only / not for public viewing or distribution
UKML Investment Comparison - CHL BTL
CHL Arrears• At acquisition, the CHL portfolio contained 1.27%
of arrears and repossession
• Annualised loss rate 0.16%
• Performance remains within forecasted range
• A change of servicing system in 2018 partly
responsible for increase in arrears
CHL – Power of Sale / Receiver of Rent / RepossessionCHL Losses
Source: Investor Reports, data as at 30 September 2019
0.00%
0.20%
0.40%
0.60%
0.80%
1.00%
1.20%
0.00%0.20%0.40%0.60%0.80%1.00%1.20%1.40%1.60%1.80%2.00%
Fe
b-1
7
Ap
r-17
Jun
-17
Au
g-1
7
Oct-
17
Dec-1
7
Fe
b-1
8
Ap
r-18
Jun
-18
Au
g-1
8
Oct-
18
Dec-1
8
Fe
b-1
9
Ap
r-19
Jun
-19
Au
g-1
9
Oct-
19
1 <2 2 <3 3 <6 6 <12 >12 3month+
0.00%
0.05%
0.10%
0.15%
0.20%
0.25%
0.30%
0.35%
0.40%
0.45%
0.00
0.50
1.00
1.50
2.00
2.50
3.00
Fe
b-1
7
Ap
r-17
Jun
-17
Au
g-1
7
Oct-
17
Dec-1
7
Fe
b-1
8
Ap
r-18
Jun
-18
Au
g-1
8
Oct-
18
Dec-1
8
Fe
b-1
9
Ap
r-19
Jun
-19
Au
g-1
9
Mill
ions
Loss Period Cum Losses Cum Loss % (RHS)
0.00
1.00
2.00
3.00
4.00
5.00
6.00
7.00
-0.35-0.150.050.250.450.650.851.051.251.451.65
Fe
b-1
7
Ap
r-17
Jun
-17
Au
g-1
7
Oct-
17
Dec-1
7
Fe
b-1
8
Ap
r-18
Jun
-18
Au
g-1
8
Oct-
18
Dec-1
8
Fe
b-1
9
Ap
r-19
Jun
-19
Au
g-1
9
Mill
ions
Mill
ions
New Sold Repaired Total (RHS)
(RHS)
18
This presentation is for professional investors only / not for public viewing or distribution
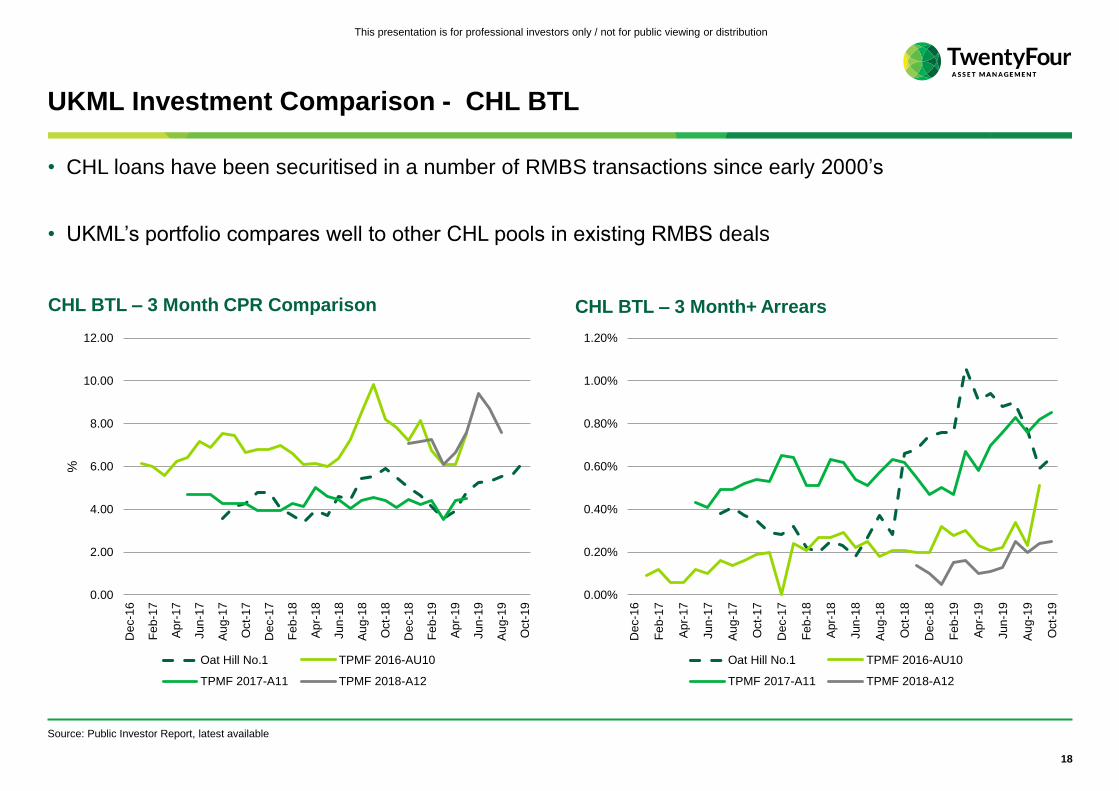
UKML Investment Comparison - CHL BTL
• CHL loans have been securitised in a number of RMBS transactions since early 2000’s
• UKML’s portfolio compares well to other CHL pools in existing RMBS deals
Source: Public Investor Report, latest available
CHL BTL – 3 Month+ ArrearsCHL BTL – 3 Month CPR Comparison
0.00
2.00
4.00
6.00
8.00
10.00
12.00
Dec-1
6
Fe
b-1
7
Ap
r-17
Jun
-17
Au
g-1
7
Oct-
17
Dec-1
7
Fe
b-1
8
Ap
r-18
Jun
-18
Au
g-1
8
Oct-
18
Dec-1
8
Fe
b-1
9
Ap
r-19
Jun
-19
Au
g-1
9
Oct-
19
%
Oat Hill No.1 TPMF 2016-AU10
TPMF 2017-A11 TPMF 2018-A12
0.00%
0.20%
0.40%
0.60%
0.80%
1.00%
1.20%
Dec-1
6
Fe
b-1
7
Ap
r-17
Jun
-17
Au
g-1
7
Oct-
17
Dec-1
7
Fe
b-1
8
Ap
r-18
Jun
-18
Au
g-1
8
Oct-
18
Dec-1
8
Fe
b-1
9
Ap
r-19
Jun
-19
Au
g-1
9
Oct-
19
Oat Hill No.1 TPMF 2016-AU10
TPMF 2017-A11 TPMF 2018-A12
19
This presentation is for professional investors only / not for public viewing or distribution
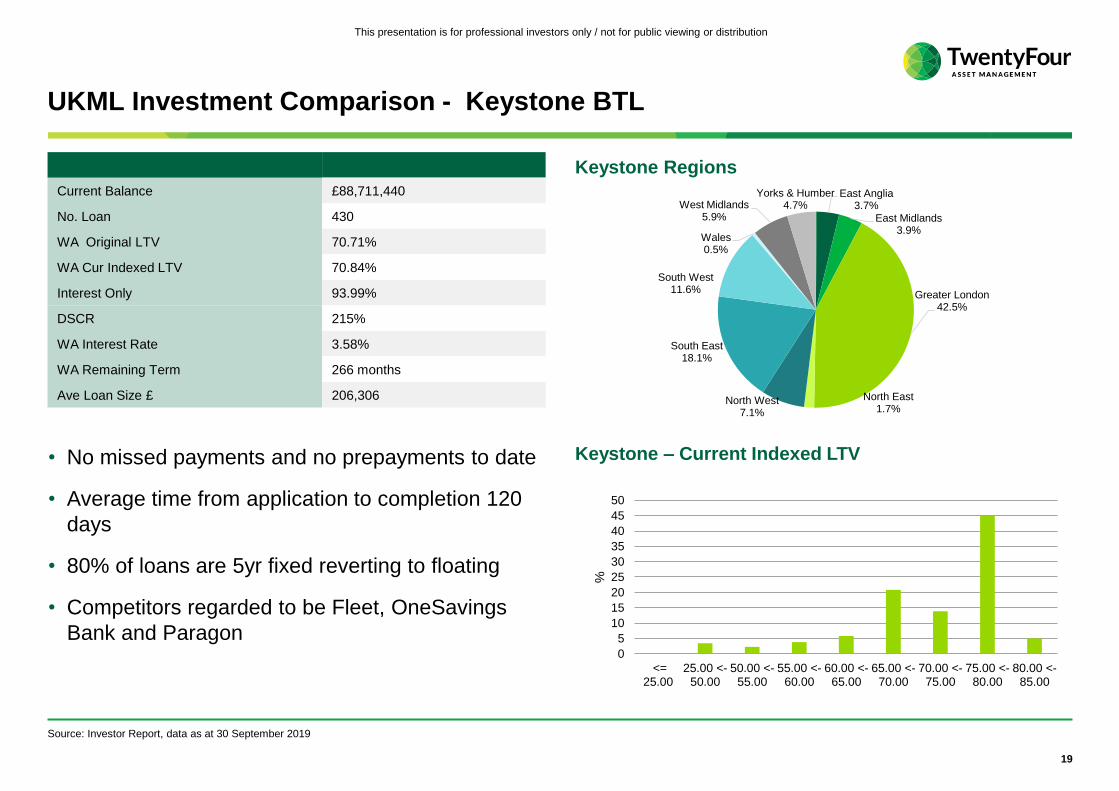
Current Balance £88,711,440
No. Loan 430
WA Original LTV 70.71%
WA Cur Indexed LTV 70.84%
Interest Only 93.99%
DSCR 215%
WA Interest Rate 3.58%
WA Remaining Term 266 months
Ave Loan Size £ 206,306
UKML Investment Comparison - Keystone BTL
Keystone Regions
Keystone – Current Indexed LTV
Source: Investor Report, data as at 30 September 2019
East Anglia3.7%
East Midlands3.9%
Greater London42.5%
North East1.7%
North West7.1%
South East18.1%
South West11.6%
Wales0.5%
West Midlands5.9%
Yorks & Humber4.7%
• No missed payments and no prepayments to date
• Average time from application to completion 120
days
• 80% of loans are 5yr fixed reverting to floating
• Competitors regarded to be Fleet, OneSavings
Bank and Paragon0
5
10
15
20
25
30
35
40
45
50
<=25.00
25.00 <-50.00
50.00 <-55.00
55.00 <-60.00
60.00 <-65.00
65.00 <-70.00
70.00 <-75.00
75.00 <-80.00
80.00 <-85.00
%
20
This presentation is for professional investors only / not for public viewing or distribution
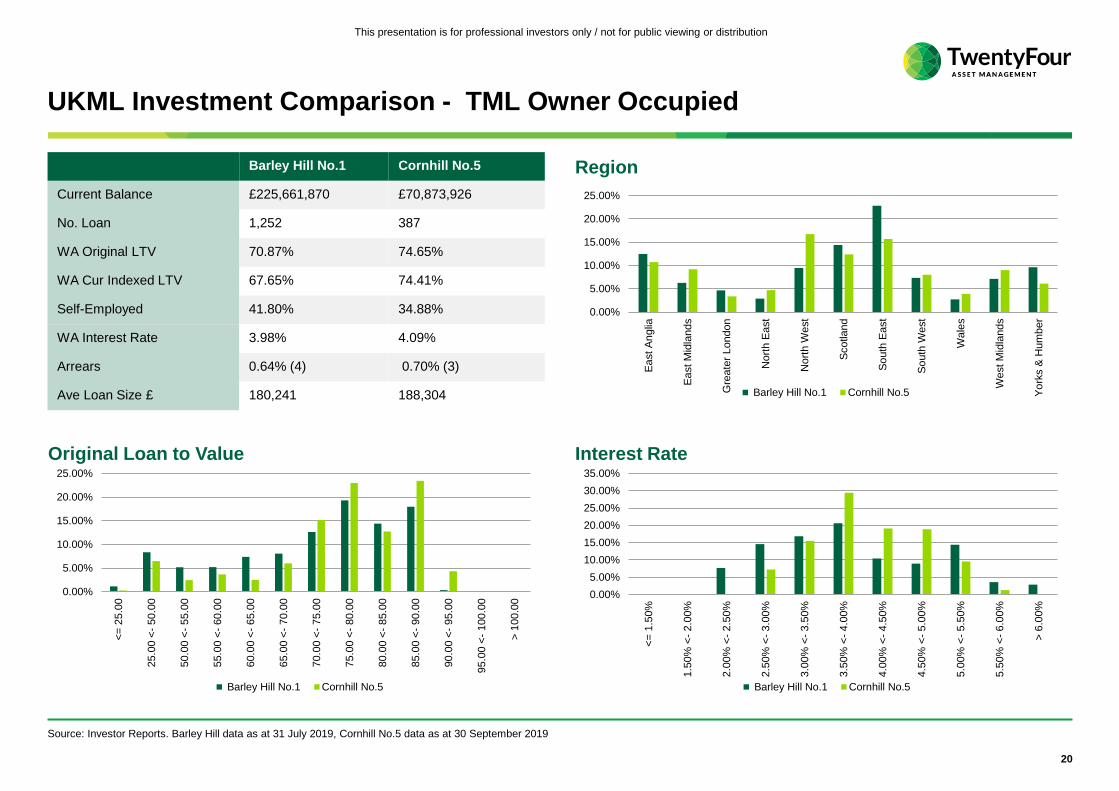
UKML Investment Comparison - TML Owner Occupied
Region
Interest RateOriginal Loan to Value
Source: Investor Reports. Barley Hill data as at 31 July 2019, Cornhill No.5 data as at 30 September 2019
Barley Hill No.1 Cornhill No.5
Current Balance £225,661,870 £70,873,926
No. Loan 1,252 387
WA Original LTV 70.87% 74.65%
WA Cur Indexed LTV 67.65% 74.41%
Self-Employed 41.80% 34.88%
WA Interest Rate 3.98% 4.09%
Arrears 0.64% (4) 0.70% (3)
Ave Loan Size £ 180,241 188,304
0.00%
5.00%
10.00%
15.00%
20.00%
25.00%
<=
25
.00
25.0
0 <
- 50.0
0
50.0
0 <
- 55.0
0
55.0
0 <
- 60.0
0
60.0
0 <
- 65.0
0
65.0
0 <
- 70.0
0
70.0
0 <
- 75.0
0
75.0
0 <
- 80.0
0
80.0
0 <
- 85.0
0
85.0
0 <
- 90.0
0
90.0
0 <
- 95.0
0
95.0
0 <
- 100.0
0
> 1
00.0
0
Barley Hill No.1 Cornhill No.5
0.00%
5.00%
10.00%
15.00%
20.00%
25.00%
Ea
st A
nglia
Ea
st M
idla
nds
Gre
ate
r London
Nort
h E
ast
Nort
h W
est
Scotla
nd
So
uth
East
So
uth
West
Wale
s
West M
idla
nds
Yo
rks &
Hum
ber
Barley Hill No.1 Cornhill No.5
0.00%
5.00%
10.00%
15.00%
20.00%
25.00%
30.00%
35.00%
<=
1.5
0%
1.5
0%
<-
2.0
0%
2.0
0%
<-
2.5
0%
2.5
0%
<-
3.0
0%
3.0
0%
<-
3.5
0%
3.5
0%
<-
4.0
0%
4.0
0%
<-
4.5
0%
4.5
0%
<-
5.0
0%
5.0
0%
<-
5.5
0%
5.5
0%
<-
6.0
0%
> 6
.00%
Barley Hill No.1 Cornhill No.5
21
This presentation is for professional investors only / not for public viewing or distribution
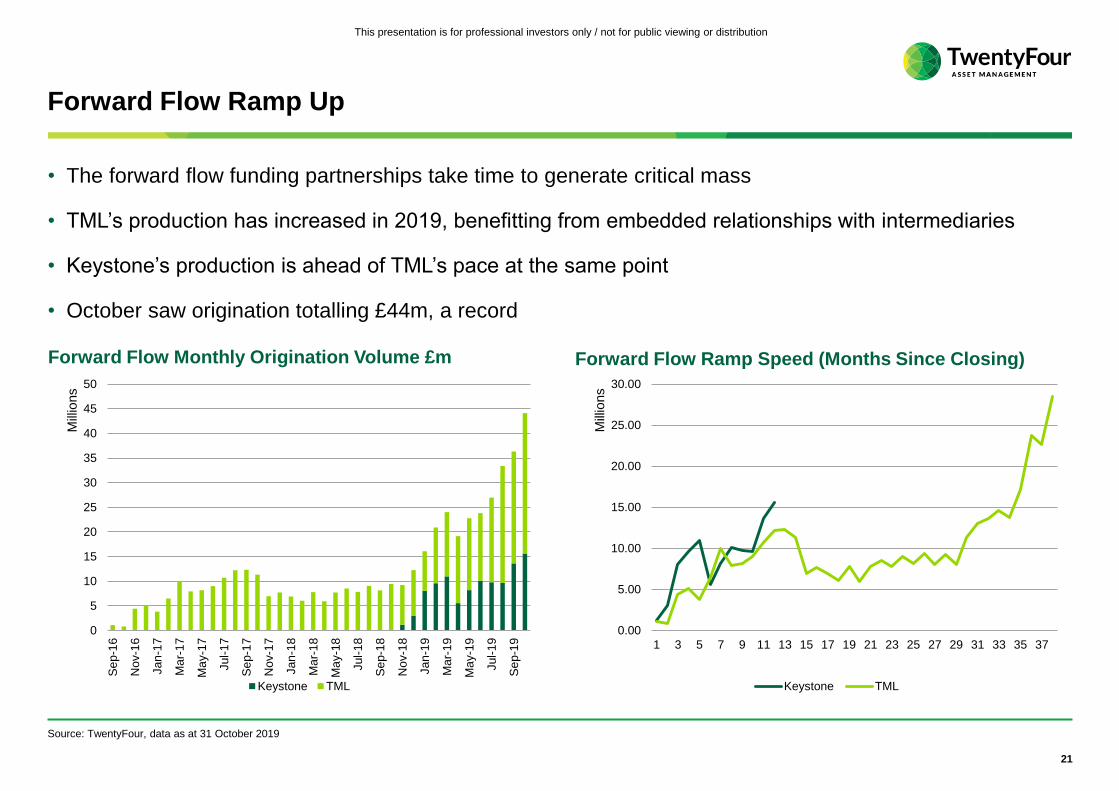
Forward Flow Ramp Up
• The forward flow funding partnerships take time to generate critical mass
• TML’s production has increased in 2019, benefitting from embedded relationships with intermediaries
• Keystone’s production is ahead of TML’s pace at the same point
• October saw origination totalling £44m, a record
Source: TwentyFour, data as at 31 October 2019
Forward Flow Ramp Speed (Months Since Closing)Forward Flow Monthly Origination Volume £m
0
5
10
15
20
25
30
35
40
45
50
Se
p-1
6
Nov-1
6
Jan
-17
Ma
r-1
7
Ma
y-1
7
Jul-
17
Se
p-1
7
Nov-1
7
Jan
-18
Ma
r-1
8
Ma
y-1
8
Jul-
18
Se
p-1
8
Nov-1
8
Jan
-19
Ma
r-1
9
Ma
y-1
9
Jul-
19
Se
p-1
9
Mill
ions
Keystone TML
0.00
5.00
10.00
15.00
20.00
25.00
30.00
1 3 5 7 9 11 13 15 17 19 21 23 25 27 29 31 33 35 37
Mill
ions
Keystone TML
22
This presentation is for professional investors only / not for public viewing or distribution
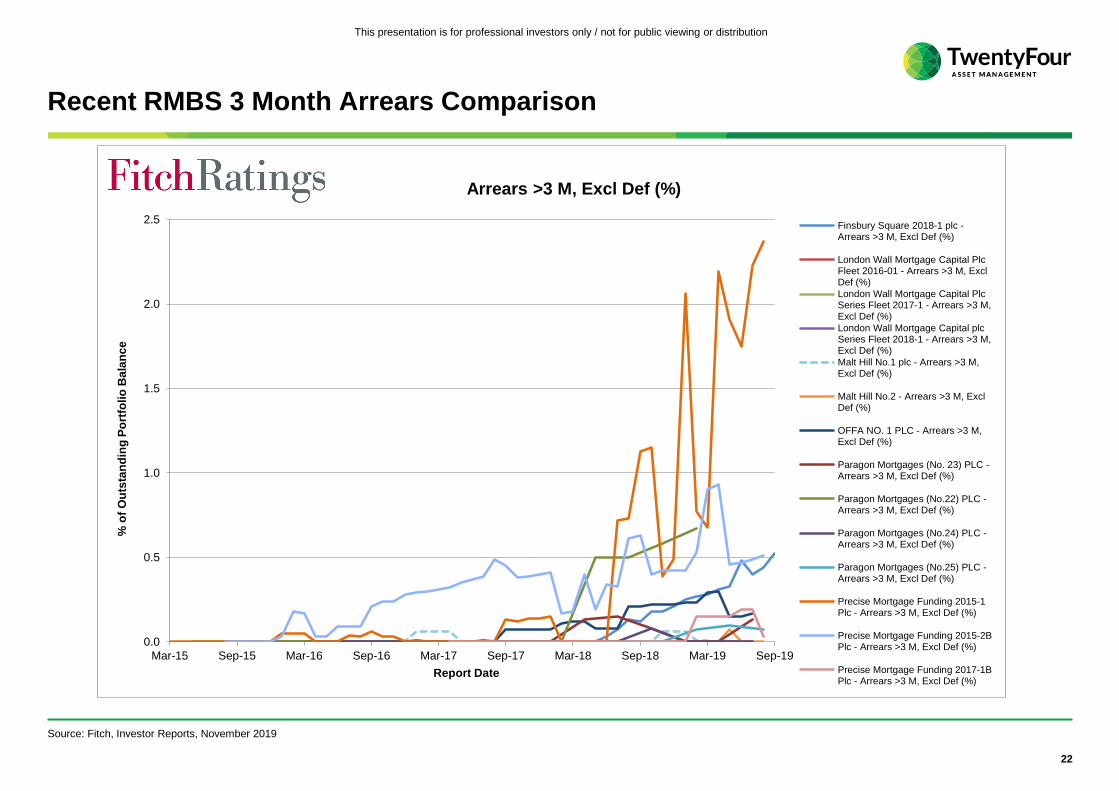
Recent RMBS 3 Month Arrears Comparison
Source: Fitch, Investor Reports, November 2019
0.0
0.5
1.0
1.5
2.0
2.5
Mar-15 Sep-15 Mar-16 Sep-16 Mar-17 Sep-17 Mar-18 Sep-18 Mar-19 Sep-19
Report Date
Finsbury Square 2018-1 plc -Arrears >3 M, Excl Def (%)
London Wall Mortgage Capital PlcFleet 2016-01 - Arrears >3 M, ExclDef (%)
London Wall Mortgage Capital PlcSeries Fleet 2017-1 - Arrears >3 M,Excl Def (%)
London Wall Mortgage Capital plcSeries Fleet 2018-1 - Arrears >3 M,Excl Def (%)
Malt Hill No.1 plc - Arrears >3 M,Excl Def (%)
Malt Hill No.2 - Arrears >3 M, ExclDef (%)
OFFA NO. 1 PLC - Arrears >3 M,Excl Def (%)
Paragon Mortgages (No. 23) PLC -Arrears >3 M, Excl Def (%)
Paragon Mortgages (No.22) PLC -Arrears >3 M, Excl Def (%)
Paragon Mortgages (No.24) PLC -Arrears >3 M, Excl Def (%)
Paragon Mortgages (No.25) PLC -Arrears >3 M, Excl Def (%)
Precise Mortgage Funding 2015-1Plc - Arrears >3 M, Excl Def (%)
Precise Mortgage Funding 2015-2BPlc - Arrears >3 M, Excl Def (%)
Precise Mortgage Funding 2017-1BPlc - Arrears >3 M, Excl Def (%)
Arrears >3 M, Excl Def (%)
% o
f O
uts
tan
din
g P
ort
folio
Ba
lan
ce
23
This presentation is for professional investors only / not for public viewing or distribution
Contents
UKML Recap
Update on Share Price and Buybacks
Investment Environment
Credit Performance
Outlook
Investment Information

24
This presentation is for professional investors only / not for public viewing or distribution
Outlook
• We have extremely high quality portfolios with robust performance
• UK economic fundamentals remain supportive, though performance looks to have peaked
• Mortgage market activity is expected to see slow growth until political uncertainty clears
• But….then we expect modest growth in lending and house prices
• Securitisation markets are open and with potential to be favourable in 2020
• Over time we will make all the portfolios work harder for us – but it is a slow process
Source: TwentyFour
November 2019
25
This presentation is for professional investors only / not for public viewing or distribution
Contents
UKML Recap
Update on Share Price and Buybacks
Investment Environment
Credit Performance
Outlook
Investment Information
26
This presentation is for professional investors only / not for public viewing or distribution
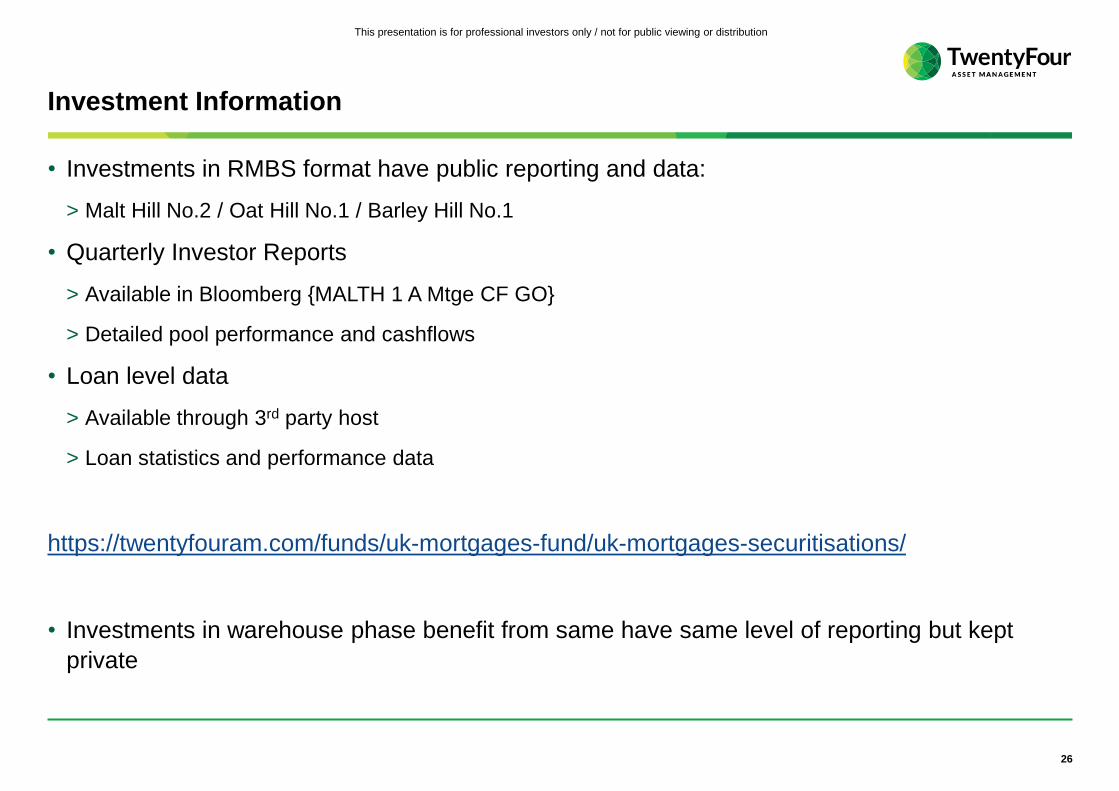
Investment Information
• Investments in RMBS format have public reporting and data:
> Malt Hill No.2 / Oat Hill No.1 / Barley Hill No.1
• Quarterly Investor Reports
> Available in Bloomberg {MALTH 1 A Mtge CF GO}
> Detailed pool performance and cashflows
• Loan level data
> Available through 3rd party host
> Loan statistics and performance data
https://twentyfouram.com/funds/uk-mortgages-fund/uk-mortgages-securitisations/
• Investments in warehouse phase benefit from same have same level of reporting but kept
private
27
This presentation is for professional investors only / not for public viewing or distribution
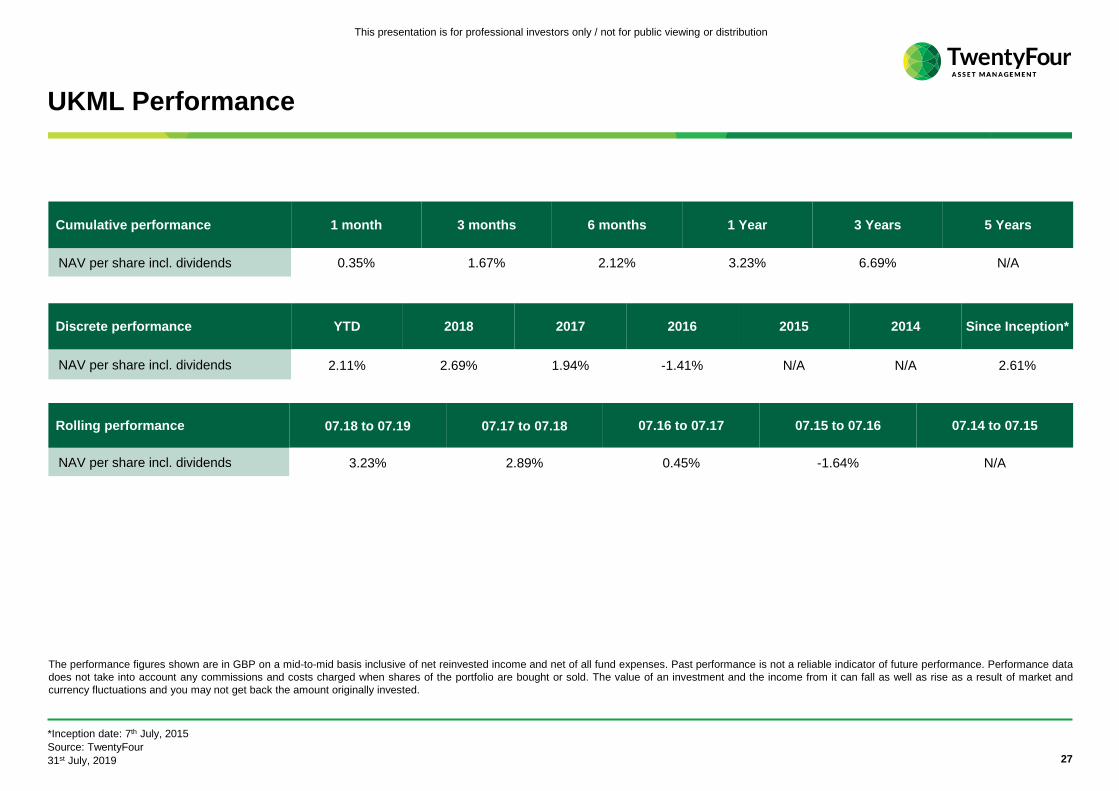
UKML Performance
*Inception date: 7th July, 2015
Source: TwentyFour
31st July, 2019
Cumulative performance 1 month 3 months 6 months 1 Year 3 Years 5 Years
NAV per share incl. dividends 0.35% 1.67% 2.12% 3.23% 6.69% N/A
Discrete performance YTD 2018 2017 2016 2015 2014 Since Inception*
NAV per share incl. dividends 2.11% 2.69% 1.94% -1.41% N/A N/A 2.61%
Rolling performance 07.18 to 07.19 07.17 to 07.18 07.16 to 07.17 07.15 to 07.16 07.14 to 07.15
NAV per share incl. dividends 3.23% 2.89% 0.45% -1.64% N/A
The performance figures shown are in GBP on a mid-to-mid basis inclusive of net reinvested income and net of all fund expenses. Past performance is not a reliable indicator of future performance. Performance data
does not take into account any commissions and costs charged when shares of the portfolio are bought or sold. The value of an investment and the income from it can fall as well as rise as a result of market and
currency fluctuations and you may not get back the amount originally invested.
28
This presentation is for professional investors only / not for public viewing or distribution
UKML Risks
The listed risks concern the current investment strategy of the fund and not necessarily the current portfolio
Key Risks
• All financial investment involves risk. The value of your investment isn't guaranteed, and its value and
income will rise and fall. Investors may not get back the full amount invested.
• The fund can invest in portfolios of mortgages or the equivalent risk. The lenders of such products may
not receive in full the amounts owed to them by underlying borrowers, affecting the performance of the
fund.
• Prepayment risks also vary and can impact returns.
• The fund employs leverage, which may increase volatility of the Net Asset Value.

29
This presentation is for professional investors only / not for public viewing or distribution
This document has been prepared and approved by TwentyFour Asset Management LLP, a company of the Vontobel Group (“Vontobel”; collectively “we, our”), who are the portfolio manager of the securities described herein, for
information purposes only. This document, its contents and any information provided or discussed in connection with it are strictly private and confidential and may not be reproduced, redistributed, referenced, or passed on,
directly or indirectly, to any other person or published, in whole or in part, for any purpose, without the consent of TwentyFour (provided that you may disclose this document on a confidential basis to your legal, tax, or investment
advisers (if any) for the purpose of obtaining advice). Acceptance of delivery of any part of this document by you constitutes unconditional acceptance of the terms and conditions of this notice. This document is an indicative
summary of the securities described herein and may be amended, superseded or replaced by subsequent summaries. The final terms and conditions of the securities will be set out in full in the applicable offering document(s).
This document shall not constitute an offer or invitation or any solicitation of any offer to sell or to subscribe for or buy any securities described herein or to effect any transactions or to conclude any legal act of any kind
whatsoever. This document is not intended to be relied upon as the basis for an investment decision, and is not, and should not be assumed to be, complete. TwentyFour is not acting as advisor or fiduciary. Accordingly, you
must independently determine, with your own advisors, the appropriateness for you of the securities before investing. You are not entitled to rely on this document and TwentyFour accepts no liability whatsoever for any
consequential losses arising from the use of this document or reliance on the information contained herein.
TwentyFour, as manufacturer, have assessed the target market for the securities as being professional clients and eligible counterparties, as such, this document is not intended for distribution to or use by retail clients as defined
in MiFID II (Directive 2014/65/EU) and that all channels for distribution of the securities to professional clients and eligible counterparties are appropriate. Consequently, this document is only directed to those persons in the UK
who are within the definition of investment professionals (as defined in Article 19 of the Financial Service & Markets Act 2000 (Financial Promotion) Order 2005). As such this communication is directed only at persons having
professional experience in matters relating to investments. Any investments to which this document relates will be entered into only with such persons. Any person subsequently offering, selling or recommending the securities (a
“distributor”) should take into consideration the manufacturer’s target market assessment; however, a distributor subject to MiFID II is responsible for undertaking its own target market assessment in respect of the securities (by
either adopting or refining the manufacturer’s target market assessment) and determining appropriate distribution channels.
This document has not been submitted to or approved by the securities regulatory authority of any state or jurisdiction. It is directed only at recipients who are institutional clients such as eligible counterparties or professional
clients as defined by MiFID II or similar regulations in other jurisdictions. No action has been made or will be taken that would permit a public offering of the securities described herein in any jurisdiction in which action for that
purpose is required. No offers, sales, resales or delivery of any securities managed by TwentyFour or any of its affiliates or distribution of any offering material relating to such securities may be made in or from any jurisdiction
except in circumstances which will result in compliance with any applicable laws and regulations and which will not impose any obligation on the above. Neither this document nor any copy of it may be distributed in any
jurisdiction where its distribution may be restricted by law. Persons who receive this document should make themselves aware of and adhere to any such restrictions.
In addition, the information contained herein is directed exclusively at persons outside the United States who are not U.S. persons (as defined in Regulation S of the Securities Act (“Regulation S”)) or acting for the account or
benefit of a U.S. person in offshore transactions in reliance on Regulation S and in accordance with applicable laws. The securities discussed herein have not been and will not be registered or qualified under the United States
Investment Company Act of 1940, as amended, nor the United States Securities Act of 1933, (the “Act”), as amended, nor with any securities regulatory authority of any State or other jurisdiction of the United States.
Consequently, they may not be offered, sold, transferred or delivered, directly or indirectly in the United States or to any US Person unless the securities are registered under the Act, an exemption from the registration
requirements of the Act and any applicable US state securities laws is available, or the transaction would not be subject to the Act.
Nothing in this document should be construed as legal, tax, regulatory, accounting or investment advice or as a recommendation, or making any representations as to suitability of any investment and/or strategies discussed and
any reference to a specific security, asset classes and financial markets are for the purposes of illustration only and there is no assurance that the manager will make any investments with the same or similar characteristics as any
investments presented. The investments are presented for discussion purposes only and are not a reliable indicator of the performance or investment profile of any composite or client account. Further, the reader should not
assume that any investments identified were or will be profitable or that any investment recommendations or that investment decisions we make in the future will be profitable. Prospective investors are reminded that it is not
possible to invest directly in an index. As the material was prepared without regard to specific objectives, financial situation or needs of any potential investors, they should seek professional guidance before deciding on whether
to make an investment. Investments into shares or other securities should in any event be made solely on the basis of the relevant offering document and after seeking the advice of an independent finance, legal, accounting and
tax specialist.
For the purposes of MiFID II, this communication is not in scope for any MiFID II / MiFIR (Regulation (EU) No 600/2014) requirements specifically related to investment research. Furthermore, as non-independent research, it has
not been prepared in accordance with legal requirements designed to promote the independence of investment research, nor are TwentyFour subject to any prohibition on dealing ahead of the dissemination of investment
research.
TwentyFour, its affiliates and the individuals associated therewith may (in various capacities) have positions or deal in securities (or related derivatives) identical or similar to those described herein.
Important Information
30
This presentation is for professional investors only / not for public viewing or distribution
To the maximum extent permitted by law, we will not be liable in any way for any loss or damage suffered by you through use or access to this information, or our failure to provide this information. Our liability for
negligence, breach of contract or contravention of any law as a result of our failure to provide this information or any part of it, or for any problems with this information, which cannot be lawfully excluded, is limited, at
our option and to the maximum extent permitted by law, to resupplying this information or any part of it to you, or to paying for the resupply of this information or any part of it to you.
All information contained in this document, particularly any share prices, calculation data and forecasts, are based on the best information available at the date indicated in the document. The information in this
document is not intended to predict actual results and no assurances are given with respect thereto. Neither TwentyFour, nor any other person undertakes to provide the recipient with access to any additional
information or update this document or to correct any inaccuracies therein which may become apparent. Although TwentyFour believe that the information provided in this document is based on reliable sources, it
does not guarantee the accuracy or completeness of information contained in this document which is stated to have been obtained from or is based upon trade and statistical services or other third party sources.
Past performance, simulated past performance and forecasted performance (whether via modelling or back-testing or similar) are not reliable indicators of future performance. Additionally, there can be
no assurance that targeted or projected returns will be achieved, that TwentyFour or the securities discussed will achieve comparable results or that TwentyFour will be able to implement the investment strategy or any
securities will achieve the investment objectives. In particular, statements contained in this document that are not historical facts are based on current expectations, estimates, projections, opinions and beliefs of
TwentyFour. Such statements involve known and unknown risks, uncertainties and other factors, and reliance should not be placed thereon. In addition, this document contains "forward-looking statements“. Actual
events or results or the actual performance of accounts may differ materially from those reflected or contemplated in such forward looking statements. The value of investments may fall as well as rise and investors
may not get back the amount invested. Prospective investors are reminded that the actual performance realised will depend on numerous factors and circumstances, some of which will be personal to the investor. No
representation is made as to the reasonableness of the assumptions made within or the accuracy or completeness of any modelling or back-testing or similar. All opinions and estimates are those of TwentyFour given
as of the date thereof and are subject to change, may have already been acted upon and may not be shared by Vontobel.
Unless otherwise stated, any performance data will be calculated in GBP terms, inclusive of net reinvested income and net of all portfolio expenses but does not take into account any commissions and costs charged
when the investment is issued or redeemed. Any optimal performance results contained herein are hypothetical returns compiled by TwentyFour and no representation is being made that any account will or is likely to
achieve returns similar to those shown. Hypothetical performance returns may have inherent limitations. Such limitations include but are not limited to that they are prepared with the benefit of hindsight and there are
numerous other factors related to the markets in general or to the implementation of any specific trading strategy which cannot be fully accounted for in the preparation of hypothetical performance results, all of which
can adversely affect actual trading results. Equally, the hypothetical performance results do not reflect the impact that material economic and market factors may have on TwentyFour’s future decision-making if it were
actually managing client money and does not involve financial risk. No hypothetical trading record can completely account for the impact of financial risks associated with actual trading. Consequently, these returns
should not be considered as indicative of the skills of the manager or represent actual recommendations.
Please remember that all investments come with risk. Positive returns, including income, are not guaranteed. Your investment may go down as well as up and you may not get back what you invested.
Asset allocation, diversification and rebalancing do not ensure a profit or protection against possible losses in declining markets. Commissions, fees and other forms of remuneration may affect the performance
negatively. This document does not disclose all the risks and other significant issues related to the securities discussed. Investing in fixed income securities comes with risks that can include but are not necessarily
limited to credit risk of issuers, default risk, possible prepayments, market or economic developments, inflation risk and interest rate risk. The issuer of ABS products may not receive the full amounts owed to them by
underlying borrowers, which would affect the performance of related securities. Credit and prepayment risks also vary by tranche which may also affect the performance of related securities. Investments in high-yield
bonds may be subject to greater market fluctuations and risk of loss of income and principal than securities in higher rated categories. Investments in foreign securities involve special risks, including foreign currency
risk and the possibility of substantial volatility due to adverse political, economic or other developments. Similarly, investments focused in a certain industry may pose additional risks due to lack of diversification,
industry volatility, economic turmoil, susceptibility to economic, political or regulatory risks and other sector concentration risks.
This document does not disclose all the risks and other significant issues related to an investment in the securities. Prior to transacting, potential investors should ensure that they fully understand the terms of the
securities and any applicable risks. This document is not a prospectus for any securities described herein. Investors should only subscribe for any securities described herein on the basis of information in the relevant
offering documents (which has been or will be published and may be obtained in English from TwentyFour by visiting its website www.twentyfouram.com), and not on the basis of any information provided herein.
TwentyFour Asset Management LLP is registered in England No. OC335015, and is authorised and regulated in the UK by the Financial Conduct Authority, FRN No. 481888. Registered Office: 8th Floor, The
Monument Building, 11 Monument Street, London, EC3R 8AF. Calls may be recorded for training and monitoring purposes. Copyright TwentyFour Asset Management LLP, 2019 (all rights reserved).
Important Information