ugo egbunike, moderator - etf · ugo egbunike, moderator director of business development etf.com...
TRANSCRIPT

Currencies & Currency Hedging
Ugo Egbunike, Moderator
Director of Business DevelopmentETF.com
Juliana Bambaci, Panelist
Index Applied Research MSCI
Jonathan Citrin, Panelist
Founder & CEOCitrin Group
Luke Oliver, Panelist
Director, Portfolio Manager Deutsche Asset & Wealth Management

Ugo Egbunike Moderator Director of Business Development ETF.com
Juliana BambaciPanelistIndex Applied ResearchMSCI
Jonathan CitrinPanelistFounder & CEO Citrin Group
Luke OliverPanelistDirector, Portfolio Manager Deutsche Asset & Wealth Management

Hedging FX Exposure in Global Equity Portfolios
Juliana BambaciPanelistIndex Applied ResearchMSCI

The US Dollar…
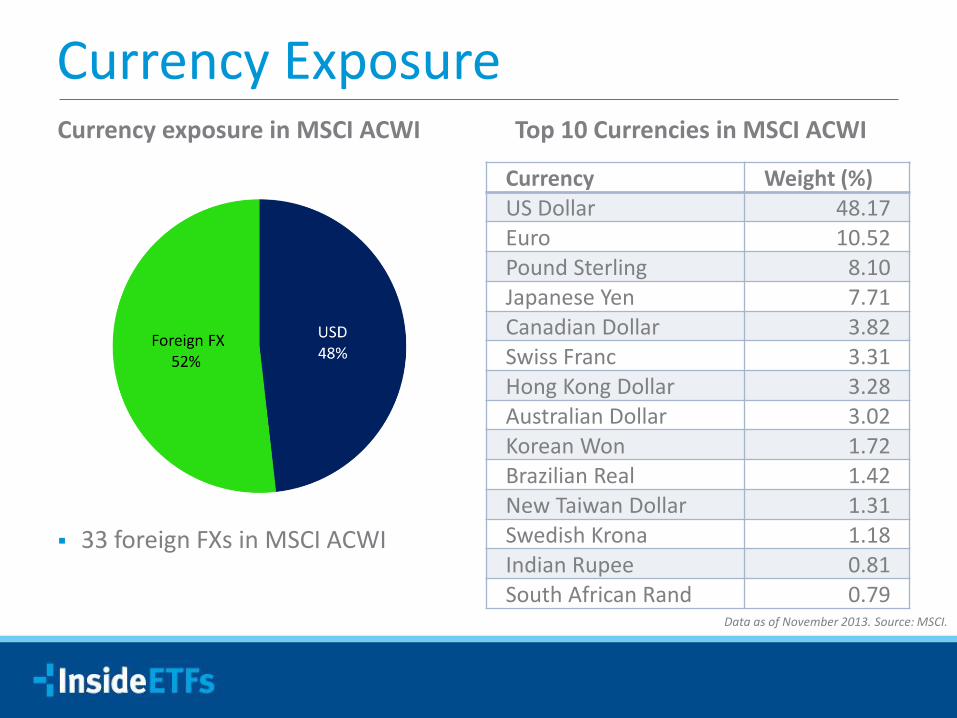
Currency ExposureCurrency exposure in MSCI ACWI Top 10 Currencies in MSCI ACWI
Currency Weight (%)US Dollar 48.17Euro 10.52Pound Sterling 8.10Japanese Yen 7.71Canadian Dollar 3.82Swiss Franc 3.31Hong Kong Dollar 3.28Australian Dollar 3.02Korean Won 1.72Brazilian Real 1.42New Taiwan Dollar 1.31Swedish Krona 1.18Indian Rupee 0.81South African Rand 0.79
33 foreign FXs in MSCI ACWI
Data as of November 2013. Source: MSCI.

Importance of Currency RiskPerformance of Hedged and Unhedged MSCI Indexes (USD)
Data period November 2012-3. Source: MSCI.

Currency Risk: Why Hedge?Comparison of MSCI Europe Index returns in local currency vs. the EUR/USD
Source: MSCI, * Data as of November 29, 2013.

DisclaimerThis document and all of the information contained in it, including without limitation all text, data, graphs, charts (collectively, the “Information”) is the property of MSCI Inc. or its subsidiaries (collectively, “MSCI”), or MSCI’s licensors, direct or indirect suppliers or any third party involved in making or compiling any Information (collectively, with MSCI, the “Information Providers”) and is provided for informational purposes only. The Information may not be reproduced or redisseminated in whole or in part without prior written permission from MSCI.
The Information may not be used to create derivative works or to verify or correct other data or information. For example (but without limitation), the Information may not be used to create indices, databases, risk models, analytics, software, or in connection with the issuing, offering, sponsoring, managing or marketing of any securities, portfolios, financial products or other investment vehicles utilizing or based on, linked to, tracking or otherwise derived from the Information or any other MSCI data, information, products or services.
The user of the Information assumes the entire risk of any use it may make or permit to be made of the Information. NONE OF THE INFORMATION PROVIDERS MAKES ANY EXPRESS OR IMPLIED WARRANTIES OR REPRESENTATIONS WITH RESPECT TO THE INFORMATION (OR THE RESULTS TO BE OBTAINED BY THE USE THEREOF), AND TO THE MAXIMUM EXTENT PERMITTED BY APPLICABLE LAW, EACH INFORMATION PROVIDER EXPRESSLY DISCLAIMS ALL IMPLIED WARRANTIES (INCLUDING, WITHOUT LIMITATION, ANY IMPLIED WARRANTIES OF ORIGINALITY, ACCURACY, TIMELINESS, NON-INFRINGEMENT, COMPLETENESS, MERCHANTABILITY AND FITNESS FOR A PARTICULAR PURPOSE) WITH RESPECT TO ANY OF THE INFORMATION.
Without limiting any of the foregoing and to the maximum extent permitted by applicable law, in no event shall any Information Provider have any liability regarding any of the Information for any direct, indirect, special, punitive, consequential (including lost profits) or any other damages even if notified of the possibility of such damages. The foregoing shall not exclude or limit any liability that may not by applicable law be excluded or limited, including without limitation (as applicable), any liability for death or personal injury to the extent that such injury results from the negligence or wilful default of itself, its servants, agents or sub-contractors.
Information containing any historical information, data or analysis should not be taken as an indication or guarantee of any future performance, analysis, forecast or prediction. Past performance does not guarantee future results.
None of the Information constitutes an offer to sell (or a solicitation of an offer to buy), any security, financial product or other investment vehicle or any trading strategy.
You cannot invest in an index. MSCI does not issue, sponsor, endorse, market, offer, review or otherwise express any opinion regarding any investment or financial product that may be based on or linked to the performance of any MSCI index.
MSCI’s indirect wholly-owned subsidiary Institutional Shareholder Services, Inc. (“ISS”) is a Registered Investment Adviser under the Investment Advisers Act of 1940. Except with respect to any applicable products or services from ISS (including applicable products or services from MSCI ESG Research, which are provided by ISS), neither MSCI nor any of its products or services recommends, endorses, approves or otherwise expresses any opinion regarding any issuer, securities, financial products or instruments or trading strategies and neither MSCI nor any of its products or services is intended to constitute investment advice or a recommendation to make (or refrain from making) any kind of investment decision and may not be relied on as such.
The MSCI ESG Indices use ratings and other data, analysis and information from MSCI ESG Research. MSCI ESG Research is produced by ISS or its subsidiaries. Issuers mentioned or included in any MSCI ESG Research materials may be a client of MSCI, ISS, or another MSCI subsidiary, or the parent of, or affiliated with, a client of MSCI, ISS, or another MSCI subsidiary, including ISS Corporate Services, Inc., which provides tools and services to issuers. MSCI ESG Research materials, including materials utilized in any MSCI ESG Indices or other products, have not been submitted to, nor received approval from, the United States Securities and Exchange Commission or any other regulatory body.
Any use of or access to products, services or information of MSCI requires a license from MSCI. MSCI, Barra, RiskMetrics, IPD, ISS, FEA, InvestorForce, and other MSCI brands and product names are the trademarks, service marks, or registered trademarks of MSCI or its subsidiaries in the United States and other jurisdictions. The Global Industry Classification Standard (GICS) was developed by and is the exclusive property of MSCI and Standard & Poor’s. “Global Industry Classification Standard (GICS)” is a service mark of MSCI and Standard & Poor’s.
© 2013 MSCI Inc. All rights reserved.
Producing Alpha via Currencies
Jonathan CitrinPanelistFounder & CEO Citrin Group
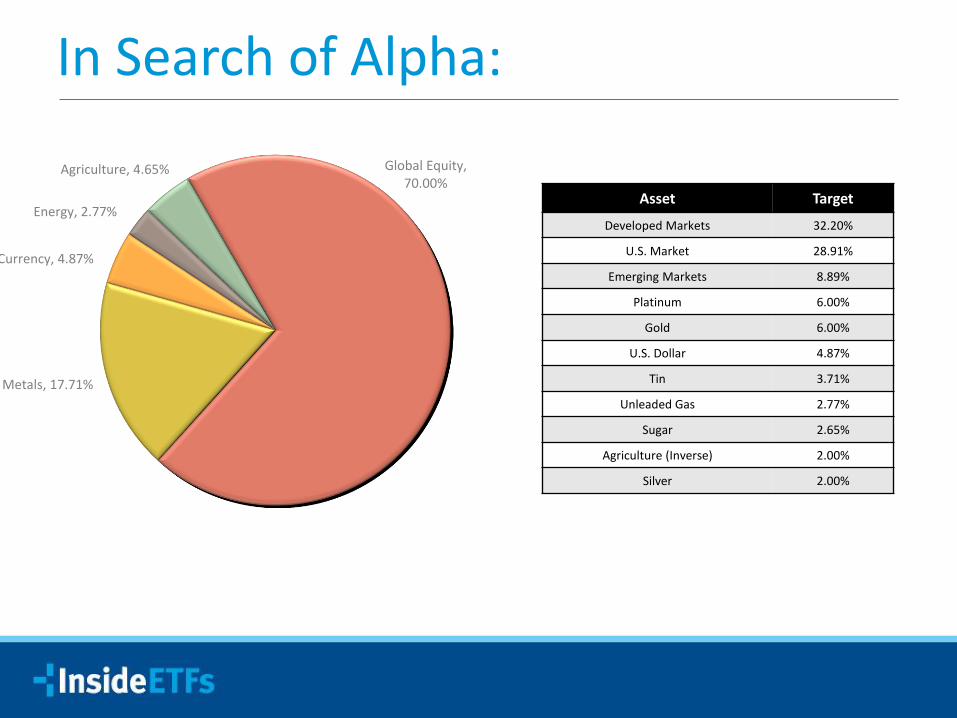
In Search of Alpha:
Global Equity, 70.00%
Metals, 17.71%
Currency, 4.87%
Energy, 2.77%
Agriculture, 4.65%
Asset Target
Developed Markets 32.20%
U.S. Market 28.91%
Emerging Markets 8.89%
Platinum 6.00%
Gold 6.00%
U.S. Dollar 4.87%
Tin 3.71%
Unleaded Gas 2.77%
Sugar 2.65%
Agriculture (Inverse) 2.00%
Silver 2.00%
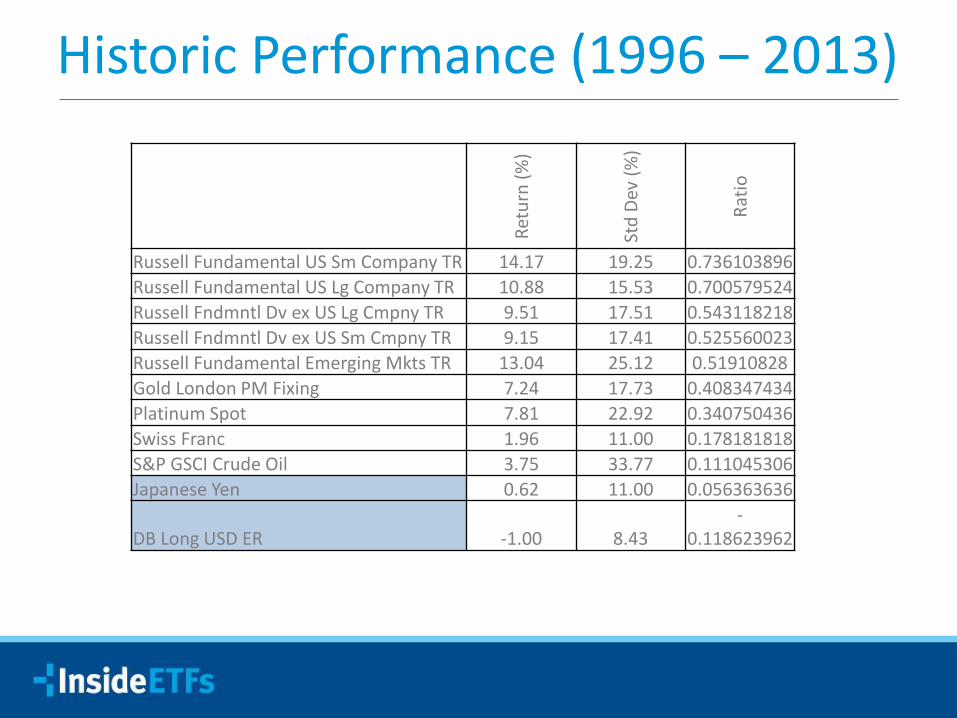
Historic Performance (1996 – 2013)
Ret
urn
(%
)
Std
Dev
(%
)
Rat
io
Russell Fundamental US Sm Company TR 14.17 19.25 0.736103896
Russell Fundamental US Lg Company TR 10.88 15.53 0.700579524
Russell Fndmntl Dv ex US Lg Cmpny TR 9.51 17.51 0.543118218
Russell Fndmntl Dv ex US Sm Cmpny TR 9.15 17.41 0.525560023
Russell Fundamental Emerging Mkts TR 13.04 25.12 0.51910828
Gold London PM Fixing 7.24 17.73 0.408347434
Platinum Spot 7.81 22.92 0.340750436
Swiss Franc 1.96 11.00 0.178181818
S&P GSCI Crude Oil 3.75 33.77 0.111045306
Japanese Yen 0.62 11.00 0.056363636
DB Long USD ER -1.00 8.43-
0.118623962
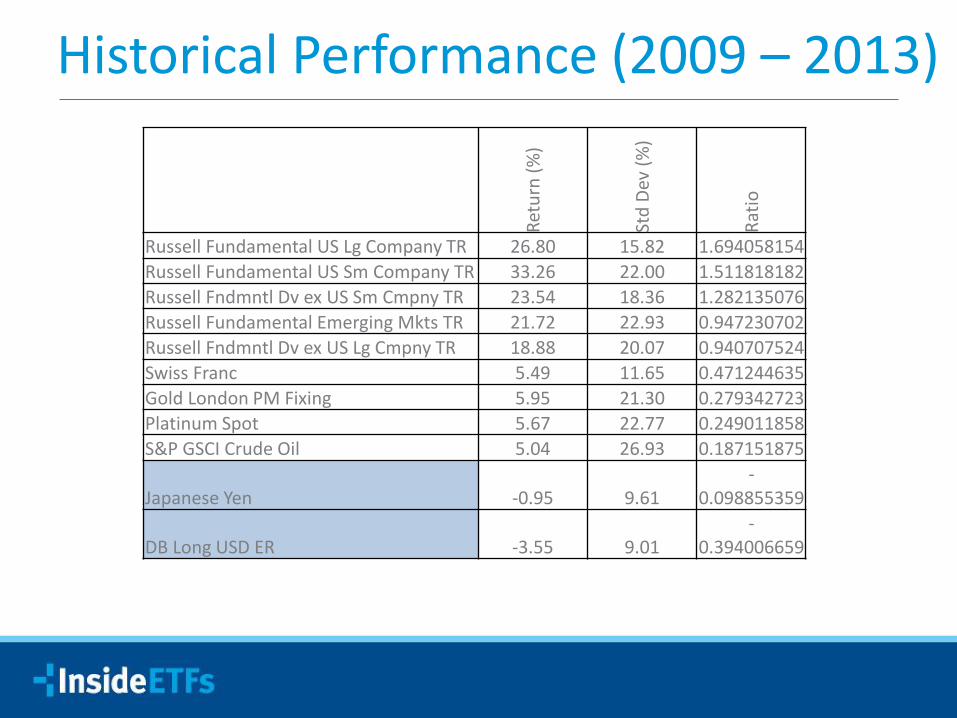
Historical Performance (2009 – 2013)
Ret
urn
(%)
Std
Dev
(%)
Rat
io
Russell Fundamental US Lg Company TR 26.80 15.82 1.694058154
Russell Fundamental US Sm Company TR 33.26 22.00 1.511818182
Russell Fndmntl Dv ex US Sm Cmpny TR 23.54 18.36 1.282135076
Russell Fundamental Emerging Mkts TR 21.72 22.93 0.947230702
Russell Fndmntl Dv ex US Lg Cmpny TR 18.88 20.07 0.940707524
Swiss Franc 5.49 11.65 0.471244635
Gold London PM Fixing 5.95 21.30 0.279342723
Platinum Spot 5.67 22.77 0.249011858
S&P GSCI Crude Oil 5.04 26.93 0.187151875
Japanese Yen -0.95 9.61-
0.098855359
DB Long USD ER -3.55 9.01-
0.394006659

Historical Correlations (1996 – 2013)
1 2 3 4 5 6 7 8 9 10 11
1) Russell Fundamental US Lg Company TR 1.00
2) Russell Fundamental US Sm Company TR 0.91 1.00
3) Russell Fndmntl Dv ex US Lg Cmpny TR 0.82 0.80 1.00
4) Russell Fndmntl Dv ex US Sm Cmpny TR 0.70 0.73 0.92 1.00
5) Russell Fundamental Emerging Mkts TR 0.71 0.72 0.81 0.78 1.00
6) S&P GSCI Crude Oil 0.18 0.25 0.33 0.35 0.33 1.00
7) Gold London PM Fixing 0.01 0.06 0.17 0.22 0.23 0.21 1.00
8) Platinum Spot 0.21 0.23 0.35 0.37 0.39 0.29 0.56 1.00
9) Japanese Yen-
0.04 -0.08 0.09 0.17 0.03 -0.02 0.24 0.05 1.00
10) Swiss Franc 0.07 0.13 0.32 0.34 0.17 0.19 0.37 0.25 0.34 1.00
11) DB Long USD ER-
0.29 -0.32 -0.53 -0.53 -0.36 -0.30 -0.42 -0.32 -0.37 -0.85 1.00

Historical Correlations (2009 – 2013)
1 2 3 4 5 6 7 8 9 10 11
1) Russell Fundamental US Lg Company TR 1.00
2) Russell Fundamental US Sm Company TR 0.95 1.00
3) Russell Fndmntl Dv ex US Lg CmpnyTR 0.87 0.82 1.00
4) Russell Fndmntl Dv ex US Sm Cmpny TR 0.84 0.81 0.95 1.00
5) Russell Fundamental Emerging Mkts TR 0.81 0.81 0.88 0.88 1.00
6) S&P GSCI Crude Oil 0.51 0.46 0.54 0.54 0.56 1.00
7) Gold London PM Fixing 0.09 0.07 0.15 0.16 0.28 0.30 1.00
8) Platinum Spot 0.49 0.45 0.52 0.52 0.59 0.50 0.72 1.00
9) Japanese Yen -0.15 -0.19 -0.11 -0.04 -0.02 -0.08 0.38 0.06 1.00
10) Swiss Franc 0.39 0.34 0.62 0.62 0.62 0.51 0.39 0.53 0.19 1.00
11) DB Long USD ER -0.62 -0.52 -0.79 -0.75 -0.72 -0.60 -0.33 -0.55 -0.22 -0.79 1.00

Global Macro & “Currency Effect”

Currency Hedging in Focus
Luke OliverPanelistDirector, Portfolio Manager Deutsche Asset & Wealth Management

Important Information DBX Advisors LLC (DBX) is the investment advisor to the db X-trackers funds, which are
distributed by ALPS Distributors, Inc. (ALPS). DBX is a subsidiary of Deutsche Bank AG, neither of which is affiliated with ALPS.
Carefully consider the funds’ investment objectives, risk factors and charges and expenses before investing. This and other important information can be found in the funds’ prospectuses, which may be obtained by calling 1-855-DBX-ETFS (1-855-329-3837) or by viewing or downloading a prospectus. Read the prospectus carefully before investing.
RisksInvesting involves risk, including possible loss of principal. Funds that invest in specific countries or geographic regions may be more volatile than investing in broadly diversified funds. Securities focusing on a single country may be more volatile. In addition to the normal risks associated with investing, international investments may involve risk of capital loss from unfavorable currency fluctuations, from differences in generally accepted accounting principles or from economic or political instability in other nations. Emerging markets involve heightened risks related to the same factors as well as increased volatility and lower trading volume. There are additional risks because of potential fluctuations in currency and interest rates. Investing in derivatives entails special risks relating to liquidity, leverage and credit that may reduce returns and increase volatility.

Important Information cont Indexes are unmanaged and you cannot invest directly in an
index.
Shares of the funds may be sold throughout the day on the exchange through any brokerage account. However, shares may only be purchased and redeemed directly from the funds by authorized participants in very large creation/redemption units. There is no assurance that an active trading market for shares of a fund will develop or be maintained.
MSCI is a servicemark of MSCI Inc. (MSCI) and has been licensed for use by DBX. The funds are not sponsored, endorsed, issued, sold or promoted by MSCI nor does MSCI make any representation regarding the advisability of investing in the funds.

Definitions Price-to-earnings ratio (P/E) ratio compares a company’s current share price to its per-share earnings.
Standard deviation is often used to represent the volatility of an investment and depicts how widely an investment’s returns vary from the investment’s average return over a certain period.
The MSCI EAFE Index captures large- and mid-cap representation across developed markets countries around the world, excluding the United States and Canada. The MSCI EAFE U.S. Dollar Hedged Index is calculated using the same methodology as its corresponding MSCI EAFE Index, but is designed to mitigate exposure to fluctuations between the value of the U.S. dollar and non-U.S. currencies.
The MSCI Emerging Markets Index captures large- and mid-cap representation across 21 emerging markets. The MSCI Emerging Markets U.S. Dollar Hedged Index is calculated using the same methodology as its corresponding MSCI Emerging Markets Index, but is designed to mitigate exposure to fluctuations between the value of the U.S. dollar and non-U.S. currencies.
The MSCI Brazil Index is designed to track the performance of the large- and mid-cap segments of the Brazilian market. The MSCI Brazil U.S. Dollar Hedged Index is calculated using the same methodology as its corresponding MSCI Brazil Index, but is designed to mitigate exposure to fluctuations between the value of the U.S. dollar and non-U.S. currencies.
The MSCI Germany Index is designed to track the performance of the large- and mid-cap segments of the German market. The MSCI Germany U.S. Dollar Hedged Index is calculated using the same methodology as its corresponding MSCI Germany Index, but is designed to mitigate exposure to fluctuations between the value of the U.S. dollar and non-U.S. currencies.
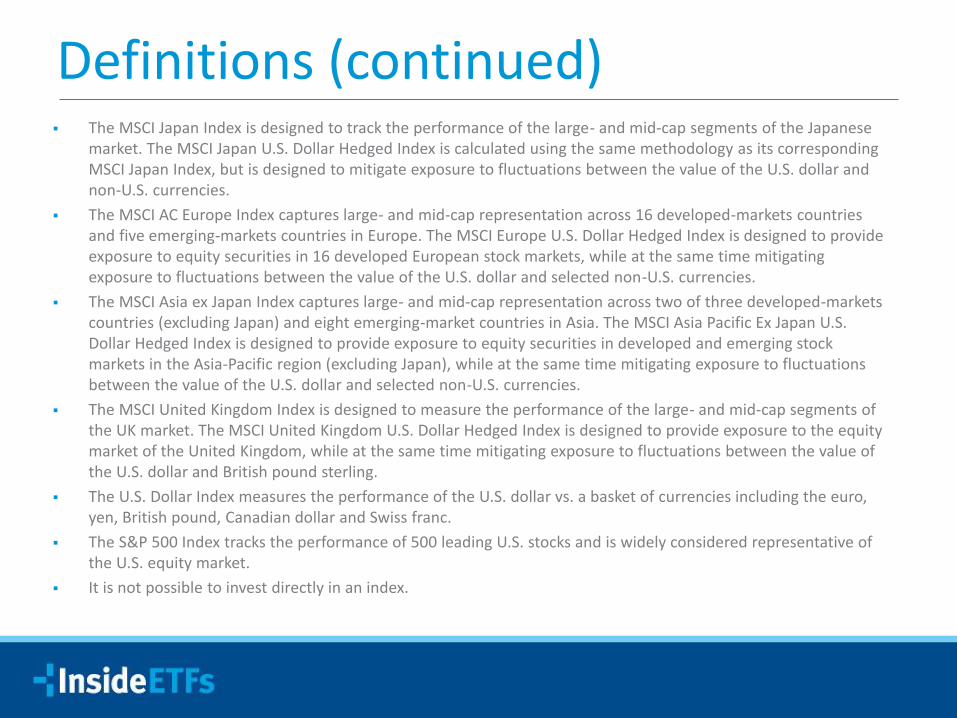
Definitions (continued) The MSCI Japan Index is designed to track the performance of the large- and mid-cap segments of the Japanese
market. The MSCI Japan U.S. Dollar Hedged Index is calculated using the same methodology as its corresponding MSCI Japan Index, but is designed to mitigate exposure to fluctuations between the value of the U.S. dollar and non-U.S. currencies.
The MSCI AC Europe Index captures large- and mid-cap representation across 16 developed-markets countries and five emerging-markets countries in Europe. The MSCI Europe U.S. Dollar Hedged Index is designed to provide exposure to equity securities in 16 developed European stock markets, while at the same time mitigating exposure to fluctuations between the value of the U.S. dollar and selected non-U.S. currencies.
The MSCI Asia ex Japan Index captures large- and mid-cap representation across two of three developed-markets countries (excluding Japan) and eight emerging-market countries in Asia. The MSCI Asia Pacific Ex Japan U.S. Dollar Hedged Index is designed to provide exposure to equity securities in developed and emerging stock markets in the Asia-Pacific region (excluding Japan), while at the same time mitigating exposure to fluctuations between the value of the U.S. dollar and selected non-U.S. currencies.
The MSCI United Kingdom Index is designed to measure the performance of the large- and mid-cap segments of the UK market. The MSCI United Kingdom U.S. Dollar Hedged Index is designed to provide exposure to the equity market of the United Kingdom, while at the same time mitigating exposure to fluctuations between the value of the U.S. dollar and British pound sterling.
The U.S. Dollar Index measures the performance of the U.S. dollar vs. a basket of currencies including the euro, yen, British pound, Canadian dollar and Swiss franc.
The S&P 500 Index tracks the performance of 500 leading U.S. stocks and is widely considered representative of the U.S. equity market.
It is not possible to invest directly in an index.

International equity investors are also
exposed to the economic and/or political risks of
individual countries.
Even when investing in U.S. dollars, an international equity investor is exposed to fluctuations in local currencies of underlying holdings.
Currency riskTypically, investors
are unaware of this risk and how
to control it.
Country riskTypically, investors
manage this through portfolio
diversification.
Hedged products are designed to mitigate the exposure to fluctuations between the value of the U.S. dollar and non-U.S. currencies while allowing pure exposure to equity markets.
International equity investing
Diversification does not guarantee protection against losses.
.
International Equity Allocation Risks?
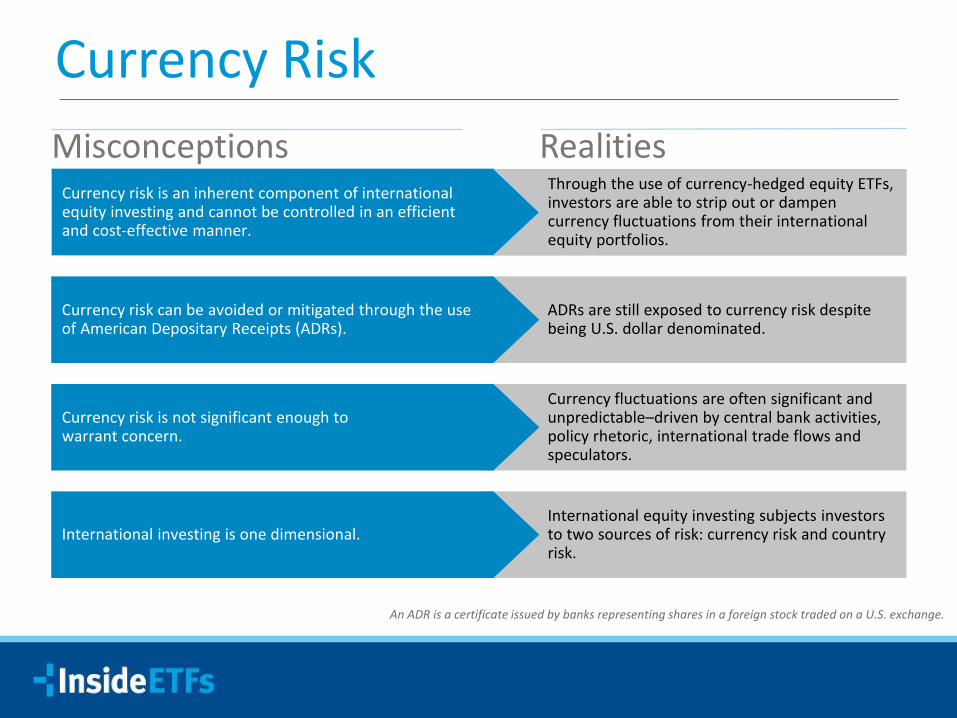
An ADR is a certificate issued by banks representing shares in a foreign stock traded on a U.S. exchange.
Currency riskTypically, investors
are unaware of this risk and how
to control it.
Through the use of currency-hedged equity ETFs, investors are able to strip out or dampen currency fluctuations from their international equity portfolios.
Currency risk is an inherent component of international equity investing and cannot be controlled in an efficient and cost-effective manner.
— ADRs are still exposed to currency risk despite being U.S. dollar denominated.
Currency risk can be avoided or mitigated through the use of American Depositary Receipts (ADRs).
Currency fluctuations are often significant and unpredictable–driven by central bank activities, policy rhetoric, international trade flows and speculators.
Currency risk is not significant enough to warrant concern.
International equity investing subjects investors to two sources of risk: currency risk and country risk.
International investing is one dimensional.
Misconceptions Realities
Currency Risk
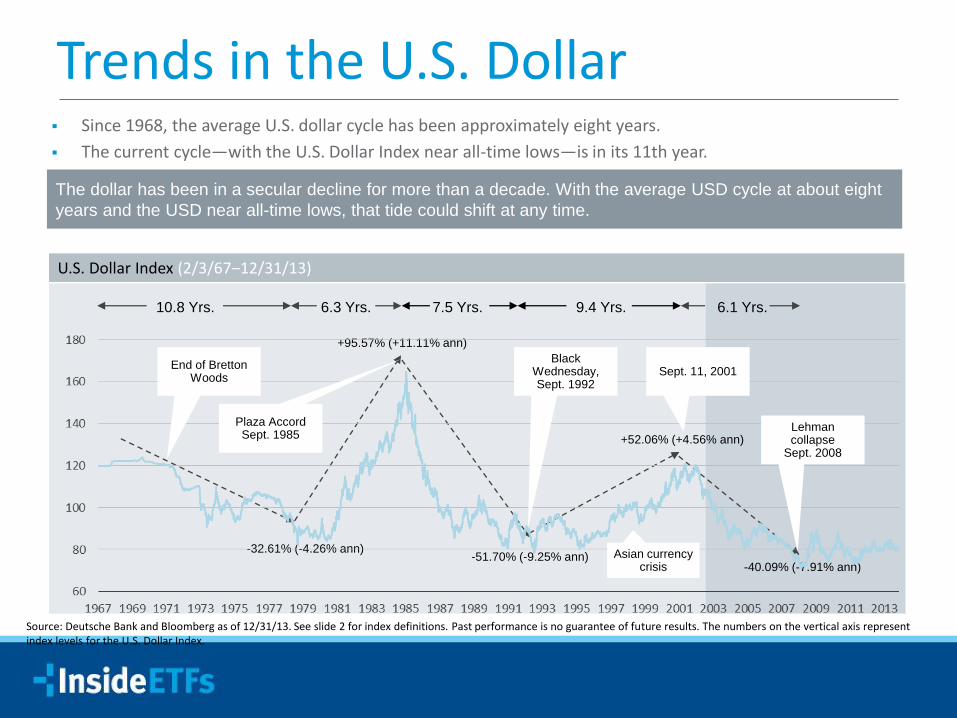
Trends in the U.S. Dollar Since 1968, the average U.S. dollar cycle has been approximately eight years.
The current cycle—with the U.S. Dollar Index near all-time lows—is in its 11th year.
The dollar has been in a secular decline for more than a decade. With the average USD cycle at about eight
years and the USD near all-time lows, that tide could shift at any time.
U.S. Dollar Index (2/3/67‒12/31/13)
-32.61% (-4.26% ann)
6.1 Yrs.
+52.06% (+4.56% ann)
-40.09% (-7.91% ann)-51.70% (-9.25% ann)
+95.57% (+11.11% ann)
9.4 Yrs.7.5 Yrs.6.3 Yrs.10.8 Yrs.
Black Wednesday, Sept. 1992
Sept. 11, 2001
Plaza Accord Sept. 1985
End of Bretton Woods
Asian currency crisis
Lehman collapse
Sept. 2008
Source: Deutsche Bank and Bloomberg as of 12/31/13. See slide 2 for index definitions. Past performance is no guarantee of future results. The numbers on the vertical axis represent index levels for the U.S. Dollar Index.

MSCI EAFE
Source: Deutsche Asset & Wealth Management as of 12/31/13. Past performance is no guarantee of future results. For comparison purposes, each entry begins with a value of 100.
79%
33%
Unhedged vs. Local Currency

What is Your Currency Risk Exposure?Euro
Austria
Belgium
Finland
France
Germany
Greece
Ireland
Italy
Portugal
Spain
The Netherlands
Australian dollarAustralia
British poundUnited Kingdom
Hong Kong dollarHong Kong
KronaSweden
KroneDenmark
KroneNorway
New Zealand dollarNew Zealand
ShekelIsrael
Swiss franc
Switzerland
Yen
Japan
Singapore dollar
Singapore
EUROPE
16 countries / 6 currencies
ASIA / PACIFIC
5 countries / 5 currencies
Middle East
1 country / 1 currency
See slide 2 for index definitions.

Japanese Indices
Source: Deutsche Asset & Wealth Management as of 12/31/13. Past performance is no guarantee of future results. For comparison purposes, each entry begins with a value of 100.
64%
27%

MSCI Currency-Hedged Indices International equity investments and FX forward contracts These indices combine international equity investments with FX forward contracts in an attempt to mitigate the
impact on performance of the currency exposure of MSCI equity indices against a U.S. dollar-based investor.
Month Start[i] Month Start[i+1] Time
Equity indices + hedge = Hedged indices
The MSCI hedged indices provide benchmarks for funds that aim to help investors mitigate the effects of FX movements on their equity exposures and therefore have access solely to the equity returns.3
— The index goes long a series of U.S. dollar one-month forwards.1
— The index is long equity constituents.
— The notional value of the forwards represents the relative market-cap weights of the equities within the index.2
— The index does not adjust the hedge intramonth.
— Forward positions are rolled over using the new value of the index and any changes in the portfolio.
Month start[i] Month start[i+1] Time
(1) A forward currency contract is a negotiated agreement between the contracting parties to exchange a specified amount of currency at a specified future time at a specified rate.
(2) An index where 50% of the underlying equity market cap is denominated in euros would buy U.S. dollar one-month forwards against euros in a notional amount equalling 50% of the index’s equity market capitalization.
(3) MSCI hedged indices do not adjust the hedge intramonth and therefore actual currency exposure may fluctuate. “FX” is the exchange of one currency for another, or the conversion of one currency into another currency.

Thank you.
Questions?

Ugo Egbunike Moderator Director of Business Development ETF.com
Juliana BambaciPanelistIndex Applied ResearchMSCI
Jonathan CitrinPanelistFounder & CEO Citrin Group
Luke OliverPanelistDirector, Portfolio Manager Deutsche Asset & Wealth Management