ubs roadshow - mpm groupmpmgroup.co.id/.../06/2014.05.08-mpmx-ubs_presentation_.pdfubs roadshow 15...
TRANSCRIPT

UBS Roadshow 15 -16 May 2014
www.mpmgroup.co.id
PT Mitra Pinasthika Mustika Tbk

Mission
To provide high quality and friendly transportation products and services that make our customers happy
MPM CREDO
Vision
Become a friendly household name through resourceful and passionate people led by respectable and humble leaders
MPM Core Values
1. Passion for Excellence
2. Customer Focus
3. Continuous Improvement
4. Respect & Humble
5. Gratefulness
6. Integrity
7. Adaptability
8. Teamwork

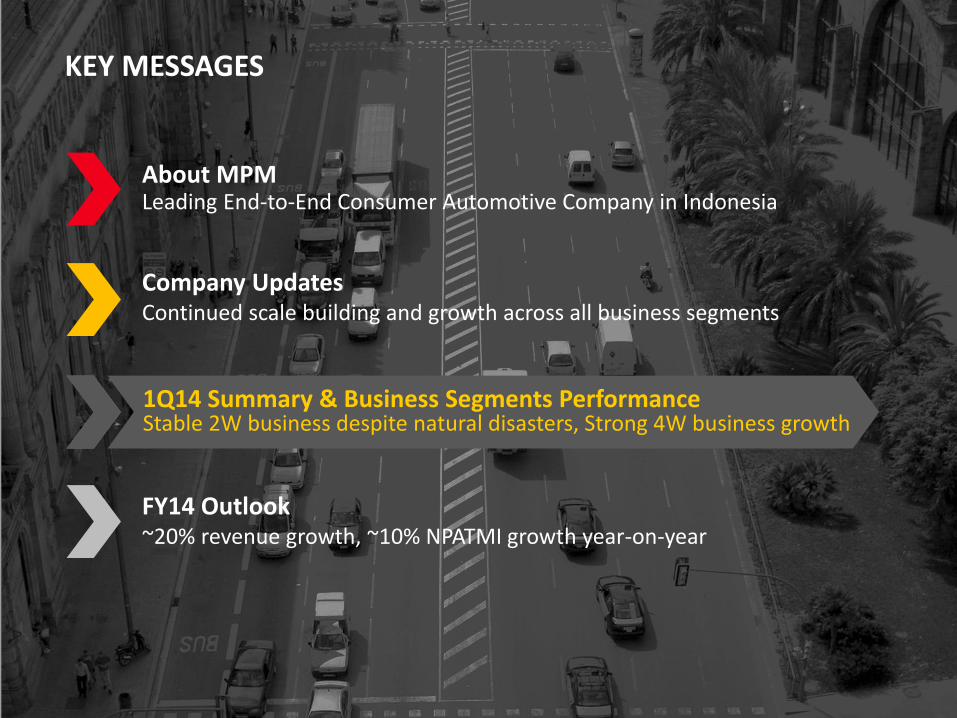
KEY MESSAGES
3
About MPM Leading End-to-End Consumer Automotive Company in Indonesia
Company Updates Continued scale building and growth across all business segments
1Q14 Summary & Business Segments Performance Stable 2W business despite natural disasters, Strong 4W business growth
FY14 Outlook ~20% revenue growth, ~10% NPATMI growth year-on-year

26 YEAR SUCCESSFUL LEGACY AND EXPERTISE IN AUTOMOTIVE...
4
1987
Founded by William Soeryadjaya as 2W
distribution business
1988
FKT was established
1992
MPMMotor 1st retail outlet was
opened
Establishment – Pre 2012
1994
Acquired initial shareholding in SAF, originally established
in 1982
2010 - 2011
Mulia was established; distribution business was transferred from
MPM to Mulia
Jan ‘12
Acquired MPMRent and MPMFinance
May ‘12
MPMInsurance was established
Dec ‘12
JACCS acquired significant
minority shares in SAF + options
May ‘13
Listed in Indonesian Stock Exchange, Ticker: MPMX
Aug ‘13
MPMAuto was established, signed Dealer and Service
Agreement with Nissan Motor Indonesia
2012 - Present
Apr ‘14
Signed merger deed of
MPMFinance and SAF

5
...CREATING AN END-TO-END NATIONWIDE ECOSYSTEM SERVING VAST CONSUMERS IN AUTOMOTIVE SECTOR...
2,4M+ active 2W customers,
~500 new 4W customers since
inception
3200+ Federal Oil Centers, 10,000+ 3rd
party retailers, 10M+ 2W customers
1,400+ corporate clients
220K+ finance & lease customers, 33K+ insurance
clients
DISTRIBUTION & RETAIL AUTO CONSUMER PARTS AUTO SERVICES FINANCIAL SERVICES
2W Honda distribution in E. Java + E. Nusa
Tenggara with 288 dealer relationships
2W Honda retail dealers with 40 outlets
nationwide
2W engine lubricant brand principal with
13,000+ outlets nationwide
4W engine lubricants (currently in bulk)
Independent 4W rental/lease company
with 34 outlets nationwide
Independent 4W financing business with 162 outlets nationwide
Independent 2W financing business with 44 outlets nationwide
Non-life insurance including 2W, 4W, cargo,
& property with 10 offices nationwide
N/A
4W Nissan & Datsun dealership, opened 1st
outlet in Mar ‘14
Data as of 1Q14
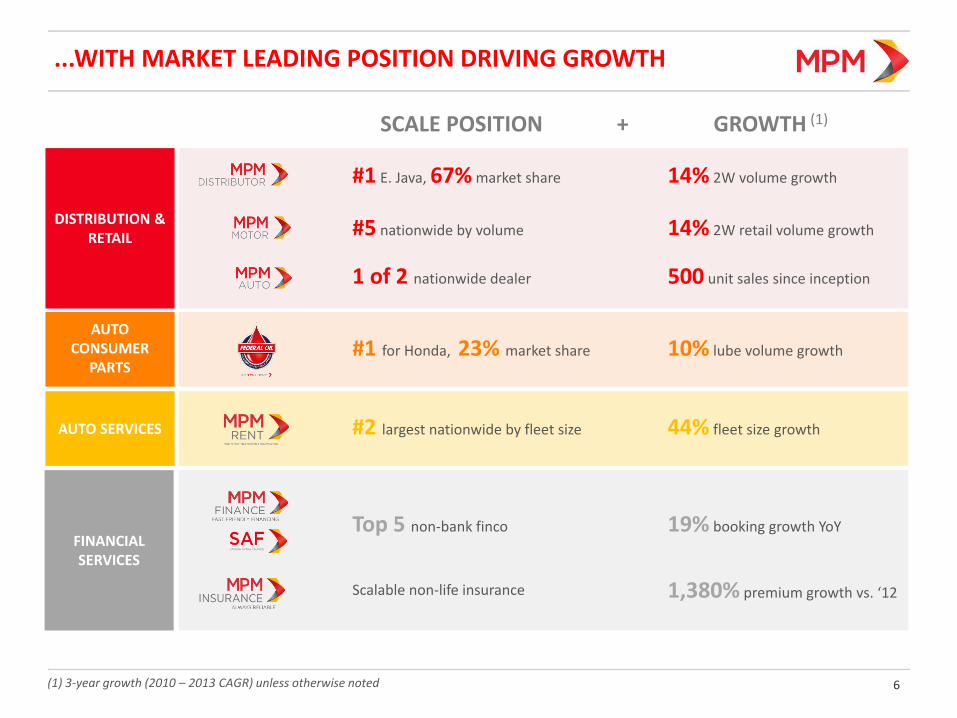
...WITH MARKET LEADING POSITION DRIVING GROWTH
6
14% 2W volume growth
GROWTH (1) SCALE POSITION +
#1 E. Java, 67% market share
14% 2W retail volume growth #5 nationwide by volume
500 unit sales since inception 1 of 2 nationwide dealer
10% lube volume growth #1 for Honda, 23% market share
44% fleet size growth #2 largest nationwide by fleet size
19% booking growth YoY Top 5 non-bank finco
1,380% premium growth vs. ‘12 Scalable non-life insurance
DISTRIBUTION & RETAIL
AUTO CONSUMER
PARTS
AUTO SERVICES
FINANCIAL SERVICES
(1) 3-year growth (2010 – 2013 CAGR) unless otherwise noted

7
15%
10%
32%
43%
Revenues FY13
IDR 13.9T
BALANCED SEGMENT PROFIT CONTRIBUTION IN THE ECOSYSTEM
Revenues 1Q14
IDR 3.6T
NPATMI FY13
IDR 526B NPATMI 1Q14
IDR 152B
Distribution & Retail Auto Consumer Parts Auto Services Financial Services
7% 7%
10%
76%
+29% YoY
+32% YoY
20%
9%
28%
43% +41% YoY
8% 7%
11%
74%
+13% YoY

8
STRONG GOVERNANCE AND MANAGEMENT IN PLACE WITH ACTIVE MAJOR SHAREHOLDERS
BOARD OF COMMISSIONERS BOARD OF DIRECTORS
Shareholder Composition
BoC brings strong mix of operational, strategy, M&A, and governance expertise
BoD members bring over 79 years of combined professional experience
47.2%
15.3%
37.5%
PT Saratoga Investama Sedaya Tbk and Affiliates
Morninglight Investments S.a.r.l
Public & Others

KEY MESSAGES
About MPM Leading End-to-End Consumer Automotive Company in Indonesia
Company Updates Continued scale building and growth across all business segments
1Q14 Summary & Business Segments Performance Stable 2W business despite natural disasters, Strong 4W business growth
FY14 Outlook ~20% revenue growth, ~10% NPATMI growth year-on-year
Company Updates Continued scale building and growth across all business segments
9
Company Updates Continued scale building and growth across all business segments

4Q13 – 1Q14 KEY EVENTS: BUILDING FOUNDATION FOR FUTURE GROWTH
10
2 Feb ‘14 26 Nov ‘13 Oct ’13 – Mar ‘14
1st MPM Dealership for Nissan opened in Enggano, JKT
MPMRent driving school opened in Bogor, W. Java
MPMFinance and SAF merger announced
FKT received Top Brand Award for 2W lube category
MPMX added into MSCI Small Cap Indices
HR talent development and GCG continuous improvements, CPM
finalized Mar ‘14
28 Mar ‘14 24 Mar ‘14 17 Mar ‘14
More details to be discussed in subsequent slides
1 2
3

Start of Sales (SOS)
11
MPMAUTO: THE FIRST OF ITS KIND BUSINESS MODEL IN BUILDING NISSAN-DATSUN DEALERSHIPS
Nissan Tj. Priok Opened Mar ‘14
Alam Sutera Coming soon
Sep ‘14
Local Partnership Scheme • Increase brand presence • Reduce CAPEX • 100% MPMAuto management
control • Fast pace expansion
Finco Partnership Scheme • Max 4 other fincos • Pre-approved customer names • 1-day loan disbursement post
document completion
Product Differentiation • Body Shop • Spare part whosaler center • Nissan U-Cars • MPMA customer loyalty card • Virtual community, website &
social media
5 mio
10 mio
70 mio
20 mio
Population
FINANCE COMPANY NETWORK CUSTOMER
BCA Finance & KKB 1,062 3,000,000
ADIRA Finance 669 1,600,000
BFI Finance 185 500,000
OTO Multiartha Finance 177 200,000
MPM Finance 62 30,000
Finance Company Alliance
1

12
Loan Portfolio, IDR B
95.9%
MPMF AND SAF MERGER WILL CREATE LEADING INDEPENDENT AUTOMOTIVE FINANCING COMPANY IN INDONESIA
FY14E
4,209
29.7%
4.2%
48.6%
17.4%
1Q14
3,435
28.3%
3.6%
48.3%
19.9%
FY13
3,278
28.2%
3.5%
47.5%
20.8%
Finance lease
Used 2W financing
Used car financing
New car financing
FY14E
1,836
90.0%
9.0% 1.0%
1Q14
1,369
90.0%
9.0% 1.0%
FY13
1,279
90.0%
9.0%
1.0%
New 2W financing
Used 2W financing
Electronic goods
FY14E
6,045
1Q14
20.7%
5.7%
27.3%
33.9%
12.1% 4,804
0.3% 20.2%
5.1%
25.6%
34.5%
14.2%
FY13
4,557
0.3% 20.3%
5.0%
25.3%
34.2%
15.0%
Electronic goods
Used 2W financing
Finance lease Used car financing
New 2W financing
New car financing
• Focus on new and used car purchases as well as used car and motorcycle refinancing
• Strong relationship with funding providers as well as numerous retail car dealers and showrooms
• Focus on new Honda motorcycle and used motorcycle financing
• Strong relationship with dealers especially in East Java
• Strengthen foothold in financing business
• Become more efficient and competitive through a stronger capital base and network expansion in Indonesia
• Lead to positive business synergy with other MPMX business entities
+
+28% YoY +44% YoY
0.3%
+33% YoY
+
2

13
MPMF AND SAF MERGER PROFORMA (ILLUSTRATION) 2
FOR ILLUSTRATION ONLY
Merger Impact to MPM IDR Billion Assumptions
[+] New Capital Injection 27 IDR 510 B at 20% yield
[+] CoF Savings 12 100 bps savings on bank borrowings
[+] Cost Synergies 1 50 bps savings on combined opex
[-] Dilution Impact (39) MPM ownership from 84.86% to 60%
Full Benefit FY14E 1 Year 1 impact
ROE before Full Benefit 12%
ROE with Full Benefit 12%
Leverage pre-capital injection 3.6x
Leverage post-capital injection 2.5x
Based on post tax (25%), annualized FY14E figures
14
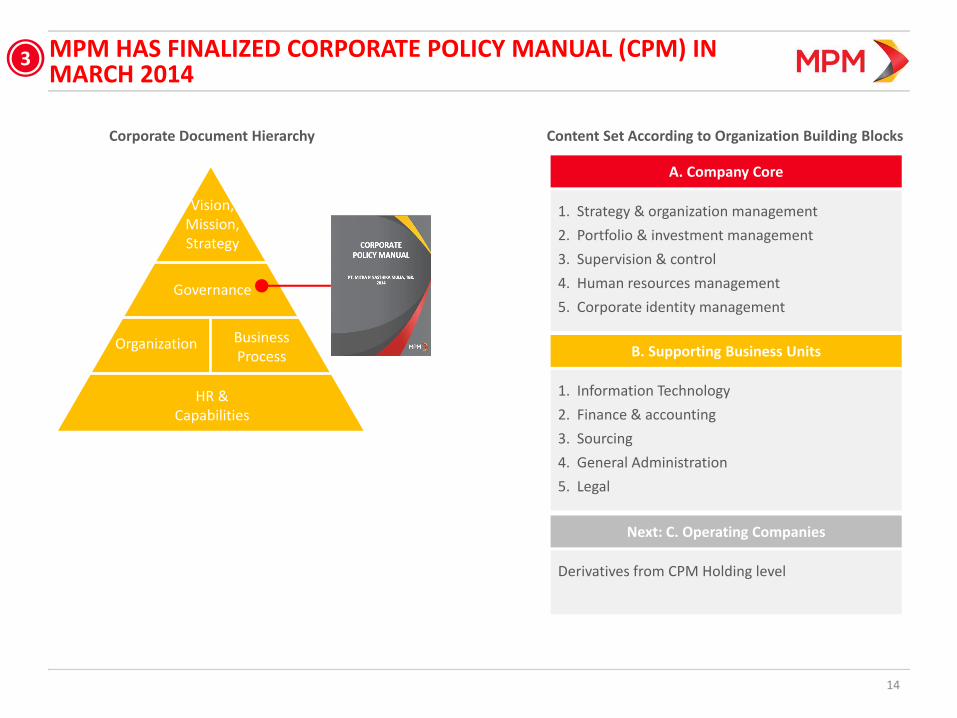
MPM HAS FINALIZED CORPORATE POLICY MANUAL (CPM) IN MARCH 2014
Vision, Mission, Strategy
Governance
Organization Business Process
HR & Capabilities
Corporate Document Hierarchy Content Set According to Organization Building Blocks
A. Company Core
B. Supporting Business Units
1. Strategy & organization management
2. Portfolio & investment management
3. Supervision & control
4. Human resources management
5. Corporate identity management
1. Information Technology
2. Finance & accounting
3. Sourcing
4. General Administration
5. Legal
Next: C. Operating Companies
Derivatives from CPM Holding level
3

15
In IDR B (%) denotes percentage of net IPO proceeds.
MPM HAS USED UP 77% OF THE PROCEEDS RAISED IN THE IPO
20%
3% 8%
13%
16%
17%
23% 970,000,000 shares
(21.7% of enlarged TSO) were offered to public market
at IDR1,500 per share
The 2013 P/E valuation is about 10.7X, with MPMX
price at IDR 1,300
Has been executed
To be executed
220 MPMRent acquisition
of SAK (1,280 cars)
225 MPMRent purchase
new cars
115 Loan repayment
175 MPMAuto build dealers
300 FKT 17% stake acquisition
45 MPMRent organic & inorganic opportunities
275 FKT factory
1,355 Net IPO proceeds
KEY MESSAGES
About MPM Leading End-to-End Consumer Automotive Company in Indonesia
Company Updates Continued scale building and growth across all business segments
1Q14 Summary & Business Segments Performance Stable 2W business despite natural disasters, Strong 4W business growth
FY14 Outlook ~20% revenue growth, ~10% NPATMI growth year-on-year
1Q14 Summary & Business Segments Performance Stable 2W business despite natural disasters, Strong 4W business growth
16
1Q14 Summary & Business Segments Performance Stable 2W business despite natural disasters, Strong 4W business growth

17
1Q14 & FY13 CONSOLIDATED REVENUE RESULTS
IDR B
10,777
FY12
2,480
159 377 205
13,879
FY13
(119)
% Growth from LY
+9% +7% +45% +26%
% Growth from LY
+27% +12% +67% +25%
Distribution & Retail
245 28 88 59
3,642
1Q14
(11)
3,233
1Q13
Auto Consumer Parts
Auto Services Financial Services
Elimination
+13%
+29% Stable revenue growth in all business units

18
1Q14 & FY13 CONSOLIDATED NET PROFIT AFTER TAX RESULTS
IDR B
% Growth from LY +5% +7% +20% +20%
Distribution & Retail
3 4 4 6
152
1Q14
17
115
1Q13
Auto Consumer
Parts
Auto Services
Financial Services
+32%
Positive growth in all business units while maintaining strong profitability
8 (5)
-29% -57%
% Growth from LY +27% +9% +159% +54%
57
19 95 51
526
FY13
(9)
374
FY12
+41%
(56)
+4% +16%
(5)
Elimination Head Office
Minority Interest

19
2W DISTRIBUTION & RETAIL: OUTPERFORM MARKET IN FY13, MANAGING IMPACT JAN-FEB ’14
736 905 968
FY12 FY13 FY14E
+7% +23%
216 216
1Q13 1Q14
0%
Sales Volume (000 units, YoY%)
211 266 288
FY12 FY13 FY14E
+8% +26%
Revenue (IDR B, YoY%)
NPAT (IDR B, YoY%)
FY13 / 1Q14 Highlights
FY14 Initiatives
• FY13: 23% sales volume growth vs. 10% industry
• 1Q14: volume impacted by flooding in Jan ‘14 and Kelud volcano eruption in Feb ’14, by Mar ‘14 volume back to normal
• Manage more efficient distribution by adding 1 warehouse to cater Southern area of E. Java
• Plan inventory level especially for Festive season preparation in July ‘14
• Increase retail sales volume by adding sales points and review financing sales portion
• Focus on operational improvement and CRM activities
Mulia
99 110 126
FY12 FY13 FY14E
+5% +12% 25
24
1Q13 1Q14
-3% MSO
9,112
FY12 FY13 FY14E
11,602 12,807
+10% +27%
1Q13 1Q14
2,897 2,695
+7%
70 74
1Q13 1Q14
+5%

20
4W DEALERSHIP: READY TO LAUNCH
Sales Volume (Car Units, YoY%)
0 -0.3
(14)
FY12 FY13 FY14E
NPAT (IDR B, YoY%)
FY13 / 1Q14 Highlights
FY14 Initiatives
• Signed agreement with Nissan Motor Distributor Indonesia in Aug ‘13
• MPMX 1st dealer was opened in Enggano, North Jakarta ... For Nissan & upcoming Datsun brand
• Sold 365 units since its inception in Nov ‘13
• Nissan launched New Teana in Mar ‘14
• Open at least 7 dealerships nationwide focusing on “3S”: showroom, services, and spare parts
• Tap into e-community channels + loyalty programs
• Partners with major financing companies & local partners
• Upcoming new lineups’ launching by Nissan:
- (0)
1Q13 1Q14
16,670
FY12 FY13 FY14E1Q13 1Q14
235
- 130
4,203
-
Revenue (IDR B, YoY%)
0
FY12 FY13 FY14E
1,444 627
1Q13 1Q14
43
387 - - 23
- (0)
FY12 FY13

21
CONSUMER PARTS: CONTINUING BRAND BUILDING & DISTRIBUTION ACTIVITIES IN FKT(1) TO INCREASE GROWTH
FY12 FY13 FY14E
+19% +8%
1Q13 1Q14
+0%
Sales Volume (KL, YoY%)
202 218 247
FY12 FY13 FY14E
+13% +8%
Revenue (IDR B, YoY%)
NPAT (IDR B, YoY%)
FY13 / 1Q14 Highlights
FY14 Initiatives
• Revenue and NPAT steady growth at +7%
• Slower volume growth due to lower repacking volume (FY13) and FO price increase (Feb 14) ... Competitors allowing “last bite” price
• Introduce new Y-MATIC product in 4Q13 to tap new market segment ... Branding “Spesialis Dingin”
• Ongoing ATL and BTL marketing and promotion activities to strenghten brand equity
• Focus on higher growth MATIC segment ... Product/SKU refinement and new product formulation introduction
• Implement key marketing and branding initiatives: Festive Season, World Cup, Racing events
• Strengthen sales and distribution organization
• Enter 4W lubricant business
• Continue feasibility study on blending plant expansion + operational efficiencies
1,286
FY12 FY13 FY14E
1,444
1,858
+29% +12%
1Q13 1Q14
415 387
+7%
62 67
1Q13 1Q14
+7%
16,670 16,678 56,393 60,632
72,033
(1) FKT = PT Federal Karyatama through its lubricant brand

22
AUTO SERVICES: STRONG PIPELINE, FOCUS ON OPERATIONAL IMPROVEMENTS
FY12 FY13 FY14E
+37% +69%
1Q13 1Q14
+41%
Fleet Size (Units, YoY%)
60 83
108
FY12 FY13 FY14E
+30% +38%
Revenue (IDR B, YoY%)
NPAT (IDR B, YoY%)
FY13 / 1Q14 Highlights
FY14 Initiatives
• FY13 fleet growth supported by 2 acquisitions, organic growth at 25% YoY
• Launched drivers training school in Mar ‘14 ... Key differentiator for corporate customers
• Average length of contract: 2.5 years
• Key Customers:
• Focus on operational improvements while growing customer base especially in MNCs
• Increase B2B brand awareness on MPMRent
• Strengthen MIS and CRM / CS capabilities
562
FY12 FY13 FY14E
938 1,256
+34% +67%
1Q13 1Q14
281
193
+45%
21 25
1Q13 1Q14
+20%
10,302
14,573
7,991
13,502
18,514
• Top New Customers:

23
MPMFINANCE: MERGER TO STRENGTHEN FRONT-END AND BACK END CAPABILITIES
2,286 2,361
4,349
FY12 FY13 FY14E
+84% +3%
506 709
1Q13 1Q14
+40%
New Booking (IDR B, YoY%)
578 674
1,280
FY12 FY13 FY14E
+90% +17%
161 183
1Q13 1Q14
+14%
100 95
196
FY12 FY13 FY14E
+105% -4%
24 23
1Q13 1Q14
-5%
Revenue (IDR B, YoY%)
NPAT (IDR B, YoY%)
FY13 / 1Q14 Highlights
FY14 Initiatives
• Strong growth in new booking ... Contributed equally between financial lease, 2W + 4W financing
• Increased revenue due to network expansion and higher lending rate
• Offset in opex and additional provisionings due to commodity business situation outside Java
• NPL performance:
• Execute merger with SAF with JACCS as 40% partner
• Diversify new product offerings, especially to support the growth of MPMAuto (Nissan & Datsun dealership)
• Strengthen risk management ... Centralized Desk Collection and recovery of write-offs
• Implementation of life insurance for car financing
• Increase collection efforts to reduce NPL to become <2.0%
2.2%
2.5% 2.4%
2.6%
Jun '13 Sep '13 Dec '13 Mar '14
Note: Assume combined MPMFinance and SAF financials for FY14E

24
SAF: TURNAROUND PERFORMANCE IN 2013
551
FY12 FY13
+86%
182 293
1Q13 1Q14
+61%
New Booking (IDR B, YoY%)
233 305
FY12 FY13
+31%
63
94
1Q13 1Q14
+49%
45
FY12 FY13
(6)
N/A
1Q13 1Q14
+83%
Revenue (IDR B, YoY%)
NPAT (IDR B, YoY%)
FY13 / 1Q14 Highlights
FY14 Initiatives
• Strong turn-around performance in new booking and
profitability
• Offset in additional provisionings / write-offs due to
commodity business situation outside Java
• NPL performance:
• Execute merger with SAF with JACCS as 40% partner
• Strengthen risk management and collection capabilities
• Maintain NPL <2%
6
12
1.7% 2.0%
1.5% 1.5%
Jun ’13 Sep ‘13 Dec ‘13 Mar ‘14
Note: Please refer to MPMFinance FY14E outlook for post-merger estimation
1.027

25
MPMINSURANCE: STRONG GROWTH THROUGH GROUP AND NON-GROUP BUSINESSES
Gross Premium (IDR B, YoY%)
5
13
FY12 FY13 FY14E
1
+146% +517%
1Q13 1Q14
+287%
NPAT (IDR B, YoY%)
FY13 / 1Q14 Highlights
FY14 Initiatives
• Additional businesses from new channels
• 10 nationwide representative offices are registered (Jakarta, Surabaya, Medan, Bandung, Denpasar, Bogor, Pekanbaru, Makasar, Malang and Semarang)
• Increase new partnerships with banks, financing companies and brokers
• Open 5 additional locations for representative offices
1
3
76
FY12 FY13 FY14E
+72% +1,411%
10
24
1Q13 1Q14
+132%
5

KEY MESSAGES
About MPM Leading End-to-End Consumer Automotive Company in Indonesia
Company Updates Continued scale building and growth across all business segments
FY14 Outlook [20 - 25%] revenue growth, [8 - 15%] NPATMI growth year-on-year
1Q14 Summary & Business Segments Performance Stable 2W business despite natural disasters, Strong 4W business growth
FY14 Outlook [20 - 25%] revenue growth, [8 - 15%] NPATMI growth year-on-year
26
FY14 Outlook ~20% revenue growth, ~10% NPATMI growth year-on-year
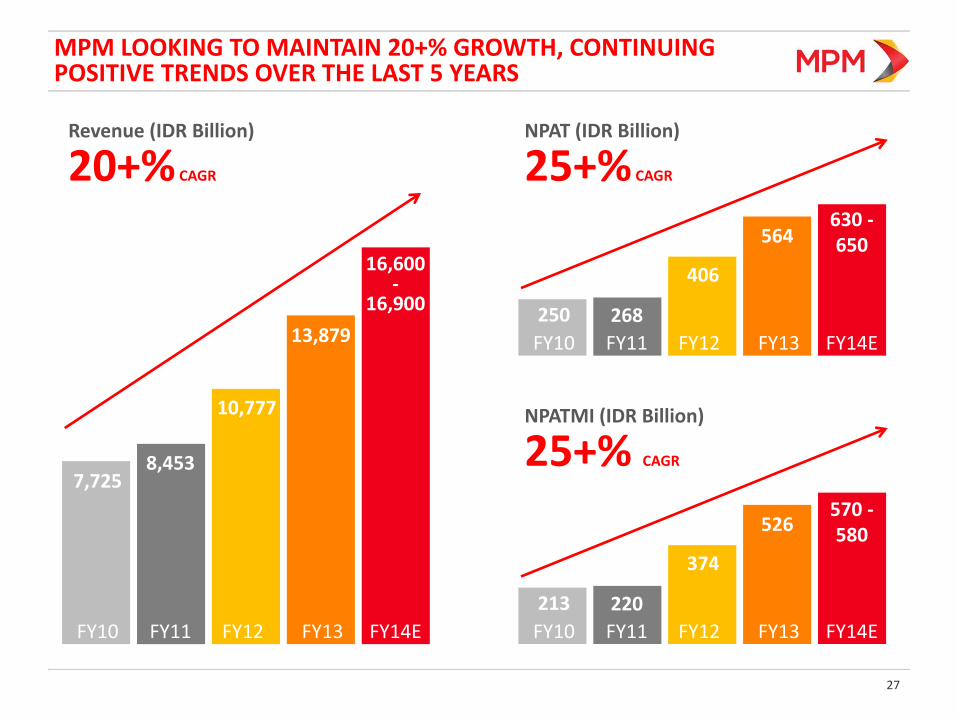
MPM LOOKING TO MAINTAIN 20+% GROWTH, CONTINUING POSITIVE TRENDS OVER THE LAST 5 YEARS
27
Revenue (IDR Billion)
20+% CAGR
16,600 -
16,900
13,879
10,777
8,453 7,725
FY10 FY11 FY12 FY13 FY14E
NPAT (IDR Billion)
25+% CAGR
570 - 580 526
374
220 213
FY10 FY11 FY12 FY13 FY14E
NPATMI (IDR Billion)
25+% CAGR
630 - 650 564
406
268 250
FY10 FY11 FY12 FY13 FY14E

1Q14 SUMMARY AND FY2014 OUTLOOK
28
Key Metrics FY12 FY13 % FY14E % 1Q13 1Q14 %
Profit & Loss (IDR Billion)
Net Revenue 10,777 13,879 29% 16,600 - 16,900
20 - 22% 3,233 3,642 13%
Gross Profit 1,618 2,024 25% 480 551 15%
GP Margins 15.0% 14.6% 14.8% 15.1%
Operating Profit 746 901 21% 217 244 12%
OP Margins 6.9% 6.5% 6.7% 6.7%
Net Profit from Cont. Operations 405 564 39% 128 157 23%
NP Margins 3.8% 4.1% 4.0% 4.3%
NPAT 406 564 39% 630 - 650 13 - 15% 128 157 23%
NPAT Margins 3.8% 4.1% 3.8 – 3.9% 4.0% 4.3%
NPATMI 374 526 41% 570 – 580 9 - 10% 115 152 32%
NPATMI Margins 3.5% 3.8% 3.4 – 3.5% 3.6% 4.2%
EBITDA 958 1,254 31% 287 338 18%
EBITDA % of Revenue 8.9% 9.0% 8.9% 9.3%

1Q14 SUMMARY AND FY2014 OUTLOOK (CONTINUED)
29
Key Metrics FY12 FY13 % FY14E % 1Q14 %
Balance Sheet (IDR Billion)
Cash 1,192 1,103 (7%) 771 (30%) 1,052 (5%)
ST & LT Loans 1,911 1,987 4% 3,107 56% 2,102 6%
MCNs 1,010 - (100%) - - 0%
Bank Funding for fincos (1) 3,216 3,551 10% 4,071 15% 3,770 6%
Book Value of Equity 1,837 4,395 139% 5,794 32% 4,564 4%
Ratios
Net Debt / Equity 2.69x 1.01x 1.11x 1.06 x
Net Debt / Equity excl. Fincos (1) 0.39x 0.20x 0.40x 0.23x
ROA 4.51% 5.05% 4.19% 5.16%
Debt / EBITDA 5.35x 4.42x 4.81x 4.34x
Debt / EBITDA excl. Fincos (1) 1.99x 1.58x 2.08x 1.55x
(1) MPMFinance and SAF

Disclaimer
30
• These materials have been prepared by PT Mitra Pinasthika Mustika Tbk (the “Company”, “MPM”) and have not been
independently verified. No representation or warranty, expressed or implied, is made and no reliance should be placed on the
accuracy, fairness or completeness of the information presented or contained in these materials. The Company or any of its
affiliates, advisers or representatives accepts no liability whatsoever for any loss howsoever arising from any information
presented or contained in these materials. The information presented or contained in these materials is subject to change
without notice and its accuracy is not guaranteed.
• These materials may contain statements that constitute forward-looking statements. These statements include descriptions
regarding the intent, belief or current expectations of the Company or its officers with respect to the consolidated results of
operations and financial condition of the Company. These statements can be recognized by the use of words such as “expects,”
“plan,” “will,” “estimates,” “projects,” “intends,” or words of similar meaning. Such forward-looking statements are not
guarantees of future performance and involve risks and uncertainties, and actual results may differ from those in the forward-
looking statements as a result of various factors and assumptions. The Company has no obligation and does not undertake to
revise forward-looking statements to reflect future events or circumstances.
• These materials are for information purposes only and do not constitute or form part of an offer, solicitation or invitation of any
offer to buy or subscribe for any securities of the Company, in any jurisdiction, nor should it or any part of it form the basis of, or
be relied upon in any connection with, any contract, commitment or investment decision whatsoever. Any decision to purchase
or subscribe for any securities of the Company should be made after seeking appropriate professional advice.