ubs global financial services conference - nordea · pdf fileglobal and european ... asset...
TRANSCRIPT

UBS Global Financial Services Conference New York, 11 May 2010
Fredrik Rystedt Group CFO
11 May 2010 UBS Global Financial Services Conference2
Disclaimer
This presentation contains forward-looking statements that reflect management’s current views with respect to certain future events and potential financial performance. Although Nordea believes that the expectations reflected in such forward looking statements are reasonable, no assurance can be given that such expectations will prove to have been correct. Accordingly, results could differ materially from those set out in the forward- looking statements as a result of various factors.
Important factors that may cause such a difference for Nordea include, but are not limited to: (i) the macroeconomic development, (ii) change in the competitive climate, (iii) change in the regulatory environment and other government actions and (iv) change in interest rate and foreign exchange rate levels.
This presentation does not imply that Nordea has undertaken to revise these forward- looking statements, beyond what is required by applicable law or applicable stock exchange regulations if and when circumstances arise that will lead to changes compared to the date when these statements were provided.

11 May 2010 UBS Global Financial Services Conference3
The Nordea prudent growth strategy
Nordic customers New European Markets
Global and European business lines
Next level of operational efficiency
Universal bankingRelationship banking

11 May 2010 UBS Global Financial Services Conference4
Result highlights
EURm Q1/10 Q4/09 Chg % Q1/09 Chg %
Net interest income 1,235 1,299 -5 1,356 -9
Net fee and commission income 475 463 3 381 25
Net result from items at fair value 548 351 56 515 6
Other income 45 45 0 27 67
Total income 2,303 2,158 7 2,279 1
Staff costs -687 -702 -2 -665 3
Total expenses -1,164 -1,219 -5¹ -1,090 7²
Profit before loan losses 1,139 939 21 1,189 -4
Net loan losses -261 -347 -25 356 -27
Operating profit 878 592 48 833 5
Net profit 643 447 44 627 3
Risk-adjusted profit 678 533 27 747 -9
¹ Down 2% - adjusting for restructuring expenses in Q4 and changes in exchange rates
² Up 3% – adjusting for changes in exchange rates

11 May 2010 UBS Global Financial Services Conference5
Net interest income, EURm
1,3561,235
1,299
Q1 2009 Q4 2009 Q1 2010
Net interest income down 5% from high levels
Remains subdued by the low interest rate levels
Underlying increase in customer operations – volumes and margins
Decrease in Group Treasury
Negative impact from day count
Total lending up 4%
Continued increase in corporate lending margins

11 May 2010 UBS Global Financial Services Conference6
Interest rate sensitivity - 3 components
Structural interest income risk (SIIR)
Reflecting the effect on NII from re-pricing gaps*
Dynamic effects on net interest income
Changes in deposit margins – mainly transaction accounts
Market risk in the interest bearing investment portfolios
Market risk has an immediately effect on the line net result from items at fair value
Increased market rates, 100bps Q1/10 Q1/09
EURm
Net Interest Income, approx 450 400
Net result from items at fair value, approx -100 -250
Total annualised income effect 350 150
* Accumulated mismatch between assets and liabilities with an interest rate duration of less than 12 months, with the assumptions that non-maturity accounts are re-priced immediately following a interest rate change, without effecting margins

11 May 2010 UBS Global Financial Services Conference7
Net fee and commission, EURm
381
475463
Q1 2009 Q4 2009 Q1 2010
Positive trend continues - Net fee and commission income up 3%
Strong performance in savings area
Asset management commissions up 6% from a strong Q4
Lending commissions up 8%
Payment commissions up 7%
Commission expenses for state schemes largely unchanged at EUR 51m
11 May 2010 UBS Global Financial Services Conference8
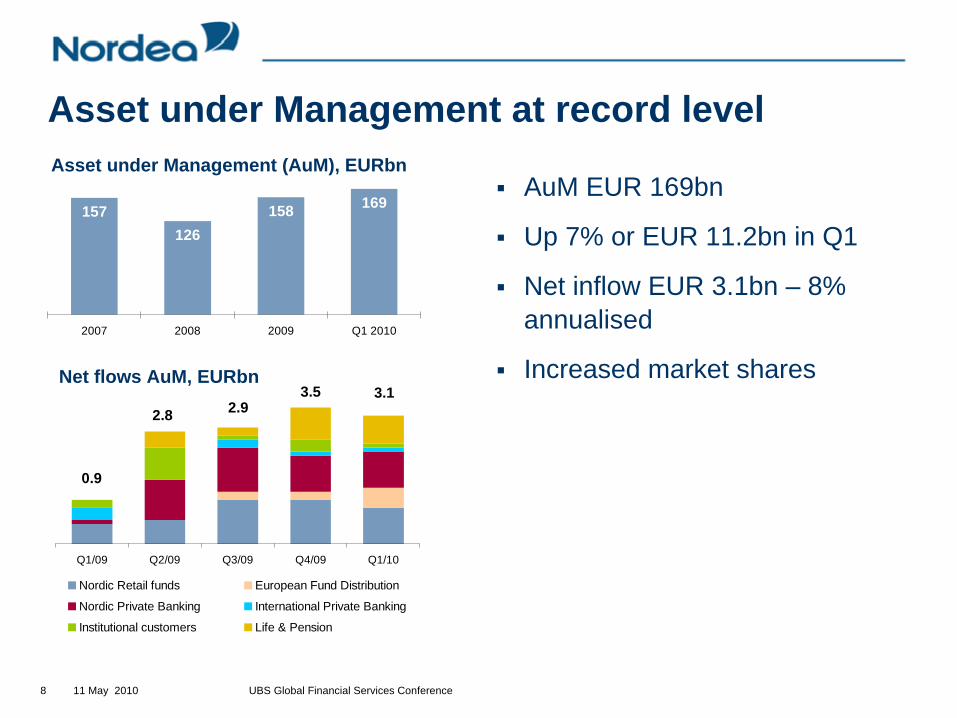
Asset under Management at record level
Q1/09 Q2/09 Q3/09 Q4/09 Q1/10
Nordic Retail funds European Fund Distribution
Nordic Private Banking International Private Banking
Institutional customers Life & Pension
3.1
0.9
2.8 2.93.5
AuM EUR 169bn
Up 7% or EUR 11.2bn in Q1
Net inflow EUR 3.1bn – 8% annualised
Increased market sharesNet flows AuM, EURbn
157126
158 169
2007 2008 2009 Q1 2010
Asset under Management (AuM), EURbn

11 May 2010 UBS Global Financial Services Conference9
Strong demand for risk management products
Capital markets activities in customer areas continues to perform
Underlying corporate demand for fixed income and FX products stabilising
High demand for credit bonds from institutional clients
Increase in Group Treasury
Continued strong Life & Pensions results
Net result from items at fair value, EURm
515548
351
Q1 2009 Q4 2009 Q1 2010

11 May 2010 UBS Global Financial Services Conference10
Total expenses according to plan
Underlying expenses down 2% -adjusting for restructuring expenses in Q4 and changes in exchange rates
Up 3% compared Q1 2009
Underlying staff costs up 1% in Q1Number of employees increased by 130
Cost/income ratio improved to 51% (56%)
Total operating expenses, EURm
1,0901,164
1,219
Q1 2009 Q4 2009 Q1 2010

11 May 2010 UBS Global Financial Services Conference11
Net loan losses, EURm
356
261
347
Q1 2009 Q4 2009 Q1 2010
Credit quality continue to stabilise
Net loan loss ratio 37bps (52bps)26bps individual (40bps)
11bps collective (12bps)
166bps in the Baltic countries (338bps)
Lower loan losses mainly found in Denmark, Sweden and the Baltic countries
No losses occurred related to the Danish guarantee scheme (EUR 29m)
52bps
37bps
54bps

11 May 2010 UBS Global Financial Services Conference12
Performing: Allowance established, payments madeNon-performing: Allowance established, full payments not made on due date
1 849 2 372
1 116
2 377
1 868 2 076
Q1 2009 Q4 2009 Q1 2010
Performing Non-performing
9461 385
486
838
1 502
921
Q1 2009 Q4 2009 Q1 2010
Individual allowances Collective allowances
Impaired loans, EURm
Total allowances, EURm
Growth in impaired loans continues to level out
Impaired loans gross up 5% to EUR 4,453m or 140 bps of total lending – 4% in local currencies
7% in Q4, 9% in Q3 and 19% in Q2
53% impaired loans are still performing
Total allowances increased 9% to EUR 2,423
Provisioning ratio continues to increase -54% compared to 52% in Q4
Collective allowances increased 10% to EUR 921m – 38% of total allowances

11 May 2010 UBS Global Financial Services Conference13
885 883847
781833 818 832
592
878895978 932 1.078
Q1/07 Q2/07 Q3/07 Q4/07 Q1/08 Q2/08 Q3/08 Q4/08 Q1/09 Q2/09 Q3/09 Q4/09 Q1/10
Operating profit Loan losses Write backs
Operating profit high and stable
Operating profit, EURm

11 May 2010 UBS Global Financial Services Conference14
Q10
7
Q20
7
Q30
7
Q40
7
Q10
8
Q20
8
Q30
8
Q4/
08
Q1/
09
Q2/
09
Q3/
09
Q4/
09
Q1/
10
Ro lling four quarter compared with FY 2006 EUR 1,957m
Long-term target for average yearly growth
2%
-100
-80
-60
-40
-20
0
20
Alli
ed Ir
ish
Ban
ksR
BS
Ban
k of
Irel
and
Com
mer
zban
kLl
oyds
KB
CS
wed
bank
SE
BU
nicr
edit
Soc
iete
Gen
eral
eIn
tesa
San
paol
oE
rste
Gro
upB
arcl
ays
Dan
ske
BB
VA
BN
P P
arib
asD
nBN
OR
Nor
dea
Ban
kS
anta
nder
SH
B
Top quartile
TSR 2007 - Q1 2010Risk-adjusted profit - on track to reach 2013 target
¹Nordic peers: Danske Bank, DnB NOR, SEB, SHB, Swedbank
38.9%38.0%
Continued delivery on long-term targets

11 May 2010 UBS Global Financial Services Conference15
Nordea expects the macro economic recovery to continue in 2010, but the development is still fragile and hence uncertainty remains
Excluding currency effects in 2010, cost growth is expected to be broadly in line with 2009 – including the effects from growth and efficiency initiatives
As previously stated, risk-adjusted profit is expected to be lower in 2010 compared to 2009, due to lower income in Treasury and Markets
However, net loan losses in 2010 are likely to be lower than in 2009. Credit quality continues to stabilise, in line with the macroeconomic recovery
Outlook 2010

11 May 2010 UBS Global Financial Services Conference16
Business development
11 May 2010 UBS Global Financial Services Conference17
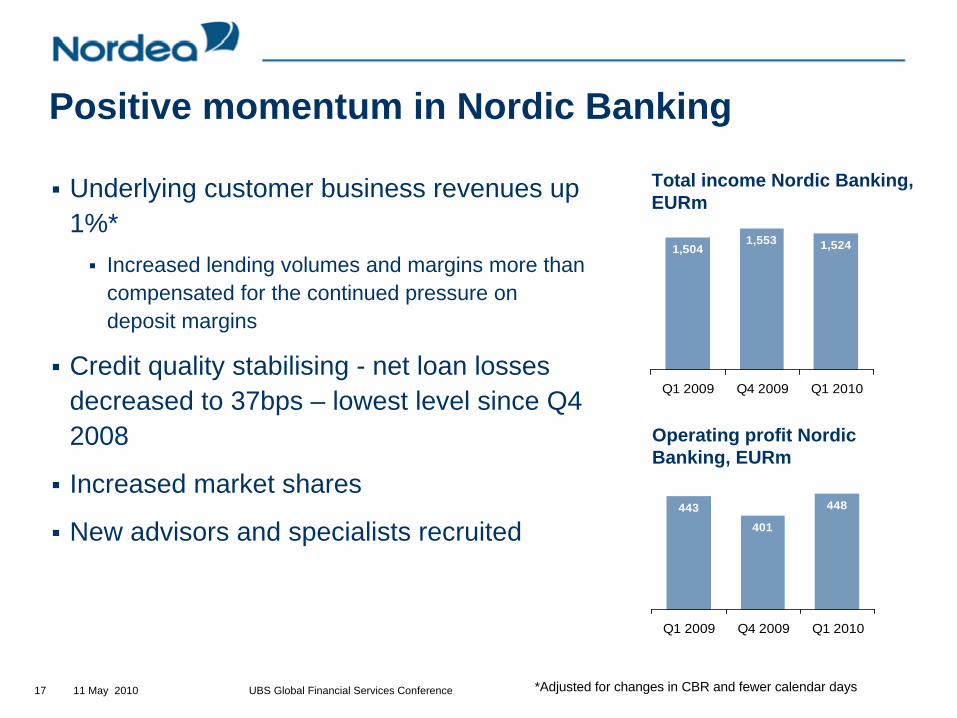
Positive momentum in Nordic Banking
Underlying customer business revenues up 1%*
Increased lending volumes and margins more than compensated for the continued pressure on deposit margins
Credit quality stabilising - net loan losses decreased to 37bps – lowest level since Q4 2008
Increased market shares
New advisors and specialists recruited
1,5041,553 1,524
Q1 2009 Q4 2009 Q1 2010
Total income Nordic Banking, EURm
443401
448
Q1 2009 Q4 2009 Q1 2010
Operating profit Nordic Banking, EURm
*Adjusted for changes in CBR and fewer calendar days

11 May 2010 UBS Global Financial Services Conference18
Q1 2009 Q4 2009 Q1 2010
Deposit income
784 766 765
The strong underlying customer volume-and margin development continues
Pressure on income from deposit remains
The strengthened Nordea brand name continues to attract customers in premium segments – confirms positive trend
37,500 new Gold and Private Banking customers in Q1 - 70% new customers in Nordea
Market shares continue to improve
Continued strong customer demand in household segment
Total income household segment, EURm
2,5792,700 2,737
Q1 2009 Q4 2009 Q1 2010
Number of Gold customers, ‘000

11 May 2010 UBS Global Financial Services Conference19
Increased customer activity
360-degree meetings at record levelsPlanned pro-active sales
Continued increase in number of transactions - funds, equity trading and structured products
Customer satisfaction improving versus competitors
Market position stronger than ever
Lending
Insurance
Savings and investments
Daily banking
Ensure all services provided by Nordea
The 3600 meeting
Building strong relationships with key customers
Nordea
2007
Peers
0.6GAP 3.9
71.267.6
70.6+0.9
-3.6
CSI index (aggregate) 2007- 2009
71.5
2009

11 May 2010 UBS Global Financial Services Conference20
549 567 604
Q1 2009 Q4 2009 Q1 2010
Increased business confidence among corporate customers in Q1
Underlying lending volumes up 2%
The demand for financing of acquisitions and investments remains subdued
Strong corporate demand for risk-management products despite decreasing market volatility
Positive macro signs drives corporate activity
Total income CMB and Large, EURm
158.4 153.5160.8
Q1 2009 Q4 2009 Q1 2010
Corporate lending, EURbn
11 May 2010 UBS Global Financial Services Conference21
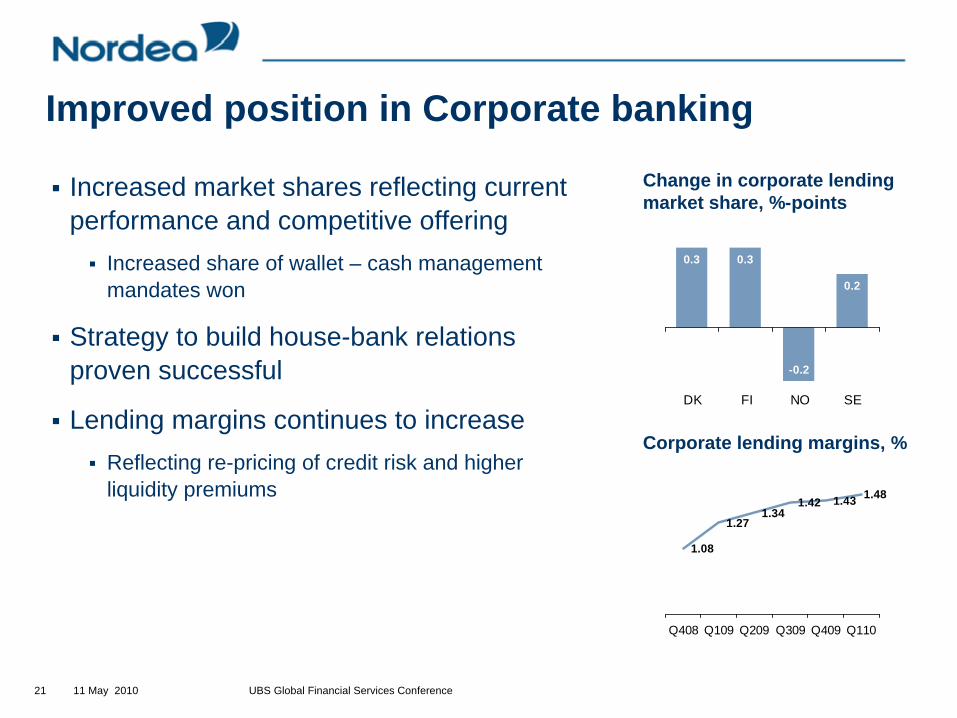
0.3 0.3
-0.2
0.2
DK FI NO SE
Increased market shares reflecting current performance and competitive offering
Increased share of wallet – cash management mandates won
Strategy to build house-bank relations proven successful
Lending margins continues to increase Reflecting re-pricing of credit risk and higher liquidity premiums
Improved position in Corporate banking
Change in corporate lending market share, %-points
1.08
1.271.34
1.42 1.43 1.48
Q408 Q109 Q209 Q309 Q409 Q110
Corporate lending margins, %

11 May 2010 UBS Global Financial Services Conference22
Institutional & International Banking
Shipping, Oil Services & International – confidence returning to the market
Somewhat increase in activity level
Margins continued up in the quarter
Financial Institutions – several mandates wonStrong market standing enabled Nordea to further strengthen the franchise and gain market share
Margins remain tight – income down 7%
New European Markets – stabilising in the Baltic’sGrowth continues in Poland
Lending margins continue to increase in the Baltic countries
Lower loan loss provisions in the Baltic countries
11 May 2010 UBS Global Financial Services Conference23
Nordea in a position of strength – implications from new regulatory proposals
11 May 2010 UBS Global Financial Services Conference24
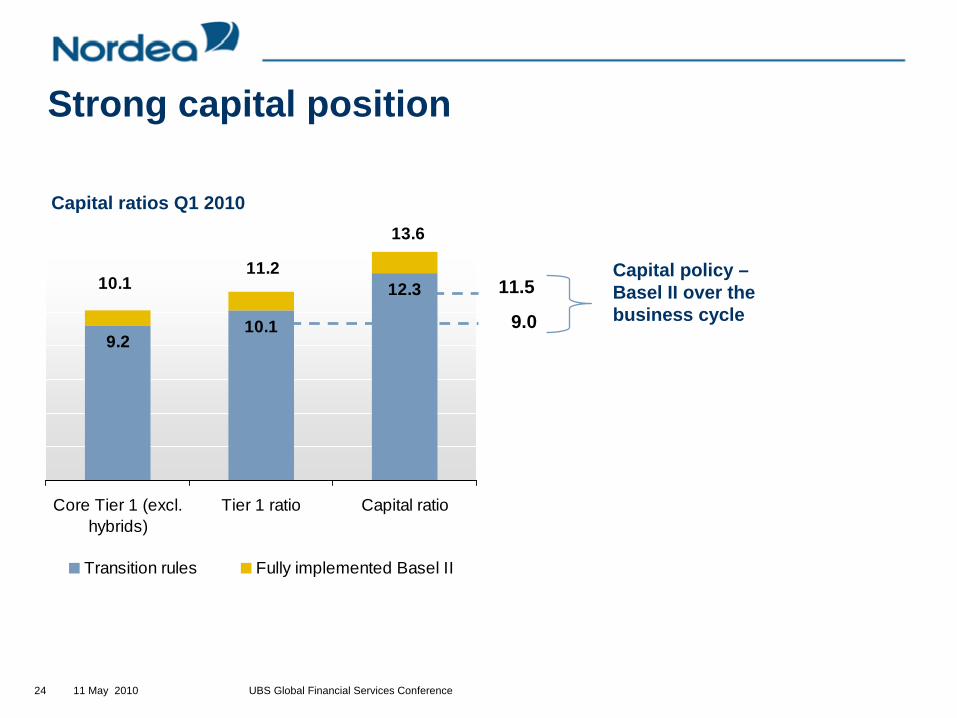
9.210.1
12.3
Core Tier 1 (excl.hybrids)
Tier 1 ratio Capital ratio
Transition rules Fully implemented Basel II
10.111.2
13.6
Capital ratios Q1 2010
11.5
9.0
Strong capital position
Capital policy – Basel II over the business cycle

11 May 2010 UBS Global Financial Services Conference25
Full access to relevant funding markets
Considering the volatile markets Nordea decided decided to take an active start of 2010
YTD (April) long term issuance € 13bn
Good volume and performance in our domestic covered bond markets. A main source of funds
Nordea Hypotek € 1.5bn 7 year covered bond
Nordea $ 1.25 bn 144A/Reg S 10 year senior bond
Nordea € 1.5bn 7 year senior bond
Nordea € 1 bn 10 year non-call subordinated bond
Nordea £ 0.5bn 5 year senior bond
Total long-term funding issued (EURbn)
22 23
31
10.4
2007 2008 2009 Q1 2010

11 May 2010 UBS Global Financial Services Conference26
High quality liquidity bufferEUR 51bn in April
96% of the holdings eligible for central bank collateral
Approx 1.5% of the liquidity buffer in exposure to PIIGS countries - short maturities
Baa1-Ba1, 1%
Aa2, 1%
Aa3, 2%
A1 - A3, 11%
Aaa, 71%
Aa1, 3%
Short securities,
11%
Covered bonds,
84%
Govern ent, 13%
Govt guarantee
d, 3%
Aaa by collateral type
22 23 21
34 3126 25
23 25 23
2322 21
24 26
31
Q12009
Q22009
Q32009
Q42009
Q12010
Q22010
Q32010
Q42010
Non-pledged Pledged
Size (EURbn)
11 May 2010 UBS Global Financial Services Conference27
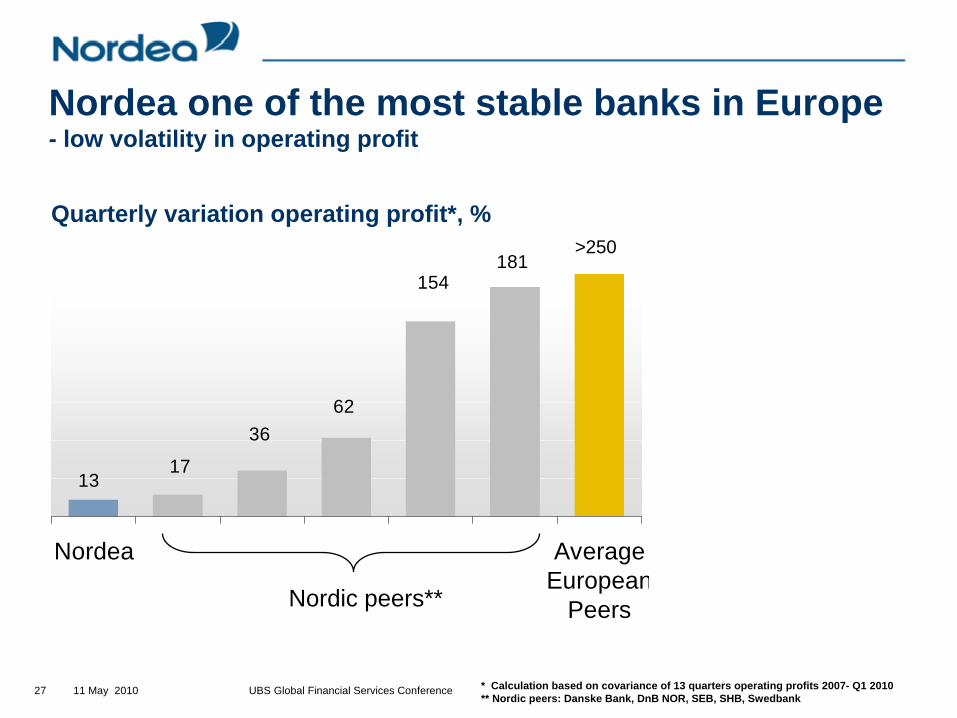
Nordea one of the most stable banks in Europe - low volatility in operating profit
181154
6236
1713
Nordea AverageEuropean
Peers
Quarterly variation operating profit*, %
* Calculation based on covariance of 13 quarters operating profits 2007- Q1 2010** Nordic peers: Danske Bank, DnB NOR, SEB, SHB, Swedbank
Nordic peers**
>250

11 May 2010 UBS Global Financial Services Conference28
Nordea fully support regulatory effortsEach element in the proposals seem logical and right but the combined effects could impact customers and harm economic growth
Need for further analysis and calibration
Quality is more important than speed when implementing new regulations
Flexibility of the implementation timetable
April 2010Dec 2009
Consultative period 1
Aug 2010 Dec 2010 2011-2012
Consultative period 2 ?
First proposal Basel comm.
First proposal EU commission
Final Basel III frame work to be decided
Implementation Phase 1
Implementation Phase 2
Second proposal Basel comm. ?

11 May 2010 UBS Global Financial Services Conference29
Successful start of the Prudent growth strategy

11 May 2010 UBS Global Financial Services Conference30
Risk adjusted profit, EURm
1,957
2,279
2,786
3,914
2,239
2006 2007 2008 2009 2010 2011 2012 2013
Group initiatives to support long-term target of doubling Risk-adjusted profit in seven years
Future distribution
New customer acquisition
CMB Sweden
Growth plan Finland
Growth plan Poland
Top league IT performance
Product platforms
Infrastructure upgrade
Customer driven Markets business
10% CAGR required

11 May 2010 UBS Global Financial Services Conference31
Activities related to the initiatives are well on track and have started in all areasFuture distribution
10 branches transformed to new branch format
Number of 360-degree advisory meetings up 60% in new format
Time spent on direct customer interaction up 6%
Growth in number of customers
Steady inflow – 37,500 new Gold and Private Banking customers
Growth Plan Finland
More than 130 new advisors and specialist recruited
Total income in Nordic Banking Finland up 2%

11 May 2010 UBS Global Financial Services Conference32
Activities related to the initiatives are well on track and have started in all areasGrowth Plan Corporate Merchant Banking (CMB) Sweden
Increased share of wallet – cash management mandates won
Growth Plan Poland
Preparatory work develops according to plan for new branch openings in the latter part of 2010
Dedicated teams formed to capture potential in local large cap – first deals closed
Efficiency and foundation
A renewed IT-contract with IBM paving the way to efficiency gains and a stronger IT foundation
Lean IT project proceeding according to plan

11 May 2010 UBS Global Financial Services Conference33
Key messagesStrong start of the year
Credit quality continue to stabilise
Continued delivery on long-term targets
Risk-adjusted profit up 27% - on track toward long-term target
Increased inflow of new customers – confirms the positive trend
Focus on Prudent growth and next generation of growth initiatives