txdot in-house ss 25 - research library · txdot in-house ss 25.1 a study of drilled shafts...
TRANSCRIPT

TxDOT In-House SS 25.1
A STUDY OF DRILLED SHAFTS CONSTRUCTED BY THE SLURRY
DISPLACEMENT METHOD
BRIDGE DIVISION TEXAS HIGHWAY DEPARTMENT
February 1973

A STUDY OF DRILLED SHAFTS CONSTRUCTED BY THE SLURRY
DISPLACEMENT METHOD
by
H. D. Butler Senior Designing Engineer
Conducted by
Bridge Division Texas Highway Department
in cooperation with the United States Department of Transportation
Federal Highway Administration

The op~n~ons, findings, and conclusions expressed in this publication are those of the author and not
necessarily those of the Federal Highway Administration.

TABLE OF CONTENTS Page No.
PREFACE • • • • • • • • ABSTRACT ••••••••• LIST OF FIGURES AND TABLES
· . . • • • • • •
· . . . . . . · . . . . . . · . . . . . . CHAPTER I.
CHAPTER II.
CHAPTER III.
CHAPTER IV.
CHAPTER V.
CHAPTER VI ..
CHAPTER VII.
INTRODUCTION • . . • • • • • 1
DESCRIPTION OF TEST SITES • • • 4 Location • • • .. • • • • • • • • 4 Soil Exploration • • • • • • • .. 4 Shear Strength Profiles •••• 6
TEST SYSTEMS • • • · . . . . . . Test Shafts · . . . . . . . . . Reaction System Loading System • Instrumentation
· . . . . . . . · . . . . . · . . . . . . . Data Acquisition • • • · . · . ..
CONSTRUCTION OF TEST SHAFTS. • •
10 10 10 12 12 17
19 Equipment. • • • • • • • • • •• 19 Site G2. • • • • • • • • • • •• 19 Site G1 •••• 0 • • • • • • •• 22 Site BB. • • • • • • • • •• 24 Concrete Placement • • · . . LOAD TESTS •• . . . . · . . . . EXTRACTION AND INSPECTION · . . Shaft Gl Shaft G2 • Shaft BB •
• Q • • • • • • • • • . . . . . . . . . . . BOND TESTS .. · . · .. .. . .. .. .. .
25
31
41 41 45 46
52
CHAPTER VIII. CONCLUSIONS AND RECOMMENDATIONS. 55
CHAPTER IX. IMPLEMENTATION • · . . . . . . . 58
APPENDIX A DETERMINATION OF SOIL REDUCTION FACTOR · .. . · . . . . 59

Page No.
APPENDIX B BORING LOGS. • • . . . • • • · · 64
APPENDIX C PLOTS OF ACCUMULATED SOIL SHEAR STRENGTHS. . • . • .. • · · 71
APPENDIX D SPECIAL PROVISION TO ITEM 416 (416---002) OF TEXAS HIGHWAY DEPARTMENT STANDARD SPECIFICATIONS.z 1972. • • 0 • • 78
ii
Figure No.
2.1
2.2
2.3
2.4
3.1
3.2
3.3
3.4
3.5
3.6
3.7
3.8
4.1
4.2
4 .. 3
4.4
4.5
5.1
5.2
5.3
LIST OF FIGURES AND TABLES
Location of Test Sites
Shear Strength Profile for Site Gl
Shear Strength Profile for Site G2
Shear Strength Profile for Site BB
Details of Anchor Shafts and Test Shafts
Details of Reaction Beam and Anchor Posts
Reaction System
Loading System
Soil Profiles and Location of Shaft Instrumentation
Mustran Cell Attached to Reinforcing Steel
Settlement Gage
Honeywell Data Logging System
Clean-Out Bucket
Tremie Guide
Installing Temporary Tremie Seal
Concrete Placing Operation
Drilling Slurry Being Displaced by Fluid Concrete
Load-Settlement Curves, Shaft Gl
Load-Settlement Curves, Shaft G2
Load-Settlement Curves, Shaft BB
iii
Page No.
5
7
8
9
11
13
14
14
15
16
16
18
21
26
28
29
30
35
36
37

LIST OF FIGURES AND TABLES
Figure No. Page No.
5.4 Load Distribution Curves, Shaft Gl, Test No. 1 38
5.5 Load Distribution Curves, Shaft G2, Test No. 1 39
5.6 Load Distribution Curves, Shaft BB, Test No. 1 40
6.1 Drilling Around Shaft Prior to Extraction 43
6.2 Lifting Device in Place 43
6.3 Removal Shaft 44
6.4 Inspection Shaft 45
6.5 Tip of Shaft Gl 48
6.6 Shaft Gl 48
6.7 Tip of Shaft G2 49
6.8 Shaft G2 49
6.9 Close-up of Shaft G2 50
6.10 Tip of Shaft BB 50
6.11 Shaft BB 51
iv

Table No.
5.1
5.2
A.l
A.2
Dates and General Information on Load Tests
Percent of Applied Load Carried by Frictional Resistance
Frictional Load Transfer and SR Values For Test Sites Gl, G2, and BB
Frictional Load Transfer and SR Values For Load Tests at SH 225 Site Located Approximately 2.5 Miles East of Sites Gl and G2.
v
Page No.
33
34
62
63

PREFACE
This report presents a detailed description of all work
done relative to the construction and test loading of three
drilled shafts constructed in Houston, Texas, using a
"slurry displacement" method of construction. It is hoped
that the information contained herein will be useful to
others who choose to use this method for drilled shaft con
struction.
This report is the result of the combined efforts of
many people. The design and construction of the test
shafts were under the general supervision of Mr. A. C. Kyser,
former Engineer-Manager of the Houston Urban Office. The
design work was supervised by Mr. W. V. Ward and construc
tion was supervised by Mr. R. A. Vansickle and Mr. F. W. Geron.
The soils investigations and load tests were under the super
vision of Mr. G. P. Berthelot. Mr. Horace Hoy made signifi
cant contributions toward developing and implementing the
design procedures which resulted from these tests.
Major contributions were made by Professor L. C. Reese
and Mr. Fadlo Touma of the University of Texas Center for
Highway Research. They were responsible for constructing
and installing the instrumentation, collecting and analyzing
the test data, and reporting the results to the Texas Highway
vi
Department. Much of the material in this report was taken
from that reported to the Texas Highway Department by
Messrs. Reese and Touma and from field notes taken on the
job by Mr. Touma.
Farmer Foundation Co. of Houston, Texas, was the
contractor for this work and the fine cooperation of
Mr. Glyen Farmer and his personnel is greatly appreciated.
vii

ABSTRACT
A "slurry disp1acement ll method for constructing drilled
shafts in water bearing and/or caving soils without the use
of casing was proposed by foundation drilling contractors
for use in the Houston~ Texas area. This is a method
whereby the sides of the excavation are supported by a mud
slurry which is subsequently displaced by the fluid concrete
that forms the completed drilled shaft. Three instrumented
full-size shafts were constructed in Houston to evaluate
this method of construction. The shafts were then test
loaded to determine the maximum load capacity and load trans
fer characteristics of each shaft. Upon completion of the
load tests~ the shafts were removed from the ground~ in
spected~ and pull-out tests performed on two reinforcing
bars.
Results of the tests and inspections performed indicate
the following:
1. Drilled shafts can safely be constructed
using the "slurry displacement" method of
construction.
2. For the design of drilled shafts in the
Houston area, it can safely be assumed that
the shear strength developed is 0.7 times
viii

the shear strength of the soil as determined
from Triaxial and/or THD Cone Penetrometer
Tests.
3. A significant portion of the load applied to
a drilled shaft is transferred to the sur
rounding soil through skin friction: 88% for
shaft Gl, 95% for shaft G2, and 61% for shaft
BB.
4. The frictional load capacity of drilled shafts
constructed in the Houston area is independent
of the construction method used.
ix

CHAPTER I
INTRODUCTION
The use of drilled shafts as foundations for highway
structures has experienced a rapid and unprecedented growth
during the past two decades. Through several years experi
ence, the Texas Highway Department has demonstrated that
the use of drilled shafts offers a significant economic
advantage over the use of driven piles in soils where holes
can be drilled without the use of specialized drilling
techniques. These soils, generally referred to as well
behaved soils, are mostly stiff clays, shales, and cemented
sands.
Results of a comprehensive research study of the load
transfer characteristics of drilled shafts, Research Study
No. 3-5-65-89, revealed that further economic benefits could
be realized through utilization of the ability of a drilled
shaft to transfer load to the surrounding soil by skin
friction as well as through point bearing. This resulted
in two major benefits: (1) the belled footings required for
point bearing design can be eliminated in many cases, and
(2) drilled shafts may be used in areas where soil conditions
are not suitable for drilling and therefore require the use
of driven piles.

Early in 1971, the Texas Highway Department began in
vestigating the feasibility of using straight drilled shafts
in other soils, not so well-behaved, such as sands, silts,
and soft clays. One promising method suggested by Houston
area foundation contractors for constructing shafts in
these materials was a "slurry displacement" method. This
is a construction method whereby the sides of the excava
tion are supported by a mud slurry which is subsequently
displaced by the fluid concrete that forms the completed
drilled shaft. Similar methods have been used in the
United States to construct cofferdams, retaining walls, and
building foundations.
A series of load tests on full-size shafts constructed
by the "slurry displacement" method was planned to evaluate
the method. Specific objectives of the tests were as
follows:
1. Verify the calculated load capacity for
straight shafts constructed by this method.
2. Obtain information necessary for the prep
aration of construction specifications for
this method.
3. Establish a relationship between the measured
frictional load capacity of a shaft constructed
2

by this method and the frictional load
capacity calculated from soils data.
The test shafts were to be loaded to failure and then ex
tracted from the ground for inspection.
Methods for instrumenting drilled shafts were developed
by the Center for Highway Research of the University of Texas
as a part of Research Study No. 3-5-65-89. Through an Inter
agency Cooperation Contract the Center for Highway Research
furnished personnel under the supervision of Professor
L. C. Reese to fabricate and install instrumentation in
the three test shafts, collect data during load tests,
analyze the data, and report the results to the Texas High
way Department.
A contract was awarded Farmer Foundation Co. of
Houston, Texas in July, 1971, for construction of the
three test systems and extraction of the test shafts after
all load tests were completed.
3

Location
CHAPTER II
DESCRIPTION OF TEST SITES
Three locations in Houston, Texas, were selected for
the construction of the test shafts (Fig. 2.1). Two of
these sites, Gland G 2, are located in the area of a
proposed interchange at the intersection of Interstate
Highways 45 and 610 (South Loop). The third site, BE, is
located on the north bank of Brays Bayou at the proposed
crossing of State High·t.1ay 288. These sites were chosen
because soil conditions prohibited the use of drilled shafts
designed to carry load in point bearing only_ Successful
completion of these tests would permit the use of straight
drilled shafts rather than the more expensive driven piles.
Furthermore, the caving conditio:1s expected at these sites
would provide a good test for the "slurry displacement"
method of construction.
Soil E~loration
Three test borings were drilled very near the location
of the test shafts. THO cone penetrometer data were taken
from one ho1er undisturbed samples for triaxial testing,
supplemented by THO cone penetro~eter data, were taken
in one hole" and standard penetration tests were run in
4

N
610
,-0 nG [W=====-ROSEN6E" __
Figure 2.1. . f Test Sites Locat1on 0
5

the other hole for other work being done at the University
of Texas Center for Highway Research. Appendix B contains
the boring logs for the holes drilled for the THD cone
penetroml'9ter and triaxial tests, the two methods presently
used by the Texas Highway Department.
Shear Strength Profiles
Profiles of shear stren9th were develop.2d for each
test site using soils data obtained from triaxial tests
and/or THD cone penetration tests. Th2se profiles are
shm-om plotted in Figures 2.2 - 2.4.
6

.j..l 4-1
..c;
.j..l 0.. OJ
o
10
20
30
40
Q 50
60
70
80
o Shear Strength (tons/sq ft)
1 0 1 5 2.0
~-----.,.. .
< .... ..... -.--...:::----
<
.--
---,-- :-.:;>
<:;:. ---THD Penetrometer Test
.-'
<.'-- --- ---
Triaxial Test Supplemented by THD Penetrometer Test
... '" < ...... -...... --- .....
-----<.---- -~~ -- ~-
'-. , >
\ \
-)
Figure 2.2. Shear Strength Profile for Site G 1
.. .. -. .. " . . .. "' .... · . , " ., .... .. .. : I •
: : .f
.. " . '" .... iii·
.' · .. , .... .. , . ..... .. ..
t."' ..
......... .,: ....
".. . ... ". ,,, .. . ' . .. ...".
. . . . . . · ." :
· '.
· " ., . ·
7

o
10
20
30
40
50
60
70
80
~<:---- ---
".----
---
-,. <
-:--..:.-::.-
...... , , , )
~-\
.... __ -.J '-- ------:..-"'-----
-> <-... --;>
,,) (
Shear Strength (tons/sq ft)
2.0 2.5
<J THD Penetrometer Test '>
----:;::"> ----l-:~aXia 1 Te s t S upplemen ted ott::...-.. __ _
--I by THD Penetrometer Test
-- ---:. -::-----,-----90 ~ ______ U_ ______ L_ ______ ~ ______ ~~ ____ ~ ______ ~ ____ ~
Figure 2.3. Shear Strength Profile for Site G 2
8

Shear Strength (tons/sq ft)
1
10
20 ..........
....... _-------- ....... --'> ---
-----~ ---30 - -- - - - - ---7
40
THD Penetrometer Test
50
60 -----\ \
70
Figure 2.4. Shear Strength Profiie for Site BB
• to •• . ' . , .. .. ..' .. " " . · · . f • .. ..
'''. :# . .. : . • {l4. · . · .. " .. · . .. .... .. · . .. ...... , ... .. 'I .. · .. . ., ...... .... .: : :. "I: -. ,. .. .. to .' .' , # .. " .. · . , ..... ' .. . ... · . .. "' ... · ., ." .. ,_.-r ..
9

Test Shafts
CHAPTER III
TEST SYSTEMS
Two shaft sizes were constructed for testing. The
shafts at sites G 2 and BB were 2'-6 11 in diameter and the
shaft at site G 1 had a diameter of 3'-0". The size and
length of shafts to be test loaded are generally designed
to fail at a load equal to, or slightly in excess of, two
times the required service load on the shaft; however., the
design of these shafts had to take into consideration the
additional requirement of extraction of the shafts after
testing. Data obtained from testing the two diameters
selected would be used for scaling up to the required size
should one or more of the test shafts fail to prove out
the required design load. Details of the test shafts are
shown in Figure 3.1.
Reaction Sx;stem
The reaction system for these tests was :made up of a
reaction beam, two anchor posts, and two an::hor shafts
designed to become part of the permanent structures.
Details of the anchor shafts are sho~n in Figure 3.1. The
reaction beam, designed to be used for a variety of load
10

~ ..
r UoZ
[
LCCd;,,:>,., 1= 17641' Locd;'cn'?· 11.6ti7· locd>',on 3: ~~.S~' ~
L/.!
!Anchor Shdf;~ ~. r. T~st Shd,t· :....-·f Anchar SIIdTf
'-1~ r-r-, I J J
F==== :::fd l-,-='ro} == = = = = = = = = = = [~1:= =.:E3==. ==== = = = = = :;.-11 k·~= = = = ~ I I I I _ .. - ' I?~cflon B~tn --_ I
I ' i : I 1 ' I I : :
l== = 'l-F, -. ~.J= = = = = = = = = =t:.·:::·;=f_ ':;=l:~!r= = = == = = = = = r~ i =:t.J====~ J • ,(Do_IS f"r .?.6'''cols. @ 'r...,. J I : ~: LOCdt/onl.Oow"lsfor,J.O' ~ • t?'50070no./deks : , I
"c"Is.~ Lcca>'lons .?~.J . Furnish"d b<; the Sfdte Col ab ..... ~/s slid/I n>afch shaf'rs>'_1.
£1.,,, A
,..,-'" Spm,,1 liooplng I!IGpllch 0"" flat turn lop ~ bottom
s~~ St!'cf,ons for r,rllcal relnf.
B"r!l AI orAL ~
~I A,:.?307ao
Az:/fiI~-o.o."'"
BARS A
~
-/~"'x"'I"or$~"!6-
rid" Bars
r-~ "'
L .
<' \
'y
BARS B
--' /?,mF 8d.-
DETAIL A DETAIL B
'Form 10;:> <7 ' of ;~s; slldf; w/~Tu~ or "9~1 This porT/on oT sht:lH and Sono ·wbe .Il:> 1M pad for as Dnll S/kIftf30In.) or Dnll Shaf>'f~6'In.)
,f' _ _ 3~ .,L' ?~ ___ .(l.~"
t ' IYI~ I .. ~'Z· ·
II 11. , n· n
" 1\ 11 1\ 1-1 II H
U
--_. __ . . 1 .-- i
c ~ ~ ° I ~;:-'I. __ '_""J~
JH~-d/d.,.?O Ho:,s t!dch Flan96
~~'dld, 10 HD/~s In W~b . __ ~ __
-ll/.jF/4.?(HS'50')
F O
.. !
1
~ ~
lit n
--1 Ii: ! W· r WJ
FRONT
ANCHOR POST SIDE
Not" Z dnchor posl' re'1Ulrt!d for ~h I,sl 1oc411Dn. FurnIsh t?OO·~-tiI'l.S bolts'" ASTM A·~Z:S
with nuts dnd Z ~sh.!!~ 'or 'dCh bell' .. I' t!<!JCh ;",sr s.dup.
Posts and bolts will btl consid'r~d inciakmtdl to Orill Shdff f3Gin). Th~pos '-$ WIll aot b .. pcllnr~ or 9dIYdn;L~d.
tiLNeRAL NOTeS
&"ncrtl;e Tor cdstlol dr7chor shdft-s shdl/ b~ CldSS C .
Coner",t., for th# ;"51' shdlff' sIIdll conIc/in 7SdCks 0' ctl~nr plr cubIC ydrd dina slldll hay, d <t!<!J d~!I strr"9M of 3600 p .S.l: l71in. A99r"9dt, fr>r Ih. tesf Shdll b, ","I't~d to %'"ff1dA.
(Loc<6t,on <t!) (Loc,,>'ion ~) (lOCdrlon I) lMslsm strwss for r~infDrcin9 s;,~1
is .?OOOO p .s /. dnd rlfrin'orc/n9 s'l-,el caq"s Slldll .... t~nd to I'h, botto"" 0' I'h,shd'l's .
ellr.o
ANCHOR . SHAFT
56~ Lktail A
·O"r AI or AI
~L~~D"YB S-D~hlIB
TEST SHAFT . 88rA .S
l:S 'Ii .
Ii J
"Ii ,I i II , "
i
'.:,~/~;h~_'::,:::m ~~
..., . \ :0&«( ( f I \\ I ~·'O'""". (o/p)
ANCHOR SHAFT
Figure 3.1.
ANCHOR SHAFT SECTION A- A
SECTION B-B ' (loCdt'lons .!~~)
--(I t3ars
~/8""Splrdl
&'rsAI
.1"Clr.
~
SECTION B-B (Locdtion I)
TEST SHAFT
TABLE OF ELEVATIONS
TLST LOCATIONS
1'0 -.$6.0 ="0 -3.z.0
locdtion I' South "'iolcl/~ bd'l of "'n; It! of / ·610 LdSfbound.
Locdfion Z' Soufh bay of 8"nt.?7 of / ' 610 edstbound.
Locdhem ~, W~st bd'l of Ben t 5 "f l~ft Fronfd9' Str. 5.H. -!~8.
t80tJ'r:vn of ~II ~/,,_rlons n'>dt;I b" ~5ft.
ESTIMATED QUANTITIES _I..t"m ~Jt IOUdnfl'""s
Drill Shaf;(.50In.) L~7.0 QaJ£$ii ... ftr3G!n.l- ~L- I Glt!.O
ZZ.d
Co"frdcfor shall proyid#l ntf~5$."r", prof~tion durin9 fIst 'or d",...I • ..... t'nd,ng .. boYt! shdft.
No laps will b" d//oH<t!d in the fr:>p ~;o, f~ Y~rTICd/ r~/"lbrc/~ in t-he Tesl- ShoI,r.
TEXAS HIGHWAY DEPARTMENT HOUSTON URBAN PROJECT
DRILLED SHAFT TEST
APPARATUS
... , ... M.G."' . ~ .. ( C,,[o £ .1 w.
r ..... r · Z '. Z ' ''I '~
:,~;~~: :;.::,,:::~:~'<:~':~~~~f.~~
Details of Anchor Shafts and Test Shafts
I-' I-'

tests, has a load capacity of 1000 tons and a span length
which can be varied from 14 to 25 feet. Details of the
reaction beam and anchor posts are shown in Figures 3.2
and 3.3.
Loading System
Load was applied to the test shafts with hydraulic
rams jacked against the above reaction system. Two 400-
ton-capacity double-acting Bayou Industries· jacks coupled
in tandem with a cornmon pressure supply were used. Pressure
was applied to the jacks by an SC Hydraulic Engineering
Corporation Model 10-600 hydraulic pump. This pump is
air-operated and requires an air pressure of 90 psi.
loading system is pictured in Figure 3.4.
Instrumentation
This
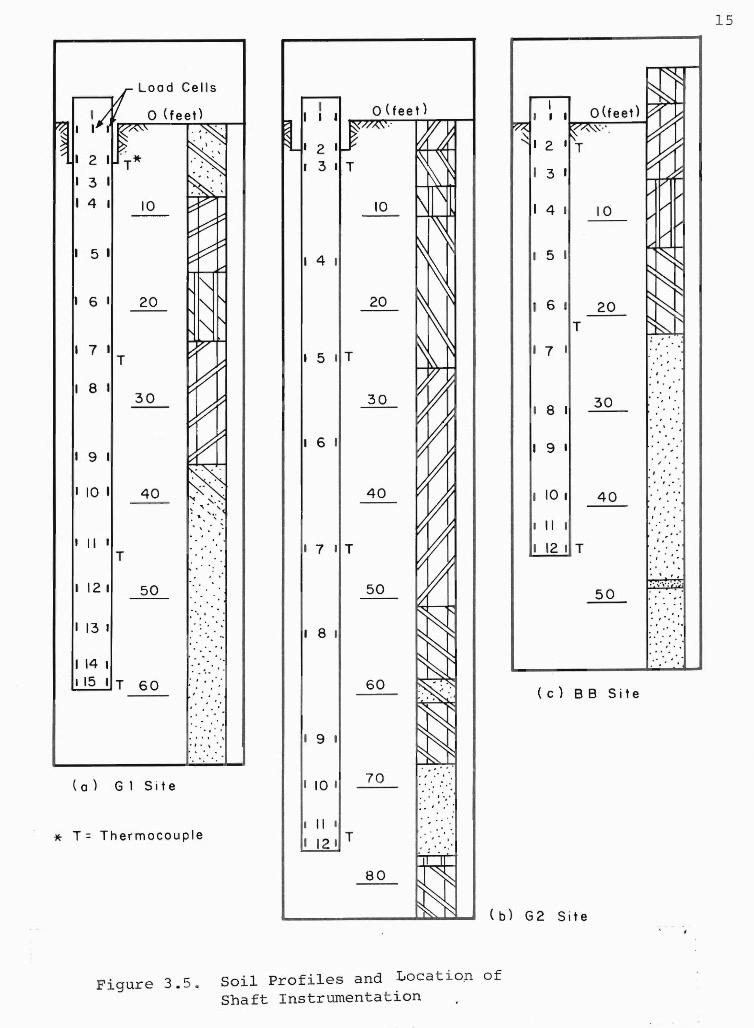
Instrumentation was installed in the test shafts to
determine the load transferred from the shaft to the
surrounding soil. This instrumentation consisted of Mustran
load cells which were developed by the University of Texas
Center for Highway Research under Research Study No. 3-5-
65-89. Load cells were located at several levels in the
shafts with four cells in the top and bottom levels and
two cells per level in each of the intermediate levels.
12

'I
_ ./- /3.5.
z,'o'
PL AN
[ ____ , _ _ y _ ~{"'nglh _V":5 - 14' '" "~j-1'
.. ,,' •• ',,- .3 ,,- ?', ' , ' ,' -~- 1 . -I-~I rs.Ymm"~!~
1 r,y !3 r, ,,, ! ,i r- "
~. ~~~~==~~~~~~
- .?·''''·'l~:O· F~n9~ It (1i5 'SO)
~ C'r~r oJ"
-I" FiI,.,e- It (JiS'SO)
.....--- s··",, · W",b ~ (HS·5t))
~1'/" r/"np'" It (IiS 'SO)
TYP. GIRDER SECT.
t 6/rckr
~'IDI'
WL' I t.. 1'4' i
Ei3~~ I~ ~ ~'-Z·It. li /l J"If"-
SECTION A'A (H!r54)
1l/;"' /5~ " !~~~~~ 1'4! r I~ (flS "5dJ..
I , .. / /
15'
11·~.,· ~ ,~/r -- ;,i Ir
.€ SECTION 0-8
~,
LU.. " : ~; , I I ~_A~! Sf!(r.,..nm * ,,',S'O' (itS '50)
. ~~' 15}'~/51" :: Pre'lOrm,d ~
rJbnc PJo' :: ".r~hr~~ , II
/ 1 1 1 1 / 1;: ~¥4d B ,r i! !/.,t._~ '~ II\l i ll
P"".J"'" I",? stvrt.51 I .10 !J.N 0., p",/ -
PLAN
-....., "
-U :i ':
ELEVATION RE ACTION BEAM
/ ...... . £ .. 1311179 Ground
- liJt""6 '() ' 0.1"9' ~ (ItS '5O)
!4f'1"~? (1-1.5 54) L"'nyfh klow I;" $pia fa ~ rl/rnls~d IS s~"i~d For .. .Kh 1,.1 s,I,
1',·1:(,&11 ",dll
1 '1 ;'1:" &lis "'/r No- MIl • . , W"wn (AHIII.MT) ;;:!' _ ...d~ , .. ~ i H .. r Nul I W,./1,u
'~ 1 ' Ii.. , · :' .q Ib-(ASTM ·..J(J7j
PLAN
s· Q ~S.Y,.,..,.lbt>vlt
or t!!t;tu~1 • ,I""
~ " Ii'
..r-i-'# &r (HTC)
BEARING DETAIL
No~s :
I MO'o< &!' s 'Y> la.IIO" .II ./JoCIui19 /'<7tnl, A::tX' TinS
M Ii
\0 II
~! ; ~ ~ .\,j ~ ;:- _J£ __
::~-~L
14 Wid? (HS'!itV jj
" -rST',"m~f
~ ~~-=-~
I '~ (NS 'S4)
==::1=
1 MJo< d"'$i9n vpl,f'/ .II ..-IN:h ;nchor /'<751. 54t7 10m .3 Miil.r d"s,?n 1"'r19lh "'1_= .JII>Char /'<7~/1 ·rs rt. ~, Allo..-3bl", slr.-ss",s .,r", ,II Mcord, nc1 ".,11. AASIM
END VIEW FRONT VIEW
ANCHOR POST DETAILS .J.pt!"c/r,c~hon$ ".tllI tin ~rll""I. ,; Z5 % .. 5, Tol,1 w"N7hl of' sf ""I nol j""'I,..f,~ ~ wr I#r "'''''''
fh" ~/I~ sp/,(;", i. '17, 7<V Ibs ~ All sl .... 1 .. 1>0" .. II>.- .,nchor /'<7P sp/'c", "'~lvcI,~
I~ spllC'" p~/ .. s sI>.illl 1M' p.;,nl",d u~''Y pI",1 S~Mdv/~ 35 or .. s ~/"'rNI", 9"'1"""'",d
7 Pr .. lOr~d f'3brK pilds slwll '" IN>nr::lN I" I"" 671JC1JrAr ,PD$I b~,;ri"'9 p/;ll~s V51"9 .." ~"",x'y
3dh",s,,,' lOr /'ull ;r",; ,;d1l",siOn 4H1d "''''JINr $#';/,"9
6 Ancllor P<I$ls bt"low sphc,,", 0Ind .. II sph~ btII/~ "I "'OK;' I",sl .,1 .. 10 k consid-"",d ,nc,cJ,IIIII fD dr,/I,d ", __ ""'r sN/ls
9. Co.1 lor .1It',1 ,,, ""'. A I 8 ,,.,..Iutkd ill und pr,c,
(HS)
•.. )., \~. rtj. ... . L...iV'".\Y :::le..: ~ 1.'E:..Nr j;u '...ISj ",...., URBAN PROJLCT
.... ,~
~ .. .~ ,",I'
:... .~ ..
.... ~
<t; \.~ ~ " ~ ~'.' .. ~ ~! .~ bid lor Slrvcl 511 (NoS)
DRILLED SHAFT TEST APPAR ATUS
, · .s"9",..n/~III~J:'f 1 LIi.b6'(J 'KJ" (NTC) (lfrc),
" t ""-1'0'5 (NYC,) rn-,-,. -. -, -, .. ---,.~ __ s"''''--l_=Of-,Z'''''''''-r---,,--t
TYPE "A" TIE (I R .. ,d)
TYPE "B" TIE (6 R,-,'d')
Fig ure 3 . 2. De t a ils of Reaction Beam and Anchor Pos ts
S·l' Dlf'tJdlNAl IKC'. ". C.J.M.. C . .J·'
I~1/~"'.C_ 7
IZ il4M IS :J0l J 7:1 ~ ~~
J--I LV

14
Figure 3.3. Reaction System
Figure 3.4 . Loading System
I
I 7 I ....::/" T ~
'~~ I 8 I W 30 :k{~ --
~ , #~
II 9 I ~b7
1'1 I ~ 10 40 ~ . . -- : ,~.~. ; .. , .. '~ . .. ".
~
I I II ,
I
T . . ;
• 121 50 ' . -- .
I 13 "
.: 'O'
" . ' "
I 14 1 ' . " . , .. , ,115 I T 60
" , I
, : ..
. , , .
I
, "', ..
.. I" I , 0' . \ . '
( a ) Gl Sit e
"* T = Thermocouple
I 2 I ,,
I 3 I T
I 4 I
I 5 I T
I 6 I
1 7 I T
I 8 •
I 9 I
1 10 t
I II I
I 12 1 T
O(feet)
10
20
40
50
60
70
80
., ,o. I
.. 0, ... • • I ••
: .. '.' 0° :
. ' .', ", ' , ' ' 0 I
, , '
I 8 I
I 9 I
I .10 I
' I II I I
: I l2 I T
( c ) B
(b) G2 Site
Figure 3. 5 . Soil Profiles and Locatiop of Shaft I nstrumentation
1 5
30 ' ' --
" .
;
,
40 I"
-- I
, , . . ,
I.
. . , .
.' ,;".;'," 50 , .
, .
. , " " , ..
' . .' . .'
B Sit e
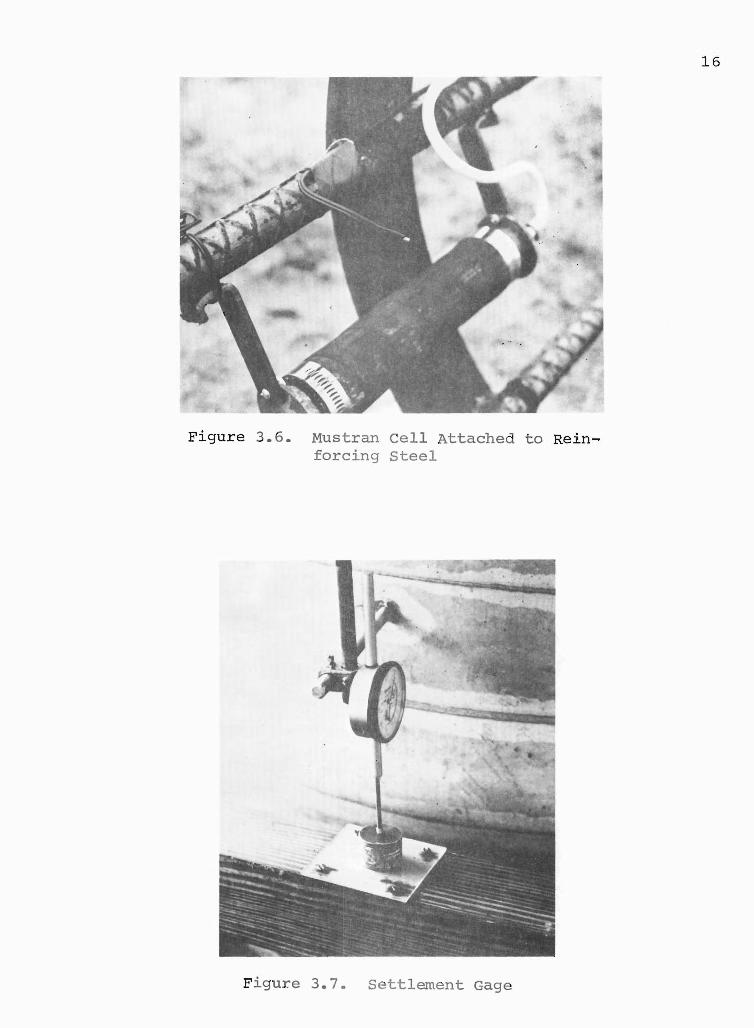
Figure 3.6. Mustran Cell Attached to Reinforcing steel
Figure 3.7. Settlement Gage
16

The location of the load cells was based on the following
considerations:
1. To provide an accurate measure of the load
reaching the tip of each shaft.
2. To provide a good calibration level at the
top of each shaft.
3. To gain information about the load transfer
characteristics of the various soil strata.
The location of the instrumentation levels, along with soil
profiles, for each test shaft is shown in Figure 3.5. A
typical Mustran cell installation is shown in Figure 3.6.
In addition to the Mustran load cells, dial gages were
used to measure the settlement of the top of each test
shaft. Two dial gages, mounted on the shaft and referenced
to four-by-four wooden beams, were used at each test shaft.
The gages were located on opposite sides of the shaft to
detect nonuniform settlement should any occur. The method
used for mounting these gages can be seen in Figure 3.7.
Data Acguisition
Data from the Mustran load cells were acquired digitally
with a Honeywell Model 620 Data Logging System. This system,
a portable modular unit shown in Figure 3.8, was housed in
a van adjacent to the test shaft. Power was supplied by
17
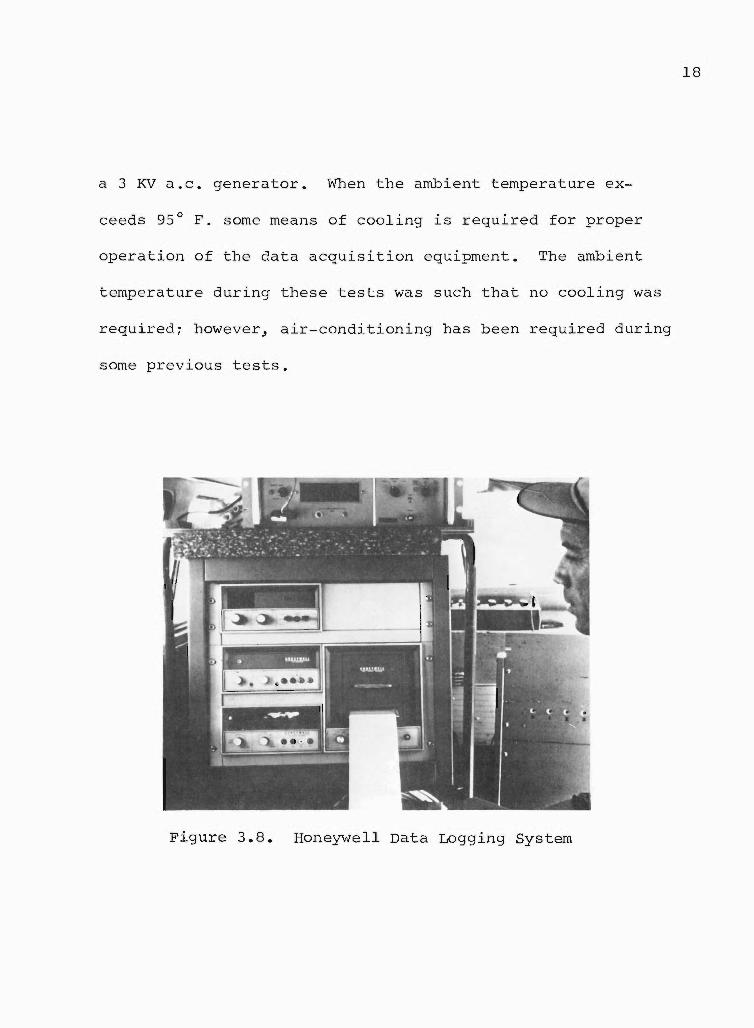
a 3 KV a.c. generator. When the ambient temperature ex
ceeds 95° F. some means of cooling is required for proper
operation of the data acquisition equipment. The ambient
temperature during these tests was such that no cooling was
required; however, air-conditioning has been required during
some previous tests.
Figure 3.8. Honeywell Data Logging System
18

Equipment
CHAPTER IV
CONSTRUCTION OF TEST SHAFTS
Construction of the test shafts using the "slurry dis
placement" method required no specialized equipment, only
that which is required for any drilled shaft construction.
Maj.or equipment used on this job included a crawler crane
with drilling equipment mounted, water tank, and a holding
tank for the mud slurry. A second crawler crane was gen
erally available to handle casing, reinforcing steel, etc.,
and to serve as a back-up crane during concrete placement.
_Site G 2
The test shaft at this site was 2'6" in diameter with
its tip 75.1 feet below the ground surface. The contractor
elected to construct this shaft first and construction
began August 17, 1971.
The first significant ground water was encountered at
an approximate depth of 56 feet. The soil above this
level was a fairly stiff clay and it was relatively easy
to drill the smooth round hole desired for a test shaft.
Just prior to introducing the first slurry into the hole,
a 39-foot length of surface casing, with an inside diameter
19
of 30 inches, was set in place to prevent wallowing of the
hole while drilling in the slurry.
The slurry used in this hole was mixed in the hole and
consisted of water and Baroid Quick-Gel, described as a high
yield Bentonite clay. Water was allowed to flow into the
hole until the water level was about four feet above the
bottom of the casing, making the water depth about 21 feet.
Two sacks (50 pounds/sack) of Bentonite were then mixed
into the water. When the drilling reached a depth of 64 feet
another sack of Bentonite was added and the water level
brought up to its original level where it was maintained
until drilling reached a depth slightly less than plan
depth. At this time the surface casing was removed and the
hole was enlarged to a diameter of 30 inches. When drilling
reached a depth of 75 feet two more sacks of Bentonite were
added, making a total of five sacks, and the water level
was brought up to 25 feet below the ground surface. Ex
cavation continued for two more feet using a clean-out
bucket in lieu of an auger (Figure 4.1). Use of the clean
out bucket permitted a detailed examination of the material
on which the tip of the shaft would rest.
Approximately one and one-half hours after the removal
of the surface casing the sides of the hole near the water
20

Figure 4.1. Clean-out Bucket
level began caving. The water level was then raised to a
level approximately 17 feet below the ground surface in an
attempt to stop the caving. About one hour later, two and
one-half hours after removal of casing, concrete arrived.
Just prior to setting the reinforcement cage in place, and
while making the final clean-out of the hole, sUbstantial
cavi ng was discovered near the water level. Examination
revealed that the area of caving was much too large for a
test shaft, therefore this hole was abandoned and filled
with concrete.
21

The location for this test shaft was moved to the
adjacent bay in the same bent and the shaft installed
August 19, 1971. It was believed that the previous failure
resulted from leaving the upper portion of the hole open
for too long a period of time. To preclude the possibility
of another failure the hole was drilled in the'dry
until the water bearing stratum was reached and then com
pletely filled with slurry. Drilling was then completed in
the slurry and without the use of surface casing. The slurry
used for drilling this hole was mixed one day before it was
used and stored in an open-top tank. Twelve sacks of
Baroid Quick-Gel were mixed with approximately 2900 gallons
of water to form the slurry.
The total time required for construction of this shaft
was approximately five hours. Three hours of this time
were used for drilling the hole and about one and one-half
hours were used in placing the concrete. The remaining
one-half hour was used in placing and aligning a section
of Sonotube used to form the portion of the shaft extending
above ground.
Site G 1
The test shaft at this site was 3'-0" in diameter with
its tip 58.7 feet below the ground surface. Construction of
22

this shaft was completed September 3, 1971.
A water bearing sandy silt was encountered at an
approximate depth of 17 feet. At this point, the hole-was
filled with slurry to a level three feet below the ground
surface. Slurry was maintained at that level throughout
the remainder of the drilling operation.
The slurry used for this shaft came from two sources:
One was a mixture of Baroid Quick-Gel used the previous day
in the drilling for an anchor shaft, and saved for re-use.
Additional slurry was provided by mixing Macogel bentonite
and water in a jet-cone mixer and pumping directly into
the hole.
An auge~ was used for the final clean-out of this hole
because a clean-out bucket of the correct size was not
available. Use of an auger in lieu of a bucket has the
disadvantage of cuttings tending to wash off during removal
and falling back into the hole. This creates a weak found
ation for the tip of the shaft and reduces the bearing
capacity of the shaft. An indication that weak material
had fallen into this shaft occurred when the tremie settled
approximately six inches when the first bucket of concrete
was dumped into it.
23
Installation of this test shaft was completed approx
imately four and one-half hours after drilling began.
Site BB
The test shaft at this site was the third and final
one constructed. It was 2'-6" in diameter with the tip
44.3 feet below the ground surface and was installed
September 21, 1971.
A water bearing sand was encountered at an approximate
depth of 20 feet. A slurry was then mixed in the hole using
four sacks (100 pounds/sack) of Macogel bentonite and water
pumped from Brays Bayou. One more sack of bentonite was
added when the hole was 40 feet deep.
Interpolation between known locations of sandstone on
each side of the test shaft indicated that sanqstone should
be found at or near the planned tip elevation, however none
was encountered at this elevation. The soil below the
bottom of the hole was probed to locate the expected sand
stone: first with a three-foot long chisel, and then with
a 10-inch diameter auger. A layer of sandstone was located
at an approximate depth of 47 feet below the ground surface.
Final clean-out of this hole was made approximately
four hours after drilling had been completed. During this
time an estimated two feet of sediments had settled in the
24

bottom of the hole. Final tip elevation was 44.3 feet
below the ground surface, or approximately 2.7 feet above
the sandstone.
The depth of slurry in this hole decreased about ten
feet during the four hours the hole was open. A similar
loss in slurry depth occurred in an adjacent hole drilled
for an anchor shaft the previous day and left open through
the night. One probable cause for these losses is the
steep gradient towards the bayou of the area in which these
holes were drilled.
25
Approximately seven and one-half hours elapsed between
the start of drilling and completion of concrete placement;
however, concrete placement required only one and one-half
hours. There was a delay of approximately four hours between
completion of the drilling and beginning of the concrete
placement.
Concrete Placement
A 10-inch diameter steel pipe tremie was used to place
the concrete in the three test shafts. Steel guides were
used to hold the tremie in the center of the reinforc-
ing steel cage: one temporarily attached at the top of the
cage and another permanently attached to the cage approx
imately 20 feet below the top (Figure 4.2). At site BB

Figure 4.2. Tremie Guide
the short length of shaft did not require these guides.
When first inserted into the mud slurry the lower end
of the tremie was sealed to prevent slurry entering it.
This seal was temporary in nature and consisted of a ply
wood plug in the pipe with the end of the tremie covered
with polyethylene sheeting held in place by rubber bands
(Figure 4.3). This seal was broken by vigorously bouncing
the tremie full of concrete.
At site BB some difficulty was experienced in getting
the concrete flow initiated. The first attempt failed and
the tremie had to be removed and emptied of concrete.

There were two possible reasons for this happening: (1) The
tremie was not clean on the inside, and (2) it was not
wetted before using. The flow of concrete in this shaft,
as well as in the other two, could have been improved by
using a tremie with a larger diamete~.
Once the tremie seal has been broken and concrete
begins to flow, the bottom of the tremie must remain sub
merged In the concrete; otherwise the slurry will contaminate
the fresh concrete. The procedure used for placing concrete
in these test shafts was to fill a one-cubic-yard dumping
bucket with concrete from a Transit Mix truck, attach
bucket to top of tremie, then slowly raise the tremie until
a good flow of concrete was obtained while dumping concrete
from the bucket into the tremie. After a bucket was emptied
the tremie was lowered to the bottom of the hole and the
above procedure repeated until good clean concrete was ob
served to flow from the excavation. Pictures of the concrete
placing operation are shown in Figures 4.4 and 4.5.
27

(a) Wooden Plug (b) Polyethylene Sheet
Figure 4.3. Installing Temporary Tremie Seal N
(X)

29

(a) Firs t Appearance of concrete
(b) Good Flow of Concrete
Figure 4. 5 . Dr illing Slurry Being Displaced by Concrete
30

CHAPTER V
LOAD TESTS
Load tests were performed on all three of the test
shafts. Shaft BB was tested at an age of 16 days while
Gland G 2 were tested at ages of 45 days and 52 days re
spectively. BB was tested at the earlier age to ascertain
the effect, if any, of testing at an early age.
All but one of the tests were performed using the
IIquick-test" procedure described in the Texas Highway De
partment "Special Provisions to Specification, Item 405,"
dated July, 1965. The exception was the third and final
test on shaft G 1 when a "cyclic" procedure was used.
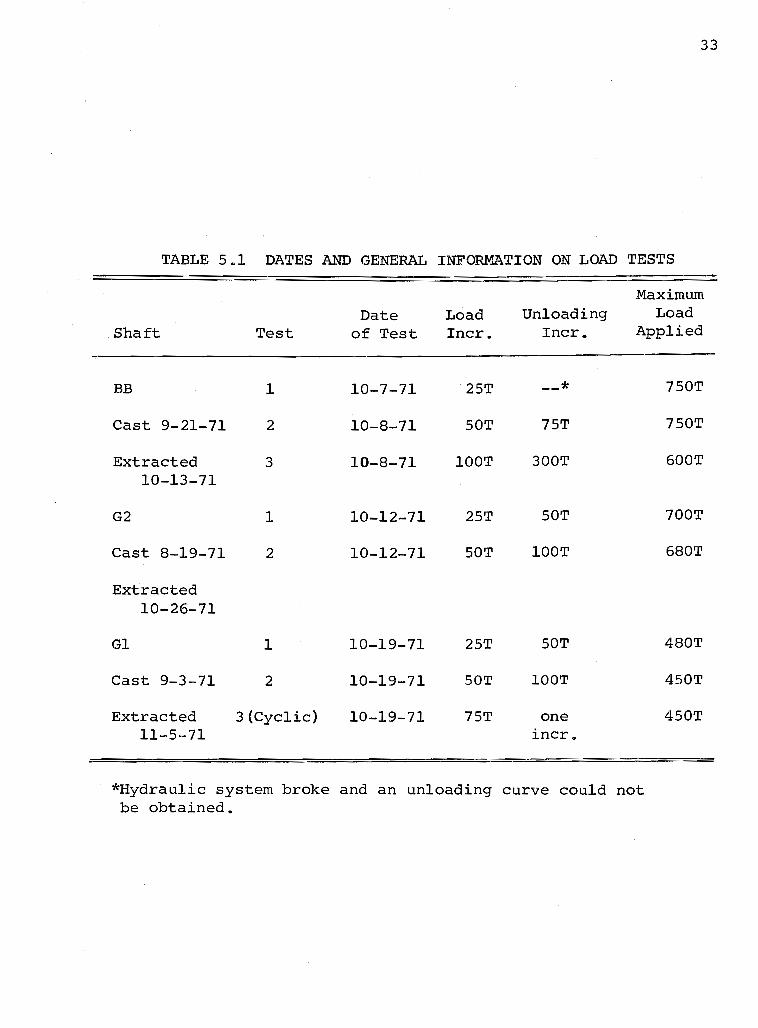
Dates of the load tests, maximum applied load, and other
general information are shown in Table 5.1. Table 5.2
shows the amount of load, as a percent of maximum applied
load, carried by frictional resistance.
Top of shaft load-settlement curves for Test Nos. 1
and 2 plus the tip load-settlement curve for Test No. 1
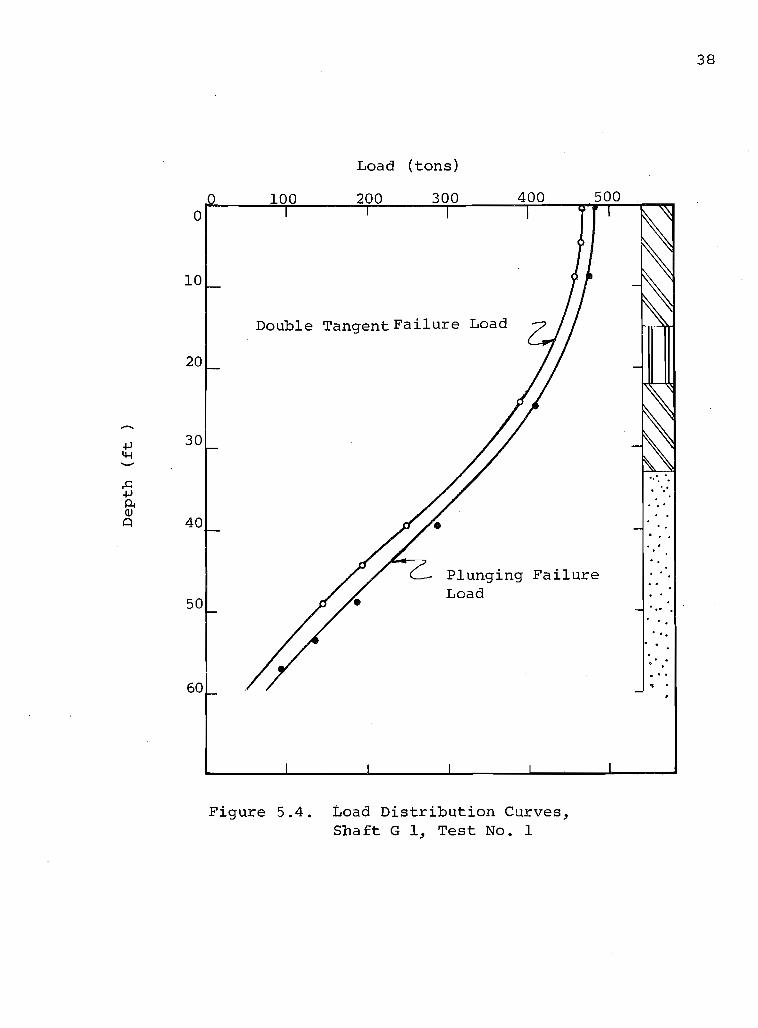
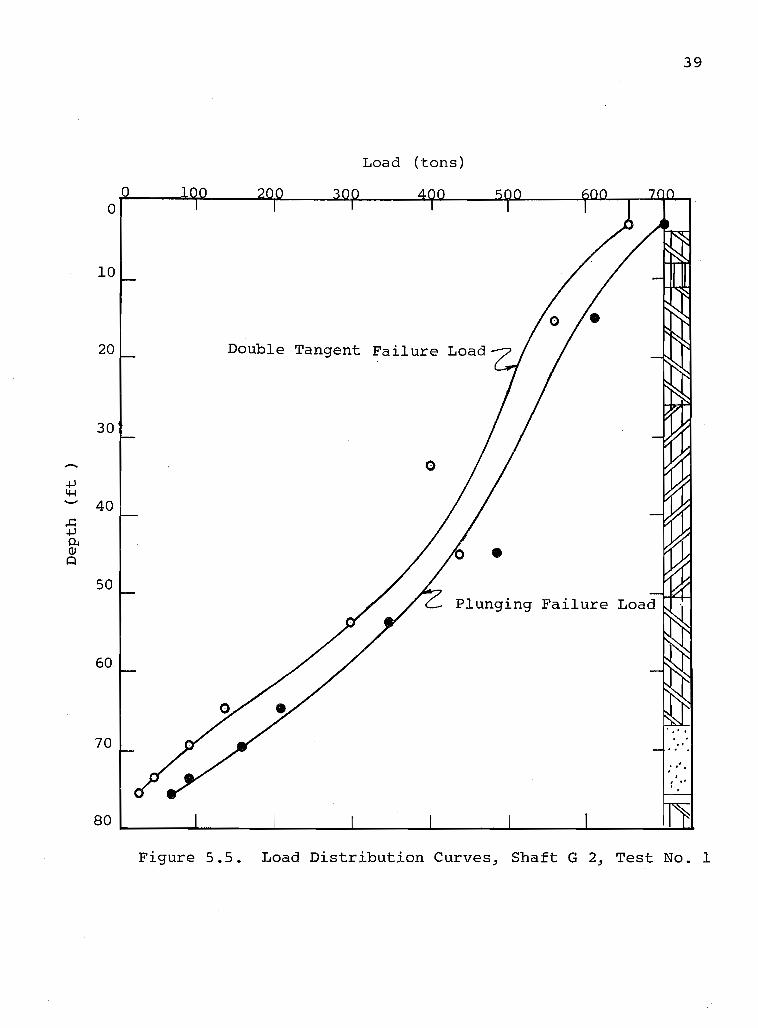
are shown in Figures 5.1 through 5.3. Load-distribution
curves for the first load test performed on each shaft are
shown in Figures 5.4 through 5.6. Two curves are shown in
each figure; one is the distribution for the Plunging Fail
ure Load and the other is for the Double Tangent Failure
31
Load. The Double Tangent Failure Load is the load indicated
by the intersection of two lines drawn on a load-settlement
curve~ one tangent to the initial flat portion of the curve
and the other tangent to the steep portion.
32
33
TABLE 5.1 DATES AND GENERAL INFORMATION ON LOAD TESTS
Shaft Test
BB 1
Cast 9-21-71 2
Extracted 3 10-13-71
G2 1
Cast 8-19-71 2
Extracted 10-26-71
G1 1
Cast 9-3-71 2
Extracted 3 (Cyclic) 11-5-71
Date of Test
10-7-71
10-8-71
10-8-71
10-12-71
10-12-71
10-19-71
10-19-71
10-19-71
Load Incr.
2ST
SOT
lOOT
2ST
SOT
2ST
SOT
7ST
Unloading Incr.
--* 7ST
300T
SOT
lOOT
SOT
lOOT
one incr.
Maximum Load
Applied
7S0T
7S0T
600T
700T
680T
480T
4S0T
4S0T
*Hydrau1ic system broke and an unloading curve could not be obtained.

34
TABLE 5.2 PERCENT OF APPLIED LOAD CARRIED BY FRICTIONAL RESISTANCE
Site
Gl
G2
BB
Ultimate Plunging Load (Tons)
480
700
750
Frictional Load Transfer (Tons)
425
665
460
Frictional Load Transfer (%)
91
95
88

-~ -,.,
.j.J ~ Q)
E: Q) .-l .j.J .j.J Q)
U)
Load (tons)
Ie!:::: jll '~I!I I pit .t:.vv 250 300 350 400 450
01 ~ • I. • • := == I I I I ~ .
0.2
0.4
0.6
0.8
" " '\ \ Tip Settlement V (Test No.1) ,
-0--_____ .,
I \
\ I
---- \. \ ---- ---4-0--- ---- --- Test No.2 2 ~
\ --- --0--_ ---------- \ ---G-_ I 1 - - - - - - - ... ~..o i --~----~
~
"''0.- -J Test No. 1
1.OL, ________ -4 ________ -L ________ ~ ______ ~~ ________ ~ ________ ~ ________ ~ ________ ~ ________ ~ ______ ~
Figure 5.1. Load-Settlement Curves, Shaft G 1
w U1

-. ~
-.-I
0.1
0.2
0.3
0.4
0.5
"-' 0.6
0.9
1.0
1.1
1.2
1.3
\ \ \ \ YZ-- Tip Settlement \ (Test No.1)
\ \ \ \ I
" I -J
--- --"'"0...._
Load (tons)
. ---- ..... v--_ ---0-----0- __
---0....
----0,. \
\.
36
\ \ \ \ \ \ \ \ \ \
~ I
I I I I
Test No. 1 7 ----'---o. __ ~_4J
-- - i ---0.. __
------0-._____ Test No. 2] J ---.0.-._____ .,."'.1"
- ---0- " . ---------0"'-'
Figure 5.2. Load-Settlement Curves~ Shaft G 2

Load (tons)
o 50 100 150 ___ ___ ___ ___ ~_~ ~__ ___ ___ ___ ___ ,__ , __
o K· • • .' • .1 • .1 :::L_ _ I I I I I I I I I I 0.2
0.4
0.6
0.8
1.0
1.2
1.4
1.6
2.0
\ \ \
------""'0-_\ - ----0- __ _ -----0-
Test No. 2
----- --0---- ----0-
, '\ , ,
\ /I /Tip Settlement ~~~:~::)--- ---~-- --0---_ ----0---- - __ -b
\ \
(Test No.1)
Estimated
Test No. 1
Figure 5.3. Load-Settlement Curves, Shaft BB '-',
W -...J
o
10
20
-+> 30 ~ -,c: +> 0.. Q)
t:l 40
50
60
Load (tons)
200 300
Double TangentFailure Load
Plunging Failure Load
Figure 5.4. Load Distribution Curves, Shaft G 1, Test No. 1
38
....... 0, .
00' . , 0 .. .
." . . ' . .
. . . . . " .. .
-
o
10
20
30
40
50
60
70
Load (tons)
Double Tangent Failure Load
o
• Plunging Failure Load
39
.. " . . " . . : ..
80 ~ ____ ~ ______ ~ ______ ~ ______ ~ ______ ~ ______ ~ ______ ~~
Figure 5.5. Load Distribution Curves, Shaft G 2, Test No.1

1
2
3
40
50
Load (tons)
200 400 600
Double Tangent -Failure Load
800
40
"'.' ":. . . Plunging Failure Load' ,",'
" , "w ~
, " " . , '
" . '': . . '
. -.. t , ,
" . , ' '. #'
......
60 '
Figure 5.6. Load Distribution Curves, Shaft BB, Test No. 1
CHAPTER VI
EXTRACTION AND INSPECTION
After load testing was completed, all test shafts were
extracted and inspected. The procedure used for extraction
was (1) drill an annular opening around the shaft for its
full depth, (2) loosen the shaft from the soil using a
specially constructed pulling device, and (3) lift shaft
from hole with a crane (Figures 6.1 - 6.4). After removal
41
of the shafts, the shaft .diameter was measured at each in
strumentation level and a careful examination of the concrete
soil interface was made. Additionally, several gages were
removed to inspect their seating in the concrete and the
concrete inspected for slurry contamination. Results from
the inspections are discussed below for each test shaft and
photographs of the extracted shafts are shown in Figures 6.5-
6.11 at the end of this chapter.
Shaft G 1
The shape of shaft G 1 was generally cylindrical and
straight. Slight enlargements were found at the bottom of
the section formed with the Sonotube and in the areas of
sand strata. The small size of these enlargements indicated
that no significant caving had occurred in the sand strata.

The tip of the shaft was irregular in shape with some re
inforcing steel exposed. The wooden plug used as a temp
orary tremie seal was located to one side of the shaft and
the polyethylene used for the same purpose had covered most
of the tip and a portion of the sides near the tip.
A coating of discolored material which had the appear
ance of sand stabilized with cement and drilling slurry
covered the entire length of the shaft. The thickness of
this coating varied from ~" to ~II in the portion of the
shaft in the sand with a lesser thickness over the remain
der of the shaft. Examination of the soil adherred to the
sides of the extracted shaft indicated that failure had
occurred in the surrounding soil and not in this coating.
Removal of concrete around some of the load cells pro
vided an opportunity to inspect the interior of the shaft
concrete. In the upper levels of the shaft evidence of
entrapped sand and bentonite was found around the in
strumentation cables and where the spiral steel and rein
forcing bars were joined. The,bottoms of some load cells
also had trapped some mud. Some evidence of contamination,
which appeared to be a stabilized mixture, was also found
approximately six inches from the surface, however, this
contamination did not appear to be widespread.
42

Figure 6.1. Drilling Around Shaft Prior to Extraction
Figure 6.2. Lifting Device in Place
43

44
Figure 6.3 . Removal of Shaft
Figure 6.4. Inspection of Shaft
The texture of the concrete surface was somewhat
roughened but there was no indication of any weak or bad
concrete except at the tip where turbulent flow of the
fluid concrete may have caused some mixing with sediments
in the bottom of the hole. Soil attached to the tip in
dicated the tip had been founded in a relatively soft mix
ture of clays which had fallen into the hole during
construction. The color of these clays matched that of the
clay layers in the upper portions of the hole. A low tip
resistance was measured during load testing further confirm
ing the presence of soft material at the tip of this shaft.
The shape of the shaft tip suggested that the tremie
might have been in an off-center position when the first
fluid concrete was introduced into the hole.
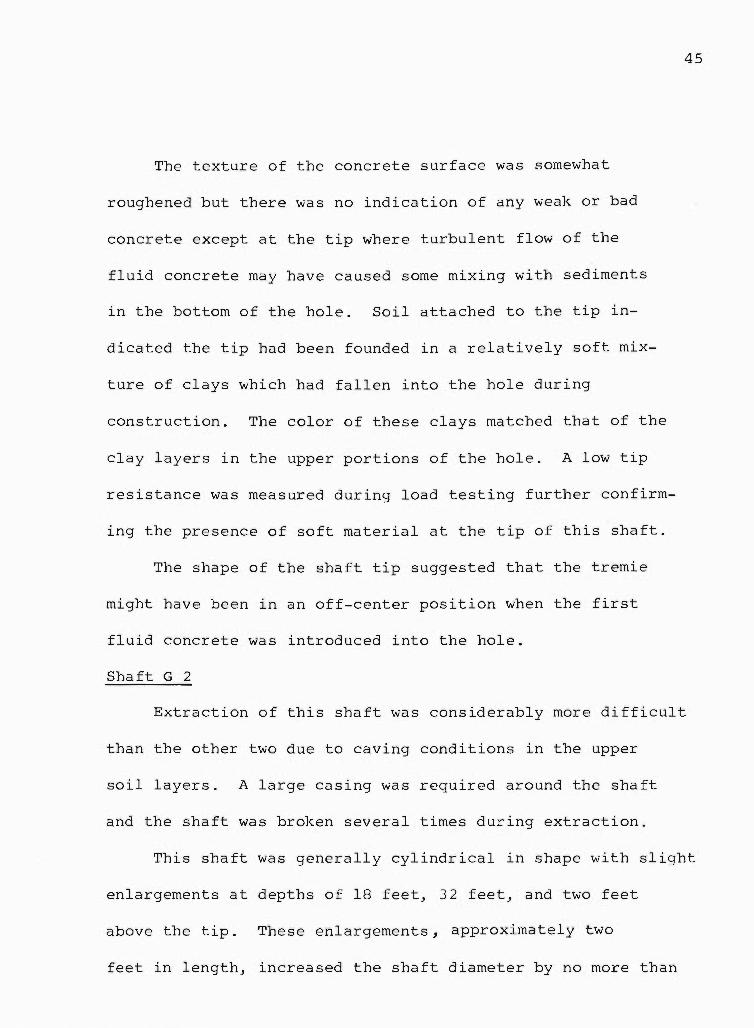
Shaft G 2
45
Extraction of this shaft was considerably more difficult
than the other two due to caving conditions in the upper
soil layers. A large casing was required around the shaft
and the shaft was broken several times during extraction.
This shaft was generally cylindrical in shape with slight
enlargements at depths of 18 feet, 32 feet, and two feet
above the tip. These enlargements, approximately two
feet in length, increased the shaft diameter by no more than
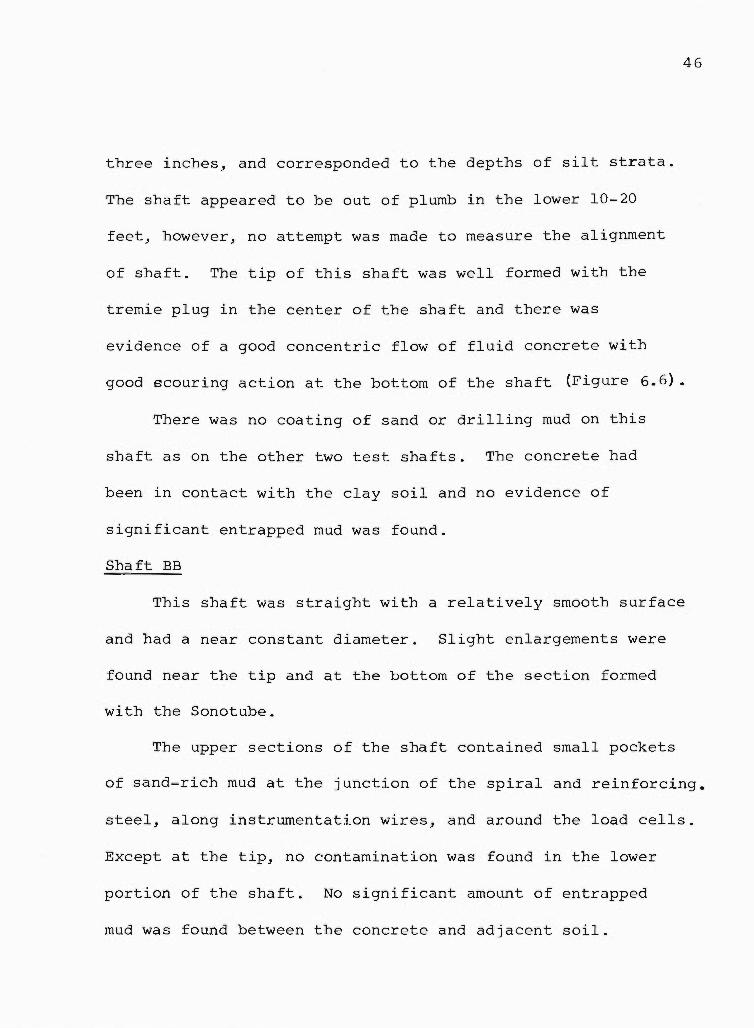
three inches, and corresponded to the depths of silt strata.
The shaft appeared to be out of plumb in the lower 10-20
feet, however, no attempt was made to measure the alignment
of shaft. The tip of this shaft was well formed with the
tremie plug in the center of the shaft and there was
46
evidence of a good concentric flow of fluid concrete with
good scouring action at the bottom of the shaft (Figure 6.6).
There was no coating of sand or drilling mud on this
shaft as on the other two test shafts. The concrete had
been in contact with the clay soil and no evidence of
significant entrapped mud was found.
Shaft BB
This shaft was straight with a relatively smooth surface
and had a near constant diameter. Slight enlargements were
found near the tip and at the bottom of the section formed
with the Sonotube.
The upper sections of the shaft contained small pockets
of sand~rich mud at the junction of the spiral and reinforcing.
steel, along instrumentation wires, and around the load cells.
Except at the tip, no contamination was found in the lower
portion of the shaft. No significant amount of entrapped
mud was found between the concrete and adjacent soil.

A coating of slightly clayey sand covered the en-
tire length of the shaft. This coating was 1/16" - 1/4"
thick, depending on the roughness of the concrete surface,
and failure apparently took place in this layer. The sand
adjacent to the concrete appeared to be somewhat stabilized.
The bottom five feet of this shaft had layers of clay
clinging to it but they were separated from the concrete by
the clayey sand layer. The different colors of the clay
indicated that it had come from the strata near the ground
surface. It is likely that this clay had fallen into the
hole during drilling and then pushed to the sides of the
hole by the fluid concrete. A smooth flow of concrete at
the bottom of this shaft had apparently been prevented by
the temporary tremie seal just as in Shaft G 1. The tip
of Shaft BB is pictured in Figure 6.7.
47

48
Figure 6.5. Tip of Shaft Gl
Figure 6.6. Shaft Gl
49
Figure 6.7. Tip of Shaft G2
Fi gure 6.8. Shaft G2

50
Figure 6.9. Close -up o f Shaft G2
Figure 6 .10 . Tip of Shaf t BB

51
Figure 6.11. Shaft BB
CHAPTER VII
BOND TESTS
A limited number of pull-out tests were performed to
determine if the bond strength of the concrete was signifi
cantly affected by the II s 1urry displacement" method of
placing concrete.
Two tests were performed using a section of shaft G 2
from a level approximately 65 feet below the ground surface.
This section was 2'-6" in diameter and 5'-6" long. Concrete
was removed and the No. 8 reinforcing bars cut to form two
test specimens: one with a bar embedment length of 13 inches
and one with an embedment length of 9 inches. Concrete
cover was 2-5/8 inches on the 13-inch length and 2-1/4 inches
on the 9-inch length.
The concrete over the 13-inch length did not fail by
bond splitting. The direction of the applied load was not
parallel to the axis of the bar and this caused a portion
of the concrete cover to spall off. This failure occurred
at an applied load of 55,500 pounds and a calculated bond
stress of 1360 psi. The concrete over the 9-inch length
failed by bond splitting at an applied load of 61,000 pounds
and a calculated bond stress of 2160 psi.
52

Inspection of the concrete removed for the above tests
did not reveal any significant slurry contamination in the
concrete or around the reinforcing steel.
Additional pull-out tests were performed on 12 concrete
specimens 12 inches in diameter, 14 inches long, and pre
pared as follows:
1. Three with No.8 deformed bars coated with a
mud slurry before casting in concrete.
2. Three with No. 8 deformed bars cast without
.a mud slurry coating.
3. Three with one-inch diameter smooth bars coated
with a mud slurry before casting in concrete.
4. Three with one-inch diameter smooth bars cast
without a mud slurry casting.
Two of the deformed bars cast with the slurry coating
failed in a threaded area before concrete failure. These
failed at loads of 54,000 and 56,000 pounds which represents
an approximate bond stress of 1230 psi and 1275 psi. Using
a different method for applying load, the third specimen with
a slurry-coated deformed bar was loaded until the concrete
failed by bond splitting. This occurred at a load of
61,500 pounds and a calculated bond stress of 1400 psi. The
three specimens made·with deformed bars without the slurry
53

coating all failed by bond splitting. The average of the
failure loads was 60~500 pounds with an average calculated
bond stress of 1375 psi.
54
All of the specimens with smooth bars failed by slippage
of the bars. The average of the failure loads for the
specimens with slurry-coated bars was 5,800 pounds with an
average calculated bond stress of 133 psi. The average of
the failure loads for the specimens with un-coated bars was
10~700 pounds with an average calculated bond stress of
242 psi.

CHAPTER VIII
CONCLUSIONS
55
Load tests were conducted on three straight drilled
shafts of constant diameter constructed using the "slurry
displacement" method. The primary reasons for these load
tests were: (1) to obtain a proven load capacity for design
verification, (2) to evaluate the II s 1urry displacement"
method of construction, and (3) to determine the load trans
fer characteristics of drilled shafts constructed by this
method. Based on the results of these tests and the in
spection of the extracted shafts, the following conclusions
and recommendations are presented.
Conclusions
1. Straight drilled shafts designed to carry load by
frictional resistance can safely be used in the
areas tested. Results of the load tests indicated
that a significant portion of the applied axial load
was carried by frictional resistance.
2. Drilled shafts can safely be constructed in water
bearing and caving soils using the "slurry
displacement" method of construction. Con-

struction techniques have a significant influ
ence on the condition of shafts constructed using
this method and care should be exercised to
prevent contamination of the concrete by the
drilling slurry.
3. The values of load transfer developed in the soils
surrounding the shafts constructed by the IIslurry
displacement ll method were found to be comparable
to those developed from previous research when
shafts were constructed in the dry.
56
4. The tip resistance of shafts constructed by the
"slurry displacement ll method can be substantially
reduced by loose materials falling into the hole
and not being completely removed before placing
concrete. This apparently occurred at shaft GI
where a low ultimate tip resistance was measured
and material from upper levels of the hole were
found clinging to the tip of the extracted shaft.
This likely was the result of making the final
clean-out of the hole with an auger rather than
with a clean-out bucket. When an auger is used the
soil cuttings have a tendency to wash off during
withdrawl o"f the auger.

57
5. The "slurry displacement" method of placing concrete
has no significant affect on the bond strength of
the concrete when deformed bars are used and the
load is applied axially. When smooth bars are
used, the slurry will cause a reduction in bond
strength. The average bond strength for the slurry
coated smooth bars was 133 psi compared with 242
psi for the uncoated bars.

CHAPTER IX
IMPLEMENTATION
Based on the results from these tests and those con
ducted under Research Study No. 3-5-65-89~ the following
procedure has been adopted for utilization of frictional
design for drilled shafts in the Houston area:
1. Use a Soil Reduction Factor* of 0.7 based on a
shear strength obtained from THO Triaxial and/or
THO cone penetrometer data.
2. Disregard the frictional capacity of the soil for
the upper 10 feet of a single shaft.
3. Assume that frictional load transfer is inde
pendent of the shaft construction method used.
Evaluation of the "slurry displacement" method used
58
to construct these test shafts resulted in approval of this
method for construction of any straight shafts used in the
I-45/I-610 (So. LOOp) Interchange structures. The specifi
cations governing this type of construction are included as
Appendix C.
* See Appendix A for definition.

59
APPENDIX A
DETERMINATION OF SOIL REDUCTION FACTOR, SR

RELATIONSHIP BETWEEN MEASURED AND
CALCULATED LOAD TRANSFER
60
Previous research has shown that the load transferred
from a drilled shaft to the surrounding soil is related to
the shear strength of the soil. This relationship, even
though sometimes greater than unity, is herein defined
Soil Reduction Factor (SR) and was determined using the
following procedure:
1. Calculate for each soil stratum, a unit shear
strength (tons/sq ft) based on Triaxial Test data
and/or THD Cone Penetrometer data.
2. Multiply the unit shear strength from Step 1 by
the stratum thickness to obtain a shear strength
in tons per foot of shaft perimeter.
3. Make an accumulative total of the shear strengths
from Step 2.
4. Calculate the potential ultimate load transfer
for each soil type from the accumulative total
shear strength in Step 3.
5. Prepare a load distribution curve (load vs. depth)
for the IIdouble-tangent" failure load obtained
from load test data.

6. The ratio of measured load transfer from Step 5
to the calculated load transfer from Step 4 is
the Soil Reduction Factor, SR.
61
Values of measured unit load transfer, calculated
total load transfer based on Triaxial Test Data and THO
Cone Penetrometer Data, total load transfer measured
during load tests, and SR are shown tabulated in Table A.l.
Values of SR' based on data taken from Research Study
3-5-65-89 Reports, for a site approximately 2.5 miles east
of Test Sites Gl and G2, are shown in Table A.2.

Site Soil
Clay G-l
-' Sand
Clay 1 G-2
Clay 2
Sand
BB Clay
Sand
Table A.l. Frictional Load Transfer and SR Values for
Test Sites Gl, G2, and BB
Frictional Load Transfer "
Per Soil Type (Tons) Average Measured Calculated Ult. Soil Reduction Unit Load Transfer
Measured Factor, SR (TSF) THD Pen. Triaxia] THD Pen. Triaxia]
Test Test Test Test
0.52 139 135 145 1.04 1.07
1.05 400 280 0.70 --
0.81 230 272 320 1.39 1.17
1.62 128 123 220 1.72 1.78
1.79 74 125 1.69 --
0.94 132 198 170 1.29 0.86 -
1.53 378 290 0.77 --
(j\ tv

-
Test
Sl Tl
S2 Tl
S3 Tl
S4 Tl
Table A.2. Frictional Load Transfer and SR Values for
Soil
Clay
Clay
Clay
Clay
Load Tests at SH 225 Site Located Approximately
2.5 Miles East of Sites Gl and G2
Frictional Load Transfer(Tons
Soil Reduction Calculated Factor (SR)
Measured THD Pen. Triaxial THD Pen. Triaxial
Test Test Test Test
88 110 97 1.10 0.87
65 87 86 1.32 0.99
88 110 121 1.37 1.08
237 259 191 0.81 0.74 ..
O"l W

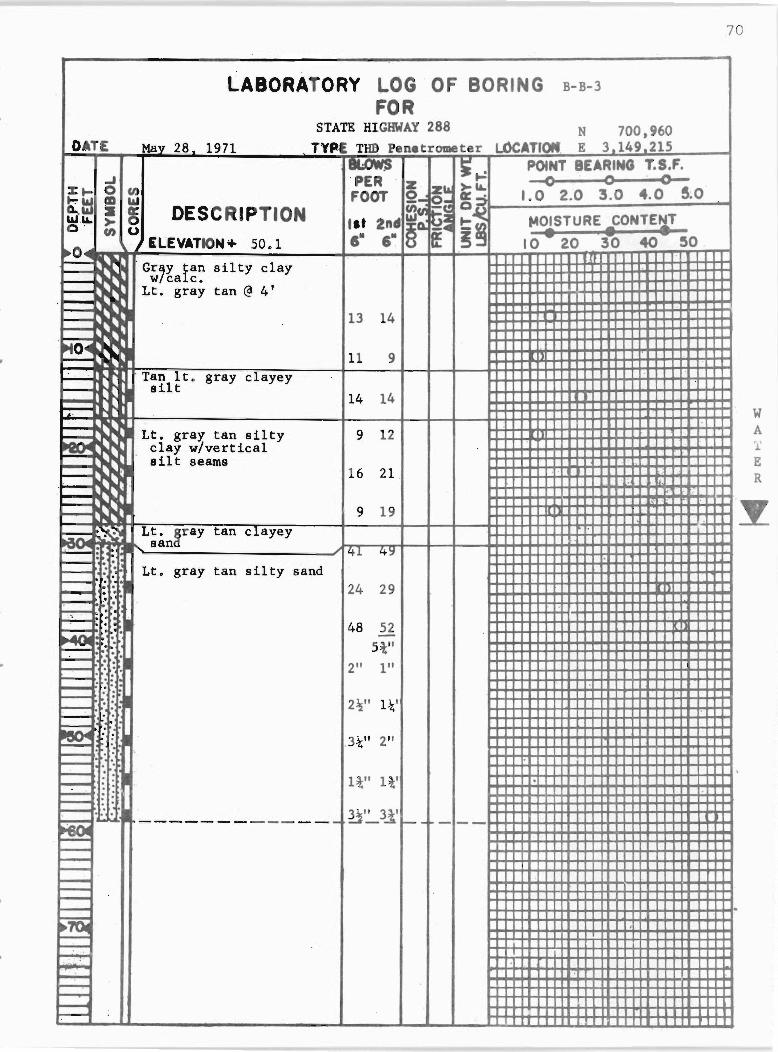
APPENDIX B
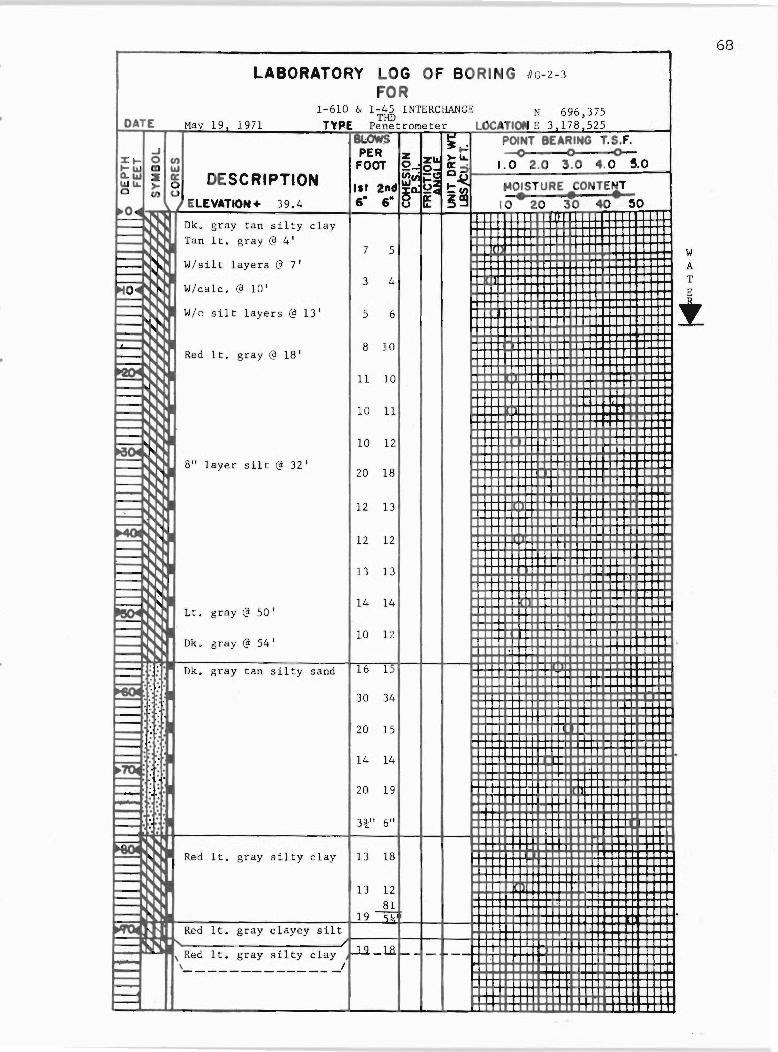
BORING LOGS
64

DATE
..I
LABORATORY LOG OF BORING ffG-1-2
FOR
M~ 21--,- 1971 1-610 & 1-45 INTERCHANGE N 695,995 . TYPE p~rPeWrometer LOCATION -..!.. 3.177 .460
IIII.~ ;..,: POINT BEARING T.S.F.
65
CI) w ~ DESCRIPTION
:1:1- 0 ~w CD o...w a
PER z >- "" --0 0 0 FOOT ~~~~ ~~. 1.0 2.0 3.0 4.0 S.O
~ui~~ 0 W.&L o·
~O ~
. 1--0-~
- ~O'"
~
>-CI)
r-I" I" 1"",
I" ~ I" ~ I"
r--~ fI!
u J. ELEVATION'" 41.6 . Dk. gray tan silty clay
Tan It. gray w/calc. @ 8'
Lt. gray t an w/o calc. @ 12'
Tan It. gray clayey ~ silt w/calc.
I-~~'tn", w/o calc.@20' r-=- I" r-- I"
r--
'It 2nd ~a;!~:; ~~ MOISTURE CONTENT S- 6- ts IE ~ ~ I 0 • 20 ' 3·0 40· SO
4 2
3 4
7 8
7 9
8 7
12 17
- I"
Tan It. gray siltr clay Red It. gray @ 26 9 12
r--..:Ill'\. ~ f~ ~I"
r-~ -9 12
pill
r-- ~ 9 12
Tan It. gray silty sand 27 26
8" layer clay @ 40'
~ · · ~.r.: ..... "" . r. , ..... -: : . - . -.. 19 21
· · · . . 31 36 r--- · ·
~ · · · Lt. gray tan @ 49'
Tan It. gray @ 52' . 35 32 - · · F ;. ~.~:
26 34 . :t-. - · · · - · . · . 4.}:1! 34; , · . : · ·
~'. · · 6" 2!t' · ~.::
~ · . ~ : ,
4.}:" 3~' r-' r-.: : ~ ,
5" 3!' ~ · , · . · ,
2~"'1 II · - · · · · · -----< .
1------4 ........... - - - - - - - - - - - - ..l.~ .ll ~ - - t- - ++-t-H++t+t++t+t-t+t+tof-tot+"-t-T-t-t-H
W A T E R

LA BORATO RY LOG OF BORING G-l·3
FOR N 69.5.9H
~TION &3.11L440
66
POINT BEARING T.S.F. ~ 0 0
1.0 2.0 3.0 4.0 5.0
MOISTURE CONTE~T
10· 203·0 ~o 50
W A T ! It

• • •
• • • • • • • • • • • • • • • • • • • • • •
• • • • • • • • •
OATE
-' XI- 0 1-&&.1 CD 0. &&.1 a &&.I Ll. > 0 en
~ ------~o .. t---
f--r--t--t· r--~
f--t---
f--f--
~ ~ t---t---r--I I .
~ t---
f--I--
f--f--
~ I r--r--
~ . I · ... f--I-- · '.
~'UII .. · . I · . . " I · . · .
· : . ~ : .
---~ ~
~
~:..::. f--f--
~ :=: Ii--f--
LABORATORY LOG OF BORING G -2 -2
FOR 1-610 & 1-45 Interchange
696 ,375 Ma v 18 1971 TYPE 3" Shelby LOCATION ~ 3 ,1 78 500
8WWS ~..,: Pat NT BEAR ING T.S .F. PER z
~i >IA.. ~ 0 0--en FOOT 0 12:. 1.0 2.0 3.0 4.0 S.O &&.I ~;; ~~ 12: DESCRIPTION t40ISTURE CONTENT 0 'It 2nd ~Q. t:en u g • • • ELEVATION + 39 . 6 6- 6- ~ ~~ 10 20 3 a 40 50
Ok. gray tan silty clay Tan It. gray @ 4' 96 W/silt pockets @ 6'
Tan It. ~ray clarey silt wi ayers 0 clay 106
Tan lt. gray nlti clay Lt. ~ray tan @ 14 Tan t. gray @ 15' Red 1 t. g ray @ 17' 104
Re~ It. ¥ra y clayey f'. w clay ayers
silt 99
Tan It. gray silty clay w/ calc. 96
wlo ca lc. @ 24' Red It. ~ray @ 27' W/calc. 29' 108 3" layer silt ~ 31' 2" layer silt 32'
98
95
If 94
Ie Tan lt. gray (9 50' 88 Ok. gray tan @ 52'
81
Gray tan silty sand 8" 1 3~er very sandy clay ~ 62 94
7 la¥er very sandy clay @ 63
Ok. gray tan silty clay 7/l
Gray tan silty sand
102
4" laye r clay @ 76'
Red 1 t . g ray s ilty cl ay 100
I" l a yer sil t @ 85' 2" layer sil t @ 86' 101 1" layer sil t @ 88'
Red 1 t. gray clayey r---- -- -- ,.. 11 '1 '_sJ.l£ ______________ ,
• S lickens ided
.
l. :~.
T E R
67
OATE
I--I--
~O" I I-- ~ I--
~ ~ ---F L-== I--
~ ~ I---I---I--~
I ........ ru-I f--
I
iM:;; = -I--I--
~ ' . . ~.:-.. · .
· . ~ .:. ,"- ' -;== · . I-- · .' f-- :
~ · .' I--I . . .. I · . · . · . bu:::: ~ -r----I--
~
~ I--F--I I
Ma v 19
LABORATORY lOG OF BORI NG #C- 2-3
FOR
1971 1- 610 & 1-45 INTERCHAN GE N 696,3 75
TI-ID TYPE Pene tromet e r LOCATION E 3 178 525
DESCRIPTION
7 5
W/ca1e. @ 10' 3 4
. wiD silt layer s @ 13' 5 6
Red 1t. gra y @ 18' 8 10
11 10
10 11
10 12
8" layer silt @ 32' 20 18
12 13
12 12
13 13
14 14 Lt. gray @ 50 '
Dk . gray @ 54' 10 12
Dk. gray tan silty sand 16 f,
30 34
20 15
14 14
20 19
3:);" 6"
Red 1 t. gray silty clay 13 18
13 12 81
19 ~ Red 1t. gray clayey silt
\ Red 1 t. gray silty clay W-i La ~-\ _____________ _ I
68
I W A T E
Y
.

DATE
LABORATORY LOG OF BORING #B-B-2
FOR STATE HIGHWAY 288 N 700,96S
Mav 27 1971 TYPI 3" Stlel IV LOCATiON E _l~,205 ,kOWS ~ POINT BEARING T.S.F •
69
.J PER Z )00 t: ~ 0 0 I~ti ~ : FOOT 0 !~~ I!i ;; 1.0 2.0 5 .0 4.0 5.0 I ~"~ :: e DESCRIPTION lit 2nd ~:Iti~ -i MOISTURE CONTE~T ~O~~~=EL~E~~=~~T~~N~+ __ ~50~.~o ____ ~6_·~6~·~~~~c-~!~~-~+'nO~·~n20Tnri3~~~ri40~~5~0Tr' n1
',-
Gray tan silty clay w/ calc.
Lt. gray tan @ 5'
Tan It . gray silty sand
8" l aye r sand stone @ 53'
- ----------• Slickensided
32 4S
2" ~tl
I
2" 3"
3~" U;" ,
4~" ~"
1" ~t'
5-t" 2t"
~~ t\: --~- ~ -
"
W A T E R
DATE
...J %~ 0 ~ W CD (L.W ~ W,'" > 0 ' U)
~O
---... 0 <111 ~
0..-, I""":'-
l1li'" ~
r1IU"'I ~~ , -
--~ .
~~
~ : I-~ -.-~ ~ I" · · "
· . ...... ' · · ~. · . · . r--- . ~:. · - · · . - · .
· . ~ · . -',.
· . - : . I- . · . · . ~ , . ~.'. ~ .. ~ r---10-~ ~ ~ --~ '--:'-:;:: ---1-~ r.-----
LABORATORY LOG OF BORING B-B-3
FOR STATE HIGHWAY 288 N 700,960
Ms,y_ 28_. 1971 TYP! THD Penetrometer LOCATJON, E 3.149.215 IU,~ ;..,: POINT BEARING T.S.F. - .,.
'PER ' ~ 0 0-U) Z ZItoi >-a&. 3.0 4.0 5;0 FOOT 0 !i~ 1.0 2.0 w ~Ui ~~ ~ DESCRIPTION
i~ t40ISTURE CONTENT lit 2nd ,,!a: u e • • • ELEVATION + 50.1 ,- ,II IE 10 20 30 40 SO
Gr,y ran silty clay w ca c.
Lt. gray tan @ 4'
13 14
11 9 ' Tan 1to gray clayey
silt 14 14
Lt. gray tan silty 9 12 clay. w/vertica1 silt seams
16 21 , " ' ,
9 19 Lt. ~ray tan Clayey
san 141 4 ~
Lt. gray tan silty sand ' 24 29
48 52 -5~"
2" 1"
2\" 1\'
,3\" 2"
1;;;" 1;;;' .
--- ---------- ~'~3.i' -- - --
70
.
W A j.'
E R

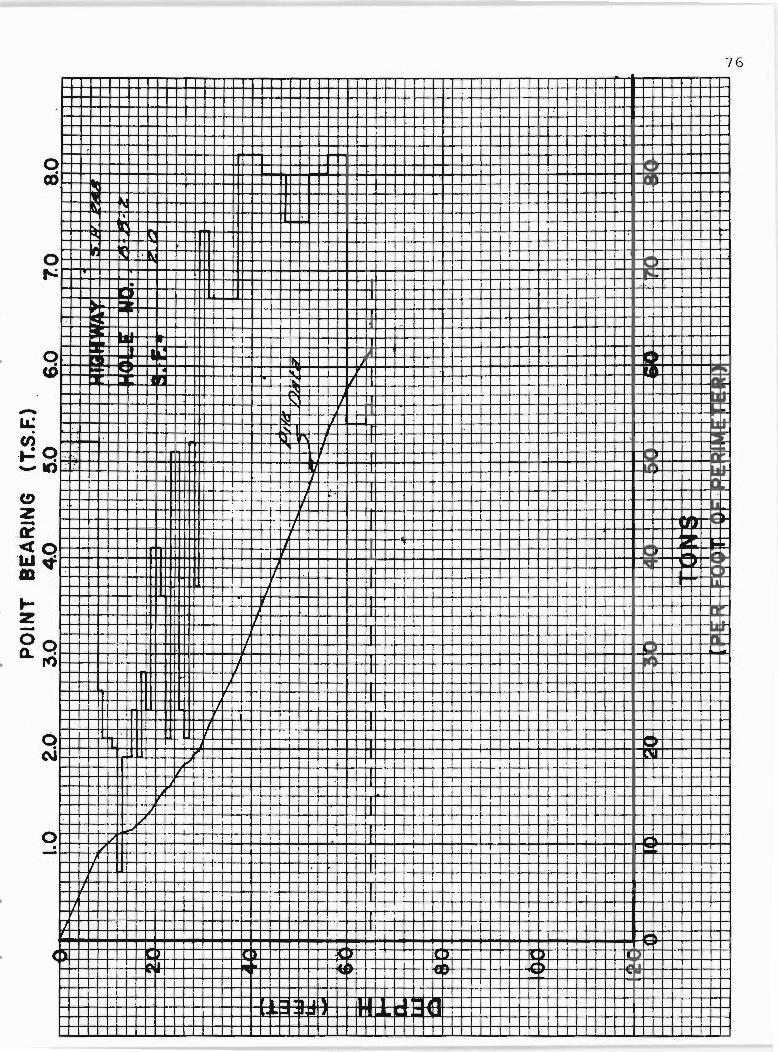
APPENDIX C
PLOTS OF ACCUMULATED
SOIL SHEAR STRENGTHS
71
)

•
q ex)
2 __ •
72


•
-
I I
I I
n rTi1 -f ,1 r -t
r r r
tiii~ 1 HI II n
M r
J -l j1 J:J u -t-+t K-H-H -r-, " I I ' ; II I HtIt"Q1nIHl-1..+ t++++ttttU=mri-1H- ' -: rt , P~
q -t-U H 'T-l tf-l ", ± N " n rr ;'+
; J H-+rr. l-rut1=: ~ ' tt
r
U
+-t-4iT I I n r-t- U + -t -l--l- -t tt ++U'"'hTlIII U U. ...j. -++-t-TT I ,4~ i ,. J
74

q (\I
0 . -
. C
.
r J I
I I
I
r
] , "T T
t""' T"
~
r-
t-
a..
---------75 ~--------------
:n
. ,
, ' -.l ..l -!,..,_ ,
I I I I
I "
.' , I ,
L.L
j
1
T
J
t-
T .1
H
-.l ..LHJ 1
I-
fI-
I-
T .ll.J
-
H-± H-H-L ..1 T T I; ~ ffWTIT tt ct.j. + H f+I r-tl.--t--l-Ll I r:rr:C
O
LL" u..u. -H -rl J-+ ..... J ~ T J T FfH+r.-r.,.j....l.....lU
"" c Il I .,... -r-n-rl-H-+ J. . NiLLR=. 1-+ ] T u..LL H- + 1'+ iii 1 '1 f en -r-t-+.+-LJ
1
IRi H +- r-rt+-+-1-I+-I I- +TI' +-1--+-1-1 '+t+++H+ 1
r-r-+-W--II -I. H H-~H ., .lL Ii-T'" H+ff-J- + ++, ~ l ' I ri-1 -f-tJ--l-H-t ~ ~ '. I T +P-+ T' -rrr II TJ+ .. ~i , ' +,~ 11 -Hj , -r ,,4-t+++ T ....... l=-J
n-t-4-Ll. 1T' t-t+-fR-i i ' ,i- 1

T 1
•
..
i
i
i r
rr..l

APPENDIX D
SPECIAL PROVISION TO ITEM 416
(416---002) OF TEXAS HIGHWAY
DEPARTMENT STANDARD SPECIFICATIONS, 1972
78

79
TEXAS HIGHWAY DEPARTMENT
SPECIAL PROVISION . ~TO
ITEM 416
DRILLED SHAFT FOUNDATIONS
For this project the Item, "Drilled Shaft Foundations" is hereby amended with respect to the clauses cited herein. No other clauses or requirements of this Item are waived or changed hereby.
Article 416.1. Description is supplemented by the following:
The "Slurry Displacement ll method is defined as a cUlstruction procedure whereby the sides of the excavation are supported, all or in part, by a mud slurry and the slurry displaced by concrete, to form a continuous concrete shaft.
The "Slurry Displacement" method may be used, at the Contractor's option, to construct any drilled shaft not requiring bell footings. Regardless of the method of shaft construction, the length shown on the plans will be the minimum length placed and the length to be paid for, unless modified by design change.
One interior drilled shaft in Bent 11, Structure 37, will be instrumented with strain gages, mustran cells and other incidentals, installed on the reinforcing steel cage. The instrumentation cables for the gages will be brought out at the construction joint at the top of the shaft. Lead wires will pe collected into a bundle at the top of the shaft in such a manner to not interfere with the placing of column forms. The instrumentation, installation and the completion of the instrumentation setup for long-term readings will be handled by State forces.
Article 416.2. Materials. This article is sUpplemented by the following:
concrete for the "Slurry Displacement" method shall be Class liEn, modified to contain a minimum of 7 sacks of cement per cubic yard, and a maximum grade 3 Coarse Aggregate. The slump shall be as required for use in a cased drilled shaft.
1-3 416---002 8-72
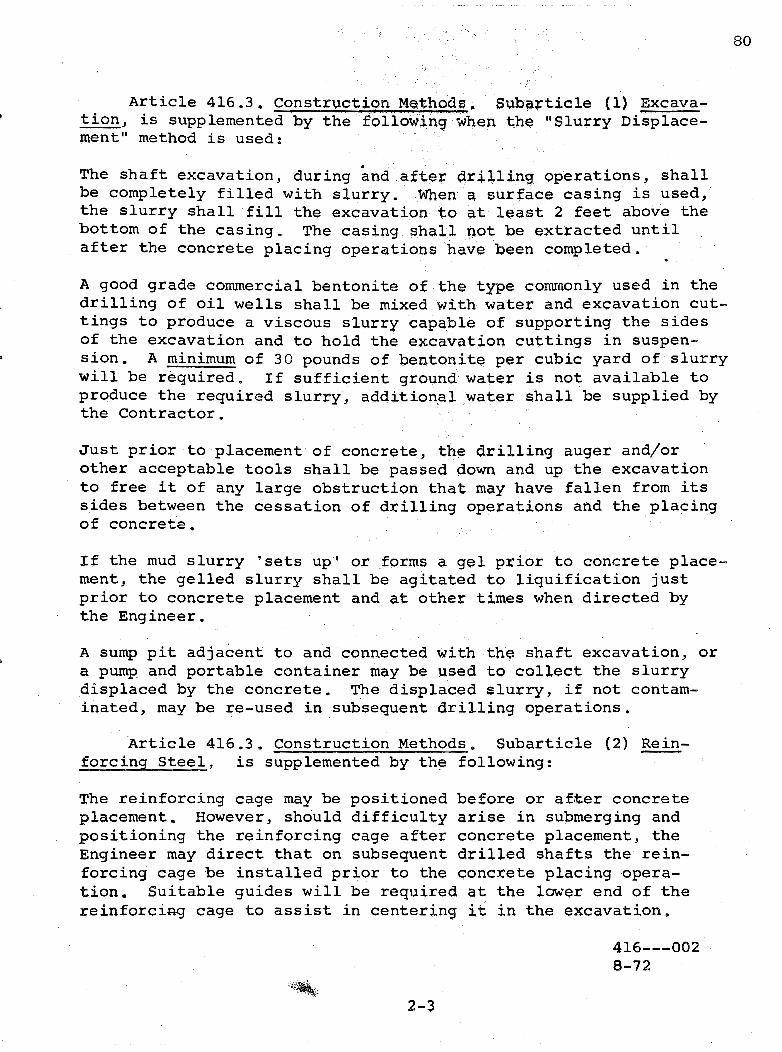
Article 416.3. Construction Methods. S1,lba~ticle (1) Excava-• t, _ _. ,_ _ ,
tJ.on, is supplemented by the follow,in9 when the IISlurry Displace-ment" method is used:
The shaft excavation, during ~nd after drilling operations, shall be completely filled with slurry.· When a surface casing is used, the slurry shall fill the excavation to at least 2 feet above the bottom of the casing. The casing shall not be extracted until after the concrete placing operations have been completed.
A good grade commercial bentonite of the type commonly used in the drilling of oil wells shall be mixed with water and excavation cuttings to produce a viscous slurry capable of supporting the sides of the excavation and to hold· the excavation cuttings in suspension. A minimum of 30 pounds of bentonite per cubic yard of slurry will be required. If sufficient groundwater is not available to produce the required slurrYJ additional water shall be supplied by the Contractor.
Just prior to placement of concrete, the drilling auger and/or other acceptable tools shall be passed down and up the excavation to free it of any large obstruction that may have fallen from its sides between the cessation of drilling operations and the placing of concrete.
If the mud slurry 'sets up' or forms a gel prior to concrete placement, the gelled slurry shall be agitated to liquification just prior to concrete placement and at other times when directed by the Engineer.
A sump pit adjacent to and connected with the shaft excavation, or a pump and portable container may be used to collect the slurry displaced by the concrete. The displaced slurry, if not contaminated, may be re-used in subsequent drilling operations.
Article 416.3. Construction Methods. Subarticle (2) Reinforcing Stee~, is supplemented by the following:
The reinforcing cage may be positioned before or after concrete placement. However, should difficulty arise in sUbmerging and positioning the reinforcing cage after concrete placement, the Engineer may direct that on subsequent drilled shafts the reinforcing cage be installed prior to the concrete placing operation. Suitable guides will be required at the lower end of the reinforcing cage to assist in centering it in the excavation.
2-3
416---002 8-72
80

The entire cage of reinforcing steel for the instrumented shaft shall be the full shaft length and shall be completely assembled and available to the State two days prior to installation in the shaft to allow the p1acemen~ of instrumentation. The Contractor shall use utmost care in handling the steel cage and placing concrete. The instrumented reinforcing cage shall be installed prior to the placing of concrete. Suitable guides will be installed on the reinforcing steel to keep the tremie from damaging the instrumentation.
81
Article 416.3. Construction Methods. Subarticle (3) Concrete, is supplemented by the following:
For the "Slurry Displacement" method, the concrete shall be placed by the tremie method in accordance with Article 420.14, "Placing Concrete in Water".
If it appears that the continuity of concreting has beencompromised due to withdrawal of the submerged end of the tremie tube prior to completion of concrete placement, the tremie shall be removed, resealed at the bottom, forced well into the concrete already placed and recharged prior to progressing further, and the Contractor will be required to core the entire length of the completed shaft or otherwise prove that the shaft is free from inclusions or contamination unless this requirement is specifically waived in writing by the Engineer.
3-3
416---002 8-72