two channels of consumer credit in the ussr channels of consumer credit in the ussr kimberly c....
TRANSCRIPT

BERKELEY-DUKEOCCASIONAL PAPERS
ON THE SECOND ECONOMYIN THE USS R
Two Channels of Consumer Credi tin the USSR
Kimberly C. Neuhauser
Paper No. 38, December 199 3
EDITORS
Gregory Grossman Vladimir G. Treml Michael V. AlexeevDepartment of Economics Department of Economics Department of EconomicsUniversity of California Duke University Indiana UniversityBerkeley, CA 94720 Durham, NC 27706 Bloomington, IN 47405
TECHNICAL EDITOR
Kimberly C. NeuhauserDepartment of Economics
Duke UniversityDurham, NC 27706

Library of Congress Catalog Card Number: 91-07584 7
Individual authors of contributions to the BDOP series retain sole copyright to their material .

BERKELEY-DUKE OCCASIONAL PAPER S
ON THE SECOND ECONOMY IN THE USS R
1. Gregory Grossman . "The Second Economy in the USSR and Eastern Europe : 38A Bibliography . "September 1985, 13 pp . [Out of print ; superseded by Paper No. 21 . ]
2. Gregory Grossman. "Inflationary, Political and Social Implications of the Current EconomicSlowdown ." September 1985.40 pp . [Also in H . H. Hoehmann et al., eds . Economics and Politics inthe USSR : Problems of Interdependence . Westview Press, 1986. ]
3. Vladimir G . Treml . "Purchase of Food from Private Sources in Soviet Urban Areas ." September 1985 .48 pp .
4. Gregory Grossman . "38A Tonsorial View of the Soviet Second Economy . " December 1985. 48 pp . [Alsoin Peter Wiles, ed . The Soviet Economy on the Brink of Reform . Unwin Hyman, 1988 . ]
5. Vladimir G . Treml . "Alcohol in the Soviet Underground Economy ." December 1985 . 65 pp .6. Mervyn Matthews . "Poverty and Patterns of Deprivation in the Soviet Union . " June 1986. 75 pp .7. Vladimir G . Treml . "Referent USSR Economic and Demographic Statistics for the Normalization of
Berkeley-Duke Emigre Questionnaire Data . " June 1986 . 214 pp .8. Michael V . Alexeev . "Factors Influencing Distribution of Housing in the USSR ." December 1986 . 47
pp . [Also in Revue d'Etudes Comparatives Est-Ouest 19:1, 5-36 . ]9. Selected Topics on the Second Economy . April 1987 . 110 pp. :
Michael V . Alexeev . "Underground Market for Gasoline in the USSR ." [Also in ComparativeEconomic Studies 30:2, 47-68 . ]Gregory Grossman. "38A Selected Bibliography on the Second Economy in the Soviet Union (Revisedand Updated) ." [Superseded by Paper No . 21 . ]Demosthenes J . Peterson. "The Number and Cost of Illegal Abortions in the USSR. "Vladimir G . Treml . "Personal and Disposable Income—Urban USSR, 1979 ."
10. Karl-Eugen Wadekin . "Private Agriculture in Socialist Countries : Implications for the USSR . " April
1987 . 36 pp. [Also in Kenneth Gray, ed . Contemporary Soviet Agriculture. Iowa State UniversityPress, 1989 . ]
11. Studies on the Soviet Second Economy . December 1987 . 90 pp. :Michael V. Alexeev and Ali Sayer. "The Second Economy Market for Foreign Made Goods in theUSSR . "Gregory Grossman . "The Second Economy : Boon or Bane for the Reform of the First Economy . "[Also in C . O. Kim and S . Gomulka, eds . Economic Reforms in the Socialist World . Forthcoming . ]Nikolai Malyshev . "Laundering of Money in the USSR through the Purchase of Winning Bonds an dLottery Tickets . "Vladimir G . Treml . " Income from Private Services Recognized by Official Soviet Statistics . "
12. Christopher Davis . "The Second Economy in Disequilibrium and Shortage Models of Centrall yPlanned Economies ." July 1988 . 148 pp .
13. Stanislaw Pomorski. "Privatization of the Soviet Economy under Gorbachev I : Notes on the 1986 Lawon Individual Enterprise ." October 1988 . 32 pp .
14. Misha Belkindas . "Privatization of the Soviet Economy under Gorbachev II : 1 . The Campaign againstUnearned Income . 2 . The Development of Private Cooperatives ." April 1989. 97 pp .
15. Kimberly C . Neuhauser and Clifford G . Gaddy . "Estimating the Size of the Private Service Econom yin the USSR ." July 1989 . 30 pp .
16. David J . Sedik . "Connections and Consumption in the USSR ." September 1989 . 40 pp .17. Gregory Grossman . "Sub-rosa Privatization and Marketization in the USSR ." November 1989. 9 pp .
[Also in Annals of the American Academy of Political and Social Science, January 1990 . ]18. Clifford G . Gaddy . "The Size of the Prostitution Market in the USSR ." January 1990 . 46 pp .19. Michael V . Alexeev. "Retail Price Reform in a Soviet-Type Economy : Are Soviet Reform Economist s
on a Right Track?" February 1990 . 24 pp .
(continued on reverse)

20. Vladimir G . Treml . "Study of Employee Theft of Materials from Places of Employment ." June 1990 .24 pp .
21. Gregory Grossman . "The Second Economy in the USSR and Eastern Europe : 38A Bibliography (with aBibliography of Recent Polish—Language Works on the Second Economy of Poland, b yBohdanWyznikiewicz) ." July 1990 . 22 pp .
22. Soviet Producer Goods Auctions . September 1990.73 pp .Y. Chernisheva and M . Rozhkov. "The Beginnings of Producer Goods Auctions in the USSR ."38A . Bardhan and Gregory Grossman. "38A Producer Goods Auction in the USSR . "
23. Kimberly C . Neuhauser . "The Market for Illegal Drugs in the Soviet Union in the Late 1980s . "November 1990 . 106 pp .
24. Clifford G . Gaddy . "The Labor Market and the Second Economy in the Soviet Union ." January 1991 .66 pp .
25. Michael V. Alexeev and Clifford G . Gaddy . "Trends in Wage and Income Distribution underGorbachev : Analysis of New Soviet Data ." February 1991 . 31 pp .
26. Kevin Block. "Depoliticizing Ownership : An Examination of the Property Reform Debate and th eNew Law on Ownership in the USSR ." March 1991 . 24 pp.
27. Gregory Grossman. "Wealth Estimates Based on the Berkeley—Duke Emigre Questionnaire : 38AStatistical Compilation ." May 1991 . 61 pp .
28. Erik Weisman . "Expenditures for Religious Services by the Soviet Population ." June 1991 . 80 pp .29. Michael Burawoy and Kathryn Hendley . "Strategies of Adaptation: 38A Soviet Enterprise Under
Perestroika and Privatization ." June 1991 . 66 pp .30. Clifford G . Gaddy . "Uncovering the ' Hidden Wage' : Public Perceptions of Opportunities for Side
Income in Various Occupations in the USSR ." November 1991 . 56 pp .31. Michael Alexeev. "Expenditures on Privately Rented Housing and Imputed Rents in the USSR . "
November 1991 . 24 pp .32.Anna Meyendorff. "The Black Market for Foreign Currency in the USSR ." December 1991 . 41 pp .33. Vladimir G . Treml . "38A Study of Labor Inputs into the Second Economy of the USSR ." January 1992 .
55 pp .34. Valeriy M. Rutgaizer . "The Shadow Economy in the USSR : 1 . 38A Survey of Soviet Research . 2 .
Sizing Up the Shadow Economy : Review and Analysis of Soviet Estimates. February 1992 . 77 pp .35. Kimberly C . Neuhauser . "The Second Economy in Funeral Services ." April 1992 . 50 pp .36. Vladimir G . Treml and Michael V . Alexeev. "The Second Economy and the Destabilizing Effect o f
its Growth on the State Economy in the Soviet Union : 1965-1989 ." December 1993 . 82 pp.37. Essays on Second Economy Markets . December 1993 . 55 pp .
Michael Alexeev . "38A Ruble is a Ruble, Or Is It? "Jim Leitzel . "Goods Diversion and Repressed Inflation : Notes on the Political Economy of Price
Liberalization . "William Pyle. "Private Car Ownership and Second Economy Activity . "
38. Kimberly C . Neuhauser . "Two Channels of Credit in the USSR . " December 1993 . 67 pp .
ORDERING INFORMATION
Single issues of Berkeley—Duke Occasional Papers are available at a pric eof $0 .10 per page . E .g ., paper No. 15—which is 30 pages—costs $3 .00 .
For single orders and for subscription inquiries, write to :
BDOP c/o Kimberly NeuhauserDepartment of Economic s
Duke UniversityDurham, NC 27706
Please make checks payable to : BDOP/Treml .

Two Channels of Consumer Credi tin the USSR
Kimberly C. NeuhauserDepartment of Economic s
Duke University

Two Channels of Consumer Credi tin the USSR
Kimberly C. Neuhauser 1
Summary
The opportunities for borrowing by households in the SovietUnion were limited. Credit was planned and rationed by th estate and was not readily available for consumer purchases .The household sector adapted to the absence of consume rcredit, creating a system of informal credit provision. Underthis informal system households were able to borrow and willin gto lend relatively large amounts of cash . This paper discussesconsumer credit in the USSR as provided by both the state an dhousehold sectors. It begins with a discussion of the variou stypes and volumes of consumer credit provided by the state inthe 1970s and 1980s . A discussion of the value of consumercredit generated in the household sector follows, based on th eBerkeley-Duke Survey . The paper then explores thecharacteristics of informal credit mechanisms and thei rapplicability in the Soviet command-administrative economy .It is hypothesized that in the Soviet case uncertainty about th eavailability of goods was in part responsible for this behavior .This paper also identifies some of the determinants of ahousehold's participation in this informal market .
' I would like to thank Professor Vladimir G . Trani for extensive comments and suggestions, and the useof his files . I am also grateful to Professor Gregory Grossman, Orest Pelech, William Pyle and Greg Kisunkofor comments and suggestions . Portions of this paper have been presented in several fora : Duke University' sLabor Lunch Seminar, the SSRC 7th Annual Workshop on Soviet Economics, and at the AAASS conferenc ein November 1991 . I benefitted greatly from the comments and discussion. Any errors and misinterpretation sare strictly my own .

2 Kimberly C. Neuhauser
I . Introduction
It was not uncommon in the Soviet Union ' for individuals to borrow or len d
relatively large sums of money from/to other individuals. The absence of financia l
intermediation and the strict rationing of credit from official sources led to th e
development of an informal mechanism . As is well known, the consumer sector wa s
largely neglected by the Soviet state and treated as a residual . Similarly, the provision of
consumer credit was not accorded a high priority, accounting for some 8 percent of tota l
long-term credit provided by the state . Just as individuals developed ways and means t o
overcome shortages of goods and misallocations generated by the planned economy, the y
also overcame the shortage of consumer credit . As part of the Berkeley-Duke Projec t
on the Second Economy in the USSR, this paper discusses the informal mechanism s
developed by households to generate credit in urban areas of the Soviet Union .
Five percent of the households surveyed for the Berkeley-Duke Project 3 were
involved in informal credit transactions during the course of their last normal yea r
(LNY)4 in the USSR. On average, these households had an outstanding debt of 66 7
rubles at the end of the LNY .
The discussion of consumer credit will proceed in th e
following manner. In the next section the value of official or state sponsored sources o f
consumer credit will be discussed . Evidence from the Berkeley-Duke survey will b e
used in section III to estimate the volume of informal credit, and to discuss the form s
2 This study concerns the availability of consumer credit under the centrally planned economy of th eUSSR and was begun in the summer of 1991 . The empirical data used in this study relate to the late 1970s ;hence I retain the use of the terms "Soviet," "Soviet Union," "USSR," and "Leningrad" in their traditiona lmeanings .
' The Berkeley-Duke Project on the Second Economy in the USSR has been designed around ahousehold budget survey. 1,061 emigre households covering 3,023 individuals were interviewed in variou scities in the U .S ., and were asked to relate their income and expenditures for the last normal year (LNY) o ftheir existence in the USSR . The survey is described in more detail in Section III .
The last normal year (LNY) is defined as the last calendar year before the decision to emigrate affecte dthe material well being of the household .
Consumer Credit
3
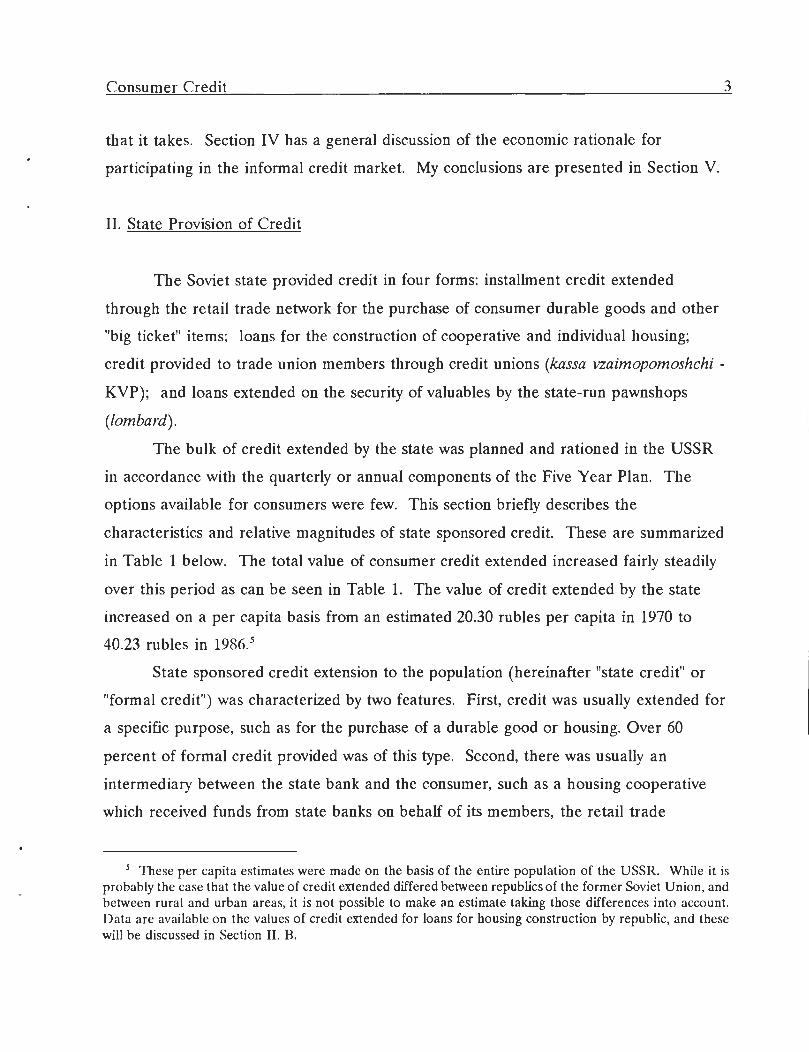
that it takes . Section IV has a general discussion of the economic rationale fo r
participating in the informal credit market . My conclusions are presented in Section V .
II . State Provision of Credi t
The Soviet state provided credit in four forms: installment credit extended
through the retail trade network for the purchase of consumer durable goods and othe r
"big ticket" items; loans for the construction of cooperative and individual housing ;
credit provided to trade union members through credit unions (kassa vzaimopomoshchi -
KVP); and loans extended on the security of valuables by the state-run pawnshop s
(lombard) .
The bulk of credit extended by the state was planned and rationed in the USS R
in accordance with the quarterly or annual components of the Five Year Plan . The
options available for consumers were few . This section briefly describes the
characteristics and relative magnitudes of state sponsored credit . These are summarized
in Table 1 below . The total value of consumer credit extended increased fairly steadily
over this period as can be seen in Table 1. The value of credit extended by the state
increased on a per capita basis from an estimated 20.30 rubles per capita in 1970 t o
40.23 rubles in 1986 . 5
State sponsored credit extension to the population (hereinafter "state credit" o r
"formal credit") was characterized by two features . First, credit was usually extended for
a specific purpose, such as for the purchase of a durable good or housing . Over 60
percent of formal credit provided was of this type . Second, there was usually an
intermediary between the state bank and the consumer, such as a housing cooperativ e
which received funds from state banks on behalf of its members, the retail trad e
5 These per capita estimates were made on the basis of the entire population of the USSR . While it isprobably the case that the value of credit extended differed between republics of the former Soviet Union, an dbetween rural and urban areas, it is not possible to make an estimate taking those differences into account .Data are available on the values of credit extended for loans for housing construction by republic, and thes ewill be discussed in Section II . B .

4 Kimberly C. Neuhauser
network, trade union credit unions (KVP) or state pawnshops . The various
intermediaries and their roles will be discussed below.
Table 1 : Credit Extended to the Populatio n(millions of rubles )
IHCInstallment
ZhSK
Credit KVPPawn-shops Tota l
1970 160 .9 485 .3 2333 1373 580 4932 . 01971 157 .6 451 .4 2861 1407 585 5462 . 61972 168 .1 418 .2 3302 1443 591 5922 . 31973 171 .5 488 .0 3448 1479 597 6183 . 61974 173 .6 467 .2 3568 1517 602 6327 . 61975 168 .6 449 .5 3635 1555 608 6416 . 01976 156 .0 414 .0 3789 1585 613 6557 . 61977 182 .6 439 .6 3917 1616 619 6774 . 21978 212 .3 451 .7 3881 .1 1647 624 6816 . 91979 233 .1 429 .8 3661 .4 1680 630 6633 . 71980 232 .3 443 .1 3558 .5 1712 635 6580 . 91981 3126 .3 1728 6401982 3958 .3 1744 64 51983 563 .0 648 .0 5609 .0 1760 630 9210 . 21984 652 .0 864 .0 6383 .0 1776 691 10366 . 51985 971 .4 7167 .9 1793 6631986 623 .6 1042 .2 7105 .8 1804 669 11244 . 31987 931 .8 1178 .2 6620 .5 1805 676 11211 .3
Notes :IHC (individual housing construction) : Finansy SSSR :
statisticheskiy sbornik, various years .ZhSK (cooperative housing construction) : Finansy SSSR :
statisticheskiy sbornik, various years .Installment Credit : 1970 - 1977 from Zakharov [1979], other s
estimated from data i nTorgovlyaKVP (kassa vzaimopomoshchi) : 1983 and 1984 from Zakharov [1986] ,
others estimates based on 2 .4 rubles per capit aPawnshops : 1983 and 1984 from Zakharov [1986], others estimated
based on 15 .22 rubles per employee/worke r
For the period of 1970 to 1985 the proportion of installment credit was between
50 and 60 percent of the estimated total provided to the population ; the proportion of
credit extended by KVP was between 16 and 27 percent ; the proportion of housin g
loans was between 9 and 14 percent; and the proportion of credit provided by state
pawnshops was between 6 and 10 percent . 6 Installment credit is by far the single most
6 The data in Table 1 are derived from several sources and in several cases are estimates (See Notes ,Table 1) . For the years 1983 and 1984, the values for credit extension are all from the same source [Zakharov ,1986] and are most likely to be internally consistent .
Consumer Credit
5
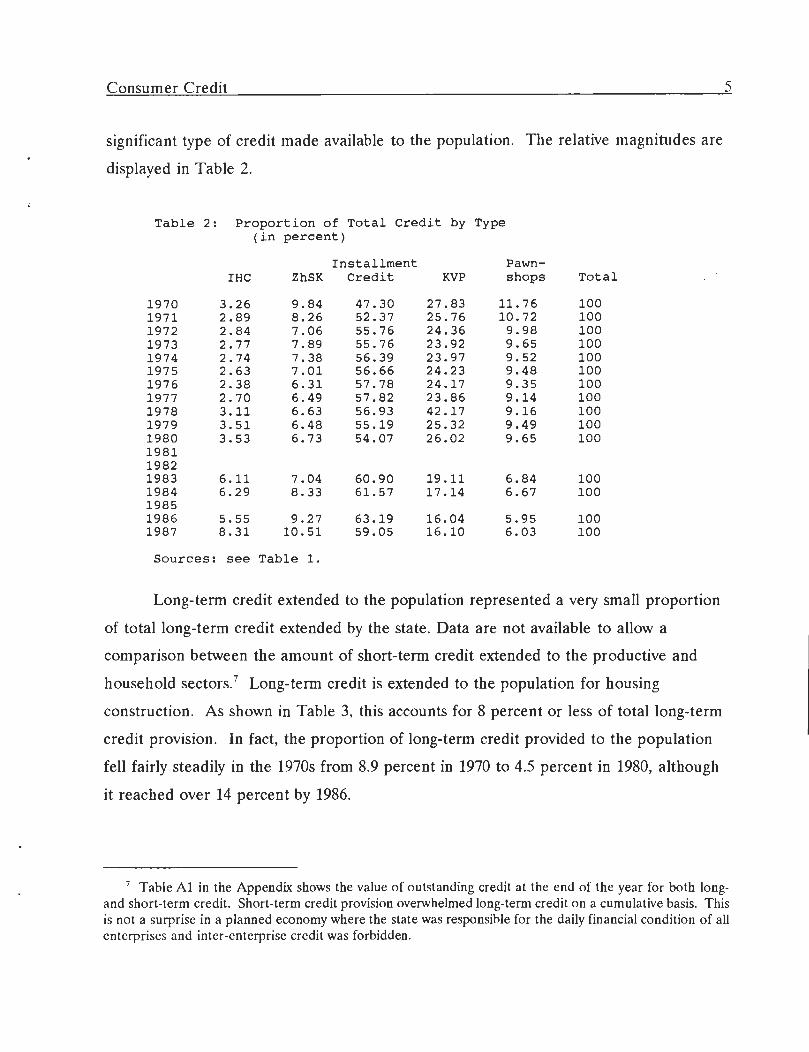
significant type of credit made available to the population . The relative magnitudes ar e
displayed in Table 2 .
Table 2 : Proportion of Total Credit by Type(in percent )
IHCInstallment
ZhSK
Credit KVPPawn -shops Tota l
1970 3 .26 9 .84
47 .30 27 .83 11 .76 1001971 2 .89 8 .26
52 .37 25 .76 10 .72 1001972 2 .84 7 .06
55 .76 24 .36 9 .98 1001973 2 .77 7 .89
55 .76 23 .92 9 .65 10 01974 2 .74 7 .38
56 .39 23 .97 9 .52 10 01975 2 .63 7 .01
56 .66 24 .23 9 .48 1001976 2 .38 6 .31
57 .78 24 .17 9 .35 1001977 2 .70 6 .49
57 .82 23 .86 9 .14 1001978 3 .11 6 .63
56 .93 42 .17 9 .16 1001979 3 .51 6 .48
55 .19 25 .32 9 .49 1001980 3 .53 6 .73
54 .07 26 .02 9 .65 100198 1198 21983 6 .11 7 .04
60 .90 19 .11 6 .84 1001984 6 .29 8 .33
61 .57 17 .14 6 .67 100198 51986 5 .55 9 .27
63 .19 16 .04 5 .95 1001987 8 .31 10 .51
59 .05 16 .10 6 .03 100
Sources : see Table 1 .
Long-term credit extended to the population represented a very small proportio n
of total long-term credit extended by the state . Data are not available to allow a
comparison between the amount of short-term credit extended to the productive an d
household sectors . ' Long-term credit is extended to the population for housin g
construction . As shown in Table 3, this accounts for 8 percent or less of total long-ter m
credit provision . In fact, the proportion of long-term credit provided to the populatio n
fell fairly steadily in the 1970s from 8 .9 percent in 1970 to 4 .5 percent in 1980, although
it reached over 14 percent by 1986 .
7 Table Al in the Appendix shows the value of outstanding credit at the end of the year for both long -and short-term credit . Short-term credit provision overwhelmed long-term credit on a cumulative basis . Thisis not a surprise in a planned economy where the state was responsible for the daily financial condition of allenterprises and inter-enterprise credit was forbidden .

6
Kimberly C. Neuhauser
Table 3 : Long-Term Bank Credit to Kolkhozes ,Population, Enterprises and Organizations ;Value of Loans Extended during the Yea r
(millions of rubles )
1970 1971 1972 1973 1974 1975 197 6
Total 7294 .0 8244 .5 8721 .7 9773 .3 10706 .7 11363 .6 12308 . 6Gosbank 5131 .2 5634 .1 5052 .4 6363 .4 6949 .3 6916 .7 7285 . 7
Kolkoz* 2183 .2 2400 .6 2736 .8 2961 .7 3234 .8 3293 .9 3774 . 6Sovkhoz 290 .5 385 .5 1301 .5 1495 .0 1706 .1 1447 .9 1301 . 3Oth State Ent 2049 .1 2117 .3 1080 .2 103 .9 1113 .8 1102 .8 1042 . 3Ent . Assocs . 304 .2 402 .7 501 .5 564 .2 666 .3 778 .1 891 . 6Cons . Coops 173 .3 198 .5 190 .2 163 .7 76 .7 142 .6 137 . 8PopulationRural ZhSK
130 .9 129 .5 142 .2 147 .9 151 .6 148 .4 138 . 1
Stroibank 2162 .8 2610 .4 2769 .3 3409 .9 3757 .4 4446 .9 5022 . 9State Ents 1647 .5 2130 .9 2325 .2 2898 .3 3268 .2 3977 .2 4591 . 0ZhSK 485 .3 451 .4 418 .2 488 .0 467 .2 449 .5 414 . 0Population 30 .0 28 .1 25 .9 23 .6 22 .0 20 .2 17 . 9
Total Populatio n
Population
646 .2 609 .0 586 .3 659 .5 640 .8 618 .1 570 . 0
as % of Total 8 .86 7 .39 6 .72 6 .75 5 .99 5 .44 4 .6 3
Year 1977 1978 1979 1980 1986 198 7
Total 15706 .7 16360 .3 15134 .1 15067 .3 11601 .4 13195 . 8
Gosbank 7224 .0 8458 .4 8271 .6 8702 .7 7729 .6 8085 . 2Kolkoz* 4027 .5 4482 .9 4496 .5 4738 .0 3528 .7 2720 . 5Sovkhoz 1171 .4 1278 .3 1094 .4 1518 .0 1621 .2 1873 . 9Oth State Ent 733 .7 1248 .1 12 .6 1057 .0 1247 .5 1914 . 8Ent .
Assocs . 960 .3 1078 .3 999 .4 960 .3 393 .4 444 . 6Cons . Coops 167 .3 177 .8 203 .3 205 .9 329 .9 203 . 2Population 163 .8 192 .9 209 .5 205 .8 579 .5 878 . 6Rural ZhSK - 0 .1 13 .1 17 .7 29 .4 50 . 0
Stroibank 8482 .7 7901 .9 6862 .5 6364 .6 3871 .8 5110 . 6State Ents 8024 .3 7430 .9 6422 .2 5912 .7 2814 .9 3929 . 2ZhSK 439 .6 451 .6 416 .7 425 .4 1012 .8 1128 . 2Population 18 .8 19 .4 23 .6 26 .5 44 .1 53 . 2
Population Total 622 .2 664 662 .9 675 .4 1665 .8 2110
Population3 .96 4 .06 4 .38 4 .48 14 .36 15 .99as % of Total
Notes : Population Total includes loans to the population and ZhSK .Sources : Finansy SSSR : statisticheskiy sbornik, various years .

Consumer Credit
7
Data are not available to determine whether this was a sudden increase in the earl y
perestroika years or the result of rapid although steady growth in the early 1980s .
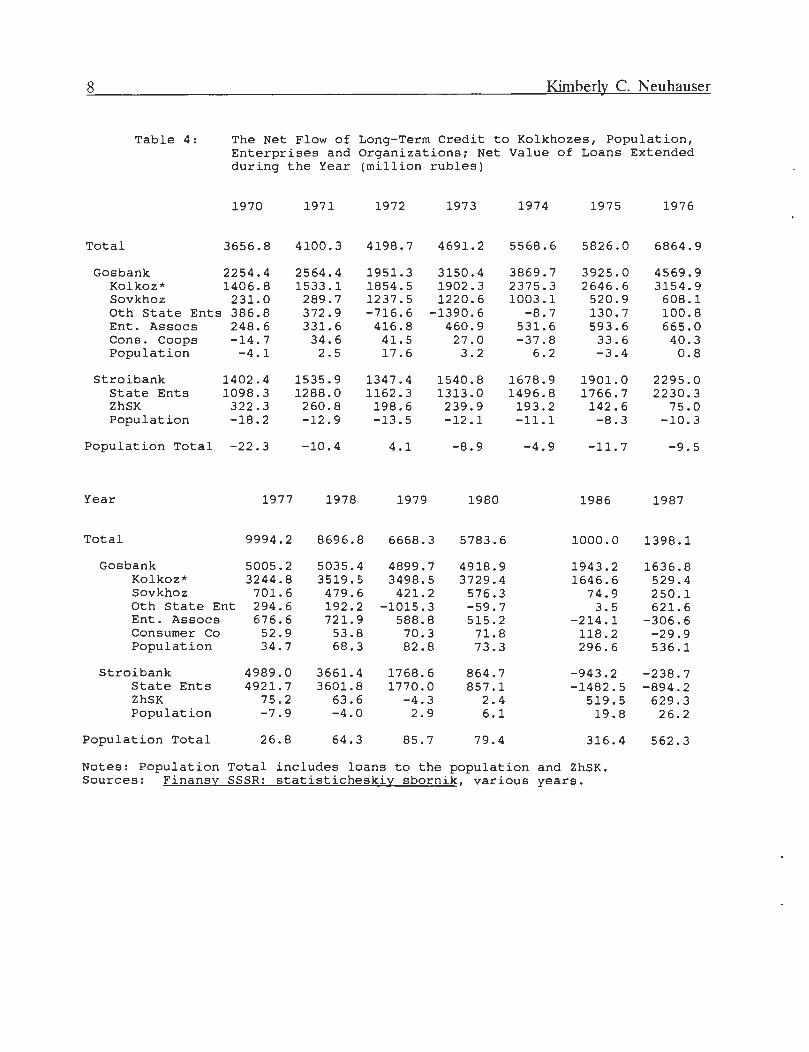
Table 4 shows the flow of credit from Gosbank and Stroibank to various sector s
of the economy.8 These values are derived by subtracting the value of loans repaid
from the value of credit extended for a given year . We see on balance that the stat e
increased the net value of total credit extended. Considering loans made to the
population, for most of the 1970s repayments to Stroibank for individual housin g
construction in urban areas were greater than the value of loans extended . This was not
true for Gosbank loans for individual housing construction in rural areas except for tw o
years, 1970 and 1975 . The annual extension of loans for cooperative housin g
construction were greater than the repayments . When the total value of loans for
housing construction from Gosbank and Stroibank are considered, the value of net credi t
to the population increased each year .
In the 1970s, the population repaid a higher proportion of loans than it received .
For example, in 1970, consumers received 8 .86 percent of long term credit granted, bu t
in that year they made 9 .52 percent of all loan repayment . Again in the perestroik a
years it appears that the population enjoyed a relative credit flow when the proportion of
loans received by consumers was significantly larger than the proportion of loans repaid .
It is likely that this is the result of increased lending to the population in the mid-1980s ,
with repayments of smaller loans made in the past providing the difference .
8 The Soviet banking system was dominated by a monopoly bank, Gosbank . Gosbank extended short-termloans to enterprises for working capital, oversaw plan fulfillment and monitored payments to the population ,and created money . Stroibank was one of the few specialized banks ; it extended credit for capital investment .(See Gregory and Stuart, 1990, pp 197-198 .)
8
Kimberly C. Neuhauser
Table 4 : The Net Flow of Long-Term Credit to Kolkhozes, Population ,Enterprises and Organizations ; Net Value of Loans Extende dduring the Year (million rubles )
1970 1971 1972
1973 1974 1975 1976
Total
3656 .8 4100 .3 4198 .7
4691 .2 5568 .6 5826 .0 6864 . 9
Gosbank
2254 .4 2564 .4 1951 .3
3150 .4 3869 .7 3925 .0 4569 . 9Kolkoz*
1406 .8 1533 .1 1854 .5
1902 .3 2375 .3 2646 .6 3154 . 9Sovkhoz
231 .0 289 .7 1237 .5
1220 .6 1003 .1 520 .9 608 . 1Oth State Ents 386 .8 372 .9 -716 .6
-1390 .6 -8 .7 130 .7 100 . 8Ent . Assocs
248 .6 331 .6 416 .8
460 .9 531 .6 593 .6 665 . 0Cons .
Coops
-14 .7 34 .6 41 .5
27 .0 -37 .8 33 .6 40 . 3Population
-4 .1 2 .5 17 .6
3 .2 6 .2 -3 .4 0 . 8
Stroibank
1402 .4 1535 .9 1347 .4
1540 .8 1678 .9 1901 .0 2295 . 0State Ents
1098 .3 1288 .0 1162 .3
1313 .0 1496 .8 1766 .7 2230 . 3ZhSK
322 .3 260 .8 198 .6
239 .9 193 .2 142 .6 75 . 0Population
-18 .2 -12 .9 -13 .5
-12 .1 -11 .1 -8 .3 -10 . 3
Population Total
-22 .3 -10 .4 4 .1
-8 .9 -4 .9 -11 .7 -9 . 5
Year
1977 1978 1979
1980 1986 198 7
Total
9994 .2 8696 .8 6668 .3
5783 .6 1000 .0 1398 . 1
Gosbank
5005 .2 5035 .4 4899 .7
4918 .9 1943 .2 1636 . 8Kolkoz*
3244 .8 3519 .5 3498 .5
3729 .4 1646 .6 529 . 4Sovkhoz
701 .6 479 .6 421 .2
576 .3 74 .9 250 . 1Oth State Ent
294 .6 192 .2 -1015 .3
-59 .7 3 .5 621 . 6Ent . Assocs
676 .6 721 .9 588 .8
515 .2 -214 .1 -306 . 6Consumer Co
52 .9 53 .8 70 .3
71 .8 118 .2 -29 . 9Population
34 .7 68 .3 82 .8
73 .3 296 .6 536 . 1
Stroibank
4989 .0 3661 .4 1768 .6
864 .7 -943 .2 -238 . 7State Ents
4921 .7 3601 .8 1770 .0
857 .1 -1482 .5 -894 . 2ZhSK
75 .2 63 .6 -4 .3
2 .4 519 .5 629 . 3Population
-7 .9 -4 .0 2 .9
6 .1 19 .8 26 . 2
Population Total
26 .8 64 .3 85 .7
79 .4 316 .4 562 .3
Notes : Population Total includes loans to the population and ZhSK .Sources : Finansy SSSR : statisticheskiy sbornik, various years .

Consumer Credit
9
A. Installment credi t
The single largest type of credit available to the population was installment credit ,
comprising over 60 percent of total formal credit available to consumers during the
1970s and early 1980s . Installment credit was provided through the retail trade network.
Table 5 presents the value of goods sold on installment credit and the associated valu e
of credit extended . Roughly 77 percent of the total value of goods sold on installmen t
credit was extended as credit to the population . The value of installment credit ros e
fairly steadily over this period . Measured in current rubles, it increased in absolut e
terms (from 2.3 to 6.2 billion rubles) and on a per capita basis (from 9 .65 to 23.50
rubles) between 1970 and 1987 . 9 The value of goods sold on installment credi t
accounted for between 2 .8 and 5 .7 percent of all non-food goods sold .
The right of citizens to purchase goods on installment credit was codified in a
Resolution of the USSR Council of Ministers of August 12, 1959, [Lapidus, 1976a, p . 59]
effort to provide the population with a more convenient method of obtaining durabl e
goods, as well as to increase the total turnover in the retail trade sector .
9 It should be noted that nominal wages rose steadily over this period as well, from an average monthl ywage of 122.0 rubles in 1970 to 202.9 rubles in 1987. Although there was no open inflation in this period, thi sincrease in average monthly wages of 66 .3 percent over the 17 years probably represents both increase dpurchasing power on the part of the population (due to rising productivity) and inflationary pressures on th esystem. If wage levels are used to deflate the value of installment credit extended by the state, then the valu eof installment credit increased by a factor of 1 .7 over this period. In addition to increases in wages over thisperiod, new products and technologies were introduced in the consumer goods sector, with concomitant highe rprices . It is not possible to quantify these effects to create a "real" purchasing power measure of trends i ninstallment credit . Wage data are from Narodnoye Khozyaystvo, various years .

1 0 Kimberly C. Neuhauser
Table 5 :
The Development of Sales of Goods on Installment Credit(million rubles)
Share ofSales of
Goodson Credit
PercentAnnualGrowth
Non-foodGoodsSales
Value ofExtended
Credit
Share ofcredit /
Cos t
1960 633 1 .8 489a1961 1110 3 .1 857 77 .2 '1962 1583 142 .6 4 .01 1213 76 . 61963 2133 134 .7 5 .6 1626 76 . 21964 2753 129 .1 6 .9 2077 75 . 41965 3372 122 .5 7 .6 2538 75 . 31966 3315 98 .3 6 .9 2485 75 . 01967 3049 92 .0 5 .7 2289 75 . 11968 3343 109 .6 5 .7 2502 74 .8'1969 3307 98 .9 5 .2 2476 74 . 91970 3122 94 .4 4 .5 2333 74 . 71971 3766 120 .6 5 .1 2861 76 . 01972 4266 113 .3 5 .3 3302 77 . 41973 4464 104 .6 5 .3 3448 77 . 21974 4602 103 .1 5 .1 3568 77 . 51975 4696 102 .0 4 .8 3635 77 . 41976 4907 104 .5 4 .8 3789 77 . 21977 5039 102 .7 4 .6 3917 77 . 71978 4994 99 .1 4 . 3 3881c1979 4711 94 .3 3 .8 366 11980 4621 98 .1 3 .5 359 11981 4060 87 .9 2 .8 315 51982 5141 126 .6 3 .5 39941983 7202 140 .1 4 .8 559 61984 8144 113 .1 5 .2 632 81985 9309 114 .3 5 .7 723 31986 9228 99 .1 5 .3 717 01987 8598 93 .2 4 .9 66811988 8204 95 .4 4 .3 637 5
a Value of credit extended in 1960 is estimate based on total value ofgoods sold on credit, with credit extension for 77 .2 percent of th etotal value
b Indicates that my calculated value (in table) differs from Zakharov' sc Values of installment credit extended for 1980 - 1988 are estimated
based on 77 .7% of total cost of goods sold on installment credit .
Sources :1961-1977 Zakharov, 1979, p . 7 51960, 1980-1988 : Torgovlya SSSR 1989 . Moscow : Goskomstat, p . 17 0

Consumer Credit 1 1
1. Eligibility for Installment Credi t
Most members of society are eligible to purchase goods on credit, although ther e
are exceptions . The following social groups were eligible :
workers and employeesincluding military personnel of officer rank and sergeant ran k
pensioners and graduate students (aspiranty)if they are studying in the same city where the trade enterprise is located .
Installment credit was not extended to workers on temporary or seasonal work, non -
graduate students in higher education institutions, and students in technikums, school s
and other institutions of higher learning . Although pensioners were eligible in principal,
it is likely that installment credit was extended only to those who were still employed, a s
an incentive to encourage their participation in the labor force and in an effort to reduc e
labor mobility. Those that were truly retired probably rarely received installmen t
credit . "
2. Terms of Credit
Most recently the terms for installment credit were set out by a Council o f
Ministers Resolution on July 5, 1985, "On the sale of durable goods on credit" [Izvestiya ,
1985, p . 3] . It stated that the downpayment should be no less than 25 percent of th e
purchase price. If the price of the good is greater than 3,000 rubles, the downpaymen t
was to be no less than 50 percent of the cost. The remainder of the cost became th e
amount of extended credit, which was to be repaid by the consumer in a period of 6
months to three years ; for goods costing more than 3,000 rubles up to four years . The
10 The percent of population employed as workers and employees (i .e ., excluding collective farm workers )rose from 37.31 to 42 .84 between 1970 and 1982, then fell off to 42 .09 in 1987 . These figures may be the bes tindicator of eligibility for installment credit .

12 Kimberly C. Neuhauser
consumer secured ownership of the good sold on credit upon the receipt of th e
downpayment . This included the right to resell th e goods.11
Other terms of the installment credit agreement included a payment by th e
consumer to the retail trade shop of 2 percent of the value of the extended credit for a
good in value up to 3,000 rubles, and a payment of 3 percent of the value of th e
extended credit for goods worth more than 3,000 rubles .
To secure the purchase of a durable good on installment credit the consumer ha d
to obtain a document (porucheniya-obyazatel'stva) from his or her place of employment
signed by the senior bookkeeper verifying the purchaser's salary and signed by th e
consumer. Upon the dismissal of an employee with outstanding debts, the place o f
employment was required to inform all creditor organizations within five days of th e
dismissal . It appears that the employer was liable for the unpaid balance of a n
employee's debts along with a penalty if the creditor was not informed about a dismissal
within the required five days [Izvestiya 1986 p . 3] . Late payment of installment credi t
incurred a penalty of 0 .1 percent per day on the unpaid balance .
3. State Financing of Installment Credi t
Gosbank provided credit to the retail trade network to support sales of durabl e
goods on credit. The retail trade organization paid 2 percent for credit from Gosbank
and received between 2 - 3 percent of the total of the loan depending on its length fro m
the customer. The higher percentage received for making loans was designed to cover t o
some extent additional costs for the retail trade shops of sales of goods on credi t
[Makhina, 1974, pp . 44 - 45] .
11 St. 30 i 43 Principles (osnov) of civil law, as quoted in "Tovary v kredit," Izvestiya March 31, 1986, p .3 .

Consumer Credit
1 3
4 . The Pattern of Durable Goods Sales on Installment Credi t
Retail trade organizations sold selected goods on credit to consumers . Th e
selection of goods that were available on credit was established by a list determined b y
the republican Council of Ministers 12. This list included goods found in sufficien t
quantities in the retail trade network, but excluded jewelry [Izvestiya, 1986, p . 3] .
The types of goods most often offered for sale on credit are durable goods suc h
as :
watchesradios and radio receiver stelevision setscamerasbicycles and moped smotorcycles and motorscooter svacuum sweeper ssewing machines
Table 5 presented above shows the value of durable goods sales on credit to th e
population for the years 1960 to 1988 .
Over the period 1970-1988 the value of credit extended for goods sold on credi t
increased fairly steadily from 2 .3 billion rubles in 1970, peaking at 7 .2 billion rubles i n
1985, and then declining in the following years to 6 .4 billion rubles in 1988 . The annua l
extension of installment credit grew by a factor of 2 .78 between 1970 and 1988. Over
this same period, average monthly wages rose by a factor of 1 .80, from 120 .0 rubles to
219 .8 rubles .
Data available from Torgovlya allow a view of the structure of durable goods sol d
on credit. Table 6 shows the calculated percent of durable goods units sold on credit fo r
selected years in the 1970s and 1980s . 13
12 Higher Resolution of the Council of Ministers of July 5, 1985 on credit . See "Tovary v kredit," IzvestiyaMar 31, 1986, p . 3 .
13 This table was calculated on the basis of Tables A2 and A3 in the Appendix .

14
Kimberly C. Neuhauser
Table 6 :
Calculated Percent of Sales on Installment Credi t
1970 1975 1980 1985 198 8
Radio Equipment 14 .19 12 .67 9 .93 11 .40 11 .2 8Television Sets 0 .00 53 .08 29 .42 38 .06 31 .9 1Cameras 2 .39 1 .75 1 .68 0 .00 0 .0 0Bicycles and Mopeds 7 .96 5 .91 4 .14 3 .33 2 .5 4Motorcycles 25 .98 17 .33 12 .98 26 .90 23 .5 2Sewing Machines 11 .77 15 .60 4 .65 0 .00 0 .0 0Watches 0 .48 0 .56 0 .61 0 .38 0 .2 8Refrigerator s
/Freezers 0 .00 0 .00 17 .58 22 .87 17 .4 6Washing Machines 0 .00 0 .00 6 .22 2 .45 1 .63
Source : Tables A2 and A3 in the Appendi x
A greater proportion of television sets were sold on credit than any other durabl e
good . 14 Televisions sets began to be offered for sale on installment terms in the mid -
1970s. In 1975 over half of all television were sold on credit . In the following years ,
roughly one third of all televisions sets were sold to the population on installment credit .
Following television sets in terms of proportion of sales on installment credit, were th e
categories of motorcycles and motorscooters, and refrigerators and freezers . Between
one-eighth and one-fourth of all motorcycles and motorscooters, and roughly one-fifth o f
refrigerators and freezers were sold on installment credit . 15 These three types of
durable goods were by far the most expensive of the durable goods sold in state an d
cooperative stores as can be seen in Table A4 in the Appendix . Of other goods sold on
credit about 10 percent of radio equipment, 3 percent of washing machines, 2 percent o f
cameras and less than 1 percent of watches were sold on credit .
14 Notably, automobiles are not sold on installment credit . For a discussion of the automobile market se ePyle, 1993 .
15 It appears that refrigerators and freezers were included on the list of available goods sometime in th elate 1970s .

Consumer Credit 1 5
B . Housing Construction Loan s
The state provided loans for the construction of cooperative apartment building s
and individual houses . Credit for cooperative housing construction was extended b y
Stroibank to cooperatives and for the most part occurred in urban areas . Gosbank
began to extend credit for rural cooperative housing construction in the late 1970s .
Credit for individual housing construction was extended by Gosbank to households i n
rural areas. A smaller proportion of credit was extended by Stroibank for individua l
housing construction in urban areas . Credit for cooperative housing construction will b e
discussed first, followed by credit for individual housing construction .
1 . Cooperative Housing Constructio n
Gosbank and Stroibank extended loans to housing construction cooperatives ,
called "zhilishno-stroitel'nyy kooperativ" or ZhSK. Cooperative housing consisted o f
multi-story, multi-family apartment buildings . The policy to extend credit for housing
construction cooperatives was introduced in the late 1950s after a decision taken by th e
Communist Party Central Committee and the Council of Ministers . This decision wa s
followed by another taken June 1, 1962 [Zonov, 1983, p . 15]. Both statements noted th e
significant role of bank credit in the development of these programs .
a. Role of Cooperative Housing Constructio n
Although cooperative housing makes up a small proportion of total living space
(just under 3 percent in 1980 and around 4 percent in the second half of the 1980 s
[Alexeev, 1993a p . 875], it was considered by the Soviet leadership to be an importan t
part of the solution to the "acute problem" of living space (as Gorbachev described it) i n
drafting the 12th Five Year Plan . The idea behind permitting cooperative housing was

1 6 Kimberly C. Neuhauser
that it would make use of the population's financial resources, and thus create a saving s
for the state budget . Furthermore, it was envisioned that allowing households to spen d
their cash on housing would be a good way to bring about a better balance in th e
aggregate income and expenditures of the population . It was hoped that part of the
downpayment would come from cash holdings and some out of savings, and that thi s
would serve to absorb some of the households' cash holdings that the leadership believe d
were excessive. Cooperative housing construction was also expected to expand the effor t
by the population in productive activities, as households had to provide some labor for
construction of their cooperative housing .
According to one estimate, increasing the share of cooperative housin g
construction would have allowed the saving of 2 .6 billion rubles of budgetary funds for
the 12th Five Year Plan, and was expected to help to balance the income an d
expenditures of the population to a significant degree, along with decreasing the queu e
for the ZhSK [Chernetsov, 1987, p . 53] .
b . Sources of Credit for ZhS K
The source of credit for building cooperative or individual housing depende d
upon the location of the borrower . The majority of cooperative housing construction
took place in urban areas, and Stroibank extended loans to urban apartmen t
construction cooperatives . Beginning in 1978 Gosbank began to extend loans fo r
cooperative apartment construction in rural areas . In both rural and urban areas loan s
for cooperative housing construction were extended to the cooperative, not to th e
individual . Here the ZhSK served as the intermediary between the ultimate lender an d
the borrower .
The annual value of loans extended to housing construction cooperatives in the
1970s was on average 446 .1 million rubles each year, with no strong trend over that time .
The average annual value of loan repayment for this period was 303 .5 million rubles

Consumer Credit
1 7
annually, tending to increase over this time period, from 163 .0 million rubles in 1970 to
423.9 million rubles in 1980. For every year except 1979 the value of loans received b y
the ZhSK was greater than the sum of loan repayments, increasing the net flow of loan s
to ZhSK in those years .
c. Terms of Credit for ZhS K
Loans for cooperative housing construction are made for 70-80 percent of th e
estimated cost of the housing, to be repaid over 25 years . The terms of the loan are a
function of where the housing is to be built . Credit is extended to the ZhSK after th e
members have amassed 20 - 30 percent of the estimated costs of construction of th e
apartments [Garbuzov, 1986, p . 454] . The state provided credit carried an annual interes t
charge of 0 .5% [Chernetsov, 1987, p . 55] .
The management of an enterprize, in agreement with the trade union, coul d
provide material assistance free-of-charge out of the fund of material incentives ('fon d
material'nogo stimulirovaniya') for both ZhSK and young adult ZhSK . 16 Eligibility for
assistance depended upon tenure . Workers having been with the firm no less than 5
years, and young adult workers having been with the firm no less than 2 years were
eligible . The amount of assistance depended upon the location . Generally it coul d
reach 30 percent of the downpayment . Up to 40 percent of the downpayment could be
provided in hardship regions such as the North, the Far East, the Far North and simila r
16 A policy was introduced to create cooperative apartment buildings for young adults, calle d"molodezhnyy ZhSK," or youth ZhSK . The housing construction cooperatives for young persons (MZhSK) ,should not be confused with the housing complexes for young adults, molodezhnyy zhilishchnyy kompleks(MZhK) . Persons under the age of 30 were eligible for membership . These were to be organized under theauspices of the municipal authorities upon the request of the Komsomol or the trade unions of loca lenterprises, institutions and other organizations .
Loans were extended to the young adult ZhSK up on the accumulation of 30 percent or more of th eestimated cost of the cooperative housing construction . In certain areas the terms were made even mor eattractive. Young adult ZhSK in cities and villages located in Kazakhstan, Siberia, the Far East, the Far Nort hand similar areas, and also in mining villages were required to amass a minimum of 20 percent of th eestimated construction costs .

18 Kimberly C. Neuhauser
regions. In the Black earth zone of Russia and other rural regions, up to 15 percent and
up to 20 percent respectively of the downpayment could be provided by one's employe r
[Chernetsov, 1987, p . 55] .
d. Trends in Credit for Cooperative Housing Constructio n
The total value of loans extended for cooperative apartment construction ros e
from 485 million rubles in 1970 to 1 .2 billion rubles in 1987, increasing in nominal term s
by a factor of 2 .4 over the 1970 level. The cost of state owned housing construction also
increased over this period, from 149 .06 rubles per square meter in 1970 to 254 .75 rubles
per square meter in 1980 . The cost per square meter of new construction increased by a
factor of 1 .7 over this period . Using the cost per square meter of new construction as a
deflator, the total value of loans for cooperative housing construction rose by about 40
percent in terms of purchasing power . '
The average annual per capita value of loans to the ZhSK in urban areas was 2 .96
rubles in the decade of the 1970s with no discernable trend.18 This value doubled b y
1987 to 6 .07 rubles per capita . Again, the absence of data for the first half of the 1980 s
hampers efforts to uncover a trend in the value of cooperative housing constructio n
loans .
Turning to data on republics, we can see that the loans for cooperative apartmen t
construction are not evenly distributed . Table 7 shows the calculated values per urba n
resident for state bank credit extended to the ZhSK for the years 1974, 1975, 1979, 1980 ,
1986 and 1987, by republic .
17 See Alexeev [1987, p . 286] . I used the cost of state-owned housing construction as a deflator for th evalue of cooperative housing construction loans because cooperative housing is usually listed as a part of state -owned housing, in contrast with privately owned housing . Data is also available for the cost of "other" (no tstate-owned) housing construction . Non-state owned housing construction cost 91 .62 rubles per square mete rin 1970, and 210.68 rubles per square meter in 1985, the last year for which data is available . When thesecosts are used as a deflator, the purchasing power of loans for cooperative housing construction increases b yabout 5 percent .
" Loans for rural ZhSK appeared in the Soviet statistical handbooks beginning in 1978 .

Consumer Credit
19
Table 7 : Loans extended to ZhSK for the Year(rubles per urban resident )
1974 1975 1979 1980 1986 1987
USSR 3 .14 2 .96 2 .55 2 .56 5 .54 6 .07RSFSR 2 .88 2 .84 2 .17 2 .15 4 .62 5 .34Ukraine 3 .54 3 .30 3 .06 3 .09 6 .03 6 .57Belorussi 6 .06 5 .02 5 .23 5 .48 10 .29 12 .18Uzbekista 1 .30 0 .87 2 .38 1 .80 6 .48 6 .2 1Kazakhsta 1 .41 1 .27 1 .05 1 .08 4 .03 3 .82Georgia 6 .28 5 .14 6 .19 5 .86 10 .70 7 .41Azerbaidz 1 .30 0 .68 1 .09 1 .23 2 .54 4 .89Lithuania 11 .33 10 .24 6 .60 7 .98 19 .51 18 .5 7Moldovia 5 .36 4 .96 5 .16 5 .61 15 .30 11 .7 0Lativa 4 .67 4 .93 3 .30 4 .01 9 .82 7 .41Kirgizia 2 .06 1 .44 2 .05 3 .24 4 .67 6 .5 0Tadzhikis 2 .66 1 .88 3 .32 1 .63 3 .16 5 .5 5Armenia 4 .02 3 .27 2 .76 2 .46 5 .66 6 .88Turkmenia 0 .00 0 .58 0 .83 1 .26 0 .97 1 .62Estonia 5 .77 5 .49 4 .21 5 .91 9 .42 8 .77
Source : Finansy SSSR : statisticheskiy sbornik, various years .
Generally the ruble values per urban resident have the following pattern: The
Baltic republics, Moldavia, Belorussia and Georgia received the greatest volume of loan s
on a per capita basis. The Central Asian republics and Azerbaidzhan fared the worst .
Turkmenia and Kazakhstan were consistently in the lowest group of four republics, wit h
frequent appearances by Azerbaidzhan an d Uzbekistan.19
The mechanism that triggers state bank loans for the ZhSK probably best explain s
this pattern . The state banks made loans to the ZhSK only after the members ha d
accumulated the necessary downpayment . Hence we would expect to see more loans t o
regions that generally have higher per capita income, and higher per capita savings. In
addition, areas with profitable enterprises would have a higher concentration of housin g
cooperatives, because the enterprises could provide resources (financial and other) t o
the cooperative. There are also cultural and traditional differences among the regions of
the former Soviet Union that would have an influence on the population's desire to liv e
in cooperative apartment buildings .
19 Table A5 in the Appendix shows the republics in their rank order by year .
20 Kimberly C. Neuhauser
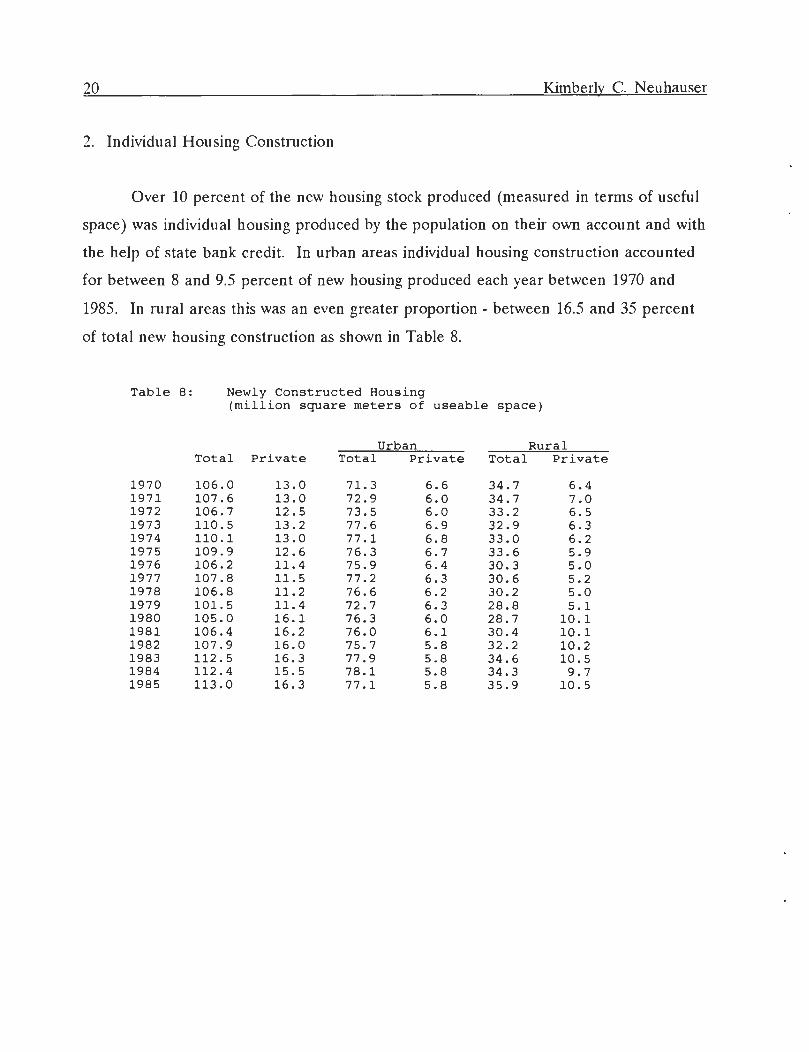
2 . Individual Housing Constructio n
Over 10 percent of the new housing stock produced (measured in terms of useful
space) was individual housing produced by the population on their own account and wit h
the help of state bank credit . In urban areas individual housing construction accounte d
for between 8 and 9 .5 percent of new housing produced each year between 1970 an d
1985. In rural areas this was an even greater proportion - between 16 .5 and 35 percent
of total new housing construction as shown in Table 8 .
Table 8 :
Newly Constructed Housing(million square meters of useable space )
Total PrivateUrban Rura l
Total
Private Total
Private
1970 106 .0 13 .0 71 .3 6 .6 34 .7 6 . 41971 107 .6 13 .0 72 .9 6 .0 34 .7 7 . 01972 106 .7 12 .5 73 .5 6 .0 33 .2 6 . 51973 110 .5 13 .2 77 .6 6 .9 32 .9 6 . 31974 110 .1 13 .0 77 .1 6 .8 33 .0 6 . 21975 109 .9 12 .6 76 .3 6 .7 33 .6 5 . 91976 106 .2 11 .4 75 .9 6 .4 30 .3 5 . 01977 107 .8 11 .5 77 .2 6 .3 30 .6 5 . 21978 106 .8 11 .2 76 .6 6 .2 30 .2 5 . 01979 101 .5 11 .4 72 .7 6 .3 28 .8 5 . 11980 105 .0 16 .1 76 .3 6 .0 28 .7 10 . 11981 106 .4 16 .2 76 .0 6 .1 30 .4 10 . 11982 107 .9 16 .0 75 .7 5 .8 32 .2 10 . 21983 112 .5 16 .3 77 .9 5 .8 34 .6 10 . 51984 112 .4 15 .5 78 .1 5 .8 34 .3 9 . 71985 113 .0 16 .3 77 .1 5 .8 35 .9 10 .5

Consumer Credit
21
Table 9 : Proportion of New Construction in Private Hand s
Private as
Private as% Total
% UrbanPrivate a s% Rura l
1970 12 .26 9 .26 18 .441971 12 .08 8 .23 20 .1 71972 11 .72 8 .16 19 .5 81973 11 .95 8 .89 19 .1 51974 11 .81 8 .82 18 .7 91975 11 .46 8 .78 17 .5 61976 10 .73 8 .43 16 .5 01977 10 .67 8 .16 16 .9 91978 10 .49 8 .09 16 .5 61979 11 .23 8 .67 17 .7 11980 15 .33 7 .86 35 .1 91981 15 .23 8 .03 33 .2 21982 14 .83 7 .66 31 .681983 14 .49 7 .45 30 .3 51984 13 .79 7 .43 28 .281985 14 .42 7 .52 29 .25
Source : Narodnoye khozyaystvo, various years
Loans for individual housing construction rose from 160 .9 million rubles in 1970
to 931 .8 million rubles in 1987 . This was an increase by a factor of 5 .8 in nominal terms .
However, the cost of non-state construction rose by a factor of 2 .3 over this period, from
91 .62 ruble per square meter in 1970, to 210 .68 rubles per square meter in 1985 (the las t
year for which data are available) . If the cost of construction is used as a deflator fo r
the value of loans for individual housing construction, then the value of state credit ros e
by a factor of 2 .5. This section describes the value and pattern of state provided credi t
for individual housing construction.
a . Sources and Terms of Credit for Individual Housing Constructio n
Long-term credit was extended for individual housing construction by Gosbank i n
rural areas and by Stroibank in urban areas . 20 Most credit for individual housing
20 In addition to the construction of housing, these credits were also provided for the purchase o flivestock, setting up housekeeping upon resettlement, and capital improvements and renovation of housing .In the 1980s a new use was permitted for these types of loans - the improvement of garden plots . Table 10

22 Kimberly C. Neuhauser
construction was extended to families who migrated to sovkhozes and kolkhozes . Credi t
for individual housing construction is usually extended in non-cash form through th e
bank or the enterprise where the borrower is employed . As with credit for cooperativ e
apartment construction, credit for individual housing construction was not extende d
directly to individuals. "Loans for individual housing construction, purchase of livestock
and domestic outfitting are for the most part given out through kolkhozes, enterprise s
and organizations under their supervision . . ." [Zakharov, 1979, p . 23] . Unlike credit for
ZhSk, loans for individual housing construction were provided up to certain amounts ,
depending upon location .
Loan repayment lasted for a period of 15 years and began in the sixth year afte r
the family moved in. The loans carried a 0 .5 percent interest rate [Zonov, 1983, p . 22] .
According to one economist, roughly half of the sum of credit for individual housin g
construction in rural areas was repaid from the material incentives fund of the sovkho z
or kolkhoz. These funds were designated to carry out the construction of homes for
their workers . Generally, in the late 1970s and early 1980s, a family receiving such a
loan did not have to repay all of it. Zonov provided the following example : A family
receiving a loan of 10,000 rubles for building a house upon resettlement repaid only a
quarter of it, or 2,500 rubles . The farm paid 4,500 rubles, and the remainder, 3,00 0
rubles, was made up by the state budget [Zonov, 1983, p . 23] .
b . Specific Uses of Individual Housing Credit .
Table 10 shows that credit was extended for several specific uses, closely relate d
to individual housing construction . In the Soviet statistical handbooks they are often
included as "Long-term Credit to the Population ." These are discussed briefly below .
shows the structure of uses for these loans .

Consumer Credit
23
1. Credit for Settling New Migrants, Building Individual Houses and Setting u pHousekeeping .
For the most part, this credit was provided in non-cash (beznalichnyy) form
through the bank or the enterprise at which the recipient worked [Zonov, 1983, p 20] .
These credits were clearly directed at facilitating the migration of citizens to rural areas ,
and in fact, the maximum size of a loan for housing construction was a function of wher e
the migrant was locating . For example, families moving to the Primorskyy and
Khabarovskyy krays, and the Amur, Chitinskaya and Kamchatskaya oblasts received u p
to 12,000 rubles ; families moving to other regions of the Black-Earth Zone of Russia ,
the Eastern and Western Siberian Economic Zones and Kazakhstan received up t o
10,000 rubles ; and families moving to the irrigated portions of Azerbaidzhan, Bashki r
ASSR, Dagestan ASSR, Kalmyk ASSR, and a series of other oblasts in Russia an d
Ukraine received up to 7,000 rubles [Zonov, 1983, p . 21]. The direction for this program
was imbedded in a Resolution of the Central Committee of the CPSU and Council o f
Ministers of June 19, 1978 [zonov, 1983, p .22] . Loan repayment began with the sixth
year after the house was completed and in the possession of the family ; the term of the
loan was for over 15 years. The interest paid to the state was minimal, 0 .5 percent
annually [Zonov, 1983, p . 22] .
2. Credit for Livestock Purchas e
Credit was also made available for the purchase of livestock . For example, credi t
was extended up to 500 rubles for the purchase of cows, and up to 250 for the purchase
of calves, with a repayment period of five years . Up to 50 percent of the loan wa s
eligible to be repaid out of the economic stimulation fund of the enterprise where th e
borrower worked [Zonov, 1983, p. 24] .

24
Kimberly C. Neuhauser
Table 10 : Longterm Bank Credits to the Rural andUrban Population for Individual HousingConstruction and Other Purpose s
1974 1975 1979 1980 1986 198 7
Total 173 .6 168 .6 233 .1 232 .3 623 .6 931 . 8
Rural Population 151 .6 148 .4 209 .5 205 .8 340 .7 483 . 7Indiv Housing Constr
141 .0 138 .8 173 .8 154 .0 288 .9 406 . 5of whic h
Workers/Employee 19 .9 17 .8 40 .0 35 .8 89 .1 150 . 9Kolkhozniki 17 .7 15 .7 30 .3 43 .5 108 .5 149 . 7Migrants 103 .4 105 .3 103 .5 74 .7 91 .3 106 . 0
Setting up Housekeep 4 .3 3 .8 21 .5 35 .8 24 .0 47 . 9Cows and Calves 6 .3 5 .8 14 .2 16 .0 27 .8 29 . 3
Urban Population 22 .0 20 .2 23 .6 26 .5 282 .9 448 . 1of whic h
Indiv Housing Constr*
16 .9 13 .4 17 .4 19 .6 44 .1 53 . 2Set up House Keeping 3 .2 5 .4 5 .3 6 . 1Capital Improvements 1 .9 1 .4 0 .9 0 . 8
Members of Horticulture 238 .8 394 . 9
Rural
Societies**
87 .33 88 .02 89 .88 88 .59 54 .63 51 .9 1% TotalUrban % Total 12 .67 11 .98 10 .12 11 .41 45 .37 48 .0 9
Ratio : Rural/Urban 6 .89 7 .35 8 .88 7 .77 1 .20 1 .08
Gosbank % Total 87 .33 88 .02 89 .88 88 .59 92 .93 94 .2 9Stroibank % Total 12 .67 11 .98 10 .12 11 .41 7 .07 5 .71
* A breakdown is not available for 1986-198 7** Credit from Gosban k
Source : Finansy SSSR : statisticheskiy sbornik, various years .

Consumer Credit
25
Table 11 : Share of Long-term Bank Credits to the Rural and Urba nPopulation for Individual Housing Construction and Othe rPurposes (in percent )
1974 1975 1979 1980 1986 198 7
Rural Population 100 .0 100 .0 100 .0 100 .0 100 .0 100 . 0
Indiv Housing Constr
93 .0 93 .5 83 .0 74 .8 84 .8 84 . 0of whic h
Workers/Employee 14 .1 12 .8 23 .0 23 .2 30 .8 37 . 1Kolkhozniki 12 .6 11 .3 17 .4 28 .2 37 .6 36 . 8Migrants 73 .3 75 .9 59 .6 48 .5 31 .6 26 . 1
Setting up Housekeep 2 .8 2 .6 10 .3 17 .4 7 .0 9 . 9
Cows and Calves 4 .2 3 .9 6 .8 7 .8 8 .2 6 . 1
Urban Population 100 .0 100 .0 100 .0 100 .0 100 .0 100 . 0of whic h
Indiv Housing Constr
76 .8 66 .3 73 .7 74 .0 15 .6 11 . 9Set up House Keeping 14 .5 26 .7 22 .5 23 . 0Capital Improvements 8 .6 6 .9 3 .8 3 . 0
Members of Horticultur eSocieties
84 .4 88 .1
Source : Table 10 .
3. Credit for Setting up Housekeeping
Young specialists who were settling in the rural regions were eligible to receive a
loan of up to 100 rubles to help with resettlement expenses . This type of loan had a five
year repayment period .
4. Loans for Gardening Cooperative s
Consumer credit was also made available to urban dwellers who were members o f
garden cooperatives for constructing small buildings and improving their garden plots .
This type of consumer credit became available in 1977 after a decision of the Centra l
Committee of the CPSU and the Council of Ministers [Zonov, 1983, p . 25]. The value
of this type of consumer credit reached 1,000 rubles per household, with a repayment

26 Kimberly C. Neuhauser
period of 5 years. In 1981 the maximum value of the loan was increased to 3,000 rubles ,
and a ten-year repayment period was established . These credits were provided in cash
form from a branch of Gosbank, or through the enterprise or organization where th e
recipient worked [Zonov, 1983, p . 25 ; Garbuzov, 1986, p. 454] . Not much information i s
available about this type of credit for consumers, although in the 1986 and 1987 it was a
substantial proportion of credit extended in urban areas as shown in Table 4 .
d. Regional Pattern of Individual Housing Construction Credi t
Out of the total credits available for individual housing construction and othe r
purposes, rural residents have traditionally received the lion's share . This is not a
surprise given the Soviet philosophy of valuing communal property over private property ,
and space constraints in urban areas. Despite the absence of a market for land, it wa s
recognized that land in urban areas was too valuable to be used for low density housing .
In 1974 the value of aggregate credit extended to rural residents for individual housin g
construction and other purposes was 6 .8 times as large as that for urban residents . This
value rose to 8 .8 times in 1979 and then fell sharply to just over parity in 1986 an d
1987 . 21
Of the total value of loans available specifically for individual housin g
construction, rural residents again received the larger share - around 90 percent for th e
years for which data are available . Table 11 shows that among rural residents the shar e
received by migrants was quite large, at nearly three-quarters of the total credit provide d
by Gosbank for individual housing construction in rural areas in 1974 . That amount fel l
both relatively and absolutely over the next decade and a half when compared with
other rural residents . Credit extended to kolkhozniki and workers and employees fo r
individual housing construction was roughly the same, with workers and employee s
receiving the larger portion in the 1970s, and kolkhozniki the larger portion in the 1980s .
21 Note : at this point data are only available for 1974, 1975, 1979, 1980, 1986, 1987 . Figures for 84 an d85 would help identify the beginning of the "garden plots" loans .

Consumer Credit 27
Credit for individual housing construction for these two groups rose by a factor of
roughly 8 .5 . (See Tables 10 and 11 .)
Credit for urban households for the construction of individual housing and othe r
purposes grew by only 20 percent during the six years from 1974 to 1980, from 22 . 0
million rubles to 26.5 million rubles . However, over the next seven years it nearl y
doubled from 26 .5 million rubles in 1980 to 53.2 million rubles in 1987 . Again, because
data on the intervening years are missing it is impossible to tell if this growth was steady
but rapid, or was due to a very sudden increase associated with the perestroika years .
Data from Finansy SSSR allow an analysis of individual housing constructio n
credits on a per capita basis. Table 12 displays the ruble value of credit provision pe r
urban and rural resident for individual housing construction and other purposes. The
value of credit extended for individual housing construction in urban areas for the USS R
as a whole is lower than the rural value by a factor of between 10 and 18 . The average
amount of credit extended per capita in rural areas for the USSR as a whole for the
years 1974, 1975, 1979, and 1980 was 1 .79 rubles. The average extended in urban areas
for that same period was 0 .15 rubles. This probably represents a conscious policy
decision, for zoning ordinances in many cites prohibit individual housing construction .

28 Kimberly C. Neuhauser
Table 12 : Long-term Loans from Gosbank to the Rural Populationfor Individual House Construction and Other Purposes ,By Republi c
(rubles per capita )
1974 1975 1979 198 0
USSR 1 .48 1 .46 2 .12 2 .09RSFSR 1 .11 1 .05 1 .84 1 .5 6Ukraine 3 .07 3 .24 3 .74 3 .6 6Belorussia 0 .19 0 .17 0 .16 0 .2 6Uzbek 0 .49 0 .40 0 .98 0 .84Kazkah 0 .87 0 .81 1 .01 0 .99Geo 0 .97 0 .85 2 .15 1 .70Azeri 0 .63 0 .55 0 .92 0 .9 1Lithuan 8 .87 9 .80 12 .87 24 .12Moldovia 0 .70 0 .65 1 .25 1 .13Latvia 1 .63 1 .19 2 .26 5 .2 3Kirgizia 2 .28 1 .83 4 .90 3 .14Tadzhik 0 .68 0 .52 0 .36 0 .47Armenia 0 .59 0 .39 0 .77 0 .86Turkmenia 0 .64 0 .62 0 .56 0 .5 4Estonia 0 .22 0 .22 0 .45 0 .45
Table 13 : Long-term Loans from Stroibank to the Urban Populationfor Individual House Construction and Other Purposes ,By Republi c(rubles per capita )
1974 1975 1979 1980 1986 198 7
USSR 0 .15 0 .13 0 .14 0 .16 0 .24 0 .2 9RSFSR 0 .11 0 .11 0 .12 0 .14 0 .19 0 .1 8Ukraine 0 .24 0 .19 0 .20 0 .23 0 .30 0 .3 2Belorussia 0 .20 0 .17 0 .11 0 .11 0 .11 0 .1 7Uzbekistan 0 .06 0 .04 0 .08 0 .06 0 .21 0 .3 0Kazakhstan 0 .18 0 .16 0 .19 0 .21 0 .37 0 .9 0Georgia 0 .38 0 .25 0 .27 0 .27 0 .56 0 .7 7Azerbaidzhan 0 .25 0 .17 0 .16 0 .12 0 .36 0 .4 9Lithuania 0 .11 0 .05 0 .05 0 .09 0 .17 0 .1 2Moldovia 0 .45 0 .29 0 .45 0 .44 1 .06 1 .3 9Latvia 0 .06 0 .06 0 .06 0 .06 0 .11 0 .1 1Kirgizia 0 .49 0 .40 0 .29 0 .22 0 .50 0 .7 9Tadzhikistan 0 .08 0 .08 0 .08 0 .07 0 .13 0 .1 9Armenia - - 0 .05 0 .05 0 .04 0 .0 4Turkmenia 0 .26 0 .25 0 .15 0 .15 0 .71 1 .0 0Estonia 0 .10 - 0 .10 0 .10 0 .18 0 .1 8
Credit for rural individual housing construction accounts for most of the credi t
extended for individual housing construction -- roughly 86 percent or more . The ruble
value of credit for individual housing construction per rural resident differed greatly
between republics . For example, in 1980 24 .12 rubles worth of credit per rural resident

Consumer Credit
29
was extended in Lithuania, compared to only 26 kopeks per rural resident in Belorussia .
The overall pattern of credit extension to republics for individual housing construction in
rural areas is an interesting one . In a ranking of republics by the amount of credi t
extended per rural resident for the years for which data are available, 22 a small group of
republics occupied the top four positions . Lithuania, Ukraine, Kirgizia appear all fou r
years and Latvia appears three times. This pattern is surprising since the terms o f
individual housing construction loans are more attractive in hardship areas . Unlike the
ZhSK, where the accumulation of the downpayment by the cooperative is necessary t o
secure a loan, there is no evidence of the need to accumulate a downpayment fo r
individual housing construction. Hence, the regional pattern of ZhSK credit may b e
linked to areas with higher income, but such a link would not be expected for individua l
housing construction .
The republics that received the lowest per capita credit for individual housin g
construction were Estonia and Belorussia which appeared four times in four years .
Armenia, Uzbekistan, Turkmenia and Tadzhikistan each appeared twice in a ranking o f
the lowest per capita receipt of credit.23 What makes these rankings interesting is tha t
they do not exhibit a north-south pattern such as the one found in credit extension t o
ZhSK. Northern republics are found among those that receive high per capita credits a s
well as low: Lithuania and Ukraine in the first position, Estonia and Belorussia in th e
second.
3. Overall Pattern of Housing Construction Credit s
In order to assess the relative positions of the fifteen republics in terms of th e
value of credit extended to households for all types of housing construction, I created a n
index. The "loan rank" index was computed to establish a relative measure that would
22 Data are available for the republics for 1974, 1975, 1979, 1980 .
23 See Table A6 in the Appendix.

30 Kimberly C. Neuhauser
indicate which republics received the highest and lowest share of state bank credit fo r
both individual and cooperative housing construction . 24 These figures show tha t
residents of Lithuania have benefited most from state credit for individual an d
cooperative housing construction, and that residents of Tadzhikistan benefited least .
Most of the republics with high loan rank index values were found in the northern part s
of the USSR. In order of the rank value they included Lithuania, Moldavia, Kirgizia ,
Ukraine and Belorussia . The republics receiving the lowest level of per capita credit
were mostly located in the south and included Turkmenia, Armenia, Azerbaidzhan ,
Tadzhikistan, Uzbekistan and Estonia . Overall then, the availability of credit fo r
housing construction, both cooperative and individual, appears to have been biase d
towards northern regions of the USSR . It should be noted that the pattern observe d
here is based on date from selected years . A more precise pattern could be determine d
if more data were available .
C. State Pawnshops (Lombard)
The system of state pawnshops (lombardy), established during the reign o f
Catherine the Great in 1745, is the oldest type of formal consumer credit institution i n
the Soviet Union, . A state pawnshop offered credit to individuals on the security of
valuables. The state controlled all pawnshops and the services offered by them wer e
considered part of the consumer service (bytovoye obsluzhivaniye) sector of the economy .
Hence, the incomes and expenditures of the state pawnshops are included in th e
consumer services sector [Churkina, 1972, p . 60] .
Two different services were provided by the system of state pawnshops : credit to
consumers on the security of valuables and storage of personal and household items . 25
24 See Appendix B : Notes on the Calculation of the Loan Rank Index .
25 The charge for storing items at a state pawnshop was 4 .7 percent annually on the value of the good .In the case of precious metals, the owner paid 4 .7 percent on the value established by the State Preciou sMetals Department, plus the cost of insurance .

Consumer Credit
3 1
According to an economist writing on consumers' use of the services offered b y
the state pawnshops, " . . . people do not come to the state pawnshop for credit out o f
need, but for cash to join a ZhSK, purchase a car, motorcycle, for a summer vacation . . . . "
[Churkina, 1972, p . 62] . This view differs from the one offered by emigres, who
considered the use of a state pawnshop as a last resort to obtain a loan .
The Typical Regulation concerning the practices of the state pawnshops set limits
on the amount of credit that could be extended given the value of the security . The
value of the loan could not exceed 75 percent of the value of the goods on collateral, o r
up to 90 percent of the value of precious stones and metals, pearls, and gold watches .
There was no limit to the number of items that a person could place in a pawnshop .
Once again, Gosbank was the ultimate lender, as it extended credit to the stat e
pawnshops on the basis of yearly and quarterly financial-production plans. The credi t
from Gosbank and the state pawnshop's own profits made up its level of "statutor y
funding" (ustavnvy fond) . According to Zakharov "bank credit accounts for up to 70
percent of the balance of the outstanding loans of the population on the secured loa n
operations of the state pawnshops" [Zakharov, 1979, p . 22] .
The value of credit extended to the population by the system of state pawnshop s
was 630 million rubles in 1983 and 691 rubles in 1984 [Zakharov, 1986, p . 16] . This is
approximately 2 .3 rubles per capita for those years . In Table 1 this figure is used t o
make the estimate of credit provided by pawnshops for the other years .
D. Trade Union Credit Unions (Kassa Vzaimopomoshchi)
The last type of formal consumer credit institution to consider is the Trade Union
Credit Union or kassa vzaimopomoshchi (KVP) . 26 KVP were established by trade
unions in enterprises, plants and institutes at the initiative of the workers to provid e
26 In this paper I translate "kassa vzaimopomoshchi" as " trade union credit union ." This is not a precis erendering because the word "kassa" in Russian is very flexible, having several meanings : cash register, cashdisbursement window, and cash fund. "Trade union credit union " best captures the essence of the KVP .

32 Kimberly C. Neuhauser
mutual material assistance. They are similar to credit unions in the west in thei r
association with one's place of employment . However, they did not provide saving s
accounts or offer demand deposits . They were funded through small monthl y
contributions from members enabling them to provide loans and small grants . Members '
contributions or dues were a few rubles a month, for a minimum of 25-30 rubles pe r
year. Members could make larger contributions and hold larger sums of money in th e
KVP, thus using the KVP like a savings bank . Some of the advantages of holding large r
sums in the KVP will be discussed below . The KVP offered short-term credit of two
types, very short-term (until the next pay period) and short-term (up to about si x
months). No interest was paid on these loans . When a member withdrew from a KVP
(either through retirement or a change of job) all contributions made to the Fund wer e
returned to the individual, again without interest .
Table 1 above shows that credit extended to the population from KVP was secon d
in size among formal sources, accounting for just under 20 percent of total consume r
credit in 1983 and 1984, and for an estimated 24 to 28 percent in the 1970s . The total
value of consumer credit extended by KVP was 1,761 thousand rubles in 1983 and 1,77 7
thousand rubles in 1984 . On a per worker and employee basis this was 15 .22 and 15 .76
rubles respectively . The other values of KVP credit found in Table 1 are estimate s
based on the 1983 and 1984 data . Thus, values for other years are estimates .
In 1984 in Moscow there were about 10,000 KVPs in operation, with a tota l
membership of over 1 .5 million persons . 27 For the year more than 1 .2 million loans (fo r
a period longer than the next pay period) were made for a total value of more than 30 0
million rubles [Krivenko, 1985, p .1] . 28 If members took out only one loan then about 8 0
percent of Moscow's KVP membership took out a loan and the average value of a loan
27 This is about 28 per cent of the estimated 5,258 .6 thousand workers and employees in Moscow in tha tyear, based on an interpolation of employment data in Moscow from Sotsial'no-ekonomicheskaya razvitia . . . ,for the years 1980 and 1985 .
28 This 300 million rubles of KVP loans constitutes 16 .9 per cent of all KVP loans made in 1984, whil eMoscow only accounts for 4 .5 per cent of workers and employees . Thus all estimates must be taken as veryapproximate .

Consumer Credit
33
was 250 rubles . Unfortunately, no data are available for the decade of the 1970s t o
make a comparison .
1. Structure of the KVP
KVPs were established at enterprises, institutes and organizations by a decision of
the trade union. The basic activities of the KVP are outlined in its charter (ustav) ,
which was based on the "Typical charter of the KVP" as established by the presidium of
the All-Union Central Council of Trade Unions ('VTsSPS') of November 23, 1973 .
A KVP has two main supervisory bodies . The first is the management of th e
KVP. The second body is the auditing committee (revizionaya komissiya) . The trad e
union oversaw all KVP activities .
2. Membershi p
Members of the trade union and persons on the trade union lists (such as retiree s
and female employees staying home to care for small children) in that enterprise ,
institute or education establishment were eligible for membership in the KVP . Members
of the KVP had the right to take out loans, participate in membership meetings, vote o n
policies, elect and be elected to the management of the KVP . Trade union members
who wished to join the KVP submitted a request to the leadership of the KVP .
Pensioners who were still members of the trade union but were no longer working ,
continued to be members of the KVP at the place where they remain on the trade unio n
list. Women temporarily not working in connection with raising children retained th e
right to membership in the KVP until their removal from the rolls of the trade union .

34 Kimberly C. Neuhauser
3. Membership Contribution s
Members of the KVP made a membership contribution of 0 .5 percent of their
monthly official salary . This contribution could be increased at the member's request .
Non-working pensioners contributed 0 .5 percent of their monthly pension ; students on
stipend contributed 0.5 percent of their monthly stipend ; students without a stipend or
women temporarily not-working to raise children, contributed 10 kopeks per month .
During an extended illness members were not required to make their contributions .
The cumulative total of a member's monthly dues was returned to the member
upon transfer to another job . In the event of a member's death, the heirs received the
balance of the member's contributions to the KVP after all loan obligations were met .
Member contributions that were not claimed after three years become the property of
the KVP .
4. Loan s
Loans were made for periods of up to 6 months (although in certai n
circumstances they could be extended for up to 10 months) . These loans were
theoretically limited to one or two times the member's monthly salary . However, a s
mentioned above, some members kept larger amounts of savings in the KVP . Naturally ,
these members could draw upon their own funds at anytime, and thus the KVP replace d
a saving bank . In addition, the management of the KVP looked favorably upon
members with large accounts, as these funds could be used to make loans to others .
Having a good relationship with the management increased the amount that a membe r
could borrow beyond the proscribed amount . 29 Very short-term loans were extended
until the next pay period. These loans were generally less than 30 rubles . Interest rate s
were not charged for loans provided by the KVP. However, a penalty of 1 percent pe r
29 This informal arrangement was described to me by a former member of a KVP in a Moscow institute.

Consumer Credit
35
month on the outstanding balance of an overdue loan was charged [Garbuzov, 1986 p .
24] .
When a loan was not repaid in a timely fashion, the management could tak e
measures of "social" or "material" influence . Measures of social influence included a
summons to appear before a meeting of the management or a discussion of pressure t o
return the loan by the members of the KVP . Measures of material influence include d
fines for late repayment of the loans, which could be deducted from the member' s
wages .
5 . Finances of the KV P
As mentioned above, the cumulative membership contributions were returned t o
the KVP member upon transfer to a new job . In this way the KVP as provided a limited
instrument of saving. The KVP fulfilled a limited role of financial intermediation b y
providing loans based on the cumulative membership dues .
There were some permanent additions to the KVP funds :
Net Income to the KVP
trade union subsidiespenalty paymentsunclaimed membership contribution s
Expenditures of the KV P
payments to the management and auditing committe eloan losses (e .g. death of member with debt )
The enterprise trade union replenished the working capital of the KVP for th e
payment of salaries and bonuses for active members and permanent staff members o f
the KVP . In addition, each year the trade union established a subsidy for the KVP in it s
budget in an amount no less than two percent of the annual plan of receipts of
membership fees to the trade union . In the event of a death of a member with an

3 6 Kimberly C. Neuhauser
outstanding loan, greater in amount than the sum of the accumulated membership dues ,
the management made a request of the trade union for the balance . When the trad e
union granted a subsidy to the KVP it was recorded as an addition to the workin g
capital on the current account of the KVP .
III . Informal Credit
In the previous section I discussed the various forms and values of consume r
credit made available by the state in the formal sector of the economy . The total valu e
of credit made available to consumers was between 20 and 40 rubles per capita annually
in the 1970s and 1980s . This value was very small relative to the total volume of credi t
provided by the state banking system . Whether the amount of credit provided to th e
population by the state was sufficient is not clear . From a planner's point of view, th e
expected demand by Soviet households for credit would have been small : education wa s
free, medical care and housing were highly subsidized, and pensions were guaranteed .
However, the existence of an informal system of credit provision parallel to the stat e
sponsored system implies that the supply of formal credit was either too low to mee t
household needs or was offered in forms or under terms that were unattractive t o
households .
In this section I discuss the nature of informal credit in the Soviet Union unde r
the command-administrative economy. When individuals needed to borrow money for
the purchase of "big-ticket" items such as durable goods, or for special occasion expense s
such as weddings or hospital stays, they would turn to friends or relatives for a loan .
Unique characteristics of Soviet-type consumption markets shaped this informal credi t
mechanism and created the demand for credit and the supply of funds .
Soviet consumption markets were characterized by shortages, low quality good s
and differential access. The shortages of goods meant that supply was unpredictable .
This gave rise to an "opportunity" demand for money -- people carried a lot of cash o n
their person in case the opportunity for a purchase presented itself . This general

Consumer Credit 37
shortage has affected the language . The verb "to purchase" (pokupat') has been replaced
by "to procure" or "to obtain" (dostavat') . Goods are no longer "sold" (prodavat '), rather
they are "given out" (davat') . Even the name for the ubiquitous string bag (avos'ka) that
all citizens carried in their pockets has entered the language as an adverb, `avos', '
meaning "what if. . "
The fact that the supply of durable goods was unpredictable meant that purchases
of durable goods could not be postponed. The individual thus had to be able to reac t
fairly rapidly when an opportunity for purchase presented itself, or forego the stream o f
services provided by the durable good for an undeterminable period .
The generally recognized low quality of consumer goods also contributed to thi s
pattern of carrying cash and reacting quickly . In the rare instance when a high quality
good became available, it was often purchased irrespective of the consumer's immediat e
needs, because it could be resold, traded or perhaps used in the future .
Finally, differential access to goods meant that rubles had different value s
depending on who had them . This goes beyond the system of closed shops and
distributors for the elite, for connections or "blat" determined to some extent what a
ruble could buy . Thus, a ruble in the hands of household "A" could not necessarily buy
the same bundle of goods as a ruble in the hands of household "B ." It can be imagined
that rubles would flow to those who could make the best use of them .
The characteristics of Soviet-type consumer markets described above provided the
basis for the supply of credit, in that individuals had relatively large amounts of cash on
hand . These characteristics also provided the basis of demand, because supply wa s
unpredictable and when presented with an opportunity to purchase a "big-ticket" item ,
individuals would not want to postpone the purchase .
As a result, consumers could not readily translate wealth into the goods of choice .
In addition, the opportunity cost of holding money was negligible . There were no lega l
investment opportunities, minimal inflation, and savings banks paid a fixed and lo w
interest rate, which facilitated the formation of this informal credit mechanism . One

3 8 Kimberly C. Neuhauser
could fairly quickly and easily go to friends and family for loans because they would hav e
lots of cash readily available .
Relatively large sums of money were transferred between households as loans an d
grants . Within an extended family these loans can be explained partially by inter -
generational transfers. In A Treatise on the Family (1981), Becker presents a model fo r
altruistic behavior as a rational economic response . His model describes the type of
behavior that can lead to provision of credit on an informal basis . Within families, this
type of credit provision often takes the form of a gift . 30 However, large sums also flow
between unrelated households, that is, between friends and colleagues .
A. Evidence from the Berkeley-Duke Surve y
The Berkeley-Duke survey is an income and expenditure survey that wa s
conducted among 1,601 emigree households comprising 3,023 individuals residing in th e
U.S. The households emigrated in the 1970s and early 1980s . They were asked about
their income and expenditures in both the formal and the informal sectors of th e
economy during the last normal year (LNY) 31 of their lives in the USSR . On several
accounts the sample is not representative of the parent population . First, the Berkeley -
Duke sample is almost exclusively urban . Second, only ten of the fifteen Soviet republic s
are represented in the sample . 32 Third, the sample has a greater share of "white collar"
workers and a higher level of educational achievement than the parent population .
Finally, because of Soviet emigration policy the sample has a much greater proportion o f
30 According to a 1990 survey made by Goskomstat, 67% of households responded that the reason fo rsaving was to help out their children [Press Byulletin, No 7, 1990] . This may overstate the proportion ofhouseholds that actually saved for this reason, because Soviet citizens tend to respont to surveys with a nanswer they believe is appropriate [Treml, personal communication] .
31 The last normal year or LNY is defined as the last calendar year before the decision to emigrat eeffected the household's material well being.
32 Estonia, Kazakhstan, Kirgizia, Tadzhikistan and Turkmenistan are not represented by emigre ehouseholds in the sample .

Consumer Credit 3 9
persons of Jewish and Armenian nationality than the parent population . 33 Some of
these deviations from the parent population are addressed in the regression analysis i n
Section 2.b. below.
1 . Purchase of a Private Home or Apartmen t
In the Berkeley-Duke survey, 161 of the 1,061 households owned their dwelling
places . 34 Unlike the rest of the survey, the survey questions about the purchase of a
private home or apartment pertained to the year of purchase, not the last normal year
(LNY). The purchase dates for these 161 apartments (apartment will be used in thi s
discussion to refer to all privately held primary dwelling places in the sample) rang e
from 1935 to 1978, with over 50 percent of the purchases made between 1960 to 1975 .
The cost of these apartments ranged from 1,800 rubles to 25,000 . Because of the
vast differences in date of purchase, location, size and other attributes relating to the
value of an apartment, it is impossible to make any direct comparisons on price .
However, the survey does provide information on the downpayment and how it wa s
obtained .
The sources of funds for the downpayment on an apartment included loans, gifts ,
loans from KVP, personal savings, receipts from the sale of personal property, and other
sources . Twenty-two households turned to KVP for loans, 42 received gifts and 50
households took out private loans . Table 14 shows characteristics of the sample as they
relate to these issues:
" For a detailed description of the Berkeley-Duke sample, see the Appendix in Grossman, 1987 .
34 Section VI of the survey asked questions about the purchase of the household's residence ; this sectionof the survey is reproduced in Appendix C .

40
Kimberly C. Neuhauser
Table 14 : Sources of Funding for the Downpayment on an Apartment *
N Mean(rubles)
(std dev) min max
KVP 22 2640 .91 (1517 .10) 100 5000
Privat eLoan 48 1445 .17 (990 .72) 200 5000
Gift 40 1918 .25 (1780 .30) 50 7000
PersonalSavings 107 3781 .31 (4465 .89) 200 30,000
Sales ofPersonalProperty 22 2472 .73 (2033 .10) 100 6000
Source : Berkeley-Duke SurveyNote :
Households made use of more than one source of fund s* Includes dachas and other dwelling s
As shown in Table 14, households turned to private sources to obtain funds for a
downpayment significantly more frequently than to the state sponsored sources . Private
credit in this case takes the shape of loans and grants (gifts) . The other sources show n
in the table were provided by the household, by means of liquidating other assets . Of
the households that turned to informal sources of credit, in 36 cases, only loans wer e
used to make the downpayment; gifts alone were used in 28 cases and both were
obtained by apartment purchasers in 14 cases .
In all but two cases, family members provided all gifts that were received by th e
sample respondents . In those two cases, gifts were received from both family an d
friends. Loans were provided by family in 33 cases (67%), and by friends in 19 cases
(40%). As shown in Table 14, the size of a loan ranged from 200 rubles to 5,000 rubles .
The value of a gift ranged from 50 rubles to 7,000 rubles .
Data from the sample also make it possible to determine, on average, the relative
importance of each of the components of funding for the downpayment . On average, for
those who obtained a loan from an informal source, the loan covered 49 percent of th e
downpayment . For those who received gifts, 57 percent . For those with access to credi t
from KVP, loans from this source covered 95 percent of the downpayment . On average,

Consumer Credit
4 1
across the 161 households that purchased apartments, loans and gifts made up 21 . 7
percent of the funds used .
Table 15 :
Percent of Total Funds Available for theDownpayment on an Apartment
Loans
10 . 2Gifts
11 . 5Personal Savings
60 . 6Sale of Persona l
Property
8 . 0KVP Loans
8 . 5Other Sources
1 . 2
Total
100 . 0
Source : Berkeley-Duke survey
The data provided by the survey respondents on the funding used to purchas e
housing, indicates that informal sources of credit are an important source of credit in th e
absence of state-provided sources .
2 .
Households' Willingness to Lend and Ability to Borro w
Borrowing and lending between households was a relatively common feature of
life in the Soviet Union (much more so than in the West) . As a part of the Berkeley-
Duke survey, households were asked how much they were willing to lend or believe d
they could borrow for a period of six months . 35 Nine hundred fifty five households
(90%) said they could borrow sizeable sums, ranging from 200 to 30,000 rubles . Those
35 The question was stated as follows .If you had needed money for a large purchase, could you have borrowed in the course of afew days from either friends or relative for a six-month period (in the LNY) ?
Yes
No
What maximum amount?
rub .
Appendix C provides an English translation of the parts of the questionnaire that pertain to this study andto household's borrowing, lending and saving habits in the LNY .

42 Kimberly C. Neuhauser
households that said they would lend (875 households or 82%) could have made fund s
available in amounts between 150 to 6,000 .
a .
Relative Magnitudes of the Amounts Households Could Borrow or Woul dLend
The average value of funds that households said they could borrow or would lend ,
differed by region as shown in Table 16 . 36 Regional differences in second econom y
spending levels have been noted in other studies [Grossman, 1987; Gaddy, 1991] .
Table 16 :
Average Amount Respondents Said They Could Borrow o rWould Lend for Six Months37
Region38
N
Mean
StdErr(rubles )
Borrow
Armenia 139 3,500 268 .4 8North 693 1,502 82 .5 1South 136 2,968 432 .0 8
Lend
Armenia 175 3,513 263 .0 2North 721 925 55 .3 2South 138 2,427 486 .49
In order to provide a context for the relative magnitude of the funds available fo r
borrowing and lending it is instructive to look at the ratio of these amounts and severa l
36 The averages presented in Table 16 are statistically distinct . The tests for these differences are foundin Appendix D .
37 The last normal year (LNY) in for households in the sample ranged from 1970 to 1981 . The rublevalues were all indexed to 1977 using the growth in average monthly wages to discount any changes in prices .1977 was chosen as the "base" year, as it was the mean and mode LNY for the sample .
38 The republics represented in the sample were classified as North, South or Armenia . North consist sof Russia, Ukraine, Belorussia, the Baltic republics and Moldavia . The South consists of Georgia ,Azerbaidzhan, Uzbekistan and Kazakhstan . The remaining three republics were not represented in th esample: Kirgiziya, Turkmenistan and Tadzhikistan .

Consumer Credit 43
measures of household income and savings . Table 17 presents the means of these ratio s
for the sample .
Table 17 :
Ratio of Amount Household Could Borrow or Would Len dto Various Income and Wealth Measures
Amount Could
Amount WouldBorrow
Lend(std dev)
(std dev )
Savings inBanka 3 .9 (25 .28) 2 .0 (5 .08 )
EstimatedTotal Savings b .47 (1 .15) .27 ( .38 )
EstimatedCash Holdingsc 1 .6 (2 .60) 1 .2 (1 .99 )
Total Earning sFrom All Sources d .62 (2 .95) .46 (1 .75 )
Estimated Valu eof Property e .63 (1 .18) .45 ( .86)
In this table the amount the household could borrow (would lend )is placed in the numerator, and the various measures of househol dwealth and income are placed in denominator .
Notes :a Total amount added to savings in the LN Yb Total value of savings at the end of the LNYc Estimated as the total additions to cash holding during the LN Yd Includes earnings from work efforts in both the first and second econom ye Value of household possessions as estimated by survey respondent s
The data in Table 17 indicate that the amount households believed they could borro w
was relatively large -- an average of three times the amount they places in savings in th e
LNY, and over half of annual income . Households said they were willing to lend on
average an amount that was over 40 percent of the household's total income for th e
year .
Another interesting feature is that 70 percent of the households which said the y
could borrow funds, said they could do so without signing any sort of promissory note .
Customarily interest payments are not expected or paid . This is surprising for Wester n
economists. However, there is a strong moral aversion to charging interest o n
consumption loans growing out of the early Christian prohibition on interest which wa s

44 Kimberly C. Neuhauser
continued through the Russian Orthodox church . 39 In the Soviet case, this attitude
found support in Marxist dogma . This attitude toward interest payments was confirme d
in a 1991 study comparing the attitudes of Soviet citizens and Americans about variou s
aspects of a market economy . The investigators found that only 6 percent of the Sovie t
citizens surveyed would charge interest on a loan of six-months duration, compared wit h
29 percent of Americans [Shiller et al ., 1991, p. 393V0 Unfortunately, we do not know
whether the Soviet respondents interpreted the question as a loan for consumption or a
loan for investment purposes .
b. Regression Analysis of Households' Abilities to Borrow and Len d
In this section I analyze the determinants of a household's ability to borrow o r
lend money to friends or relatives in the manner described above. The following mode l
was used for a series of regressions, with the household's ability to borrow as the
dependent variable :
Borrow = a + b(Legitimate Income) + c(Informal Income) + d(Connections) +e(Average Age) + f(Education) ;
and for the household's ability to lend :
Lend = a + b(Legitimate Income) + c(Informal Income) + d(Connections) +e(Average Age) + f(Education) ;
The value for Borrow or Lend was the value in rubles that the respondent said the y
could borrow or lend for six months, indexed to 1977 values . Legitimate incom e
39 The prohibition against usury on the part of laymen was codified at the first Council of Carthage in 34 5[New Catholic . . . .p . 499] . Centuries later, interest charges became acceptable in the countries that were largel yProtestant [Eliade, 1987 . p 363] . This development did not occur in regions influenced by Russian Orthodoxy .
40 It is interesting to note, however, that this is not the case for loans made in hard currency. It i sgenerally expected that interest will be paid on a loan made in hard currency. A former MVD colonel, wit hresponsibilities for economic crimes said in an interview that he had seen little evidence of usury, and in fac tthat interest payments were not expected unless the project was successful . He estimated that between 20 and30 per cent of the profits would be considered about right . [personal communication, 1993] .

Consumer Credit 45
included total wages, transfers, and interest income on saving accounts for th e
household . Informal income included all the income to the family from non-stat e
sources, such as income from renting out a dacha, selling produce from a private plot ,
work on own account and so forth . The variable Connections was the respondents '
estimates of the ruble value of connections ; for example, it included the monetary valu e
of savings by purchasing goods or services through friends and acquaintances . The ruble
values for income and connections were also indexed to 1977 . The Average Ag e
variable is the average age of the spouses in the household . Education was the highest
level of educational attainment by either spouse measured in years . The results are
presented in Table 18 .
Table 18 :
Parameter Estimates for Regressions
Part A : Total Sample
t-stat
-2 .942
Lend
Intercept
Coefficient
t-statBorrow
Intercept
Coefficient
697 .952 -608 .953
-2 .610Legit .
Inc 0 .339 7 .687 Legit .
Inc 0 .222
5 .14 5Other Inc 0 .349 12 .958 Other Inc 0 .406
15 .22 1Connections 0 .307 2 .826 Connections 0 .179
1 .66 5Avg Age 14 .407 4 .351 Avg Age 21 .94
6 .77 5Education 14 .7 1 .064 Education -19 .863
1 .467
N 925 N 98 9Adjusted R2 0 .244 Adjusted R2 0 .25 8
Part B : Leningrad
t-stat
-2 .706
Lend
Intercept
Coefficient
t-statBorrow
Intercept
Coefficient
-1126 .048 -602 .443
1 .68 5Legit .
Inc 0 .377 8 .140 Legit .
Inc 0 .236
5 .96 3Other Inc 0 .392 5 .284 Other Inc 0 .327
5 .03 1Connections 0 .449 3 .754 Connections 0 .512
4 .82 7Avg Age 18 .116 4 .090 Avg Age 16 .745
4 .33 8Education 28 .237 1 .253 Education -8 .582
0 .43 2
N 280 N 29 2Adjusted R2 0 .368 Adjusted R2 0 .332

46 Kimberly C. Neuhauser
Part C : Yerevan
LendBorrowCoefficient t-stat Coefficient
t-stat
Intercept -234 .996 0 .404 Intercept -257 .326 0 .472Legit .
Inc 0 .011 0 .079 Legit .
Inc 0 .131 1 .132Other Inc 0 .296 7 .216 Other Inc 0 .376 9 .21 1Connections 0 .786 2 .388 Connections 0 .478 1 .488Avg Age 11 .862 1 .263 Avg Age 16 .13 1 .934Education 18 .909 0 .673 Education -14 .890 0 .55 1
N 142 N 17 6Adjusted R2 0 .397 Adjusted R2 0 .426
Source : Berkeley-Duke Survey
In Table 18 the coefficients and t-statistics are presented for regressions on th e
entire sample and for two cities, Leningrad and Yerevan . For both borrowing and
lending in all three areas, the coefficient on education was never significant, signifyin g
that the level of educational attainment is not an important factor in determining a
household's ability to borrow and lend. Turning to the entire sample, the coefficients on
all other independent variables were significant for both borrowing and lending, excep t
for Connections which was not significant for lending . The results from the regressions
on the Leningrad sub-sample follow the pattern of the total sample most closely .
Connections were significant for a household's ability to borrow in all three cases ,
as I would expect . The coefficients on Legitimate Income and Other Income ar e
significant for both borrowing and lending, and virtually the same for the total sampl e
and for the Leningrad sub-sample . However, Legitimate Income is not significant in
either case for the sub-sample from Yerevan . Informal income is the only independent
variable with explanatory power for the ability to lend for the Yerevan sub-sample ;
Informal Income and Connections are the only significant independent variable fo r
explaining the household's ability to borrow. Despite the fact that so few independen t
variables are significant for the Yerevan sub-sample, they generated the largest value o f
the R2s. This supports other evidence that informal economic activities are especiall y
important in Armenia [See Alexeev, 1993b ; Grossman, 1987] .

Consumer Credit 47
3 .
Other Sources of Informal Credit
a. "Chernaya Kassa "
Another informal credit mechanism used in the Soviet Union is the "chernaya
kassa." 41 There is not a good English term for this phenomenon, but by its function i t
is similar to the rotating credit societies found in developing countries . (See discussio n
below; also Besley et . al., 1990; Geertz, 1962 .) A "chernaya kassa" functions in the
following manner: a group of people agree to participate, usually colleagues at work o r
a circle of friends. Each month every participant contributes a fixed amount such as 1 0
rubles. One person gets the "fund" each month in a predetermined order . In this wa y
the "pot" is passed around equally . Some "chernaya kassa" groups deal with fairl y
sizeable sums of money and the fund is used to buy tools and equipment (Berkeley -
Duke Project Interview N2N4-92SEK) . For example, large scale undergroun d
production of goods require such informal credit arrangements. Unfortunately, the
Berkeley-Duke Project has not been able to measure or otherwise quantify them .
b. Other informal arrangements
Fairly large scale informal credit arrangements do appear in other spheres . A
recent book on organized crime in the USSR described the fairly complex financia l
arrangements that have grown up to support this new phenomenon [Gurov, 1990] . It
appears that there are assistance funds (similar in spirit to the KVP discussed in Sectio n
II) called "obshchak" set up by members of criminal organizations to support members o f
the organization in Soviet prisons and work colonies . In addition, pensions and socia l
security for members is provided . "Loans" are made to help new members start out i n
new "businesses ." The funds for this are generated by "taxing" the activities of variou s
"' This term might best be translated as "shadow" funds, for "chernaya" means black, but can also mea nshadow, and is also used to refer to the "black" markets or "shadow " markets, which are also informal .

48 Kimberly C. Neuhauser
actors: drug dealers, thieves, protection racketeers and others . While there is n o
concrete evidence, there is probably a similar financial infrastructure that has grown u p
to support the activities of production in the "crypto-private" economy . There is some
overlap in the spheres of activity between organized crime and underground production
[Vladimir Treml, 1991 personal communication] .
Section IV The Sources of Informal Credi t
A.
Origins of Demand for Informal Credit in the USS R
The demand for credit is generated by a mismatch between a household's incom e
and expenditure flows. This is quite understandable especially in the case of th e
purchase of a durable good which provides a stream of services, but the payment mus t
be made in advance . The demand for informal credit is generated by a shortage in th e
supply of credit provided by formal sources, which in the Soviet case is by the state
banking system . Some of the reasons for turning to informal sources of credit in th e
Soviet Union are best illustrated by the following transaction .
Recently, a young Moscow professional wanted to move his family from
the suburbs to the center of the city to avoid long commutes and make i t
possible for his son to attend better schools . An older couple renting a
government owned apartment in the center of town was willing to make a n
apartment swap . The "price" for this exchange was 12,000 rubles . The
young professional was able to raise 8,000 rubles in one day from friend s
and family -- an amount greater than one and a half times his annua l
official salary [personal communication] .
This transaction has the main elements that give rise to the demand for informal credit ,
and reflect the unique Soviet circumstances :
1 . a durable good or "big-ticket" item was desired ;

Consumer Credit 49
2. the transaction was not strictly legal, as the receipt would be construed a s
"unearned income" ; and,
3. the opportunity for the purchase appeared somewhat randomly and coul d
not be postponed .
Uncertainty over the availability of a good (point 3 . above), gives rise to an
"opportunity" demand for money, somewhat like the precautionary demand for money .
For many purchases of this type there is a bribe or side payment included in the actua l
price the consumer paid . The uncertainty in this transaction is not solely associated wit h
the "addition" to an official price . Gaddy [1991] has shown that there is fairly wide -
spread knowledge of the "hidden wage" component for many occupations in the Soviet
Union. The "hidden wage" is the extra income that one has the opportunity to earn
associated with one's job or position . In a similar fashion the "bribe" component of th e
final price of many goods and services (cars, apartment swaps, placement in a particula r
school, and so forth) would also be widely known .
In addition, because part of the purchase price involves a payment that is no t
strictly legal (point 2. above), even if consumer credit were more widely available, Sovie t
citizens would not be able to turn to those sources .
B .
Source of Supply of Informal Credi t
In this section I briefly discuss the literature on informal credit markets and th e
applicability to the Soviet consumer markets .
1 .
General Reasons for the Development of Informal Credi tMarkets and Instruments
Informal credit markets in developing countries have been studied extensively,
with most economists agreeing that the informal mechanisms which have grown out o f
these situations have a sound economic basis, and have responded fairly effectively to

50 Kimberly C. Neuhauser
mitigate the problems raised by adverse selection and moral hazard . The discussion that
follows is based on Basu [1984], Bell [1988], and Stiglitz [1988] .
a. Absence of better savings instrument s
Credit is often rationed in developing countries, hence the return for placin g
funds in an official institution may be much lower than that available in the "market . "
Similarly when credit is rationed, it may not be possible for an individual to borrow fro m
official sources. Hence, two individuals can be made better off by trading claims ove r
goods in different periods . Financial intermediation is not necessary when two
individuals can transact with a double co-incidence of wants .
b. Monitoring costs lowered through knowledg e
Local money lenders in developing areas have generally been more successfu l
than state-sponsored institutions in providing credit . Bell shows that this is not strictly a
case of monopoly power on the part of the local money lender, but that a loca l
inhabitant is better suited to evaluate the risk of default for any particular loan, and th e
value of any collateral offered as part of the bargain . Information is also fairly
widespread about the ability to pay of individuals and households in small villages o r
between co-workers . Persons with this sort of intimate knowledge are well placed t o
evaluate the risk of a loan .
2. Rotating Credit Societie s
One example of an informal credit mechanism is a rotating credit society .
Rotating savings and credit associations (Roscas) are found all across the developin g
world -- in Asia, Africa, and Latin America . This is similar to the "chernaya kassa "
found in the Soviet Union discussed above . These institutions serve primarily as a

Consumer Credit 5 1
means to save up for indivisible or durable goods and for large events . Roscas take
many forms, but the basic structure is this : A group of people gather on a regular basi s
for a fixed number of periods, each contributing a fixed amount to the "fund ." The fun d
is received by one member each period, decided by bidding, lot or in an order agreed
upon in advance. After a member has "won" the fund, he or she continues to contribute
until the end of the period .
Traditional values (such as honoring obligations) contribute to the successfu l
functioning of the credit society . In addition, mobility is limited, so the likelihood o f
"skipping town" with the fund before completing one's obligations is low . In addition,
since all members know each other well, the cost of monitoring use of the funds is low ,
and the members are in a good position to evaluate a recipient's ability to repay th e
loan. Geertz [1962] describes several forms of rotating credit societies from around th e
world and observes that as the overall economy becomes more monetized an d
developed, interest repayment plays an increasingly important role in this type o f
informal credit mechanism .
The nature of inter-household credit in the Soviet-type economy was close i n
spirit to the rotating credit society . Households knew each other well, hence monitorin g
costs were not great ; mobility was to some extent limited (by virtue of the necessity o f
procuring permits to live in certain cities and wide-spread housing shortages) .
Besley, Coate and Loury [1990] have developed a general equilibrium model of a
rotating credit savings and credit association . In their model, individuals are mad e
better off by joining a rosca than trying to save up for a durable good on their own . In
addition, they have the surprising result that a random roscas may under certai n
circumstances yield a higher level of expected utility than a perfectly competitive credit
market .

5 2 Kimberly C. Neuhauser
3.
Specific to the Sovie t Case42
The conditions in Soviet society under the command- administrative economy
system that gave rise to informal household provision of credit may be described by th e
following example . In Figure 1 savings grow at a fixed rate for a typical individual ,
denoted by the ray from the origin, OA. At time t=1 the individual has saved 10 0
rubles. Also at time t=1, a friend asks to borrow 100 rubles until time t=2 . If th e
individual chooses not to make the loan, savings will grow at the rate indicated by OA. If
the loan is made, then savings follows the path indicated by the discontinuous broke n
line OB. In this instance, the friend has offered to pay interest on the loan, although a s
discussed above, this is not important in the individual's decision to make the loan .
Figure 1
Hence, at time t=2 the individual's savings return to their original path, increased by th e
payment of interest . (Although, as mentioned above interest payments are generally not
expected . )
Why is the lender willing to make this loan, drawing his own resources down to zero ?
There are several possible reasons :
1 .
The lender believes the likelihood of default is small ;
42 A formal model and of this phenomenon is developed in my dissertation, "The Impact of Suppl yUncertainty on Informal Credit Mechanisms : The Case of Russia," Duke University, forthcoming .

Consumer Credit 53
2.
The lender believes in his own ability to raise funds to make a purchas e
should the opportunity arise in the time period before repayment ;
3.
The lender recognizes that his provision of a loan increases the likelihoo d
of procuring a loan from the recipient in the future ;
4.
During the period of the loan (and perhaps afterward) the recipient ma y
be obligated to provide the lender other non-monetary benefits -- use of
car, dacha, services. These are not explicit "payments", but may serve the
same purpose as interest payments in providing the agent with som e
benefits for the use of his savings ; and
5.
More attractive savings instruments may not be available .
6.
The agent sees that the opportunity to purchase a good during the perio d
has a probability distribution; that is, the availability of the good is no t
guaranteed .
One of the significant findings relating to the success of local money lenders i n
developing countries, is the fact that they know their clientele well, and are in a goo d
position to judge the creditworthiness of potential borrowers . This relates to point 1 .
above: Who better to judge the creditworthiness of a person than close friends and co -
workers? [Bell, 1988 ]
With respect to the availability of goods, the lender recognized that goods ar e
available only unpredictably. However, the lender may have a belief about what the
probability of obtaining a particular good is. The probability may be some function o f
the following :
connection sagelocationoccupation (For example, those in the retail trade sector certainly have
greater access to consumer goods, for example)

5 4 Kimberly C. Neuhauser
Because individuals have differing views of their probability of obtaining goods,
rubles will have differing values at any point in time. These differences in the subjective
value of the ruble also drive part of the informal market for credit in the USSR .

Consumer Credit 55
V. Conclusion
The nature of consumer credit in the former Soviet Union has been poorl y
researched in both the West and the USSR. This paper describes the formal or state
sponsored system of consumer credit, estimates the total value of credit extended, and
describes the nature of informal credit mechanisms . Soviet citizens relied heavily upo n
these informal lines of credit to purchase durable goods and make semi-legal cas h
transactions .
Several features of the Soviet economic system made these informal credi t
arrangements possible and necessary . Official sources of credit were planned an d
rationed, and consumers did not necessarily have equal access to goods and/or credit .
The opportunity to make a purchase arose unpredictably and suddenly . This increased
the transactions cost of every purchase ; hence individuals needed to obtain cash quickly .
For many goods much of the purchase "price" of the good included a bribe or were i n
some other way illegal/semi-legal . In large part these informal credit arrangements
developed in response to the uncertainty inherent in the command-administrativ e
economy of the Soviet Union .
Under perestroika and in the current period of economic transition, the levels of
uncertainty are even higher than before . Former official sources of credit ar e
undergoing change, and new institutions have not yet taken root. Under these
conditions, informal credit markets will continue to play a vital role in providin g
liquidity. Successful new institutions of financial intermediation should take into accoun t
those aspects of Soviet behavior that are manifest in the informal credit market s
described above .

56 Kimberly C. Neuhauser
Appendix A: Tables
Table Al :
Value of Outstanding Debt at the End o fthe Year extended by State Bank s
TotalShort-Term
Long-Term
Short%Tota l
1970 126234 104739 21495 0 .831971 137029 111565 25464 0 .8 11972 150541 120859 29682 0 .801973 168880 134660 34220 0 .801974 188709 149269 39440 0 .7 91975 204044 160715 43329 0 .7 91976 227868 177397 50471 0 .7 81977 254037 193733 60304 0 .7 61978 274920 206060 68860 0 .7 51979 300397 225020 75377 0 .7 51980 342464 261394 81070 0 .7 61986 452562 356637 95925 0 .7 91987 432130 334738 97392 0 .77
Source : Finansy SSSR : statisticheskiy sbornik, various years .
Table A2 :
Sales to the Population of Goods Through State An dCooperative Stores (thousand units )
1970 1975 1980 1985 1988
Radio Equipment 5870 7591 6634 6894 708 1Television Sets 5580 6002 6523 8116 8409Cameras 1337 1773 2315 2008 211 4Bicycles and Moped 4198 4368 4639 5132 566 9Motorcycles 816 1033 1210 1171 128 8Sewing Machines 1257 1237 1204 1304 140 2Watches 28240 35536 40257 48581 5242 8Refrigerators/Fre 3756 4823 4910 4430 479 3Washing Machines 4135 3241 3538 4487 553 6Tape Recorders 984 21902 2755 4458 572 9
Source : Torgovlya SSSR,
1989, pp . 152-157 .

Consumer Credit
57
Table A3 :
Installment Credit Sales of Durable Goods toHouseholds (thousand units )
Radio Equipmen tTelevision Set sCamera sBicycles and Mope dMotorcyclesSewing Machine sWatche sRefrigerators/Fr eWashing MachinesCamera Equipment
197 0
83 3
3 233 421 214 813 6--
12 .3
1975
1980
962
6593186
191931
3 9258
19 2179
15 7193
5 6199
246
1985
78 6308 9
17 131 5
18 7101 3
1101 2
Consumer
1988
7992683
144303
14 783 7
9 01 2
Goods
- 863-
22 010 .3
9 . 1
Source : Torgovlya SSSR,
1989 . p . 172 .
Price forTable A4 :
Average Retail Trad e(rubles per unit )
1970
1975
1980 1985 1988
Radio Equipment 71 .25
88 .71
105 .55 110 .63 120 .38Television Set s
Color 774 .34
650 .22
706 .87 643 .99 713 .19Black & White 329 .84
313 .8
229 .36 229 .1 216 .7 8Cameras 33 .38
37 .58
63 .36 71 .76 62 .63Bicycles and Mopeds 63 .1
64 .15
79 .04 77 .6 81 .5 2Motorcycles 592 .85
668 .62
824 .99 964 .81 1010 .7 9Sewing Machines 67
87 .25
124 .8 142 .04 149 .03Watches 17 .3
21 .1
27 .77 23 .64 24 .03Refrigerators /
Freezers 214 .51
244 .58
249 .66 288 .11 316 .8 3Washing Machines 92 .16
87 .04
88 .61 94 .61 94 .58
Source : Torgovlya SSSR, 1989, p . 92
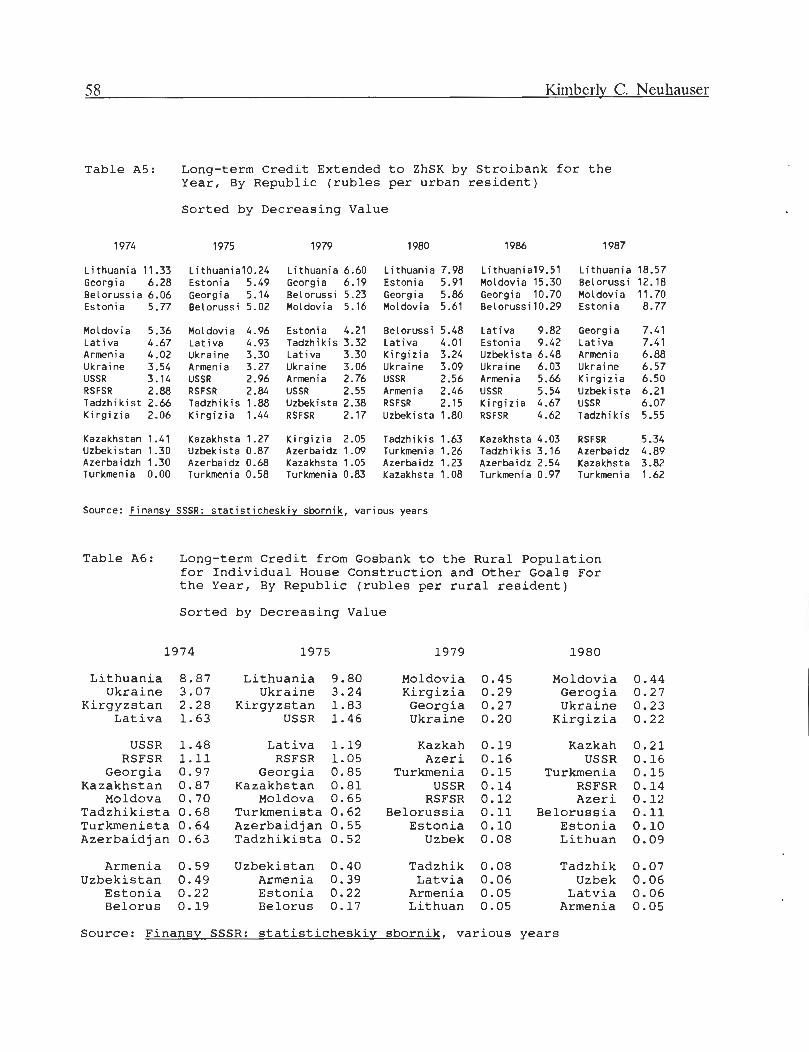
58
Kimberly C. Neuhauser
Table A5 :
Long-term Credit Extended to ZhSK by Stroibank for th eYear, By Republic (rubles per urban resident )
1974
Sorted by Decreasing Valu e
1975
1979 1980
1986 1987
Lithuania 11 .3 3Georgia 6.28Belorussia 6.06Estonia
5 .77
Moldovia
5 .36Lativa
4 .67Armenia
4 .02Ukraine
3 .5 4USSR
3 .1 4RSFSR
2 .88Tadzhikist 2 .66Kirgizia
2 .06
Kazakhstan 1 .4 1Uzbekistan 1 .3 0Azerbaidzh 1 .3 0Turkmenia 0 .00
Lithuania10.24 Lithuania 6 .60
Lithuania 7 .98 Lithuania19.51 Lithuania 18 .57
Estonia
5 .49
Georgia
6.19
Estonia
5 .91
Moldovia 15 .30
Belorussi 12 .1 8
Georgia
5 .14
Belorussi 5 .23
Georgia
5 .86
Georgia 10 .70
Moldovia 11 .70
Belorussi 5 .02
Moldovia 5 .16
Moldovia 5 .61
Belorussi10 .29
Estonia
8 .77
Moldovia 4 .96
Estonia
4 .21
Belorussi 5 .48
Lativa
9.82
Georgia
7 .4 1
Lativa
4 .93
Tadzhikis 3 .32
Lativa
4 .01
Estonia
9.42
Lativa
7 .4 1
Ukraine
3 .30
Lativa
3 .30
Kirgizia 3 .24
Uzbekista 6 .48
Armenia
6 .8 8
Armenia
3 .27
Ukraine
3.06
Ukraine
3 .09
Ukraine
6 .03
Ukraine
6 .57
USSR
2 .96
Armenia
2 .76
USSR
2 .56
Armenia
5 .66
Kirgizia
6 .5 0RSFSR
2 .84
USSR
2 .55
Armenia
2 .46
USSR
5 .54
Uzbekista 6 .2 1Tadzhikis 1 .88
Uzbekista 2 .38
RSFSR
2 .15
Kirgizia 4 .67
USSR
6 .07
Kirgizia 1 .44
RSFSR
2.17
Uzbekista 1 .80
RSFSR
4 .62
Tadzhikis 5 .5 5
Kazakhsta 1 .27
Kirgizia 2 .05
Tadzhikis 1 .63
Kazakhsta 4 .03
RSFSR
5 .34
Uzbekista 0 .87
Azerbaidz 1 .09
Turkmenia 1 .26
Tadzhikis 3 .16
Azerbaidz 4 .89
Azerbaidz 0 .68
Kazakhsta 1 .05
Azerbaidz 1 .23
Azerbaidz 2 .54
Kazakhsta 3 .82
Turkmenia 0 .58
Turkmenia 0 .83
Kazakhsta 1 .08
Turkmenia 0 .97
Turkmenia 1 .62
Source : FinansySSSR :statisticheskiy sbornik, various year s
Table A6 : Long-term Credit from Gosbank to the Rural Populatio nfor Individual House Construction and Other Goals Fo rthe Year, By Republic (rubles per rural resident )
Sorted by Decreasing Value
1974
1975
1979
198 0
Lithuania 8 .87
Lithuania 9 .80
Moldovia 0 .45
Moldovia 0 .44
Ukraine 3 .07
Ukraine 3 .24
Kirgizia 0 .29
Gerogia 0 .2 7
Kirgyzstan 2 .28
Kirgyzstan 1 .83
Georgia 0 .27
Ukraine 0 .2 3
Lativa 1 .63
USSR 1 .46
Ukraine 0 .20
Kirgizia 0 .2 2
USSR 1 .4 8RSFSR 1 .1 1
Georgia 0 .9 7Kazakhstan 0 .8 7
Moldova 0 .70Tadzhikista 0 .68Turkmenista 0 .64Azerbaidjan 0 .63
Lativa 1 .19
Kazkah 0 .19
Kazkah 0 .2 1
RSFSR 1 .05
Azeri 0 .16
USSR 0 .1 6
Georgia 0 .85
Turkmenia 0 .15
Turkmenia 0 .1 5
Kazakhstan 0 .81
USSR 0 .14
RSFSR 0 .1 4
Moldova 0 .65
RSFSR 0 .12
Azeri 0 .1 2
Turkmenista 0 .62
Belorussia 0 .11
Belorussia 0 .1 1
Azerbaidjan 0 .55
Estonia 0 .10
Estonia 0 .1 0
Tadzhikista 0 .52
Uzbek 0 .08
Lithuan 0 .09
Armenia 0 .59
Uzbekistan 0 .40
Tadzhik 0 .08
Tadzhik 0 .07
Uzbekistan 0 .49
Armenia 0 .39
Latvia 0 .06
Uzbek 0 .06
Estonia 0 .22
Estonia 0 .22
Armenia 0 .05
Latvia 0 .06
Belorus 0 .19
Belorus 0 .17
Lithuan 0 .05
Armenia 0 .05
Source : Finansy SSSR : statisticheskiy sbornik, various years

Consumer Credit
5 9
Appendix B : Notes on the Calculation of Loan Rank Index
The loan rank index was computed to establish a relative measure of the credit tha t
would indicate which republics received the highest and lowest share of state bank credit
for housing construction . Data for ihc was available for rural and urban residents fo r
1974, 1975, 1979, 1980 . Data was available for cooperative housing construction fo r
urban residents for six years - the four listed above plus 1986 and 1987 . The value of
per capita credit for each republic was ranked for each year . A count was made of the
number of times a republic fell in the top four positions and the bottom four position s
for the years above. These counts are shown below .
Individual Individual CooperativeHousing Housing HousingConstruction Construction ConstructionRURAL URBAN URBAN
Max = 6Max = 4 Max = 4
Top FourLith 4 Mold 4 Lith 6Uk
4 Bel 2 Geo 5Kirg 4 Uzbe 2 Belo 5Lat
3 Lith 2 Est 4USSR 1 Geo 2 Mold 4
Uk 2Kirg 2
Bottom FourArm 4 Kaz 6Est 4
Belo 4 Lat 3 Turk 6Arm 2 Tadz 2 Azer 6Uzbe 2 Azer 2 Uzbe 2Turk 2 Est 1 Tadz 2Tadz 2 Turk 1 Kir 1
RSFSR 1 RSFSR 1Uzbe 1Geo 1
The number of times the republic appeared was divided by the number of years for eac h
type of credit and these figures were summed to create the loan rank values presente d
below. A value of 3 .00 indicates that the republic appeared in that category every yea r
for which data are available .

60 Kimberly C. Neuhauser
Republics receiving highest
Republics receiving lowestper capita credit for
per capita credit fo rhousing construction
housing constructio n
High Rank Index
Low Rank Index
Litunania 2.500 Turkmenia 1 .750Moldavia 1 .667 Armenia 1 .500Kirgizia 1 .500 Azerbaid 1 .500Ukraine 1 .500 Tadzhikis 1 .333Belorussi 1 .333 Estonia 1 .250Georgia 1 .333 Uzbekista 1 .083Lativa 0.750 Belorussi 1 .000Estonia 0.667 Kazakstan 1 .000Uzbekista 0.500 Latvia 0.750USSR 0.250 RSFSR 0.41 7
Georgia 0.250Kirgizia 0.167
These figures show that residents of Lithuania have benefited most from state credit fo r
housing construction, and that residents of Tadzhikistan have benefited least . Most of
the republics with high loan rank values were found in the northern parts of the USSR ,
the major exception being Kirgizia, which ranks third on this index . The reverse is true
for the ranking of republics receiving the lowest levels of percapita housing constructio n
credit. Five of the six republics which the lowest level of credit were southern, th e
exception being Estonia. Four of these republics were in Central Asia .
One issue which needs to be cleared up is that of the mechanism which trigger s
the state credit . If state credit for housing construction is a function of the populations
savings then credit for housing construction is most likely to flow to republics with highe r
incomes. This poses a problem for the two republics that seem misplaced : Kirgizia, wit h
a high value in the in the high credit receipents' column, and Estonia in the othe r
column .

Consumer Credit
6 1
Appendix C
Translation of the Berkeley-Duke Household Budget Surve yQuestions that are relevant to the issues of private borrowingand lending .
IX . Family Possessions and Saving in the LN Y
4. What was your family's total debt at the end of th eLNY ?
a . to state, cooperative and social entities(excluding payments in connection with house o rapt)? rub .
b . to private parties
rub .
5. During the LNY, what amount did your family pay asprincipal repayment and interest (per month or year )
Per
PerMonth Year
a. to state, cooperative and social entitie s(excluding payments in connection with house orapt) ?
b. to private partie s
6 .
How much did you family put aside as savings in th ecourse of the LNY?
rub .
7. As is generally known, in the USSR private persons donot have access to a system of bank credit . As aresult, people are frequently forced to borrow fro meach other to an extent which is less accepted in theWest, but which is considered perfectly normal in theUSSR . If you had needed money for a large purchase, i nthe course of a few days could you have borrowed fro meither friends or relative for a six-month period (i nthe LNY)?
Yes
No
What maximum amount?
rub .
8. If a friend or relative had turned to you with such arequest and you wanted to help him, what was th emaximum amount you could have lent him for a six-monthperiod? rub .
With a promissory note or without?
(underline)

62 Kimberly C. Neuhauser
X . The Family's Income in the LNY
5 .
How much interest did your family earn :
a . from the state (on passbook savings, bonds, etc .) ?rub .
b. from private parties?
rub .
6 .
How much support (non-repayable) did your famil yreceive from relatives?
rub .
7 .
Total amount of installment credit received by you rfamily in the LNY :
rub .
8 .
Total amount of money borrowed by your family durin gthe LNY :
a. from credit unions and "chernaya kassa"(to whic hco-workers voluntarily and systematicallycontributed certain amounts)
rub .b. from private persons (including relatives)
rub .

Consumer Credit
63
Appendix DMeans Tests to Determine Regional Variation in the Amounts that Household sSaid They Could Borrow or Len d
Means tests were run to determine whether the values from different regions o f
the Soviet Union were statistically different . The results are presented in Table Dl .
Table Dl : Means Tests : Values of t-Statistic s
Region N Mean StdErr t
Borrow
Armenia 139 3,500 268 .4 8Rest 829 1,740 100 .53 -6 .5360
North 693 1,502 82 .5 1South 136 2,968 432 .08 -5 .493 4
Len/Mos 341 1,489 111 .0 5North 352 1,515 121 .86 -0 .155 9
Lend
Armenia 175 3,513 263 .02Rest 859 1,167 92 .63 -9 .898 1
North 721 925 55 .3 2South 138 2,426 486 .49 -6 .0734
Len/Mos 355 850 72 .40North 366 998 83 .26 -1 .3404
Source : Berkeley-Duke survey
The test statistics were calculated according to the following :
JSel + Se2
Here, p. and µ2 are the computed averages, and sel and Se 2 are the respectivestandard errors of the means .
Absolute values of t greater than 1 .697, indicate that the averages are statisticall y
different at the 95 percent confidence level . Clearly, Armenia differs from the rest o f

64 Kimberly C. Neuhauser
the USSR, and there is a difference in the amount a household is willing to lend an d
believe is able to borrow between the North and the South . There is no statistica l
difference between Moscow/Leningrad and the rest of the North . This test was
conducted to check for any differences between these two largest, most cosmopolita n
cities, and the rest of the urban north .

Consumer Credit
65
References
Alexeev, Michael . "The Current Conditions and Reform in the Housing Sector of theFormer Soviet Union," in Joint Economic Committee, U .S. Congress, The FormerSoviet Union in Transition . Vol. 2, pp. 837-888 . Washington: GovernmentPrinting Office, 1993a .
. "A Ruble is a Ruble, Or Is It?" in Essays on Second Economy Markets ,Berkeley-Duke Occasional Papers on the Second Economy in the USSR . PaperNo. 37, December 1993b .
. "Soviet Residential Housing : Will the "Acute Problem" be Solved?" in Join tEconomic Committee, U .S . Congress, Gorbachev's Economic Plans . Vol. 2, pp .282-296 . Washington : Government Printing Office, 1987 .
Basu, Kaushik . The Less Developed Economy: A critique of Contemporary Theory.Oxford:Basil Blackwell, 1984 .
Becker, Gary S . A Treatise on the Family . Cambridge : Harvard University Press, 1981 ,esp. Chapter 8 : "Altruism in the Family," pp. 172 - 201 .
Bell, Clive . "Credit Markets and Interlinked Transactions," in Chenery, H . and T. N.Srinivasan, eds . Handbook of Development Economics . Amsterdam : ElsevierScience Publishers, 1988, pp . 763 - 830 .
Besley, Timothy, Stephen Coate and Glenn Loury . "The Economics of Rotating Saving sand Credit Associations," MIT Department of Economics Working Paper . PaperNo. 556, May 1990 .
Chernetsov, S . A. "Finansovo-kreditnyy mekanizm razvitiya kooperativnogo zhilishchnog ostroitel'stva (The Financial-Credit Mechanism of Cooperative Housin gConstruction) ." Finansy SSSR . Jan . 1987, pp . 52 - 55 .
Churkina, Z. "Lombard kak predpriytiye bytovogo obsluzhivaniya (The Pawnshop as anEnterprise in the Everyday Consumer Services Sector) ." Dengi i kredit, No . 7(1972) pp . 60-63 .
Eliade, Mircea, ed . The Encyclopedia of Religion . New York: MacMillian, 1997 .
Finansy SSSR : statisticheskiy sbornik (1986-1987 gg) . Moscow: Goskomstat, 1988 .

66 Kimberly C. Neuhauser
Gaddy, Clifford G . "Uncovering the 'Hidden Wage' : Public Perceptions of Opportunitiesfor Side Income in Various Occupations in the USSR," Berkeley-Duke OccasionalPapers on the Second Economy in the USSR . Paper No. 30, November 1991 .
Garbuzov, V . F., Sr. Editor . Finansovo-kreditnyy slovar' : v trekh tomakh . Moscow :Finansy i statistika, 1986 .
Geertz, Cifford . "The Rotating Credit Association: A "Middle Rung" in Development . "Economic Development and Cultural Change, 1962 1 :241-263 .
Gregory, Paul R . and Robert C . Stuart . Soviet Economic Structure and Performance, 4thed . New York : Harper & Row, 1990 .
Grossman, Gregory . "Roots of Gorbachev's Problems: Private Income and Outlay in theLate 1970s ." in Joint Economic Committee, U .S. Congress, Gorbachev's EconomicPlans . Vol. 2, pp . 213-229 . Washington: Government Printing Office, 1987 .
Gurov, A.I . Professional'naya prestupnost' :proshloye i sovremennost' [Organized Crime :Past and Present] . Moscow: Yuridicheskaya literatura, 1990 .
Krivenko, L. I., and N. P. Goncharenko . Pabota kassy vzaimopomoshchi pr iprofsoyuznom komitete (Otvety na voprosy) . [The Work of the Trade UnionCredit Union under the Trade Union Committee (Answers to Questions)] ,Moscow: Moskovskiy gorodskoy sovet professional'nykh soyuzovuchebno-metodicheskiy tsentr ; finansovyy otdel, 1985 .
Lapidus, N. "O prodazhe tovarov v kredit (On the Sale of Goods on Credit) ." Dengiikredit, No. 8, 1976a, pp. 59 - 62 .
. "Prodazha tovarov v kredit i tendentsii eye razvitiya (The Sale of Goods o nCredit and Tendencies of its Development) ." Sovetskaya torgovlya, No. 9, 1976b ,pp . 35 - 37 .
Makhina, T . "Nam pishut : kak uprostit' paschety za tovary, prodannyye v kredit" (Letterto the editor : How to simplify settlements for goods sold on credit) Sovetskayatorgovlya No 5, May 1974, pp 44-45 .
Narodnoye khozyaystvo SSSR Moscow: Finansy i statistika . various years .
New Catholic Encyclopedia . Washington DC: Catholic University Press . 1967 .

Consumer Credit
67
Pyle, William, "Private Car Ownership and Second Economy Activity," in "Essays o nSecond Economy Markets," Berkeley-Duke Occasional Papers on the Secon dEconomy in the USSR, Paper No. 37, December 1993, pp . 31-53 .
Shiller, Robert J ., Maxim Boycko, and Vladimir Korobov. "Popular Attitudes TowardFree Markets : The Soviet Union and the United States Compared, " AmericanEconomic Review, June 1991, pp . 385 - 400 .
Sotsial'no-ekonomicheskoye ravitiye stolits soyuznykh i avtonomnykh respublik, kraevykhi oblastnykh tsentrov : statisticheskiy sbornik . Moscow: Goskomstat SSSR, 1991 .
Stiglitz, Joseph E. "Economic Organization, Information, and Development," in Chenery ,H . and T. N. Srinivasan, eds . Handbook of Development Economics . Amsterdam :Elsevier Science Publishers, 1988, pp . 93 -160 .
Torgovlya SSSR . Moscow : Goskomstat, 1989 .
Zakharov, V.S . Potrebitel'skiy kredit v SSSR [Consumer Credit in the USSR] . Moscow :Finansy i statistika, 1986 .
. Kredit v sisteme upravleniya ekonomikoy [Credit in the System ofDirecting the Economy] . Moscow: Finansy i statistika, 1979 .
Zonov, Viktor I ., Maica M. Bagina, Svetlana P . Glinkin, et al . Potrebitel'skiy kredi t(sbornik) [Consumer Credit] . Moscow: Znaniye, 1983.