tva draft integrated resource plan
TRANSCRIPT

0


Message from TV A
March 2015
Thank you for reviewing TVA's Draft 2015 Integrated Resource Plan (IRP). This document and the associated Supplemental Environmental Impact Statement take a 20-year look at ways that TVA can meet future demand for electricity beyond that which can be met by existing power sources. This study enables TVA to better serve our customers with the reliability they require and to create an energy portfolio which responds best to changing conditions.
These reports reflect strong collaborationand significant time of our IRP Working Group and Regional Energy Resource Council. These groups are made up of individuals representing diverse stakeholder viewpoints from across the region. They include customers, academia, advocacy groups, business organizations and government agency officials. We want to thank all of them for their commitment and sincere efforts to make this study TVA's best yet.
We paved new ground by developing a unique way to measure and model the financial costs of energy efficiency and renewable resources as if they were traditional power plants.This method is a more disciplined approach than ever before that we believe creates a much better picture on how all resources can be best utilized to support load growth in the Valley.
Initial observations from the draft studies are: • Additional capacity is needed to serve our customers in all scenarios • No immediate need for baseload resources beyond Watts Bar Unit 2 and Browns Ferry
power uprates • Energy Efficiency plays an increased role in all cases • Renewable resources (particularly solar) also make a contribution • Expansion of natural gas generation is indicated in all cases • The EIS thoroughly assessed the environmental impacts of the suggested guidelines
During the course of modeling and evaluating the planning strategies, we identified questions and findings that warrant further evaluation during the next phase of the IRP study. In addition, in discussions with members on the IRP Working Group and the Regional Energy Resource Council, we identified other ideas that merit further analysis. That work will continue during the Public Comment phase and results will be captured in the final reports out this summer.
We encourage your feedback on these studies to ensure transparency and that we are serving the broadest needs of those in the Valley. You can use an on-line comment form and learn more at www.tva.gov/irp.
Sincerely,
~ VP-Stakeholder Relations
4,flf-~ Scott Self VP-Enterprise Planning

INTEGRATED RESOURCE PLAN – 2015 DRAFT REPORT
Table of Contents
Table of Contents
1 TVA’s Energy Future ............................................................................................................. 2 1.1 TVA Overview .................................................................................................................. 3
1.1.1 TVA’s Mission ............................................................................................................ 3 1.1.2 TVA’s Customers ....................................................................................................... 4
1.2 Integrated Resource Planning .......................................................................................... 4 1.2.1 IRP Objectives ........................................................................................................... 5 1.2.2 IRP Development ....................................................................................................... 5
1.3 Supplemental Environmental Impact Statement ............................................................... 5 2 IRP Process ........................................................................................................................... 8
2.1 Scoping ............................................................................................................................ 8 2.2 Develop Study Inputs and Framework .............................................................................. 8 2.3 Analyze and Evaluate ......................................................................................................10 2.4 Present Initial Results and Gather Feedback ...................................................................10 2.5 Incorporate Feedback and Perform Additional Modeling ..................................................11 2.6 Identify Target Power Supply Mix ....................................................................................11 2.7 Approval of IRP Recommendations .................................................................................11
3 Public Participation ..............................................................................................................13 3.1 Public Scoping Period......................................................................................................14
3.1.1 Public Meetings and Webinars ................................................................................. 14 3.1.2 Written Comments ................................................................................................... 15 3.1.3 Results of the Scoping Process ................................................................................ 15
3.2 Public Involvement in Developing Study Inputs and Framework ......................................17 3.2.1 IRP Working Group Meetings ................................................................................... 17 3.2.2 Public Briefings ........................................................................................................ 17 3.2.3 Additional Comments ............................................................................................... 18
3.3 Public Involvement in Review of the Draft IRP .................................................................18 4 Need for Power Analysis ...................................................................................................20
4.1 Estimate Demand ............................................................................................................20 4.1.1 Load Forecasting Methodology ................................................................................ 20 4.1.2 Forecast Accuracy ................................................................................................. 23 4.1.3 Forecasts of Peak Load and Energy Requirements ............................................... 24
4.2 Determine Reserve Capacity Needs ................................................................................26 4.3 Estimate Supply ...............................................................................................................26
4.3.1 Baseload, Intermediate, Peaking and Storage Resources ........................................ 27 4.3.2 Capacity and Energy ................................................................................................ 29 4.3.3 Current TVA Capacity and Energy Supply................................................................ 30
4.4 Calculate the Capacity Gap .............................................................................................31 5 Energy Resource Options ...................................................................................................36
5.1 Energy Resource Selection Criteria .................................................................................36 5.1.1 Criteria for Considering Resource Options ............................................................... 36 5.1.2 Criteria Required for Resource Options .................................................................... 36
5.2 Resource Options Included in IRP Evaluation ...............................................................38
i

INTEGRATED RESOURCE PLAN – 2015 DRAFT REPORT
Table of Contents
5.2.1 Existing Assets by Resource Category .................................................................. 38 5.2.2 New Assets by Resource Category ........................................................................ 42
6 Resource Plan Development and Analysis ......................................................................52 6.1 Development of Scenarios and Strategies .......................................................................53
6.1.1 Development of scenarios ........................................................................................ 53 6.1.2 Development of planning strategies ......................................................................... 58
6.2 Resource portfolio optimization modeling ......................................................................61 6.2.1 Development of optimized capacity expansion plan ................................................. 62 6.2.2 Evaluation of detailed financial analysis ................................................................... 62 6.2.3 Uncertainty (risk) analysis ........................................................................................ 63
6.3 Portfolio Analysis and Scorecard Development ...............................................................65 6.3.1 Selection of Metric Categories .................................................................................. 65 6.3.2 Development of scoring and reporting metrics ....................................................... 67 6.3.3 Scorecard design ..................................................................................................... 72
6.4 Strategy Assessment Process .......................................................................................72 7 Draft Study Results ............................................................................................................74
7.1 Analysis Results ............................................................................................................74 7.1.1 Firm Requirements and Capacity Gap ..................................................................... 74 7.1.2 Expansion Plans ...................................................................................................... 76
7.2 Scorecard Results ...........................................................................................................86 7.3 Scoring Metric Comparisons ............................................................................................89 7.4 Preliminary Observations .................................................................................................90
8 Strategy Assessments and Next Steps ............................................................................93 8.1 Strategy Assessments .....................................................................................................93
8.1.1 Cost and Risk Assessment ...................................................................................... 93 8.1.2 Environmental Stewardship ...................................................................................... 97 8.1.3 Flexibility .................................................................................................................. 98 8.1.4 Valley Economics ..................................................................................................... 99 8.1.5 Summary of Initial Observations ............................................................................. 100
8.2 Reporting Metrics Comparisons ..................................................................................... 102 8.3 Additional Analysis ........................................................................................................ 103 8.4 Policy Considerations .................................................................................................... 103 8.5 IRP Study Schedule and Next Steps ............................................................................. 104
Appendix A – Navigant Summary Letter Report on Generating Resource Cost and Performance Estimates ........................................................................................................ 106 Appendix B – Assumptions for Renewables • Test ............................................................ 111 Appendix C – Distributed Generation Evaluation Methodology ........................................ 118 Appendix D - 2015 IRP: Modeling Energy Efficiency .......................................................... 124 Appendix E - Capacity Plan Summary Charts ..................................................................... 143 Appendix F - Method for Computing Environmental Metrics ............................................. 149 Appendix G - Method for Computing Valley Economic Impacts ....................................... 161
ii

INTEGRATED RESOURCE PLAN – 2015 DRAFT REPORT
Table of Contents
List of Figures
Figure 3-1: Distribution of Scoping Comments by State ............................................................15 Figure 3-2: Inputs and Framework Public Briefings ...................................................................17 Figure 4-1: Comparison of Actual and Forecasted Annual Peak Demand .................................23 Figure 4-2: Comparison of Actual and Forecasted Net System Requirements ..........................24 Figure 4-3: Peak Demand Forecast ..........................................................................................25 Figure 4-4: Energy Forecast .....................................................................................................26 Figure 4-5: Illustration of Baseload, Intermediate and Peaking Resources. ..............................27 Figure 4-6: Baseline Capacity, Summer Net Dependable MW ..................................................31 Figure 4-7: Estimating the Capacity Gap ...................................................................................32 Figure 4-8: Capacity Gap ..........................................................................................................32 Figure 4-9: Energy Gap .............................................................................................................33 Figure 5-1: Coal Fleet Map........................................................................................................39 Figure 5-2: Coal Fleet Portfolio Plans ........................................................................................40 Figure 5-3: List of New Assets ..................................................................................................43 Figure 5-4: Nuclear Expansion Options .....................................................................................44 Figure 5-5: Coal Expansion Options ..........................................................................................45 Figure 5-6: Gas Expansion Options ..........................................................................................45 Figure 5-7: Hydro Expansion Options .......................................................................................46 Figure 5-8: Utility-Scale Storage Options ..................................................................................47 Figure 5-9: Wind Expansion Options .........................................................................................48 Figure 5-10: Solar Expansion Options .......................................................................................49 Figure 5-11: Biomass Expansion Options .................................................................................49 Figure 5-12: DR Expansion Options ..........................................................................................50 Figure 5-13: EE Expansion Options ..........................................................................................50 Figure 6-1: Key Uncertainties ....................................................................................................54 Figure 6-2: Scenario Key Characteristics ..................................................................................55 Figure 6-3: Energy Demand Assumptions .................................................................................56 Figure 6-4: Gas Price Assumptions ...........................................................................................56 Figure 6-5: Coal Price Assumptions ..........................................................................................57 Figure 6-6: CO2 Price Assumptions ...........................................................................................58 Figure 6-7: Key Planning Strategy Attributes .............................................................................59 Figure 6-8: Planning Strategies Key Characteristics .................................................................60 Figure 6-9: Strategy Descriptions ..............................................................................................61 Figure 6-10: Sample Stochastic Result .....................................................................................63 Figure 6-11: Example Uncertainty Ranges ................................................................................64 Figure 6-12: Strategic Imperatives ............................................................................................66
iii

INTEGRATED RESOURCE PLAN – 2015 DRAFT REPORT
Table of Contents
Figure 6-13: Scoring Metrics .....................................................................................................68 Figure 6-14: Scoring Metric Formulas .......................................................................................69 Figure 6-15: Reporting Metrics ..................................................................................................70 Figure 6-16: Reporting Metric Formulas ....................................................................................71 Figure 6-17: Scorecard Alignment .............................................................................................71 Figure 6-18: Scorecard Template ..............................................................................................72 Figure 7-1: Firm Requirements by Scenario ..............................................................................75 Figure 7-2: Range of Capacity Gaps by Scenario .....................................................................76 Figure 7-3: Incremental Capacity Additions by 2033 .................................................................77 Figure 7-4: Percent of Total Capacity by 2033 ..........................................................................78 Figure 7-5: Percent of Energy by 2033 ......................................................................................78 Figure 7-6: Percent of Total Capacity for Strategy A .................................................................79 Figure 7-7: Percent of Total Energy for Strategy A ....................................................................80 Figure 7-8: Percent of Total Capacity for Strategy B .................................................................80 Figure 7-9: Percent of Total Energy for Strategy B ....................................................................81 Figure 7-10: Percent of Total Capacity for Strategy C ...............................................................81 Figure 7-11: Percent of Owned, EEDR, vs Purchased Assets for Strategy C ............................82 Figure 7-12: Percent of Total Energy for Strategy C ..................................................................82 Figure 7-13: Comparison of Energy Efficiency Resources ........................................................83 Figure 7-14: Percent of Total Capacity for Strategy D ...............................................................83 Figure 7-15: Percent of Total Energy for Strategy D ..................................................................84 Figure 7-16: Comparison of Renewable Resources ..................................................................85 Figure 7-17: Percent of Total Capacity for Strategy E ...............................................................85 Figure 7-18: Percent of Total Energy for Strategy E ..................................................................86 Figure 7-19: Strategy A Scorecard ............................................................................................86 Figure 7-20: Strategy B Scorecard ............................................................................................87 Figure 7-21: Strategy C Scorecard ............................................................................................87 Figure 7-22: Strategy D Scorecard ............................................................................................88 Figure 7-23: Strategy E Scorecard ............................................................................................88 Figure 7-24: Scoring Metrics by Strategy & Scenario ................................................................90 Figure 8-1: System Average Cost .............................................................................................94 Figure 8-2: Total Plan Cost (PVRR) ..........................................................................................95 Figure 8-3: Risk/Benefit Ratio ...................................................................................................96 Figure 8-4: Risk Exposure .........................................................................................................96 Figure 8-5: Cost/Risk Trade-Offs ..............................................................................................97 Figure 8-6: Environmental Impacts ............................................................................................98 Figure 8-7: System Regulating Capability .................................................................................99 Figure 8-8: Valley Economics ....................................................................................................99 Figure 8-9: Reporting Metrics by Strategy & Scenario ............................................................. 103
iv

INTEGRATED RESOURCE PLAN – 2015 DRAFT REPORT
Table of Contents
Figure B-1: Example of Wind Monthly-mean variability of net power capacity by 3TIER ........ 114 Figure B-2: Sites across Tennessee Valley with historical solar irradiance data supplied by CPR
........................................................................................................................... 115 Figure B-3: Solar Fixed Axis and Utility Tracking Capacity Factors by Month ......................... 116 Figure B-4: NDC by hour of the top 20 peak load days of Summer 1998-2013 ...................... 116 Figure C-1: DG Market Segments and Penetration Levels Across IRP Scenarios ................... 119 Figure C-2: Correlation of IRP CO2 uncertainty values to EIA source data ............................. 120 Figure C-3: Development of National Renewable DG Penetration Levels ............................... 121 Figure C-4: National Renewable Energy Adoption Levels (Utility-led and DG) ........................ 121 Figure C-5: Residential/Commercial DG Adoption Levels (by 2040) ....................................... 122 Figure C-6: Residential/Commercial DG Adoption Levels (Annual) ......................................... 122 Figure D-1: Energy Efficiency Performance on a Typical Peak Summer Day (2023) ............... 126 Figure D-2: Energy Efficiency Monthly Profile (2023) .............................................................. 127 Figure F-1: Scoring Metrics ..................................................................................................... 150 Figure F-2: Scoring Metric Formulas ....................................................................................... 151 Figure F-3: Reporting Metrics .................................................................................................. 151 Figure F-4: Reporting Metric Formulas .................................................................................... 151 Figure G-1: Input and Output Impacts ..................................................................................... 163 Figure G-2: Results ................................................................................................................. 165 Figure G-3: Current Outlook .................................................................................................... 166 Figure G-4: Stagnant Economy ............................................................................................... 167 Figure G-5: Growth Economy ................................................................................................. 168 Figure G-6: De-Carbonized Future .......................................................................................... 169 Figure G-7: Distributed Marketplace ........................................................................................ 171 Figure G-8: Nonfarm Employment........................................................................................... 172
List of Tables Table 8-1: Summary of Observations by Metric Category ....................................................... 100 Table 8-2: Summary of Observations by Strategy ................................................................... 101 Table D-1: Tier, Sector, and Block Hierarchy .......................................................................... 128 Table D-2: Weighting of EE Programs .................................................................................... 128 Table D-3: Net to Gross ratios and Lifespans for the EE programs within sectors ................... 129 Table D-4: Tier Step Changes ................................................................................................. 130 Table D-5: Block Characteristics for each sector ..................................................................... 131 Table D-6: Resource Characteristic Comparison with EE ....................................................... 133 Table D-7: Design and Delivery Uncertainties ......................................................................... 134 Table D-8: Indirect and Direct Stochastic Variables ................................................................ 139
v

INTEGRATED RESOURCE PLAN – 2015 DRAFT REPORT
Table of Contents
Acronym Index IRP Integrated Resource Plan
TVA Tennessee Valley Authority
EE Energy efficiency
IRPWG Integrated Resource Plan Working Group
PPA Purchase Power Agreement
SMR Small Modular Nuclear Reactor
LPC Local Power Company
EIS Environmental Impact Statement
SEIS Supplemental Environmental Impact Statement
NEPA National Environmental Policy Act
EEDR Energy Efficiency and Demand Response
FY Fiscal Year
MW Megawatt
MWh Megawatt hour
GWh Gigawatt hour
TWh Terawatt hour
KWh kilowatt hour
MAPE mean absolute percent error
CC combined cycle gas plant
CT combustion turbine
CO2 Carbon dioxide
EPU extended power uprates
PWR Pressurized Water Reactor
APWR Advanced Pressurized Water Reactor
HVDC High Voltage Direct Current
IGCC Integrated Gas Combined Cycle
SCPC Supercritical Pulverized Coal
CCS Carbon Capture and Sequestration
PVRR Present Value of Revenue Requirements
vi

Chapter 1
1

INTEGRATED RESOURCE PLAN – 2015 DRAFT REPORT
Introduction
Contents
1 TVA’s Energy Future ............................................................................................................. 2 1.1 TVA Overview .................................................................................................................. 3
1.1.1 TVA’s Mission ............................................................................................................ 3 1.1.2 TVA’s Customers ....................................................................................................... 4
1.2 Integrated Resource Planning .......................................................................................... 4 1.2.1 IRP Objectives ........................................................................................................... 5 1.2.2 IRP Development ....................................................................................................... 5
1.3 Supplemental Environmental Impact Statement ............................................................... 5 1 TVA’s Energy Future The Tennessee Valley Authority’s 2015 Integrated Resource Plan (IRP) will guide TVA in making decisions about the energy resources we will use to meet future demand for electricity in the Tennessee Valley. Having a long-range energy resource plan enables us to provide affordable, reliable electricity to the people we serve. It is a crucial element for success in a constantly changing business and regulatory environment and will better equip us to meet many of the challenges facing the electric utility industry.
A key challenge is projecting how much power we will need when and where and identifying the optimum mix of energy resources to meet future power demand. Electricity can’t be stored economically in sufficient quantities, so electric utilities must constantly balance power supply and demand. Energy efficiency programs can help reduce future demand, and various energy resources can be used to supply future demand – from constructing new generation facilities to contracting with others to provide needed electricity, including renewable generation. But all of these options take time to implement. Given the long lead times required to plan, permit and build generating facilities, demand forecasts involve 10- to 20-year outlooks.
In addition, we must take steps to ensure TVA has the transmission infrastructure to get electricity to where it is needed. We currently operate and maintain 16,000 miles of transmission lines across the Tennessee Valley region. As the population grows we must upgrade or expand this system. TVA must allow adequate time to properly study, engineer, site, and plan environmental reviews to build additional transmission infrastructure.
All of these activities entail varying levels of risk and uncertainties, which we try to account for in our IRP analyses and energy resource portfolio. In earlier IRPs, we determined that a diversified energy resource portfolio is one of the best ways to reduce risks, and we have reconfirmed this in our 2015 IRP. It is important that we maintain a mix of energy resource options, including nuclear, natural gas, coal, energy efficiency, hydroelectric power and other renewables, to reduce the risks associated with relying on specific fuel types.
2

INTEGRATED RESOURCE PLAN – 2015 DRAFT REPORT
Introduction
1.1 TVA Overview
1.1.1 TVA’s Mission TVA was created by Congress in 1933 and charged with a unique mission: to improve the quality of life in a seven-state region through the integrated management of the region’s resources. To help lift the Tennessee Valley out of the Great Depression, TVA built dams for flood control, provided low-cost power and commercial shipping, restored depleted lands, and raised the standard of living across the region. As times have changed, we have changed with them, meeting new challenges and bringing new opportunities. Today, TVA continues to serve the people of the Tennessee Valley through its work in three areas: Energy, the Environment, and Economic Development.
Energy
Safe, clean, reliable and affordable electricity powers the economy of our region and enables greater prosperity and a higher quality of life for everyone. After safety, our top priority is keeping our electric rates as low as feasible and our reliability as high as possible.
TVA operates the nation’s largest public power system, including 41 active coal-fired units, six nuclear units, 109 conventional hydroelectric units, four pumped-storage units, 87 simple-cycle combustion turbine units, 11 combined cycle units, five diesel generator units, one digester gas site and 16 solar energy sites.1 We also purchase a portion of our power supply from third-party operators under long-term power purchase agreements (PPAs).
TVA’s 16,000-mile-long transmission system is one of the largest in North America. For the past 14 years, the system achieved 99.999 percent power reliability. It efficiently delivered more than 161 billion kilowatt-hours of electricity to customers in FY 2014.
TVA makes annual investments in science and technology innovation that enable us to be at the forefront of advances in the utility industry and help us meet future business and operational challenges. Core research activities directly support improving our generation and delivery assets, air and water quality and clean energy integration. Currently, we are involved in research activities related to emerging technological advances in small modular nuclear reactors (SMRs), grid modernization for transmission and distribution systems, energy utilization technologies and distributed energy resources.
Environmental Stewardship TVA manages natural resources of the Tennessee Valley for the benefit of the region’s people. We manage the Tennessee River system and associated public lands to reduce flood damage, maintain navigation, support power production, enhance recreation, improve water and protect shoreline resources.
TVA manages its power system to provide clean energy and minimize environmental impacts from its operations. Today, air quality across the region is the best it has been in more than 30 years. Since 1977, TVA has spent about $5.9 billion on air pollution controls and is investing approximately $1 billion in additional control equipment at our Gallatin Fossil Plant in middle Tennessee. Emissions of nitrogen oxides (NOx) are 91 percent below peak 1995 levels and emissions of sulfur dioxide (SO2) are 95 percent below 1977 levels through 2013.
1 As of September 30, 2014
3

INTEGRATED RESOURCE PLAN – 2015 DRAFT REPORT
Introduction
TVA’s emissions of carbon dioxide (CO2) were reduced 32 percent between 2005 and 2013. We project approximately a 40 percent reduction in CO2 emissions by 2020 from 2005 levels.
Economic Development TVA’s large power system, diverse fuel mix and robust transmission system allows us to provide high reliability and competitive rates to attract industry to our region. During the past five years, TVA has helped attract or retain 240,000 jobs in our service territory and secure more than $30 billion in capital investment for the region through the Valley Investment Initiative program. This program, established in 2008, is designed to increase the number and quality of jobs in the Valley and to benefit the power system through smarter energy use.
1.1.2 TVA’s Customers Our relationships with our customers are crucial to providing affordable electricity to residents and businesses. As largely a wholesaler of electricity, TVA works in partnership with local power companies (LPCs) to deliver affordable, reliable electricity. We also deliver electricity directly to some customers, large industries and federal installations and exchange power with other interconnected utility systems.
LPCs make up most of TVA’s customer base and are the backbone of the region’s power distribution system. Accounting for roughly 87 percent of total TVA sales and 90 percent of total revenue, the LPCs are municipally-owned and consumer-owned (cooperative) utilities. TVA generates and delivers electricity to the LPCs, which deliver electricity to their residential, commercial and industrial customers. Municipal LPCs comprise the largest block of TVA customers. Many of the consumer-owned cooperative utilities were formed to bring electricity to once-sparsely populated rural, remote areas of the region.
Large industries and federal installations that buy electricity directly from TVA, such as Oak Ridge National Laboratory, account for 13 percent of total sales and 10 percent of total revenue. TVA’s electricity exchanges with interconnected utilities also can produce revenue.
TVA power contracts govern customer relationships, including the pricing or rate structure under which power is sold. Our contracts with LPCs obligate TVA to generate and deliver enough electricity to meet their full electric load, including reserves, now and in the future.
1.2 Integrated Resource Planning The purpose of integrated resource planning is to meet future power demand by identifying the need for generating capacity and determining the best mix of resources to meet the need on a least-cost, system-wide basis. The integrated approach considers a broad range of feasible supply-side and demand-side options and assesses them with respect to financial, economic and environmental impacts. The 2015 IRP will revise our 2011 IRP. We are updating the 2011 IRP earlier than planned because several of the assumptions used in its development changed. These include reduced demand for electricity and greater availability and lower cost of natural gas.
We are releasing this draft of our 2015 IRP for public review and comment. A final IRP will be released after we incorporate feedback on this draft, complete additional analyses and identify a preferred target power supply mix.
4

INTEGRATED RESOURCE PLAN – 2015 DRAFT REPORT
Introduction
1.2.1 IRP Objectives The following objectives guide the development of this IRP:
• Deliver a plan aligned to mandated least-cost planning principles • Decrease risk by utilizing a diverse portfolio of supply and demand side resources • Deliver clean energy and lower environmental impacts • Consider increased use of renewables, energy efficiency and demand response
resources • Ensure the portfolio delivers energy in a reliable manner • Enhance the treatment of energy efficiency in the study • Provide flexibility to adapt to changing market conditions and future uncertainty • Improve credibility and trust through a collaborative and transparent approach • Integrate stakeholder perspectives throughout the process.
1.2.2 IRP Development TVA’s 2015 IRP is being developed over a two-year period with extensive technical and economic analyses and significant participation from our customers and other stakeholders.
We are using an integrated, least-cost system planning process that takes into account the demand for electricity, resource diversity, reliability, costs, risks, environmental impacts and the ability to dispatch energy resources. Forecasts of inflation, commodity prices and environmental regulations are being evaluated simultaneously to provide needed information. Constraints (corporate, strategic and environmental objectives) are being considered as different combinations of strategies and predictions of future conditions are analyzed and evaluated.
We are conducting the IRP process in a transparent, inclusive manner that provides numerous opportunities for the public to learn about the project and participate in it. We also meet regularly with a wide range of stakeholders who serve on the 2015 IRP Working Group. This group is composed of individuals representing state agencies, distributors of TVA power, industry groups, environmental and energy advocates, academia and research institutions, and business and economic development professionals. (More information about the IRP Working Group is provided in Chapter 3, Public Participation.) We believe this extensive outreach will produce a better IRP and are grateful for the questions raised and the feedback and insights provided.
1.3 Supplemental Environmental Impact Statement As a federal agency, TVA must comply with the National Environmental Policy Act of 1970 (NEPA). This act requires all federal agencies to consider the impact of their proposed actions on the environment before making decisions. The NEPA process provides a structured way for analyzing alternative actions and for involving the public in the decision-making process. For the development of this IRP, the primary product from the NEPA process is a supplement to the 2011 environmental impact statement (EIS).
The EIS focuses on the potential impacts of the various IRP strategies more closely and in greater detail than do the environmental metrics presented in this IRP. The impacts of actions to implement the IRP, such as building and operating a new generating facility, will be the subject of action- and site-specific NEPA reviews.
5

INTEGRATED RESOURCE PLAN – 2015 DRAFT REPORT
Introduction
The draft EIS is being released for public review and comment simultaneously with this draft IRP. After addressing public comments, the EIS will be issued in final form for consideration by the TVA Board.
This study was prepared in accordance with NEPA, Council of Environmental Quality regulations for implementing NEPA, and TVA’s procedures for implementing NEPA.
6

Chapter 2
7

INTEGRATED RESOURCE PLAN – 2015 DRAFT REPORT
IRP Process
Contents
2 IRP Process ........................................................................................................................... 8 2.1 Scoping ............................................................................................................................ 8 2.2 Develop Study Inputs and Framework .............................................................................. 8 2.3 Analyze and Evaluate ......................................................................................................10 2.4 Present Initial Results and Gather Feedback ...................................................................10 2.5 Incorporate Feedback and Perform Additional Modeling ..................................................11 2.6 Identify Target Power Supply Mix ....................................................................................11 2.7 Approval of IRP Recommendations .................................................................................11
2 IRP Process TVA’s 2015 IRP process consists of seven distinct steps:
1. Scoping 2. Develop Study Inputs and Framework 3. Analyze and Evaluate 4. Present Initial Results and Gather Feedback 5. Incorporate Feedback and Perform Additional Modeling 6. Identify Preferred Target Supply Mix 7. Approval of Recommended Plan
Public participation is integral to the process and is explained in more detail in Chapter 3. Steps 2 through 6 are explained in more detail in Chapter 6. Step 7, approval of the final plan, will be detailed in the Final IRP.
2.1 Scoping The public scoping period for TVA’s 2015 IRP began in October 2013. The objective in this initial step of the process was to identify resource options, strategies and future conditions that merit evaluation in the IRP process. Public scoping comments covered a wide range of issues, including the nature of the integrated resource planning process, preferences for various types of power generation, increased energy efficiency and demand response (EEDR) and the environmental impacts of TVA’s power generation. The comments received helped to identify issues important to the public and to lay the foundation for the supplement to the 2011 Environmental Impact Statement that supports the 2015 IRP.
2.2 Develop Study Inputs and Framework When developing a long-term plan for a power system, utilities typically use a least-cost decision making framework that focuses on a single view of the future. At TVA, we also use a least-cost decision making framework. The Integrated Resource Plan informs TVA on how potential resource portfolios could perform given different market and external conditions. The results of these potential actions and potential future environments describe the portfolio in areas such as operations, financials, environmental impact, macro-economics, and reliability.
8

INTEGRATED RESOURCE PLAN – 2015 DRAFT REPORT
IRP Process
Strategies represent future business decisions over which TVA has full control.
Scenarios represent future conditions that TVA cannot control.
A portfolio is the intersection of a strategy and a scenario and represents a multiyear energy resource plan detailing how TVA intends to meet future power needs.
Our goal is to identify an energy resource plan that performs well under a variety of future conditions (e.g., a strong economy or a weak economy) thereby reducing the risk that a selected strategy or plan would perform well under one set of future conditions, but poorly under a different set of conditions. This increases the likelihood that TVA’s plan will provide least-cost solutions to future demands for electricity from its power system regardless of how the future plays out.
This decision making framework requires use of a scenario planning approach. Scenario planning provides an understanding of how the results of near-term and future decisions would change under different conditions.
Future decisions that produce similar results under different conditions may mean that these decisions provide more predictable outcomes, whereas decisions that result in major differences are less predictable and therefore more “risky.”
At the outset of our 2015 IRP process, we developed a set of five resource planning strategies that would be analyzed as part of the IRP. These planning strategies represent decisions that TVA controls (e.g., asset additions, idling coal plants, integration of more flexible resource options) as opposed to the scenarios described below, which represent aspects of the future that TVA does not control (e.g., more stringent regulations, fuel prices, construction costs).
Different mixes of resource options (generating technologies and/or energy efficiency programs) formed the framework for distinct planning strategies that were assessed over the 20-year IRP planning horizon. The feasibility of each planning strategy was determined based on input from subject matter experts and stakeholders.
Together we then developed a series of five scenarios representing alternative plausible futures to help us test the performance of the resource planning strategies under different conditions and, ultimately, to identify the strategy that might represent the most flexible approach to ensuring the lowest cost, most reliable power for our customers.
Each scenario can be thought of as a model of a possible future. In one model, the economy might stagnate, fuel prices drop and electricity demand remains flat. In another, strong economic recovery could lead to increased fuel prices and to rapid recovery in electricity sales and long-term demand growth and increase the cost of building generating sources.
To better assess the robustness of the strategies evaluated for this IRP, we purposely structured these scenarios to present different challenges to the resource planning strategies. The scenarios differ from each other in key areas, such as projected customer demand, fuel prices and future economic and regulatory conditions.
The five scenarios and five strategies are shown below.
9

INTEGRATED RESOURCE PLAN – 2015 DRAFT REPORT
IRP Process
2.3 Analyze and Evaluate After the resource planning strategies and scenarios were developed, the performance of each planning strategy was analyzed in detail across all of the scenarios. This phase of the IRP used industry-standard capacity expansion planning and production cost-modeling software to estimate the total cost of each combination of strategy and scenario. Other metrics, financial risks and environmental impacts, were developed from the cost-modeling results.
Unique resource plans or “portfolios” were developed, one for each combination of scenario and strategy. Each of the 25 portfolios represented a long-term, least-cost plan of different resource mixes that could be used to meet the region’s power needs.
Every portfolio was ranked using metrics within a consistent, standard scorecard. Care was taken to note those portfolios that performed best overall, and those that performed well in most models of the future. The metrics were chosen based on importance to TVA’s mission and captured financial, economic and environmental impacts. Portfolios were analyzed for their robustness under stress across multiple scenarios, as opposed to total overall performance since metrics alone could signify good performance in one or two scenarios, but average or poor performance in all others.
2.4 Present Initial Results and Gather Feedback This draft of the 2015 IRP is being released for public review and comment. It presents a broad range of viable planning strategies for implementation, but does not include an exhaustive list of all strategies that were investigated during the strategy design phase. During discussions with the IRP Working Group on a list of proposed strategies it was agreed that some were actually
10

INTEGRATED RESOURCE PLAN – 2015 DRAFT REPORT
IRP Process
sensitivities not resource planning strategies. Members of the Working Group and TVA agreed on the top five strategies to be analyzed as part of this IRP.
As in the scoping period, TVA encourages public comments on the draft IRP and associated supplemental EIS. The comments received will help us identify public concerns and recommendations concerning the future operation of the TVA power system.
2.5 Incorporate Feedback and Perform Additional Modeling After the public comment period ends, all comments will be reviewed and combined with other similar comments as appropriate. We will respond to all substantive comments either by revising the IRP or associated EIS or by providing specific answers in the final supplemental EIS. If we need to conduct additional technical analyses to respond to comments, the results will be included in the final IRP report.
2.6 Identify Target Power Supply Mix After review of public comments and any additional analysis, TVA staff will identify a target power supply mix based on one or more of the planning strategies evaluated in the IRP. This general target will reflect that mix of resources (supply and demand side) that best position the utility for success in a variety of alternative futures, while preserving the flexibility necessary to respond to uncertainty.
2.7 Approval of IRP Recommendations No sooner than 30 days after the Notice of Availability, the associated EIS will be published in the Federal Register and the TVA Board of Directors will be asked to approve the recommendations included in the study, including the target power supply mix. The Board will decide whether to approve the recommendations presented in the study, to modify them or to approve an alternative. The Board’s decision will be described and explained in a Record of Decision.
11

Chapter 3
12

INTEGRATED RESOURCE PLAN – 2015 DRAFT REPORT
Public Participation
Contents 3 Public Participation ..............................................................................................................13
3.1 Public Scoping Period......................................................................................................14 3.1.1 Public Meetings and Webinars ................................................................................. 14 3.1.2 Written Comments ................................................................................................... 15 3.1.3 Results of the Scoping Process ................................................................................ 15
3.2 Public Involvement in Developing Study Inputs and Framework ......................................17 3.2.1 IRP Working Group Meetings ................................................................................... 17 3.2.2 Public Briefings ........................................................................................................ 17 3.2.3 Additional Comments ............................................................................................... 18
3.3 Public Involvement in Review of the Draft IRP .................................................................18
3 Public Participation The nine million people who use TVA electricity have a stake in TVA’s energy resource decisions. They also have varying values, needs and preferences that must be factored into those decisions to help ensure that TVA achieves the purpose for which it was created: to benefit the people of the Tennessee Valley.
For this reason, we use a transparent and participatory approach in integrated resource planning with multiple opportunities for people to provide input and influence the IRP’s development and outcome.
Our goals in involving the public are to:
• Engage numerous stakeholders with differing viewpoints throughout the process • Incorporate public opinions into the development of the IRP, including opportunities to
review and comment on various inputs, analyses and options being considered • Encourage open and honest communication in order to provide a sound understanding
of the process • Use multiple means to keep the public informed and provide multiple ways to provide
input • Form an IRP Working Group made up of people representing the broad perspectives of
those who live and work in the Valley. The formation of an IRP Working Group is a cornerstone of the public input process for the 2015 IRP process, just as it was for the 2011 process. Working Group members review input assumptions and preliminary results and provide feedback throughout the process. They are responsible for providing their individual views to TVA, as well as representing and keeping their constituencies informed regarding the IRP process.
The 2015 Working Group consists of 18 representatives from business and industry, state agencies, government, distributors of TVA power, academia, and energy and environmental non-governmental organizations.
In addition to the IRP Working Group individuals on two stakeholder groups provided TVA guidance and expertise on renewable energy resources and energy efficiency and demand response.
13

INTEGRATED RESOURCE PLAN – 2015 DRAFT REPORT
Public Participation
The Tennessee Valley Renewable Information Exchange (TV-RIX) was established in September 2012 and was actually a result of the 2011 IRP ‘Next Steps’ to further analyze renewable technologies, business models and market trends. The group consisted of 17 members representing renewable interest groups, state governments, national/regional expertise and utility industry representatives. TV-RIX provided inputs on biomass, hydro, solar and wind resources for the IRP modeling process.
The Energy Efficiency Information Exchange (EEIX) was established in October 2013 to focus on the exchange of ideas on naturally occurring adoption rates of energy efficiency. The group had 13 members representing local power companies, state energy offices and non-government organizations. This group assisted in developing simple, flexible and cost-effective portfolios to be used in the IRP analysis and selection process.
Public involvement was a particular focus in the first two steps of the IRP process, Scoping and Develop Study Inputs and Framework, and is currently a focus as we seek public comments on this draft IRP as part of step 4, Present Initial Results and Gather Feedback.
3.1 Public Scoping Period To begin the 2015 IRP process, TVA announced the start of a 33-day public scoping period on October 21, 2013.
The beginning of the scoping period was publicized across the Tennessee Valley though news releases, advertisements and a notice on TVA’s website. Notices also were sent to people who participated in the development of TVA’s 2011 IRP.
In addition, on October 31, 2013, TVA published a notice in the Federal Register of its intent to prepare a supplement to the 2011 IRP Environmental Impact Statement.
At the start of the public scoping period, we explained why we are updating our IRP, what we are focusing on, how we will conduct the planning process, and how the results will be used to guide our future energy resource decisions.
Our goals in conducting public scoping were to ensure:
• Stakeholder issues and concerns were identified early and studied properly • Reasonable alternatives were considered • Key uncertainties that could impact costs or performance of certain energy resources were
identified • Input received was properly considered and would lead to a thorough and balanced final
IRP. As part of scoping, we collected public input through public meetings, webinars and written comments.
3.1.1 Public Meetings and Webinars TVA held two public meetings as part of the scoping period. The first was in Knoxville, Tennessee on October 24, 2013, and the second was in Memphis, Tennessee on November 6, 2013. Both meetings were broadcast simultaneously as webinars, available on the Internet.
At each meeting, TVA staff described the process of developing the IRP and associated EIS and then responded to questions from members of the public attending the meeting both in
14

INTEGRATED RESOURCE PLAN – 2015 DRAFT REPORT
Public Participation
person and online. Participants also were encouraged to provide input via comment cards available at the meetings or through an online comment form.
Participants included members of the public, congressional representatives, representatives from state agencies and local governments, representatives from local power companies, non-governmental organizations and other special interest groups; and TVA employees.
About 85 people attended the meetings in person or via webinar.
3.1.2 Written Comments Throughout the scoping period, TVA accepted comments via mail, email and fax. Comment cards also were available at scoping meetings, and an online comment form was available from TVA’s IRP website.
About 85 percent of the scoping comments were submitted either as email forms or form letters promoted by two advocacy campaigns. (Read more about these advocacy campaigns below.)
We received a total of nearly 1,100 comments. Figure 3-1 shows the distribution of these comments by state.
Figure 3-1: Distribution of Scoping Comments by State
3.1.3 Results of the Scoping Process The information collected during the public scoping period helped shape the initial framework of TVA’s 2015 IRP and is being used in determining which resource options should be considered to meet future electricity demand.
The majority of the scoping comments were generated by two advocacy campaigns. The largest of these, promoted by the Sierra Club and Tennessee Environmental Council, consisted of email forms that thanked TVA for recent coal plant retirement decisions, urged TVA to
Tennessee, 903
Alabama, 81 Georgia, 20
Kentucky, 41
Mississippi, 86 North
Carolina, 1 Virginia, 1
Unknown, 6
15

INTEGRATED RESOURCE PLAN – 2015 DRAFT REPORT
Public Participation
prioritize the use of solar and wind energy, increase energy efficiency efforts, and work to reduce the local economic impacts of coal plant retirements. A smaller campaign, promoted by organizations affiliated with the regional coal industry, submitted form letters citing the abundance and stable cost of coal, the high capacity factor of coal plants, the employment provided by the use of coal, and coal’s contribution to low and stable rates.
Other comments, including those from the scoping meetings, addressed a wide range of topics. These are summarized below. Energy Resource Options Most of the comments regarding potential energy resource options addressed the benefits and/or drawbacks of various energy options, including nuclear, coal-fired, and natural gas-fired generation, as well as solar and wind renewable generation. Numerous comments encouraged increased energy efficiency efforts while a small number of comments encouraged increased use of other demand reduction options such as demand response and combined heat and power. Several commenters requested that TVA fully and fairly evaluate all potential energy resources.
Environmental Impacts of Power System Operations Many of the comments addressed the negative and/or beneficial environmental and economic impacts of the use of various energy resource options. These included air pollutants, greenhouse gas emissions and climate change, spent nuclear fuel and disposal of coal ash. Several comments also mentioned impacts resulting from mining, particularly surface mining and the use of coal and hydraulic fracturing to produce natural gas. Others encouraged TVA to assess the vulnerability of its power system to climate change, to assess the effects of climate change on TVA’s power demand forecasts, and to conduct more detailed analyses of local and regional economic impacts, including employment.
IRP Process Several comments addressed aspects of the integrated resource planning process. Many of these supported the use of least-cost analysis and asked TVA to be sensitive to the adopted plan’s impact on ratepayers.
Comments on planning scenarios included the incorporation of the effects of climate change, varying approaches to incorporating regulation of greenhouse gas emissions, the evaluation of future fuel prices, particularly for natural gas; and the impacts of current and anticipated environmental regulations.
Comments on resource planning strategies included maximizing renewable generation and energy efficiency, phasing out the use of fossil fuels, transmission grid upgrades and increasing distributed generation.
Other comments regarding the planning process addressed the valuation of renewable energy resources, the removal of limits on quantities of renewable energy, energy efficiency, and demand response, and incorporating the external health and environmental costs of all energy resources.
16

INTEGRATED RESOURCE PLAN – 2015 DRAFT REPORT
Public Participation
3.2 Public Involvement in Developing Study Inputs and Framework In this step, we used the key themes and results identified from public scoping to help develop the study framework, including the range of strategies for IRP analysis. During this phase, we worked closely with the IRP Working Group and held public briefings.
3.2.1 IRP Working Group Meetings Beginning in November 2013, TVA met with the IRP Working Group approximately every month. Twelve meetings were held prior to the release of the Draft IRP and associated EIS at various locations throughout the region.
The meetings were designed to encourage discussion on all facets of the process and to facilitate information sharing, collaboration and expectation setting for the IRP. IRP Working Group members reviewed and commented on planning assumptions, analytical techniques and proposed energy resource options and strategies. Specific topics included the energy efficiency approach in the IRP models, TVA’s power delivery structure, load and commodity forecasts and supply resource options.
Given the diverse makeup of the IRP Working Group, there was a wide range of views on specific issues, such as the value of energy efficiency programs, environmental concerns and the costs associated with various generation technologies. Open discussions supported by the best available data helped improve understanding of the specific issues.
To increase public access to the IRP process, all non-confidential IRP Working Group meeting material was posted on TVA’s website, along with webinar recordings and related presentation videos. We also developed an IRP Working Group website for members to post information and to request data from our staff.
3.2.2 Public Briefings In addition to the public scoping and IRP Working Group meetings, TVA held three briefings to update the public on the status of IRP development. Figure 3-2 shows the dates and locations of these briefings.
Date Location
March 26, 2014 Chattanooga, Tenn.
June 18, 2014 Knoxville, Tenn.
November 3, 2014 Knoxville, Tenn.
Figure 3-2: Inputs and Framework Public Briefings
Participants had the option to attend in person or participate by webinar. At each meeting, TVA staff made a brief presentation, followed by a moderated Q&A session.
17

INTEGRATED RESOURCE PLAN – 2015 DRAFT REPORT
Public Participation
Topics discussed at the public briefings included an introduction to the integrated resource planning process, resource options, development of scenarios and strategies and evaluation metrics.
An average of 20 people attended each of the three public briefings in person, and approximately 50 people participated via webinar. Recordings of the sessions were posted on the IRP website.
TVA also briefed the public on the IRP process through presentations to local organizations, clubs and associations.
3.2.3 Additional Comments After the close of the scoping period, TVA received comments related to the IRP from two advocacy campaigns. In the spring of 2014, TVA received nearly 1,000 postcards through a Tennessee Sierra Club campaign. The message on these cards was similar to that of the Sierra Club/Tennessee Environmental Council email campaign during the public scoping period. In the fall of 2014, TVA received about 4,500 form emails through the takeactionTN campaign promoted by the Tennessee Electric Cooperative Association and America’s Electric Cooperatives. These emails advocated an “all-of-the-above” approach to energy generation, opposed greenhouse gas regulations proposed by the Environmental Protection Agency, expressed concern over reliance on nuclear and natural gas generation and emphasized low cost and reliability.
3.3 Public Involvement in Review of the Draft IRP TVA is issuing this draft IRP for public comment in March 2015. The “official” public comment period will be 46 days long, closing on April 27, 2015. In addition to accepting written comments, we are hosting public meetings and webinars to obtain public feedback during this period.
18

Chapter 4
19

INTEGRATED RESOURCE PLAN – 2015 DRAFT REPORT
Need for Power Analysis
Contents 4 Need for Power Analysis ...................................................................................................20
4.1 Estimate Demand ............................................................................................................20 4.1.1 Load Forecasting Methodology ................................................................................ 20 4.1.2 Forecast Accuracy ................................................................................................. 23 4.1.3 Forecasts of Peak Load and Energy Requirements ............................................... 24
4.2 Determine Reserve Capacity Needs ................................................................................26 4.3 Estimate Supply ...............................................................................................................26
4.3.1 Baseload, Intermediate, Peaking and Storage Resources ........................................ 27 4.3.1.1 Baseload Resources ...........................................................................................28 4.3.1.2 Intermediate Resources ......................................................................................28 4.3.1.3 Peaking Resources.............................................................................................28 4.3.1.4 Storage Resources .............................................................................................28
4.3.2 Capacity and Energy ................................................................................................ 29 4.3.3 Current TVA Capacity and Energy Supply................................................................ 30
4.4 Calculate the Capacity Gap .............................................................................................31
4 Need for Power Analysis A primary purpose of this IRP is to accurately determine whether the energy resources TVA currently has available are sufficient to supply the power the Tennessee Valley region will need over the study period (2014-2033) and, if the anticipated demand exceeds the current supply, to estimate the capacity gap and determine what type and how much additional generating resources are needed.
This chapter describes the four steps in the process used to make this determination: compute demand, determine reserve capacity needs, estimate supply and estimate the capacity gap.
4.1 Estimate Demand The first step in forecasting future power needs is to estimate long-term growth in electricity sales and peak demand. Peak demand, or peak load, is the highest one-hour power requirement placed on the system. In order to reliably serve customers, TVA must have sufficient resources to meet the peak hour demand.
The electricity sales and peak demand forecasts for this IRP were developed from individual, detailed forecasts of residential, commercial and industrial sales. We checked the historical accuracy of these forecasts to help ensure errors in data or methodology were quickly identified and resolved. We also generated a range of forecasts (high, expected, and low) to ensure that TVA’s plans do not depend on the accuracy of a single forecast.
4.1.1 Load Forecasting Methodology To forecast future electricity demand, TVA uses statistical and mathematical models that link electricity sales to several key drivers. These include the growth in overall economic activity, the price of electricity, customer retention and the price of competing energy sources such as natural gas.
20

INTEGRATED RESOURCE PLAN – 2015 DRAFT REPORT
Need for Power Analysis
We also apply an end-use forecasting model to capture the effect of underlying trends affecting residential, commercial and industrial electricity sales such as changes in the use of various types of equipment or processes in each sector and expected changes in the stock and efficiency of equipment and appliances.
For example, in the residential sector, energy usage was forecasted for space heating, air conditioning, water heating and several other uses after accounting for changes in efficiency over time, appliance saturation and replacement rates, growth in average home size and other factors. In the commercial sector, we gave similar attention to changes in efficiency, saturation and other variables in a number of categories, including lighting, cooling, refrigeration and space heating.
Finally, working with TVA customer service representatives, we supplemented the historical data used in our modeling with industry analyses and feedback from our large, directly served customers regarding demand. This input helped us better predict the magnitude and timing of changes in load attributable to plant closures and expansions.
Key Forecast drivers
Growth in Economic Activity
At least annually, TVA produces a forecast of regional economic activity for budgeting and long-range planning purposes. These forecasts are developed from county-level economic forecasts in order to accurately model the prevailing economic conditions in the region.
Historically, the Tennessee Valley economy was more dependent on manufacturing than the economies of other regions. Industries such as pulp and paper, aluminum, steel and chemicals were drawn to the Valley because of the availability of natural resources, access to a skilled workforce and the supply of reliable and affordable electricity. However, manufacturing’s share of non-farm employment has steadily declined in the Valley, as it has across the region.
Our region is different from others in that manufacturing’s share of economic output in the Tennessee Valley actually increased since 1980, from 17 percent to 18 percent. These trends speak to the changing nature of economic activity here. While many labor-intensive manufacturing industries moved overseas, a continued shift toward energy-efficient manufacturing processes in the Valley is helping to preserve manufacturing’s contribution to total economic output. This is important to TVA’s load forecasting in that it may indicate a weakening in the historical relationships between economic growth and load growth.
Because of this continued dependence on manufacturing, our region’s economy tends to be more sensitive to economic conditions impacting the demand for manufactured goods. Near-term future growth in 2015 and 2016 is expected to benefit from positive cyclical economic conditions. After 2016, however, longer-term demographic pressures are expected to hold average growth in Gross Regional Product near 1.6 percent as retiring baby boomers restrict the available labor supply. Population growth in the Tennessee Valley declined from an annual average of about 1.0 percent in 1980 to 0.7 percent in 2014 and is expected to decline to 0.5 percent by 2043, which will limit the demand for all goods and services, including power.2
2 TVA population data from U.S. Census Bureau and Moody’s Analytics
21

INTEGRATED RESOURCE PLAN – 2015 DRAFT REPORT
Need for Power Analysis
Price of Electricity
Forecasts of the retail price for electricity are based on long-term estimates of TVA’s total costs to operate and maintain the power system and are adjusted to include an estimate of the historical markups charged by distributors of TVA power. These costs, known in the industry as revenue requirements, are based on estimates of the key costs of generating and delivering electricity, including fuel, variable operations and maintenance costs, capital investment and interest.
Customer Retention
Over the last 25 years, the electric utility industry has undergone a fundamental change in most parts of the country. In many states, an environment of regulated monopoly has been replaced with varying degrees of competition. Although TVA has contracts with the 155 local power companies (LPCs), it is not immune to competitive pressures. The contracts allow LPCs to give TVA notice of contract cancellation, after which they may procure power from other sources. Many large industrial customers also have the option of shifting production to plants outside TVA’s service area if TVA’s rates become non-competitive. Additionally, large industrial operations could generate their own power without distribution or transmission line losses – an increasingly attractive option to TVA’s largest customers as hydraulic fracturing reduces the cost of natural gas to unexpected lows.
These risks are factored into TVA’s load forecasts because they could affect future load, but we believe they will be offset by our commitment to keeping TVA rates competitive.
Price of Competing Energy Sources
Changes in the price of electricity compared to the price of natural gas and other fuels also influences load growth.
If consumers can heat their homes and water cheaper using natural gas or other energy sources, they may move away from electricity in the long-term. The potential for this type of substitution depends on the relative prices of other fuels and the ability of those fuels to provide a comparable service. It also depends on the physical capability to make the substitution. For example, while consumers can change out electric water heaters and replace electric heat pumps with natural gas furnaces, the ability to use another form of energy to power consumer electronics, lighting and cooling is far more limited by current technology. Changes in the price of TVA electricity compared to the price of natural gas and other fuels also influence consumers’ choices of appliances—either electric, gas or other fuels.
While other substitutions are possible, the price of natural gas serves as the benchmark for the relative competitiveness of electricity and the potential substitution impacts on load forecasts. Accounting for the long-run impact of natural gas prices is especially important in light of the increased competitive pressure resulting from hydraulic fracturing and the shale gas revolution. Although low gas prices make power production less expensive, it also tempts customers to shift from electricity to natural gas to meet their energy needs.
22

INTEGRATED RESOURCE PLAN – 2015 DRAFT REPORT
Need for Power Analysis
4.1.2 Forecast Accuracy
Forecast accuracy is generally measured by how much the forecast deviates from the actual energy and peak demands, adjusted for abnormal weather. Figures 4-1 and 4-2 show annual forecasts for fiscal years (FY) 1999 through 2014 for peak load requirements and net system energy requirements compared to actual peak loads and actual energy use.
Figure 4-1 is a comparison of actual annual peak demands in megawatts (MW) to the peak demands forecasted one year earlier. The red “Normalized Actual” line represents what the annual peak would have been under normal weather conditions. The closer the blue dotted “Forecast” line is to the red “Normalized Actual” line, the more accurate the peak forecast. For example, in FY14, the actual peak was only 1.3 percent greater than forecasted. Over-forecasts from FY11 to FY13 are related to the Great Recession, which resulted in a decline in weather-normalized peaks that continued well after the recession’s end. We are now seeing the return of modest growth in weather-normalized peaks.
Figure 4-1: Comparison of Actual and Forecasted Annual Peak Demand
Figure 4-2 is a comparison of actual and forecasted net system requirements expressed in total annual energy, measured in gigawatt-hours (GWh). Energy is somewhat less volatile than peaks, which are based on a single hour of each year, because energy is the sum of all the hours of the year. This makes energy a little easier to forecast, and the year-ahead forecast variances tend to be smaller.
25,000
26,000
27,000
28,000
29,000
30,000
31,000
32,000
33,000
34,000MW
Fiscal Year (FY) Forecasted
Forecast (MW) Normalized Actual (MW)
One Year-Ahead Peak Forecast Accuracy
23

INTEGRATED RESOURCE PLAN – 2015 DRAFT REPORT
Need for Power Analysis
Figure 4-2: Comparison of Actual and Forecasted Net System Requirements
The mean absolute percent error (MAPE)3 of TVA’s forecasts of net system energy and peak load requirements FY 1999 through FY 2014 was 1.8 percent and 3.1 percent, respectively. While the nature of forecasting a single hour’s MWs inherently leads to elevated peak forecast errors, this includes an unusually large error (7.6 percent) in the FY09 peak forecast as the full severity of the Great Recession’s impact was not yet fully realized.
Energy is less volatile so forecast errors tend to be a little smaller, but the Great Recession still adversely impacted the energy forecast’s error rate. Ignoring the forecast for 2009 brings the energy error rate down from 1.8 to 1.4 percent, which is more in line with what we expect in a typical year. From informal conversations with peer utilities, TVA’s energy forecast MAPE of around 1 to 2 percent is in line with other utilities.
4.1.3 Forecasts of Peak Load and Energy Requirements Over the next couple decades the Current Outlook Scenario4 anticipates net system energy and peak demand to grow about 1.0 percent and 1.1 respectively, which is somewhat slower than the 1.3 percent experienced for both net system energy and peak demand over the FY1990 through FY2013 period. These lowered expectations from the long-term trend are a function of both economics and energy efficiency projections. Slower economic growth, driven by the baby
3 MAPE is the average absolute value of the error each year; it does not allow over-predictions and under-predictions to cancel each other out. 4 Refer to Chapter 6 for a discussion of the scenarios developed for this IRP.
150,000
155,000
160,000
165,000
170,000
175,000
180,000
185,000
190,000FY
99
FY00
FY01
FY02
FY03
FY04
FY05
FY06
FY07
FY08
FY09
FY10
FY11
FY12
FY13
FY14
GWh
Fiscal Year (FY) Forecasted
Forecast (GWh) Normalized Actual (GWh)
One Year-Ahead Energy Forecast Accuracy
24

INTEGRATED RESOURCE PLAN – 2015 DRAFT REPORT
Need for Power Analysis
boomers’ retirement, and an ever-tightening regulatory environment are both anticipated to moderate future energy growth.
To deal with the inherent uncertainty in forecasting, TVA has developed a range of forecasts. Each forecast corresponds to different load scenarios around the Current Outlook Scenario’s forecast. The Current Outlook Scenario for the IRP is the forecast that TVA prepared for the FY2015 Long Range Financial Plan in fall of 2013. The range of forecasts for net system peak load and energy requirements used in the IRP are shown in Figures 4-3 and 4-4, respectively. Both include the Current Outlook Scenario and the highest and lowest growth scenarios that were modeled. They are the Growth Economy Scenario and the Distributed Marketplace Scenario, respectively. Annual peak load growth over the 2014 through 2033 time period varies from 0.3 percent in the lowest growth scenario to 1.3 percent in the highest growth scenario. Net system energy requirements grow at an annual rate of 1.0 percent in the Current Outlook Scenario but growth dips as low as 0.0 percent in the lowest growth scenario and peaks at 1.1 percent in the highest growth scenario.
Figure 4-3: Peak Demand Forecast
The use of ranges ensures that TVA considers a spectrum of electricity demand in its service territory and reduces the likelihood that its plans are overly dependent on a single-point estimate of demand growth. Alternative scenarios highlight the risk inherent in forecasting and planning to a single point estimate. The scenario-generated ranges are used to inform planning decisions beyond pure least-cost considerations based on a specific demand in each year.
29,000 30,000 31,000 32,000 33,000 34,000 35,000 36,000 37,000 38,000 39,000
MW
Fiscal Year
Highest Lowest Current Outlook Scenario
Peak Demand Scenarios 2014-2033
Annual Growth Rates Highest Scenario: 1.3% Current Outlook: 1.1% Lowest Scenario: 0.3%
25

INTEGRATED RESOURCE PLAN – 2015 DRAFT REPORT
Need for Power Analysis
Figure 4-4: Energy Forecast
4.2 Determine Reserve Capacity Needs To maintain reliability, power providers must always have more generating capacity available than required to meet peak demand. This additional generation, called “reserve capacity,” must be large enough to cover the loss of the largest single operating unit (contingency reserves), be able to respond to moment-by-moment changes in system load (regulating reserves) and replace contingency resources should they fail (replacement reserves). Total reserves must also be sufficient to cover uncertainties such as unplanned unit outages, undelivered purchased capacity, severe weather events or load forecasting error.
TVA identified a planning reserve margin based on minimizing overall cost of reliability to the customer. This reserve margin is based on a probabilistic analysis that considered the uncertainty of unit availability, transmission capability, weather-dependent unit capabilities (e.g., hydro, wind and solar), economic growth and weather variations to compute expected reliability costs. Based on this analysis, we selected a target reserve margin that minimized the cost of additional reserves plus the cost of reliability events to the customer. The target or optimal reserve margin was adjusted based on TVA’s risk tolerance. Based on this methodology, TVA’s current planning reserve margin is 15 percent above peak load requirements and is applied during both the summer and winter seasons.
4.3 Estimate Supply The third step in the process of analyzing future power needs is to identify the supply- and demand-side resources currently available to meet future power demand. Our generation
150,000 155,000 160,000 165,000 170,000 175,000 180,000 185,000 190,000 195,000 200,000
2014
2015
2016
2017
2018
2019
2020
2021
2022
2023
2024
2025
2026
2027
2028
2029
2030
2031
2032
2033
GWh
Fiscal Year
Highest Lowest Current Outlook Scenario
Energy Scenarios 2014-2033
Annual Growth Rates Highest Scenario: 1.1% Current Outlook: 1.0% Lowest Scenario: 0.0%
26

INTEGRATED RESOURCE PLAN – 2015 DRAFT REPORT
Need for Power Analysis
supply consists of a combination of existing TVA-owned resources; budgeted and approved projects such as new plant additions, updates to existing assets; and existing power purchase agreements (PPAs).
Generating assets can be categorized both by whether the power they produce is used to meet base, intermediate or peak demand or used for storage, and by capacity type or energy/fuel source.
4.3.1 Baseload, Intermediate, Peaking and Storage Resources Figure 4-5 illustrates the uses of baseload, intermediate and peaking assets. Although these categories are useful, the distinction between them is not always clear-cut. For example, a peaking unit, which is typically used to serve only intermittent but short-lived spikes in demand, may be called on from time to time to run continuously for a limited period even though it may be less economical to do so. This may be due to transmission or other power system constraints. Similarly, some baseload units are capable of operating at different power levels, giving them some characteristics of an intermediate or peaking unit. This IRP considered strategies that take advantage of this range of operations.
Figure 4-5: Illustration of Baseload, Intermediate and Peaking Resources.
1AM 3AM 5AM 7AM 9AM 11AM 1PM 3PM 5PM 7PM 9PM 11PM
GW
Hours of the Day
Base load resources above minimum load requirments represent surplus capacity that can be used for filling pumped hydro reservoirs
Peaking Resources
Summer Day Load Shape with Generating Resources
Peaking resources above maximum load requirments represent required reservecapacity
Baseload Resources
Intermediate Resources
Power purchase agreements (PPAs) refer to the energy and/or capacity bought from other suppliers for use on the TVA system in place of TVA building and operating its own resources. Power purchases provide additional diversity for TVA’s portfolio. We are currently a party to numerous short-term and long-term PPAs.
27

INTEGRATED RESOURCE PLAN – 2015 DRAFT REPORT
Need for Power Analysis
4.3.1.1 Baseload Resources
Due to their lower operating costs and high availability, baseload resources are used primarily to provide continuous, reliable power over long periods of uniform demand. Baseload resources typically have higher construction costs than other alternatives, but also have much lower fuel and variable costs, especially when fixed costs are expressed on a unit basis (e.g., dollars per MWh). An example of a baseload resource is a nuclear power plant.
Some energy providers also use natural gas-fired combined cycle (CC) plants as incremental baseload generators. However, given the historical tendency for natural gas prices to be higher than coal and nuclear fuel prices when expressed on a unit basis (i.e., dollar per million British Thermal Unit), a CC unit is generally considered a more expensive option for larger continuous generation needs. Although natural gas-fired CC plants could become more attractive for baseload generation as the fundamentals of fuel supply and demand change and if access to shale gas continues to grow.
4.3.1.2 Intermediate Resources
Intermediate resources are used primarily to fill the gap in generation between baseload and peaking needs. They also provide back-up and balance the supply of energy from intermittent wind and solar generation.
Intermediate units are required to produce more or less output as the energy demand increases and decreases over time, both during the course of a day and seasonally. Given current fuel prices and relative generating efficiencies, these units are more costly to operate than baseload units but cheaper than peaking units.
Intermediate generation typically comes from natural gas-fired CC plants and smaller coal units. However, energy from wind and solar generation also can be used as intermediate resources depending on the energy production profile and the availability of energy storage technologies.
Hydro generating assets can generally be categorized as intermediate resources, but their flexibility allows them to operate the full range from baseload to peaking. The limitation of hydro generation is restricted more by water availability and the various needs of the river system such as navigation.
4.3.1.3 Peaking Resources
Peaking units are expected to operate infrequently during short duration, high demand periods. They are essential for maintaining system reliability requirements, as they can ramp up quickly to meet sudden changes in either demand or supply. Typical peaking resources are natural gas-fired combustion turbines (CTs), conventional hydroelectric generation and pumped-storage hydroelectric generation.
4.3.1.4 Storage Resources
Storage units usually serve the same power supply function as peaking units but use low-cost, off-peak electricity to store energy for generation at peak times. An example of a storage unit is a hydroelectric pumped-storage plant. These plants pump water to a reservoir during periods of
28

INTEGRATED RESOURCE PLAN – 2015 DRAFT REPORT
Need for Power Analysis
low demand and release it to generate electricity during periods of high demand. Consequently, a storage unit is both a power supply source and an electricity user.
4.3.2 Capacity and Energy
Power system peaks are measured in terms of capacity, the instantaneous maximum amount of energy that can be supplied by a generating plant and collectively by the power system.
For long term planning purposes, capacity can be defined in several ways:
• Nameplate capacity is the theoretical design value or intended maximum megawatt output of a generator at the time of installation. Transmission planners use the maximum output for a generating unit to ensure the integrity of the power delivery system year round.
• Net dependable capacity is the maximum output that can typically be expected in normal operation or under normal operating conditions.
• Seasonal net dependable capacity is the maximum dependable output/capacity less all known adjustments (e.g., transmission restrictions, station service needs and fuel derates) at the time of summer peak. This value, which is used by capacity planners, is typically determined by performance testing during the respective season. TVA uses the summer net dependable capacity of a unit because the capacity of thermal generating units is reduced during the heat of summer which is when the load on the TVA system typically peaks.
Overall power system production is measured in terms of energy (i.e., megawatt-hour). Energy is the total amount of power that an asset delivers in a specified time frame. For example, one MW of power delivered for one hour equals one megawatt-hour (MWh) of energy.
The capacity factor of a power plant is a measure of the actual energy delivered by a generator compared to the maximum amount it could have produced at the nameplate capacity. Assets that run constantly, such as nuclear plants, provide a significant amount of energy with capacity factors greater than 90 percent.
Assets that are used infrequently, such as a combustion turbine, provide relatively little energy with capacity factors of less than five percent, although the energy they produce is crucial since it is often delivered at peak times.
Capacity Factor Examples High capacity factor unit:
A 1,200 MW unit could theoretically produce 10,512 GWh of power if it ran every hour of the year. After planned annual outages, the unit will typically produce 9,461 GWh or 90 percent of its theoretical capacity.
Low capacity factor unit:
A 250 MW natural gas-fired combustion turbine (CT) unit could theoretically produce 2,190 GWh of power if it ran every hour of the year. However, CT units generally have a capacity factor less than 5%, which means the unit would likely operate about 438 hours of the year and produce 110 GWh.
29

INTEGRATED RESOURCE PLAN – 2015 DRAFT REPORT
Need for Power Analysis
Energy efficiency also can be measured in terms of capacity and energy. Even though energy efficiency does not input power into the system, the effect is similar because it represents power that is not required from another resource. Demand reduction also is measured in capacity and energy. However, unlike energy efficiency, it does not offer a significant reduction in total energy used.
4.3.3 Current TVA Capacity and Energy Supply
TVA uses a wide range of technologies to meet the needs of Tennessee Valley residents, businesses and industries. Figure 4-6 shows the generating assets that would be used to meet those needs over time for the baseline case, which reflects our current practice of optimizing the resource portfolio while scheduling the contribution of energy efficiency, demand response, and renewables5. This resource plan will be used in the associated EIS report to represent the “no action alternative” as required under NEPA.
Figure 4-6 includes both owned and purchased resources, in megawatts of summer net dependable capacity, and is divided into fuel-type (i.e., nuclear, hydro, coal, etc.). In this chart, the lower area in the figure contains the existing assets and the new expansion assets are shown at the upper portion of the stacked area chart. EE is shown in the upper area of this chart to make comparison to the results from the modeling discussed in Chapter 7 easier. There are existing contracts for demand response that need to be accounted for and are shown in the existing assets. Similarly, the current renewable resources are shown in the bottom of the chart.
Figure 4-6 shows how TVA’s existing capacity portfolio is expected to change through 2033. The existing assets only include resources that currently exist; assets that are under contract; TVA Board-approved changes to existing resources such as refurbishment projects; and TVA Board-approved additions such as Watts Bar Unit 2. Existing resources decrease through 2033 primarily because of the retirement of coal-fired units and the expiration of existing contracts (power purchase agreements). The renewable component of the existing portfolio is primarily composed of wind PPAs. Because the power generated from wind and other renewable resources is intermittent, the firm capacity (or the amount of capacity that can be applied to firm requirements) for these assets is much lower than the nameplate capacity.
Having a diverse portfolio of resource types – coal, nuclear, hydroelectric, natural gas, and renewable resources – and being able to use these resources in different ways enables TVA to provide reliable, low-cost power while minimizing the risk of disproportionate reliance on any one type of resource.
5 This IRP will utilize a new methodology to dynamically select these resources. See discussion in Chapter 6.
30

INTEGRATED RESOURCE PLAN – 2015 DRAFT REPORT
Need for Power Analysis
Figure 4-6: Baseline Capacity, Summer Net Dependable MW
Approximately 37 percent of TVA’s capacity is currently sourced from emission-free assets such as nuclear power, renewable resources including hydroelectricity, and interruptible load management. The renewable category shown throughout this document is based on modeled outputs of energy from renewable sources such as wind, solar, and biomass. Therefore, this metric is not intended to represent a quantity of certified renewable energy credits.
Currently, about 52 percent of TVA’s electricity is produced from coal-fired and natural gas-fired plants. The Nuclear plants produce about 33 percent of the generation, hydroelectric plants produce about 11 percent, and most of the remaining generation came from non-hydro renewables and energy efficiency sources. Although combustion turbines comprise 15 percent of TVA’s current capacity portfolio, their annual energy contribution is less than 1 percent, as would be expected of higher cost reliable peaking resources.
4.4 Calculate the Capacity Gap The need for power can be expressed either as a capacity gap or as an energy gap.
As noted previously, a capacity gap is the difference between total supply and total demand. More specifically, it is the difference in megawatts between a power provider’s existing firm capacity and the forecast annual peak adjusted for any interruptible customer loads plus 15 percent reserve requirements.
Figure 4-7 shows TVA’s estimated capacity gap or shortfall based on the existing firm capacity and the annual firm requirement for the current outlook scenario.
0
5,000
10,000
15,000
20,000
25,000
30,000
35,000
40,000
45,000
2014 2016 2018 2020 2022 2024 2026 2028 2030 2032
MW,SND Capacity for the Baseline Case
New DR
New EE
New Gas CC
New Gas CT
New Hydro
New Coal
New Nuclear
Existing DR
Existing Gas CC
Existing Gas CT/Diesel
Existing Renewables
Existing Coal
Existing Hydro
Existing Nuclear
31

INTEGRATED RESOURCE PLAN – 2015 DRAFT REPORT
Need for Power Analysis
Capacity Gap Chart
Figure 4-7: Estimating the Capacity Gap
Figure 4-8 shows the range of capacity gaps corresponding to the highest growth scenario, the Economic Growth scenario, and the lowest growth scenario, the Distributed Marketplace scenario. These and other scenarios are described in detail in Chapter 6.
Capacity Gap Range
Figure 4-8: Capacity Gap
-
5,000
10,000
15,000
20,000
25,000
30,000
35,000
40,000
45,000
2014 2016 2018 2020 2022 2024 2026 2028 2030 2032
MW, SND
Firm Requirement = Peak Demand + 15% Reserves - Interruptibles
Existing Firm Suply
Capacity Gap
(5,000)
0
5,000
10,000
15,000
2014 2016 2018 2020 2022 2024 2026 2028 2030 2032
MW, SND
Current Outlook Highest (Growth Economy) Lowest (Distributed Marketplace)
32

INTEGRATED RESOURCE PLAN – 2015 DRAFT REPORT
Need for Power Analysis
An energy gap is the amount of energy specified in GWh provided by the existing firm capacity resources minus the energy required to meet net system requirements (i.e., the energy needed to serve the load over the entire year). It includes the energy consumed by the end-users plus distribution and transmission losses.
Figure 4-9 shows the range of energy gaps TVA can expect under the net system requirements associated with the highest and lowest growth scenarios.
Under the Current Outlook scenario, TVA requires additional capacity and energy of 2,100 MW and more than 16,000 GWh by 2020, growing to 10,300 MW and more than 58,000 GWh by 2033.
Energy Gap Range
Figure 4-9: Energy Gap
(10,000)
0
10,000
20,000
30,000
40,000
50,000
60,000
70,000
2014 2016 2018 2020 2022 2024 2026 2028 2030 2032
GWh
Current Outlook Highest (Growth Economy) Lowest (Distributed Marketplace)
33

INTEGRATED RESOURCE PLAN – 2015 DRAFT REPORT
Need for Power Analysis
This page intentionally left blank
34

Chapter 5
35

INTEGRATED RESOURCE PLAN – 2015 DRAFT REPORT
Energy Resource Options
Contents 5 Energy Resource Options ...................................................................................................36
5.1 Energy Resource Selection Criteria .................................................................................36 5.1.1 Criteria for Considering Resource Options ............................................................... 36 5.1.2 Criteria Required for Resource Options .................................................................... 36
5.2 Resource Options Included in IRP Evaluation ...............................................................38 5.2.1 Existing Assets by Resource Category .................................................................. 38 5.2.2 New Assets by Resource Category ........................................................................ 42
5 Energy Resource Options
Maintaining the diversity of TVA’s energy resources is fundamental to our ability to provide low-cost, reliable and clean electric power to Valley residents, businesses and industries. For this reason, we considered the addition of a wide range of supply-side generating resources, as well as energy efficiency and other demand-side resource options, to fill the forecasted 20-year capacity and energy gaps identified through the power needs analysis described in Chapter 4.
The power needs analysis indicates that, under the Current Outlook scenario, TVA will require additional capacity and energy of 2,100 MW and almost 16,000 GWh by 2020, growing to 10,300 MW and more than 58,000 GWh by 2033.
5.1 Energy Resource Selection Criteria
During the scoping process, TVA identified a broad range of energy resources that could be used to fill the predicted capacity and energy gaps. The next two sections explain the criteria that were used to reduce this list to a manageable portfolio of expansion options. For a complete list of resource options considered, see Chapter 5, Energy Resource Options, of the associated EIS.
5.1.1 Criteria for Considering Resource Options
Two criteria were used to ensure that only viable energy resource options were considered in the IRP analysis. To be considered, resource options must:
• Use a proven technology, or one that has reasonable prospects of becoming commercially available in the planning horizon
• Be available to TVA within the region or be available to be imported through market purchases
5.1.2 Criteria Required for Resource Options To compare energy resource options available for new generation fairly, it is important to have consistent data regarding the cost and operating characteristics of each option. A list of characteristics used in the 2015 IRP are identified and defined below. Section 5.2.2 will present the numerical values for some of these parameters for the new assets.
36

INTEGRATED RESOURCE PLAN – 2015 DRAFT REPORT
Energy Resource Options
Cost characteristics: • Unit capital costs: Each technology type must have a representative $/kW, which is
considered a total installed cost. Total installed cost includes equipment, engineering and interest during construction in present day dollars.
• Capital escalation rates: Since capital costs typically increase over time, a simplifying assumption could be that the capital costs escalate at the forecast rate of inflation. However, some renewable energy technologies are forecast to decrease over time.
• Construction spend schedule: Some technologies take a long time to build. Construction times for nuclear units, for example, average about 10 years. To estimate the cash flow for the construction of a long-lead time build unit such as a nuclear unit, the percent of total capital dollars spent in each year is required. This metric is typically not needed for renewable assets which are smaller in scale and generally built in less than a year.
• Fixed operating and maintenance costs (FOM): FOM costs are independent of the number of hours of operation or amount of electricity produced and are generally expressed in a dollar per kilowatt per year ($/kW-yr). FOM includes operating and maintenance labor, plant support equipment, administrative expenses and fees required by regulatory bodies.
• Variable operating and maintenance costs (VOM): VOM costs are dependent on the number of hours of operation and are generally expressed as a dollar per megawatt-hour ($/MWh). VOM costs include consumables like raw water, waste and water disposal expenses, chemicals and reagents. VOM costs do not include fuel expenses.
• Fuel expenses: Fuel is the material that is consumed to generate electricity – for example, coal, natural gas, uranium and biomass. These costs are typically expressed in a dollar per million British thermal units ($/mmBtu) and include the delivery charges.
• Transmission: A new generating resource has to be connected to the transmission system. Costs are typically expressed as a dollar per kilowatt ($/kilowatt).
Operating characteristics:
• Summer net dependable capacity: Each unit must have a summer net dependable capacity rating in megawatts.
• Capacity credit: The capacity credit must be estimated for variable units or non-dispatchable resources. The capacity credit is the amount of capacity immediately available at the highest demand times.
• Summer full load heat rate: A heat rate must be specified for each unit. A heat rate is a measure of the consumption of fuel necessary for a unit to produce electricity. Heat rates are shown in British thermal units per kilowatt hour (Btu/kWh) and are based on a summer full-load heat rate. Heat rates are considered long-term planning assumptions and include the expected degradation in the heat rate of a unit after the first two years. Although a heat rate is not typically associated with a nuclear unit, one is necessary to model the fuel costs.
• Unit availability: A date when each unit would be available for operation must be specified. Unit availability is restricted by technical feasibility or commercial availability, as well as permitting and construction times. For example, if it takes four years to build a combined cycle plant, then a new CC could not be selected prior to four years into the planning horizon.
37
INTEGRATED RESOURCE PLAN – 2015 DRAFT REPORT
Energy Resource Options
• Book life: The book life of a unit is the number of years a resource is expected to be in service for accounting purposes. Book life is the financial payback period which represents the amount of time the asset is expected to be used and useful. A license extension, beyond the original asset life, is not assumed with any new generating option.
5.2 Resource Options Included in IRP Evaluation
TVA’s existing assets, including existing TVA-owned resources, as well as budgeted and approved projects, and power purchase agreements, are considered fixed assets in the IRP evaluation. These assets are expected to continue operating through the duration of the planning period or through the terms of existing power purchase agreements and other contracts, where applicable.
Options for new generation to meet the forecast net system requirements identified in Chapter 4 include: building new generating units, retro-fitting existing units with controls to continue operations, development of energy efficiency and demand response programs, and new power purchase agreements.
The next two sections describe existing and potential new generation by resource category. For a comprehensive description of all resource option attributes, characteristics and technologies, see Chapter 5, Energy Resource Options, of the associated EIS.
5.2.1 Existing Assets by Resource Category
Nuclear
TVA currently operates five nuclear reactors: three at Browns Ferry Nuclear Plant, two at Sequoyah Nuclear Plant and one at Watts Bar Nuclear Plant. These plants have a combined generating capacity of about 6,700 MW. On August 1, 2007, the TVA Board of Directors approved the completion of a second reactor at Watts Bar Nuclear Plant. This reactor will have a 1,150 MW generating capacity. The new reactor is scheduled to become operational by the end of 2015 and is included as a current resource in TVA’s generating portfolio.
Coal
TVA currently operates 10 coal-fired power plants consisting of 41 active generating units with a total capability of almost 11,900 MW. Capability is defined as the ability of a generating system to carry power for a specified time and does not include operational limitations such as fuel de-rates. We use a value lower than the capability of a resource for the summer net dependable capacity. TVA has retired 11 coal-fired units and idled 7 more units. The goal of long-term idling is the preservation of the asset so that it can be re-introduced into TVA’s generating portfolio in the future with improvements and environmental additions, if power system conditions warrant. By 2016, the existing coal fleet will decrease to about 32 active units with a total capability of 10,300 MW as a total of sixteen units are expected to be idled to comply with environmental requirements. Below is a snapshot of the planning assumptions for the coal units.
38

INTEGRATED RESOURCE PLAN – 2015 DRAFT REPORT
Energy Resource Options
In addition to TVA-owned coaled fired units, TVA has access to the output from a coal-fired power plant with a generating capacity of about 440 MW through a long-term power purchase agreement.
Figure 5-1: Coal Fleet Map
Shawnee Paradise
Cumberland Gallatin
Kingston
Bull Run
Colbert Widows Creek
Allen
Johnsonville
39

INTEGRATED RESOURCE PLAN – 2015 DRAFT REPORT
Energy Resource Options
Coal Plant Total # of Original Units
Current Operating Status Operational Plan
Allen 3 Operational Retire all three units by 12/31/2018. Board approved plan to construct a 2x1 combined cycle plant adjacent to the site
Bull Run 1 Operational Continue to operate Colbert 5 Unit 5 idled
Units 1-4 operational Board approved plan to retire all five units no later than 06/30/2016.
Cumberland 2 Operational Continue to operate Gallatin 4 Operational Continue to operate with Board
approved scrubbers and SCRs by 12/31/2017
Johnsonville 10 Units 1-4 operational Units 5-10 idled
Retire 6 units by 12/31/2015; retire 4 units by 12/31/2017
Kingston 9 Operational Continue to operate Paradise 3 Operational Board approved plans to construct a
combined cycle plant on site, retire units 1 and 2, and continue operation of unit 3.
Shawnee 10 Units 1-9 operational Unit 10 retired
Board approved plans to control units 1 and 4. The remaining units will continue to operate until a long-term decision is made
Widow’s Creek 8 Units 1-6 retired Unit 8 idled in fall of 2014 Unit 7 operational
Retire unit 8 in the future and continue to evaluate unit 7
Figure 5-2: Coal Fleet Portfolio Plans
Natural Gas
TVA operates 87 combustion turbines (CT) at nine power plants with a combined generating capability of about 5,400 MW and 11 combined cycle (CC) units at five plants with approximately 3,900 MW of capability. TVA is also currently a party to a long-term lease of a 700 MW CC plant.
Petroleum Fuels
TVA currently owns five diesel generators and has a few other diesel generators under power purchase contracts. These resources provide a total capability of about 120 MW.
Hydroelectricity
TVA operates 109 conventional hydroelectric generating units at 29 dams. These units have the capability to generate about 5,400 MW of electricity.
40

INTEGRATED RESOURCE PLAN – 2015 DRAFT REPORT
Energy Resource Options
In addition, TVA has a long-term power purchase agreement with the U.S. Army Corps of Engineers for eight dams on the Cumberland River system. These facilities provide almost 400 MW of capability.
TVA anticipates about half of the capability to be available at the summer peak hour given all the operational constraints.
Energy Storage
TVA operates one large energy storage facility. Our Raccoon Mountain Pumped-Storage Plant has four generating units with a SND capacity of 1,616 megawatts. Raccoon Mountain is TVA’s largest hydroelectric facility and provides critical flexibility to the TVA system by storing water at off-peak times for use when demand is high.
Wind
TVA purchases all of the power produced by the Buffalo Mountain wind farm in Anderson County, Tenn. Buffalo Mountain is the largest wind farm in the Southeast, with 18 turbines and 27 MW of nameplate capacity. As defined in section 4.3.2, the nameplate capacity is the maximum technical output of a generator, or the theoretical design value.
We also have long-term power purchase contracts with eight wind farms located in Illinois, Kansas and Iowa. These facilities provide about 1,500 MW of nameplate capacity. TVA anticipates about 14% of the nameplate to be available for peak summer requirements. TVA obtains the renewable energy credits from seven of these farms. Renewable energy credits are a separate commodity formed from the production of energy at designated sites.
Solar
TVA owns 16 photovoltaic (PV) installations with a combined capacity of about 300 kilowatts of nameplate capacity. We also purchase solar power through several programs and long-term power contracts totaling nearly 72 MW of nameplate capacity with about 36 MW expected to be available at the summer peak hour.
Biomass
TVA generates electricity at Allen Fossil Plant by co-firing methane from a nearby sewage treatment plant and by co-firing wood waste at Colbert Fossil Plant. The co-firing is more like a fuel switch for coal and does not provide additional capacity to either of the coal plants. TVA purchases about 49 MW of biomass-fueled generation.
Energy Efficiency
TVA’s energy efficiency and demand response portfolio focuses on reduction in peak demand and energy savings. From FY2012-FY2014 these efforts have reduced 451 MW in peak demand and have saved 1,843 GWhs in energy.
41

INTEGRATED RESOURCE PLAN – 2015 DRAFT REPORT
Energy Resource Options
Demand Response
Demand response programs also focus on reduction of peak demand. Under these programs, TVA industrial and commercial customers can reduce their power bills by allowing TVA to suspend availability of power in the event of a power system emergency. These programs provide about 600 MWs of peak reduction. Another program allows TVA to curtail power delivery to participants for economic or reliability reasons. This program provides about 560 MWs of peak reduction. If needed, TVA also can reduce peak demand by about 85 MWs through in-house curtailments.
5.2.2 New Assets by Resource Category A complete list of viable new resource options for IRP evaluation is provided below. A detailed discussion by resource category follows.
An independent third-party reviewed and compared the parameters to proprietary and other industry sources to ensure the modeled unit characteristics and assumptions were representative of the respective generating technologies. (See Appendix A for Navigant Summary Letter).
Nuclear
• Pressurized water reactor (PWR) • Advanced pressurized water reactor
(APWR) • Small modular reactor (SMR)
Coal fired
• Integrated gas combined cycle (IGCC)
• Supercritical pulverized coal 1x8 (SCPC1x8)
• Supercritical pulverized coal 2x8 (SCPC2x8)
• Integrated gas combined cycle with carbon capture and sequestration (IGCC CCS)
• Supercritical pulverized coal 1x8 with carbon capture and sequestration (SCPC1x8 CCS)
• Supercritical pulverized coal 2x8 with carbon capture and sequestration (SCPC2x8 CCS)
Natural Gas fired
• Simple cycle combustion turbine 3x
Utility-scale Storage • Pumped-hydro storage • Compressed air energy storage
(CAES) Wind
• Midcontinent Independent System Operator (MISO)
• Southwest Power Pool (SPP) • In Valley • High voltage direct current (HVDC)
Solar
• Utility-scale one-axis tracking photovoltaic
• Utility-scale fixed-axis photovoltaic • Commercial-scale large photovoltaic • Commercial-scale small photovoltaic
Biomass
• New direct combustion • Repowering
42

INTEGRATED RESOURCE PLAN – 2015 DRAFT REPORT
Energy Resource Options
(CT 3x) • Simple cycle combustion turbine 4x
(CT 4x) • Combined cycle two on one (CC 2 by
1) • Combined cycle three on one (CC 3
by 1)
Hydro • Hydro expansion project where spill
permits • Hydro expansion project where
space permits • Small-head or low-head (run of river)
hydro project
Energy Efficiency (EE) • Residential EE • Commercial EE • Industrial EE
Demand Response
Figure 5-3: List of New Assets
Nuclear There are three nuclear expansion options available to fill the expected capacity gap: a Pressurized Water Reactor (PWR), an Advanced Pressurized Water Reactor (APWR) and a Small Modular Reactor (SMR). The PWR option is based on completion of the Bellefonte brownfield site. The APWR and SMR options are not site specific.
Figure 5-5 shows some of operating characteristics used to model each option. Summer net dependable capacity, summer full load heat rate, unit availability and book life are explained above. The annual outage rate percentage includes forced and planned outages. See Chapter 4, Section 4.3.2, for a discussion of the different types of capacity ratings.
TVA could increase the electrical output of the three Browns Ferry Nuclear units. This project could provide approximately 400 MWs of additional capacity and is termed an extended power uprate (EPU). Figure 5-4 provides an example of the characteristics for one of these projects. The book life is based on the remaining life of the plant.
A nuclear PPA is also assumed to be available for model selection. PPAs are available for selection based on competitive information which cannot be disclosed. PPA options are evaluated similar to build options with a few slight differences. One difference is when present value revenue requirements resulting from the expansion model selections are converted into cash flows, the build options have significant capital expenditures that match the construction spend schedule (noted in section 5.1.2) versus the PPA options which have levelized cash flow payments based on the terms of the contract (similar to a mortgage). The other difference for PPAs is if the asset is located outside of the TVA transmission area then the necessary transmission wheeling charges are included.
43

INTEGRATED RESOURCE PLAN – 2015 DRAFT REPORT
Energy Resource Options
*The SMR option is based on a twin pack, the minimum viable configuration.
Figure 5-4: Nuclear Expansion Options
Coal The 2015 IRP includes six coal expansion options, including two integrated gas combined cycle (IGCC) options and four supercritical pulverized coal (SCPC) options.
IGCC technology converts coal into gas. One IGCC option has carbon capture and sequestration (CCS) and one does not. The CCS technology option is assumed to be commercially available starting in 2028 and has a 90% carbon dioxide (CO2) capture rate. Coal units typically have a CO2 emission rate of 205 pounds per million BTUs of coal burned so the CCS technology would reduce the CO2 rate to 20.5 pounds per million BTUs of coal burned. The modeled CO2 emissions incur an emission penalty in the form of a dollar per ton of CO2 emitted.
Two of the four SCPC options have one steam generator with a supercritical steam cycle. One of these options includes CCS technology; the other does not. The other two SCPC options have two steam generators with supercritical steam cycles. Again, one of these options includes CCS technology, and one does not.
Three options to continue to operate the Shawnee coal plant with the addition of more environmental controls (on various units) were available for model selection.
PWR APWR SMR* EPU 1
Summer Net Dependable Capacity (MW) 1,260 1,117 334 134Summer Full Load Heat Rate (Btu/kWh) 9,853 9,715 10,046 9,558Unit Availability (Yr) 2026 2026 2026 2018Annual Outage Rate (%) 10% 10% 10% 10%Book Life (Yrs) 40 40 40 29
Unit Characteristics
44

INTEGRATED RESOURCE PLAN – 2015 DRAFT REPORT
Energy Resource Options
IGCC IGCC* CCS
SCPC 1x8
SCPC 2x8
SCPC 1x8 CCS
SCPC 2x8 CCS
Unit Characteristics Summer Net Dependable Capacity (MW) 500 469 800 1,600 600 1,200 Summer Full Load Heat Rate (Btu/kWh) 8,000 10,000 8,674 8,674 10,843 10,843 Unit Availability (Yr) 2022 2028 2025 2025 2028 2028 Annual Outage Rate (%) 17% 18% 10% 10% 11% 11% Book Life (Yrs) 40 40 40 40 40 40
*Note the CCS technology is assumed to have a 25% penalty on a 625 MW IGCC plant.
Figure 5-5: Coal Expansion Options
Natural Gas The IRP evaluation includes two simple cycle combustion turbine (CT) options and two combined cycle (CC) natural gas fueled options. The simple cycle CTs are available with either three or four turbines. The CC options have either two turbines and one steam generator (CC 2 by 1) or three turbines and one steam generator (CC 3 by 1). CC units have supplemental capacity termed duct-firing capacity that adds approximately 100 MW to the base capacity shown. All options are based on a generic location. The CO2 emission rate for a typical gas unit is 117 pounds of CO2 per million Btus of gas burned. The modeled gas units incur emission charges based on a dollar per ton emission penalty.
In addition, the IRP evaluation includes options for purchasing power from existing merchant gas plants, acquiring merchant gas plants, and options in which TVA would build additional gas-fueled units.
CT 3x CT 4x CC 2 by 1 CC 3 by 1
Unit Characteristics Summer Net Dependable Capacity (MW) 590 786 670 1,005 Summer Full Load Heat Rate (Btu/kWh) 10,132 10,132 6,946 6,598 Unit Availability (Yr) 2018 2018 2019 2019 Annual Outage Rate (%) 4% 4% 7% 7% Book Life (Yrs) 30 30 30 30
Figure 5-6: Gas Expansion Options
45

INTEGRATED RESOURCE PLAN – 2015 DRAFT REPORT
Energy Resource Options
Petroleum Fuels TVA expects to phase out petroleum power purchases by 2028. There are no diesel fuels or other petroleum based resource options as a primary fuel source under consideration in the IRP because of emissions from these facilities.
Hydroelectric Two new hydro projects are included in the IRP evaluation, developed in collaboration with the TVRIX stakeholders. They include adding additional hydro turbines to existing dam facilities where there is space available with structural modifications. The other would add turbines at existing dam facilities where water that is now spilled could be used to power more turbines.
Both projects are similar to the larger TVA hydro system and are energy-limited units. Energy-limited units are resources that cannot be dispatched (in the model) based on price ($/MWh) as are traditional thermal generating resources, such as nuclear, coal and gas. Hydropower cannot be dispatched based on price alone because water releases in the Tennessee River system also are required for navigation and flood damage reduction and take into account recreation, water quality and other purposes. For this reason, an hourly hydro generation schedule, totaling 8,760 hours, is pre-loaded into the capacity expansion model.
Since hydro plants do not use fuel, a heat rate is not needed for modeling.
Small- and low-head hydropower, called run of river, also is included as an IRP resource option.
A hydro PPA was also included in the IRP evaluation.
Figure 5-7: Hydro Expansion Options
Energy Storage The IRP evaluation includes a new hydroelectric pumped-storage unit as a resource option. The pumped-storage option would use three reversible turbine generators to either take electricity from the grid by pumping water into a higher altitude reservoir during periods of excess power or add electricity to the grid by using the pumped water to power a turbine as it falls from the upper to the lower reservoir.
A compressed air energy storage (CAES) option also is included as an energy storage option. A CAES plant is similar to a pumped-storage plant but, instead of pumping water from a lower to an upper reservoir, a gas turbine is used to compress air often into an underground cavern where it can be stored under pressure until electricity is required. The pressurized air is then heated and directed through a conventional generator to produce electricity.
Dam Spill Addition
Dam Space Addition
Run of River
Summer Net Dependable Capacity (MW) 40 30 25Unit Availability (Yr) 2019 2018 2021Annual Outage Rate (%) - - 4%Book Life (Yrs) 40 40 40
Unit Characteristics
46

INTEGRATED RESOURCE PLAN – 2015 DRAFT REPORT
Energy Resource Options
Storage efficiency is included in modeling both these energy storage options because of the energy losses inherent to the energy conversion process and due to the loss of water or air during storage. The storage efficiency percentage for these energy storage options represents the efficiency of one cycle (i.e., pumping water, then releasing).
TVA did not evaluate any electric battery storage options because of operational limitations.
Pump Storage
CAES
Unit Characteristics Summer Net Dependable Capacity (MW) 850 330 Summer Full Load Heat Rate (Btu/kWh) - 4,196 Unit Availability (Yr) 2023 2019 Annual Outage Rate (%) 7% 10% Storage Efficiency (%) 81% 70% Book Life (Yrs) 40 40
Figure 5-8: Utility-Scale Storage Options
Wind
Because TVA cannot take direct advantage of the tax credits and other investment incentives offered by the federal government to encourage wind power development, it has been more financially advantageous to acquire wind power resources through PPAs. This approach allows us to include wind as a resource option in the IRP. The purchase of wind resources as a PPA, whether produced in or imported to the TVA region, lowers the costs of these resources to TVA and its customers. TVA may evaluate the option of building wind facilities in the future if investment incentives and/or future federal or state renewable mandates change.
Four wind options are included in the IRP evaluation, and the characteristics of these options were developed with input from the TVRIX stakeholders. The Midcontinent Independent System Operator (MISO), the Southwest Power Pool (SPP) and the In Valley options represent various wind resources in different regional transmission areas. The High Voltage Direct Current (HVDC) option would use a direct current (DC) bulk transmission system. The HVDC transmission system would reduce power losses that are typical of the more common alternating current (AC) transmission systems. The HVDC option would require a third-party to permit and build a new transmission line so the unit availability is later than the other options. All unit availability dates were rounded to the next full year.
Wind resources are energy- and capacity-limited resources. For this reason, we use an energy production profile to dispatch wind energy rather than price, similar to hydro resources. We also apply a capacity credit since the total nameplate capacity of a wind turbine cannot be expected at the time of the system peak. To determine the capacity credit, we used historical data to estimate the typical wind power output at the time of the peak power demand on the TVA
47

INTEGRATED RESOURCE PLAN – 2015 DRAFT REPORT
Energy Resource Options
system. This resulted in a 14 percent capacity credit, meaning that 14 percent of nameplate capacity is expected to be available at the system peak. This reduced capacity is considered the summer net dependable capacity. Appendix B includes a more detailed discussion about the determination of the data assumptions for the modeling of the wind options included in this IRP.
MISO SPP In valley
HVDC
Unit Characteristics
Nameplate Capacity (MW) 200 200 120 200 Summer Net Dependable Capacity (MW) 28 28 17 28 Unit Availability (Yr) 2016 2016 2017 2020 Annual Outage Rate - - - - Book Life (Yrs) 20 20 20 20
Figure 5-9: Wind Expansion Options
Solar Similar to new wind generation, because TVA cannot take advantage of the current investment incentives offered to promote solar power development, it is more financially advantageous to acquire solar power resources through PPAs. We may evaluate the option of building solar facilities in the future if investment incentives and/or federal or state renewable mandates change.
Four solar options, developed with input from the TVRIX stakeholders, are included in the IRP evaluation at a minimum capacity block size of 25 MW nameplate capacity. All capacities are stated in alternating current (AC) terms.
The utility tracking option is considered a single installation and includes a dual axis tracker that allows the solar panels to follow the sun. The utility fixed option represents several ground mounted fixed-axis/fixed-tilt solar installations. The large and small scale commercial options represent a collection of solar installations at different price points and with different generating characteristics.
Like hydro and wind resources, solar resources are energy-limited and therefore dispatched using an energy production profile. Solar resources also are similar to the capacity-limited wind resources where the availability of the unit at the time of the TVA system peak is less than the full nameplate capacity. We applied a 68 percent capacity credit for the utility tracking unit and a 50 percent capacity credit for the fixed asset options. The unit availability date was rounded to the first full year. More details about the assumptions used in the development of the unit characteristics for these solar options can be found in Appendix B.
48

INTEGRATED RESOURCE PLAN – 2015 DRAFT REPORT
Energy Resource Options
Figure 5-10: Solar Expansion Options
Biomass Two new biomass options are included in the IRP evaluation: a new direct combustion biomass facility and a repower option, which is the conversion of existing coal-fired units to biomass-fired units. Like the assumptions for hydro, wind, and solar, these options were also developed with input from the TVRIX stakeholders. Because biomass cofiring is considered a fuel switch opportunity, it was not included as a capacity expansion option.
Direct Combustion
Repower
Unit Characteristics Summer Net Dependable Capacity (MW) 115 75 Summer Full Load Heat Rate (Btu/kWh) 13,500 12,243 Unit Availability (Yr) 2019 2015 Annual Outage Rate 5% 5% Book Life (Yrs) 30 20
Figure 5-11: Biomass Expansion Options
Demand Response Demand response programs enable participating customers to reduce their power costs by allowing TVA to limit their power during peak demand times. Using a new innovative approach, these programs were modeled in the 2015 IRP based on unit characteristics similar to those used for natural gas combustion turbines (CT). Demand response programs are operated much like CTs, or peaker units, and focus on reduction of peak demand. However, the terms of the demand response customer contracts are shorter than the expected book life of a CT unit.
Utilitytracking
Utilityfixed
Commercialsmall
Commerciallarge
Nameplate Capacity (MW) 25 25 25 25Summer Net Dependable Capacity (MW) 18 13 13 13Unit Availability (Yr) 2015 2015 2015 2015Annual Outage Rate - - - -Book Life (Yrs) 25 25 25 25
Unit Characteristics
49

INTEGRATED RESOURCE PLAN – 2015 DRAFT REPORT
Energy Resource Options
Demand Response
Unit Characteristics Summer Net Dependable Capacity (MW) 1 Summer Full Load Heat Rate (Btu/kWh) 10,132 Unit Availability (Yr) 2014 Annual Outage Rate - Book Life (Yrs) 5
Figure 5-12: DR Expansion Options
Energy Efficiency The 2015 IRP reflects TVA’s increased focus on energy efficiency (EE). A new, innovative modeling approach was used in this IRP to evaluate EE as a supply-side resource, with characteristics and costs structured similarly to conventional generating resources or power plants. This allowed various EE “generating units” to be optimized against the other resource options. More details about this modeling approach can be found in Appendix D.
EE “generating units” were developed to represent the residential (Res), commercial (Com) and industrial (Ind) sectors. Then each sector was divided into three tiers, representing three distinct price points, for a total of nine units. All of the tier 1 units are available beginning in 2014, but the first year tier 2 and 3 units will be available varies by sector. These units are energy limited, similar to hydro, wind and solar units, and use annual hourly production profiles.
Res Tier
1
Res Tier
2
Res Tier
3
Com Tier
1
Com Tier
2
Com Tier
3
Ind Tier
1
Ind Tier
2
Ind Tier
3
Unit Characteristics Nameplate Capacity (MW) 10 10 10 10 10 10 10 10 10 Summer Full Load Heat Rate (Btu/kWh) - - - - - - - - - Unit Availability (Yr) 2014 2022 2026 2014 2019 2022 2014 2018 2022 Annual Outage Rate - - - - - - - - - Book Life (Yrs) 17 13 13 15 13 13 12 10 10
Figure 5-13: EE Expansion Options
50

Chapter 6
51

INTEGRATED RESOURCE PLAN – 2015 DRAFT REPORT
Resource Plan Development and Analysis
Contents 6 Resource Plan Development and Analysis ......................................................................52
6.1 Development of Scenarios and Strategies .......................................................................53 6.1.1 Development of scenarios ........................................................................................ 53 6.1.2 Development of planning strategies ......................................................................... 58
6.2 Resource portfolio optimization modeling ......................................................................61 6.2.1 Development of optimized capacity expansion plan ................................................. 62 6.2.2 Evaluation of detailed financial analysis ................................................................... 62 6.2.3 Uncertainty (risk) analysis ........................................................................................ 63
6.3 Portfolio Analysis and Scorecard Development ...............................................................65 6.3.1 Selection of Metric Categories .................................................................................. 65 6.3.2 Development of scoring and reporting metrics ....................................................... 67 6.3.3 Scorecard design ..................................................................................................... 72
6.4 Strategy Assessment Process .......................................................................................72
6 Resource Plan Development and Analysis
This chapter describes the process TVA uses to identify a target power supply mix that will be based on the analysis done in the IRP. The process involves choosing the types of resources that we could use to meet the future power needs of our customers, recognizing that the future is uncertain and our choices need to give us flexibility to adapt. So the approach tests several options around resource choices we could make (called planning strategies) in different sets of uncertain future conditions (called scenarios). The set of resource choices selected in any one future defines how we would provide power to our customers under those conditions; we call that set of resource choices a portfolio, and it is created by modeling a planning strategy in a particular scenario. These portfolios are then scored using some key factors (called metrics) that allow us to capture cost, risk, environmental footprint and other aspects that should be considered when deciding on the best target power supply mix.
52

INTEGRATED RESOURCE PLAN – 2015 DRAFT REPORT
Resource Plan Development and Analysis
6.1 Development of Scenarios and Strategies TVA uses a scenario planning approach in integrated resource planning, a common approach in the utility industry. Scenario planning is useful for determining how various business decisions will perform in an uncertain future. The goal is to develop a least-cost strategy that is consistent with TVA’s legislatively mandated mission and also delivers our customers rate stability over a variety of future environments.
Multiple strategies, which represent business decisions that TVA can control, are modeled against multiple scenarios, which represent uncertain futures that TVA cannot control. The intersection of a single strategy and a single scenario results in a resource portfolio6. A portfolio is a 20-year capacity expansion plan that is unique to that strategy and scenario combination.
6.1.1 Development of scenarios While most quantitative models used in long range planning focus on what is statistically likely based on history, market data and projected future patterns, TVA uses scenario analysis that allows for the possibility that the future could evolve along paths not suggested solely by historical trends.
The scenarios used in the draft IRP analysis were developed during the scoping phase of the study in 2013. The process used to develop these scenarios is described below.
Identification of key uncertainties The first step in developing scenarios was to work with the individuals on the IRP Working Group to identify key uncertainties. These uncertainties, shown in Figure 6-1, were used as building blocks to construct scenarios.
6 Portfolios are also referred to as capacity expansion plans or resource portfolios
53

INTEGRATED RESOURCE PLAN – 2015 DRAFT REPORT
Resource Plan Development and Analysis
Uncertainty Description
TVA sales The load to be served by TVA
Natural gas prices The price of natural gas ($/MMBtu), including transportation
Wholesale electricity prices for TVA
The hourly price of energy ($/MWh) at the TVA boundary (used as a proxy for market price of power)
Coal prices The price of coal ($/MMBtu), including transportation
Regulations All regulatory and legislative actions, including applicable codes and standards, that impact the operation of electric utilities, excluding CO2 regulations
CO2 regulation/price The cost of compliance with possible CO2 related regulation and/or the price of cap-and-trade legislation, represented as a $/Ton value
Distributed Generation National trending of distributed generation resources and potential regional activity by customers or third-party developers (not TVA) See Appendix C for details on the method used to incorporate the effects of DG in the scenarios.
National Energy Efficiency (EE) adoption
An estimate of the willingness of customers nationally to adopt EE measures, recognizing the impacts of both technology affordability and electricity price
Economic outlook (national and regional)
All aspects of the regional and national economy including general inflation, financing considerations, population growth, GDP and other economic drivers
Figure 6-1: Key Uncertainties
Construction of scenarios Scenarios were constructed using combinations of the key uncertainties shown in Figure 6-1 and then refined to ensure that each scenario:
• Represented a plausible, meaningful future in which TVA could find itself within the 20-year study period
• Was unique among the scenarios being considered for study
Placed sufficient stress on the resource selection process and provided a foundation for analyzing the robustness, flexibility and adaptability of each combination of supply- and demand-side options
• Captured relevant key stakeholder interests.
54

INTEGRATED RESOURCE PLAN – 2015 DRAFT REPORT
Resource Plan Development and Analysis
Figure 6-2 shows the key characteristics of the scenarios selected for the draft IRP analysis.
Scenarios Key Characteristics
1 - Current Outlook The outlook for the future which TVA is currently using for resource planning studies
2 – Stagnant Economy Stagnant economy results in flat to negative growth, delaying the need for new generation
3 – Growth Economy Rapid economic growth translates into higher than forecasted energy sales and resource expansion
4 – De-Carbonized Future
Increasing climate-driven effects create strong federal push to curb greenhouse gas emissions; new legislation caps and penalizes CO2 emissions from the utility industry and incentivizes non-emitting technologies
5 – Distributed Marketplace
Customers’ awareness of growing competitive energy markets and the rapid advance in energy technologies produce unexpected high penetration rates in distributed generation and energy efficiency. TVA assumes responsibility to serve the net customer load (no backup for any customer-owned resources)
Figure 6-2: Scenario Key Characteristics
Determination of key scenario assumptions The final step in scenario development was to forecast key assumptions for each scenario.
Figure 6-3 shows the forecasted assumptions for energy demand/load growth for each scenario. The Current Outlook scenario projects growth of approximately 1.0 percent per year. Three scenarios – Stagnant Economy, De-Carbonized Future, and Distributed Marketplace – project lower load growth than the Current Outlook scenario, while the Growth Economy scenario models a modest growth scenario.
55

INTEGRATED RESOURCE PLAN – 2015 DRAFT REPORT
Resource Plan Development and Analysis
Figure 6-3: Energy Demand Assumptions
Figure 6-4 shows the forecasted assumptions for gas prices. Gas prices are similar for the Current Outlook, Stagnant Economy and Distributed Marketplace scenarios, while both the Growth Economy and De-Carbonized Future scenarios assume a substantial increase in gas prices later this decade.
Figure 6-4: Gas Price Assumptions
TWh
TVA Energy Demand
1 Current Outlook 2 Stagnant Economy3 Growth Economy 4 De-carbonized Future5 Distributed Marketplace
$/M
MBt
u
TVA Gas Price - Nominal
1 Current Outlook 2 Stagnant Economy3 Growth Economy 4 De-carbonized Future5 Distributed Marketplace
56
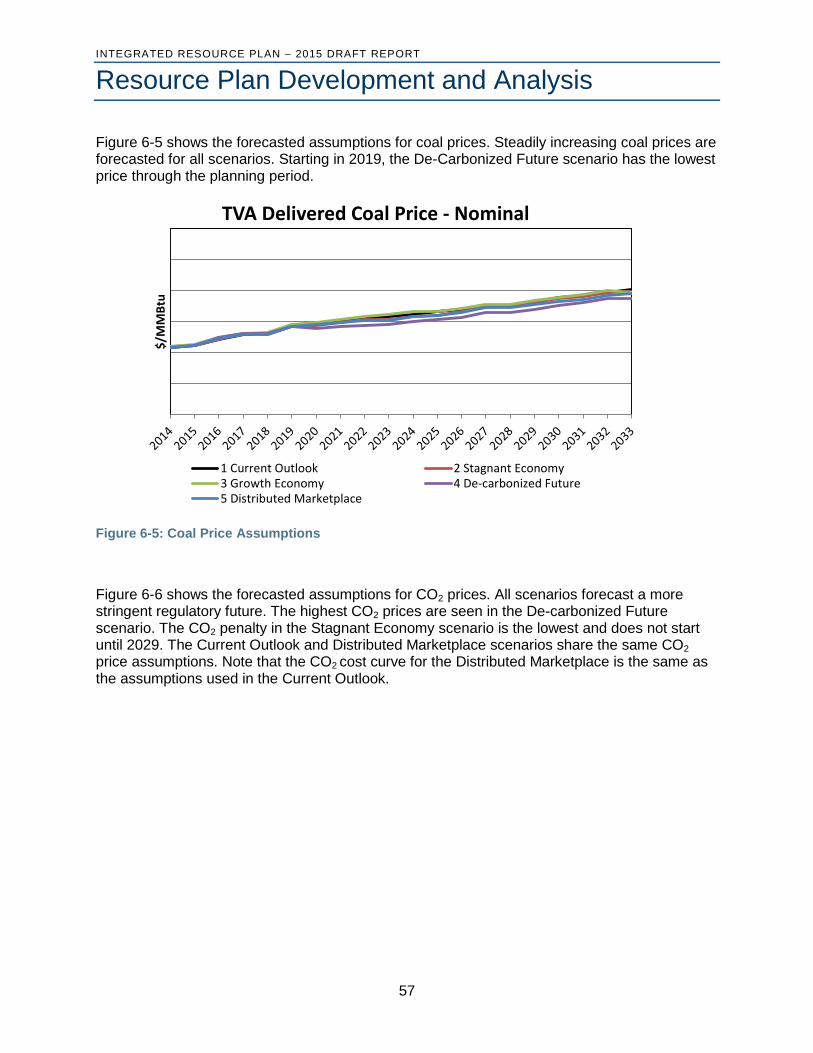
INTEGRATED RESOURCE PLAN – 2015 DRAFT REPORT
Resource Plan Development and Analysis
Figure 6-5 shows the forecasted assumptions for coal prices. Steadily increasing coal prices are forecasted for all scenarios. Starting in 2019, the De-Carbonized Future scenario has the lowest price through the planning period.
Figure 6-5: Coal Price Assumptions
Figure 6-6 shows the forecasted assumptions for CO2 prices. All scenarios forecast a more stringent regulatory future. The highest CO2 prices are seen in the De-carbonized Future scenario. The CO2 penalty in the Stagnant Economy scenario is the lowest and does not start until 2029. The Current Outlook and Distributed Marketplace scenarios share the same CO2 price assumptions. Note that the CO2 cost curve for the Distributed Marketplace is the same as the assumptions used in the Current Outlook.
$/M
MBt
u
TVA Delivered Coal Price - Nominal
1 Current Outlook 2 Stagnant Economy3 Growth Economy 4 De-carbonized Future5 Distributed Marketplace
57

INTEGRATED RESOURCE PLAN – 2015 DRAFT REPORT
Resource Plan Development and Analysis
Figure 6-6: CO2 Price Assumptions
6.1.2 Development of planning strategies After the scenarios were developed, the next step in the IRP process was to design planning strategies. Scenarios and strategies are very different. Whereas scenarios describe plausible futures and include factors that TVA cannot control, strategies describe business decisions over which TVA has full control.
The process used to develop planning strategies is described below.
Identification of key strategy components The first step in developing planning strategies was to identify the key components, or attributes, to be included in each strategy. Ten distinct attributes were identified using input from individuals on the IRP Working Group and comments received during the public scoping period.
$ /
met
ric to
n CO2 Costs Nominal ($ / metric ton)
1 Current Outlook 2 Stagnant Economy3 Growth Economy 4 De-carbonized Future5 Distributed Marketplace
Planning strategies represent decisions
and choices over which TVA has
control.
58

INTEGRATED RESOURCE PLAN – 2015 DRAFT REPORT
Resource Plan Development and Analysis
Attributes Description
Existing nuclear Constraints related to TVA’s existing nuclear fleet, including Extended Power Uprates (EPUs)
Nuclear additions
Limitations on technologies and timing related to the addition of new nuclear capacity, including Watts Bar Unit 2, small modular reactors (SMRs), A/P 1000s and completion of TVA’s Bellefonte Nuclear Plant
Existing coal Constraints related to TVA’s existing coal fleet, including the current schedule for idling coal units
New coal Limitations on technology and timing on new coal-fired plants, including Carbon Capture & Sequestration (CCS) and Integrated Gasification Combined Cycle (IGCC) technologies
Gas additions Limitations on technologies and timing related to the expansion options fueled by natural gas (CT, CC)
Energy Efficiency and Demand Response (EEDR)
Considers energy efficiency and demand response programs that are incentivized by TVA and/or local power companies, excluding impacts from naturally occurring efficiency/ conservation
Renewables (utility scale)
Limitations on technologies and timing of renewable resources, including options that could be pursued by TVA or in collaboration with local power companies
Purchased Power Agreements (PPAs)
Level of market reliance allowed in each strategy; no limitation on the type of energy source (conventional or renewable)
Distributed Generation/Distributed Energy Resources
Includes customer-driven resource options or third-party projects that are distributive in nature
Transmission Type and level of transmission infrastructure required to support resource options in each strategy
Figure 6-7: Key Planning Strategy Attributes
Development of strategies using attributes TVA combined these 10 components to create five distinct planning strategies for the IRP analysis. Figure 6-8 lists the five strategies and their key characteristics.
59

INTEGRATED RESOURCE PLAN – 2015 DRAFT REPORT
Resource Plan Development and Analysis
Strategies Key Characteristics
A – Traditional Utility Planning (Reference Plan)
Traditional least cost optimization; EE/renewables selectable
B – Meet an Emission Target Resources selected to create lower emitting portfolio based on an emission rate target or level using CO2 as the emissions metric
C – Focus on Long-Term, Market-Supplied Resources
Most new capacity needs met using longer-term PPA or other bilateral arrangements; TVA makes a minimal investment in owned assets
D – Maximize Energy Efficiency (EE)
Majority of capacity needs are met by setting an annual energy target for EE (priority resource to fill the energy gap); other resources selected to serve remaining need
E – Maximize Renewables
Enforce near-term and long-term renewable energy targets; meet targets with lowest cost combination of renewables; hydro is included as a renewable option along with biomass, wind and solar
Figure 6-8: Planning Strategies Key Characteristics
Definition of strategies After defining each strategy’s key characteristics, specific descriptions were developed for each strategy attribute as shown in Figure 6-9.
60

INTEGRATED RESOURCE PLAN – 2015 DRAFT REPORT
Resource Plan Development and Analysis
Figure 6-9: Strategy Descriptions
Strategy attributes were used in the modeling in several different ways. For example, Strategy A has specific defined constraints such as new coal additions only with carbon capture and sequestration. Other components specified timing, such as allowing nuclear additions to be started after 2022 in Strategies A and B.
6.2 Resource portfolio optimization modeling The generation of resource portfolios was a two-step process. First, an optimized portfolio, or capacity expansion plan, was generated, followed by a detailed financial analysis. This process was repeated for each strategy/scenario combination and for additional sensitivity runs.
61

INTEGRATED RESOURCE PLAN – 2015 DRAFT REPORT
Resource Plan Development and Analysis
6.2.1 Development of optimized capacity expansion plan TVA uses a capacity optimization model called System Optimizer.7 This model employs an optimization technique where an “objective function” (e.g., total resource plan cost) is minimized subject to a number of constraints.
Energy resources were selected by adding or subtracting assets based on minimizing the present value of revenue requirements (PVRR). PVRR represents the cumulative present value of total revenue requirements for the study period based on an eight percent discount rate. In other words, PVRR is the present day value of all future costs for the study period, discounted to reflect the time value of money and other factors such as investment risk.
In addition, the following constraints were applied in the optimization runs:
• Balance of supply and demand • Energy balance • Reserve margin • Generation and transmission operating limits • Fuel purchase and utilization limits • Environmental stewardship
The System Optimizer model uses a simplified dispatch algorithm to compute production costs and a “representative hours” approach in which average generation and load values in each representative period within a week are scaled up appropriately to span all hours of the week and days of the months.
Year-to-year changes in the resource mix are then evaluated and infeasible states are eliminated. The least cost path (based on lowest PVRR) from all possible states in the study period is used in the draft IRP as the optimized capacity expansion plan.
6.2.2 Evaluation of detailed financial analysis Next, each capacity expansion plan was evaluated using an hourly production costing algorithm, which calculated detailed production costs of each plan including fuel and other variable operating costs. These detailed cost simulations provided total strategy costs and financial metrics that were used in the strategy assessment process.
This analysis was accomplished using a strategic planning software tool called MIDAS.8 MIDAS uses a chronological production costing algorithm with financial planning data to assess plan cost, system rate impacts and financial risk. It also uses a variant of Monte Carlo analysis,9 which is a sophisticated analytical technique that allows for risk analysis by varying important drivers in multiple runs to create a distribution of total costs rather than a single point estimate. The total cost for each resource plan (PVRR) was calculated taking into account additional considerations, including the cash flows associated with financing. The model generated multiple combinations of the key assumptions for each year of the study period and computed the costs of each combination. Capital costs for supply-side options were amortized for
7 System Optimizer is an industry standard software model developed by Ventyx. 8 MIDAS is also a Ventyx product. 9 Monte Carlo analysis is also referred to as stochastic analysis
62

INTEGRATED RESOURCE PLAN – 2015 DRAFT REPORT
Resource Plan Development and Analysis
investment recovery using a real economic carrying cost method that accounted for unequal useful lives of generating assets.
In addition to computation of the total plan cost (PVRR) over the full 20-year study period, a 10-year system average cost metric was calculated. This metric provides an alternative view of the revenue requirements for the 2014-2023 timeframe expressed per MWh. It is not intended as a forecast of wholesale or retail rates over the study period. Rather, it was developed to gauge the potential rate impact associated with a given portfolio and provides an indication of relative rate pressure across the strategies being studied. A second system average cost metric covering the period 2024-2033 also was computed. Reviewing these two metrics in combination with PVRR and the financial risk measures provides a clearer picture of the cost/risk balance for each resource plan.
6.2.3 Uncertainty (risk) analysis Stochastic analysis of production cost and financials bound the uncertainty and identify the risk exposure that is inherent in long-range power supply planning, because the fundamental forecasts used in those studies are inevitably wrong. Variability will result due to supply/demand disruptions, weather, market conditions, technology improvements, and economic cycles. A Monte Carlo simulation allows for a better understanding of the richness of possible futures, as well as their likelihoods, so that plans can be made proactively, as opposed to reactively. A stochastic model is used to estimate probability distributions of potential outcomes by allowing for simultaneous random-walking variation in many inputs over time.
At TVA, a representative Monte-Carlo distribution comprised of 72 stochastic iterations is developed for each of the scenario/strategy combinations to more fully assess the likely plan costs for each portfolio. A sample stochastic result is shown in Figure 6-10:
Figure 6-10: Sample Stochastic Result
Cost and risk metrics shown later in this report are computed based on the expected values produced from these stochastic iterations. The Midas tool allows TVA to explicitly consider uncertainty and risk exposure in the evaluation of the planning strategies. This analysis is based on applying probability distributions around the key variables used to frame the scenarios and
63

INTEGRATED RESOURCE PLAN – 2015 DRAFT REPORT
Resource Plan Development and Analysis
define assumptions used in the strategies. The Monte Carlo analysis in MIDAS includes 13 key variables:
• Commodity prices: natural gas, coal, oil, CO2 allowances, electricity price10 • Financial parameters: interest rates, capital costs, Operation and Maintenance (O&M)
costs • Availability: hydro, fossil and nuclear • Load forecast uncertainty: demand and load-shape-year • Planning parameters: reserve margin target
The fundamental (expected value) forecasts for these key variables differ across the five scenarios, and so the uncertainty ranges (stochastic envelope) are also different. So the evaluation of the uncertainty around the performance of the strategies considers both the variation across the scenarios (different plausible futures), as well as capturing the probability distribution around the expected forecasts represented by the stochastic envelope. As an example, Figure 6-11 shows these different uncertainty ranges around the TVA peak load forecast.
Figure 6-11: Example Uncertainty Ranges
The figure shows the range of variation in the expected forecast of peak demand across all five scenarios (represented by the gray shaded area); for orientation, the Current Outlook scenario’s fundamental forecast and its associated uncertainty range is shown in the black solid and dotted lines. The stochastic envelope, representing the uncertainty ranges from all five scenarios, is shown as the blue dotted line and bounds the uncertainty range evaluated in Midas. Each of the 13 key variables has a set of scenario ranges and stochastic envelopes that ensure a more dynamic assessment of the variability in the performance of each planning strategy.
10 Stochastic electricity price was derived in MIDAS using stochastic variables as inputs
64

INTEGRATED RESOURCE PLAN – 2015 DRAFT REPORT
Resource Plan Development and Analysis
In addition to the uncertainty analysis based on the Monte Carlo modeling, in this IRP study we are including energy efficiency (EE) as a selectable resource. TVA made this decision to allow full portfolio optimization, to clearly demonstrate value proposition and to allow flexible, nimble response to changing business environments. Uncertainty exists with all resource types and is modeled in different ways. For the EE resource, we consider two primary sources of uncertainty: Design and Delivery Uncertainty. Design uncertainty exists for the following reasons:
• Blocks are “proxies” for programs not yet developed some of which represent as-yet undeveloped technologies
• Blocks are a blend of measures with different lifespans and each with a different underlying load shape
Delivery uncertainty is driven by several factors:
• The fact that TVA does not own the relationship with most end-use customers in the valley
• Experience in other jurisdictions around non-performance (realization rate) for both energy and demand
• Uncertainty around the impact of future codes and standards on program design and deliveries (are EE program deliveries as certain in 2033 as they are in 2015?)
A more complete discussion of the treatment of uncertainty for energy efficiency can be found in Appendix D. The uncertainty around the EE resource, combined with the Monte Carlo modeling of uncertainty, results in a robust evaluation of the planning strategies and allows TVA to more confidently apply metrics using a scorecard framework as a way to assess overall performance.
6.3 Portfolio Analysis and Scorecard Development Modeling multiple strategies within multiple scenarios resulted in a large number of portfolios. So, initially, our portfolio analysis focused on common characteristics that strategies exhibited over multiple scenarios rather than on specific outcomes in individual portfolios. Strategies that behaved in a similar manner in most scenarios were considered to be “robust” – i.e., more flexible, less risky over the long-term and able to lessen the impacts of uncertainty. Conversely, strategies that behaved differently or poorly in most scenarios were considered more risky with a higher probability for future regret.
The first step in the portfolio evaluation process was to develop a scorecard to assess and compare the performance of planning strategies in each scenario. The process used to develop an evaluation scorecard is described below.
6.3.1 Selection of Metric Categories TVA’s mission and stakeholder concerns related to resource planning were key considerations in developing a set of metrics for use in evaluating the performance of the portfolios generated in the IRP.
To achieve our overall mission of providing low cost, reliable power to the people of the Tennessee Valley, TVA focuses on four strategic imperatives: balancing rates and debt so that we maintain low power rates while living within our means; and recognizing the trade-off between optimizing the value of our asset portfolio and being responsible stewards of the Tennessee Valley’s environment and natural resources.
65

INTEGRATED RESOURCE PLAN – 2015 DRAFT REPORT
Resource Plan Development and Analysis
Figure 6-12: Strategic Imperatives
Optimizing TVA’s asset portfolio is the primary purpose of integrated resource planning, but other imperatives also shape the process:
• As part of the financial analysis, a balance sheet and income statement are created for each portfolio to capture the rate revenues required to fund each resource plan.
• A coverage ratio method is used to ensure that the overall debt limit is respected in each optimization run.
• Stewardship obligations are considered in modeling of various compliance requirements, including portfolio optimization which factors in a carbon penalty and includes key environmental metrics in the assessment of each resource plan (air, water and solid waste impacts).
As part of the public involvement process, stakeholders assigned priority to key concerns regarding the development of a long-range power supply plan, and priority concerns were used in identifying metric categories.
Based on TVA’s strategic imperatives and feedback from stakeholders, five metrics categories were selected for use in evaluating the performance of planning strategies:
• Cost, including both the long-range cost of the resource plan (present value of customer costs) as well as a look at a shorter term average system cost (an indicator of possible rate pressure)
66

INTEGRATED RESOURCE PLAN – 2015 DRAFT REPORT
Resource Plan Development and Analysis
• Financial Risk, which measures the variation (uncertainty) around the cost of the resource plan by assessing a risk/benefit ratio and computing the likely amount of cost at risk using data from probability modeling
• Stewardship, which captures multiple measures related to the environmental footprint of the resource plans such as air emissions and water or waste impacts
• Valley Economics, which computes the macro-economic effects of the resource plans by measuring the change in per capita income compared to a reference case
• Flexibility, which measures how responsive the generation portfolio of each resource plan is by evaluating the type/quantity of resources and the extent to which this mix can easily follow load swings.
6.3.2 Development of scoring and reporting metrics After establishing the metrics categories, the next step was to identify candidate metrics for each category. These metrics can be grouped into two broad categories:
• Scoring metrics to be used in the scorecard to assess the performance of each strategy in different scenarios
• Reporting metrics to be included in the IRP report as supplemental information for purposes of explanation and clarification.
After considering the computational requirements and likely predictive value of multiple candidate metrics, as well as whether stakeholder groups would understand the purpose of each metric, TVA selected nine scoring metrics summarized in Figure 6-13.
67

INTEGRATED RESOURCE PLAN – 2015 DRAFT REPORT
Resource Plan Development and Analysis
Scoring Metric Definition
20-year expected value PVRR
The total plan cost (capital and operating) expressed as the present value of revenue requirements over the 20-year study period (generated from the stochastic analysis, or the expected value of the probability distribution of plan costs)
Average system cost ($/MWh), Year 1-10
Average system cost for the first 10 years of the study, computed as the levelized annual average system cost (revenue requirements in each year divided by sales in that year)
Risk/benefit ratio Area under the plan cost distribution curve between P(95)and expected value divided by the area between expected value and P(5)
Risk exposure The point on the plan cost distribution below which the likely plan costs will fall 95% of the time based on stochastic analysis
CO2 annual average tons The annual average tons of CO2 emitted over the study period
Water consumption The annual average gallons of water consumed over the study period
Waste The annual average quantity of coal ash, sludge and slag projected based on energy production in each portfolio
Flexibility The annual system regulating capacity expressed as a percentage of peak load; measures the ability of the system to respond to load swings
% change in per capita income
The change in per capita personal income expressed as a change from a reference portfolio in each scenario
Figure 6-13: Scoring Metrics
68

INTEGRATED RESOURCE PLAN – 2015 DRAFT REPORT
Resource Plan Development and Analysis
Figure 6-14 shows the formulas used to compute these scoring metrics.
Figure 6-14: Scoring Metric Formulas
69

INTEGRATED RESOURCE PLAN – 2015 DRAFT REPORT
Resource Plan Development and Analysis
In addition to the nine scoring metrics, seven reporting metrics were chosen:
Reporting Metric Definition
Average system cost ($/MWh), Year 11-20
Average system cost for the second 10 years of the study, computed as the levelized annual average system cost (revenue requirements in each year divided by sales in that year)
Cost uncertainty The predicted variation in plan cost from the stochastic analysis, determined by using the difference between the tails of the distribution; the range in which plan costs will fall 90% of the time
Risk ratio A measure of risk that the plan cost will exceed the expected value. This metric is developed by computing the ratio of the upper (higher cost) section of the cost distribution (between P(95) and the expected value) divided by the expected value
CO2 intensity The CO2 emissions expressed as an emission intensity; computed by dividing emissions by energy generated
Spent Nuclear Fuel Index A measure of the quantity of spent nuclear fuel that is projected to be generated based on energy production in each portfolio
Flexibility Two measures were selected in this category: the variable energy resource penetration, which measures the amount of variable or intermittent energy included in the plans; and a flexibility turn-down factor to measure the ability of the system to serve low load periods
Employment The change in employment expressed relative to a baseline future
Figure 6-15: Reporting Metrics
70

INTEGRATED RESOURCE PLAN – 2015 DRAFT REPORT
Resource Plan Development and Analysis
Figure 6-16 shows the formulas used to compute these scoring metrics.
Figure 6-16: Reporting Metric Formulas
The scorecard metrics developed in collaboration with the IRP Working Group align with TVA’s mission as shown in Figure 6-17.
Figure 6-17: Scorecard Alignment
71

INTEGRATED RESOURCE PLAN – 2015 DRAFT REPORT
Resource Plan Development and Analysis
6.3.3 Scorecard design Once the scoring metrics were selected, the strategy scorecard could be designed. Using a format similar to the 2011 IRP, the scorecard summarizes the performance of an individual planning strategy in each of the scenarios. Figure 6-18 shows the scorecard template, which includes nine columns (one for each of the scoring metrics, grouped by metric category) and five rows (one for each of the scenarios).
Figure 6-18: Scorecard Template
The scorecard serves as a summary tabulation of the performance of the planning strategy in each scenario. To evaluate differences within a given scenario, all five scorecards should be reviewed. Interpretation of the performance of each strategy will be presented in Chapter 7.
6.4 Strategy Assessment Process Finally, scorecards were filled in based on an assessment of overall performance of each planning strategy in the five metric categories: cost, financial risk, stewardship, Valley economics and flexibility.
Each metric category was assessed individually based on the simple average of the strategy’s performance in each scenario (assumes each scenario was equally likely), and graphics were developed to facilitate interpretation of trends and to identify preliminary observations. These observations will guide the development of an action plan for further case analysis. A cost/risk graphic was also prepared to enable an investigation of possible cost and risk trade-offs.
The strategy assessment graphics, along with information about observations from the draft IRP study and the action plan, can be found in Chapter 8.
Scenarios
PVRR($Bn)
System Average Cost
($/MWh)
Risk/Benefit Ratio
Risk Exposure($Bn)
CO2(MMTons)
Water(Gallons)
Waste(TBD)
System Regulating Capability
% Difference in Change in Per Capita
Income1. Current Outlook2. Stagnant Economy3. Growth Economy4. De-Carbonized Future5. Distributed Market Place
Cost Risk Environmental Stewardship FlexibilityValley
Economics
72

Chapter 7
73

INTEGRATED RESOURCE PLAN – 2015 DRAFT REPORT
Draft Study Results
Contents 7 Draft Study Results ............................................................................................................74
7.1 Analysis Results ............................................................................................................74 7.1.1 Firm Requirements and Capacity Gap ..................................................................... 74 7.1.2 Expansion Plans ...................................................................................................... 76
7.2 Scorecard Results ...........................................................................................................86 7.3 Scoring Metric Comparisons ............................................................................................89 7.4 Preliminary Observations .................................................................................................90
7 Draft Study Results This chapter describes the preliminary findings of the 2015 IRP. The results for 25 distinct portfolios are presented in this chapter along with the scorecard measures as discussed in Chapter 6.
7.1 Analysis Results
7.1.1 Firm Requirements and Capacity Gap The key components of each scenario were translated into a forecast of firm requirements (demand plus reserves), which was used to identify the resulting capacity gap and need for power. This drove the selection of resources in the capacity planning model.
Figure 7-1 illustrates the firm requirements forecasts for the five scenarios studied in the IRP.
74

INTEGRATED RESOURCE PLAN – 2015 DRAFT REPORT
Draft Study Results
Figure 7-1: Firm Requirements by Scenario
Firm requirements were greatest in the growth economy scenario (highest load growth) and lowest in the distributed marketplace scenario (flat load growth until 2024). The remaining scenarios fell within this range and generally displayed smooth but unique growth trends, with the exception of de-carbonized future scenario; the discontinuity exhibited in that scenario is the result of the abrupt application of an aggressive CO2 penalty.
The shape of the firm requirement curves influenced the type and timing of resource additions in the strategies. The timing of additional resources was a function of the existing system capacity and the impact of the attributes used to define11 each strategy. Figure 7-2 shows the range of the capacity gaps in the cases.
11 strategy assumptions are discussed in Section 6.1
30,000
35,000
40,000
45,000
2014 2016 2018 2020 2022 2024 2026 2028 2030 2032
MW, SND Firm Requirements
1. Current Outlook 2. Stagnant Economy 3.Growth Economy
4. De-Carbonized Future 5. Distributed Marketplace
75

INTEGRATED RESOURCE PLAN – 2015 DRAFT REPORT
Draft Study Results
Figure 7-2: Range of Capacity Gaps by Scenario
7.1.2 Expansion Plans
The capacity expansion plans are presented below by strategy. Further information on the capacity expansion plans are presented in Appendix E – Expansion Plan Listing.
Figure 7-3 presents the incremental capacity additions by 2033 for all 25 cases. The vertical axis is in summer net dependable (SND) megawatts, the capacity that can be applied to firm requirements. All the results for each strategy are grouped together with the scenarios on the horizontal axis. For example, the first bar on the left of the chart is the incremental capacity results from the reference plan under the current outlook scenario. The incremental capacity additions are grouped by resource type (i.e., nuclear, hydro, coal, etc.).
The de-carbonized future and the distributed marketplace scenarios have the lowest demand forecasts and therefore have the least amount of incremental capacity. Conversely, the growth economy had the highest demand and therefore results in the most incremental capacity.
(5,000)
0
5,000
10,000
15,000
2014 2016 2018 2020 2022 2024 2026 2028 2030 2032
MW, SND Capacity Gap
1. Current Outlook 2. Stagnant Economy 3.Growth Economy
4. De-Carbonized Future 5. Distributed Marketplace
76

INTEGRATED RESOURCE PLAN – 2015 DRAFT REPORT
Draft Study Results
Figure 7-3: Incremental Capacity Additions by 2033
Capacity resource highlights are summarized below by resource type:
Nuclear: The extended power uprates (EPU) capacity expansion projects were selected in every case providing approximately 400 MW. No new nuclear was selected beyond the scheduled Watts Bar Unit 2.
Hydro: Two of the smaller hydro capacity projects were selected in all 25 cases. An additional hydro asset is typically selected in the growth scenario, the de-carbonized future scenario, and also in the maximize renewables strategy.
Coal: No new coal plants were selected. In a few cases, additional coal units were idled beyond those currently planned.
Renewables: Renewable additions range from ~900 MW to ~12,600 MW of nameplate capacity. The lowest selection of renewable assets occurs in the distributed marketplace scenario. The highest selection of renewables occurs in the economic growth scenario. This includes utility and commercial scale renewables and does not include small distributed renewable assets. The assumptions on distributed renewables were considered in the load demand projections for each scenario (see further discussion in Appendix C).
Natural Gas: The addition of natural gas units vary more significantly than other resources and depend on the forecasted load in each scenario and the strategic focus. The maximum amount of additional CT capacity is approximately 4,800 MW in the high load world of the growth economy scenario. The lowest amount of additional CT capacity is about 800 MW in the distributed marketplace scenario. The incremental Gas CC capacity additions are similar across strategies A, B, D, and E and grow over time.
EE: The amount of energy efficiency added in strategies A, B, C, and E is fairly consistent averaging approximately 2,700 MW by 2033. The consistent selection of energy efficiency is attributable to the low price compared to other assets and the energy contributions from the energy efficiency blocks. The one exception in this group is the maximize renewables strategy/distributed marketplace scenario case which has a lower selection of energy efficiency at 1,900 MW by 2033 due to the combination of low load assumptions and the strategic focus on renewables. The amount of EE in all of the maximize EEcases is also consistent at ~4,600 MW by 2033.
0
2,000
4,000
6,000
8,000
10,000
12,000
14,000MW, SND
DREEGas CCGas CTRenewablesCoalHydroNuclear
Strategy A: Reference Plan
Strategy D:Maximize EE
Strategy C:Market Supplied Resources
Strategy B: Meet an Emission Target
Strategy E:Maximize Renewables
77

INTEGRATED RESOURCE PLAN – 2015 DRAFT REPORT
Draft Study Results
DR: The incremental demand response averages out to be about 460 MW across all 25 cases with a range of almost 270 MW to 575 MW.
Figure 7-4 presents the total capacity portfolio by percent of megawatts for each case by 2033. Figure 7-5 shows the corresponding energy portfolio and is in percent of terawatt-hours.
Figure 7-4: Percent of Total Capacity by 2033
Figure 7-5: Percent of Energy by 2033
Summary by Strategy:
Strategy A: The reference plan is TVA’s traditional least-cost optimization plan and applies no special constraints or targets.
Figure 7-6 presents the modeled capacity portfolios by percent of megawatts for the reference plan over the planning horizon. The nuclear portfolio increases across all scenarios over time with the addition of Watts Bar Unit 2 and the extended power uprate projects. The hydro capacity increases slightly over time with the selection of projects that provide some additional
0%
10%
20%
30%
40%
50%
60%
70%
80%
90%
100%% of MW, SND
DREEGas CCGas CTRenewablesCoalHydroNuclear
Strategy A: Reference Plan
Strategy D:Maximize EE
Strategy C:Market Supplied Resources
Strategy B: Meet an Emission Target
Strategy E:Maximize Renewables
0%
10%
20%
30%
40%
50%
60%
70%
80%
90%
100%
% of TWh
EEDR
Gas
Renewables
Coal
Hydro
Nuclear
Strategy A :The Reference Plan
Strategy D:Maximize EE
Strategy C:Market Supplied Resources
Strategy B:Meet an Emission Target
Strategy E:Maxmize Renewables
78

INTEGRATED RESOURCE PLAN – 2015 DRAFT REPORT
Draft Study Results
capacity in all the cases. In the growth economy and the de-carbonized future scenarios, an additional hydro market asset is selected. Coal assets begin to decrease by 2020 in all scenarios as units are idled as planned. A slight decrease of the coal portfolio occurs in the de-carbonized future and the distributed marketplace scenarios by 2025 where additional coal units are idled. For most of the reference plan case results, solar assets are selected in the mid-2020 timeframe and wind assets are selected in the late 2030 time period. However, in the decarbonized future scenario, wind assets are selected as early as 2020. The natural gas assets increase over time, with the first addition occurring as early as 2020 in the economic growth scenario and as late as 2032 in the de-carbonized future scenario. The TVA Board-approved Paradise and Allen gas plants increase the gas portfolio in 2020, then the percentage decreases over time as existing third-party contracts expire. Energy efficiency increases over time in all scenarios decreasing the need for new intermediate gas resources in the near term. Demand response maintains a consistent portion of the capacity portfolio over time and throughout the scenarios.
Figure 7-7 shows the energy portfolio which corresponds to the capacity charts in Figure 4. Nuclear energy increases over time due to the addition of Watts Bar Unit 2 and the extended power uprates. Hydro energy remains fairly constant. Coal generation decreases over the planning horizon as units are idled. The renewable generation remains fairly constant through time over the low demand scenarios (stagnant economy and distributed marketplace) and increases over time in the other three scenarios. Natural gas generation varies with load and strategic focus. Demand response, which produces low energy volumes, has been combined with the energy efficiency into one group termed EEDR. The incremental energy efficiency contributes 9% to 11% of the energy portfolio by 2033. Case 1A (the current outlook/reference plan case) results in 62% emission free energy by 2033.
Figure 7-6: Percent of Total Capacity for Strategy A
0%
10%
20%
30%
40%
50%
60%
70%
80%
90%
100%
2015 2020 2025 2030 2033 2015 2020 2025 2030 2033 2015 2020 2025 2030 2033 2015 2020 2025 2030 2033 2015 2020 2025 2030 2033
% of MW, SND
DR
EE
Gas CC
Gas CT
Renewables
Coal
Hydro
Nuclear
Scenario 1: Curent Outlook
Scenario 4:Decarbonized Future
Scenario 3: Economic Growth
Scenario 2:Stagnant Economy
Scenario 5:Distributed Marketplace
Strategy A: The Reference Plan
79

INTEGRATED RESOURCE PLAN – 2015 DRAFT REPORT
Draft Study Results
Figure 7-7: Percent of Total Energy for Strategy A
Strategy B: ‘Meet an Emission Target’ focuses on achieving a system-wide CO2 emission rate target in the least-cost manner. To set a target for the 20 year planning horizon ending in 2033, we utilized a glide slope that reduces TVA’s greenhouse gas emissions by 17% by 2020 and 80% by 2050 from a 2005 baseline. Strategy B adopts the 2033 data point on that glide slope of 557 pounds CO2 per MWh that translates to a 50% reduction in TVA’s system-wide CO2 emission rate from a 2005 baseline.
This strategy was not formulated to reflect EPA’s proposed Clean Power Plan (CPP) or rule. The proposed CCP was issued in June 2014 and its final form is uncertain. After EPA issues the final rule, States will have one to two years to decide how to implement it. The CCP also will be litigated. TVA’s next update of its IRP will be able to take into account these developments.
Figure 7-8 shows the resources added over time through strategy B. The results from this strategy are very similar to the reference plan. The similarity of the case results was not anticipated during the development of the scenarios and strategies. The significant contributions from the selected energy efficiency and the renewable assets chosen in the reference plan result in reaching the CO2 emission target and therefore the two strategies are similar. Figure 7-9 shows the energy portfolio for strategy B.
Figure 7-8: Percent of Total Capacity for Strategy B
0%
10%
20%
30%
40%
50%
60%
70%
80%
90%
100%
2015 2020 2025 2030 2033 2015 2020 2025 2030 2033 2015 2020 2025 2030 2033 2015 2020 2025 2030 2033 2015 2020 2025 2030 2033
% of TWh
Strategy A: The Reference Plan
EEDR
Gas
Renewables
Coal
Hydro
Nuclear
Scenario 1: Curent Outlook
Scenario 4:Decarbonized Future
Scenario 3: Economic Growth
Scenario 2:Stagnant Economy
Scenario 5:Distributed Marketplace
0%
10%
20%
30%
40%
50%
60%
70%
80%
90%
100%
2015 2020 2025 2030 2033 2015 2020 2025 2030 2033 2015 2020 2025 2030 2033 2015 2020 2025 2030 2033 2015 2020 2025 2030 2033
% of MW, SND
DR
EE
Gas CC
Gas CT
Renewables
Coal
Hydro
Nuclear
Scenario 1: Curent Outlook
Scenario 4:Decarbonized Future
Scenario 3: Economic Growth
Scenario 2:Stagnant Economy
Scenario 5:Distributed Marketplace
Strategy B: Meet an Emission Target
80

INTEGRATED RESOURCE PLAN – 2015 DRAFT REPORT
Draft Study Results
Figure 7-9: Percent of Total Energy for Strategy B
Strategy C: The Focus on Long-Term, Market Supplied Resources strategy is designed to constrain TVA capital spending in the least-cost manner. In this case construction of new self-build assets was restricted but improvements to existing assets and funds for energy efficiency and demand response programs were allowed.
Figure 7-10 presents the total capacity portfolios for Strategy C by % of megawatts over the planning horizon. The nuclear and hydro portfolios are similar to the reference plan and the meet an emission target strategies. The coal portfolio increases slightly above the reference plan because maintaining existing coal resources is more favorable than procuring market supply. Third-party renewable and gas assets compete across the scenarios and selection depends on the scenario assumptions of load and commodity prices. The volumes on the gas and renewable assets selected in this strategy are similar to the reference plan but the difference is that TVA would enter into a third-party agreement for the resource. Energy efficiency volumes remain similar across the scenarios as in the reference plan.
Figure 7-11 shows purchases as a percent of the capacity portfolio of approximately 17% by 2033. EEDR is shown separately in this graphic, even though those resources are not entirely controlled by TVA.
The energy portfolio for this strategy is shown in Figure 7-12.
Figure 7-10: Percent of Total Capacity for Strategy C
0%
10%
20%
30%
40%
50%
60%
70%
80%
90%
100%
2015 2020 2025 2030 2033 2015 2020 2025 2030 2033 2015 2020 2025 2030 2033 2015 2020 2025 2030 2033 2015 2020 2025 2030 2033
% of TWh
Strategy B: Meet and Emission Target
EEDRGasRenewablesCoalHydroNuclear
Scenario 1: Curent Outlook
Scenario 4:Decarbonized Future
Scenario 3: Economic Growth
Scenario 2:Stagnant Economy
Scenario 5:Distributed Marketplace
0%
10%
20%
30%
40%
50%
60%
70%
80%
90%
100%
2015 2020 2025 2030 2033 2015 2020 2025 2030 2033 2015 2020 2025 2030 2033 2015 2020 2025 2030 2033 2015 2020 2025 2030 2033
% of MW, SND
DR
EE
Gas CC
Gas CT
Renewables
Coal
Hydro
Nuclear
Scenario 1: Curent Outlook
Scenario 4:Decarbonized Future
Scenario 3: Economic Growth
Scenario 2:Stagnant Economy
Scenario 5:Distributed Marketplace
Strategy C: Market Supplied Resources
81

INTEGRATED RESOURCE PLAN – 2015 DRAFT REPORT
Draft Study Results
Figure 7-11: Percent of Owned, EEDR, vs Purchased Assets for Strategy C
Figure 7-12: Percent of Total Energy for Strategy C
Strategy D: The Maximize Energy Efficiency strategy requires that future energy needs be met first with EE in the least-cost manner.
A comparison of the selected energy efficiency across the current outlook scenario is shown in Figure 7-13. The amount of EE in strategy D increases above the reference plan starting in 2024 and is approximately 1,900 MW and 11,200 GWh higher than the reference plan by 2033.
Figure 7-14 shows the percent of total capacity for the strategy D cases over time. The nuclear and hydro assets are fairly similar to the reference plan. The coal portfolio varies in the de-carbonized future where the low loads along with the increase in EE result in additional coal unit
0%
10%
20%
30%
40%
50%
60%
70%
80%
90%
100%
2014 2016 2018 2020 2022 2024 2026 2028 2030 2032
% of MW
Capacity for Current Outlook/Market Supplied Resources Case (1C)
Purchased
EEDR
Owned
0%
10%
20%
30%
40%
50%
60%
70%
80%
90%
100%
2015 2020 2025 2030 2033 2015 2020 2025 2030 2033 2015 2020 2025 2030 2033 2015 2020 2025 2030 2033 2015 2020 2025 2030 2033
% of TWh
Strategy C: Market Supplied Resources
EEDRGasRenewablesCoalHydroNuclear
Scenario 1: Curent Outlook
Scenario 4:Decarbonized Future
Scenario 3: Economic Growth
Scenario 2:Stagnant Economy
Scenario 5:Distributed Marketplace
82

INTEGRATED RESOURCE PLAN – 2015 DRAFT REPORT
Draft Study Results
retirements relative to other cases. Renewables are reduced by about 1% in 2033 as compared to the reference plan. Fewer natural gas units are selected relative to the reference plan given the increased deliveries from EE.
Figure 7-13: Comparison of Energy Efficiency Resources
Figure 7-14: Percent of Total Capacity for Strategy D
0
500
1,000
1,500
2,000
2,500
3,000
3,500
4,000
4,500
5,000
2015 2020 2025 2030 2033 2015 2020 2025 2030 2033 2015 2020 2025 2030 2033 2015 2020 2025 2030 2033 2015 2020 2025 2030 2033
MW, SND
Current Outlook Scenario
Industrial
Commercial
Residental
Strategy A:The Reference Plan
Strategy D:Maximixe EE
Strategy C:Market Suppied Resources
Strategy B:Meet an Emission Target
Strategy E:Maximize Renewables
0%
10%
20%
30%
40%
50%
60%
70%
80%
90%
100%
2015 2020 2025 2030 2033 2015 2020 2025 2030 2033 2015 2020 2025 2030 2033 2015 2020 2025 2030 2033 2015 2020 2025 2030 2033
% of MW, SND
DR
EE
Gas CC
Gas CT
Renewables
Coal
Hydro
Nuclear
Scenario 1: Curent Outlook
Scenario 4:Decarbonized Future
Scenario 3: Economic Growth
Scenario 2:Stagnant Economy
Scenario 5:Distributed Marketplace
Strategy D: Maximize EE
83

INTEGRATED RESOURCE PLAN – 2015 DRAFT REPORT
Draft Study Results
Figure 7-15: Percent of Total Energy for Strategy D
Strategy E: The Maximize Renewables strategy enforces a renewable energy target of 20% by 2020 and 35% by 2040. The renewable energy target includes generation from the existing hydro system. The renewable energy strategy objective is met in the least-cost manner.
Solar, wind, and hydro resources were the renewable assets selected throughout the study. Figure 7-16 shows the new renewable additions added across strategy E in five year increments for all five scenarios. The megawatts shown are the nameplate capacities. In Strategy E, hydro assets are added in every scenario. Wind is added by 2020 throughout the scenarios and almost doubles by 2033. Solar is selected in the near-term at smaller amounts in the scenarios with some load growth. However, by 2025, the mix of renewables averages across the scenarios to be 7% hydro, 47% wind and 46% solar on a nameplate basis.
Figure 7-17 shows the percent of total capacity for the strategy E cases over time. The nuclear assets are fairly similar to strategy A (the reference plan). Hydro increases above the reference plan strategy with the selection of a market asset in all 5 cases. The maximize renewables/distributed marketplace case with low loads and a strategic focus on renewable generation selects the most coal to be idled. Renewables increase to more than 12% of the summer net dependable capacity portfolio by 2033 in all scenarios. The natural gas expansion is less than the reference plan in all scenarios.
0%
10%
20%
30%
40%
50%
60%
70%
80%
90%
100%
2015 2020 2025 2030 2033 2015 2020 2025 2030 2033 2015 2020 2025 2030 2033 2015 2020 2025 2030 2033 2015 2020 2025 2030 2033
% of TWh
Strategy D: Maximize EE
EEDRGasRenewablesCoalHydroNuclear
Scenario 1: Curent Outlook
Scenario 4:Decarbonized Future
Scenario 3: Economic Growth
Scenario 2:Stagnant Economy
Scenario 5:Distributed Marketplace
84

INTEGRATED RESOURCE PLAN – 2015 DRAFT REPORT
Draft Study Results
Figure 7-16: Comparison of Renewable Resources
Figure 7-17: Percent of Total Capacity for Strategy E
0
2,000
4,000
6,000
8,000
10,000
12,000
14,000
2015 2020 2025 2030 2033 2015 2020 2025 2030 2033 2015 2020 2025 2030 2033 2015 2020 2025 2030 2033 2015 2020 2025 2030 2033
MW,Nameplate
Strategy E: Maximize Renewables
Hydro
Solar
Wind
Scenario 1: Current Outlook
Scenario 4: Decarbized Future
Scenario 3: Economic Growth
Scenario 2: Stagnant Economy
Scenario 5: Distributed Marketplace
0%
10%
20%
30%
40%
50%
60%
70%
80%
90%
100%
2015 2020 2025 2030 2033 2015 2020 2025 2030 2033 2015 2020 2025 2030 2033 2015 2020 2025 2030 2033 2015 2020 2025 2030 2033
% of MW, SND
DR
EE
Gas CC
Gas CT
Renewables
Coal
Hydro
Nuclear
Scenario 1: Curent Outlook
Scenario 4:Decarbonized Future
Scenario 3: Economic Growth
Scenario 2:Stagnant Economy
Scenario 5:Distributed Marketplace
Strategy E: Maximize Renewables
85

INTEGRATED RESOURCE PLAN – 2015 DRAFT REPORT
Draft Study Results
Figure 7-18: Percent of Total Energy for Strategy E
7.2 Scorecard Results The fully populated scorecards for each of the five planning strategies are included in this section (see Chapter 6 for a discussion about the development of the scorecard template). Each strategy scorecard contains the metric values for that particular strategy in each of the five scenarios modeled in the IRP. The metric values are based on the combination of the portfolio optimization and uncertainty analysis work applied to each of the planning strategies under consideration.
The scorecard for Strategy A is shown in Figure 7-19. The highest PVRR is the Growth Economy due to the large build-out to meet firm requirements. The highest system average cost is the De-Carbonized Future. The Growth Economy has the highest risk exposure driven by higher loads, and the Growth Economy has the highest CO2 releases, water consumption, and solid waste production. Note that the scorecard presents the system regulating capability snapshot in 2033 (more values for this metric are discussed in Chapter 8). Since the Valley economics metric uses Strategy A as the reference case in computing impacts, the change in per capita income is 0% for this strategy.
Figure 7-19: Strategy A Scorecard
0%
10%
20%
30%
40%
50%
60%
70%
80%
90%
100%
2015 2020 2025 2030 2033 2015 2020 2025 2030 2033 2015 2020 2025 2030 2033 2015 2020 2025 2030 2033 2015 2020 2025 2030 2033
% of TWh
Strategy E: Maximize Renewables
EEDRGasRenewablesCoalHydroNuclear
Scenario 1: Curent Outlook
Scenario 4:Decarbonized Future
Scenario 3: Economic
Growth
Scenario 2:Stagnant Economy
Scenario 5:Distributed Marketplace
86

INTEGRATED RESOURCE PLAN – 2015 DRAFT REPORT
Draft Study Results
The scorecard for Strategy B is shown in Figure 7-20. These results are very similar to those shown for Strategy A, since the portfolios developed in that strategy (and in particular the contribution from energy efficiency and renewables) generally achieve the overall system emission target designed for Strategy B.
Figure 7-20: Strategy B Scorecard
The scorecard results for Strategy C are shown in Figure 7-21. PVRR cost rankings are similar to Strategy A, but the absolute values are slightly reduced from the values reported in that scorecard, primarily the result of the assumptions around the pricing and term of the purchased power arrangements that are selected in that strategy. The system average costs are similar to Strategy A, and environmental metrics are also similar to Strategy A since the resource types are similar.
Figure 7-21: Strategy C Scorecard
The Strategy D scorecard is shown in Figure 7-22. PVRR cost rankings across the scenarios are similar to strategy A but total costs are generally higher. System average costs are similar in the first 10 years. The Risk/Benefit Ratio and Risk Exposure are higher for this strategy, due to
87

INTEGRATED RESOURCE PLAN – 2015 DRAFT REPORT
Draft Study Results
the requirement that resource needs be met first with energy efficiency, thereby restricting portfolio composition. However, this strategy has better performance in environmental metrics.
Figure 7-22: Strategy D Scorecard
Strategy E metric values are shown in Figure 7-23. PVRR costs are higher than respective strategy A costs for all cases, the result of aggressive renewable resource targets. Correspondingly, system average costs are higher in all strategy E cases. The Risk/Benefit Ratio and Risk Exposure are higher with more renewables, which indicates that the enforced targets may be too high relative to the benefits derived from adding renewable resources to the portfolio. This strategy has the best performance in all environmental metrics, driven by the higher concentration of renewable resources in the cases.
Figure 7-23: Strategy E Scorecard
88

INTEGRATED RESOURCE PLAN – 2015 DRAFT REPORT
Draft Study Results
7.3 Scoring Metric Comparisons Figure 7-24 shows a comparison of how each strategy scored across all scenarios by metri
Strategy
Scenario
1 -
Current Outlook
2 - Stagnant Economy
3 - Growth
Economy
4 - De-Carbonized
Future
5 - Distributed
Marketplace Average
PVRR ($ billion) A 132.7 125.9 139.6 131.7 120.4 130 B 132.7 126 139.5 131.7 120.4 130.1 C 132.7 125.8 139.4 131.5 120.5 130 D 134.4 127.9 141.3 133.6 122.8 132 E 136.2 129.4 140.8 132.8 123.5 132.5
System Average Cost 2014-2023 ($/MWh)
A 76.7 76 77.7 81 77.3 77.7 B 76.7 76 77.7 80.9 77.3 77.7 C 76.3 75.5 77.7 80.6 76.7 77.4 D 76.9 75.9 77.5 81.1 77.3 77.3 E 78.4 77.3 78.5 81.3 78.5 78.8
Risk/Benefit Ratio
A 0.92 0.95 0.91 1 0.99 0.95 B 0.92 0.95 0.92 0.99 0.99 0.95 C 0.86 0.91 0.9 0.99 0.99 0.93 D 0.94 0.98 0.93 1.03 1 0.98 E 1.03 1.04 1.04 1.01 1.05 1.03
Risk Exposure ($ billion)
A 140.4 132.8 147.5 140.3 127.1 137.6 B 140.4 133 147.6 140.3 127.1 137.7 C 140 132.7 147.7 140.1 127.4 137.6 D 142.4 135.4 149.7 142.7 130 140 E 145.1 137.4 149.8 141.7 130.9 141
89

INTEGRATED RESOURCE PLAN – 2015 DRAFT REPORT
Draft Study Results
CO2 Emissions (million tons/year)
A 57 51.8 59.7 44.2 44.2 51.4 B 57 51.8 59.7 44.3 44.2 51.4 C 58.4 51.7 59 44.1 45.1 51.7 D 56.2 50.7 57.6 41.8 43.5 50 E 52.2 45.6 54.2 41.6 39.9 46.7
Water Consumption (million gallons/year)
A 61,843 59,448 61,899 55,991 56,330 59,102 B 61,860 59,451 61,912 56,046 56,331 59,120 C 62,593 59,385 61,587 55,912 56,573 59,210 D 61,505 59,008 61,246 54,026 56,002 58,357 E 59,785 56,929 59,780 53,921 54,483 56,980
Waste (million tons/year)
A 3.46 3.5 3.72 3.08 3.21 3.39 B 3.46 3.5 3.71 3.1 3.21 3.39 C 3.42 3.5 3.7 3.09 3.25 3.39 D 3..445 3.44 3.73 2.75 3.17 3.27 E 3.16 3.13 3.5 2.76 2.93 3.1
System Regulating Capability (2033)
A 28.70% 28.00% 27.10% 18.90% 22.30% 25.00% B 29.90% 27.90% 26.20% 19.70% 22.30% 25.20% C 28.60% 28.40% 29.70% 21.60% 20.80% 25.80% D 27.70% 22.30% 26.40% 20.30% 25.00% 24.30% E 20.90% 20.40% 23.50% 18.80% 16.00% 19.90%
Percent Difference in Per Capita Income (Relative to Strategy A)
A 0.00% 0.00% 0.00% 0.00% 0.00% 0.00% B 0.00% 0.01% -0.01% 0.00% 0.00% 0.00% C 0.00% 0.01% 0.03% 0.01% 0.00% 0.01% D 0.02% 0.02% 0.02% 0.02% 0.02% 0.02% E -0.01% 0.00% 0.00% 0.02% -0.01% 0.00%
Figure 7-24: Scoring Metrics by Strategy & Scenario
7.4 Preliminary Observations Based on the results of the modeling to date, TVA has made some preliminary observations about the case results:
• There is a need for new capacity in every scenario being modeled, even in the lower load futures
90

INTEGRATED RESOURCE PLAN – 2015 DRAFT REPORT
Draft Study Results
• There are no immediate needs for baseload resources beyond the completion of Watts Bar Unit 2 and the Browns Ferry extended power uprates.
• Most of the variation in expansion plans is around natural gas and renewables and most of the resource plans show a tradeoff between EE and gas resources.
• Higher levels of energy efficiency and renewable resources are indicated in many cases over the 20 year study period.
• Changing environmental standards for CO2 will drive retire/control decisions on some coal-fired generation in the mid-2020s
• Solar resources begin appearing in the resource plans in the mid 2020s; wind resources appear in the late 2020s in some scenarios, and generally the HVDC wind option is not selected until early 2030s
These observations will further explored in the assessments presented in Chapter 8.
91

Chapter 8
92

INTEGRATED RESOURCE PLAN – 2015 DRAFT REPORT
Strategy Assessments and Next Steps
Contents 8 Strategy Assessments and Next Steps ............................................................................93
8.1 Strategy Assessments .....................................................................................................93 8.1.1 Cost and Risk Assessment ...................................................................................... 93 8.1.2 Environmental Stewardship ...................................................................................... 97 8.1.3 Flexibility .................................................................................................................. 98 8.1.4 Valley Economics ..................................................................................................... 99 8.1.5 Summary of Initial Observations ............................................................................. 100
8.2 Reporting Metrics Comparisons ..................................................................................... 102 8.3 Additional Analysis ........................................................................................................ 103 8.4 Policy Considerations .................................................................................................... 103 8.5 IRP Study Schedule and Next Steps ............................................................................. 104
8 Strategy Assessments and Next Steps This chapter explains the strategy assessments and summarizes the results. Areas where additional study may be needed and next steps in the IRP process are also discussed.
8.1 Strategy Assessments To assess the performance of the five planning strategies (explained in Chapter 6 and shown to the right), we used scorecard data to conduct four assessments:
• Cost and risk
• Environmental stewardship
• Flexibility
• Valley economics
We calculated the overall value of each strategy by averaging its performance over every scenario, since all of them are presumed to be equally likely.
8.1.1 Cost and Risk Assessment The cost and risk assessment was aimed at gaining a better understanding of the relative performance of different strategies in terms of total plan costs and financial risk.
Planning Strategies Strategy A: Traditional Utility Planning
Strategy B: Meet an Emissions Target
Strategy C: Focus on Long-Term, Market Supplied Resources
Strategy D: Maximize Energy Efficiency
Strategy E: Maximize Renewables
93

INTEGRATED RESOURCE PLAN – 2015 DRAFT REPORT
Strategy Assessments and Next Steps
The cost assessment was based on two scorecard metrics:
• System Average Cost ($MWh), Year 1-10 – the average system cost for the first 10 years of the study, computed as the levelized annual system average cost (i.e., revenue requirements in each year divided by sales in that year)
• Expected Value PVRR, 20 Year – the total plan cost (capital and operating) expressed as the present value of revenue requirements (PVRR) over the 20-year study period.
These metrics allowed us to compare the cost and financial risks associated with different planning strategies from both a short-term (10-year) and a long-term (20-year) perspective. (See Chapter 6, section 6.2.2, for more information on scoring metrics, including the formulas used to compute them.)
Figure 8-1 shows the results for the 10-year system average cost metric. The blue bar represents the system average cost values for the first 10 years in the study period (2014-2023), and the red bar represents the second 10-year period (2024-2033).
Figure 8-1: System Average Cost
During the first 10-year period, the system average cost is essentially the same across all five strategies. However, in the second 10-year period, there is some variation, with Strategy D exhibiting the highest system average cost. This is likely the result of increased costs for energy efficiency programs combined with a resultant reduction in energy sales. These factors combine to shrink sales and put upward pressure on the system average cost.
Figure 8-2 shows the results for the 20-year present value revenue requirement (PVRR) metric. The chart shows the range of plan costs as well as the expected value for each strategy across all the scenarios. The lower end of each bar is the best case (lowest cost) outcome from the uncertainty analysis; the upper end is the worst case (highest cost) outcome; the expected value is the point of transition between the two colored sections of each bar. Strategies A, B and C have roughly the same average PVRR results across all scenarios and the lowest set of total plan costs measured in terms of the 20-year PVRR. Strategies A and B are virtually identical due to the selection of EE in Strategy A which enables that case to essentially achieve the emission target set in Strategy B, while Strategy C has the lowest cost of this group. This result is driven in part by the assumptions included in Strategy C regarding the price and terms of possible market-based purchased power agreements. Strategies D and E are projected to have
94

INTEGRATED RESOURCE PLAN – 2015 DRAFT REPORT
Strategy Assessments and Next Steps
a PVRR that is about $2 billion higher over the 20-year planning period, while the range of possible outcomes for all five strategies is fairly consistent as shown by the height of the bars.
Figure 8-2: Total Plan Cost (PVRR)
Two additional metrics were used to assess the risk of each strategy:
• Risk/Benefit Ratio – the area under the plan cost distribution curve between P(95) and Expected Value (when costs exceed the expected value) divided by the area between Expected Value and P(5) (when costs are less than the expected value)
• Risk Exposure – the point on the plan cost distribution below which the likely plan costs will fall 95 percent of the time (this is also the worst-case outcome).
Figure 8-3 shows the risk/benefit ratios for the five planning strategies. In this metric, lower values indicate better performance where the benefits outweigh the risks. Risk/benefit scores less than 1.0 indicate that costs are more likely to be less than the expected value.
95

INTEGRATED RESOURCE PLAN – 2015 DRAFT REPORT
Strategy Assessments and Next Steps
Figure 8-3: Risk/Benefit Ratio
Strategy C has the lowest value, followed by Strategies A and B. The strong performance of Strategy C is likely the result of the assumptions around the price and term of the purchase power agreements chosen in that strategy. TVA expects to conduct additional sensitivity testing on this strategy prior to finalizing the IRP. Strategy E appears to be the most risky from a financial perspective. It is the only strategy with a ratio greater than 1.0, indicating that plan costs in this strategy are more likely to exceed the expected value, caused in part by the aggressive renewable targets established in this case. We plan to investigate key assumptions in Strategy E in an effort to better understand this result.
Figure 8-4 shows TVA’s risk exposure under the five strategies. This metric measures the worst-case outcome as represented by the P(95) value of the PVRR distribution and is useful in determining which strategies present the higher financial risks.
Figure 8-4: Risk Exposure
0.9
1.0
1.1
A. TheReference Plan
B. Meet anEmission Target
C. Focus on L-T,Mkt Supplied
Resources
D. MaximizeEnergy
Efficiency
E. MaximizeRenewables
Risk
/Ben
efit
Ratio
Strategy
Bett
er
96

INTEGRATED RESOURCE PLAN – 2015 DRAFT REPORT
Strategy Assessments and Next Steps
Strategies A, B and C have essentially the same risk exposure, while Strategies D and E have distinctly higher exposure values – as much as $3.5 billion higher. This indicates that the more aggressive targets imposed for energy efficiency (Strategy D) and renewables (Strategy E) carry higher financial risks than the other three strategies. In both of these strategies, the required resource contributions (EE or renewables) tend to limit the flexibility to optimize a portfolio in the uncertainty analysis, leading to these higher financial risk scores. Strategy E has the highest risk exposure and is also the only strategy with a risk/benefit ratio greater than 1.0. This indicates that this strategy may be the most risky financially of those evaluated in the IRP. This result is driven by the very aggressive targets for renewable resources that are imposed in the strategy.
Another way to assess cost and financial risk is to combine the cost and risk scores so a trade-off analysis can be performed. Figure 8-5 shows cost/risk trade-offs based on total plan cost and system average cost.
Figure 8-5: Cost/Risk Trade-Offs
Based on these charts, there does not appear to be a trade-off between cost and risk; that is, as cost increases risk also increases. These charts also reinforce the cost and risk assessment results discussed about Strategies D and E having somewhat higher plan costs and exhibit higher financial risks, with Strategy E showing the highest cost and risk outcome.
8.1.2 Environmental Stewardship As discussed in Chapter 6, strategy scorecards include three measures for environmental stewardship performance:
• CO2 Average Tons – the annual average tons of CO2 emitted over the study period
• Water consumption – the annual average gallons of water consumed over the study period
• Waste – the annual average quantity of coal ash, sludge and slag based on energy production in each portfolio.
97

INTEGRATED RESOURCE PLAN – 2015 DRAFT REPORT
Strategy Assessments and Next Steps
Figure 8-6 shows the average environmental impact for each strategy for each of these three metrics. The graphic presents the impacts on a relative basis, normalized to the highest impact for each metric. More information about the development of these metrics can be found in Appendix F.
Figure 8-6: Environmental Impacts
Strategies A, B and C have almost the same environmental impacts across all three metrics, with Strategy C having a slightly higher impact. Strategy D shows somewhat lower environmental impacts for all three metrics, with Strategy E showing the lowest impacts. The air and waste impacts in Strategy E are significantly lower than the other strategies due to the emphasis on renewable resources.
8.1.3 Flexibility Annual system regulating capability, expressed as a percentage of peak load, was used to measure the flexibility of the five planning strategies. TVA considers flexibility – the ability of the system to respond to load swings – as a key consideration for long-range resource planning.
This is especially true as the resource mix shifts from traditional, fully dispatchable central station units toward more diverse and dispersed generating assets.
This is the first time TVA has used annual system regulating capability as a metric to assess the performance of a resource portfolio, and further work is planned after the completion of this IRP to determine what the minimum or optimum flexibility score should be for the TVA system.
Figure 8-7 shows flexibility scores for each strategy at three points within the study window: 2014, 2024 and 2033 (higher is better).
98

INTEGRATED RESOURCE PLAN – 2015 DRAFT REPORT
Strategy Assessments and Next Steps
Figure 8-7: System Regulating Capability
Strategy D has a better flexibility score during the first ten years of the study period due to lower system load. However, during the second decade, the quick response units added in Strategies A, B and C result in similar levels of regulating capability. By the end of the study period, Strategy D has a slightly lower flexibility score, likely the result of fewer quick-start capacity additions due to the higher commitment to energy efficiency resources in that strategy. The results for Strategy E are significantly different because this strategy has a higher percentage of non-dispatchable renewable resources and thus a reduced ability to respond to unexpected load swings.
8.1.4 Valley Economics The impact of different planning strategies on the Valley economy was assessed based on the percent change in per capita income, measured from the reference income level established by Strategy A in each scenario. More details about how TVA has computed this macro-economic impact can be found in Appendix G. The results are shown in Figure 8-8.
Figure 8-8: Valley Economics
99
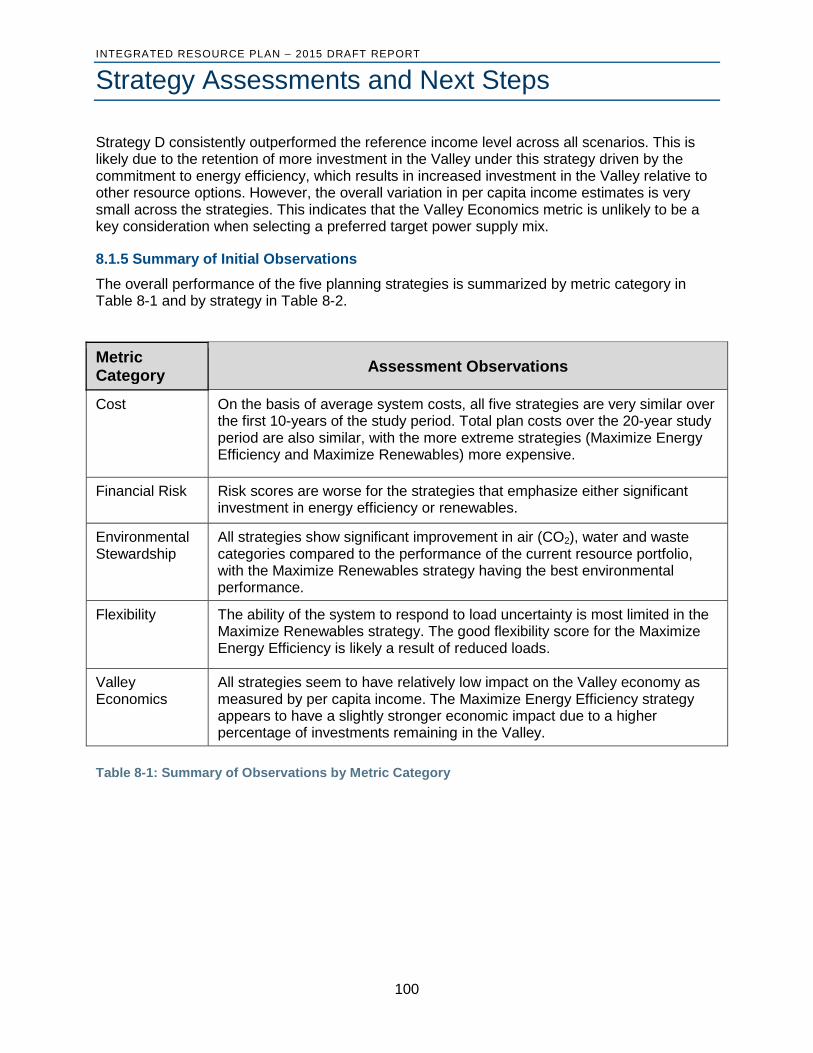
INTEGRATED RESOURCE PLAN – 2015 DRAFT REPORT
Strategy Assessments and Next Steps
Strategy D consistently outperformed the reference income level across all scenarios. This is likely due to the retention of more investment in the Valley under this strategy driven by the commitment to energy efficiency, which results in increased investment in the Valley relative to other resource options. However, the overall variation in per capita income estimates is very small across the strategies. This indicates that the Valley Economics metric is unlikely to be a key consideration when selecting a preferred target power supply mix.
8.1.5 Summary of Initial Observations The overall performance of the five planning strategies is summarized by metric category in Table 8-1 and by strategy in Table 8-2.
Metric Category Assessment Observations
Cost On the basis of average system costs, all five strategies are very similar over the first 10-years of the study period. Total plan costs over the 20-year study period are also similar, with the more extreme strategies (Maximize Energy Efficiency and Maximize Renewables) more expensive.
Financial Risk Risk scores are worse for the strategies that emphasize either significant investment in energy efficiency or renewables.
Environmental Stewardship
All strategies show significant improvement in air (CO2), water and waste categories compared to the performance of the current resource portfolio, with the Maximize Renewables strategy having the best environmental performance.
Flexibility The ability of the system to respond to load uncertainty is most limited in the Maximize Renewables strategy. The good flexibility score for the Maximize Energy Efficiency is likely a result of reduced loads.
Valley Economics
All strategies seem to have relatively low impact on the Valley economy as measured by per capita income. The Maximize Energy Efficiency strategy appears to have a slightly stronger economic impact due to a higher percentage of investments remaining in the Valley.
Table 8-1: Summary of Observations by Metric Category
100

INTEGRATED RESOURCE PLAN – 2015 DRAFT REPORT
Strategy Assessments and Next Steps
Strategy Assessment Observations
Strategy A: Reference Plan
• Relatively low PVRR and System Average Cost during the first 10 years of the study period
• Lowest System Average Cost in the second 10 years of the study period
• Low financial risk (risk/benefit ratio less than one; second lowest risk exposure)
• Higher environmental impact compared to Strategies D and E • Demonstrates flexibility
Strategy B: Meet an Emission Target
• Results are nearly identical to Strategy A
Strategy C: Rely on Long-Term, Market-Based Resources
• Relatively low PVRR, system average cost, and financial risk • Higher environmental impact than other strategies • Shows higher system regulating capability than other strategies
Strategy D: Maximize Energy Efficiency (EE)
• Higher PVRR than Strategies A, B or C • Relatively similar system average cost to other strategies during the
first decade, but high system average cost during the second decade due to increasing levels of EE and lower power sales
• Comparable to Strategies A, B and C on flexibility performance due to reduced sales
• Low environmental impact, second only to Strategy E
Strategy E: Maximize Renewables
• Highest PVRR in all scenarios due to enforcement of renewable energy targets
• Highest risk/benefit ratio of any strategy (greater than 1.0) • Lower flexibility performance than other strategies • Lowest environmental impact
Table 8-2: Summary of Observations by Strategy
101

INTEGRATED RESOURCE PLAN – 2015 DRAFT REPORT
Strategy Assessments and Next Steps
8.2 Reporting Metrics Comparisons As further described in Chapter 6, in addition to scoring metrics, reporting metrics were selected to provide further explanation and clarification in interpreting the performance of the individual planning strategies in each of the results. Figure 8-9 shows a comparison of how each strategy scored across all scenarios by reporting metric.
Alternative
Strategy Scenario
1 2 3 4 5 Average System Average
Cost 2024-2033
($/MWh)
A 98.7 94.8 100.4 103.0 98.7 99.1
B 98.6 95.1 100.4 103.4 98.7 99.3
C 99.4 95.8 102.0 103.8 100.2 100.2
D 104.5 102.4 106.8 110.0 108.3 106.4
E 102.0 99.1 100.8 104.6 101.6 101.6 Cost
Uncertainty ($Bn)
A 16,014 14,331 16,810 17,277 13,435 15,573
B 16,051 14,295 16,884 17,241 13,422 15,579
C 15,798 14,480 17,335 17,387 14,002 15,801
D 16,477 15,008 17,420 17,919 14,296 16,224
E 17,527 15,677 17,751 17,664 14,589 16,642 Risk Ratio A 0.058 0.055 0.057 0.065 0.056 0.058
B 0.058 0.055 0.058 0.065 0.055 0.058
C 0.055 0.055 0.059 0.066 0.058 0.058
D 0.059 0.058 0.059 0.068 0.058 0.061
E 0.065 0.062 0.064 0.067 0.061 0.064 CO2
Intensity (Tons/GWh)
A 350.0 330.0 352.9 291.3 306.9 326.2
B 350.3 330.1 353.0 292.2 306.9 326.5
C 358.5 329.6 351.7 291.1 312.9 328.8
D 351.4 329.6 345.6 279.9 308.5 323.0
E 320.4 290.7 319.8 273.5 275.1 295.9 Spent
Nuclear Fuel
(Tons/Year)
A 149.05 149.05 149.05 149.05 149.05 149.05
B 149.05 149.05 149.05 149.05 149.05 149.05
C 149.05 149.05 149.05 149.05 149.05 149.05
D 149.05 149.05 149.05 149.05 149.05 149.05
E 149.05 149.05 149.05 149.05 149.05 149.05 Variable
Resource Penetration
2033
A 24.9% 17.8% 31.2% 40.7% 19.2% 26.8%
B 24.7% 17.6% 33.5% 39.6% 19.2% 26.9%
C 22.9% 19.5% 31.8% 40.9% 20.0% 27.0%
D 19.7% 19.6% 32.2% 36.5% 16.9% 25.0%
E 48.1% 48.1% 48.1% 48.7% 45.0% 47.6%
102

INTEGRATED RESOURCE PLAN – 2015 DRAFT REPORT
Strategy Assessments and Next Steps
Figure 8-9: Reporting Metrics by Strategy & Scenario
8.3 Additional Analysis During the course of modeling and evaluating the planning strategies, we identified questions and findings that warrant further evaluation during the next phase of the IRP study. In addition, in discussions with individuals on the IRP Working Group and the Regional Energy Resource Council, we identified additional scenario and strategy ideas that merit further analysis. These sensitivity cases generally fall into three categories:
1. Testing the impact to the case results if a certain resource type not selected by the optimization model is forced into the portfolio or a resource type previously selected is eliminated from consideration. For example, forcing in a AP1000 nuclear unit or removing EE from the portfolio options.
2. Testing the impact to the case results if a specific combination of assumptions is imposed on the optimization model, rather than using the correlated scenario assumptions developed for the study. An example would be forcing in a high gas price forecast.
3. Testing the impact to the case results if key characteristics of one or more resource types are altered or fixed prior to running the optimization model. An example would be changing the ramp rate of the energy efficiency resource.
We are currently identifying specific sensivity case definitions and developing a work plan to ensure the most informative analyses are completed prior to developing IRP recommendations. The details from this additional analysis will be summarized in the final IRP report.
8.4 Policy Considerations The IRP is a resource planning study focused on identifying a target power supply mix for TVA. In the process of developing the cases and reviewing the results with stakeholders, a number of policy-related issues were raised that are outside the scope of the IRP itself but will need to be considered as we move toward implementation of any recommendations from the study.
Flexibility Turndown
Factor 2033
A 49.1% 45.2% 52.5% 65.0% 52.9% 53.0%
B 48.9% 45.2% 54.1% 64.6% 52.9% 53.2%
C 46.9% 45.8% 52.8% 64.9% 53.2% 52.7%
D 46.7% 48.8% 55.5% 65.0% 56.4% 54.5%
E 62.2% 63.3% 60.6% 66.4% 68.0% 64.1% Percent
Change in Employment (Relative to Strategy A)
A -0.00% -0.00% -0.00% -0.00% -0.00% -0.00%
B 0.00% 0.03% -0.01% 0.00% 0.00% 0.00%
C 0.00% 0.04% 0.05% 0.02% 0.00% 0.02%
D 0.06% 0.11% 0.06% 0.07% 0.08% 0.08%
E -0.02% 0.02% -0.01% 0.00% -0.02% 0.01%
103

INTEGRATED RESOURCE PLAN – 2015 DRAFT REPORT
Strategy Assessments and Next Steps
For example, we recognize that a commitment to significant levels of energy efficiency as part of the resource portfolio will likely put upward pressure on rates, and that could have negative consequences for low/fixed income customers as well as renters. The details of the approach we might take are outside the scope of the IRP report, but the study work we have completed will inform the follow-on planning and evaluation of the EE portfolio.
We also know that electric rates and job growth are critical concerns for Valley residents. While we have chosen to focus on two specific metrics to assess the macro-economic impacts of our resource choices, TVA remains committed to our least-cost mandate and our responsibility for regional economic development. Although the IRP itself does not analyze either of these issues, the findings in this planning study do become key inputs in the financial planning cycle that helps TVA set rates and fund economic development activities. In the final IRP report, we plan to provide further discussion around these concerns in the context of the study recommendations.
There are several other policy issues that come into play when implementing recommendations from the IRP, especially if the target power supply mix relies on more load-side options, like energy efficiency programs, or resources that are more dispersed, like wind or solar facilities. Because of our unique business model, TVA and its local power company partners may have to collaborate in new and innovative ways to ensure that this evolving resource portfolio remains reliable and provides maximum value to all customers. We plan to explore these and other issues as the IRP is finalized and we begin to develop plans to implement any recommendations approved by the TVA Board based on the analysis done in this study.
8.5 IRP Study Schedule and Next Steps Figure 8-9 shows the remaining phases of the 2015 IRP study, covering the period from the release of the draft IRP and associated Supplemental Environmental Impact Statement (SEIS) to the submission of recommendations to the TVA Board.
Figure 8-9: Project Schedule (Final Phase)
104

INTEGRATED RESOURCE PLAN – 2015 DRAFT REPORT
Strategy Assessments and Next Steps
We are currently in the “Present Initial Results” step of the schedule. This step began with the release of this draft report (and the associated SEIS) and will conclude in late April 2015 at the end of the public comment period. During this part of the project, TVA will host a series of public comment sessions across the Valley to solicit feedback from a broader set of stakeholders and customers consistent with our obligations under the National Environmental Protection Act (NEPA).
Public comment sessions are planned for the following dates and locations:
• March 19 – Chattanooga, TN
• April 6 – Knoxville, TN
• April 9 – Huntsville, AL
• April 14 – Tupelo, MS
• April 15 – Memphis, TN
• April 21 – Nashville, TN
• April 22 – Bowling Green, KY
Once these sessions are complete, we will move into the “Incorporate Input” step, where the feedback from these meetings, along with input from other stakeholder groups, will be considered and additional study work completed as needed.
In the “Identify Preferred Power Supply Mix” step, we will develop recommendations based on the study findings and submit those recommendations to the TVA Board in the summer of 2015.
105

INTEGRATED RESOURCE PLAN – 2015 DRAFT REPORT
Appendix A
Appendix A – Navigant Summary Letter Report on Generating Resource Cost and Performance Estimates
106

INTEGRATED RESOURCE PLAN – 2015 DRAFT REPORT
Appendix A
Summary Letter Report on Generating Resource Cost and Performance Estimates Developed for the 2015 TVA Integrated Resource Plan
September 12, 2014 Navigant Consulting, Inc., (“Navigant”) has reviewed and recommended cost and performance parameters for potential new power generation and storage resource alternatives to be considered in the Tennessee Valley Authority (TVA) 2015 Integrated Resource Plan (IRP) (“Resource Estimates”). The work was performed for TVA under contract work authorization #669468 and purchase order #709838 (revised). The primary deliverable was a Microsoft Excel workbook summarizing the Resource Estimates and related assumptions and notes. The preliminary draft workbook was delivered on April 25, 2014, and the final workbook was delivered on June 17, 2014. This report (“Report”) summarizes the work scope, the resources and parameters reviewed, and our primary findings at a high level. In performance of this review and Report, we have in part relied on information provided to us by TVA and third parties. While we believe this information to be reliable, it has not been independently verified for either accuracy or validity, and no assurances are offered with respect thereto. This Report does not represent any endorsement of any particular resource type, nor a guarantee that any resource type is viable or can be ultimately delivered. This Report covers the TVA 2015 IRP only. We make no representations, warranties or opinions concerning the enforceability or legality of the laws, regulations, rules, agreements or other similar documents reviewed as part of this work. Navigant and its employees are independent contractors providing professional services to TVA and are not officers, employees, or agents of TVA. Background and Scope As part of the 2015 IRP effort, TVA is identifying and evaluating potential new power generating and storage resources necessary to serve future load. Estimated values for new resource cost and performance are necessary in order to perform generation capacity expansion and dispatch modeling. TVA requires estimated values that are internally consistent and representative of actual values to be observed in practice. Parameters include performance and cost for traditional, renewable, and alternative generation technologies, and also for power storage technologies. Estimated values are obtained from several sources including the TVA business units, the Tennessee Valley Renewable Information Exchange, and the IRP project staff itself. Navigant’s task was to review the estimated values provided by TVA for each resource type, and, as necessary, develop alternative values, forming a set of Resource Estimates that are indicative of what can be expected for each resource technology within the Tennessee Valley geographic area. The deliverable was a spreadsheet workbook of tables – one for each resource technology – that:
• lists the parameters and associated values provided by TVA, • lists alternative values as available and relevant, and • recommends specific Resource Estimates for use in IRP modeling.
107

INTEGRATED RESOURCE PLAN – 2015 DRAFT REPORT
Appendix A
Technologies and Parameters Reviewed Power generation and energy storage resources considered in the review included the following, which represent alternatives for new capacity to serve future load:
• Natural gas-fired generation o Single cycle combustion turbines o Combined cycle combustion turbines (with and without supplemental duct firing)
• Coal-fired generation o Pulverized coal (with and without carbon capture and sequestration) o Integrated gasification combined cycle (coal) (with and without carbon capture
and sequestration) • Nuclear generation
o BW205 design o AP1000 design o Small modular reactors
• Energy storage o Pumped hydro-electric storage o Compressed air energy storage (CAES)
• Solar photovoltaic (PV) generation o Utility scale (both fixed-panel and tracking) o Commercial scale (both small and large)
• Wind energy generation o Onshore within the Tennessee Valley o Located in Midcontinent Integrated System Operator (MISO) or Southwest Power
Pool (SPP) o Obtained via High Voltage Direct Current (HVDC) transmission
• Biomass energy generation o Co-firing o Integrated gasification combined cycle (IGCC) (biomass) o Direct combustion at new facility o Repowering of existing facility
Cost and performance parameters vary somewhat according to generating and storage technology, but each technology generally has 8-12 applicable characteristics or parameters for which values were reviewed. These include summer net dependable capacity, summer full-load heat rate, build time, annual outage rate, storage efficiency, storage input demand, plant overnight capital cost, transmission upgrade cost, total overnight capital cost, variable operating & maintenance (O&M) cost, fixed operating & maintenance cost (both in $ and $/kW-year), firm gas charge, and book life.
108

INTEGRATED RESOURCE PLAN – 2015 DRAFT REPORT
Appendix A
When relevant and reliable industry values for specific parameter values were available, they were utilized for comparison and as a basis for any Resource Estimate. Notes concerning the source and reconciliation of any material differences were provided in the workbook. High-Level Findings and Recommendations Navigant provided recommended parameter values and performed direct comparisons with TVA estimates for 264 values. For about two-thirds of these, the TVA values were determined to be consistent with the recommended values (meaning within 10%, measured relative to the original TVA estimate). The remaining one-third of the values showed numerical differences of greater than 10%, characterized here as “material”. Of the materially different values, over half – representing 62 of the 264 values reviewed – showed differences greater than 20%. Some parameters are correlated with others, and one key difference in interpretation or estimation sometimes led to a pattern of differences across parameters. Additionally, variations in underlying classification categories (cost allocation, for example) can mean that there is some compensation or offsetting in net effects when modeling. Overall, the substantial majority of TVA values were determined to be consistent with recommended values, and otherwise reasonable. Regarding natural gas-fired generating resources, for the 48 parameter values compared, 29 (59%) of the TVA values were consistent with values recommended by Navigant. Roughly one-fifth of all parameters showed differences of 20% or more. The only systematic material difference between TVA values and recommended values was in annual outage rates, where the Navigant recommendations were higher across the board. For a given resource, parameter value differences vary in terms of impact, and a number of potentially offsetting differences are evident. The vast majority (79%) of the 66 coal resource parameters compared were in agreement. For the parameters with material differences, there was no systematic pattern, although some differences were noted for plant overnight capital costs, build time, and variable O&M. For nuclear generation, about half of the parameter values (15 out of 31) were found to be consistent. Most of the remaining values were 20% or more different (12 values). Generally speaking, recommended outage rates, plant and total overnight capital costs, and variable O&M values were materially higher than TVA values. Regarding energy storage, two-thirds of the compared parameter values were materially consistent. Each value with a material difference was at least 20% different. The parameters with such differences included variable O&M, fixed O&M (both dollars per year and $/kw-year), and book life for pumped hydro; and annual outage rate, storage efficiency, and plant and total overnight costs for CAES. Some potentially offsetting differences were observed. Almost all of the solar PV parameter values compared were consistent. Only a single material difference was identified, where the recommended value for fixed O&M (small commercial rooftop solar) was materially higher.
109
INTEGRATED RESOURCE PLAN – 2015 DRAFT REPORT
Appendix A
For wind energy, 16 of the 29 parameter values compared (or 55%) were consistent, with about half of the remaining values showing differences greater than 20%. Recommended outage rates were materially higher than TVA values for all three technology alternatives. Other differences varied by technology, and some potentially offsetting effects are seen. Biomass options show consistent parameter values in about one-quarter of the comparisons, with material differences in about three-quarters of the 29 values compared. All of materially different values are at least 20% different. This applies to co-firing, new direct combustion, and biomass repowering of existing coal. (No reliable source of industry information was located for biomass IGCC, and there are no such plants in service.) Where comparisons were possible, recommendations were materially higher for heat rate, build time, outage rate, and plant overnight capital. Some differences were due to varying assumptions about plant sizing, however, and some potentially offsetting differences were noted for variable and fixed O&M. On balance for all the generating and storage resources examined, the substantial majority of the proposed TVA parameter values for which comparisons were performed were consistent with recommended values – about two-thirds of all compared values. For those parameters with material differences in values of 10% or more, a number of those were to some degree offsetting within a given resource/technology. The TVA values reviewed were provided in Spring 2014, and the summary above relates to recommendations and comparisons based on the values provided at that time. Since then, TVA has modified numerous values to be used in its IRP modeling, in part reflecting the outcome of this review. TVA staff were extremely helpful and responsive both in providing supporting information needed in the review/comparison process, and in providing useful feedback and clarification on the draft workbook deliverable and the constituent parameter values. It is clear that TVA is striving to fairly represent all of the potential new generating resources in its IRP modeling, thus laying the basis for meaningful IRP modeling of resource expansion alternatives.
110

INTEGRATED RESOURCE PLAN – 2015 DRAFT REPORT
Appendix B
Appendix B – Assumptions
for Renewables • Test
111

INTEGRATED RESOURCE PLAN – 2015 DRAFT REPORT
Appendix B
Modeling Approach for Wind & Solar Options Wind and solar resources have unique operating characteristics that are different from thermal and other more traditional resources. To properly account for the contribution from these intermittent resources, the energy contribution is represented using hourly energy profiles that are imported into the model, and the seasonal capacity of these resources is represented by a computed Net Dependable Capacity (NDC) value. The annual capacity factor of the hourly energy profiles are also computed to ensure the total amount of energy is comparable to industry benchmark sources. This appendix discusses the methodology TVA has used to determine both the energy profiles and NDC values for wind and solar options that are considered in the IRP.
Wind Modeling Generation from wind is weather and location dependent, and not dispatchable like more conventional resources. Therefore, utilities need to develop a reasonable representation of the output from wind for use in long-range planning models. This “wind shape” is based on actual data collected from specific sites, or modeled data using wind turbine design assumptions.
TVA uses data from 3TIER to develop the planning assumptions around wind shape and capacity factor for use in the IRP. A “typical week” hourly shape for each month was developed by 3TIER for each wind option. Once a shape has been selected, the amount of energy produced can be determined and a capacity factor computed (actual generation expressed as a percentage of maximum possible generation).
Determining Wind Capacity Factors TVA used actual results from its wind contracts (1500 MW in Oklahoma, Illinois, Kansas and Iowa), simulated and actual data for the in-valley sites, and proposals for various projects to determine the capacity factors for the wind resources options included in the IRP. Since each of the options originates from different regions, TVA used a region-specific estimate for annual capacity factors. For modeling purposes, TVA assumed the MISO and SPP wind had a 40 percent capacity factor, the HVDC option originating from Oklahoma had a 55 percent capacity factor, and the In-valley option had a 30 percent capacity factor.
The HVDC project has a 55 percent annual capacity factor due to the availability of wind in Oklahoma and the newer technology of the wind turbines, which were assumed to be GE 1.7-100 wind turbines at a height of 80 meters. This capacity factor is much higher than TVA’s existing wind contracts in other locations. The chart below shows the range of capacity factors:
112

INTEGRATED RESOURCE PLAN – 2015 DRAFT REPORT
Appendix B
Determining the Wind Net Dependable Capacity (NDC) Planners must determine how much wind generation is likely at the system peak hour so that appropriate credit can be given to wind resources when computing the capacity/load balance to determine if the required reserve margin has been met in a given year. That capacity credit value is called the Net Dependable Capacity (NDC).
The NDC is applied to the nameplate capacity and is used by the expansion model to meet the 15 percent reserve margin requirement. It is calculated in a six-step process and repeated for annual, summer and winter periods for both the wind and solar resources.
1. For each year of the sample period, select the summer season (June-Sept). • TVA focuses this process on the summer because the system peak occurs in
that season. 2. Identify the top 20 load days of the summer.
• Using the top 20 days in the summer produces a distribution of wind generation in the sample year.
3. Find the peak hour for each of those top 20 days. 4. Determine the wind generation for each of those 20 peak hours and convert to capacity
factors. • These generation values are converted to capacity factors by dividing the hourly
generation by the nameplate capacity of the wind resource. 5. Choose the 25th percentile of this capacity factor distribution.
• TVA selects the 25th percentile value to ensure that wind generation at the time of the system peak will exceed this value 75 percent of the time.
6. Then these 25th percentile annual capacity factor values are averaged across all the years of the sample to produce the NDC used for planning purposes.
For this IRP study, TVA repeated this calculation using 16 years of data ranging from 1998 to 2013.
113

INTEGRATED RESOURCE PLAN – 2015 DRAFT REPORT
Appendix B
The simulated hourly wind generation was provided by 3TIER, a third-party company specializing in renewable energy assessment and forecasting. The wind generation was based on simulation of TVA’s existing wind contracts in MISO, SPP, and PJM as well as a site in Kansas near where the HVDC site is proposed. 3TIER assessed the long-term variability of the wind for each site in a retrospective analysis of historical wind speed and power. These data points were derived from a mesoscale Numerical Weather Prediction (NWP) model that was statistically calibrated to match the observed data during the measurement period at the height of the towers. An example of the variability of the wind net power is shown in Figure 1.
Figure B-1: Example of Wind Monthly-mean variability of net power capacity by 3TIER
The Annual NDC was calculated as 14 percent based on a portfolio view of all current wind contracts to capture the diversity of location across the different states of the region. This 14 percent NDC was used for all wind options. Specific sites of future wind in MISO, SPP or in-valley is unknown, so it would be inappropriate to assume a better or worse NDC at this time. A more specific NDC would be incorporated into the wind portfolio NDC calculation once specific sites are known. TVA did not consider over-subscription contracts where transmission is limited to a level below the nameplate rating of the wind capacity which tends to improve both the annual capacity factor and the NDC rating. The costs associated with the wind projects modeled in the IRP do not reflect oversubscription; in TVA’s experience with several existing wind contracts, this over-subscription provision is negotiated in the terms and costs of a particular contract and is not easily comparable to industry benchmarks.
Solar Modeling Similar to wind, solar resources are also weather and location dependent. Modeling of solar options in the IRP proceeds in a similar fashion to wind, and requires determination of solar
114
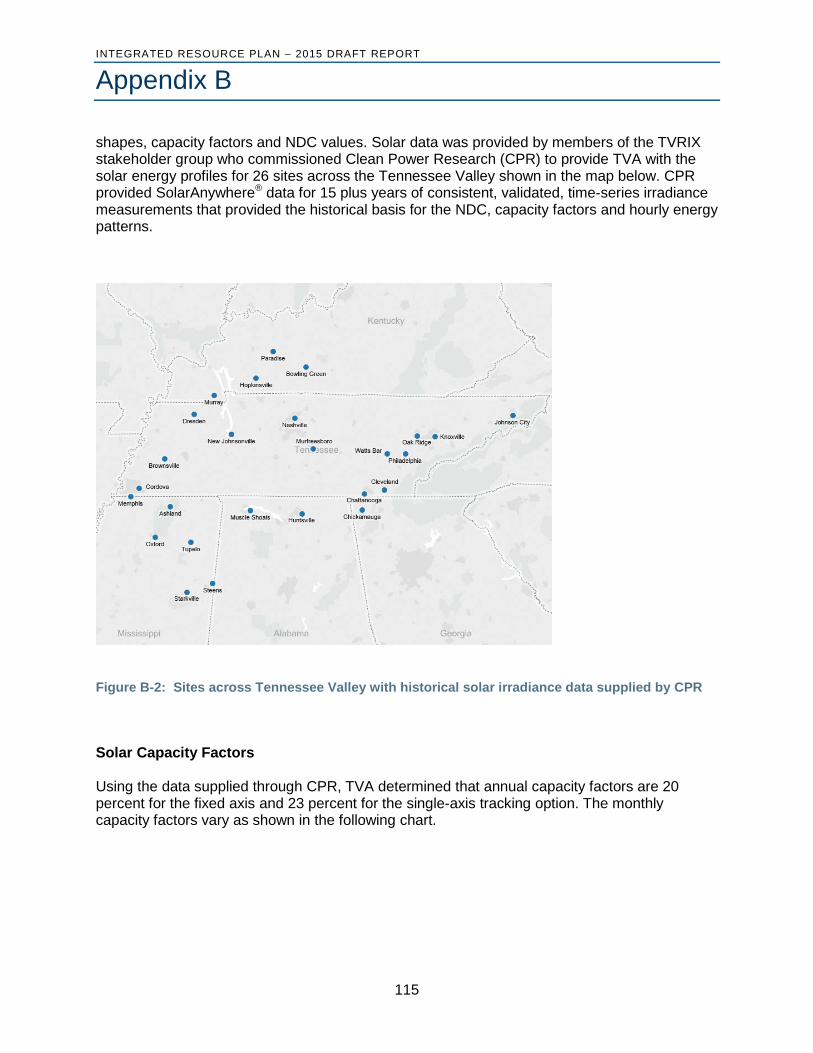
INTEGRATED RESOURCE PLAN – 2015 DRAFT REPORT
Appendix B
shapes, capacity factors and NDC values. Solar data was provided by members of the TVRIX stakeholder group who commissioned Clean Power Research (CPR) to provide TVA with the solar energy profiles for 26 sites across the Tennessee Valley shown in the map below. CPR provided SolarAnywhere® data for 15 plus years of consistent, validated, time-series irradiance measurements that provided the historical basis for the NDC, capacity factors and hourly energy patterns.
Figure B-2: Sites across Tennessee Valley with historical solar irradiance data supplied by CPR
Solar Capacity Factors Using the data supplied through CPR, TVA determined that annual capacity factors are 20 percent for the fixed axis and 23 percent for the single-axis tracking option. The monthly capacity factors vary as shown in the following chart.
115

INTEGRATED RESOURCE PLAN – 2015 DRAFT REPORT
Appendix B
Figure B-3: Solar Fixed Axis and Utility Tracking Capacity Factors by Month
Solar NDC values The determination of the NDC for solar resources utilizes the same process described for wind resources. The figure below shows the range of NDC values for solar fixed-axis systems computed using data covering the period 1998-2013:
Figure B-4: NDC by hour of the top 20 peak load days of Summer 1998-2013
10%
15%
20%
25%
30%
35%
Jan
Feb
Mar Apr
May Jun
Jul
Aug
Sep Oct
Nov
Dec
Cap
acity
Fac
tor
Month
Fixed Axis Solar Utility Tracking Solar
78%70% 69%
63%
50%
28%
0%
20%
40%
60%
80%
100%
1:00 PM 2:00 PM 3:00 PM 4:00 PM 5:00 PM 6:00 PM
Solar Fixed AxisNet Dependable Capacity (NDC) by Hour of Top
20 Peak Load Days of Summer 1998 - 2013
116

INTEGRATED RESOURCE PLAN – 2015 DRAFT REPORT
Appendix B In the summer, TVA normally has a peak load at 5:00 p.m. EST, but can also see a peak load between the hours of 2:00 p.m. and 6:00 p.m. EST. The 25th percentile of solar generation of those hours would occur at 5:00 p.m. or 6:00 p.m. EST as the sun is setting. Therefore, the summer NDC was set at 50 percent for fixed axis, including utility scale, small and large-commercial. The utility tracking option has a 68 percent NDC. All solar options have a 0 percent NDC during the winter, since TVA’s winter peaks normally occur at 5:00 a.m. EST when solar is not available.
117

INTEGRATED RESOURCE PLAN – 2015 DRAFT REPORT
Appendix C
Appendix C – Distributed Generation Evaluation Methodology
118

INTEGRATED RESOURCE PLAN – 2015 DRAFT REPORT
Appendix C
Background Distributed generation (DG) is broadly defined as generation that is produced on the distribution grid network. IRP strategies primarily focus on central station or utility-scale resource planning options, therefore the contributions from DG represented in this IRP are primarily captured in scenario development. In the context of the selected IRP scenarios, DG is more narrowly defined as customer-driven, demand-side generation which results in utility load reductions. Additionally, DG was subdivided into two customer categories: Industrial customers and residential/commercial. To represent the load profiles associated with DG penetration in these customer groups, an on-site natural gas plant was assigned to industrial customers, while small solar was utilized for residential/commercial customers. Although an assortment of DG technologies could realistically be deployed, these two technologies serve as useful proxies to represent DG across customer classes. Figure 1 shows how DG penetration, along with other uncertainties, was represented across the various scenarios and how the customer classes discussed were applied to DG penetration.
Figure C-1: DG Market Segments and Penetration Levels Across IRP Scenarios
Methodology Different methodologies were applied to forecast DG penetration growth differences between customer-led Industrial and Residential/Commercial market segments. Although the approaches differ, DG penetration levels across all scenarios directly impact other scenario uncertainties, specificly commodities, electricity prices and loads.
119

INTEGRATED RESOURCE PLAN – 2015 DRAFT REPORT
Appendix C
Residential/Commercial Distributed Generation Penetration Residential/Commercial DG penetration is defined as TVA’s residential and commercial customers’ energy consumption that is self-generated by renewable energy. Renewable energy encompasses all traditional renewable resource types (solar, wind, hydro, biomass, geothermal). For the purposes of this analysis, all Residential/Commercial DG is assumed to be solar PV. To determine Residential/Commercial DG adoption rates, a sequential set of linear drivers were applied. The primary, or leading, driver was another IRP scenario uncertainty, CO2 regulation. CO2 regulation was viewed as the most likely driving force to impact future levels of renewable energy growth, both from a utility- and customer-led perspective. Therefore, CO2 assumptions were first applied to determine utility-driven, national renewable energy adoption rates. National renewable energy adoption rates in turn drove customer-led DG renewable growth. Finally, national levels of DG growth were then appropriately scaled down to reflect regional DG growth in the Tennessee Valley region. To begin this sequential analysis, first, CO2 uncertainty levels were correlated to traceable source data. The Reference case along with the GHG 10, GHG 15, and GHG 25 cases of the 2013 U.S. Energy Information Administration (EIA) Annual Energy Outlook were chosen as the source material. EIA and TVA CO2 price assumptions were correlated to interpolate reasonable national renewable adoption levels by 2040, EIA’s end of analysis period.
Figure C-2: Correlation of IRP CO2 uncertainty values to EIA source data
The national renewable energy adoption levels, adapted from EIA data, were then adjusted to develop corresponding national DG penetration levels. EIA’s reference case and GHG 15 growth curves were applied to national DG growth rates to ensure relative consistency between
Analysis Basis TVA IRP Scenarios
TVA CO2Uncertainty Level
National RE Adoption(% of generation by 2040)
EIA – Reference Stagnant Economy Very Low CO2 16.5%
Current Outlook Same 18%
Distributed Marketplace Low CO2 20%
EIA - GHG 10 23.5%
Growth Economy High CO2 25%
EIA - GHG 15 28.4%
EIA - GHG 25 31.4%
De-carbonized Future Very High CO2 35%
120

INTEGRATED RESOURCE PLAN – 2015 DRAFT REPORT
Appendix C
IRP scenarios. The percentages of renewable growth as a function of total renewables growth were determined as described in Figure 3.
Figure C-3: Development of National Renewable DG Penetration Levels
Figure 4 charts national renewable energy growth rates as a percentage of total generation for the electric sector (utility-led only) and including DG (customer-led). The marginal gap between each set of solid and dashed lines indicates the quantities of DG penetration occurring across the various IRP scenarios.
Figure C-4: National Renewable Energy Adoption Levels (Utility-led and DG)
121

INTEGRATED RESOURCE PLAN – 2015 DRAFT REPORT
Appendix C
Finally, to translate national renewable DG adoption levels to TVA regional DG levels, a 75% multiplier was applied to represent regional differences. As mentioned previously, Residential/Commercial DG penetration was assumed to be 100% solar PV to serve as a relative proxy for renewable DG growth. These growing levels of Residential/Commercial DG penetration result in varying levels of TVA load loss as shown in Figures 5 & 6. Cumulative and annual capacity growth levels are also shown to provide a sense of total and incremental growth levels of renewable DG.
Figure C-5: Residential/Commercial DG Adoption Levels (by 2040)
Figure C-6: Residential/Commercial DG Adoption Levels (Annual)
TVA IRP Scenarios*
Impact of TVA RS-CO DG by 2040
Reduction in TVA load
Cumulative Capacity Growth (MW dc)
Avg. Annual Capacity Growth (MW dc)
Stagnant Economy ~0.6% ~815 ~31
Distributed Marketplace ~3.0% ~4,000 ~154
Growth Economy ~2.0% ~3,050 ~117
De-carbonized Future ~2.5% ~3,315 ~127
* Projections for renewable DG under our current outlook do include some portion of renewable DG penetration as part of the loadforecast, however they are based off historical implementation levels only (not future projections) and are limited in magnitude.
RS-CO DG Impact to TVA Load TVA Cumulative RS-CO DG Capacity Growth
122

INTEGRATED RESOURCE PLAN – 2015 DRAFT REPORT
Appendix C
Industrial Distributed Generation Penetration To accent the Residential/Commercial DG penetration analysis, industrial DG was also applied to reflect DG growth beyond renewable energy, namely from natural gas pursued by industrial customers. Industrial DG was applied across two scenarios: The Distributed Marketplace and Growth Economy. The following assumptions were applied across each scenario: Distributed Marketplace Scenario: Assumed 50% of industrial customer load was lost to DG over the study period (representing 10% of total TVA load). Growth Economy Scenario: Assumed 10% of industrial customer load with high steam needs were lost to DG over study period (0.6% of total TVA load). Conclusion DG, both nationally and at the TVA level, is included in the 2015 IRP study as demand-side generation that is customer-driven (outside of utility involvement), and results in a reduction to utility load. Industrial DG is load loss occurring from natural gas projects while Residential/Commercial DG is represented by solar PV projects. Residential/Commercial DG is driven by CO2 regulation and national renewable and DG growth rates. The resulting combination of both Industrial and Residential/Commercial DG growth rates are captured across the various IRP scenarios as load loss. The Distributed Marketplace scenario represents the most extreme load loss on the TVA system projected to be caused by DG.
123

INTEGRATED RESOURCE PLAN – 2015 DRAFT REPORT
Appendix D
Appendix D - 2015 IRP: Modeling Energy Efficiency
124
INTEGRATED RESOURCE PLAN – 2015 DRAFT REPORT
Appendix D
1 Energy Efficiency in the IRP One of TVA’s goals is to provide low-cost, clean, and reliable electric power to consumers and it does this by maintaining a diverse set of energy resource options. Energy efficiency and demand-side management programs have been part of TVA’s energy portfolio since the late 1970s and include incentive programs, price structure changes and educational efforts to encourage awareness and smart consumer choices. TVA continues to offer programs under the EnergyRight® Solutions brand that include residential, commercial, industrial, renewable (end-use-generation), demand response and educational/outreach initiatives.
TVA is currently engaged in evaluating new programs, delivery and impacts as it continues to evolve the demand side management portfolio. These programs help reduce reliance on power purchases from other suppliers, reduce power production environmental impacts and mitigate utility bill pressures by providing benefits to consumers and the TVA system. Refining the characterization of energy efficiency in models will enhance potential for success and assist in keeping electricity costs low.
1.0 Energy Efficiency Modeling TVA’s 2011 IRP used discrete energy efficiency portfolios matched to specific strategies for the modeling effort. The portfolios consisted of detailed program designs for individual energy efficiency and demand response programs that outlined annual costs and demand/energy reductions across a 30-year planning horizon. In the 2011 IRP, energy efficiency consisted of over 20 individual program designs, and the portfolios were considered “must run” components of their respective strategies.
Two significant drawbacks to this approach were the lack of flexibility in the must run nature of the energy efficiency contribution for each strategy design and the staff time required to develop program details for efforts that would not necessarily launch for several years. To address these deficiencies, a different approach was developed in the 2015 IRP to employ “blocks” of energy efficiency impacts and costs that reflect the characteristics of existing programs but do not require the development of detailed program designs.
TVA energy efficiency programs typically address the major components of energy consumption in the areas of lighting, building shell improvements, HVAC/control upgrades, industrial process changes and a newly identified approach, voltage regulation. Assumptions on changes to load shapes and reductions in demand and energy can be derived from the results of existing programs and projected for blocks which serve as proxies of yet-to-be-defined future programs, as well as continuation of existing efforts. This approach greatly reduces the staff time needed to develop modeling inputs and, if designed in small enough blocks, affords the opportunity for the model to select an optimum level of energy efficiency on an annual incremental basis to match the given strategy and scenario inputs in each model run.
1.1 TVA Energy Efficiency Program Characteristics A variety of delivery methods are used to deliver programs to end-use consumers. Residential programs are delivered through various channels, which include: up-stream incentives to manufacturers and installers; promotion and administration of TVA-designed programs through local power companies (LPCs); turnkey administration of TVA-designed programs through third-party vendors; and design, promotion and administration of programs by LPCs. In the
125

INTEGRATED RESOURCE PLAN – 2015 DRAFT REPORT
Appendix D
commercial and industrial sectors, programs are offered to large customers directly served by TVA. The majority of promotion and administration duties for LPC commercial and industrial customers are handled by TVA field staff and a third-party administrator under contract to TVA with the collaboration and coordination of the LPCs. The Conservation Voltage Reduction (CVR) program requires the participation of the individual LPCs and does not involve promotion or participation by individual end-use customers.
Energy efficiency programs impact the system to reduce costs through demand reduction as well as energy savings. As can be seen in Figure 1, on a typical peak day, the energy efficiency resource provides load matching to TVA’s overall load requirements for that day. This is due to the EE resource portfolio design having the same system load shape drivers as the system load. The variable EE shape over the majority of the day (Figure 1) and year round EE (Figure 2) demonstrates that EE resembles the cycling nature of an intermediate resource like a natural gas combined cycle unit.
Figure D-1: Energy Efficiency Performance on a Typical Peak Summer Day (2023)
Looking across a typical year (Figure 2), energy efficiency resources provide fuel and operating cost savings by lowering demand across all months of the year and offsetting the need for base load and intermediate resources. The shapes differ by sector with the residential sector following weather patterns more closely than the commercial or industrial sectors.
-
500
1,000
1,500
2,000
-
5,000
10,000
15,000
20,000
25,000
30,000
35,000
1 3 5 7 9 11 13 15 17 19 21 23
EE &
DR
Red
uctio
ns (M
W)
Peak
Loa
d (M
W)
Hour
Residential EE Commercial EEIndustrial EE Peak Hourly Load minus EEPeak Hourly Load
126

INTEGRATED RESOURCE PLAN – 2015 DRAFT REPORT
Appendix D
Figure D-2: Energy Efficiency Monthly Profile (2023)
In the block designs used for the 2015 IRP, the residential sector has a defined capacity factor of 57%; the commercial sector has a capacity factor of 68%; and the industrial sector has a capacity factor of 80%. These capacity factors are comparable to other base load and intermediate duty resources with capacity factors typically greater than 40%.
2.0 Model Inputs and Assumptions For energy efficiency to be a selectable resource option in the optimization model, energy efficiency block characteristics must be developed that are conceptually comparable to other supply side resources.
The Block Concept
Traditional supply side resources have the following characteristics:
• Capacity and energy - typically a known size in MW and MWh respectively • Install cost - typically a bus bar $/kW • Construction lead time - years to build from initial project consideration • Operational characteristics—must run number of hours per year, heat rate (fuel
efficiency), capacity factor, etc. • Service Life - years
TVA developed energy efficiency options in a similar fashion. Blocks of energy efficiency impacts and load shapes were constructed for three market sectors: residential, commercial and industrial. Each sector has a load shape similar to the weighted average of the end-use load shapes for current EE program within those sectors. For example, a residential EE block has a load shape similar to the weighted average of six residential customer programs’ annual load shapes (Table 1). Each of the sectors is comprised of three pricing tiers
0
500
1000
1500
2000
2500
3000
0
5,000
10,000
15,000
20,000
25,000
30,000
35,000
1 2 3 4 5 6 7 8 9 10 11 12
EE &
DR
Red
uctio
ns (M
W)
Peak
Loa
d (M
W)
Months
Residential EE Commercial EEIndustrial EE Monthly Load 2023Monthly Load minus EEDR
127
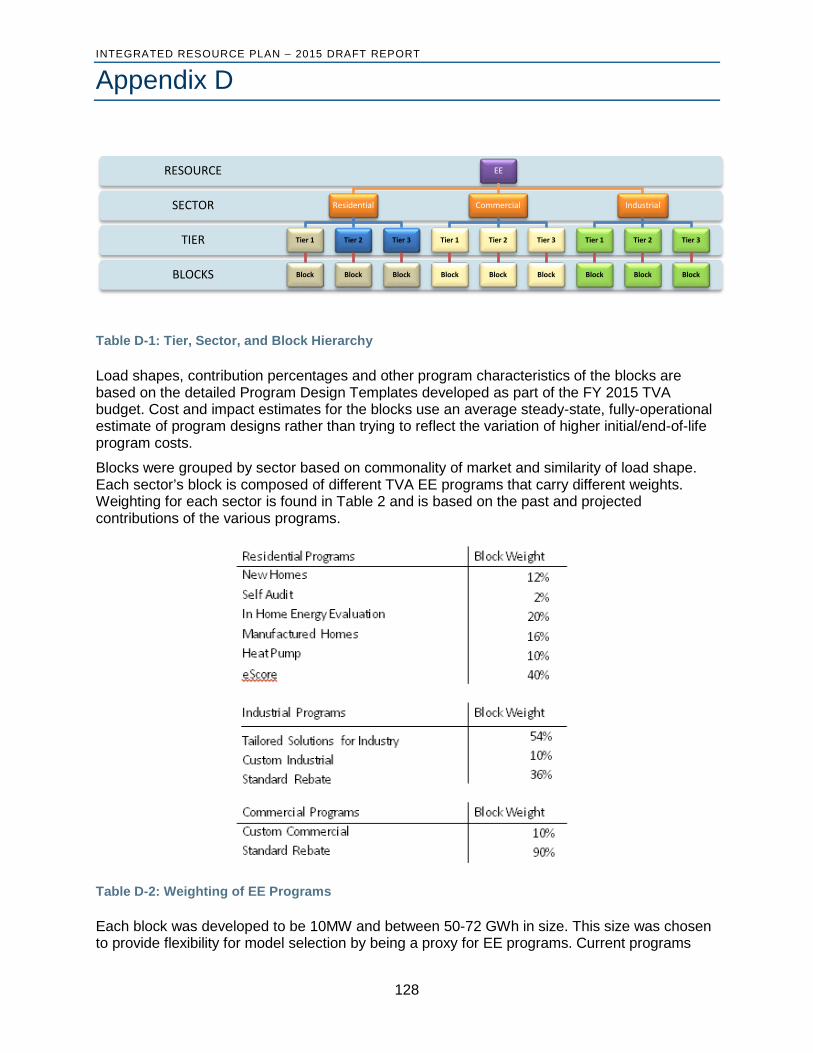
INTEGRATED RESOURCE PLAN – 2015 DRAFT REPORT
Appendix D
Table D-1: Tier, Sector, and Block Hierarchy
Load shapes, contribution percentages and other program characteristics of the blocks are based on the detailed Program Design Templates developed as part of the FY 2015 TVA budget. Cost and impact estimates for the blocks use an average steady-state, fully-operational estimate of program designs rather than trying to reflect the variation of higher initial/end-of-life program costs.
Blocks were grouped by sector based on commonality of market and similarity of load shape. Each sector’s block is composed of different TVA EE programs that carry different weights. Weighting for each sector is found in Table 2 and is based on the past and projected contributions of the various programs.
Table D-2: Weighting of EE Programs
Each block was developed to be 10MW and between 50-72 GWh in size. This size was chosen to provide flexibility for model selection by being a proxy for EE programs. Current programs
BLOCKS
TIER
SECTOR
RESOURCE EE
Residential
Tier 1
Block
Tier 2
Block
Tier 3
Block
Commercial
Tier 1
Block
Tier 2
Block
Tier 3
Block
Industrial
Tier 1
Block
Tier 2
Block
Tier 3
Block
128

INTEGRATED RESOURCE PLAN – 2015 DRAFT REPORT
Appendix D
each have a net-to-gross (NTG) design assumption (Table 3) which accounts for free-ridership and other aspects of program efficacy and were weighted in the development of the sector blocks. Each existing program also has an associated set of modeled data including the on-peak capacity reduction and associated “operational like” characteristics, which include an 8,760-hour load shape consistent with the sector end-use load shape. Since each EE block occurs at the end use level, the characteristics are “grossed up” for transmission and distribution losses to create a “supply side equivalent” when modeled with other resource options.
Program Sub Program Lifespan NTG
R1 New Homes 15 64%
R2 Kit & Self Audit 6 75%
R3 IHEE 18 80%
R4 Manufactured Homes (VHP) 15 80%
R5 Heat Pump Program 15 67%
R9 ESTAR Man. Homes 15 80%
R14 eScore 18 80%
C1 Tailored Solutions 10 70%
C2 Custom Industrial 10 70%
C3 Custom Commercial 15 76%
C10 Standard Rebate Commercial 15 69%
C11 Standard Rebate Industrial 15 74%
Table D-3: Net to Gross ratios and Lifespans for the EE programs within sectors
2.0.1 Pricing Once the operational characteristics of each sector EE block was developed, pricing tiers were identified. Pricing tiers were developed to reach more deeply into the pool of potential savings in the Valley; additional costs would need to be incurred to expand delivery system infrastructures and encourage greater participation. Blocks within Tier 1 were priced at the current portfolio of programs for each sector in accordance with the weighting table referenced above.
129

INTEGRATED RESOURCE PLAN – 2015 DRAFT REPORT
Appendix D
Tier 2 and Tier 3 consist of programs yet-to-be-developed (some of which represent as-yet-undeveloped technologies) and pricing was based on the step function increase found in Table 4. The breakpoints and step function increase for each of the sectors were developed through consultation with the managers of existing TVA programs and supporting consultants.
Table D-4: Tier Step Changes
The steps in cost for tiers 2 and 3 are similar to a supply stack in which programs with the highest potential are the lowest cost programs, programs with mid-potential are mid cost programs, and programs with lowest to mid potential are at a high program cost. As benefits are exhausted from of the lowest cost programs, it moves down the supply stack to the next lowest cost program.
Levelized costs for each of the tiers within the sectors can be found in Figure 4. Energy efficiency programs are compared against a greenfield combined cycle plant, which energy efficiency tends to closely resemble based on capacity factor. All block costs, including incentives, escalate at inflation (1.8% per year) so that energy efficiency becomes cheaper over time in real terms.
Figure D-4: Levelized EE block cost comparison ($/MWh) compared to a greenfield combined cycle plant over time
130

INTEGRATED RESOURCE PLAN – 2015 DRAFT REPORT
Appendix D
2.0.2 Quantity Much like the supply side counterparts, EE programs also have operational-like limits on the ramp rate, or year-over-year growth, based on startup time and development of infrastructure. The limits are driven by program development, customer awareness, market penetration, participant acquisition and many other customer and market factors.
Through 2018, TVA has a “required” energy efficiency performance as part of a 2011 EPA settlement. These programs are embedded into the TVA annual business planning cycle and are being modeled as “must run” resources for the IRP resource selection model.
For the selectable blocks, TVA assumed that growth of the total delivered blocks each year cannot exceed 25% when compared to the previous year for years 1-5. For years 6-15, the growth rate was limited to 20%, and then is at 15% per year thereafter. These limits were based on the ability of TVA and program partners to expand the delivery infrastructure from one year to the next and the expectation of increasing consumer/participant awareness. 2.0.3 Block Life For supply side resources, power contracts expire and power plants reach end of life and are retired. Similarly, energy efficiency resources have useful lifespans (e.g. light bulbs burn out, lighting systems must be upgraded and heating and cooling equipment must be replaced). For the 2015 IRP, TVA has assumed each block of energy efficiency resource can be replaced with a similar block at the available price for that sector’s block.
The lifespans for each of the sector blocks were developed based on program composition within each sector, current program lifespan assumptions, and measure lifespan assumptions used by industry standards.
Table D-5: Block Characteristics for each sector
Each of the blocks in the different tiers and sectors have differing lifespans. Tier 1 block lifespans were determined using a weighted average based on existing programs. Tier 2 and 3 blocks are made up of programs yet to be developed as well as some potentially unknown
131

INTEGRATED RESOURCE PLAN – 2015 DRAFT REPORT
Appendix D
technologies, therefore the same estimates could not be applied. TVA instead used an industry average lifespan for each of the sectors. Residential and commercial tier 2 and 3 blocks have a 13 year lifespan and industrial tier 2 and 3 blocks a 10-year lifespan (Table 5).
3.0 Energy Efficiency Methodology within System Planning 3.1 Planning Approach Energy Efficiency (EE) programs have two basic impacts that are relevant to planners:
1) Avoided energy calculation – Energy not consumed means fuel not burned, resulting in savings in variable costs. Further, since program impacts are felt at the meter, they also avoid transmission and distribution (thermal) losses which can average 6.5% by the time energy reaches an end user.
2) Avoided capacity calculation – Capacity is avoided, because reduced electricity demand translates into reduced need for incremental capacity additions.
Using EE program design parameters, hourly demand profiles are developed via engineering models, such as eQuest, and then calibrated through program evaluation. Inputs to the models include occupancy/utilization profiles and weather data. Each model’s key output is an 8,760 hourly profile of a “before” end use shape and an “after” efficient end use shape that are subtracted to get the net savings. The net savings shape is then regressed on weather and calendar variables, revealing the relationship between savings and temperature, day of week, season, etc. The model is then forecast forward using TVA weather and load forecast as inputs. The final result is an hourly energy efficiency savings forecast synched to the TVA load forecast.
There are two basic ways to incorporate the EE shapes into System Planning models:
1) As a load modifier: the energy efficiency shapes are subtracted from the original system load and the resulting net system load is fed into the model’s “load input.”
2) As a resource (selectable or non-selectable): consistent with how all other supply side resources are modeled (i.e. nuclear, coal, gas, hydro, etc.). EE resources point to a defined energy pattern (i.e. the EE load shape) similar to a solar resource.
Each approach has pros and cons and the best approach depends on modeling architecture and modeling objectives. For the 2015 IRP, TVA elected to use the model-as-a-selectable-resource approach. This allows TVA to model selectable EE resource units for full optimization. Energy efficiency is non-dispatchable and operates similarly to a number of other non-dispatchable generation resources in that system operators cannot directly control it based on system needs. There are no variable operations and maintenance (VOM) costs nor an emissions penalty (CO2 costs). Key input parameters are monthly avoided capacity, $/kW (cost divided by summer peak kW) and an hourly energy pattern.
3.2 New Approach to Modeling from 2011 IRP TVA is taking a new approach to energy efficiency modeling to allow energy efficiency to compete with other resources within each of the IRP cases. This will create an opportunity to allow for full portfolio optimization, to better gauge the impacts of the programs in different situations, and to better demonstrate the value proposition for the resource.
The 2011 IRP study did not contain energy efficiency as a selectable resource. Several different EE portfolios were scheduled as load modifiers in various scenarios. There was no supply stack concept in those portfolios, which in effect reduces model flexibility and limits model outcome.
132

INTEGRATED RESOURCE PLAN – 2015 DRAFT REPORT
Appendix D
TVA’s new modeling approach for energy efficiency as a competitive resource attempts to enhance model visibility and potential impacts with regards to least cost optimization.
3.2.1 Comparability to Other Supply Side Resources Energy efficiency unit characteristics must be developed that are comparable to other supply side resources. Supply side characteristics that feed the capacity expansion model can be found in Table 6 and are compared against the energy efficiency “power plant.”
Table D-6: Resource Characteristic Comparison with EE
For supply side resources in the IRP, unit performance is not expected to be 100%. This delivery risk is captured in an outage rate for the unit. There is not a comparable outage rate for the modeled energy efficiency blocks; rather, the modeling approach assumes the block to be operationally available 100% of the time. Efficiency is dependent on variables such as equipment reliability and service life, operating conditions, etc., that would impact operability similar to an outage rate.
In addition to outage rates, Table 7 shows the potential uncertainties that are captured in cost for supply side resources. Examples include a carbon dioxide emission penalty, fuel cost uncertainty, project cost contingencies and cost escalation uncertainties.
One item unique to TVA’s modeling approach on EE blocks is related to technological improvements. Traditional supply side resources do not reflect advancements in technology over time. For example, a combined cycle plant constructed in 2033 possesses the same heat
SUPPLY SIDE COMPARISON
Com EE Ind EE Res EE New CC New CT
New Coal w/
CCS AP1000Year Available 2014 2014 2014 2019 2018 2028 2026
Outage Rate Heat Rate Fuel Costs
Fuel CAGR
CO2 Costs
CO2 CAGR (starts in 2022)
O&M costs O&M Escalation
Transmission Contingency Cost Project Contingency Cost
Capital Costs Escalation of capital
Capacity Factor
Technology shifts
133

INTEGRATED RESOURCE PLAN – 2015 DRAFT REPORT
Appendix D
rates, ramp rates, cost of construction (escalated for inflation), etc. as one constructed in 2015 because we do not know what the future technology will be. However, in EE blocks TVA allows for an assumption of technological improvements based on the history of EE deliveries over the past 30 years.
3.3 Modeling Uncertainty The block design approach is novel and fits well with model architecture, but introduces some uncertainties around design and delivery that are unique relative to other resources. Design uncertainty is introduced by the creation of prescribed blocks of EE meant to reflect bundles of programs over time. Delivery uncertainty exists around claimed versus evaluated measures, the ability to deliver and implement programs though TVA’s 155 different local power companies, and risk around EE deliveries relative to future codes and standards.
Table D-7: Design and Delivery Uncertainties
Uncertainty of all types exists with supply side resources and is modeled in different ways in the analysis, but typically manifest itself as cost. For energy efficiency, TVA considers the two primary categories of uncertainty mentioned above to remain comparable with other supply side resources. In addition, certain variables can be captured directly or indirectly in the stochastic analysis performed in the study. Key uncertainties are discussed in more detail below.
3.3.1 Design Uncertainty Since the modeled energy efficiency blocks are proxies for technologies and programs not yet developed, there is uncertainty in their design and future composition. Blocks in the study are modeled as 10 MW resources with a defined load shape by sector (residential, commercial, and industrial). The virtual nature of energy efficiency compared with the tangible, physical attributes of supply side resources necessarily introduces a level of uncertainty around certain key design attributes.
3.3.1.1 Measure Life Uncertainty Measure life or Effective Useful Life (EUL) is the median number of years that the measure after installation is expected to be in place and operable. This includes “equipment life” which is the number of years installed equipment will be operational before it fails, and “measure persistence” which takes into account business turnover, failure or early retirement of the installed equipment.
Each of the energy efficiency blocks contains different programs with different EULs. Tier 1 blocks contain currently developed TVA programs, and the block lifespan was determined using weighted averages. Block lifespans for tiers 2 and 3 were approached differently. Because tiers 2 and 3 contain undeveloped technologies and programs, industry average standards were used for the different sector’s lifespan.
Design DeliveryProxy Programs in Blocks LPC Delivery RiskMeaure Lifespan Blending Codes and Standards
Unchanging Shapes Claimed vs. Evaluated
Uncertainty
134

INTEGRATED RESOURCE PLAN – 2015 DRAFT REPORT
Appendix D
Since the energy efficiency blocks are a mix of differing technologies with differing life measures, potential exists for overestimation or underestimation of energy savings. With respect to the energy shapes, the capacity expansion model uses a repeating annual energy pattern for each block to the end of the lifespan. As programs die off before the expected lifespan, they are replaced with the same technology at no cost until the end of a defined block life.
Figure 5 demonstrates how this applies to a 14-year residential audit program within a residential block that has a lifespan of 17 years. Several technologies die off before the end of life, but the block assumes the energy is still there because the technology is replaced with like kind (solid black line). Notice there is an overstatement of energy for years 6 -17. For the technologies where contribution ends prior to end of block life, it is replaced with a similar block and contributes with the same energy pattern for the remaining block life. The risk in these cases is that we are overstating energy (by having the same energy contribution every year) and underestimating costs (by assuming technology is replaced at no cost to TVA). The blending of programs into blocks creates unique challenges for resource planning in that an average lifespan can create resource adequacy challenges in a particular year.
Figure D-5: Example of a residential audit program modeled as part of a residential block
3.3.1.2 Fixed Shape Uncertainty Each of the energy efficiency sectors has a fixed end use 8,760 load shape. For modeling convenience, the blocks are assumed to have an unchanging composition over time, even though this is unlikely. TVA’s stochastic modeling around the overall TVA load shape partially addresses some of this risk but does not address the uncertainty around the shape of the block designs changing over time as programs and technologies evolve and as the “low hanging fruit” of EE is picked off.
-
200
400
600
800
1,000
1,200
1,400
1,600
1,800
1 2 3 4 5 6 7 8 9 10 11 12 13 14 15 16 17 18 19 20
Annu
al k
Wh
Savi
ngs
Year
Duct Sealing/Repair Direct Install HP Water Heater Air Sealing
HVAC - HP HVAC - AC Lighting Attic Insulation
Windows & Doors Claimed Program Savings Claimed Block Savings
End of program lifeEnd of residential block life
135
INTEGRATED RESOURCE PLAN – 2015 DRAFT REPORT
Appendix D
3.3.2 Delivery Risk Uncertainty
3.3.2.1 Local Power Company Delivery Uncertainty Unlike conventional assets that can be constructed, operated and maintained directly by TVA, there is more uncertainty around the ability to implement EE resources in the Tennessee Valley because of the multiple parties involved and coordination around end use customer adoption. The end use providers are made up of the participants and the local power companies. There are currently 155 Local Power Companies (LPCs) in the TVA region consisting of municipal utility companies and cooperatives. Since TVA is not the end-use provider there is risk in how the 155 local power companies would vary in their delivery of EE programs. Additionally, TVA and the LPCs need to establish delivery mechanisms to facilitate larger EE deployment across the region and this takes time and resources which may be different than a comparable, vertically integrated utility might experience.
TVA believes delivery risk will diminish over time as delivery mechanisms are developed and refined with the LPC customers. A 10% adjustment is applied to reflect delivery risk for years 1 through 5. At year 6, this adjustment begins declining at 2% per year.
3.3.2.2 Realization Rate Delivery Uncertainty The gross realization rate is the ratio of measured energy reduction (actual) to claimed energy reduction (planned). The gross realization rate is typically multiplied by the Net to Gross ratio (a ratio which accounts for attribution) in order to get “the net realization rate.” In most studies reviewed by TVA, net realization rates tend to be less than one, although in some jurisdictions realization rates reflecting actual performance exceeding planned savings have been achieved.
Examples of lower realization rates (i.e. realized program impacts) can be seen in more mature markets such as California, Con Edison and Indiana where there are extensive measurement and verification (M&V) data. They illustrate that risk exists with regard to energy and capacity impacts even in these more mature markets. A lot of this is attributable to operational issues, calculation methods, and inappropriate baselines. TVA does not expect to repeat industry experience with regards to claimed and evaluated measured discrepancies since TVA has different market drivers. However, TVA can learn from their experience by noting that there is risk around these future program assumptions. In the IRP case, the risk is primarily around our ability to realize deliveries over the 20-year study period on programs that as-yet have not been designed, undergone M&V and been refined. This uncertainty increases over time.
3.3.2.3 Delivery Risk: Codes and Standards TVA’s modeling approach assumes that selectable EE resource deliveries are over and above any future tightening of efficiency codes and standards. Currently, known codes and standards (C&S) are reflected in the load forecast in the IRP, and future increases in C&S are not assumed.
Treating EE as a supply side resource means that it is available and deliverable in the same way that a conventional resource is, and this creates a risk around C&S tightening. A conventional gas turbine for example, delivers MWs regardless of whether new efficiency standards reduce TVA’s sales in year 15 of the study. For EE, there is a risk that future tightening of C&S would reduce the amount of EE available to deploy in the market or increase the cost of deploying the EE resource in the future. As baseline efficiency requirements increase, then either the supply (volume) of EE must decrease or the cost of the next series of
136

INTEGRATED RESOURCE PLAN – 2015 DRAFT REPORT
Appendix D
measures must increase. TVA’s current EE modeling assumes that over the 20-year study period that TVA programs can be developed to exceed whatever the then-current standards may be.
3.4 Recognizing Design & Delivery Uncertainty: Planning Factor Adjustment Why do all these performance issues and uncertainty matter? Dynamically modeling energy efficiency as a resource means that all variables, including resource costs, shapes and uncertainties, significantly influence the modeled needs for base load, intermediate and peaking generation. There are several possible ways to address this uncertainty analytically, including carrying higher planning reserves, but each increases overall plan costs. To address these uncertainties and allow energy efficiency to compete on the same playing field as a supply side resource, a planning adjustment factor was made to reflect the two categories of design and delivery uncertainty.
Initially, the primary risk TVA faces is delivery risk, largely around the ability to implement programs across our service territory and build the infrastructure with our LPC partners. This is represented as a 10% cost adder in years 1-5 that begins to decline in year 6. The other uncertainties around block design and delivery risk uncertainty are initially zero but begin to grow over time, starting in year 6. The total planning adjustment is shown in Figure 6 and grows to 30 percent over the out years of the study. This planning adjustment reflects the fact that the further out in the future one goes, the more uncertain these proxy EE blocks are. The planning adjustment is an approximation, not a precise calculation, but is meant to reflect how uncertainties increase over time.
In this construct, the uncertainties manifest as cost in the model. The alternate approach was to restrict volumes available in the out years, but TVA chose to keep the volumes consistent to test the model boundaries. Uncertainty manifesting as cost has certain modeling advantages and also allows volumes to be unconstrained. In many case results we can see full selection of EE blocks occur, even in the out years with the uncertainty adjustments, which allows for a more robust range of case results.
137

INTEGRATED RESOURCE PLAN – 2015 DRAFT REPORT
Appendix D
Figure D-6: Planning Factor Adjustment over time
3.5 Recognizing Uncertainty: Stochastic Analysis While the planning adjustment captures design and delivery uncertainty, TVA’s analytical approach also considers stochastic analysis on several key inputs. O&M cost escalations are stochastically varied in the analysis using the same distributions as other O&M costs. Resulting system cost impacts are indirectly varied by demand and weather pattern (i.e. load shape) distributions modeled in the analysis. Traditional supply side resources have other factors that can change both their cost and generation levels: demand, fuel, O&M, capital costs, CO2 emission penalties, etc. All such uncertainties manifest as cost in the model. Table 8 lists the direct and indirect stochastic variables for several supply side resources as a comparison to energy efficiency.
0%
5%
10%
15%
20%
25%
30%
35%
2014
2015
2016
2017
2018
2019
2020
2021
2022
2023
2024
2025
2026
2027
2028
2029
2030
2031
2032
2033
LPC Delivery Risk Uncertainty Total Adj
More uncertainty
LPC delivery uncertainty declines
Design and Delivery uncertainties increase over time before leveling out by 2025
LPC delivery uncertaintyonly in first
5 years
Zero uncertainty in early years because TVA already
has programs identified
138

INTEGRATED RESOURCE PLAN – 2015 DRAFT REPORT
Appendix D
Table D-8: Indirect and Direct Stochastic Variables
Even after accounting for the planning factor uncertainty, EE blocks have a significantly lower range of uncertainty than a comparable combined cycle plant as shown in Figure 7. The uncertainty bands around combined cycle costs are much wider due to fuel, emissions, O&M, capacity factor and capital cost uncertainty. The much narrower EE uncertainty band is driven by the design and delivery uncertainties previously covered, stochastic variations on O&M cost and the indirect effects of the stochastic draws on the overall system load shape.
139

INTEGRATED RESOURCE PLAN – 2015 DRAFT REPORT
Appendix D
Figure D-7: Uncertainty bands in $/MWh for each of the EE sector blocks as compared to a greenfield combined cycle plant
140

INTEGRATED RESOURCE PLAN – 2015 DRAFT REPORT
Appendix D
3.6 Costs After Planning Adjustment Levelized Cost of Energy (LCOE) is a common metric to allow comparisons of total resource costs reflective of capital costs, asset lives and expected fuel costs. Looking at the comparison in Figure 8, EE compares favorably with other TVA resources in 2015.
Figure D-8: Levelized Cost comparisons in 2015 (2015$/MWh)
Looking at the LCOE over time with the uncertainty adjustment, most of the EE blocks remain less expensive than a natural gas combined cycle unit through the IRP study period. Only Residential Tier 3 has block costs that are higher in the beginning and end of the study period than a comparable combined cycle.
Figure D-9: Levelized cost comparison ($/MWh) of EE tiers in 2015 and 2033
141

INTEGRATED RESOURCE PLAN – 2015 DRAFT REPORT
Appendix D
Figure D-10: Levelized Cost Comparison by Sector through time
4.0 Next Steps Energy efficiency modeling for the IRP was a collaborative effort across TVA and with stakeholders. Modeling energy efficiency as a competitive resource introduces additional uncertainties around design and delivery that are unique from other traditional resources. TVA’s approach accounts for these uncertainties with a planning adjustment, which is hoped to refine over time as programs are developed, measured and verified. The modeling framework chosen for use in the 2015 IRP has produced a robust set of results that demonstrate the value energy efficiency brings to the portfolio, including an assessment of the outcome for cases that test the boundaries for EE. TVA’s next step is to develop an internal business process to leverage this dynamic approach in resource planning and to revisit the assumptions behind some of the fundamental parameters.
142

INTEGRATED RESOURCE PLAN – 2015 DRAFT REPORT
Appendix E
Appendix E - Capacity Plan Summary Charts
143

INTEGRATED RESOURCE PLAN – 2015 DRAFT REPORT
Appendix E
Capacity & Energy Expansion Results Appendix
The capacity expansion plans are shown below by strategy. The capacity graphics show the total capacity grouped by resource type (i.e., nuclear, hydro, coal, etc) over the planning horizon. The capacity is in gigawatts, which is 1,000 megawatts, and is based on the summer net dependable capacity value or the amount of capacity that TVA plans to have available to meet summer peak firm requirements.
Total Capacity Expansion Plans
2015 2020 2025 2030 2033 2015 2020 2025 2030 2033 2015 2020 2025 2030 2033 2015 2020 2025 2030 2033 2015 2020 2025 2030 2033DR 2 2 2 2 2 1 1 2 2 2 2 2 2 2 2 2 2 2 2 2 1 1 2 2 2EE 0 1 2 3 3 0 1 2 3 3 0 1 2 3 3 0 1 2 3 3 0 1 2 3 3Gas CC 5 7 7 6 6 5 7 6 6 6 5 7 7 6 6 5 7 7 6 6 5 7 6 6 6Gas CT 5 6 6 9 10 5 6 6 7 9 5 6 7 9 10 5 6 7 9 10 5 6 6 6 7Renewables 0 1 1 2 3 0 1 1 2 2 0 1 2 3 4 0 1 2 3 4 0 1 1 1 2Coal 11 8 8 7 7 11 8 8 7 7 11 8 8 8 8 11 8 8 8 8 11 8 7 5 5Hydro 4 4 4 4 4 4 4 4 4 4 5 5 5 5 5 5 5 5 5 5 4 4 4 4 4Nuclear 7 8 8 8 8 7 8 8 8 8 7 8 8 8 8 7 8 8 8 8 7 8 8 8 8
0
5
10
15
20
25
30
35
40
45
50
GW, SND Scenario 1: Current Outlook
Scenario 4:Decarbonized Future
Scenario 3: Economic Growth
Scenario 2:Stagnant Economy
Scenario 5:Distributed Marketplace
Strategy A: The Reference Plan
144

INTEGRATED RESOURCE PLAN – 2015 DRAFT REPORT
Appendix E
2015 2020 2025 2030 2033 2015 2020 2025 2030 2033 2015 2020 2025 2030 2033 2015 2020 2025 2030 2033 2015 2020 2025 2030 2033DR 2 2 2 2 2 1 1 2 2 2 2 2 2 2 2 1 1 1 2 2 1 1 2 2 2EE 0 1 2 3 3 0 1 2 3 3 0 1 2 3 3 0 1 2 3 3 0 1 2 3 3Gas CC 5 7 7 6 6 5 7 6 6 6 5 7 7 6 6 5 7 6 6 6 5 7 6 6 6Gas CT 5 6 7 9 10 5 6 6 8 10 5 6 7 9 10 5 6 6 6 7 5 6 6 6 7Renewables 0 1 1 2 3 0 1 1 2 2 0 1 2 3 4 0 1 2 3 4 0 1 1 1 2Coal 11 8 8 7 7 11 8 8 7 7 11 8 8 8 8 11 8 7 5 5 11 8 7 5 5Hydro 4 4 4 4 4 4 4 4 4 4 5 5 5 5 5 5 5 5 5 5 4 4 4 4 4Nuclear 7 8 8 8 8 7 8 8 8 8 7 8 8 8 8 7 8 8 8 8 7 8 8 8 8
0
5
10
15
20
25
30
35
40
45
50
GW, SND Scenario 1: Current Outlook
Scenario 4:Decarbonized Future
Scenario 3: Economic Growth
Scenario 2:Stagnant Economy
Scenario 5:Distributed Marketplace
Strategy B: Meet an Emission Target
2015 2020 2025 2030 2033 2015 2020 2025 2030 2033 2015 2020 2025 2030 2033 2015 2020 2025 2030 2033 2015 2020 2025 2030 2033DR 2 2 2 2 2 1 1 1 2 2 2 2 2 2 2 1 1 1 2 2 1 1 1 2 2EE 0 1 2 3 3 0 1 2 3 3 0 1 2 3 3 0 1 2 3 3 0 1 2 3 3Gas CC 5 7 6 6 5 5 7 5 5 5 5 7 6 5 5 5 7 5 5 5 5 7 5 5 5Gas CT 5 6 7 8 10 5 6 7 8 10 5 6 7 9 10 5 6 6 6 7 5 6 6 6 6Renewables 0 1 1 2 3 0 1 1 2 2 0 1 2 3 4 0 1 2 3 4 0 1 1 2 2Coal 11 8 8 8 8 11 8 8 7 7 11 8 8 8 8 11 8 7 6 5 11 8 8 7 6Hydro 4 4 4 4 4 4 4 4 4 4 5 5 5 5 5 5 5 5 5 5 4 4 4 4 4Nuclear 7 8 8 8 8 7 8 8 8 8 7 8 8 8 8 7 8 8 8 8 7 8 8 8 8
0
5
10
15
20
25
30
35
40
45
50
GW, SND Scenario 1: Current Outlook
Scenario 4:Decarbonized Future
Scenario 3: Economic Growth
Scenario 2:Stagnant Economy
Scenario 5:Distributed Marketplace
Strategy C: Market Supplied Resources
145

INTEGRATED RESOURCE PLAN – 2015 DRAFT REPORT
Appendix E
2015 2020 2025 2030 2033 2015 2020 2025 2030 2033 2015 2020 2025 2030 2033 2015 2020 2025 2030 2033 2015 2020 2025 2030 2033DR 2 2 2 2 2 2 2 2 2 2 2 2 2 2 2 2 2 2 2 2 2 2 2 2 2EE 0 1 2 4 5 0 1 2 4 5 0 1 2 4 5 0 1 2 4 5 0 1 2 4 5Gas CC 5 7 6 6 6 5 7 6 6 6 5 7 7 6 6 5 7 6 6 6 5 7 6 6 6Gas CT 5 6 7 8 9 5 6 6 6 7 5 6 7 9 9 5 6 6 6 6 5 6 6 6 6Renewables 0 1 1 2 2 0 1 1 2 2 0 1 2 3 3 0 1 2 3 3 0 1 1 1 1Coal 11 8 8 7 7 11 8 8 7 7 11 8 8 7 7 11 8 6 5 4 11 8 7 5 5Hydro 4 4 4 4 4 4 4 4 4 4 5 5 5 5 5 4 4 4 4 4 4 4 4 4 4Nuclear 7 8 8 8 8 7 8 8 8 8 7 8 8 8 8 7 8 8 8 8 7 8 8 8 8
0
5
10
15
20
25
30
35
40
45
50
GW, SND Scenario 1: Current Outlook
Scenario 4:Decarbonized Future
Scenario 3: Economic Growth
Scenario 2:Stagnant Economy
Scenario 5:Distributed Marketplace
Strategy D: Maximize EE
2015 2020 2025 2030 2033 2015 2020 2025 2030 2033 2015 2020 2025 2030 2033 2015 2020 2025 2030 2033 2015 2020 2025 2030 2033DR 1 1 1 2 2 1 1 2 2 2 2 1 2 2 2 1 1 1 2 2 1 1 1 1 2EE 0 1 2 3 3 0 1 2 3 2 0 1 2 3 3 0 1 2 3 3 0 1 2 2 2Gas CC 5 7 6 6 6 5 7 6 6 6 5 7 6 6 6 5 7 6 6 6 5 7 6 6 6Gas CT 5 6 6 6 7 5 6 6 6 7 5 6 7 8 9 5 6 6 6 6 5 6 6 6 6Renewables 0 1 3 4 5 0 1 3 4 5 0 2 3 5 6 0 1 3 4 5 0 1 2 4 4Coal 11 8 8 7 7 11 8 7 6 5 9 7 7 6 6 11 8 6 5 4 11 7 6 5 4Hydro 5 5 5 5 5 5 5 5 5 5 5 5 5 5 5 5 5 5 5 5 5 5 5 5 5Nuclear 7 8 8 8 8 7 8 8 8 8 7 8 8 8 8 7 8 8 8 8 7 8 8 8 8
0
5
10
15
20
25
30
35
40
45
50
GW, SND Scenario 1: Current Outlook
Scenario 4:Decarbonized Future
Scenario 3: Economic Growth
Scenario 2:Stagnant Economy
Scenario 5:Distributed Marketplace
Strategy E: Maximize Renewables
146

INTEGRATED RESOURCE PLAN – 2015 DRAFT REPORT
Appendix E
Below are the total energy charts that correspond to the capacity expansion plans above. The energy charts show total energy grouped by resource type (i.e., nuclear, hydro, coal, etc) over the planning horizon and are in terawatt hours, which is a 1,000 gigawatt hours.
Total Energy
2015 2020 2025 2030 2033 2015 2020 2025 2030 2033 2015 2020 2025 2030 2033 2015 2020 2025 2030 2033 2015 2020 2025 2030 2033EEDR 1 5 12 17 17 1 5 12 17 17 1 5 12 17 18 1 5 12 17 18 1 5 12 16 16Gas 23 31 30 36 37 23 26 24 30 38 25 25 28 31 29 21 13 12 17 18 20 22 17 19 25Renewables 6 6 8 10 16 6 6 6 8 6 6 7 10 14 25 6 22 25 27 32 6 6 6 8 5Coal 58 41 39 37 34 57 40 39 37 36 58 51 45 44 39 59 30 27 23 20 57 36 31 27 25Hydro 16 17 17 17 17 16 16 17 17 17 17 18 18 18 18 16 17 17 17 17 16 16 16 17 16Nuclear 55 67 69 67 68 55 67 69 67 68 55 67 69 67 68 55 67 69 67 68 55 67 69 67 68
0
50
100
150
200
TWh
Strategy A: The Reference Plan
Scenario 1: Current Outlook
Scenario 4:Decarbonized Future
Scenario 3: Economic Growth
Scenario 2:Stagnant Economy
Scenario 5:Distributed Marketplace
2015 2020 2025 2030 2033 2015 2020 2025 2030 2033 2015 2020 2025 2030 2033 2015 2020 2025 2030 2033 2015 2020 2025 2030 2033EEDR 1 5 12 17 17 1 5 12 17 17 1 5 12 17 18 1 5 12 18 18 1 5 12 16 16Gas 23 31 30 36 38 23 26 24 30 38 25 24 28 33 27 21 14 13 17 19 20 22 17 19 25Renewables 6 6 8 10 15 6 6 6 8 5 6 7 10 12 28 6 21 24 27 31 6 6 6 8 5Coal 58 41 39 37 34 57 40 39 37 36 58 51 45 45 38 59 30 27 23 20 57 36 31 27 25Hydro 16 17 17 17 17 16 16 17 17 17 17 18 18 18 18 16 17 17 17 17 16 16 16 17 16Nuclear 55 67 69 67 68 55 67 69 67 68 55 67 69 67 68 55 67 69 67 68 55 67 69 67 68
0
50
100
150
200
TWh
Strategy B: Meet an Emission Target
Scenario 1: Current Outlook
Scenario 4:Decarbonized Future
Scenario 3: Economic Growth
Scenario 2:Stagnant Economy
Scenario 5:Distributed Marketplace
147

INTEGRATED RESOURCE PLAN – 2015 DRAFT REPORT
Appendix E
2015 2020 2025 2030 2033 2015 2020 2025 2030 2033 2015 2020 2025 2030 2033 2015 2020 2025 2030 2033 2015 2020 2025 2030 2033EEDR 1 5 12 17 17 1 5 12 17 17 1 6 14 19 19 1 5 13 18 19 1 5 12 16 16Gas 23 31 29 32 35 23 26 24 28 36 25 23 26 28 27 21 14 12 16 17 20 22 16 17 21Renewables 6 6 8 10 12 6 6 7 9 6 6 8 10 15 25 6 22 24 27 31 6 6 6 8 6Coal 58 41 40 40 40 57 40 39 37 37 58 51 45 44 39 59 30 27 23 21 57 36 33 29 28Hydro 16 17 17 17 17 16 16 17 17 17 17 18 18 18 18 16 17 17 17 17 16 16 16 17 16Nuclear 55 67 69 67 68 55 67 69 67 68 55 67 69 67 68 55 67 69 67 68 55 67 69 67 68
0
50
100
150
200
TWh
Strategy C: Market Supplied Resources
Scenario 1: Current Outlook
Scenario 4:Decarbonized Future
Scenario 3: Economic Growth
Scenario 2:Stagnant Economy
Scenario 5:Distributed Marketplace
2015 2020 2025 2030 2033 2015 2020 2025 2030 2033 2015 2020 2025 2030 2033 2015 2020 2025 2030 2033 2015 2020 2025 2030 2033EEDR 1 5 13 24 29 1 5 13 24 29 1 5 13 24 29 1 5 13 24 29 1 5 13 24 29Gas 23 30 29 32 36 23 26 23 24 29 25 25 28 32 25 21 13 14 15 18 20 22 16 15 17Renewables 6 6 7 9 6 6 6 6 8 6 6 6 9 11 25 6 22 25 27 25 6 6 6 6 3Coal 58 42 39 35 34 57 40 38 35 33 58 51 45 39 33 59 30 23 19 17 57 36 31 26 23Hydro 16 17 17 17 17 16 16 17 17 17 17 18 18 18 18 16 17 17 17 17 16 16 16 16 16Nuclear 55 67 69 67 68 55 67 69 67 68 55 67 69 67 68 55 67 69 67 68 55 67 69 67 68
0
50
100
150
200
TWh
Strategy D: Maximize EE
Scenario 1: Current Outlook
Scenario 4:Decarbonized Future
Scenario 3: Economic Growth
Scenario 2:Stagnant Economy
Scenario 5:Distributed Marketplace
2015 2020 2025 2030 2033 2015 2020 2025 2030 2033 2015 2020 2025 2030 2033 2015 2020 2025 2030 2033 2015 2020 2025 2030 2033EEDR 1 5 12 17 17 1 5 12 16 16 1 5 12 17 17 1 5 12 17 18 1 5 11 13 12Gas 23 21 17 18 19 23 19 14 15 17 25 16 17 20 22 21 14 14 18 18 20 17 9 9 11Renewables 6 18 24 33 38 6 16 22 30 36 6 19 26 34 40 6 21 25 29 34 6 16 20 25 29Coal 57 37 35 30 28 56 37 32 29 26 57 47 41 35 32 58 30 23 19 17 57 31 25 22 19Hydro 17 18 18 18 18 17 18 18 18 18 17 18 18 18 18 17 18 18 18 18 17 18 18 18 17Nuclear 55 67 69 67 68 55 67 69 67 68 55 67 69 67 68 55 67 69 67 68 55 67 69 67 68
0
50
100
150
200
TWh
Strategy E: Maximize Renewables
Scenario 1: Current Outlook
Scenario 4:Decarbonized Future
Scenario 3: Economic Growth
Scenario 2:Stagnant Economy
Scenario 5:Distributed Marketplace
148

INTEGRATED RESOURCE PLAN – 2015 DRAFT REPORT
Appendix F
Appendix F - Method for Computing Environmental Metrics
149

INTEGRATED RESOURCE PLAN – 2015 DRAFT REPORT
Appendix F
Process In developing the criteria for the environmental impact metrics, TVA wanted to create a set of metrics representative of the trade-offs between energy resources rather than identifying a single resource with “best” environmental performance. By considering air, water and waste in the IRP scorecard, coupled with the broader qualitative discussion of anticipated environmental impacts in the EIS, a robust comparison of the environmental footprint of the planning strategies better informed the selection of the recommended strategy.
Method The environmental impact metrics can be grouped into two broad categories:
• Scoring metrics – these metrics will be used in the strategy scorecard to assess the performance of a given set of portfolios created by modeling that strategy across the scenarios used in the study.
• Reporting metrics – will be computed and included in the IRP report as informational or supplemental measures to help clarify or expand on the insights.
Three environmental impact metrics for air, water and waste were selected for scoring and two, air and waste, for reporting metrics. The scoring metrics are shown in Figure 1.
Scoring Metric Definition
CO2 Avg Tons The annual average tons of CO2 emitted over the study period
Water Consumption The annual average gallons of water consumed over the study period
Waste The annual average quantity of coal ash, sludge & slag projected based on energy production in each portfolio
Figure F-1: Scoring Metrics
The formulas used to calculate the scoring metrics are shown in Figure 2.
150

INTEGRATED RESOURCE PLAN – 2015 DRAFT REPORT
Appendix F
Figure F-2: Scoring Metric Formulas
The two reporting metrics are shown in Figure 3.
Reporting Metric Definition
CO2 Intensity The CO2 emissions expressed as an emission intensity; computed by dividing emissions by energy generated
Spent Nuclear Fuel Index A measure of the quantity of spent nuclear fuel that is projected to be generated based on energy production in each portfolio
Figure F-3: Reporting Metrics
The formulas for the reporting metrics are shown in Figure 4.
Figure F-4: Reporting Metric Formulas
151

INTEGRATED RESOURCE PLAN – 2015 DRAFT REPORT
Appendix F
Strategy Performance: Air Impact Metric
CO2 Scoring metric results:
Strategy A-The Reference Plan
Strategy B-Meet an Emission Target
20,000
30,000
40,000
50,000
60,000
70,000
80,000
Annu
al C
O2
Emiss
ions
in
Thou
sand
Ton
s 1A
2A
3A
4A
5A
20,000
30,000
40,000
50,000
60,000
70,000
80,000
Annu
al C
O2
Emiss
ions
in
Thou
sand
Ton
s 1B
2B
3B
4B
5B
152

INTEGRATED RESOURCE PLAN – 2015 DRAFT REPORT
Appendix F
Strategy C-Focus on Long-term, Market Resources
Strategy D-Maximize Energy Efficiency
Strategy E-Maximize Renewables
20,000
30,000
40,000
50,000
60,000
70,000
80,000
Annu
al C
O2
Emiss
ions
in
Thou
sand
Ton
s 1C
2C
3C
4C
5C
20,000
30,000
40,000
50,000
60,000
70,000
80,000
Annu
al C
O2
Emiss
ions
in
Thou
sand
Ton
s 1D
2D
3D
4D
5D
20,000
30,000
40,000
50,000
60,000
70,000
80,000
Annu
al C
O2
Emiss
ions
in
Thou
sand
Ton
s 1E
2E
3E
4E
5E
153

INTEGRATED RESOURCE PLAN – 2015 DRAFT REPORT
Appendix F
CO2 Reporting metric results:
Strategy A-The Reference Plan
Strategy B-Meet an Emission Target
150
200
250
300
350
400
450
500
Annu
al C
O2
Emiss
ions
Rat
e in
To
ns/G
Wh
1A
2A
3A
4A
5A
150
200
250
300
350
400
450
500
Annu
al C
O2
Emiss
ions
Rat
e in
To
ns/G
Wh
1B
2B
3B
4B
5B
154

INTEGRATED RESOURCE PLAN – 2015 DRAFT REPORT
Appendix F
Strategy C-Focus on Long-term, Market Resources
Strategy D-Maximize Energy Efficiency
Strategy E-Maximize Renewables
150
200
250
300
350
400
450
500
Annu
al C
O2
Emiss
ions
Rat
e in
To
ns/G
Wh
1C
2C
3C
4C
5C
150
200
250
300
350
400
450
500
Annu
al C
O2
Emiss
ions
Rat
e in
To
ns/G
Wh
1D
2D
3D
4D
5D
150
200
250
300
350
400
450
500
Annu
al C
O2
Emiss
ions
Rat
e in
To
ns/G
Wh
1E
2E
3E
4E
5E
155

INTEGRATED RESOURCE PLAN – 2015 DRAFT REPORT
Appendix F
Air Impact Metric Observations: • CO2 emissions vary largely by scenario but decline over time for all strategies • Strategies A,B and C have similar CO2 emission profiles across the scenarios, coming in
about 3 percent above Strategy D and about 10 percent above Strategy E • Strategy E achieves the lowest intensity at 296 tons/GWh, which is about 10 percent
lower than A, B and C and about 8 percent lower than D
Strategy Performance: Water Impact Metric Scoring metric results:
Strategy A-The Reference Plan
Strategy B-Meet an Emission Target
45,000
50,000
55,000
60,000
65,000
70,000
Annu
al W
ater
Con
sum
ptio
n in
M
illio
n Ga
llons
Year
1A
2A
3A
4A
5A
45,000
50,000
55,000
60,000
65,000
70,000
Annu
al W
ater
Con
sum
ptio
n in
M
illio
n Ga
llons
1B
2B
3B
4B
5B
156

INTEGRATED RESOURCE PLAN – 2015 DRAFT REPORT
Appendix F
Strategy C-Focus on Long-term, Market Resources
Strategy D-Maximize Energy Efficiency
Strategy E-Maximize Renewables
45,000
50,000
55,000
60,000
65,000
70,000
Annu
al W
ater
Con
sum
ptio
n in
M
illio
n Ga
llons
1C
2C
3C
4C
5C
45,000
50,000
55,000
60,000
65,000
70,000
Annu
al W
ater
Con
sum
ptio
n in
M
illio
n Ga
llons
1D
2D
3D
4D
5D
45,000
50,000
55,000
60,000
65,000
70,000
Annu
al W
ater
Con
sum
ptio
n in
M
illio
n Ga
llons
1E
2E
3E
4E
5E
157

INTEGRATED RESOURCE PLAN – 2015 DRAFT REPORT
Appendix F
Water Impact Metric Observations: • Average water consumption declines over time in all strategies. • Variation across scenarios within a particular strategy ranges from 10.5 percent for
Strategies A/B to 13.8 percent for Strategy D. This is largely driven by the variation in load growth in the different scenarios.
• Average water consumption across the five strategies ranges from 56,960 for Strategy E to 59,210 for Strategy C or 2,250 million gallons. This represents a variation of about 4 percent.
Strategy Performance: Waste Impact Metric Scoring metric results:
Strategy A-The Reference Plan
Strategy B-Meet an Emission Target
-
1,000,000
2,000,000
3,000,000
4,000,000
5,000,000
6,000,000
Annu
al P
rodu
ctio
n in
Ton
s
1A
2A
3A
4A
5A
-
1,000,000
2,000,000
3,000,000
4,000,000
5,000,000
6,000,000
Annu
al P
rodu
ctio
n in
Ton
s
1B
2B
3B
4B
5B
158

INTEGRATED RESOURCE PLAN – 2015 DRAFT REPORT
Appendix F
Strategy C-Focus on Long-term, Market Resources
Strategy D-Maximize Energy Efficiency
Strategy E-Maximize Renewables
-
1,000,000
2,000,000
3,000,000
4,000,000
5,000,000
6,000,000
Annu
al P
rodu
ctio
n in
Ton
s
1C
2C
3C
4C
5C
-
1,000,000
2,000,000
3,000,000
4,000,000
5,000,000
6,000,000
Annu
al P
rodu
ctio
n in
Ton
s
1D
2D
3D
4D
5D
-
1,000,000
2,000,000
3,000,000
4,000,000
5,000,000
6,000,000
Annu
al P
rodu
ctio
n in
Ton
s
1E
2E
3E
4E
5E
159

INTEGRATED RESOURCE PLAN – 2015 DRAFT REPORT
Appendix F
Strategy Performance: Waste Impact Metric
Reporting metric results:
The trends in the production of high-level waste, which is primarily spent nuclear fuel and other fuel assembly components, parallel those of nuclear fuel requirements and are the same for all alternative strategies and average 149.05 Tons/Year.
160

INTEGRATED RESOURCE PLAN – 2015 DRAFT REPORT
Appendix G
Appendix G - Method for Computing Valley Economic Impacts
161

INTEGRATED RESOURCE PLAN – 2015 DRAFT REPORT
Appendix G
Background Since the TVA Act promotes agricultural and industrial development as a core TVA responsibility, the economic well-being of Tennessee Valley (hereafter Valley) residents has been part of the TVA’s mission since 1933. In keeping with TVA’s core mission, the IRP scoring process incorporates a single economic impact metric for each strategy of every scenario under consideration. Per capita income is calculated in order to assess the relative impact of each strategy on the general economic conditions of in the TVA Region. This metric is used as one input into the overall IRP Scorecard used to evaluate alternative strategies. As second metric, Valley employment is also included in this appendix but is not part of the scorecard.
Process Overview Per capita income provides a single metric that broadly reflects the general economic well-being of Valley residents and is readily understandable and relatable. It is also one that will reflect the net effect of each strategy’s change in expenditures and electricity bills. Increases in TVA expenditures on labor, equipment and construction materials stimulate the economy. At the same time, increases in consumers’ electricity bills required to fund those operations and construction activities, reduce consumers’ disposable income. Lower disposable income limits consumer purchases on goods and services in the TVA Region. Since strategies that involve increasing in-Valley expenditures tend to require higher electricity bills, their impacts tend to be offsetting.
The PI+ Model by Regional Economic Models, Inc., hereafter referred to as REMI, is used to model the multiplier effects of each strategy’s expenditures that stimulate the regional economy and its electrical bills that dampen it. REMI is a general equilibrium model used by TVA for well over a decade and is currently in use by over 100 universities, state and local governments, utilities, and consulting firms throughout the U.S. and Europe. TVA’s model has been tailored to the TVA Region by county and optimized to capture the inter-industry and inter-regional linkages with surrounding counties and the rest of the United States. As shown in Figure B-1, the “direct effects,” i.e. changes in TVA expenditures and retail electricity bills, are input into REMI, which capture any multiplier effects and interactions within the regional economy.
162

INTEGRATED RESOURCE PLAN – 2015 DRAFT REPORT
Appendix G
Figure G-1: Input and Output Impacts
Strategy A of each scenario serves as the Reference Plan, so each strategy within each scenario is compared to Strategy A. Thus, increases in expenditures are only entered into REMI to the extent that they exceed Strategy A’s expenses. In this way REMI’s outputs are the impact on per capita income relative to the Reference Plan of each scenario. Methodology Each strategy has a different annual revenue requirement needed to fund its construction, generation, and energy efficiency programs. The difference between the Reference Plan and the other strategies’ revenue requirements are modeled as changes in the electricity bill for residential, commercial, and industrial customers. Ultimately, rate payers must fund any increase in TVA expenditures.
163

INTEGRATED RESOURCE PLAN – 2015 DRAFT REPORT
Appendix G
While increases in a strategy’s revenue requirements tend to reduce consumers’ ability to purchase goods and services, an increase in TVA expenditures stimulates economic activity, at least to the extent that they are purchased within the TVA Region. Expenditures that are almost exclusively sourced outside the TVA Region, such as fuel or purchased wind power from the Midwest, are excluded from TVA Region expenditures.
Since not all types of expenses have identical economic impacts, REMI was used to separately model the impact of renewable construction, non-renewable construction, non-fuel operation and maintenance (O&M), and energy efficiency expenses. In this way REMI identifies the ability of the TVA Region’s economy to supply the necessary inputs and to what extent they must be sourced outside the region. Since most new construction expenses are likely to be natural gas-fired power plants, REMI’s custom construction industry for natural gas-fired power plants was incorporated into the analysis. Similarly, since most new renewable construction in the TVA Region will be solar installations, REMI’s custom industry for solar plant construction was used. This delineation between types of construction expenditures enhanced the accuracy of the results and followed directly from stakeholder feedback after completion of the 2011 Integrated Resource Plan.
While there are ongoing national codes and standards that increase energy efficiency, TVA implements programs that expedite the adoption of energy efficient appliances and insulation that are over and above the minimum required. The economic impact of TVA investments in energy efficiency programs are modeled as eight new jobs in the TVA Region for each $1 million spent. Of the jobs created 20 percent fall in the utility industry, 20 percent in construction industry, and 60 percent in professional/scientific employment categories. All differences from the Reference Plan are annual values, so changes in per capita income are generated by year. The per capita income output models the trajectory of economic impacts over time. In order to rank and compare alternative strategies, the present value of the changes in per capita income is evaluated with a 2 percent discount rate from 2014 to 2033. A low 2 percent discount rate is employed, because the changes in per capita income were previously adjusted for inflation. Selecting a rate as high as 8 percent does not, however, materially impact the strategy rankings. The results are presented below for non-farm employment as well.
Overall Findings Figure B-2 provides changes in the TVA Region’s per capita income caused by each strategy. The difference in all scenarios for all strategies is quite small. From 2014 to 2033 the average percentage change in per capita income ranged from -0.01% to 0.03%. The results are expected to be small for several reasons. First, TVA’s revenue is a small percentage of the total TVA Region economy. In 2015, TVA’s revenues are expected to approach $11 billion, but the entire TVA Region economy is almost $430 billion. Second, all the proposed strategies are similar approaches to supplying the region’s power needs. Changing from one approach to another should not result in significant impacts on the economy as a whole.
164

INTEGRATED RESOURCE PLAN – 2015 DRAFT REPORT
Appendix G
Figure G-2: Results
Across the five scenarios, there are meaningfully different assumptions about economic conditions nationwide that impact the TVA Region’s standard of living. Per capita incomes are not, however, comparable across scenarios because the varying scenario assumptions generally overwhelm strategy-driven impacts.
Detailed Results – Current Outlook Scenario Scenario 1 -Current Outlook reflects the expected case assumptions about the general state of the economy and power markets. In this scenario we find that Strategy D, Maximize Energy Efficiency (EE), is the most beneficial. From 2014 to 2033 the present value of the changes in per capita income is $116 over and above what would have been available in the Reference Plan. To get a sense of what is driving the results, the changes in in-Valley expenditures are graphed alongside the changes in revenue requirements. Increasing in-Valley expenditures provide an economic stimulus, while increases in the revenue requirements dampen economic growth.
An important interpretation caveat is that REMI models different types of expenditures differently. Dollars spent on solar construction have a different impact from dollars spent on gas plant construction or energy efficiency. Nonetheless, comparing aggregate changes in in-Valley expenditures and revenue requirements can provide insights into the model’s result.
Scenario 1 Scenario 2 Scenario 3 Scenario 4 Scenario 5Avg. of Annual % Changes Current Stagnant Growth De-Carbonized Distributed
from Reference Plan Outlook Economy Economy Future MarketplaceB - Meet Emission Target 0.00% 0.01% -0.01% 0.00% 0.00%C - Focus on LT Market* 0.00% 0.01% 0.03% 0.01% 0.00%D - Maximize EE 0.02% 0.02% 0.02% 0.02% 0.02%E - Maximize Renewables -0.01% 0.00% 0.00% 0.00% -0.01%
Present Value of Per CapitaIncome (2013$)
A- Reference Plan $38,074 $36,206 $39,590 $37,502 $38,074B - Meet Emission Target $38,074 $36,208 $39,588 $37,501 $38,074C - Focus on LT Market* $38,073 $36,209 $39,602 $37,505 $38,073D - Maximize EE $38,080 $36,213 $39,597 $37,510 $38,081E - Maximize Renewables $38,069 $36,204 $39,588 $37,502 $38,069
* Full Name: Focus on Long-Term, Market-Supplied Resources
2014-2033Per Capita Income
165
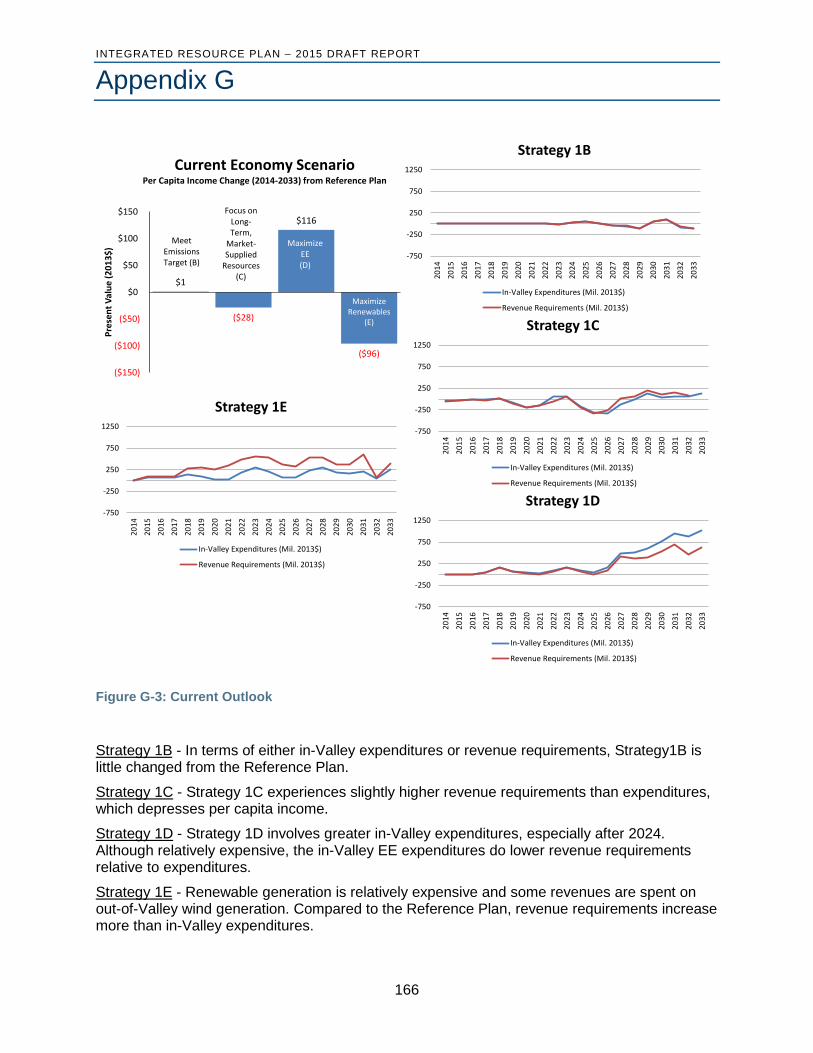
INTEGRATED RESOURCE PLAN – 2015 DRAFT REPORT
Appendix G
Figure G-3: Current Outlook
Strategy 1B - In terms of either in-Valley expenditures or revenue requirements, Strategy1B is little changed from the Reference Plan.
Strategy 1C - Strategy 1C experiences slightly higher revenue requirements than expenditures, which depresses per capita income.
Strategy 1D - Strategy 1D involves greater in-Valley expenditures, especially after 2024. Although relatively expensive, the in-Valley EE expenditures do lower revenue requirements relative to expenditures.
Strategy 1E - Renewable generation is relatively expensive and some revenues are spent on out-of-Valley wind generation. Compared to the Reference Plan, revenue requirements increase more than in-Valley expenditures.
-750
-250
250
750
1250
2014
2015
2016
2017
2018
2019
2020
2021
2022
2023
2024
2025
2026
2027
2028
2029
2030
2031
2032
2033
Strategy 1B
In-Valley Expenditures (Mil. 2013$)
Revenue Requirements (Mil. 2013$)
-750
-250
250
750
1250
2014
2015
2016
2017
2018
2019
2020
2021
2022
2023
2024
2025
2026
2027
2028
2029
2030
2031
2032
2033
Strategy 1C
In-Valley Expenditures (Mil. 2013$)
Revenue Requirements (Mil. 2013$)
-750
-250
250
750
1250
2014
2015
2016
2017
2018
2019
2020
2021
2022
2023
2024
2025
2026
2027
2028
2029
2030
2031
2032
2033
Strategy 1D
In-Valley Expenditures (Mil. 2013$)
Revenue Requirements (Mil. 2013$)
-750
-250
250
750
1250
2014
2015
2016
2017
2018
2019
2020
2021
2022
2023
2024
2025
2026
2027
2028
2029
2030
2031
2032
2033
Strategy 1E
In-Valley Expenditures (Mil. 2013$)
Revenue Requirements (Mil. 2013$)
$1
($28)
$116
($96)
($150)
($100)
($50)
$0
$50
$100
$150
Pres
ent V
alue
(201
3$)
MeetEmissions Target (B)
Focus on Long-Term,
Market-Supplied
Resources (C)
Maximize EE(D)
Current Economy ScenarioPer Capita Income Change (2014-2033) from Reference Plan
Maximize Renewables
(E)
166

INTEGRATED RESOURCE PLAN – 2015 DRAFT REPORT
Appendix G
Detailed Results – Stagnant Economy Scenario The Stagnant Economy scenario models a world in which economic growth fails to materialize as expected. Most strategies have a marginally positive impact, but the benefit of in-Valley EE expenditures gives Strategy D the largest gain.
Figure G-4: Stagnant Economy
Strategy 2B - In-Valley expenditures increase, but revenue requirements are only marginally higher.
Strategy 2C - Increases in in-Valley expenditures are consistently greater than the increases in revenue requirements.
Strategy 2D - Significant EE investments, modeled as all in-Valley jobs, result in higher in-Valley expenditures. Even though revenue requirements increase, in-Valley expenditures more quickly increase.
Strategy 2E - Higher cost renewables are less cost effective with limited sales growth and lighter carbon regulation.
-400-200
0200400600800
1,000
2014
2015
2016
2017
2018
2019
2020
2021
2022
2023
2024
2025
2026
2027
2028
2029
2030
2031
2032
2033
Strategy 2B
In-Valley Expenditures (Mil. 2013$)
Revenue Requirements (Mil. 2013$)
-400-200
0200400600800
1,000
2014
2015
2016
2017
2018
2019
2020
2021
2022
2023
2024
2025
2026
2027
2028
2029
2030
2031
2032
2033
Strategy 2C
In-Valley Expenditures (Mil. 2013$)
Revenue Requirements (Mil. 2013$)
-400-200
0200400600800
1,000
2014
2015
2016
2017
2018
2019
2020
2021
2022
2023
2024
2025
2026
2027
2028
2029
2030
2031
2032
2033
Strategy 2D
In-Valley Expenditures (Mil. 2013$)
Revenue Requirements (Mil. 2013$)
-400-200
0200400600800
1,000
2014
2015
2016
2017
2018
2019
2020
2021
2022
2023
2024
2025
2026
2027
2028
2029
2030
2031
2032
2033
Strategy 2E
In-Valley Expenditures (Mil. 2013$)
Revenue Requirements (Mil. 2013$)
$47
$67
$142
($34)($50)
($25)
$0
$25
$50
$75
$100
$125
$150
Pres
ent V
alue
(201
3$)
MeetEmissions Target (B)
Focus on Long-Term, Market-
Supplied Resources (C)
Maximize EE(D)
Maximize Renewables (E)
Stagnant Economy ScenarioPer Capita Income Change (2014-2033) from Reference Plan
167

INTEGRATED RESOURCE PLAN – 2015 DRAFT REPORT
Appendix G
Detailed Results – Growth Economy Scenario The Growth Economy Scenario models an environment of higher than expected economic growth and growing demand for power. This is the one scenario in which Strategy C, Focus on Long-Term, Market-Supplied Resources, provides the greatest benefit. This is largely driven by TVA’s presumed ability to secure 10-year PPA’s prior to the profitability of in-Valley solar generation. Strategy D that emphasizes energy efficiency programs is, however, the still second most beneficial.
Figure G-5: Growth Economy
Strategy 3B - In-Valley expenditures are generally lower and revenue requirements are flat.
Strategy 3C - Revenue requirements are driven down because TVA is able to sign 10-year Purchased Power Agreements with gas-fired power plant operators but afterwards builds solar generation as technological improvements make solar power more efficient.
-900-600-300
0300600900
1,200
2014
2015
2016
2017
2018
2019
2020
2021
2022
2023
2024
2025
2026
2027
2028
2029
2030
2031
2032
2033
Strategy 3B
In-Valley Expenditures (Mil. 2013$)
Revenue Requirements (Mil. 2013$)
-900-600-300
0300600900
1,200
2014
2015
2016
2017
2018
2019
2020
2021
2022
2023
2024
2025
2026
2027
2028
2029
2030
2031
2032
2033
Strategy 3C
In-Valley Expenditures (Mil. 2013$)
Revenue Requirements (Mil. 2013$)
-900-600-300
0300600900
1,200
2014
2015
2016
2017
2018
2019
2020
2021
2022
2023
2024
2025
2026
2027
2028
2029
2030
2031
2032
2033
Strategy 3D
In-Valley Expenditures (Mil. 2013$)
Revenue Requirements (Mil. 2013$)
-900-600-300
0300600900
1,200
2014
2015
2016
2017
2018
2019
2020
2021
2022
2023
2024
2025
2026
2027
2028
2029
2030
2031
2032
2033
Strategy 3E
In-Valley Expenditures (Mil. 2013$)
Revenue Requirements (Mil. 2013$)
($43)
$240
$147
($36)($50)
$0
$50
$100
$150
$200
$250
$300
Pres
ent V
alue
(201
3$)
Growth Economy ScenarioPer Capita Income Change (2014-2033) from Reference Plan
MeetEmissions
Target (B)
Focus on Long-Term,
Market-Supplied
Resources (C)
Maximize Renewables
(E)
Maximize EE (D)
168

INTEGRATED RESOURCE PLAN – 2015 DRAFT REPORT
Appendix G
Strategy 3D - EE expenditures, modeled as in-Valley jobs, ramp up dramatically beginning in 2023 and create a significant stimulus effect that more than offsets the increased cost.
Strategy 3E - Since wind is primarily located outside the Valley, focusing on renewables involves Valley residents paying for out-of-Valley generation. Through 2024 revenue requirements are generally greater than in-Valley expenditures.
Detailed Results – De-Carbonized Future Scenario The De-Carbonized Future Scenario models a regulatory environment in which there are significant carbon taxes that impact the relative efficiency of alternative strategies. As in all but one scenario, the stimulus impact of Strategy D’s in-Valley EE investments generates a marginally more positive economic impact than the other strategies.
Figure G-6: De-Carbonized Future
-400-200
0200400600800
1,000
2014
2015
2016
2017
2018
2019
2020
2021
2022
2023
2024
2025
2026
2027
2028
2029
2030
2031
2032
2033
Strategy 4B
In-Valley Expenditures (Mil. 2013$)
Revenue Requirements (Mil. 2013$)
-400-200
0200400600800
1,000
2014
2015
2016
2017
2018
2019
2020
2021
2022
2023
2024
2025
2026
2027
2028
2029
2030
2031
2032
2033
Strategy 4C
In-Valley Expenditures (Mil. 2013$)
Revenue Requirements (Mil. 2013$)
-400-200
0200400600800
1,000
2014
2015
2016
2017
2018
2019
2020
2021
2022
2023
2024
2025
2026
2027
2028
2029
2030
2031
2032
2033
Strategy 4D
In-Valley Expenditures (Mil. 2013$)
Revenue Requirements (Mil. 2013$)
-400-200
0200400600800
1,000
2014
2015
2016
2017
2018
2019
2020
2021
2022
2023
2024
2025
2026
2027
2028
2029
2030
2031
2032
2033
Strategy 4E
In-Valley Expenditures (Mil. 2013$)
Revenue Requirements (Mil. 2013$)
($18)
$65
$158
($9)($50)
$0
$50
$100
$150
$200
$250
$300
Pres
ent V
alue
(201
3$)
De-Carbonized Future ScenarioPer Capita Income Change (2014-2033) from Reference Plan
Lean on the Market
(C)
Do More EE (D)
MeetEmissions
Target(B)
Focus on Long-Term,
Market-Supplied
Resources (C)
Maximize Renewables
(E)
Maximize EE (D)
169

INTEGRATED RESOURCE PLAN – 2015 DRAFT REPORT
Appendix G
Strategy 4B - Strategy B’s revenue requirements and expenditures are little changed.
Strategy 4C - Revenue requirement growth is moderated by limited growth in the cost of purchased power. Expenses increase with in-Valley solar construction after 2019 and significant EE in 2024 & 2025.
Strategy 4D - Significant in-Valley EE expenditures begin in 2024.
Strategy 4E - Revenue requirements in 2016 through 2022 exceed in-Valley expenditures as out-of-Valley wind expenditures peak in 2019. After 2020 increases in Non-Fuel O&M and in-Valley Solar Construction expenses provide a stimulus.
Detailed Results – Distributed Marketplace Scenario The Distributed Marketplace Scenario models a world in which the economic and technological changes facilitate a shift toward distributed power generation. In this scenario, Strategy D offers the only approach that improves upon the Reference Plan.
-400-200
0200400600800
10001200
2014
2015
2016
2017
2018
2019
2020
2021
2022
2023
2024
2025
2026
2027
2028
2029
2030
2031
2032
2033
Strategy 5B
In-Valley Expenditures (Mil. 2013$)
Revenue Requirements (Mil. 2013$)
-400-200
0200400600800
1,0001,200
2014
2015
2016
2017
2018
2019
2020
2021
2022
2023
2024
2025
2026
2027
2028
2029
2030
2031
2032
2033
Strategy 5C
In-Valley Expenditures (Mil. 2013$)
Revenue Requirements (Mil. 2013$)
-400-200
0200400600800
1,0001,200
2014
2015
2016
2017
2018
2019
2020
2021
2022
2023
2024
2025
2026
2027
2028
2029
2030
2031
2032
2033
Scenario 5D
In-Valley Expenditures (Mil. 2013$)
Revenue Requirements (Mil. 2013$)
-400-200
0200400600800
1,0001,200
2014
2015
2016
2017
2018
2019
2020
2021
2022
2023
2024
2025
2026
2027
2028
2029
2030
2031
2032
2033
Scenario 5E
In-Valley Expenditures (Mil. 2013$)
Revenue Requirements (Mil. 2013$)
$0 ($31)
$136
($102)($150)
($100)
($50)
$0
$50
$100
$150
$200
$250
$300
Pres
ent V
alue
(201
3$)
Distributed Marketplace ScenarioPer Capita Income Change (2014-2033) from Reference Plan
Lean on the Market
(C)
Do More EE (D)
Maximize Renewables
(E)
Lean on the Market
(C)
Do More EE (D)
MeetEmissions
Target(B)
Focus on Long-Term, Market-
Supplied Resources
(C)
Maximize EE(D)
170

INTEGRATED RESOURCE PLAN – 2015 DRAFT REPORT
Appendix G Figure G-7: Distributed Marketplace
Strategy 5B - In-Valley expenditures and revenue requirements are little changed.
Strategy 5C – Changes in revenue requirements generally exceed in-Valley expenditures.
Strategy 5D - EE investments lift in-Valley expenditures above increases in revenue requirements.
Strategy 5E - Focusing on expensive --and often out-of-the-Valley wind-- renewables increases revenue requirements faster than in-Valley expenditures.
Conclusion There are multiple approaches to meeting the TVA region’s power needs. This analysis compared the economic impact of alternative strategies to that of the Reference Plan for every scenario. Each strategy involved changing the level of in-Valley expenditures and the magnitude of electricity bills required to satisfy each strategy’s funding needs. Using REMI’s PI+ general equilibrium model tailored to the TVA service territory, the impact on per capita income of alternative strategies for meeting power demand was evaluated. By using custom industry models and base REMI capabilities, the impacts of different types of expenditures (e.g., renewable construction, non-renewable construction, non-fuel O&M, etc.) were modeled explicitly.
Under most scenarios Strategy D, Maximize EE, generated the largest gains in per capita income over and above the Reference Plan. EE expenditures disproportionately remain in the Valley and dampen future electricity costs. Both factors tend to improve the relative performance of Strategy D. That being said, the impact of all alternative strategies on per capita income was exceptionally small. Across all scenarios and strategies the average percentage change in per capita income from 2014 through 2033 ranged from -0.01% to 0.03%. The present value of the stream of annual differences is small as well. Over a 20-year period, the “Maximize EE” strategy provides an additional benefit whose present value ranges from $116 to $158.
Other Reportable Metric Although not used in the analysis directly, percentage changes in Nonfarm employment from the Reference Plan are presented in this section. Like changes in per capita income, changes in nonfarm employment are very small.
171

INTEGRATED RESOURCE PLAN – 2015 DRAFT REPORT
Appendix G
Figure G-8: Nonfarm Employment
Scenario 1 Scenario 2 Scenario 3 Scenario 4 Scenario 5Avg. of Annual % Changes Current Stagnant Growth De-Carbonized Distributed
from Reference Plan Outlook Economy Economy Future MarketplaceB - Meet Emission Target 0.00% 0.03% -0.01% 0.00% 0.00%C - Focus on LT Market* 0.00% 0.04% 0.05% 0.02% 0.00%D - Maximize EE 0.06% 0.11% 0.06% 0.07% 0.08%E - Maximize Renewables -0.02% 0.02% -0.01% 0.00% -0.02%
Annual Average(Thousands)
A- Reference Plan 4,338 3,837 4,717 4,189 4,338B - Meet Emission Target 4,338 3,839 4,717 4,188 4,338C - Focus on LT Market* 4,338 3,839 4,720 4,189 4,338D - Maximize EE 4,341 3,841 4,720 4,192 4,342E - Maximize Renewables 4,337 3,838 4,717 4,188 4,337
* Full Name: Focus on Long-Term, Market-Supplied Resources
2014-2033NonFarm Employment
172