turkish power market monthly report (april 2012) -
TRANSCRIPT

Hydropower Investment Promotion Project (HIPP)
Turkish Power Market Monthly Report (April 2012)
This publication was produced for review by the United States Agency for International Development. It was prepared by Deloitte Consulting

Turkish Power Market Monthly Report (April 2012) USAID HYDROPOWER INVESTMENT PROMOTION PROJECT (HIPP) CONTRACT NUMBER: EEM-I-00-07-00005-0 DELOITTE CONSULTING LLP USAID/CAUCASUS OFFICE OF ENERGY AND ENVIRONMENT
DISCLAIMER: The author’s views expressed in this publication do not necessarily reflect the views of the United States Agency for International Development or the United States Government.
This document was prepared by
Author Organization Contact Details
Nikoloz Sumbadze Deloitte Consulting [email protected] +995-32-24-45-70/71
Reviewer Organization Contact Details
Neka Danelia Deloitte Consulting [email protected] +995-32-24-45-70/71
Adrian Rouse Deloitte Consulting [email protected] +995-599-28-72-07

TABLE OF CONTENTS EXECUTIVE SUMMARY ...................................................................................... 1
1. INTRODUCTION .......................................................................................... 2
2. SYNOPSIS OF TURKISH ENERGY ECONOMY ......................................... 3
3. SYNOPSIS OF TURKISH DAM ................................................................... 4
4. ANALYSIS OF TURKISH DAM ACTIVITIES IN APRIL 2012 ..................... 6 4.1. Price Sub Groups on the Turkish DAM ........................................................... 8 4.2. Price Curve Dynamics by Week-Days .......................................................... 10 4.3. DAM Volume Data Analysis .......................................................................... 11
APPENDIX ......................................................................................................... 13

Acronyms Used in this Report
CPI Consumer Price Index
DAM Day-Ahead Market
EMRA Energy Market Regulatory Authority
EUAS Electricity Generation Company (of Turkey)
EPIAS Turkish Energy Exchange (EnerjiPiyasalarıİşletmeAnonimŞirketi)
FDI Foreign Direct Investment
GW Gigawatt
GWh Gigawatt Hours
HIPP Hydropower Investment Promotion Project
HPP Hydro Power Plant
IFI International Financial Institutions
KGÜP Final Day Ahead Production / Consumption Program (KesinleşmişGünÖncesiÜretim/TüketimProgramı)
kWh Kilowatt Hours
MW Megawatt
MWh Megawatt Hours
PMUM Market Financial Reconciliation Center (Piyasa Mali UzlastirmaMerkezi)
SDV System Demand Volume
TEIAS Turkish Electricity Transmission Company
TL Turkish Lira
USD United States Dollar
USc US Dollar Cents
y-o-y Year Over Year

1|P a g e
Hydropower Investment Promotion Project Turkish Power Market Monthly Report
Executive Summary • USAID’s Hydropower Investment Promotion Project (HIPP) intends to help facilitate
private sector development of at least 400 MW of new, climate friendly hydropower in Georgia. This report has been published in support of this goal.
• Turkey has been identified as a potential export market for Georgian electricity. This report provides an analysis of power market prices and developments in Turkey, thereby enabling potential developers, governments, IFIs and other stakeholders to better understand the economics of investment into the Georgian hydropower market.
• The number of members registered on the DAM in April increased by 1.2% to 538 compared to 528 in March 2012.
• Total trading volume in Aprilreached 4,111GWh,a 0.6% increase on March.
• At 265.5 million USD, total turnover in the DAM for Aprilwas 7.54%lower than March.
• In April, trading volume in the DAM accounted for 24.45% of realized physical demand compared to 21.31% in March.
• DAM prices in Aprilpeakedat 10.10 USc/kWh. The average price during the month was 6.34 US c/kWh and the minimum price was 1.12 US c/kWh.
• April’s peak hours wererecorded during 11:00-12:00 on April 3rdand 4thwhen electricity demand in Turkey reached 28,830MWh on average for these days. Off-peak hourswere recorded during 02:00-06:00 on April 8th and 9th when electricity demand was 20,641MWh on average within these hours.
• Maximum SDV was 29,912MWh, whereas minimum and average SDV were 16,965MWh and 23,350MWh, respectively.
• Daily trading volumes on the DAM ranged from a low of 4,198MWh toa high of7,506MWh; the average daily trading volume was 5,709MWh.
• April was the fifth full month of activity on the DAM.

2|P a g e
1. Introduction
In early 2011, the USAID-funded Hydropower Investment Promotion Project (HIPP) created the Special Studies Group to provide analysis of the Georgian and regional electricity markets as well as to support the electricity market research needed for the Investment Promotion Group within HIPP. The Turkish electricity market is the focal point of energy sales from new Georgian HPPs and there appears to be strong interest in power market developments in Turkey from many potential HPP developers, governments, IFIs and others.By examining the hourly prices and volumes of the Turkish DAM, this report intends to provide stakeholders such as these with a better understandingof the economics of investment into the Georgian hydropower market. The report analyzes the hourly prices and volumes of the Turkish DAM for the examined month. Historical data on final day-ahead production volume, peak, off-peak and shoulder-peak prices used in this report are based on data available from the TEIAS/PMUM website1.TL/USD exchange rates have been calculated using data from the Central Bank of Turkey’s website, including weekend exchange rates that are calculated using the last preceding working days’ exchange rate. In addition, The Turkish Power Market Monthly Report examines total turnover changes together with DAM’s share in total forecasted demand. The figures on economic parameters are based on Central Bank of Turkey’s Monthly Price Development Report for April 2012 and its Inflation Report for Quarter II.The remainder of this report is structured as follows. Section 2 provides a brief overview of the Turkish energy economy and its main parameters. Section 3 provides an overview of the Turkish DAM and basic statistical information for April 2012. In addition, a comparison with February 2012 is conducted. Section 4 provides analysis of the Turkish DAM prices and volumes within monthly, weekly and hourly intervals, together with DAM volume data analysis.Finally,data sources and other relevant material are provided in the appendix.
1Market Financial Reconciliation Center, http://dgpys.teias.gov.tr/dgpys/

3|P a g e
2. Synopsis of Turkish Energy Economy
In April, inflation in Turkey persisted at relatively high levels. Consumer prices went up 1.52% over the month and annual Consumer Price Index (CPI)increased to 11.14%, compared to 10.4% in March. Higher electricity and natural gas tariffs were partly responsible for this increase. According to the Central Bank of Turkey and the Turkish Statistical Institute, energy prices increased by 3.06% in April over March, whileannual inflation in the energy items group rose to 16.1%. In spite of this, prices in the energy group excluding electricity and natural gas decreased in April parallel to the decline in international energy prices. Consequently, the energy group contributed 2.37% to April CPI. As stated in the Inflation Report, inflation is expected to increase in the coming months, but trend downwards to an annualized 7% at the end of the year.
During January-February 2012, Turkey’s foreign trade deficit was 12.6%, compared to 12.9% for the same period of the previous year. During this time, Turkey’s energy importbill increased by 23.8%to 9.2 billion USD,accounting for 72% of the foreign trade deficit.
In April, aside from changes in economic parameters, there were various developments in the Turkish energy sector which are worthy of mention. According to press reports, Energy Allied International is planning to build a coal gasification plant in the Aegean province of Manisa, where there are an estimated 800 million tons of lignite reserves. The proposed plant would convert coal into gas, which could be used in a variety of fields, including for thermal power plants.
Global investment bank, Goldman Sachs, has acquired a 13.3% share in Turkish utility company AksaEnerji for 240 million USD, from Kazanci Holding. Under the terms of the deal, Goldman Sachs reserves the right to sell the stakes back to Kazanci Holding for the same price after a period of six years. The deal also covers a 400 million USD loan for Kazanci Holding, financed by a consortium formed by Goldman Sachs, Garanti Bank and Is Bank.
By 2023, Turkey plans to have five nuclear power plants with a 10% share in its total electricity production, some of which may be fulfilled with Chinese partners, such as China’s state-owned energy company, China Guangdong Nuclear Power Holding Company, which has expressed interest in building Turkey’s second nuclear power plant in Sinop. Chinese investment would help Turkey attract some of the 110 billion USD of FDI it is targeting over the next five years.
In a related development, Turkey's state owned Electricity Generation Company (EUAS) and Canadian nuclear power Company, Candu Energy,signed anMoU to conduct feasibility studies on Turkey’s Black Sea coast. The cost of the plant is estimated to be in the range of 20 billion USD. Turkey had already signed a deal with Russian nuclear energy company Rosatom to build its first nuclear power plant in Akkuyu, near the Mediterranean coast in the southern province of Mersin. This plant is also expected to cost about 20 billion USD, and will be active for 60 years. The first unit of the power plant is
4|P a g e
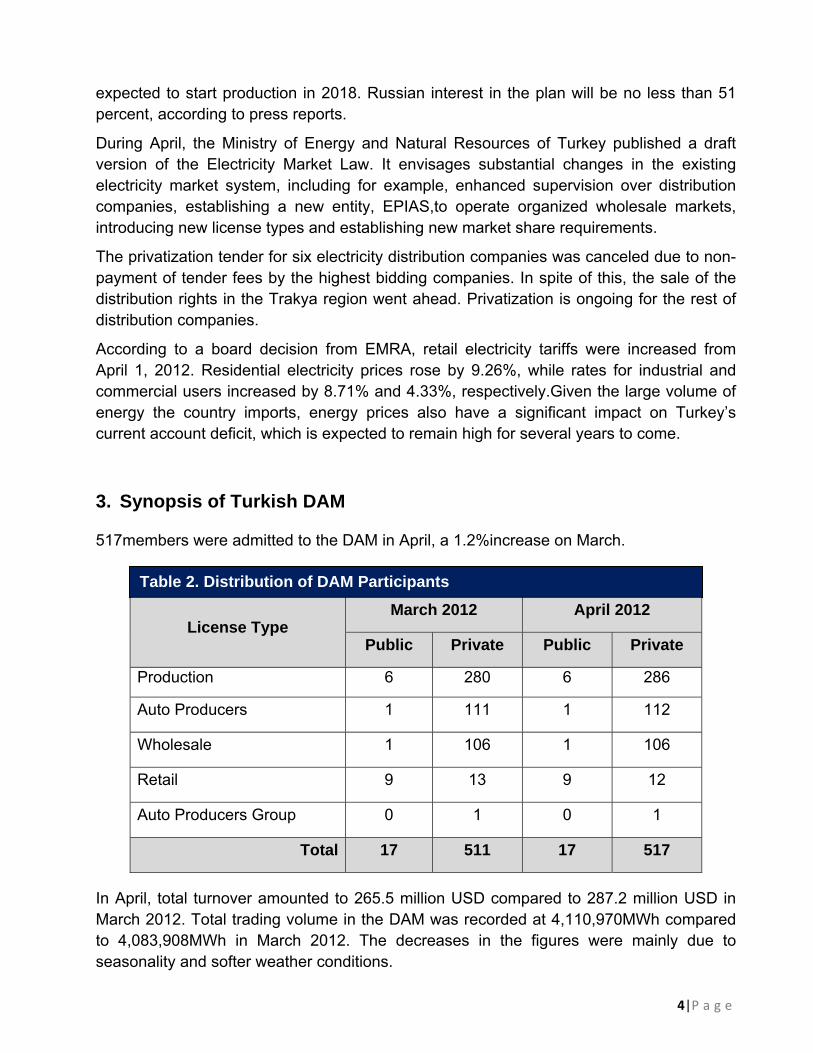
Table 2. Distribution of DAM Participants
expected to start production in 2018. Russian interest in the plan will be no less than 51 percent, according to press reports.
During April, the Ministry of Energy and Natural Resources of Turkey published a draft version of the Electricity Market Law. It envisages substantial changes in the existing electricity market system, including for example, enhanced supervision over distribution companies, establishing a new entity, EPIAS,to operate organized wholesale markets, introducing new license types and establishing new market share requirements.
The privatization tender for six electricity distribution companies was canceled due to non-payment of tender fees by the highest bidding companies. In spite of this, the sale of the distribution rights in the Trakya region went ahead. Privatization is ongoing for the rest of distribution companies.
According to a board decision from EMRA, retail electricity tariffs were increased from April 1, 2012. Residential electricity prices rose by 9.26%, while rates for industrial and commercial users increased by 8.71% and 4.33%, respectively.Given the large volume of energy the country imports, energy prices also have a significant impact on Turkey’s current account deficit, which is expected to remain high for several years to come.
3. Synopsis of Turkish DAM
517members were admitted to the DAM in April, a 1.2%increase on March.
License Type March 2012 April 2012
Public Private Public Private
Production 6 280 6 286
Auto Producers 1 111 1 112
Wholesale 1 106 1 106
Retail 9 13 9 12
Auto Producers Group 0 1 0 1
Total 17 511 17 517
In April, total turnover amounted to 265.5 million USD compared to 287.2 million USD in March 2012. Total trading volume in the DAM was recorded at 4,110,970MWh compared to 4,083,908MWh in March 2012. The decreases in the figures were mainly due to seasonality and softer weather conditions.

5|P a g e
Description 03/2012 04/2012 Change
Base Average (US c/kWh) 6.86 6.34 -7.58%
Peak Average Price (US c/kWh) 7.48 7.08 -5.35%
Off-Peak Average Price (US c/kWh) 5.82 4.48 -23.02%
Shoulder-Peak Average Price (US c/kWh) 6.98 6.87 -1.58%
Highest Price (US c/kWh) 11.95 10.10 -15.48%
Lowest Price (US c/kWh) 2.79 1.12 -59.86%
Total Turnover (USD) 287,203,805 265,538,930 -7.54%
Average Hourly Turnover (USD) 386,026 368,804 -4.46%
Maximum Hourly Turnover (USD) 900,598 693,095 -23.04%
Minimum Hourly Turnover (USD) 103,500 64,164 -38.01%
Average Weekdays Price (US c/kWh) 7.01 6.78 -3.28%
Average Weekdays Turnover (USD) 401,443 400,692 -0.19%
Average Weekend Price (US c/kWh) 6.49 5.33 -17.87%
Average Weekend Turnover (USD) 348,340 294,397 -15.49%
Description 03/2012 04/2012 Change
Total Volume (MWh) 4,083,908 4,110,970 0.66%
Highest Trading Volume (MWh) 8,107 7,506 -7.41%
Lowest Trading Volume (MWh) 3,391 4,198 23.80%
Average Trading Volume (MWh) 5,489 5,709 4.01%
Highest System Demand Volume (MWh) 31,143 29,912 -3.95%
Lowest System Demand Volume (MWh) 18,820 16,965 -9.86%
Average System Demand Volume (MWh) 25,759 23,350 -9.35%
Average Weekdays Trading Volume (MWh) 5,596 5,823 4.06%
Average Weekend Trading Volume (MWh) 5,227 5,443 4.13%
DAM’s share in total forecasted demand (%) 21.31 24.45 14.73%
Note:
Base average price contains an average of all the hourly prices in the examined periods. Peak, off-peak, and shoulder-peak average prices and the highest and lowest price contain prices for already determined peak, off-peak and shoulder-peak hours and maximum and minimum prices during the examined period. Total volume determines the volume of electricity traded in the DAM. System demand volume represents the total volume of electricity consumed in Turkey.
Table 3. Summary of Prices and Turnover Table 4. Summary of Volumes

6|P a g e
4. Analysis of Turkish DAM Activities in April 2012 The Turkish DAM is characterized by hourly and even weekly fluctuations in price spikes and production volumes. However, in the aggregate, trading volumes and clearing prices continue to grow. In April 2012, electricity production increased by around 3% compared with the previous year. Based on HIPP’s previous studies, this report uses three price clusters: peak, shoulder-peak and off-peak hours. During daytime, peak hours were categorized in 11:00-19:00 hours, whereas off-peak hours were between 02:00-08:00 and shoulder peak hours were 08:00-11:00 and 19:00-02:00.
PMUM’s web site provides day-ahead demand and production forecasts. Data is also provided on KGUP that is the final schedule of the next day’s production after day-ahead bidding2. HIPP uses KGUP as a proxy for demand on the Turkish power market.
Year Variables on Hourly Basis April, 2011 April, 2012 Change
DAM Price (US c/kWh)
Max 11.02 10.10 -8.35% Average 5.63 6.34 12.61%
Min 0.10 1.12 1020% Trading
Volume on the DAM (MWh)
Max 3437 7,506 118.39% Average 1079 5,709 429.10%
Min 69 4,198 5984%
System Demand Volume (MWh)
Max 27,010 29,912 10.74% Average 22,120 23,350 5.56%
Min 16,700 16,965 1.59%
The data in Table 5 shows there were considerable y-o-y change in key market variables. After March 2012, when electricity supply and prices were relatively stable,key market variables continued to show y-o-y increases in April 2012. On average, SDV demand increased by 5.56%in April 2012 while trading volumes and prices on the DAM tended to increase as well. In the examined month, DAM’s trading volumequadrupled when compared to April 2011, while prices showed a 12.61% y-o-y increase.
2We estimated the difference between actual monthly production and KGUP monthly production at 7.4% in March. (Total sum of KGUP production for March was 16,812 GWh, while for the same time period actual production was 18,163 GWh).
Table 5. Comparison of DAM variables

7|P a g e
012345678910
0
5
10
15
20
25
3000
:00‐01
:00
01:00‐02
:00
02:00‐03
:00
03:00‐04
:00
04:00‐05
:00
05:00‐06
:00
06:00‐07
:00
07:00‐08
:00
08:00‐09
:00
09:00‐10
:00
10:00‐11
:00
11:00‐12
:00
12:00‐13
:00
13:00‐14
:00
14:00‐15
:00
15:00‐16
:00
16:00‐17
:00
17:00‐18
:00
18:00‐19
:00
19:00‐20
:00
20:00‐21
:00
21:00‐22
:00
22:00‐23
:00
23:00‐24
:00
US c/kW
h
GWh
Average System Load in 2011 Average System Load in 2012
Average DAM Price in 2011 Average DAM Price in 2012
0
2
4
6
8
10
12
US c/kW
h
Daily Min Prices Daily Average Prices Daily Max Prices
Figure 1compares variationsin average system loads and pricesbetween April 2011 and April 2012. As can be seen, hourly system volume was higher in April2012 than in April 2011. DAM prices are also higher, peaking at 09:00-12:00 hours, compared to prices in April 2011.
Figure 1. Average System Load and Prices by Hours
Figure 2. Daily Minimum, Average and Maximum Prices in the DAM

8|P a g e
0
2
4
6
8
10
12
00:00‐01
:00
01:00‐02
:00
02:00‐03
:00
03:00‐04
:00
04:00‐05
:00
05:00‐06
:00
06:00‐07
:00
07:00‐08
:00
08:00‐09
:00
09:00‐10
:00
10:00‐11
:00
11:00‐12
:00
12:00‐13
:00
13:00‐14
:00
14:00‐15
:00
15:00‐16
:00
16:00‐17
:00
17:00‐18
:00
18:00‐19
:00
19:00‐20
:00
20:00‐21
:00
21:00‐22
:00
22:00‐23
:00
23:00‐24
:00
US c/kW
h
Hourly Min Prices Hourly Average Prices Hourly Max Prices
As can be seen inFigure 2, there were considerableprice spikes during April 2012. While DAM prices in April continued to decrease compared to March 2012, electricity prices were characterized with small fluctuations.April’s peak hours were recorded during 11:00-12:00 when electricity demand in Turkey reached 28,830 MWh on average for these days. Off-peak hours were recorded during 02:00-06:00 when electricity demand was 20,641 MWh on average for these days within those hours.
As shown in Figure 3, electricity spot prices in the DAM followed typical hourly trends and can be characterized asbasically stable.On average, pricesranged from 5–8 US c/kWh. Peak hours were between 09:00-18:00 when the highest electricity price was greater than 10 US c/kWh.
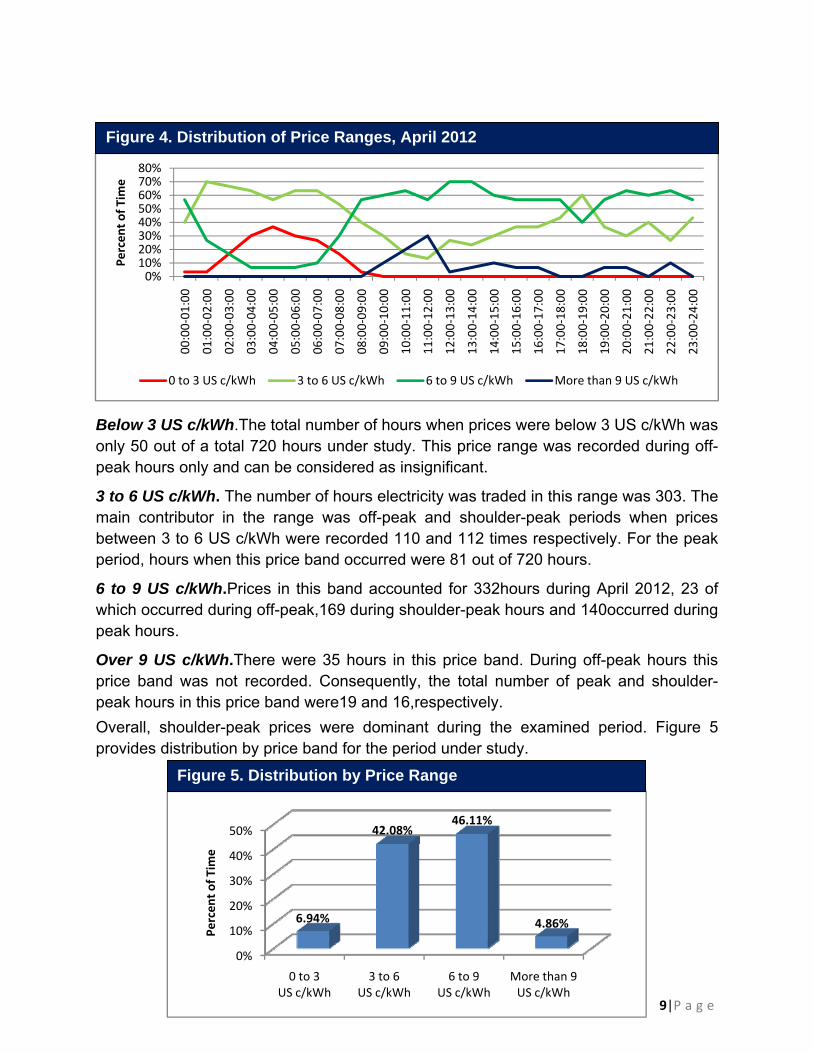
4.1. Price Sub Groups on the Turkish DAM In Figure 4, we use PMUM data to group April’shourly prices in four price bands. Based on our analysis, prices below 3 US c/kWh were recorded with the smallest share. Prices in the 3-6 US c/kWh range were mostly recorded in off-peak and shoulder-peak hours. Prices between 6-9 US c/kWh accounted for the largest share of market volume together with prices between 3-6 US c/kWh. Sales in this price bandsoccurred during working hours and had a significantly higher share of total volume. Prices above 9 US c/kWh were recorded mostly shoulder-peak and peak hours but had small share.
Figure 3. Hourly Minimum, Average and Maximum Price in the DAM, April 2012
9|P a g e
0%10%20%30%40%50%60%70%80%
00:00‐01
:00
01:00‐02
:00
02:00‐03
:00
03:00‐04
:00
04:00‐05
:00
05:00‐06
:00
06:00‐07
:00
07:00‐08
:00
08:00‐09
:00
09:00‐10
:00
10:00‐11
:00
11:00‐12
:00
12:00‐13
:00
13:00‐14
:00
14:00‐15
:00
15:00‐16
:00
16:00‐17
:00
17:00‐18
:00
18:00‐19
:00
19:00‐20
:00
20:00‐21
:00
21:00‐22
:00
22:00‐23
:00
23:00‐24
:00
Percen
t of T
ime
0 to 3 US c/kWh 3 to 6 US c/kWh 6 to 9 US c/kWh More than 9 US c/kWh
0%
10%
20%
30%
40%
50%
0 to 3 US c/kWh
3 to 6 US c/kWh
6 to 9 US c/kWh
More than 9 US c/kWh
6.94%
42.08%46.11%
4.86%
Percen
t of T
ime
Below 3 US c/kWh.The total number of hours when prices were below 3 US c/kWh was only 50 out of a total 720 hours under study. This price range was recorded during off-peak hours only and can be considered as insignificant.
3 to 6 US c/kWh. The number of hours electricity was traded in this range was 303. The main contributor in the range was off-peak and shoulder-peak periods when prices between 3 to 6 US c/kWh were recorded 110 and 112 times respectively. For the peak period, hours when this price band occurred were 81 out of 720 hours.
6 to 9 US c/kWh.Prices in this band accounted for 332hours during April 2012, 23 of which occurred during off-peak,169 during shoulder-peak hours and 140occurred during peak hours.
Over 9 US c/kWh.There were 35 hours in this price band. During off-peak hours this price band was not recorded. Consequently, the total number of peak and shoulder-peak hours in this price band were19 and 16,respectively. Overall, shoulder-peak prices were dominant during the examined period. Figure 5 provides distribution by price band for the period under study.
Figure 4. Distribution of Price Ranges, April 2012
Figure 5. Distribution by Price Range

10|P a g e
0% 20% 40%60%
80%100%
MonTueWedThuFriSatSun
13%8%
1%1%5%16%
30%35%
38%31%34%
65%60%
48%47%
51%64%
65%29%
24%
8%
9%
11%4%
1%
0 to 3 US c/kWh 3 to 6 US c/kWh 6 to 9 US c/kWh More than 9 US c/kWh
0
2
4
6
8
10
12
Mon Tue Wed Thu Fri Sat Sun
US c/kW
h
Minimum Average Maximum
4.2. Price Curve Dynamics by Week-Days Figure 6 shows that maximum and average electricity prices are high during weekdays, while electricity prices decrease during weekends, as electricity demand softens.
Figure 7 provides a comparision of price bands within weekdays. Prices below 3 USc/kWh were recorded onalmost all weekdays, however its share was insignificant. Prices between 3-6 USc/kWh occurred on all weekdays and had a considarable share together with prices between 6-9 US c/kWh. Also prices over 9 USc/kWh were recorded mostly during the middle of week but had a relatively low share. Pricemovements in April followed March’s weekly trend with some minor changes. Overall, prices between 3-6 and 6-9 US c/kWh were most common in weekly price breakdowns with 40% and 45% shareof the time.
Figure 6. Price Dynamics by Weekdays, April 2012
Figure 7. Price Range Breakdown by Weekdays

11|P a g e
15
17
19
21
23
25
27
29
400
450
500
550
600
650
Percen
t
GWh
System Daily Producation Share of DAM
0%5%
10%15%20%25%30%35%40%45%50%
0% 0%
16.11%
46.94%
34.72%
2.22%Percen
t of T
ime
Volume in Single Hour (MWh)
4.3.DAM Volume Data Analysis Figure 8 illustrates daily production in the entire Turkish power market and the share of the DAM.As can be seen, system loads are significantly lower during weekends in Turkey. However, trading volumes in the DAM did not follow this trendin April. This explains why thedashed line on the graph is acyclic to the system load, thereby indicating an increasing share of trading volume as a portion of total system load during weekends.
Figure 9 provides distribution of trading volume by groups in the Turkish DAM.
Figure 8. Daily Electricity Production and Share of the DAM
Figure 9. Trading Volume by Group in the DAM, April 2012

12|P a g e
4,0004,5005,0005,5006,0006,5007,0007,5008,000
00:00‐01
:00
01:00‐02
:00
02:00‐03
:00
03:00‐04
:00
04:00‐05
:00
05:00‐06
:00
06:00‐07
:00
07:00‐08
:00
08:00‐09
:00
09:00‐10
:00
10:00‐11
:00
11:00‐12
:00
12:00‐13
:00
13:00‐14
:00
14:00‐15
:00
15:00‐16
:00
16:00‐17
:00
17:00‐18
:00
18:00‐19
:00
19:00‐20
:00
20:00‐21
:00
21:00‐22
:00
22:00‐23
:00
23:00‐24
:00
MWh
Min DAM Volume Average DAM Volume Max DAM Volume
4,0004,5005,0005,5006,0006,5007,0007,5008,000
MWh
Min DAM Volume Average DAM Volume Max DAM Volume
Figure 10 represents minimum, average and maximum volume dynamics within 24 hours.
Figure 11 represents daily minimum, average and maximum volume dynamics within the examined period.
Figure 10. Hourly Minimum, Average and Maximum Volumes in the DAM, April 2012
Figure 11. Daily Minimum, Average and Maximum Volumes in the DAM, April 2012

13|P a g e
Appendix Source materials used in this report can be found at the following locations.
1. Hydropower Investment Promotion Project, www.hydropower.ge 2. Energy Market Regulatory Authority, www.emra.gov.tr 3. Market Financial Reconciliation Center (PMUM), dgpys.teias.gov.tr/dgpys/ 4. Market Financial Reconciliation Center (PMUM), www.pmum.gov.tr 5. Turkish Electricity Transmission Corporation, www.teias.gov.tr

14|P a g e
USAID Hydropower Investment Promotion Project (USAID-HIPP)
Deloitte Consulting Overseas Projects - HIPP
13th floor, 11, Apakidzestr, Tiflis Business Center,
Tbilisi, 0171, Georgia

15|P a g e