tunisia 2012 state of the water report -...
TRANSCRIPT


Tunisia 2012 State of the Water Report

Donor: African Water Facility/African Development BankGrant Recipient: CEDAREAWF Grant Agreement No.: 5600155002351Project ID No.: P-Z1-EAZ-027Document Name: Tunisia 2012 State of the Water ReportDocument Type: National ReportVersion: English, Final Version (V2)Countries: TunisiaRegion: North Africa Main Author: Mekki Hamza, Ph.D., Tunisia National Project Management Unit (NPMU)Contributors: Moncef Rekaya, Habib Chaieb, Lotfi Nacef, National Task Force, Tunisia NPMUSupervision & Review: Khaled AbuZeid, Ph.D., P.E.; Mohamed Elrawady, M.Sc., CEDAREDesign & Layout: Eng. Tamer El-HakimDocument Date: November, 2014
For reference purposes, this publication should be referred to as:Tunisia MAWRF, CEDARE, Hamza, M. (2014), “Tunisia 2012 State of the Water Report”, Monitoring & Evaluation for Water In North Africa (MEWINA) Project, Ministry of Agriculture, Water Resources & Fisheries (MAWRF) - Tunisia, Water Resources Management Program - CEDARE.

National Task Force
Abderrahman Ouasli Office of Planning and Hydraulic Equilibriums (BPEH)/ Agriculture
Samy Sellami National Water Distribution Utility (SONEDE)/ Agriculture
Fahmi Ben Abdeljaoued Directorate of Urban Hydraulic (DHU)/ Processing
Habib Omrane National Sanitation Utility (ONAS)/ Environment
Jamel Chellouf Directorate of Milieu Hygiene and Environmental Protection (DHMPE)/Health
Karim Salah National Institute of Statistics (INS)/ Development
Mohamed Nouira General Authority of the State Budget Disposal (CGABE)/ Financial
Hatem Baccour National Institute of Meteorology (INM)/ Transportation
Abdelghani Darghouthi Tunisian Company of Electricity and Gas (STEG)/ Industry and Energy
Hichem Khelfa General Directorate of Foreign Trade (DGCE)/ Trade and Handicrafts
Henda Mnacer Ben Hassine General Directorate of Water Resources (DGRE)/ Agriculture

Contents
1. Introduction . . . . . . . . . . . . . . . . . . . . . . . . . . . . . . . . . . . . . . . . . . . . . . . . . . . . . 12
2. National, Continental, and Global Targets . . . . . . . . . . . . . . . . . . . . . . . . . . . . . 15
2.1. Tunisia National Water Targets . . . . . . . . . . . . . . . . . . . . . . . . . . . . . . . . . . 15
2.2. African Water & Sanitation Targets . . . . . . . . . . . . . . . . . . . . . . . . . . . . . . . 17
2.3. Global Water Targets . . . . . . . . . . . . . . . . . . . . . . . . . . . . . . . . . . . . . . . . . . 19
2.4. Summary of National, Pan African and Global Indicators Monitored and Evaluated in Tunisia . . . . . . . . . . . . . . . . . . . . . . . . . . . . . . . . . . . . . .20
3. National State of the Water (SOW) Indicators . . . . . . . . . . . . . . . . . . . . . . . . . .25
3.1. National & Country Specific SOW Indicators . . . . . . . . . . . . . . . . . . . . . . .25
3.2. Shared Aquifer SOW Indicators . . . . . . . . . . . . . . . . . . . . . . . . . . . . . . . . . . 51
4. Indicators Values . . . . . . . . . . . . . . . . . . . . . . . . . . . . . . . . . . . . . . . . . . . . . . . . .56
4.1. The National SOW Data . . . . . . . . . . . . . . . . . . . . . . . . . . . . . . . . . . . . . . . .56
4.2. The North Western Sahara Aquifer SOW Data . . . . . . . . . . . . . . . . . . . . . .84
5. Analysis & Trends . . . . . . . . . . . . . . . . . . . . . . . . . . . . . . . . . . . . . . . . . . . . . . . .87
5.1. Analysis of the National State of Water . . . . . . . . . . . . . . . . . . . . . . . . . . . .87
5.2. Inventory of Available Historical Data for Each Indicator . . . . . . . . . . . . .89
6. Policy Recommendations . . . . . . . . . . . . . . . . . . . . . . . . . . . . . . . . . . . . . . . . . 125
References . . . . . . . . . . . . . . . . . . . . . . . . . . . . . . . . . . . . . . . . . . . . . . . . . . . . . . . 126
Annex . . . . . . . . . . . . . . . . . . . . . . . . . . . . . . . . . . . . . . . . . . . . . . . . . . . . . . . . . . . 128

List of Tables
Table 1. Summary table of water program (Budget Management by Objective BMO), with its objectives, indicators and targets for 2016 ... 15
Table 2. Target indicators, value, state, and possible reasons for deterioration or improvement ...................................................................................... 16
Table 3. African Water and Sanitation M&E, & Reporting: indicator, target, value, state and possible reasons for deterioration or improvement ..... 17
Table 4. Millennium Development Goals: indicator, target, value, state and possible reasons for deterioration or improvement ............................... 20
Table 5. Summary of national, pan African and global indicators monitored and evaluated in Tunisia ........................................................................ 20
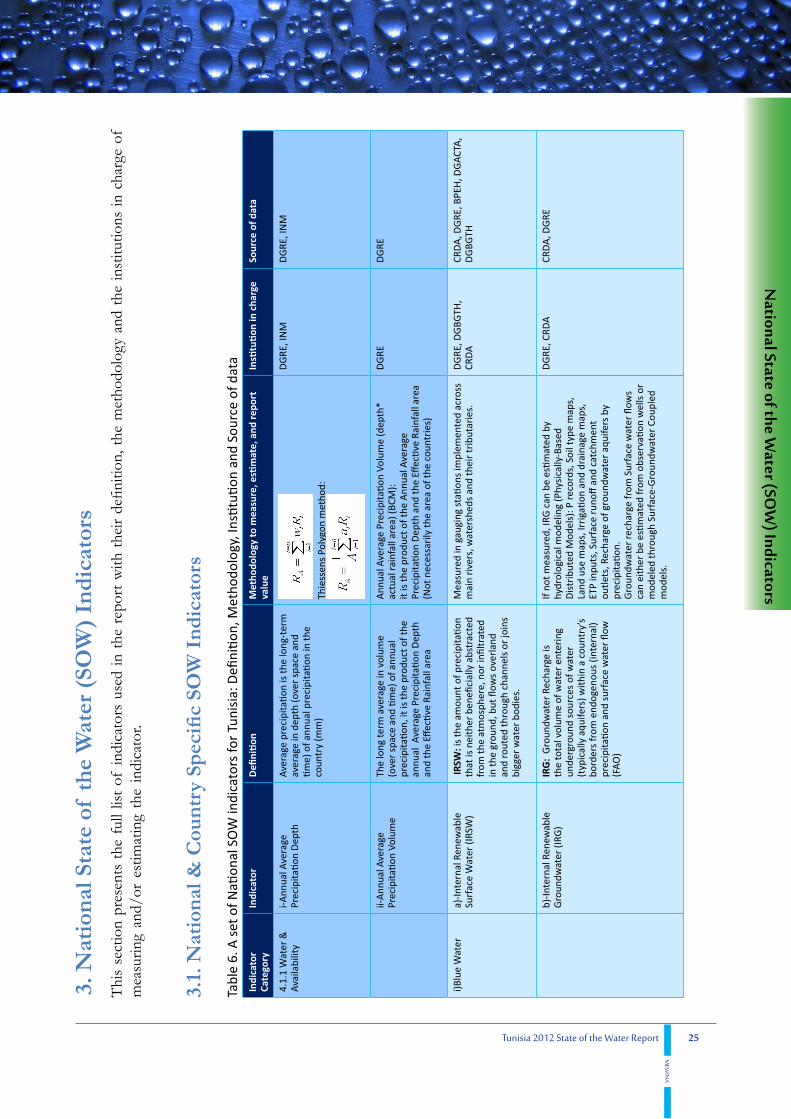
Table 6. A set of National SOW indicators for Tunisia: Definition, Methodology, Institution and Source of data ........................................ 25
Table 7. A new selected set of National SOW indicators for Tunisia ................... 46
Table 8. A selected set of NWSAS SOW indicators .............................................. 51
Table 9. National SOW data sheet indicating the values assigned to each indicator, unit, measurement year, and source ...................................... 56
Table 10. External surface water inflow and External Surface Water outflow in Tunisia ............................................................................................... 68
Table 11. Water Quality parameters (2012 data) .................................................... 75
Table 12. Bacteriological analysis, historical data (1995-2012) .............................. 76
Table 13. State of 2013 RAMSAR sites ................................................................... 76
Table 14. Virtual-water net flow: importation/exportation 2012 .......................... 80
Table 15. Commercial & Physical Water Losses on SONEDE networks (2012) . 82
Table 16. North Western Sahara Aquifer System data sheet indicating the values assigned to each indicator, unit, measurement year, and source 84
Table 17. Analysis of the National SOW (Additional specific indicators and Historical Data)...................................................................................... 87
Table 18. Inventory of available historical data, annual average, and 2012 values ..................................................................................................... 89
Table 19. Successive estimations of Tunisia Water Resources (1968-2005) in MCM/Year ............................................................................................. 99

Table 20: Withdrawals from dams ........................................................................ 101
Table 21. Withdrawals from shallow aquifers ....................................................... 102
Table 22. Withdrawals from deep aquifers included NRGW ............................... 103
Table 23. Withdrawals from desalinated water (SONEDE) ................................. 103
Table 23a. Green Water Consumption for Livestock Fodder Water Use (2002-2013) ....................................................................................................... 104
Table 24. Irrigated Areas (1000 ha) ....................................................................... 104
Table 25. Total Forest & Pasture Lands (ha) ........................................................ 105
Table 25a. Municipal & Industrial Wastewater Treatment Capacity, Historical Data (2008-2012) ................................................................... 109
Table 26. Installed Hydropower Capacity .............................................................111
Table 27. Population Growth (1921-2014) .............................................................. 113
Table 28. Water Quality Historical Data Wadi El Bey (2004-2012) ...................... 114
Table 29. Historical Data on Water & Health Indicators (2000-2013) ................. 115
Table 30. Number and Areas of Wetlands Sites, Historical Data (1981-2013) ..... 116
Table 31. Water & Governance indicators (2008-2013) ......................................... 124

List of Figures
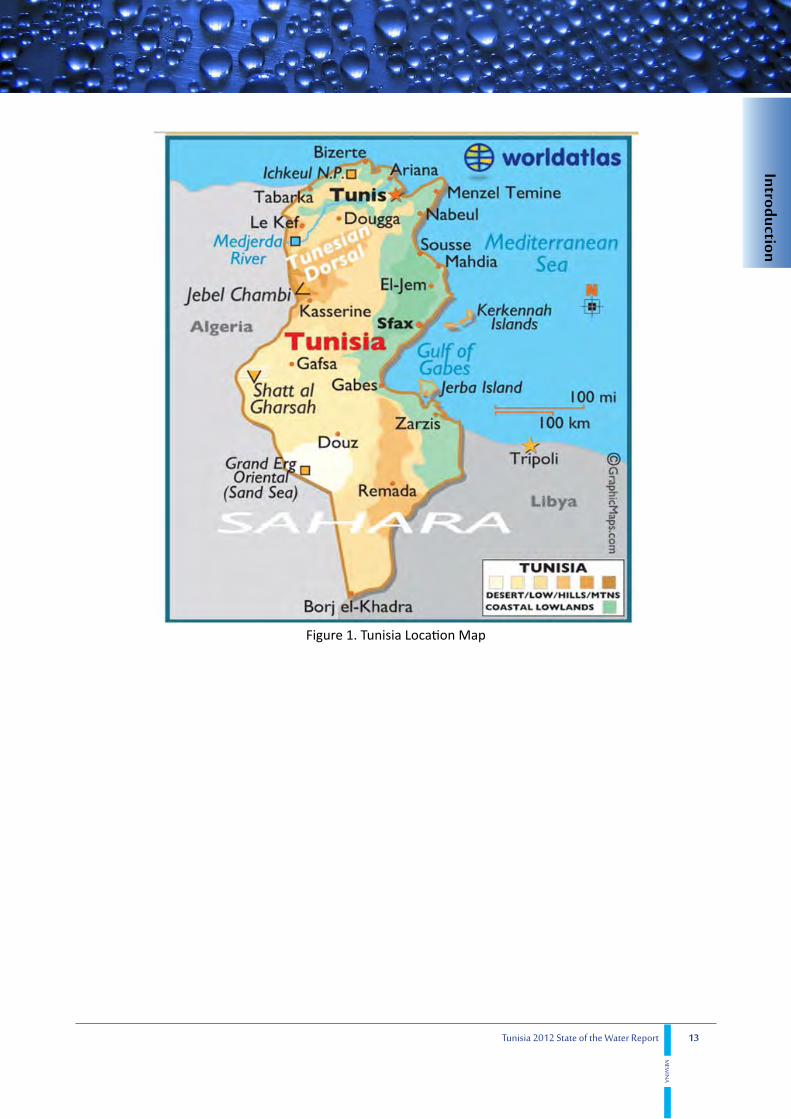
Figure 1. Tunisia Location Map . . . . . . . . . . . . . . . . . . . . . . . . . . . . . . . . . . . . . . 13
Figure 2. Tunisia Water Resources Map . . . . . . . . . . . . . . . . . . . . . . . . . . . . . . . . 14
Figure 3. Virtual-water net flow: importation/exportation 2012 (Graph) . . . . . . 81
Figure 4. Annual Average Precipitation, Historical Data (1983-2013) . . . . . . . . . 98
Figure 5. Successive estimations of Tunisia Water Resources (1968-2005) in MCM/Year . . . . . . . . . . . . . . . . . . . . . . . . . . . . . . . . . . . . . . . . . . . . . . 99
Figure 6. Hydrographic basins map (Distribution of surface water flows by watershed) . . . . . . . . . . . . . . . . . . . . . . . . . . . . . . . . . . . . . . . . . . . . . . 100
Figure 7. Evolution of Surface Water flows, Historical Data (1960-2005) . . . . . 100
Figure 8. Withdrawals from dams 2008-2013 (Graph) . . . . . . . . . . . . . . . . . . . . 102
Figure 9. Shallow Aquifers Withdrawals, Historical Data (1980-2010) . . . . . . . 102
Figure 10. Deep Aquifers Withdrawals, Historical Data (2001-2011) . . . . . . . . 103
Figure 11. Desalinated Water Withdrawals, Historical Data 2007-2012 (SONEDE) . . . . . . . . . . . . . . . . . . . . . . . . . . . . . . . . . . . . . . . . . . . . . . 103
Figure 12. Irrigated Area, Historical Data (1970-2011) . . . . . . . . . . . . . . . . . . . . 104
Figure 13. Total Forest and Pasture land, Historical Data (1995-2012) . . . . . . . 105
Figure 14. Water Supply Coverage indicators, Historical Data (1984-2012) . . . 106
Figure 15. Urban Sanitation Coverage, Historical Data (1994-2012) . . . . . . . . . 107
Figure 16. Water Supply Network Length, Historical Data (1983-2012) SONEDE . . . . . . . . . . . . . . . . . . . . . . . . . . . . . . . . . . . . . . . . . . . . . . . 108
Figure 17. Water Supply Network Length, Historical Data (1965-2012) DGGREE . . . . . . . . . . . . . . . . . . . . . . . . . . . . . . . . . . . . . . . . . . . . . . . 108
Figure 18. Length of ONAS Sewage pipe Networks, Historical Data (1975-2012) . . . . . . . . . . . . . . . . . . . . . . . . . . . . . . . . . . . . . . . . . . . . . . . . . . . 109
Figure 19. Electricity Generated Using Hydropower, Historical Data (2000-2012) . . . . . . . . . . . . . . . . . . . . . . . . . . . . . . . . . . . . . . . . . . . . . . . . . . . 110
Figure 20. Installed Hydropower Capacity, Historical Data (1956-2013) . . . . . 112
Figure 21. Population Growth, Historical Data (1921-2014) . . . . . . . . . . . . . . . . 113
Figure 22. Historical Data on Water & Health Indicators (2000-2013) . . . . . . . 116

Photos
Photo 1. Turbining (Beni Metir Dam) . . . . . . . . . . . . . . . . . . . . . . . . . . . . . . . . .111
Photo 2. Hydro electricity Generation . . . . . . . . . . . . . . . . . . . . . . . . . . . . . . . . .112
Photo 3. Overflow of wadi Medjerda . . . . . . . . . . . . . . . . . . . . . . . . . . . . . . . . . .119
Photo 4. Flooded Mabtouh Plain downstream of wadi Medjerda . . . . . . . . . . . .120
Photo 5. Flood Event in September 2009 in Redeyef –Gafsa (Destruction of the CPG railway in Redeyef) . . . . . . . . . . . . . . . . . . . . . . . . . . . . . . .120
Photo 6. Flood Event in September 2009 in Redeyef –Gafsa (Destruction of the irrigation pipe of Tabedit-Richet Naam) . . . . . . . . . . . . . . . . . .121
Photo 7. Flood Event in September 2009 in Redeyef –Gafsa (Destruction of works of water and soil conservation in Tarfaoui river) . . . . . . . . .121
Figure 23. Number and Areas of Wetlands Sites, Historical Data (1981-2013) . 117
Figure 24. Ramsar Wetlands map . . . . . . . . . . . . . . . . . . . . . . . . . . . . . . . . . . . . 118
Figure 25. Chronology of Droughts-Floods in Tunisia, Historical Data (861-2005) . . . . . . . . . . . . . . . . . . . . . . . . . . . . . . . . . . . . . . . . . . . . . . . 122
Figure 26. Water & Governance indicators 2008-2013 (Graph) . . . . . . . . . . . . . 124

List of Abbreviations and Acronyms
AfDB: African Development Bank
AMCOW: African Ministers’ Council On Water
ANGED: Agence Nationale de Gestion des Déchets
ANPE: Agence Nationale de Protection de l’Environnement
AUE: Association d’Usagers de l’Eau
AWC: Arab Water Council
BAD: Banque Africaine de Développement
BCM: Billion Cubic Meters
BIRD: Banque Internationale de Reconstruction et de Développement
BIRH: Bureau de l’Inventaire et des Recherches Hydrauliques
BPEH: Bureau de Planification et des Equilibres Hydrauliques
CEDARE: Center for Environment & Development for the Arab Region & Europe
CGABE: Comité Général de l’Administration du Budget de l’Etat
CITET: Centre International des Technologies de l’Environnement
CM: Cubic Meters
COPEAU: Contrôle de la Pollution des Eaux
CRDA: Commissariat Régional au Développement Agricole
DGACTA: Direction Générale d’Aménagement et de Conservation des Terres Agricoles
DGBGTH: Direction Générale des Barrages et des Grands Travaux Hydrauliques
DGCE: Direction Générale du Commerce Extérieur
DGDD: Direction Générale du Développement Durable
DGEDA: Direction Générale des Etudes et du Développement Agricole
DGEQV: Direction Générale de l’Environnement et de la Qualité de la Vie
DGGREE: Direction Générale du Génie Rural et de l’Exploitation des Eaux
DGRE: Direction Générale des Ressources en Eau
DHMPE: Direction de l’Hygiène du Milieu et de la Protection de l’Environnement
DHU: Direction de l’Hydraulique Urbaine
EMWIS: Euro-Mediterranean Water Information System

EUT: Eaux Usées Traitées
FAE: Facilité Africaine de l’Eau
FAO: Food and Agriculture Organization of the United Nations
GDA: Groupement de Développement Agricole
GIS: Geographic Information System
GR: Génie rural
GWh: Gigawatts/hour
GWP: Global Water Partnership
INM: Institut National de la Météorologie
INRGREF: Institut National de Recherche en Génie Rural, Eaux et Forêts
INS: Institut National de la Statistique
IWRM: Integrated Water Resources Management
JMP: Joint Monitoring Program for water supply and sanitation, dirigé par OMS/UNICEF
MCM: Million Cubic Meters
M&E: Monitoring and Evaluation
M&E&R: Monitoring , Evaluation and Reporting
MARH: Ministère de l’Agriculture et des Ressources Hydrauliques
MDGs: Millennium Development Goals
MEWINA: Monitoring & Evaluation for Water In North Africa
Mm3/Year: Million cubic meters per year
MW: Megawatt
NA: Not Available
N-AMCOW: Northern Region of the African Ministerial Council on Water
NT: Norme Tunisienne
NWSAS: North Western Sahara Aquifer System
OMD: Objectifs du Millénaire pour le Développement
OMS: Organisation Mondiale de la Santé
ONAS: Office National de l’Assainissement
ONG: Organisation non gouvernementale

OSS: Observatoire du Sahara et du Sahel
OTEDD: Observatoire Tunisien de l’Environnement et du Développement Durable
OTH: Office du Thermalisme et d’Hydrothérapie
PIB: Produit Intérieur Brut
PISEAU: Projet d’Investissement dans le Secteur de l’Eau
PNEE: Programme National d’Economie d’Eau
PNUD: Programme des Nations Unies pour le Développement
RAR: Rapid Assessment Report
RWSS: Rural Water Supply and Sanitation
SAEP: Système d’Alimentation en Eau Potable
SASS: Système Aquifère du Sahara Septentrional
SECADENORD: Société d’Exploitation du Canal et des Adductions des Eaux du Nord.
SEMIDE: Système Euro-méditerranéen d’Information de l’Eau
SINEAU: Système d’information National sur l’Eau
SISOLS: Système d’Information sur les Sols
SONEDE: Société Nationale d’Exploitation et de Distribution des Eaux
SOW: State Of the Water
STEG: Société Tunisienne d’Electricité et du gaz
SYCOHTRAC: Système de Collecte des Mesures Hydrologiques en Temps Réels et Annonce des Crues
SYGREAU: Système de Gestion des Ressources en Eau
TDN: Tunisian Dinar
UNESCO: United Nations Education, Science and Culture Organization
UWSS: Urban Water Supply and Sanitation
WSS: Water Supply and Sanitation
WWTP: Waste Water Treatment Plant

12 Tunisia 2012 State of the Water Report
MEW
INA
1. IntroductionThis report is conducted in the framework of MEWINA project in execution of the component relating to the standardization and harmonization of national systems with those of N-AMCOW and the development of a sustainable mechanism for monitoring, evaluation and reporting.
After the development of a minimum set of indicators, standards and criteria; of a framework and operational guidelines of the state of the national water monitoring and evaluation, and after the compilation of existing data and information on the monitoring and evaluation of the water sector and sanitation; it is important to continue the process and prepare the National Baseline Report State of the water for the country. This methodological guideline will not only monitor progress and performances achieved in the country to meet the objectives of national, regional and global targets in the water and sanitation sector, but also will prepare Baseline State of the Water Report in the N- AMCOW region.
Although efforts have been made in the country for the reporting of monitoring and evaluation of water sector, this National Baseline State of the Water Report proposes to bring together existing indicators, process, and integrate the most useful and the most relevant of them with the SOW indicators harmonized regionally by the MEWINA project, to stop a new set of indicators to be regularly monitored and evaluated in the country in harmony with the SOW indicators in N-AMCOW region.
The first part focused on nationally set water related targets in Tunisia, as well as continental and global targets that have been adopted. The current standings towards achieving all targets were mentioned. In addition, values were assigned for the target indicators presented.
The second part presents the full list of indicators used in the report and all indicators belong to one of the agreed indicator categories, during the MEWINA Water M&E Rapid Assessment Regional Validation Workshop held in Cairo on October 27th-29th 2013. Definitions, methodologies of calculation and reporting, institutions in charge of measuring and/or estimating indicator, and source of data were outlined in this section as well.
The following section consists of a data sheet indicating the values assigned to each indicator, for the year 2012, along with the units of measurement, the measurement year, the source, and any remarks.
Then, an overall analysis of the national state of the water is provided and an inventory of available historical data for some indicators and observed trends is given.
Finally the last part recommends policy reforms to enhance the state of the water Reporting process in general.
13
Introduction
Tunisia 2012 State of the Water Report
MEW
INA
Figure 1. Tunisia Location Map

14 Tunisia 2012 State of the Water Report
MEW
INA
Figure 2. Tunisia Water Resources Map

15
National, Continental, and G
lobal Targets
Tunisia 2012 State of the Water Report
MEW
INA
2. National, Continental, and Global Targets2.1. Tunisia National Water Targets
Table 1. Summary table of water program (Budget Management by Objective BMO), with its objectives, indicators and targets for 2016
Objective Indicator Target Definition Methodology of Calculation
Mobilization of water resources
1-Storage capacity of large dams
1-Achieve a capacity of 2438 Mm3/year in 2016
(Start date: 2010, Start volume: 2077 Mm3)
Total storage volume of fresh water natural lakes and reservoirs created by large dams
Technical design data drawings for manmade reservoirs; hydrographic surveys and bathymetric maps in case of natural lakes
2-Capacity North Water Transfer
2- Achieve transferred volumes of 800 Mm3/year in 2016 (Start date:2010, Start volume: 700 Mm3)
Total transfer capacity of North water network
Technical design data drawings for pumping stations, manmade reservoirs; hydrographic surveys and networks.
3- Mobilization of Surface Water
3- Achieve mobilized volumes of 2355 Mm3/year in 2016
(Start date: 2010, Start volume:2144 Mm3)
Total annual volumes mobilized by all dams relative to the potential of surface water that can be technically mobilized
Total annual volumes mobilized by all dams / Potential of surface water that can be technically mobilized that is 2,5 billions m3 /year
4- Exploitation of groundwater
4- Achieve exploited volumes of 2262 Mm3/year in 2016
(Start date: 2010, Start volume:2121 Mm3)
Total annual volumes abstracted from groundwater sources and wells including non renewable resources per year
Total annual volumes abstracted from groundwater sources and wells including non renewable resources per year. Field surveys or estimation using well licenses and irrigation permissions.
Saving water and reducing losses
5-Equipment of irrigable areas by water saving equipment
5- Achieve an equipment rate of 93 % in 2016
(Start date: 2010, Start rate: 86 %)
Total area equipped with sprinklers, drip irrigation, localized irrigation concreted seguias/ Total irrigable area.
Total area equipped with sprinklers, drip irrigation, localized irrigation concreted seguias (ha)/ Total irrigable area (ha).
6- Coverage of operating and maintenance costs of irrigation systems and rural drinking water supply
6- Achieve a coverage rate of 90 % for rural drinking water supply and 83% for irrigation systems in 2016
(Start date: 2010, Start rate: 83 % for DWS)
(Start date: 2010, Start rate: 60 % for IS)
0perating and maintenance costs paid by users/Actual operating and maintenance costs
0perating and maintenance costs paid by users/Actual operating and maintenance costs for rural drinking water supply (TDN)
0perating and maintenance costs paid by users/Actual operating and maintenance costs for irrigation systems (TDN)

16 Tunisia 2012 State of the Water Report
MEW
INA
7- Renovation of networks, rehabilitation and development of irrigation
7- Development and operation input of 11 000 ha obsolete irrigated area in 2016
(Start date: 2013, Start OIA: 4000 ha)
Modernization of irrigation networks, and rehabilitation & development of irrigated land
Surface of obsolete irrigated area, modernized, rehabilitated and back in operation (ha)
8- Improving the efficiency of irrigation systems on farms
8- Achieve efficiency rate of 78% in 2016
(Start date: 2010, Start rate: 76 % )
Amounts of water distributed in head parcel of the farm, less losses in the farm network in comparison to total amounts of water distributed in head parcel.
(Amounts of water distributed in head parcel - losses in the farm network)/ Total amounts of water distributed in head parcel of the farm.
Rural water supply 9- Drinking water supply in rural areas
9- Achieve coverage rate of 98% in 2016
(Start date: 2010, Start rate: 93,5% )
Percentage of population provided with piped or improved drinking- water source in rural areas
Population provided with piped or improved drinking- water source in rural areas / Total population in rural areas.
Preservation and sustainable water resources management
10- Annual rate of aquifers artificial recharge
10- Achieve an injection volume of 27,2 Mm3 per year in 2016
(Start date: 2012, Start rate: 16,8 % )
Volume of injected water actually reaching the saturated zone/Total volume of water from different sources, injected into overexploited aquifers, accusing a piezometric decline.
Volume of injected water actually reaching the saturated zone/Total volume of water injected into overexploited aquifers.
11- Quantities of treated wastewater reused in agricultural irrigation
11- Achieve a volume of 22 Mm3/year 2016 (Start date: 2010, Start volume:16 Mm3)
Quantity of treated wastewater from WWTP that is reused in a given year in agricultural irrigation
Quantity of treated wastewater from WWTP that is reused in a given year in agricultural irrigation
The table above presents the state of water target indicators program of the Ministry of Agriculture (in charge of water) with the objectives, targets, definitions and methods of calculation. This program includes 11 target indicators, among which 9 indicators have been incorporated and retained in the New National SOW set of indicators. The remaining target indicators are not relevant and scalable and have not been selected with the SOW indicators. The retained target indicators are presented in the following table:
Table 2. Target indicators, value, state, and possible reasons for deterioration or improvement
Indicator Category Indicator TargetValue for target
indicator State of the indicator
Possible reasons for deterioration or improvement2010 2011 2012
Water & Availability
(Blue Water)
3-Mobilization of Surface Water
Achieve mobilized volumes of 2355 Mm3/year in 2016
2144 2144 2188 Improvement Achievement of new dams
Water & Availability
(Non Conventional Water)
11-Treated wastewater reused in agricultural irrigation
Achieve a volume of 22 Mm3/year 2016
16 17 17 Stable Farmers unwillingness

17
National, Continental, and G
lobal Targets
Tunisia 2012 State of the Water Report
MEW
INA
Water & Consumption
4-Withdrawals from Blue Groundwater
Achieve exploited volumes of 2262 Mm3/year in 2016
2121 2147 2172 Slight improvement
-New permits
-New shallow and deep wells
8-Improving the efficiency of irrigation systems on farms
Achieve efficiency rate of 78% in 2016
76 76 77 Slight improvement
-
5-Equipment of irrigable areas by water saving equipment
Achieve an equipment rate of 93 % in 2016
86 86 88 Slight increase -
Water & Finance 6- Coverage of operating and maintenance costs of irrigation systems and rural drinking water supply
Achieve a coverage rate of 90 % for rural drinking water supply in 2016
83 83 66 Deterioration Revolution
Achieve a coverage rate of 83% for irrigation systems in 2016
60 60 64 Slight increase -
Water & services
(Water Coverage and Accessibility)
9-Rural Water Supply Coverage
Achieve a coverage rate of 98% in 2016
93.5 95.4 96.2 Improvement Achievement of new rural drinking water supply sys-tems (RDWSS)
Water & services
(Water Infrastructure)
1-Dams capacity Achieve a capacity of 2438 Mm3/year in 2016
2077 2077 2152 Improvement Achievement of new dams
2-Transfer Capacity of Water resources (Northern waters)
Achieve transferred volumes of 800 Mm3/year in 2016
700 700 700 Stable -
2.2. African Water & Sanitation Targets
African Ministers’ council on water (AMCOW): the pan African Water and Sanitation Monitoring, Evaluation and Reporting Format: (7 themes, 25 Performance Categories, and about 15 Indicators for preparing the 2013 report to African Union Assembly on implementing Water and Sanitation Goals in Africa).
Table 3. African Water and Sanitation M&E, & Reporting: indicator, target, value, state and possible reasons for deterioration or improvement
ThemesPerformance Category
IndicatorPerformance Target
Value for target indicator (2013)
State of the indicator
Possible reasons for deterioration or improvement
1.Water Infrastructure for Economic Growth
1. Water for Energy
Hydropower utilization
Increase by 10% between 2000 and 2015
Rate of increase : %0 in 2013
Stable
Target will not be achieved in 2015
The economically feasible hydropower potential and the installed hydroelectric capacity have not changed since several years.

18 Tunisia 2012 State of the Water Report
MEW
INA
2. Water for Agriculture
Water productivity Increase WP by 30% from 2000 to 2015
Rate of increase: +71.3% in 2013
Improvement
Target will be achieved in 2015
-Improving water management and mastering modern techniques of irrigation and water saving.
Rain fed Agriculture & Irrigation
Increase IA by 50% from 2000 to 2015
+59.1 % in 2013 Target will be achieved in 2015
-Improving water management and mastering modern techniques of irrigation and water saving.
3. Water for Multiple Uses
Water Demand Satisfaction Index
Increase by 10% from 2000 to 2015
+18.2 % in 2013 Fluctuation from year to year
Target is met but is highly controlled by the fluctuation in green water
2.Management and Protection of Water Resources
4. Transboundary basins and Water Resources Management
Existence of a Management Plan for Effective Water or IWRM Plan
Existence of a Management Plan for Effective Water or IWRM Plan by 2015
There is no stated plan for IWRM, however the main institutions in charge of water work separately for the promotion of IWRM.
Slight improvement
-
7. Rainwater Share of rainwater use in total municipal water consumption
Increase up to 10% by 2015
+1.6 % in 2013 Weak or absent performance
Institutional gap
3.Achieving the Water and Sanitation MDGs
8. Urban Water Supply
% of people without access
Reduce by 50% from 1990 to 2015
Reduce by 100 % in 2013
Improvement Target achieved
-
9. Urban Sanitation
% of people without access
Reduce by 50% from 1990 to 2015
Reduce by 83.3 % in 2013
Improvement Target will be achieved in 2015
-
10. Rural Water Supply
% of people without access
Reduce by 50% from 1990 to 2015
Reduce by 90.0 % in 2013
Improvement Target will be achieved in 2015
-
11. Rural Sanitation and Hygiene
% of people without access
Reduce by 50% from 1990 to 2015
Reduce by 71.9% in 2013
Improvement Institutional gap
4.Global Changes and Risks Management
12. Adaptation to Climate Change
Existence Climate Change Adaptation Strategy
Develop and implement , at least 1 CC Adaptation Strategy per country by 2015
1 CC Adaptation Strategy in 2013
Improvement Strategy adopted
13. Water- related Hazards
Existence of Early warning System for disaster prevention
Establish at least 1 EW System at national level by 2015
Under preparation
- -

19
National, Continental, and G
lobal Targets
Tunisia 2012 State of the Water Report
MEW
INA
5. Governance and Management
14. Institutional arrangements
Reform response to good governance principles
Updated Reform available and implemented by 2015
Specific actions taken so far
Improvement -Restructuring of BPHE, Revision of the Water Code, Establishment of the National Water Council, etc.
17. Right to water
Reform response to criteria for human right to water and sanitation
Updated Reform available and implemented by 2015
Updated Reform available in 2014
Improvement Water Rights in the new constitution (Article 44) (2014)
6. Financing 19. Financing water and Sanitation
% of GDP to hygiene and sanitation (resp.% of national budget to watsan)
Allocate at least 0.5 % of GDP to hygiene and sanitation (resp. 5% of national budget for watsan)
Allocate 0.13 % of GDP to hygiene and sanitation in 2013 (resp.1.8 % of national budget for watsan)
Weak or absent performance
Need to bring the percentage to 0.5 % of GDP on hygiene and sanitation and to 5 % the percentage of national budget for water and sanitation
7. Education 23. Information Existence of M&E Systems in line with the pan African M&E System
- - Not yet -
(Full template show in annex)
Source: AMCOW pan African Water and Sanitation Monitoring, Evaluation and Reporting Format: Tunisia Background Information Sheet, Tunisia Water and Sanitation Performances Evaluation Sheet. N-MEWINA project. Mekki HAMZA. June 2014.
Among these 7 themes, 15 Performance Categories, and 16 target indicators enable monitoring and evaluation of performances to achieve the 2015 targets. Most of these target indicators were included in the New National SOW set of indicators for Tunisia.
2.3. Global Water Targets
Achievement of MDGs:
Goal 7: Ensure Sustainable Development
TARGET 7C: Halve, by 2015, the proportion of people without sustainable access to safe drinking water and to basic sanitation services
Monitoring Indicators of Achieved Progress:
Indicator 1: Proportion of population using an improved drinking water source
Indicator 2: Proportion of population using improved sanitation facilities

20 Tunisia 2012 State of the Water Report
MEW
INA
Table 4. Millennium Development Goals: indicator, target, value, state and possible reasons for deterioration or improvement
Themes Performance Category
Indicator Performance Target Value for target indicator
State of the indicator
Possible reasons for deterioration or improvement
Achieving the Water and Sanitation MDGs
8. Urban Water Supply
% of people without access
Reduce by 50% from 1990 to 2015
Reduce by 100 % in 2013
Improvement Target achieved
-
9. Urban Sanitation % of people without access
Reduce by 50% from 1990 to 2015
Reduce by 83.3 % in 2013
Improvement Target achieved
-
10. Rural Water Supply
% of people without access
Reduce by 50% from 1990 to 2015
Reduce by 90.0 % in 2013
Improvement Target achieved
-
11. Rural Sanitation and Hygiene
% of people without access
Reduce by 50% from 1990 to 2015
Reduce by 71.9% in 2013
Improvement Target achieved
Institutional gap
These target indicators are monitored and evaluated to measure simultaneously the achieved progress to reach both continental and global targets.
2.4. Summary of National, Pan African and Global Indicators Monitored and Evaluated in Tunisia
Table 5. Summary of national, pan African and global indicators monitored and evaluated in TunisiaIndicator Category /Performance Category
Indicator Definition/ Explanation Type of target
Water & Availability
(Blue Water)
1-Mobilization of Surface Water
Total annual volumes mobilized by all dams relative to the potential of surface water that can be technically mobilized
National Water Targets
(9 indicators)
Water & Availability
(Non Conventional Water)
2-Treated wastewater reused in agricultural irrigation
Quantity of treated wastewater from WWTP that is reused in a given year in agricultural irrigation
Water & Consumption 3-Withdrawals from Blue Groundwater
Total annual volumes abstracted from groundwater sources and wells including non renewable resources per year
4-Improving the efficiency of irrigation systems on farms
Amounts of water distributed in head parcel of the farm, less losses in the farm network in comparison to total amounts of water distributed in head parcel.
5-Equipment of irrigable areas by water saving equipment
Total area equipped with sprinklers, drip irrigation, localized irrigation concreted seguias/ Total irrigable area.
Water & Finance 6- Coverage of operating and maintenance costs of irrigation systems and rural drinking water supply
0perating and maintenance costs paid by users/Actual operating and maintenance costs
Water & services
(Water Coverage and Accessibility)
7-Rural Water Supply Coverage
Percentage of population provided with piped or improved drinking- water source in rural areas

21
National, Continental, and G
lobal Targets
Tunisia 2012 State of the Water Report
MEW
INA
Water & services
(Water and Infrastructure)
8-Dams capacity Total storage volume of fresh water natural lakes and reservoirs created by large dams
9-Transfer Capacity of Water resources (Northern waters)
Total transfer capacity of North water network
1. Water for Energy 1-Hydropower utilization
-Rate of increase in hydropower utilisation Index (RiHpuI).
The hydropower utilisation Index (HpuI) is the fraction of economically feasible hydropower potential that can be genererated by the installed
Hydropower Plants. The Index can be improved when the country increases the capacity or the number of its hydropower plants. For a
given year, the Rate of increase in hydropower utilisation Index is the change (in %) in its value of the year 2000.
African Water & Sanitation Targets
(16 indicators)
2. Water for Agriculture 2-Water productivity
- Rate of increase in Water productivity
(RiWp).
The Water productivity (Wp) measures the contribution of water to the economy (i.e. the US $ produced per a cubic meter of water used in crop production). The rate of increase in water productivity (RiWP) is the change (in %) in its value of the year 2000.
3--Rain fed Agriculture & Irrigation
-Rate of increase of irrigat-ed areas (RiIA).
The Irrigated areas (IA) is the total area equiped for irrigation. The rate of increase of irrigated areas (RiIA) is the change (%) in its value in 2000.
3. Water for Multiple Uses
4-Water Demand Satisfaction Index
-Rate of increase of Water Demand Satisfaction Index (RiWDSI)
The Water Demand Satisfaction Index (WDSI) is the level at which the total country water demand is satisfied. For a given year, the Rate of increase the Water Demand Satisfaction Index (RiWDSI) is (in %) the incremental value of the WDSI from its 2000 value. This incremental value reflects country efforts to mobilize conventional and nonconventional water resources to satisfy demand in all sectors.
4. Transboundary basins and Water Resources Management
5-Existence of a Manage-ment Plan for Effective Wa-ter or IWRM Plan
- Water efficiency Plan
A national strategy that identifies the priority steps that must be taken to reform the water management system to meet IWRM principles. It may suggest changes to national policy, the legislative framework, financing structure, organizational framework, and a range of management tools. It should set out a sequence of actions over a specific time frame to transform existing practices to more sustainable ones (GWP definition). This strategy might also be called IWRM Plan or any other name, and must provide clear overview of : (i) the Policy and legal environment, (ii) the institutional arrangements, (iii) the financing structure, and (iv) the Management tools , of the national water resources management.

22 Tunisia 2012 State of the Water Report
MEW
INA
7. Rainwater 6-Share of rainwater use in total municipal water con-sumption
- Percentage of rainwater use in total municipal water consumption (pRu).
Roof-collected rainwater can be used for a range of purposes to complement the municipal water supplies. The uses include personal washing, toilet flushing, laundry, use, surface and equipment washing,
topping up spas and pools, garden irrigation, cooling and heating, and
many industrial processes. It is not recommended that rainwater is used for drinking or food preparation in areas where a reticulated drinking water supply is provided, as the quality of rainwater is not as reliable as urban drinking water supplies.
The total amount of rainwater used in the country by businesses, community groups, sporting clubs and residential developments, to supplement their water supply, constitutes with the total municipal
water supply and other uses, the total municipal water consumption by the country.
8. Urban Water Supply 7-% of people without access
- Rate of Water Inacessibilty reduction (IRwat)
It is the rate by which the country has reduced, so far (from 1990 to date), the proportion of the urban population without improved drinking water source.
9. Urban Sanitation 8-% of people without access
- Rate of Sanitation and Hygiene Inacessibilty reduc-tion (IRsan)
It is the rate by which the country has reduced, so far (from 1990 to date), the proportion of the urban population without improved sanitation facility.
10. Rural Water Supply 9-% of people without access
-Rate of Water Inacessibilty reduction (IRwat)
It is the rate by which the country has reduced, so far (from 1990 to date), the proportion of the rural population without improved drinking water source.
11. Rural Sanitation and Hygiene
10-% of people without access
- Rate of Sanitation and Hygiene Inacessibilty reduc-tion (IRsan)
It is the rate by which the country has reduced, so far (from 1990 to date), the proportion of the rural population without improved sanitation facility.
12. Adaptation to Cli-mate Change
11-Existence Climate Change Adaptation Strategy
- Climate Change Adapta-tion Strategy.
The Strategy is an official policy document developed by the country for climate change resilience.
13. Water- related Ha-zards
12-Existence of Early warn-ing System for disaster prevention
- Early warning system for disaster prevention at national level.
The set of capacities needed to generate and disseminate timely and meaningful warning information to enable individuals, communities and organizations threatened by a hazard to prepare and to act appropriately and in sufficient time to reduce the possibility of harm or loss. Warning systems need to span all steps from hazard detection through to community response. (Definition of the United Nations International strategy for disaster reduction, UNISDR)

23
National, Continental, and G
lobal Targets
Tunisia 2012 State of the Water Report
MEW
INA
14. Institutional arrange-ments
13-Reform response to good governance principles
- Water sector policy that reflects good governance principles.
The range of political, social, economic, and administrative systems that are in place to regulate the development and management of water resources and provision of water services at different levels of society (Definition of UNESCO/UNDESA)
17. Right to water 14-Reform response to criteria for human right to water and sanitation
Need to improve water sector policy & reform that promotes human rights to water and sanitation
19. Financing water and Sanitation
15-% of GDP to hygiene and sanitation (resp.% of na-tional budget to watsan)
-
- Percentage of GDP to Sanitation and Hygiene (gdpSH).
Share of the national GDP allocated to sanitation and hygiene.
- Percentage of national Budget to Water and Sani-tation (BdgWS).
Share of the national Budget allocated to Water and Sanitation.
23. Information 16-Existence of M&E Sys-tems in line with the pan African M&E System
- Enhanced Water and San-itation M&E System in line with the pan African M&E.
The on-going pan African M&E process that aims at establishing data management system (DMS) at AMCOW/AUC to track progress on the implementation of the Sharm El-Sheikh Commitments on Water and Sanitation, requires alignement of existing data management systems at country level, as well as RLBOs and RECs levels. Under this framework countries’ water and sanitation M&E systems will be
enhanced to be aligned with DMS at sub-regional and continental levels.
8. Urban Water Supply 1-% of people without access
- Rate of Water Inacessibilty reduction
It is the rate by which the country has reduced, so far (from 1990 to date), the proportion of the urban population without improved drinking water source.
Global Water Targets
(4 indicators)
9. Urban Sanitation 2-% of people without access
- Rate of Sanitation and Hygiene Inacessibilty re-duction
It is the rate by which the country has reduced, so far (from 1990 to date), the proportion of the urban population without improved sanitation facility.
10. Rural Water Supply 3-% of people without access
- Rate of Water Inacessibilty reduction
It is the rate by which the country has reduced, so far (from 1990 to date), the proportion of the rural population without improved drinking water source.
11. Rural Sanitation and Hygiene
4-% of people without access
- Rate of Sanitation and Hygiene Inacessibilty re-duction
It is the rate by which the country has reduced, so far (from 1990 to date), the proportion of the rural population without improved sanitation facility.
TOTAL 29 indicators -
4 indicators relating to Water Supply and Sanitation being counted twice, the selected indicators become

24 Tunisia 2012 State of the Water Report
MEW
INA
then 25 indicators.
All these indicators of national interest will be found in the list of SOW indicators harmonized regionally by the MEWINA project and/or in the additional specific indicators list of the country.
25
National State of the W
ater (SOW
) Indicators
Tunisia 2012 State of the Water Report
MEW
INA
3. N
atio
nal S
tate
of
the
Wat
er (S
OW
) Ind
icat
ors
Thi
s se
ctio
n pr
esen
ts th
e fu
ll lis
t of
indi
cato
rs u
sed
in th
e re
port
with
thei
r de
finiti
on, t
he m
etho
dolo
gy a
nd th
e in
stitu
tions
in c
harg
e of
m
easu
ring
and/
or e
stim
atin
g th
e in
dica
tor.
3.1.
Nat
iona
l & C
ount
ry S
peci
fic S
OW
Ind
icat
ors
Tabl
e 6.
A s
et o
f Nati
onal
SO
W in
dica
tors
for
Tuni
sia:
Defi
nitio
n, M
etho
dolo
gy, I
nstit
ution
and
Sou
rce
of d
ata
Indi
cato
r Ca
tego
ry
In
dica
tor
Defi
niti
onM
etho
dolo
gy to
mea
sure
, esti
mat
e, a
nd re
port
va
lue
Insti
tuti
on in
cha
rge
Sour
ce o
f dat
a
4.1.
1 W
ater
&
Avai
labi
lity
i-Ann
ual A
vera
ge
Prec
ipita
tion
Dep
thAv
erag
e pr
ecip
itatio
n is
the
long
-ter
m
aver
age
in d
epth
(ove
r sp
ace
and
time)
of a
nnua
l pre
cipi
tatio
n in
the
coun
try
(mm
)Th
iess
ens
Poly
gon
met
hod:
DG
RE, I
NM
DG
RE, I
NM
ii-A
nnua
l Ave
rage
Pr
ecip
itatio
n Vo
lum
eTh
e lo
ng te
rm a
vera
ge in
vol
ume
(ove
r sp
ace
and
time)
of a
nnua
l pr
ecip
itatio
n, it
is th
e pr
oduc
t of t
he
annu
al A
vera
ge P
reci
pita
tion
Dep
th
and
the
Effec
tive
Rain
fall
area
Ann
ual A
vera
ge P
reci
pita
tion
Volu
me
(dep
th*
actu
al ra
infa
ll ar
ea) (
BCM
): it
is th
e pr
oduc
t of t
he A
nnua
l Ave
rage
Pr
ecip
itatio
n D
epth
and
the
Effec
tive
Rain
fall
area
(N
ot n
eces
sari
ly th
e ar
ea o
f the
cou
ntri
es)
DG
RED
GRE
i)Blu
e W
ater
a)-In
tern
al R
enew
able
Su
rfac
e W
ater
(IRS
W)
IRSW
: is
the
amou
nt o
f pre
cipi
tatio
n th
at is
nei
ther
ben
efici
ally
abs
trac
ted
from
the
atm
osph
ere,
nor
infil
trat
ed
in th
e gr
ound
, but
flow
s ov
erla
nd
and
rout
ed th
roug
h ch
anne
ls o
r jo
ins
bigg
er w
ater
bod
ies.
Mea
sure
d in
gau
ging
sta
tions
impl
emen
ted
acro
ss
mai
n ri
vers
, wat
ersh
eds
and
thei
r tr
ibut
arie
s.D
GRE
, DG
BGTH
, CR
DA
CRD
A, D
GRE
, BPE
H, D
GAC
TA,
DG
BGTH
b)-In
tern
al R
enew
able
G
roun
dwat
er (I
RG)
IRG
: G
roun
dwat
er R
echa
rge
is
the
tota
l vol
ume
of w
ater
ent
erin
g un
derg
roun
d so
urce
s of
wat
er
(typ
ical
ly a
quife
rs) w
ithin
a c
ount
ry’s
bo
rder
s fr
om e
ndog
enou
s (in
tern
al)
prec
ipita
tion
and
surf
ace
wat
er fl
ow
(FAO
)
If no
t mea
sure
d, IR
G c
an b
e es
timat
ed b
y hy
drol
ogic
al m
odel
ing
(Phy
sica
lly-B
ased
D
istr
ibut
ed M
odel
s): P
reco
rds,
Soi
l typ
e m
aps,
La
nd u
se m
aps,
Irri
gatio
n an
d dr
aina
ge m
aps,
ET
P in
puts
, Sur
face
run
off a
nd c
atch
men
t ou
tlets
, Rec
harg
e of
gro
undw
ater
aqu
ifers
by
prec
ipita
tion.
Gro
undw
ater
rech
arge
from
Sur
face
wat
er fl
ows
can
eith
er b
e es
timat
ed fr
om o
bser
vatio
n w
ells
or
mod
eled
thro
ugh
Surf
ace-
Gro
undw
ater
Cou
pled
m
odel
s.
DG
RE, C
RDA
CRD
A, D
GRE

26 Tunisia 2012 State of the Water Report
MEW
INA
c)-T
otal
Inte
rnal
Ren
ewab
le
Blue
Wat
er R
esou
rces
(T
IRBW
R=IR
SW+I
RG)
TIRB
WR=
(IRS
W+I
RG):
Lon
g-te
rm
aver
age
annu
al fl
ow o
f riv
ers
and
rech
arge
of a
quife
rs g
ener
ated
from
en
doge
nous
pre
cipi
tatio
n. D
oubl
e co
untin
g of
sur
face
wat
er a
nd
grou
ndw
ater
reso
urce
s is
avo
ided
by
dedu
cting
the
over
lap
from
the
sum
of
the
surf
ace
wat
er a
nd g
roun
dwat
er
reso
urce
s. (F
AO)
(TIR
BWR=
IRSW
+IRG
)D
GRE
, DG
BGTH
, CRD
ACR
DA
, DG
RE, B
PEH
, DG
ACTA
, D
GBG
TH
d)- E
xter
nal S
urfa
ce W
ater
In
flow
(ESW
I)ES
WI:
Tha
t par
t of t
he c
ount
ry’s
an
nual
rene
wab
le s
urfa
ce w
ater
re
sour
ces
that
are
not
gen
erat
ed in
th
e co
untr
y. It
incl
udes
sur
face
inflo
ws
from
ups
trea
m c
ount
ries
, and
par
t of
the
wat
er o
f bor
der
lake
s an
d/or
ri
vers
with
out h
uman
influ
ence
), it
also
take
s in
to a
ccou
nt th
e qu
antit
y of
flo
w p
rote
cted
by
form
al a
gree
men
ts
or tr
eatie
s, a
nd th
eref
ore,
it m
ay v
ary
with
tim
e. (
Mod
ified
from
FAO
)
ESW
I is
mea
sure
d in
gau
ging
sta
tions
loca
ted
at
the
entr
ance
of r
iver
s ac
ross
bor
ders
; it c
once
rns
surf
ace
inflo
ws
from
ups
trea
m n
eigh
bori
ng
coun
try.
DG
RE, D
GBG
THCR
DA
, DG
RE, B
PEH
, DG
BGTH
e)-E
xter
nal S
urfa
ce W
ater
O
utflo
w (E
SWO
)Lo
ng-t
erm
ave
rage
ann
ual q
uanti
ty o
f su
rfac
e w
ater
leav
ing
the
coun
try
Exte
rnal
Sur
face
Wat
er O
utflo
w (E
SWO
): L
ong-
term
ave
rage
ann
ual q
uanti
ty o
f Sur
face
wat
er
leav
ing
the
coun
try.
No
ESW
O to
war
ds n
eigh
bori
ng c
ount
ries
, but
to
war
ds th
e se
a in
cas
e of
floo
ds
DG
RE, D
GBG
TH, C
RDA
CRD
A, D
GRE
, BPE
H, D
GBG
TH
f)-E
xter
nal G
roun
dwat
er
Inflo
w (E
GI)
Long
-ter
m a
vera
ge a
nnua
l qua
ntity
of
gro
undw
ater
ann
ually
ent
erin
g th
e co
untr
y, ta
king
into
con
side
ratio
n tr
eatie
s (F
AO)
Exte
rnal
Gro
undw
ater
Inflo
w (E
GI)
: Lo
ng-t
erm
av
erag
e an
nual
qua
ntity
of g
roun
dwat
er a
nnua
lly
ente
ring
the
coun
try,
taki
ng in
to c
onsi
dera
tion
trea
ties
(FAO
).Es
timat
ed fr
om p
iezo
met
ric
map
s, o
bser
vatio
n w
ells
or
mod
eled
thro
ugh
Gro
undw
ater
mod
els.
DG
RE, C
RDA
CRD
A, D
GRE
g)-E
xter
nal G
roun
dwat
er
Outf
low
(EG
O)
Long
-ter
m a
vera
ge a
nnua
l qua
ntity
of
gro
undw
ater
leav
ing
the
coun
try
(FAO
)
Exte
rnal
Gro
undw
ater
outf
low
(EG
O) :
Lon
g-te
rm
aver
age
annu
al q
uanti
ty o
f gro
undw
ater
leav
ing
the
coun
try
(FAO
) Es
timat
ed fr
om p
iezo
met
ric
map
s, o
bser
vatio
n w
ells
or
mod
eled
thro
ugh
Gro
undw
ater
mod
els.
No
EGO
tow
ards
nei
ghbo
ring
cou
ntri
es, b
ut
tow
ards
the
sea
in c
ase
of c
oast
al a
quife
rs.
DG
RE, C
RDA
CRD
A, D
GRE
h)-T
otal
Ext
erna
l Re
new
able
Blu
e W
ater
Re
sour
ces
Inflo
w(T
ERBW
R)=(
ESW
I+EG
I)
The
porti
on o
f the
cou
ntry
’s
rene
wab
le w
ater
reso
urce
s w
hich
is
not
gen
erat
ed w
ithin
the
coun
try
(FAO
)
(TER
BWR)
=(ES
WI+
EGI)
DG
RE, D
GBG
TH, C
RDA
CRD
A, D
GRE
, DG
BGTH
, BPE
H

27
National State of the W
ater (SOW
) Indicators
Tunisia 2012 State of the Water Report
MEW
INA
i)-To
tal R
enew
able
Blu
e Su
rfac
e W
ater
(T
RBSW
)=(IR
SW)+
(ESW
I)-
(ESW
O)
Is th
e re
sulta
nt o
f the
inte
rnal
pr
oduc
ed s
urfa
ce w
ater
and
the
tran
sbou
ndar
y in
flow
s an
d ou
tflo
ws
of
surf
ace
wat
er
(TRB
SW)=
(IRSW
)+(E
SW I)
-(ES
WO
)D
GRE
, DG
BGTH
, CRD
ACR
DA
, DG
RE, D
GBG
TH,
DG
ACTA
, BPE
H
j)- T
otal
Ren
ewab
le B
lue
Gro
undw
ater
(T
RBG
)=(IR
G)+
(EG
I)-(
EGO
)
Is th
e re
sulta
nt o
f the
inte
rnal
pr
oduc
ed g
roun
dwat
er a
nd th
e tr
ansb
ound
ary
inflo
ws
and
outf
low
s of
gr
ound
wat
er
(TRB
G)=
(IRG
)+(E
G I)
-(EG
O)
DG
RE, C
RDA
CRD
A, D
GRE
k)-O
verl
ap b
etw
een
surf
ace
wat
er a
nd g
roun
dwat
er
(OSW
GW
)
Part
of t
he re
new
able
fres
hwat
er
reso
urce
s th
at is
com
mon
to b
oth
surf
ace
and
grou
ndw
ater
. It i
s eq
ual
to g
roun
dwat
er d
rain
age
into
riv
ers
(typ
ical
ly b
ase
flow
of r
iver
s) m
inus
se
epag
e fr
om r
iver
s in
to a
quife
rs.
(FAO
)
OSW
= ba
se fl
ow o
f riv
ers
min
us s
eepa
ge fr
om
rive
rs in
to a
quife
rs. I
t is
mea
sure
d by
gau
ging
ri
vers
that
feed
or
drai
n aq
uife
rs.
DG
RE, C
RDA
CRD
A, D
GRE
l)-To
tal R
enew
able
Blu
e W
ater
Res
ourc
es(T
RBW
R)=(
TRBS
W)+
(TRB
G)-
(OSW
GW
)
Is th
e su
m o
f tot
al re
new
able
blu
e su
rfac
e an
d gr
ound
wat
er e
xclu
ding
th
e ov
erla
p be
twee
n th
em
(TRB
WR)
=(TR
BSW
)+(T
RBG
)-(O
SW)
DG
RE, D
GBG
TH, C
RDA
CRD
A, D
GRE
, DG
BGTH
, D
GAC
TA, B
PEH
m)-
Tota
l Exp
loita
ble
Non
-Re
new
able
Gro
und
Wat
er
(TEN
RG)
The
annu
al e
xtra
ctab
le a
mou
nt
of n
on-r
enew
able
gro
undw
ater
ac
cord
ing
to a
pre
spe
cifie
d sa
fe y
ield
th
at is
dic
tate
d by
a p
re s
peci
fied
sust
aina
bilit
y pe
riod
(x n
umbe
r of
ye
ars)
.
TNRG
WR
can
be e
stim
ated
by
hydr
olog
ical
m
odel
ing
(Phy
sica
lly-B
ased
Dis
trib
uted
Mod
els)
: P
reco
rds,
Soi
l typ
e m
aps,
Lan
d us
e m
aps,
Irri
gatio
n an
d dr
aina
ge m
aps,
ETP
inpu
ts, S
urfa
ce r
unoff
an
d ca
tchm
ent o
utle
ts, R
echa
rge
of g
roun
dwat
er
aqui
fers
by
prec
ipita
tion,
Sat
ellit
e im
ager
y.G
roun
dwat
er re
char
ge fr
om S
urfa
ce w
ater
flow
s ca
n ei
ther
be
estim
ated
from
obs
erva
tion
wel
ls o
r m
odel
ed th
roug
h Su
rfac
e-G
roun
dwat
er C
oupl
ed
mod
els.
Th
e TN
RGW
R ex
trac
tabl
e an
nual
ly, a
ccor
ding
to
a p
re s
peci
fied
safe
yie
ld, i
s di
ctat
ed b
y a
pre
spec
ified
sus
tain
abili
ty p
erio
d (x
num
ber
of y
ears
).
DG
RE, C
RDA
CRD
A, D
GRE
n) T
otal
Blu
e W
ater
Re
sour
ces
(TBW
R)Is
the
sum
of T
otal
Ren
ewab
le B
lue
Wat
er R
esou
rces
(TRB
WR)
and
Tot
al
Expl
oita
ble
Non
-Ren
ewab
le G
roun
d W
ater
(TN
RG)
TBW
R=TR
BWR+
TNRG
WD
GRE
, CRD
ACR
DA
, DG
RE
o)-M
obili
zatio
n of
Sur
face
W
ater
(s
peci
fic in
dica
tor)
Tota
l ann
ual v
olum
es m
obili
zed
by
all d
ams
rela
tive
to th
e po
tenti
al o
f su
rfac
e w
ater
that
can
be
tech
nica
lly
mob
ilize
d
Tota
l ann
ual v
olum
es m
obili
zed
by a
ll da
ms
/ Po
tenti
al o
f sur
face
wat
er th
at c
an b
e te
chni
cally
m
obili
zed
that
is 2
, 5 B
CM /
year
.
DG
BGTH
, DG
RE
DG
BGTH

28 Tunisia 2012 State of the Water Report
MEW
INA
ii)G
reen
Wat
era)
-Wat
er fo
r Ra
in-f
ed
Agr
icul
tura
l Con
sum
ption
sTh
e to
tal a
mou
nt o
f pre
cipi
tatio
n di
rect
ly c
onsu
med
by
rain
fed
agri
cultu
re
-The
Ref
eren
ce v
alue
is c
alcu
late
d as
the
ratio
be
twee
n ir
riga
tion
abst
racti
ons
and
the
area
for
the
corr
espo
ndin
g la
nd u
se (R
). -A
lpha
is a
func
tion
of th
e pr
evai
ling
arid
ity a
nd
the
plan
t cov
er (a
n av
erag
e va
lue
of 0
.7 m
ay b
e as
sum
ed fo
r cr
ops
in te
mpe
rate
to a
rid
regi
ons
)-T
he ra
iny
peri
od fo
r th
e N
atur
al v
eget
ation
land
us
e is
then
iden
tified
(say
3 m
onth
s, i.
e. (0
.25)
ye
ar)
-Ave
rage
Veg
etati
on a
bstr
actio
ns =
Are
a of
Ve
geta
tion
* (R
) * (0
.7) *
(0.2
5)-S
atel
lite
imag
ery
is c
urre
ntly
mor
e effi
cien
t
DG
RE, D
GG
REE
CRD
A, D
GG
REE,
DG
PA, D
GE-
DA
, DG
RE
b)-W
ater
for
Rain
-fed
Pa
stur
e Co
nsum
ption
sTh
e to
tal a
mou
nt o
f pre
cipi
tatio
n di
rect
ly c
onsu
med
by
past
ure
area
s-A
vera
ge V
eget
ation
abs
trac
tions
= A
rea
of
Vege
tatio
n *
(R) *
(0.7
) * (0
.25)
-Sat
ellit
e im
ager
y is
cur
rent
ly m
ore
effici
ent
DG
RE, D
GG
REE
CRD
A, D
GPA
,OEP
, DG
EDA
, D
GG
REE,
DG
RE
c)-W
ater
for
Rain
-fed
For
est
Cons
umpti
ons
The
tota
l am
ount
of p
reci
pita
tion
dire
ctly
con
sum
ed b
y fo
rest
s-A
vera
ge V
eget
ation
abs
trac
tions
= A
rea
of
Vege
tatio
n *
(R) *
(0.7
) * (0
.25)
-Sat
ellit
e im
ager
y is
cur
rent
ly m
ore
effici
ent
DG
RE, D
GG
REE
CRD
A, D
GPA
, DG
F, D
GG
REE,
D
GED
A, D
GRE
d)-T
otal
Ren
ewab
le G
reen
W
ater
Res
ourc
es
TRG
WR
= a+
b+
c
The
tota
l am
ount
of p
reci
pita
tion
dire
ctly
con
sum
ed b
y ra
in fe
d ag
ricu
lture
, pas
ture
and
fore
sts
area
s
TRG
WR
= a+
b+
c D
GRE
, DG
GRE
ECR
DA
, DG
PA, D
GED
A, D
G-
GRE
E, O
EP, D
GF,
DG
RE
e)- T
otal
Ren
ewab
le W
ater
Re
sour
ces
(TRW
R)=(
TRBW
R+TR
GW
R)
The
tota
l Ren
ewab
le W
ater
Res
ourc
es
is h
ence
cal
cula
ted
as th
e su
m o
f the
to
tal B
lue
Wat
er d
escr
ibed
in th
e pr
evio
us s
ub-s
ectio
n an
d th
e to
tal
Gre
en W
ater
.
(TRW
R)=(
TRBW
R+TR
GW
R)D
GRE
, DG
GRE
ECR
DA
, DG
PA, D
GED
A, D
G-
GRE
E, O
EP, D
GF,
DG
RE
f)- T
otal
Con
venti
onal
W
ater
Res
ourc
es(T
CWR)
= T
RWR+
TNRG
=
TBW
R+TR
GW
R
Is th
e su
m o
f Tot
al R
enew
able
Wat
er
Reso
urce
s an
d To
tal N
on R
enew
able
W
ater
Res
ourc
es.
Als
o it
is th
e su
m o
f Tot
al B
lue
Wat
er
Reso
urce
s an
d To
tal R
enew
able
Gre
en
Wat
er R
esou
rces
.
(TCW
R) =
TRW
R+TN
RG =
TBW
R+TR
GW
RD
GRE
, DG
GRE
ECR
DA
, DG
PA, D
GED
A, D
G-
GRE
E, O
EP, D
GF,
DG
RE
iii)N
on-
Conv
entio
nal
Wat
er
a)-P
rodu
ced
Mun
icip
al
and
Indu
stri
al W
aste
wat
er
(PM
W)
Ann
ual q
uanti
ty o
f was
tew
ater
ge
nera
ted
in th
e co
untr
y, in
oth
er
wor
ds, t
he q
uanti
ty o
f wat
er th
at h
as
been
pol
lute
d by
add
ing
was
te
Non
mea
sure
dEs
timat
ed fr
om m
unic
ipal
and
indu
stri
al
with
draw
als
ON
AS
ON
AS
b)- T
reat
ed M
unic
ipal
and
In
dust
rial
Was
tew
ater
Qua
ntity
of g
ener
ated
mun
icip
al a
nd
indu
stri
al w
aste
wat
er th
at is
trea
ted
in a
giv
en y
ear
and
disc
harg
ed fr
om
trea
tmen
t pla
nts
(effl
uent
)
Mea
sure
d qu
antit
y of
gen
erat
ed m
unic
ipal
and
in
dust
rial
was
tew
ater
that
is tr
eate
d in
a g
iven
ye
ar a
nd d
isch
arge
d fr
om tr
eatm
ent p
lant
s
ON
AS
ON
AS
c)- R
euse
d Tr
eate
d M
unic
ipal
and
Indu
stri
al
Was
tew
ater
Qua
ntity
of t
reat
ed w
aste
wat
er th
at is
re
used
in a
giv
en y
ear
Mea
sure
d qu
antit
y of
trea
ted
was
tew
ater
that
is
reus
ed in
a g
iven
yea
rO
NA
S, D
GG
REE
ON
AS,
DG
GRE
E, C
RDA

29
National State of the W
ater (SOW
) Indicators
Tunisia 2012 State of the Water Report
MEW
INA
c bi
s)- T
reat
ed w
aste
wat
er
reus
ed in
agr
icul
tura
l ir
riga
tion
Tota
l am
ount
of t
reat
ed w
aste
wat
er
from
WW
TP th
at is
reus
ed in
a g
iven
ye
ar in
agr
icul
tura
l ir
riga
tion
-Tot
al v
olum
e of
trea
ted
was
tew
ater
reus
ed in
a
give
n ye
ar in
agr
icul
tura
l irr
igati
on (M
CM/y
ear)
-% o
f the
tota
l am
ount
of T
WW
pro
duce
d by
W
WTP
DG
GRE
E, O
NA
SD
GG
REE,
ON
AS
d)- P
rodu
ced
Agr
icul
tura
l D
rain
age
(PA
D)
Tota
l vol
ume
of th
e w
ater
with
draw
n fo
r ag
ricu
lture
but
not
con
sum
ed a
nd
flow
s ou
t of t
he s
yste
m
Not
mea
sure
d re
gula
rly
DG
GRE
E, D
GRE
CRD
A, D
GG
REE,
DG
RE
e)- R
euse
d A
gric
ultu
ral
Dra
inag
eTh
e to
tal v
olum
e of
agr
icul
tura
l dr
aina
ge th
at is
retu
rned
bac
k to
the
syst
em th
roug
h re
use
Not
mea
sure
d re
gula
rly
DG
GRE
E, D
GRE
CRD
A, D
GG
REE,
DG
RE
f)- P
rodu
ced
Des
alin
ated
W
ater
(PD
W)
Wat
er p
rodu
ced
annu
ally
by
desa
linati
on o
f bra
ckis
h or
sal
t wat
erM
easu
red
regu
larl
y by
SO
NED
EN
on m
easu
red
regu
larl
y co
ncer
ning
pri
vate
pr
oduc
ers
SON
EDE,
DG
RECR
DA
, SO
NED
E, D
GRE
g)- T
otal
Non
-Con
venti
onal
W
ater
Res
ourc
es (T
NCW
R)=
(PM
W)+
(PA
D)+
(PD
W)
Tota
l Non
-Con
venti
onal
Wat
er
Reso
urce
s(T
NCW
R)=
(PM
W)+
(PA
D)+
(PD
W)
ON
AS,
SO
NED
E,
DG
GRE
E, D
GRE
CRD
A, O
NA
S, S
ON
EDE,
D
GG
REE,
DG
RE
a)
h)- T
h)-
To
tal N
on-R
enew
able
G
ro
Gro
undw
ater
(TN
RGR)
The
annu
al e
xtra
ctab
le a
mou
nt
of n
on-r
enew
able
gro
undw
ater
ac
cord
ing
to a
pre
spe
cifie
d sa
fe
yiel
d th
at is
dic
tate
d by
a s
peci
fic
sust
aina
bilit
y pe
riod
(x n
umbe
r of
ye
ars)
TNRG
WR
can
be e
stim
ated
by
hydr
olog
ical
m
odel
ing
(Phy
sica
lly-B
ased
Dis
trib
uted
Mod
els)
: P
reco
rds,
Soi
l typ
e m
aps,
Lan
d us
e m
aps,
Irri
gatio
n an
d dr
aina
ge m
aps,
ETP
inpu
ts, S
urfa
ce r
unoff
an
d ca
tchm
ent o
utle
ts, R
echa
rge
of g
roun
dwat
er
aqui
fers
by
prec
ipita
tion,
Sat
ellit
e im
ager
y.G
roun
dwat
er re
char
ge fr
om S
urfa
ce w
ater
flow
s ca
n ei
ther
be
estim
ated
from
obs
erva
tion
wel
ls o
r m
odel
ed th
roug
h Su
rfac
e-G
roun
dwat
er C
oupl
ed
mod
els.
Th
e TN
RGW
R ex
trac
tabl
e an
nual
ly, a
ccor
ding
to
a p
re s
peci
fied
safe
yie
ld, i
s di
ctat
ed b
y a
pre
spec
ified
sus
tain
abili
ty p
erio
d (x
num
ber
of y
ears
).
DG
RE,
CRD
A, D
GRE
i)-To
tal C
onve
ntion
al W
ater
Re
sour
ces
(TCW
R)=
(TRW
R)+(
TNRG
R)
TCW
R(T
CWR)
= (T
RWR)
+(TN
RGR)
DG
RE, D
GBG
TH,
DG
GRE
ECR
DA
, DG
BGTH
, BPE
H,
DG
GRE
E, D
GRE
j)-To
tal A
vaila
ble
Wat
er
Reso
urce
s (T
AWR)
= (T
CWR)
+(TN
CWR)
TAW
R is
the
sum
of t
otal
ann
ual
rene
wab
le a
nd n
on-r
enew
able
wat
er
reso
urce
s (a
ppro
xim
ated
) and
tot
al
annu
al n
on-c
onve
ntion
al w
ater
re
sour
ces
(TAW
R)=
(TCW
R)+(
TNCW
R)D
GRE
, DG
BGTH
, D
GG
REE,
ON
AS,
SO
NED
E
CRD
A, D
GBG
TH, B
PEH
, D
GG
REE,
DG
RE, O
NA
S,
SON
EDE
4.1.
2 W
ater
&
Use
sa)
Ann
ual T
otal
wat
er
with
draw
alTh
e gr
oss
amou
nt o
f wat
er e
xtra
cted
fr
om a
ll so
urce
s, e
ither
per
man
ently
or
tem
pora
rily
, for
all
uses
. It i
nclu
des
cons
umpti
ve u
se, c
onve
yanc
e lo
sses
, an
d re
turn
flow
Wat
er e
xtra
cted
ann
ually
from
all
sour
ces
for
all
uses
.It
incl
udes
con
sum
ptive
use
, con
veya
nce
loss
es,
and
retu
rn fl
ow
BPEH
, DG
BGTH
, D
GG
REE,
SO
NED
E,
DG
RE
CRD
A, B
PEH
, DG
BGTH
, D
GG
REE,
SO
NED
E, O
NA
S,
BIRH
, DG
RE
b)W
ithdr
awal
for
Dom
estic
W
ater
use
Tota
l ann
ual v
olum
e of
wat
er
with
draw
als
used
for
dom
estic
pu
rpos
es
Tota
l ann
ual v
olum
e of
wat
er w
ithdr
awal
s us
ed fo
r do
mes
tic p
urpo
ses
SON
EDE,
DG
GRE
E,
BIRH
, DG
RECR
DA
s, S
ON
EDE,
D
GG
REE,
BIRH
, DG
RE

30 Tunisia 2012 State of the Water Report
MEW
INA
c)W
ithdr
awal
for
Indu
stri
al
Wat
er u
se
Tota
l ann
ual v
olum
e of
wat
er
with
draw
als
used
for
indu
stri
al
purp
oses
Tota
l ann
ual v
olum
e of
wat
er w
ithdr
awal
s us
ed fo
r in
dust
rial
pur
pose
sSO
NED
E, M
IN IN
D,
DG
GRE
E, B
IRH
, DG
RECR
DA
, ST
EG, S
ON
EDE,
D
GG
REE,
BIR
H, D
GRE
d)W
ithdr
awal
for
Agr
icul
tura
l Wat
er u
se
Tota
l ann
ual v
olum
e of
blu
e w
ater
w
ithdr
awal
s us
ed fo
r ag
ricu
ltura
l pu
rpos
es
Tota
l ann
ual v
olum
e of
blu
e w
ater
with
draw
als
used
for
agri
cultu
ral p
urpo
ses
TABW
W
DG
PA,
DG
EDA
,DG
GRE
E,BI
RH,
BPEH
, DG
RE
CRD
As,
DG
PA, D
GED
A,
DG
GRE
E, B
IRH
, BPE
H, D
GRE
e) G
reen
Wat
er
Cons
umpti
ons
for
Agr
icul
ture
Wat
er u
se
The
tota
l vol
ume
of g
reen
wat
er
annu
ally
con
sum
ed b
y ra
in fe
d ag
ricu
lture
The
tota
l vol
ume
of g
reen
wat
er a
nnua
lly
cons
umed
by
rain
fed
agri
cultu
reTA
GW
W
DG
RE, D
GG
REE,
BPE
HCR
DA
s, D
GPA
, DG
EDA
, DG
-G
REE,
OEP
, DG
F, B
IRH
, BPE
H,
DG
RE
f)To
tal A
gric
ultu
ral W
ater
us
esTh
e to
tal a
nnua
l vol
ume
cons
umed
by
both
rain
fed
and
irri
gate
d ag
ricu
lture
TABW
W+T
AGW
WD
GRE
, DG
GRE
E, B
PEH
CRD
A, D
GPA
, DG
EDA
, DG
-G
REE,
BIR
H, B
PEH
, DG
RE
g)W
ithdr
awal
s fr
om B
lue
Surf
ace
wat
erA
nnua
l gro
ss a
mou
nt o
f wat
er
extr
acte
d fr
om r
iver
s, la
kes
and
rese
rvoi
rs. I
t inc
lude
s w
ithdr
awal
of
prim
ary
rene
wab
le s
urfa
ce w
ater
re
sour
ces
and
seco
ndar
y fr
eshw
ater
so
urce
s (w
ater
pre
viou
sly
with
draw
n an
d re
turn
ed)
Ann
ual g
ross
am
ount
of w
ater
ext
ract
ed fr
om
rive
rs, l
akes
, dam
s an
d re
serv
oirs
. It i
nclu
des
-with
draw
al o
f pri
mar
y re
new
able
sur
face
wat
er
reso
urce
s -a
nd s
econ
dary
fres
hwat
er s
ourc
es (w
ater
pr
evio
usly
with
draw
n an
d re
turn
ed)
DG
RE, D
GBG
TH,
SON
EDE
CRD
As,
BIR
H,B
PEH
, SO
NED
E,
DG
BGTH
, DG
ACTA
, D
GRE
h) W
ithdr
awal
s fr
om B
lue
Rene
wab
le G
roun
dwat
erTo
tal a
bstr
actio
ns fr
om re
new
able
gr
ound
wat
er s
ourc
es, p
er y
ear
Tota
l ann
ual a
bstr
actio
ns fr
om g
roun
dwat
er
sour
ces,
incl
udin
g no
n re
new
able
sou
rces
(F
low
mea
sure
men
t, s
atel
lite
imag
ery)
DG
RE, B
IRH
, CRD
ACR
DA
, BIR
H, S
ON
EDE,
DG
-G
REE,
DG
RE
i)With
draw
als
from
Bl
ue N
on-R
enew
able
G
roun
dwat
er
Tota
l ann
ual v
olum
es a
bstr
acte
d fr
om
non-
rene
wab
le re
sour
ces,
nam
ely,
fo
ssil
grou
ndw
ater
.
Tota
l ann
ual v
olum
es a
bstr
acte
d fr
om n
on-
rene
wab
le re
sour
ces,
nam
ely,
foss
il gr
ound
wat
er.
(Flo
w m
easu
rem
ent,
sat
ellit
e im
ager
y)
DG
RECR
DA
, DG
RE
ibis
) Tot
al w
ithdr
awal
s fr
om
Blue
Wat
erIs
the
sum
of w
ithdr
awal
s fr
om B
lue
Surf
ace
Wat
er, B
lue
Rene
wab
le
Gro
undw
ater
and
Blu
e N
on
Rene
wab
le G
roun
dwat
er
TWBW
=WBS
W+B
RG+B
NRG
DG
RECR
DA
, DG
RE
i ter
) Gre
en w
ater
Co
nsum
ption
for
Live
stoc
k Fo
dder
Wat
er U
se
(Add
ition
al)
Tota
l with
draw
als
from
Gre
en W
ater
fo
r Li
vest
ock
Fodd
er W
ater
Use
Tota
l with
draw
als
from
Gre
en W
ater
for
Live
stoc
k Fo
dder
Wat
er U
se
DG
GRE
E, O
EP, D
GPA
, D
GED
ACR
DA
, DG
GRE
E, O
EP, D
GPA
, D
GED
A
I qua
t) B
ottle
d W
ater
Pr
oduc
tion
(Add
ition
al)
Bott
led
Wat
er P
rodu
ction
(BCM
/Yea
r)Bo
ttle
d W
ater
Pro
ducti
on (B
CM/Y
ear)
BIRH
, OFF
ICE
DE
THER
MA
LISM
EBI
RH, O
FFIC
E D
E TH
ERM
ALI
SME
j)With
draw
als
from
non
-co
nven
tiona
l res
ourc
esTo
tal v
olum
es a
bstr
acte
d an
nual
ly
from
wat
er re
sour
ces
othe
r th
an
surf
ace
and
grou
ndw
ater
, nam
ely,
tr
eate
d w
aste
wat
er a
nd d
esal
inat
ed
sea
wat
er
Tota
l vol
umes
abs
trac
ted
annu
ally
from
trea
ted
was
tew
ater
and
des
alin
ated
sea
wat
erO
NA
S, S
ON
EDE,
D
GG
REE,
DG
RECR
DA
, ON
AS,
SO
NED
E,
DG
GRE
E, D
GRE

31
National State of the W
ater (SOW
) Indicators
Tunisia 2012 State of the Water Report
MEW
INA
k)O
vera
ll W
ater
Use
Effi
cien
cyTh
e ra
tio o
f the
diff
eren
ce b
etw
een
the
tota
l with
draw
als
from
ori
gina
l so
urce
s (s
urfa
ce w
ater
, ren
ewab
le
and
non-
rene
wab
le g
roun
dwat
er,
and
Des
alin
ated
Wat
er) a
nd th
e w
aste
wat
er a
nd D
rain
age
flow
s to
th
e w
ithdr
awal
from
Ori
gina
l Sou
rces
ex
pres
sed
as a
per
cent
age.
OW
UE=
100*
((W
ithdr
awal
s fr
om O
rigi
nal s
ourc
es-
Was
tew
ater
and
Dra
inag
e ou
tflo
ws)
/With
draw
als
from
Ori
gina
l sou
rces
)
SON
EDE,
O
NA
S,D
GG
REE,
BPE
H,
DG
RE
CRD
A, S
ON
EDE,
ON
AS,
D
GG
REE,
BPE
H, D
GRE
l)Wat
er S
usta
inab
ility
Inde
xTh
e ra
tio o
f the
tota
l with
draw
als
from
O
rigi
nal s
ourc
es in
clud
ing
gree
n w
ater
co
nsum
ption
s by
rain
fed
agri
cultu
re
to th
e To
tal R
enew
able
Wat
er
reso
urce
s (B
lue
and
Gre
en W
ater
)
TW in
clud
ing
gree
n w
ater
con
sum
ption
s by
rain
fe
d ag
ricu
lture
/TRW
R (B
lue
and
Gre
en W
ater
)BP
EH,
DG
BGTH
,DG
GRE
E,
SON
EDE,
DG
RE
CRD
A, B
PEH
, DG
BGTH
, D
GG
REE,
SO
NED
E, O
NA
S,
BIRH
, DG
RE
m)W
aste
wat
er a
nd
Dra
inag
e O
utflo
ws
Was
tew
ater
and
Agr
icul
tura
l Dra
inag
e flo
win
g ou
t of t
he s
yste
m
PMIW
+ PA
D(o
ut o
f the
sys
tem
)O
NA
S, D
GG
REE,
DG
RECR
DA
, ON
AS,
DG
PA,
DG
GRE
E, D
GRE
, BPE
H
n)Tr
ansb
ound
ary
Was
tew
ater
and
Dra
inag
e O
utflo
ws
Was
tew
ater
and
Agr
icul
tura
l Dra
inag
e flo
win
g ou
t of t
he c
ount
ry’s
bor
ders
PMIW
+ PA
D
(out
of t
he c
ount
ry’s
bor
ders
)O
NA
S, D
GG
REE,
DG
RECR
DA
, ON
AS,
DG
GRE
E,
DG
RE, B
PEH
o)M
iner
al w
ater
con
sum
p-tio
n To
tal v
olum
e of
min
eral
wat
er
cons
umed
per
yea
r an
d pe
r ca
pita
To
tal v
olum
e of
min
eral
wat
er c
onsu
med
per
yea
r an
d pe
r ca
pita
(l/
c/y)
Min
istr
y of
Tra
de
(DC)
, Min
istr
y of
H
ealth
(Hyd
roth
erap
y
office
)
Min
istr
y of
Tra
de (D
C), M
in-
istr
y of
Hea
lth (H
ydro
ther
apy
office
)
p)N
on C
onve
ntion
al W
ater
Re
sour
ces
used
in w
ater
su
pply
Ann
ual v
olum
es o
f Non
Con
venti
onal
W
ater
Res
ourc
es u
sed
in w
ater
sup
ply
-Des
alin
ated
wat
er-T
reat
ed w
ater
Ann
ual v
olum
es o
f Non
Con
venti
onal
Wat
er
Reso
urce
s us
ed in
wat
er s
uppl
y-D
esal
inat
ed w
ater
-Tre
ated
wat
er
SON
EDE,
DG
RESO
NED
E, D
GRE
q)W
ithdr
awal
s by
diff
eren
t ec
osys
tem
s-T
otal
ann
ual v
olum
e de
dica
ted
to
mee
t the
wat
er n
eeds
of d
iffer
ent
ecos
yste
ms
(wet
land
s ar
eas,
lake
s,
sebk
has)
-Tot
al a
nnua
l vol
ume
dedi
cate
d to
mee
t the
wat
er
need
s of
diff
eren
t eco
syst
ems
(wet
land
s ar
eas,
la
kes,
seb
khas
)
AN
PE, D
GRE
AN
PE, D
GRE
4.1.
3 W
ater
&
Lan
d-U
se
Chan
ges
a)To
tal i
rrig
ated
Agr
icul
tura
l La
ndTo
tal w
ater
man
aged
agr
icul
tura
l are
aA
rea
(ha)
DG
GRE
ED
GG
REE,
DG
EDA
, CRD
As,
CN
T
b)To
tal R
ain
fed
A
gric
ultu
ral L
and
Tota
l rai
n fe
d ag
ricu
ltura
l are
aA
rea
(ha)
DG
PAD
GPA
, DG
GRE
E , D
GED
A,
CRD
As,
CN
T
c) T
otal
Pas
ture
Lan
dTo
tal r
ain
fed
past
oral
are
aA
rea
(ha)
DG
F, O
EPD
GF,
OEP
, DG
PA, D
GED
A,
CRD
As,
CN
T
d)To
tal F
ores
ts la
nd
Tota
l rai
n fe
d fo
rest
are
aA
rea
(ha)
DG
FD
GF,
DG
EDA
, CRD
As,
CN
T

32 Tunisia 2012 State of the Water Report
MEW
INA
e)U
rban
Enc
roac
hmen
t on
A
gric
ultu
ral L
and
Is th
e lo
ss o
f agr
icul
tura
l lan
d ca
used
by
urb
aniz
ation
, and
is e
xpre
ssed
by
agri
cultu
ral a
rea
lost
/ ye
ar.
The
reco
mm
ende
d ap
proa
ch d
epen
ds o
n th
e pr
esen
ce o
f hig
h re
solu
tion
Land
sat S
atel
lite
imag
es fo
r di
ffere
nt y
ears
for
the
area
or
coun
try
of in
tere
st. T
hese
imag
es a
re s
impl
y ov
erla
id a
nd
the
diffe
renc
e in
are
a be
twee
n th
em is
stu
died
by
Geo
grap
hica
l Inf
orm
ation
Sys
tem
(GIS
) soft
war
e.
DG
GRE
E, D
GPA
, D
GAC
TA, O
TED
DD
GG
REE,
DG
PA, D
GED
A,
CRD
As,
OTE
DD
, CN
T
4.1.
4 W
ater
&
Serv
ices
i)Wat
er
Cove
rage
and
A
cces
sibi
lity
a)Im
prov
ed U
rban
Wat
er
Supp
ly C
over
age
Perc
enta
ge o
f pop
ulati
on p
rovi
ded
with
pip
ed d
rink
ing
wat
er in
urb
an
area
s
% o
f pop
ulati
on p
rovi
ded
with
pip
ed d
rink
ing
wat
er in
urb
an a
reas
(sec
tor
min
istr
y)SO
NED
ESO
NED
E, IN
S
b)Im
prov
ed R
ural
Wat
er
Supp
ly C
over
age
Perc
enta
ge o
f pop
ulati
on p
rovi
ded
with
pip
ed d
rink
ing
wat
er in
rur
al
area
s
% o
f pop
ulati
on p
rovi
ded
with
pip
ed d
rink
ing
wat
er in
rur
al a
reas
(se
ctor
min
istr
y)D
GG
RRE,
SO
NED
ED
GG
REE,
GD
A, S
ON
EDE,
INS,
G
over
nora
te C
ounc
il
c)Im
prov
ed U
rban
Sa
nita
tion
Cove
rage
Perc
enta
ge o
f pop
ulati
on c
over
ed w
ith
sani
tatio
n in
urb
an a
reas
% o
f pop
ulati
on c
over
ed w
ith s
anita
tion
in u
rban
ar
eas
(sec
tor
min
istr
y)O
NA
SO
NA
S, IN
S
d)Im
prov
ed R
ural
Sa
nita
tion
Cove
rage
Perc
enta
ge o
f pop
ulati
on c
over
ed w
ith
sani
tatio
n in
rur
al a
reas
% o
f pop
ulati
on c
over
ed w
ith s
anita
tion
in r
ural
ar
eas
(sec
tor
min
istr
y)O
NA
S? D
GG
REE?
DG
GRE
E, O
NA
S, IN
S
e)Pe
rcen
tage
of p
opul
ation
w
ith im
prov
ed w
ater
su
pply
An
impr
oved
dri
nkin
g-w
ater
sou
rce
is d
efine
d as
one
that
, by
natu
re o
f its
con
stru
ction
or
thro
ugh
activ
e in
terv
entio
n, is
pro
tect
ed fr
om o
utsi
de
cont
amin
ation
% o
f pop
ulati
on w
ith im
prov
ed d
rink
ing
wat
er
sour
ce (J
MP)
SON
EDE,
DG
GRE
ESO
NED
E, D
GG
REE,
INS,
JMP
f)Pe
rcen
tage
of p
opul
ation
w
ith im
prov
ed s
anita
tion
Defi
ned
at lo
okin
g at
the
follo
win
g fa
ciliti
es a
s in
dica
tors
: Flu
sh o
r po
ur-
flush
(pip
ed s
ewer
sys
tem
, sep
tic
tank
, pit
latr
ine)
, Ven
tilat
ed Im
prov
ed
Pit l
atri
ne, p
it la
trin
e w
ith s
lab,
co
mpo
sting
toile
t
% o
f pop
ulati
on w
ith im
prov
ed s
anita
tion
faci
lities
(J
MP)
ON
AS,
DG
GRE
EO
NA
S, D
GG
REE,
INS,
JMP
F1)R
ural
dri
nkin
g w
ater
su
pply
sys
tem
s (R
DW
SS)
Num
ber
of r
ural
dri
nkin
g w
ater
sup
ply
syst
ems
(RD
WSS
)N
umbe
r of
rur
al d
rink
ing
wat
er s
uppl
y sy
stem
s (R
DW
SS)
DG
GRE
E, S
ON
EDE
SON
EDE,
DG
GRE
E, C
RDA
F2)A
gric
ultu
ral D
evel
op-
men
t Gro
ups
(AD
G)
Num
ber
of A
gric
ultu
ral D
evel
opm
ent
Gro
ups
(AD
G)
-Wat
er s
uppl
y A
DG
-Irri
gatio
n A
DG
-Joi
nt A
DG
Num
ber
of A
gric
ultu
ral D
evel
opm
ent G
roup
s (A
DG
)-W
ater
sup
ply
AD
G-Ir
riga
tion
AD
G-J
oint
AD
G
DG
GRE
E, C
RDA
DG
GRE
E, C
RDA
F3)D
rink
ing
wat
er &
Qua
lity
stan
dard
sPa
rt o
f the
dri
nkin
g w
ater
sup
plie
d,
not c
onfo
rm to
qua
lity
stan
dard
s-R
ural
are
a-U
rban
are
a
Part
of t
he d
rink
ing
wat
er s
uppl
ied,
not
con
form
to
qua
lity
stan
dard
s-R
ural
are
a-U
rban
are
a
SON
EDE,
DG
GRE
E,
DH
ME
SON
EDE,
DG
GRE
E, D
HM
PE

33
National State of the W
ater (SOW
) Indicators
Tunisia 2012 State of the Water Report
MEW
INA
F4)D
rink
ing
wat
er w
ith T
DS
<1, 5
g/
l-D
istr
ibuti
on ra
te o
f dri
nkin
g w
ater
TD
S <1
, 5 g
/ l
-Vol
ume
of d
rink
ing
wat
er d
istr
ibut
ed w
ith T
DS
<1,
5 g
/ l/
Tota
l dri
nkin
g w
ater
dis
trib
uted
vol
ume
-Rur
al a
rea
-Urb
an a
rea
SON
EDE,
DG
GRE
ESO
NED
E, D
GG
REE
F5)U
tiliz
ation
of b
rack
ish
wat
er T
DS>
5 g
/ l
in
irri
gate
d s
ecto
r
Util
izati
on ra
te o
f bra
ckis
h w
ater
with
TD
S> 5
g /
l in
irri
gate
d se
ctor
Volu
me
utiliz
ed o
f bra
ckis
h w
ater
with
TD
S> 5
g /
l in
irri
gate
d se
ctor
/Tot
al v
olum
e of
wat
er u
sed
DG
GRE
E, D
GPA
, D
GAC
TA,
INRG
REF
DG
GRE
E, D
GPA
, DG
ACTA
,IN
RGRE
F
F6)T
reat
ed w
aste
wat
er&
Qua
lity
stan
dard
sPa
rt o
f tre
ated
was
tew
ater
prod
uced
, not
con
form
to q
ualit
y st
anda
rds
(tre
atm
ent s
tage
1, tr
eatm
ent s
tage
2,
trea
tmen
t sta
ge3)
Part
of t
reat
ed w
aste
wat
erpr
oduc
ed, n
ot c
onfo
rm to
qua
lity
stan
dard
s(t
reat
men
t sta
ge1,
trea
tmen
t sta
ge2,
trea
tmen
t st
age3
)
ON
AS,
DG
GRE
EO
NA
S, D
GG
REE
ii)W
ater
In
fras
truc
ture
:g)
Len
gths
of N
etw
orks
(W
ater
Sup
ply,
Sew
age,
Ir
riga
tion,
and
Dra
inag
e).
Leng
ths
of N
etw
orks
(Wat
er S
uppl
y,
Sew
age,
Irri
gatio
n, a
nd D
rain
age)
.Le
ngth
s of
Net
wor
ks (W
ater
Sup
ply,
Sew
age,
Ir
riga
tion,
and
Dra
inag
e) in
km
.D
GG
REE,
SO
NED
E,
ON
AS
DG
GRE
E, S
ON
EDE,
ON
AS,
D
GBG
TH, S
ECA
DEN
ORD
, CR
DA
h)D
am S
tora
ge C
apac
ityTh
e to
tal c
apac
ity o
f all
wat
er
regu
latin
g st
ruct
ures
inst
alle
d.To
tal c
apac
ity o
f all
wat
er re
gula
ting
stru
ctur
es
inst
alle
d (B
CM/y
).D
GBG
TH, S
ON
EDE,
SE
CAD
ENO
RD,
DG
ACTA
DG
BGTH
, SO
NED
E,
SECA
DEN
ORD
, DG
ACTA
i)Wat
er S
uppl
y Ca
paci
tyD
efine
d as
the
tota
l Dri
nkin
g W
ater
Tr
eatm
ent C
apac
ity, i
n ot
her
wor
ds
it is
the
sum
mati
on o
f the
pot
entia
l ca
paci
ties
of a
ll dr
inki
ng w
ater
pla
nts
-Tot
al D
rink
ing
Wat
er T
reat
men
t Cap
acity
(M
CM/y
), -S
umm
ation
of t
he p
oten
tial c
apac
ities
of a
ll dr
inki
ng w
ater
pla
nts
(MCM
/y)
SON
EDE,
DG
GRE
ESO
NED
E, D
GG
REE,
CRD
As
j)Des
alin
ation
cap
acity
The
tota
l cap
acity
of a
ll de
salin
ation
pl
ants
Tota
l cap
acity
of a
ll de
salin
ation
pla
nts
(MCM
/y)
SON
EDE,
DG
RESO
NED
E, C
RDA
, Pri
vate
us
ers,
k)N
umbe
r of
wat
er s
uppl
y m
eter
s in
stal
led
Num
ber
of w
ater
sup
ply
met
ers
inst
alle
dN
umbe
r of
wat
er s
uppl
y m
eter
s in
stal
led
SON
EDE,
DG
GRE
E,SO
NED
E, D
GG
REE,
CRD
A,
DG
BGTH
, DG
ACTA
, SE
CAD
ENO
RD
l) M
unic
ipal
Was
tew
ater
Tr
eatm
ent C
apac
ityTo
tal c
apac
ity o
f all
Mun
icip
al
Was
tew
ater
Tre
atm
ent P
lant
s (M
CM/
Year
)
Tota
l cap
acity
of a
ll M
unic
ipal
Was
tew
ater
Tr
eatm
ent P
lant
s (M
CM/Y
ear)
ON
AS
ON
AS
m) I
ndus
tria
l Was
tew
ater
Tr
eatm
ent C
apac
ityTo
tal c
apac
ity o
f all
Indu
stri
al
Was
tew
ater
Tre
atm
ent P
lant
s (M
CM/
Year
)
Tota
l cap
acity
of a
ll In
dust
rial
Was
tew
ater
Tr
eatm
ent P
lant
s (M
CM/Y
ear)
ON
AS
ON
AS
n) W
aste
wat
er C
olle
ction
Ca
paci
ty (A
dditi
onal
)Is
the
sum
of M
unic
ipal
and
Indu
stri
al
Was
tew
ater
Tre
atm
ent C
apac
ityIs
the
sum
of M
unic
ipal
and
Indu
stri
al W
aste
wat
er
Trea
tmen
t Cap
acity
ON
AS
ON
AS
o)Tr
ansf
er c
apac
ity o
f W
ater
reso
urce
s (m
ainl
y N
orth
ern
Wat
ers)
Tota
l tra
nsfe
r ca
paci
ty o
f Nor
ther
n w
ater
s ne
twor
k in
a g
iven
yea
rTe
chni
cal d
esig
n da
ta d
raw
ings
for
pum
ping
st
ation
s, m
anm
ade
rese
rvoi
rs; h
ydro
grap
hic
surv
eys
and
netw
orks
.
SECA
DEN
ORD
, SO
NED
E, D
GBG
THSE
CAD
ENO
RD, S
ON
EDE,
D
GBG
TH

34 Tunisia 2012 State of the Water Report
MEW
INA
4.1.
5 W
ater
&
Ener
gya)
Elec
tric
ity g
ener
ated
us
ing
Hyd
ropo
wer
(GW
h/Ye
ar)
Elec
tric
ity g
ener
ated
usi
ng
Hyd
ropo
wer
(GW
h/Ye
ar).
Hyd
ropo
wer
pro
ducti
on a
s pe
rcen
t of
tota
l ele
ctri
city
pro
ducti
on (W
ord
Bank
).
Hyd
ropo
wer
pro
ducti
on a
s pe
rcen
t of t
otal
el
ectr
icity
pro
ducti
on (W
orld
Ban
k).
-For
all
Hyd
ropo
wer
gen
erati
on p
lant
s , t
he
follo
win
g tw
o pa
ram
eter
s sh
ould
be
know
n:
(i)
Hea
d (h
): Th
e Ve
rtica
l dis
tanc
e be
twee
n th
e w
ater
inta
ke a
nd th
e Tu
rbin
e
(ii)
Flow
(q)
: Ins
ide
the
Turb
ine
-Pth = ρ q g h
-Som
e of
the
pow
er g
ener
ated
is lo
st d
ue
to fr
ictio
n in
side
the
Turb
ine,
ther
efor
e th
e th
eore
ttica
l Pow
er is
cor
rect
ed b
y m
ultip
lyin
g it
by
a fa
ctor
.
Min
istr
y of
Indu
stry
, ST
EGST
EG, I
NS
b)In
stal
led
Hyd
ropo
wer
ca
paci
ty (M
W)
Sum
of a
ll ge
nera
tor
nam
epla
te p
ower
ra
tings
(in G
W) f
rom
the
inst
alle
d H
ydro
pow
er P
lant
s (A
MCO
W,2
012)
Sum
of a
ll ge
nera
tor
nam
epla
te p
ower
ratin
gs
(in G
W) f
rom
the
inst
alle
d H
ydro
pow
er P
lant
s (A
MCO
W, 2
012)
or th
e m
axim
um r
unoff
of a
hyd
roel
ectr
ic fa
cilit
y th
at c
an b
e co
nsta
ntly
mai
ntai
ned
and
utiliz
ed b
y eq
uipm
ent
Min
istr
y of
Indu
stry
, ST
EGST
EG, I
NS
b bu
s)W
ater
Use
d to
ge
nera
te E
lect
rici
ty (M
CM/
Year
) (A
dditi
onal
)
Wat
er U
sed
to g
ener
ate
Elec
tric
ity
(MCM
/Yea
r)W
ater
Use
d to
gen
erat
e El
ectr
icity
(MCM
/Yea
r)M
inis
try
of In
dust
ry,
STEG
, DG
BGTH
STEG
, DG
BGTH
4.1.
6 W
ater
&
Popu
latio
nc)
Inte
rnal
Ren
ewab
le W
ater
Re
sour
ces
per
capi
taTh
e m
axim
um th
eore
tical
am
ount
of
wat
er p
rodu
ced
inte
rnal
ly a
nd a
ctua
lly
avai
labl
e, o
n a
per
per
son
basi
s
IRW
R /
Tota
l pop
ulati
on in
m3 /
y/c.
DG
RE, I
NS
DG
RE, D
GBG
TH, B
PEH
, IN
S
d) T
otal
Ren
ewab
le B
lue
Wat
er R
esou
rces
per
cap
ita
The
max
imum
theo
retic
al a
mou
nt
of w
ater
act
ually
ava
ilabl
e, o
n a
per
pers
on b
asis
TRBW
R/To
tal p
opul
ation
in m
3 /y/
c.D
GRE
, IN
S D
GRE
, DG
BGTH
, BPE
H, I
NS
e)To
tal P
opul
ation
Tota
l pop
ulati
onTo
tal p
opul
ation
INS
INS
f)In
tern
al R
enew
able
wat
er
reso
urce
s pe
r ca
pita
Long
-ter
m a
vera
ge a
nnua
l flow
of
riv
ers
and
rech
arge
of a
quife
rs
gene
rate
d fr
om e
ndog
enou
s pr
ecip
itatio
n, o
n a
per
pers
on b
asis
IRW
R/To
tal p
opul
ation
in m
3 /y/
c.D
GRE
, IN
SD
GRE
, BPE
H, I
NS
g)To
tal S
urfa
ce R
enew
able
Bl
ue w
ater
reso
urce
s pe
r Ca
pita
Is th
e re
sulta
nt o
f the
inte
rnal
pr
oduc
ed s
urfa
ce w
ater
and
the
tran
sbou
ndar
y in
flow
s an
d ou
tflo
ws
of
surf
ace
wat
er, o
n a
per
pers
on b
asis
.
TSRB
WR/
Tota
l pop
ulati
on in
m3 /
y/c.
DG
RE, I
NS
DG
RE, D
GBG
TH, B
PEH
, IN
S
h)To
tal R
enew
able
Wat
er
Reso
urce
s pe
r ca
pita
Is th
e su
m o
f tot
al re
new
able
blu
e an
d gr
een
wat
er re
sour
ces,
on
a pe
r pe
rson
bas
is
(TRB
WR+
TRG
WR)
/Tot
al p
opul
ation
in
m3 /
y/c.
DG
RE, I
NS
DG
RE, D
GBG
TH, B
PEH
, IN
S

35
National State of the W
ater (SOW
) Indicators
Tunisia 2012 State of the Water Report
MEW
INA
i)Blu
e w
ater
With
draw
als
per
capi
taTo
tal a
nnua
l abs
trac
tions
from
sur
face
an
d gr
ound
wat
er s
ourc
es in
clud
ing
non-
rene
wab
le g
roun
dwat
er a
nd
seco
ndar
y fr
eshw
ater
sou
rces
(wat
er
prev
ious
ly w
ithdr
awn
and
retu
rned
), on
a p
er p
erso
n ba
sis.
Tota
l ann
ual a
bstr
actio
ns/
Tota
l pop
ulati
on in
m3
/y/c
.D
GRE
, DG
GRE
E, IN
SD
GRE
, DG
BGTH
, DG
GRE
E,
BPEH
, IN
S
j) G
reen
Wat
er
Cons
umpti
ons
per
capi
taTh
e to
tal a
mou
nt o
f pre
cipi
tatio
n di
rect
ly c
onsu
med
by
past
ure
area
s,
rain
fed
area
s, a
nd fo
rest
are
as, o
n a
per
pers
on b
asis
.
Tota
l am
ount
of p
reci
pita
tion
dire
ctly
con
sum
ed
by p
astu
re a
reas
, rai
n fe
d ar
eas,
and
fore
st a
reas
/
Tota
l pop
ulati
on in
m
3 /y/
c.
DG
RE, I
NS
DG
RE, D
GED
A, D
GPA
, BPE
H,
INS
k)To
tal A
vaila
ble
Wat
er
Reso
urce
s pe
r ca
pita
The
sum
of r
enew
able
, non
rene
wab
le
and
non
conv
entio
nal W
ater
Re
sour
ces
on a
per
per
son
basi
s.
(RW
R+N
RWR+
NCW
R)/
Tota
l pop
ulati
on in
m
3 /y/
c.D
GRE
, IN
SD
GRE
, DG
EDA
, SO
NED
E,
ON
AS,
BPE
H, I
NS
l) To
tal W
ater
Con
sum
ption
pe
r ca
pita
The
gros
s am
ount
of w
ater
ext
ract
ed
by a
ll se
ctor
s fr
om a
ll so
urce
s, e
ither
pe
rman
ently
or
tem
pora
rily
, on
a pe
r pe
rson
bas
is
Wat
er e
xtra
cted
by
all s
ecto
rs fr
om a
ll so
urce
s/
Tota
l pop
ulati
on in
m3 /
y/c.
DG
RE, D
GG
REE,
INS
DG
RE, D
GG
REE,
SO
NED
E,
BPEH
, IN
S
m) A
gric
ultu
ral W
ater
W
ithdr
awal
s pe
r ca
pita
The
sum
of t
otal
agr
icul
tura
l ab
stra
ction
s fr
om b
lue
wat
er, a
nd
dire
ct b
enefi
cial
abs
trac
tions
from
pr
ecip
itatio
n in
rain
fed
area
s, o
n a
per
pers
on b
asis
Agr
icul
tura
l abs
trac
tions
from
blu
e w
ater
, and
di
rect
ben
efici
al a
bstr
actio
ns fr
om p
reci
pita
tion
in
rain
fed
area
s/ T
otal
pop
ulati
on in
m3 /
y/c.
DG
RE, D
GG
REE,
D
GED
A,D
GPA
, BPE
H,
INS
DG
RE, D
GG
REE,
D
GED
A,D
GPA
, BPE
H, I
NS
n)In
dust
rial
Wat
er
With
draw
als
per
capi
taTo
tal a
nnua
l vol
ume
of w
ater
w
ithdr
awal
s us
ed fo
r in
dust
rial
pu
rpos
es o
n a
per
pers
on b
asis
Tota
l ann
ual v
olum
e of
wat
er w
ithdr
awal
s us
ed fo
r in
dust
rial
pur
pose
s/To
tal p
opul
ation
in m
3 /y/
c.D
GRE
, DG
GRE
E, B
PEH
, IN
SD
GRE
, DG
GRE
E, D
GED
A,
BPEH
, IN
S
o) D
omes
tic W
ater
W
ithdr
awal
s pe
r ca
pita
Tota
l ann
ual v
olum
e of
wat
er
with
draw
als
used
for
dom
estic
pu
rpos
es o
n a
per
pers
on b
asis
Tota
l ann
ual v
olum
e of
wat
er w
ithdr
awal
s us
ed fo
r do
mes
tic p
urpo
ses/
Tot
al p
opul
ation
in m
3 /y/
c.D
GRE
, DG
GRE
E, IN
SD
GRE
, DG
GRE
E, S
ON
EDE,
BP
EH, I
NS
p)Po
pula
tion
with
out
Impr
oved
Wat
er S
uppl
yTh
e to
tal p
opul
ation
with
out
impr
oved
Wat
er S
uppl
yTo
tal p
opul
ation
with
out i
mpr
oved
Wat
er S
uppl
yD
GG
REE,
SO
NED
E, IN
SD
GG
REE,
SO
NED
E, IN
S
q) P
opul
ation
with
out
Ade
quat
e Sa
nita
tion
The
tota
l pop
ulati
on w
ithou
t im
prov
ed S
anita
tion
Tota
l pop
ulati
on w
ithou
t im
prov
ed S
anita
tion
DG
GRE
E, O
NA
S,IN
SD
GG
REE,
ON
AS,
INS
4.1.
7 W
ater
&
Hea
ltha)
Dia
rrhe
a pr
eval
ence
% o
f chi
ldre
n un
der
five
suffe
ring
from
D
iarr
hea
% o
f mor
talit
y of
chi
ldre
n un
der
five
suffe
ring
fr
om D
iarr
hea
Min
istr
y of
Hea
lth,
DH
MPE
Min
istr
y of
Hea
lth, D
HM
PE,
INS
b)D
racu
ncul
iasi
s re
port
ed
case
sN
umbe
r of
ann
ual i
ncid
ents
of t
he
dise
ase
Num
ber
of a
nnua
l inc
iden
ts o
f the
dis
ease
Min
istr
y of
Hea
lth,
DH
MPE
Min
istr
y of
Hea
lth, D
HM
PE,
INS
(dis
ease
not
cur
rent
ly
mon
itore
d)
c)Ch
oler
a re
port
ed c
ases
Num
ber
of a
nnua
l inc
iden
ts o
f the
di
seas
e N
umbe
r of
ann
ual i
ncid
ents
of t
he d
isea
se
Min
istr
y of
Hea
lth,
DH
MPE
Min
istr
y of
Hea
lth, D
HM
PE,
INS
d)O
pen
Def
ecati
on p
racti
ceN
umbe
r of
peo
ple
who
con
tinue
to
prac
tice
open
def
ecati
on
Num
ber
of p
eopl
e w
ho c
ontin
ue to
pra
ctice
ope
n de
feca
tion
Min
istr
y of
Hea
lth,
DH
MPE
M
inis
try
of
Envi
ronm
ent,
ON
AS,
IN
S
Min
istr
y of
Hea
lth, D
HM
PE,
INS
Min
istr
y of
Env
ironm
ent,
O
NA
S

36 Tunisia 2012 State of the Water Report
MEW
INA
e)Pe
rcen
tage
of o
pen
defe
catio
n%
of p
opul
ation
pra
ctici
ng o
pen
defe
catio
n %
of p
opul
ation
pra
ctici
ng o
pen
defe
catio
n M
inis
try
of H
ealth
, D
HM
PE
Min
istr
y of
En
viro
nmen
t, O
NA
S,
INS
Min
istr
y of
Hea
lth, D
HM
PE,
INS
Min
istr
y of
Env
ironm
ent,
O
NA
S
f)H
epati
tis A
repo
rted
ca
ses
-Num
ber
of a
nnua
l inc
iden
ts o
f the
di
seas
e-N
umbe
r of
ann
ual i
ncid
ents
of t
he d
isea
seD
HM
PED
HM
PE
g) T
ypho
id fe
ver
repo
rted
ca
ses
-Num
ber
of a
nnua
l inc
iden
ts o
f the
di
seas
e-N
umbe
r of
ann
ual i
ncid
ents
of t
he d
isea
seD
HM
PED
HM
PE
h) C
hole
ra re
port
ed c
ases
(A
dditi
onal
)-N
umbe
r of
ann
ual i
ncid
ents
of t
he
dise
ase
-Num
ber
of a
nnua
l inc
iden
ts o
f the
dis
ease
DH
MPE
DH
MPE
4.1.
8 W
ater
&
Qua
lity
The
Wat
er
Qua
lity
Inde
xW
QI
WQ
I mea
sure
s di
ssol
ved
oxyg
en,
pH, c
ondu
ctivi
ty, t
otal
nitr
ogen
, and
to
tal p
hosp
horu
s. It
is a
n in
dica
tor
of
eutr
ophi
catio
n, n
utri
ent p
ollu
tion,
ac
idifi
catio
n, a
nd s
alin
izati
on.
WQ
I mea
sure
s di
ssol
ved
oxyg
en, p
H, c
ondu
ctivi
ty,
tota
l nitr
ogen
, and
tota
l pho
spho
rus.
WQ
I=10
0-((
F12 +F
22 +F32 )1/
2 )/1.
732
F1:%
of f
aile
d va
riab
les
(sco
pe)
F2: %
of f
aile
d te
sts
(fre
quen
cy)
F3: A
mou
nt b
y w
hich
faile
d te
sts
exce
ed
guid
elin
es (m
agni
tude
) W
QI b
etw
een
80-9
4: G
ood
WQ
I bet
wee
n 6
5-79
: Fai
r
a)D
isso
lved
oxy
gen
(D0)
Dis
solv
ed o
xyge
n is
a m
easu
re o
f fre
e (i.
e., n
ot c
hem
ical
ly c
ombi
ned)
oxy
gen
diss
olve
d in
wat
er
It c
an b
e m
easu
red
with
a d
isso
lved
oxy
gen
prob
e su
ch a
s an
oxy
gen
sens
or o
r an
opt
ode
in li
quid
m
edia
, usu
ally
wat
er. T
he s
tand
ard
unit
is
milli
gram
s pe
r lite
r (m
g/l)
or p
arts
per
milli
on
(ppm
)
DG
RE,
DH
MPE
SON
EDE
AN
PE, O
NA
S
DG
RE, D
GAC
TAD
HM
PESO
NED
EA
NPE
, ON
AS
b)pH
Is a
mea
sure
of t
he a
cidi
ty o
r al
kalin
ity
of a
wat
er b
ody
pH is
the
mea
sure
of a
cidi
ty o
r ba
sici
ty o
f so
lutio
ns.
Mat
hem
atica
lly, p
H is
the
nega
tive
loga
rith
m o
f th
e ac
tivity
of t
he h
ydro
nium
ion,
mor
e oft
en
expr
esse
d as
the
mea
sure
of t
he h
ydro
nium
ion
conc
entr
ation
. Th
e pH
of p
ure
wat
er is
abo
ut 7
at 2
5 °C
; thi
s va
lue
vari
es w
ith te
mpe
ratu
re.
DG
RE,
DH
MPE
SON
EDE
AN
PE, O
NA
S
DG
RE, D
GAC
TAD
HM
PESO
NED
EA
NPE
, ON
AS
c) E
lect
ric
Cond
uctiv
ity (E
C)Is
a m
easu
re o
f the
abi
lity
of w
ater
to
car
ry a
n el
ectr
ic c
urre
nt, w
hich
de
pend
s on
the
pres
ence
of i
ons.
In
crea
ses
in c
ondu
ctivi
ty c
an le
ad to
ch
ange
s th
at re
duce
bio
dive
rsity
and
al
ter
com
mun
ity c
ompo
sitio
n
-In m
any
case
s, c
ondu
ctivi
ty is
link
ed d
irect
ly to
th
e To
tal D
isso
lved
Sol
ids
(T.D
.S.).
Hig
h qu
ality
de
ioni
zed
wat
er h
as a
con
ducti
vity
of a
bout
5.5
μS
/m, t
ypic
al d
rink
ing
wat
er in
the
rang
e of
5-5
0 m
S/m
, whi
le s
ea w
ater
abo
ut 5
S/m
(i.e
., se
a w
ater
’s c
ondu
ctivi
ty is
one
mill
ion
times
hig
her
than
that
of d
eion
ized
wat
er).
-It is
mea
sure
d w
ith a
con
ducti
vity
met
er
DG
RE, D
GAC
TAD
HM
PESO
NED
E,
SECA
DEN
ORD
AN
PE, O
NA
S
DG
RE, D
GAC
TAD
HM
PESO
NED
E, S
ECA
DEN
ORD
AN
PE, O
NA
SCR
DA

37
National State of the W
ater (SOW
) Indicators
Tunisia 2012 State of the Water Report
MEW
INA
d)N
itrog
en a
nd p
hosp
horu
sA
re n
atur
ally
occ
urri
ng e
lem
ents
es
senti
al fo
r al
l liv
ing
orga
nism
s.
Incr
ease
s in
N a
nd P
in n
atur
al w
ater
s,
larg
ely
as
a re
sult
of h
uman
acti
vitie
s in
the
drai
nage
bas
in c
an o
vere
stim
ate
plan
t gro
wth
and
cho
ke o
ff o
xyge
n su
pplie
s
-The
che
apes
t and
sim
ples
t met
hod
to a
naly
ze
wat
er s
ampl
es fo
r ph
osph
ate
and
nitr
ate
conc
entr
ation
is th
e us
e of
che
mic
al te
sts.
-T
he P
hoto
met
er w
ill a
llow
pre
cise
inte
rpre
tatio
n of
col
ors
into
mg/
l.
DG
RE, D
HM
PESO
NED
EA
NPE
, ON
AS
DG
RE, D
GAC
TAD
HM
PESO
NED
EA
NPE
, ON
AS
e)To
tal D
isso
lved
Sol
ids
TDS
(ppm
)To
tal D
isso
lved
Sol
ids
TDS
(ppm
)O
ven
dryi
ng w
ater
sam
ples
C
hem
ical
te
sts
DG
RE, D
HM
PESO
NED
EA
NPE
, ON
AS
DG
RE, D
GAC
TAD
HM
PESO
NED
EA
NPE
, ON
AS
f)Fe
cal C
holif
orm
(C
olon
ies/
100
ml)
(Add
ition
al)
Feca
l Cho
lifor
m (
Colo
nies
/100
ml)
Feca
l Cho
lifor
m
DG
RE, D
HM
PESO
NED
EA
NPE
, ON
AS
DG
RE, D
GAC
TAD
HM
PESO
NED
EA
NPE
, ON
AS
4.1.
9 W
ater
&
Ecos
yste
ms
a)N
umbe
r of
wet
land
s si
tes
ackn
owle
dged
by
RAM
SAR
Num
ber
of w
etla
nds
site
s ac
know
ledg
ed b
y RA
MSA
RN
umbe
r of
wet
land
s si
tes
Min
istr
y of
En
viro
nmen
t, A
NPE
Min
istr
y of
A
gric
ultu
re, D
GRE
, D
GF
INS
Min
istr
y of
Env
ironm
ent,
A
NPE
DG
RE, D
GF,
INS
b)To
tal W
etla
nds
area
s (t
o be
cal
cula
ted
by e
arth
ob
serv
ation
tool
s)
Tota
l Wet
land
s ar
eas
Tota
l Wet
land
s ar
eas
(to
be c
alcu
late
d by
ear
th
obse
rvati
on to
ols)
in h
a.M
inis
try
of
Envi
ronm
ent,
AN
PEM
inis
try
of
Agr
icul
ture
, DG
RE,
DG
FIN
S
Min
istr
y of
Env
ironm
ent,
A
NPE
DG
RE, D
GF,
INS
c)To
tal F
resh
wat
er S
peci
es
Coun
tTo
tal F
resh
wat
er S
peci
es C
ount
Num
ber
DG
F, W
WF
Med
, A
NPE
DG
F, W
WF
Med
, AN
PE
d)N
umbe
r of
End
ange
red
Spec
ies
(Add
ition
al)
Num
ber
of E
ndan
gere
d Sp
ecie
sN
umbe
rD
GF,
WW
F M
ed,
AN
PED
GF,
WW
F M
ed, A
NPE
e)N
umbe
r of
Inva
sive
Sp
ecie
s(A
dditi
onal
)
Num
ber
of In
vasi
ve S
peci
esN
umbe
rD
GF,
WW
F M
ed,
AN
PED
GF,
WW
F M
ed, A
NPE
4.1.
10 W
ater
&
Clim
ate
i)Ext
rem
e W
eath
er E
vent
sf)
Floo
d ev
ents
in th
e la
st
two
deca
des
A fl
ood
is d
efine
d as
an
over
flow
of
a la
rge
amou
nt o
f wat
er b
eyon
d its
no
rmal
lim
its, e
spec
ially
ove
r w
hat i
s no
rmal
ly d
ry la
nd.
-Cos
t of A
nnua
l dam
age
indu
ced
by fl
oods
-Hum
an L
osse
sD
GRE
, IN
M, M
inis
try
of In
teri
or,
Civi
l Pr
otec
tion
Min
istr
y o
f Agr
icul
ture
, BP
EH,
DG
RE, C
RDA
, CN
T, C
ivil
prot
ectio
n

38 Tunisia 2012 State of the Water Report
MEW
INA
g)Fl
ash-
flood
eve
nts
in th
e la
st tw
o de
cade
s A
flas
h flo
od is
defi
ned
as a
n ov
erflo
w
of a
larg
e am
ount
of w
ater
ove
r w
hat
is n
orm
ally
dry
land
, due
to h
eavy
ra
in.
-Cos
t of A
nnua
l dam
age
indu
ced
by fl
ash
flood
s-H
uman
Los
ses
DG
RE, I
NM
, Min
istr
y of
Inte
rior
, Ci
vil
Prot
ectio
n
Min
istr
y o
f Agr
icul
ture
,D
GRE
, CRD
A, C
NT
Civi
l pro
tecti
on
h)N
umbe
r of
Cla
ss 1
Flo
od
Even
tsCl
ass
1 flo
ods
are
larg
e flo
od e
vent
s ca
usin
g si
gnifi
cant
dam
age
to
stru
ctur
es o
r ag
ricu
lture
; fat
aliti
es;
and/
or 1
-2 d
ecad
es-lo
ng re
port
ed
inte
rval
sin
ce th
e la
st s
imila
r ev
ent
(Dar
tmou
th, 2
013)
Num
ber
DG
RE, I
NM
, Min
istr
y of
Inte
rior
, Ci
vil
Prot
ectio
n
Min
istr
y o
f Agr
icul
ture
,D
GRE
, CRD
A, C
NT
Civi
l pro
tecti
on
i) N
umbe
r of
Cla
ss 1
.5
Floo
d Ev
ents
Clas
s 1.
5 flo
ods
are
very
larg
e ev
ents
: w
ith a
gre
ater
than
2 d
ecad
es b
ut le
ss
than
100
yea
r es
timat
ed re
curr
ence
in
terv
al, a
nd/o
r a
loca
l rec
urre
nce
inte
rval
of a
t 1-2
dec
ades
and
affe
cting
a
larg
e ge
ogra
phic
regi
on (>
500
0 sq
. km
) (D
artm
outh
, 201
3)
Num
ber
DG
RE, I
NM
, Min
istr
y of
Inte
rior
, Civ
il Pr
otec
tion
Min
istr
y o
f Agr
icul
ture
,D
GRE
, CRD
A, C
NT
Civi
l pro
tecti
on
j)Num
ber
of C
lass
2 F
lood
Ev
ents
Clas
s 2
flood
eve
nts
are
ext
rem
e ev
ents
with
an
estim
ated
recu
rren
ce
inte
rval
gre
ater
than
100
yea
rs
(Dar
tmou
th, 2
013)
Num
ber
DG
RE, I
NM
, Min
istr
y of
Inte
rior
, Civ
il Pr
otec
tion
Min
istr
y o
f Agr
icul
ture
,D
GRE
, CRD
A, C
NT
Civi
l pro
tecti
on
k)D
roug
ht e
vent
s in
the
last
tw
o de
cade
sA
dro
ught
eve
nt is
a lo
ng p
erio
d of
ab
norm
ally
low
rain
fall,
esp
ecia
lly o
ne
that
adv
erse
ly a
ffect
s gr
owin
g or
livi
ng
cond
ition
s.
-Cos
t of A
nnua
l dam
age
indu
ced
by d
roug
hts
-Hum
an L
osse
sD
GRE
, IN
M, M
inis
try
of In
teri
or, C
ivil
Prot
ectio
n
Min
istr
y o
f Agr
icul
ture
, D
GRE
, CRD
A, C
NT
l)Unu
sual
Wea
ther
Ev
ents
(Sno
w, h
ail,
etc.
) (A
dditi
onal
)
Unu
sual
Wea
ther
Eve
nts
(Sno
w, h
ail,
etc.
)N
umbe
r/Ty
peIN
M, D
GRE
INM
, DG
RE, D
GPA
, CRD
A,
Civi
l Pro
tecti
on
m)E
xist
ence
of E
arly
W
arni
ng D
isas
ter
prev
entio
n Sy
stem
and
Yea
r of
est
ablis
hmen
t
Exis
tenc
e of
Ear
ly W
arni
ng D
isas
ter
prev
entio
n Sy
stem
and
Yea
r of
es
tabl
ishm
ent
Exis
tenc
e of
Ear
ly W
arni
ng D
isas
ter
prev
entio
n Sy
stem
and
Yea
r of
est
ablis
hmen
t (Ye
s/N
o)D
GRE
, IN
M, M
inis
try
of In
teri
or, C
ivil
Prot
ectio
n
Min
istr
y o
f Agr
icul
ture
D
GRE
, CN
T
n)Cl
imat
e Ch
ange
A
dapt
ation
: Nati
onal
A
dapt
ation
Pla
n (Y
es/N
o)
Nati
onal
Ada
ptati
on P
lan
(Yes
/No)
Nati
onal
Ada
ptati
on P
lan
(Yes
/No)
DG
RE, D
GEQ
V, O
TED
DM
inis
try
of A
gric
ultu
re,
DG
RE,
Min
istr
y of
Env
ironm
ent,
AN
PE, O
TED
D
4.1.
11 W
ater
&
Soci
o-Ec
onom
ics
i)Wat
er
prod
ucti
vity
a)In
dust
rial
wat
er
prod
uctiv
ityIn
dust
rial
GD
P/(In
dust
rial
wat
er
with
draw
al),
Econ
omic
val
ue a
dded
(in
US$
) per
cub
ic m
eter
of w
ater
w
ithdr
awn
by in
dust
ry; t
he g
ross
in
dust
rial
reve
nue
divi
ded
by th
e to
tal
indu
stri
al w
ater
con
sum
ption
-Indu
stri
al G
DP/
(Indu
stri
al w
ater
with
draw
al),
- The
gro
ss in
dust
rial
reve
nue
divi
ded
by th
e to
tal
indu
stri
al w
ater
con
sum
ption
-Val
ue in
US$
DG
RE, D
GG
REE,
BP
EH, I
NS,
Min
istr
y of
In
dust
ry
Min
istr
y of
Indu
stry
Min
istr
y of
Agr
icul
ture
, D
GRE
, DG
GRE
E, B
PEH
INS

39
National State of the W
ater (SOW
) Indicators
Tunisia 2012 State of the Water Report
MEW
INA
b) A
gric
ultu
ral w
ater
pr
oduc
tivity
“Cr
op p
er
Dro
p”
Econ
omic
val
ue a
dded
in (U
S$) p
er
cubi
c m
eter
of w
ater
with
draw
n by
ag
ricu
lture
: In
othe
r w
ords
, it i
s th
e gr
oss
agri
cultu
ral r
even
ue d
ivid
ed
by th
e to
tal a
gric
ultu
ral w
ater
co
nsum
ption
(inc
ludi
ng ir
riga
tion
with
draw
als
and
rain
fed
agri
cultu
re
gree
n w
ater
con
sum
ption
).
-The
gro
ss a
gric
ultu
ral r
even
ue d
ivid
ed b
y th
e to
tal a
gric
ultu
ral w
ater
con
sum
ption
(inc
ludi
ng
irri
gatio
n w
ithdr
awal
s an
d ra
in fe
d ag
ricu
lture
gr
een
wat
er c
onsu
mpti
on).
-Val
ue in
US$
DG
RE, D
GG
REE,
BPE
H,
INS,
DG
EDA
, Min
istr
y of
Agr
icul
ture
Min
istr
y of
Agr
icul
ture
, D
GRE
, DG
GRE
E, B
PEH
, CRD
AIN
S
c)Em
ploy
men
t in
Agr
icul
ture
“Jo
b pe
r D
rop”
The
ratio
of t
otal
labo
r em
ploy
ed in
A
gric
ultu
re t
o th
e to
tal w
ithdr
awal
s (in
clud
ing
irri
gatio
n w
ithdr
awal
s an
d ra
in fe
d ag
ricu
lture
gre
en w
ater
co
nsum
ption
)
-Tot
al la
bor
empl
oyed
in A
gric
ultu
re /
Tota
l w
ithdr
awal
s (in
clud
ing
irri
gatio
n w
ithdr
awal
s an
d ra
in fe
d ag
ricu
lture
gre
en w
ater
con
sum
ption
)
DG
RE, D
GG
REE,
BPE
H,
INS,
DG
EDA
, Min
istr
y of
Agr
icul
ture
Min
istr
y of
Agr
icul
ture
, D
GRE
, DG
GRE
E, B
PEH
, D
GED
A C
RDA
, IN
S
d) E
mpl
oym
ent i
n In
dust
ry
“Job
per
Dro
p”Th
e ra
tio o
f tot
al la
bor
empl
oyed
in
indu
stry
to th
e to
tal i
ndus
tria
l w
ithdr
awal
s
-Tot
al la
bor
empl
oyed
in in
dust
ry /
Tota
l ind
ustr
ial
with
draw
als
DG
RE, D
GG
REE,
BP
EH, I
NS,
Min
istr
y of
In
dust
ry
Min
istr
y of
Indu
stry
Min
istr
y of
Agr
icul
ture
, D
GRE
, DG
GRE
E, B
PEH
, D
GED
A, C
RDA
, IN
S
ii) T
ariff
s an
d A
ffor
dabi
lity
a)W
ater
and
San
itatio
n ch
arge
s as
% o
f ave
rage
ho
useh
old
inco
me:
The
mon
thly
cha
rge
for
10 c
ubic
m
eter
s of
wat
er c
ompa
red
to th
e m
onth
ly h
ouse
hold
inco
me.
The
ho
useh
old
Inco
me
is e
stim
ated
as
five
times
the
Gro
ss N
ation
al In
com
e (G
NI)
per
capi
ta.
-GN
I per
cap
ita (f
orm
erly
GN
P pe
r ca
pita
) is
the
gros
s na
tiona
l inc
ome,
con
vert
ed to
US$
usi
ng th
e W
ord
Bank
Atla
s m
etho
d, d
ivid
ed b
y th
e m
idye
ar
popu
latio
n.G
NI i
s th
e su
m o
f val
ues
adde
d by
all
resi
dent
pr
oduc
ers
plus
any
pro
duct
taxe
s (le
ss s
ubsi
dies
) no
t inc
lude
d in
the
valu
ation
of o
utpu
t plu
s ne
t re
ceip
ts o
f pri
mar
y in
com
e (c
ompe
nsati
on o
f em
ploy
ees
and
prop
erty
inco
me)
from
abr
oad
- Mon
thly
cha
rge
for
10 c
ubic
met
ers
of w
ater
/M
onth
ly h
ouse
hold
inco
me.
SON
EDE,
DG
GRE
EO
NA
S, IN
SM
inis
try
of A
gric
ultu
re:
SON
EDE,
DG
GRE
EM
inis
try
of E
nviro
nmen
t:
ON
AS
Min
istr
y of
Fin
ance
Min
istr
y of
Dev
elop
men
t and
Pl
anni
ng: I
NS
b)Su
bsid
y (D
omes
tic-
Indu
stri
al-A
gric
ultu
ral)
% o
f sub
sidy
app
lied
for
diffe
rent
se
ctor
s.-%
of s
ubsi
dy a
pplie
d to
Dom
estic
sec
tor+
% o
f su
bsid
y ap
plie
d to
Indu
stri
al s
ecto
r+ %
of s
ubsi
dy
appl
ied
to A
gric
ultu
ral s
ecto
r.
SON
EDE,
DG
GRE
E,
DG
EDA
,D
GFI
OP,
ON
AS,
INS
Min
istr
y of
Agr
icul
ture
: SO
NED
E, D
GG
REE
Min
istr
y of
Env
ironm
ent:
O
NA
SM
inis
try
of In
dust
ryM
inis
try
of F
inan
ceM
inis
try
of D
evel
opm
ent a
nd
Plan
ning
: IN
S
4.1.
12 W
ater
&
Fina
nce
a)Pu
blic
exp
endi
ture
on
Wat
er re
late
d pr
ojec
tsIt
is d
efine
d as
gov
ernm
ent s
pend
ing
in w
ater
reso
urce
s in
fras
truc
ture
de
velo
pmen
t, p
lann
ing&
m
anag
emen
t, a
s w
ell a
s dr
inki
ng
wat
er s
uppl
y an
d sa
nita
tion
trea
tmen
t an
d re
use.
Inve
stm
ent i
n w
ater
and
san
itatio
n pr
ojec
ts w
ith
priv
ate
parti
cipa
tion
cove
rs in
fras
truc
ture
pro
ject
s in
wat
er a
nd s
anita
tion
that
hav
e re
ache
d fin
anci
al
clos
ure
and
dire
ctly
or
indi
rect
ly s
erve
the
publ
ic.
Min
istr
y of
Fin
ance
Min
istr
y of
A
gric
ultu
reO
NA
S, S
ON
EDE
-Min
istr
y of
Agr
icul
ture
: D
GFI
OP,
DG
RE,D
GG
REE,
D
GBG
TH, D
GAC
TA, C
RDA
, SO
NED
E, S
ECA
DEN
ORD
,-M
inis
try
of E
nviro
nmen
t:
AN
PE, O
TED
D, O
NA
S-M
inis
try
of R
egio
nal
Dev
elop
men
t and
Pla
nnin
g:
INS
-Min
istr
y of
Fin
ance

40 Tunisia 2012 State of the Water Report
MEW
INA
b)Fo
reig
n A
id fo
r W
ater
The
sect
oria
l dis
trib
ution
of b
ilate
ral
Offi
cial
Dev
elop
men
t Ass
ista
nce
com
mitm
ents
refe
rs to
the
econ
omic
se
ctor
of d
estin
ation
.
The
sect
oria
l dis
trib
ution
of b
ilate
ral O
ffici
al
Dev
elop
men
t Ass
ista
nce
com
mitm
ents
refe
rs to
th
e ec
onom
ic s
ecto
r of
des
tinati
on, r
athe
r th
an to
th
e ty
pe o
f goo
ds o
r se
rvic
es p
rovi
ded.
The
se a
re
aggr
egat
es o
f ind
ivid
ual p
roje
cts
notifi
ed u
nder
th
e Cr
edito
r Re
porti
ng S
yste
m, s
uppl
emen
ted
by
repo
rting
on
the
sect
oria
l dis
trib
ution
of t
echn
ical
co
-ope
ratio
n, a
nd o
n ac
tual
dis
burs
emen
ts o
f foo
d an
d em
erge
ncy
aid.
Min
istr
y of
Fin
ance
Min
istr
y of
A
gric
ultu
reO
NA
S, S
ON
EDE
-Min
istr
y of
Agr
icul
ture
: D
GFI
OP,
DG
RE,
DG
GRE
E,D
GBG
TH,
DG
ACTA
, CRD
A, S
ON
EDE,
SE
CAD
ENO
RD,
-Min
istr
y of
Env
ironm
ent:
A
NPE
, OTE
DD
, ON
AS
-Min
istr
y of
Reg
iona
l D
evel
opm
ent a
nd P
lann
ing:
IN
S-M
inis
try
of F
inan
ce
c)Pe
rcen
tage
of n
ation
al
Budg
et d
irect
ed to
the
wat
er s
ecto
r (A
MCO
W)
It is
the
perc
enta
ge o
f nati
onal
bud
get
dire
cted
to a
ll w
ater
rela
ted
proj
ects
, la
bor,
and
serv
ices
. It i
nclu
des
all
wat
er u
se s
ecto
r, an
d is
not
lim
ited
to
Wat
er s
uppl
y an
d sa
nita
tion.
% o
f nati
onal
bud
get d
irect
ed to
all
wat
er re
late
d pr
ojec
ts, l
abor
, and
ser
vice
s. It
incl
udes
all
wat
er
use
sect
or.
Min
istr
y of
Fin
ance
Min
istr
y of
A
gric
ultu
reO
NA
S, S
ON
EDE
-Min
istr
y of
Agr
icul
ture
: D
GFI
OP,
DG
RE, D
GG
REE,
D
GBG
TH, D
GAC
TA, C
RDA
, SO
NED
E, S
ECA
DEN
ORD
,-M
inis
try
of E
nviro
nmen
t:
AN
PE, O
TED
D, O
NA
S-M
inis
try
of R
egio
nal
Dev
elop
men
t and
Pla
nnin
g:
INS
-Min
istr
y of
Fin
ance
d)Pe
rcen
tage
of n
ation
al
Budg
et d
irect
ed to
Wat
er
and
Sani
tatio
n Se
ctor
It is
the
perc
enta
ge o
f nati
onal
bud
get
dire
cted
to W
ater
and
San
itatio
n Se
ctor
pro
ject
s, la
bor,
and
serv
ices
.
%M
inis
try
of F
inan
ceM
inis
try
of
Agr
icul
ture
ON
AS,
SO
NED
E
Min
istr
y of
Fin
ance
Min
istr
y of
Agr
icul
ture
ON
AS,
SO
NED
E, D
GFI
OP
Min
istr
y of
Env
ironm
ent,
M
inis
try
of R
egio
nal
Dev
elop
men
t and
Pla
nnin
g
e)O
pera
tion
&
Mai
nten
ance
Cos
t Re
cove
ry fo
r W
ater
Sup
ply
and
Sani
tatio
n
Is th
e su
m o
f all
tari
ffs c
olle
cted
from
al
l sub
scri
bers
to W
ater
sup
ply
and
Sani
tatio
n se
rvic
es in
one
yea
r di
vide
d by
the
tota
l ope
ratio
nal c
ost o
f wat
er
supp
ly a
nd s
anita
tion
for
the
sam
e ye
ar
-Sum
of a
ll ta
riffs
col
lect
ed fr
om a
ll su
bscr
iber
s to
Wat
er s
uppl
y an
d Sa
nita
tion
serv
ices
in o
ne
year
/To
tal o
pera
tiona
l cos
t of w
ater
sup
ply
and
sani
tatio
n fo
r th
e sa
me
year
.
SON
EDE,
DG
GRE
EO
NA
SSO
NED
E, D
GG
REE,
GD
A,
ON
AS
f)Pe
rcen
t of G
DP
dire
cted
to
San
itatio
n &
Hyg
iene
Is th
e pe
rcen
t of G
DP
dire
cted
to
Sani
tatio
n &
Hyg
iene
%M
inis
try
of F
inan
ce,
Min
istr
y of
Hea
lth,
ON
AS,
DH
MPE
Min
istr
y of
Fin
ance
, Min
istr
y of
Hea
lth,
Min
istr
y of
Env
ironm
ent,
M
inis
try
of R
egio
nal
Dev
elop
men
t and
Pla
nnin
g,
ON
AS,
DH
MPE

41
National State of the W
ater (SOW
) Indicators
Tunisia 2012 State of the Water Report
MEW
INA
g) O
pera
tion
&
Mai
nten
ance
Cos
t Re
cove
ry fo
r Ir
riga
tion
Is th
e su
m o
f all
tari
ffs c
olle
cted
from
al
l far
mer
s in
one
yea
r di
vide
d by
the
tota
l ope
ratio
nal c
ost o
f irr
igati
on fo
r th
e sa
me
year
-Sum
of a
ll ta
riffs
col
lect
ed fr
om a
ll fa
rmer
s in
one
ye
ar /
Tota
l ope
ratio
nal c
ost o
f irr
igati
on fo
r th
e sa
me
year
.
DG
GRE
ED
GG
REE,
CRD
A, G
DA
h) )
Ope
ratio
n &
M
aint
enan
ce C
ost
Reco
very
for
Indu
stry
Is th
e su
m o
f all
tari
ffs c
olle
cted
from
al
l ind
ustr
ials
in o
ne y
ear
divi
ded
by
the
tota
l ope
ratio
nal c
ost o
f ind
ustr
y fo
r th
e sa
me
year
Is th
e su
m o
f all
tari
ffs c
olle
cted
from
all
indu
stri
als
in o
ne y
ear
divi
ded
by th
e to
tal
oper
ation
al c
ost o
f ind
ustr
y fo
r th
e sa
me
year
Min
istr
y of
indu
stry
, M
inis
try
of F
inan
ceM
inis
try
of in
dust
ry, M
inis
try
of F
inan
ce
i)Pri
vate
sec
tor
inve
stm
ent
in th
e w
ater
sec
tor
and
sani
tatio
n
-Pri
vate
sec
tor
inve
stm
ent i
n th
e w
ater
sec
tor
-Pri
vate
sec
tor
inve
stm
ent i
n th
e sa
nita
tion
sect
or
-Pri
vate
sec
tor
inve
stm
ent i
n th
e w
ater
sec
tor
-Pri
vate
sec
tor
inve
stm
ent i
n th
e sa
nita
tion
sect
orM
inis
try
of A
gric
ultu
re
(API
A, D
GFI
OP,
CR
DA
), M
inis
try
of
Envi
ronm
ent,
Min
istr
y of
Fin
ance
, Min
istr
y of
Agr
icul
ture
, Min
istr
y of
En
viro
nmen
t
j)Cos
t of w
ater
deg
rada
tion
Cost
of w
ater
deg
rada
tion
(pol
lutio
n,
over
expl
oita
tion,
dep
letio
n, m
arin
e an
d sa
lt w
ater
intr
usio
n, w
ater
sa
liniz
ation
.
Cost
of w
ater
deg
rada
tion
(pol
lutio
n,
over
expl
oita
tion,
dep
letio
n, m
arin
e an
d sa
lt w
ater
in
trus
ion,
wat
er s
alin
izati
on
Min
istr
y of
Fin
ance
, M
inis
try
of
Agr
icul
ture
, Min
istr
y of
Env
ironm
ent
DG
RE,B
IRH
,D
GG
REE,
CRD
A, S
ON
EDE,
SE
CAD
ENO
RD, M
inis
try
of
Inte
rior
, Min
istr
y of
Justi
ce
4.1.
13 W
ater
&
Trad
ea)
Virt
ual-w
ater
flow
s re
late
d to
trad
e in
cro
p,
anim
al, a
nd in
dust
rial
pr
oduc
ts, p
er c
ount
ry.
Will
be
limite
d to
:-A
gric
ultu
ral V
irtu
al W
ater
Ex
port
(BCM
/Yea
r)- A
gric
ultu
ral V
irtu
al W
ater
Im
port
(BCM
/Yea
r)
Tota
l infl
ow a
nd o
utflo
w o
f vir
tual
w
ater
whi
ch in
turn
is d
efine
d as
: th
e vo
lum
e of
fres
hwat
er u
sed
to
prod
uce
the
prod
uct,
mea
sure
d at
the
plac
e w
here
the
prod
uct w
as a
ctua
lly
prod
uced
(Hoe
kstr
a an
d Ch
apag
ain,
20
01)
Hoe
kstr
a an
d Ch
apag
ain
(200
1) p
rovi
ded
refe
renc
e ta
bles
that
pro
vide
the
appr
oxim
ate
volu
me
of w
ater
nee
ded
to p
rodu
ce o
ne k
ilogr
am
of d
iffer
ent c
rop,
ani
mal
, and
indu
stri
al p
rodu
cts.
Th
eref
ore,
the
volu
me
of w
ater
use
d to
pro
duce
a
cert
ain
prod
uct c
an b
e es
timat
ed b
y m
ultip
lyin
g th
ese
refe
renc
e va
lues
(or
any
sim
ilar
valu
es
prov
ided
in th
e na
tiona
l and
glo
bal l
itera
ture
) by
the
tota
l ann
ual p
rodu
ced
amou
nt o
f the
sa
me
prod
uct.
In th
e sa
me
man
ner,
it is
pos
sibl
e t e
stim
ate
the
amou
nt o
f wat
er e
mbe
dded
in
impo
rted
and
exp
orte
d pr
oduc
ts
Min
istr
y of
Tra
de
(DG
CE),
Min
istr
y of
A
gric
ultu
re, D
GPA
, D
GED
A, D
GG
REE,
IN
RGRE
F, IR
ESA
, D
GRE
.
Min
istr
y of
Tra
deM
inis
try
of A
gric
ultu
re:
DG
GRE
E, D
GRE
, GD
GPA
, D
GED
A, I
RESA
, IN
RGRE
F
4.1.
14 W
ater
&
Gov
erna
nce
a)IW
RM p
lan
in p
lace
(Yes
/N
o)A
nati
onal
pla
n de
dica
ted
entir
ely
to
wat
er re
sour
ces,
with
mor
e th
an 3
en
tities
invo
lved
, and
with
all
wat
er
use
sect
ors
addr
esse
d co
uld
qual
ify a
s a
natio
nal I
WRM
-IWRM
pla
n in
pla
ce (Y
es/N
o)D
GRE
, BPE
HM
inis
try
of A
gric
ultu
re:
DG
RE, D
GG
REE,
DG
BGTH
, SE
CAD
ENO
RD, S
ON
EDE,
BP
EHM
inis
try
of E
nviro
nmen
t:
AN
PE, O
TED
D, O
NA
S
b)Ex
iste
nce
of N
ation
al
Wat
er a
nd S
anita
tion
M&
E,&
R S
yste
m (A
MCO
W)
Exis
tenc
e of
Nati
onal
Wat
er a
nd
Sani
tatio
n M
&E,
& R
Sys
tem
(AM
COW
)-N
ation
al W
ater
and
San
itatio
n M
&E,
& R
Sys
tem
(A
MCO
W) i
n pl
ace
(Yes
/No)
DG
RE, B
PEH
All
stak
ehol
ders
All
user
s(n
o na
tiona
l sys
tem
)
c) S
urfa
ce W
ater
Per
mits
Is
sued
to D
ate
Sur
face
Wat
er P
erm
its Is
sued
to D
ate
Num
ber
DG
RE, B
IRH
, CRD
AD
GRE
, BIR
H, C
RDA
d) T
otal
Vol
umet
ric
Righ
ts
Ass
osci
ated
with
sur
face
W
ater
Per
mits
d) T
otal
Vol
umet
ric
Righ
ts A
ssoc
iate
d w
ith s
urfa
ce W
ater
Per
mits
MCM
/Yea
rD
GRE
, BIR
H, C
RDA
DG
RE, B
IRH
, CRD
A

42 Tunisia 2012 State of the Water Report
MEW
INA
e) V
olum
e as
soci
ated
with
su
rfac
e W
ater
per
mits
as
a Pe
rcen
t of A
nnua
l Blu
e Su
rfac
e W
ater
With
draw
als
e) V
olum
e as
soci
ated
with
sur
face
W
ater
per
mits
as
a Pe
rcen
t of A
nnua
l Bl
ue S
urfa
ce W
ater
With
draw
als
%D
GRE
, BIR
H, C
RDA
DG
RE, B
IRH
, CRD
A
f)W
ater
Rig
hts/
Year
Num
ber
of o
ffici
ally
aut
hori
zed
wat
er
righ
ts p
erm
its fo
r be
nefic
ial u
sage
by
indi
vidu
als
or e
ntitie
s, a
nd e
quiv
alen
t %
of t
otal
ann
ual v
olum
e di
stri
bute
d.
Num
ber
of o
ffici
ally
aut
hori
zed
wat
er r
ight
s fo
r be
nefic
ial u
sage
by
indi
vidu
als
or e
ntitie
s.D
GRE
(BIR
H),
BPEH
Min
istr
y of
Agr
icul
ture
:D
GRE
, BI
RH, D
GG
REE,
CRD
A
d)G
roun
dwat
er w
ell
perm
its i
ssue
d to
dat
e (N
umbe
r)
Num
ber
of o
ffici
ally
aut
hori
zed
regi
ster
ed s
hallo
w o
r de
ep w
ells
for
bene
ficia
l usa
ge b
y in
divi
dual
s or
en
tities
.
-Num
ber
of o
ffici
ally
aut
hori
zed
shal
low
or
deep
w
ells
for
bene
ficia
l usa
ge b
y in
divi
dual
s or
enti
ties.
DG
RE (B
IRH
), CR
DA
Min
istr
y of
Agr
icul
ture
:D
GRE
, BI
RH, C
RDA
e)To
tal V
olum
etri
c W
ater
Ri
ghts
Ass
ocia
ted
with
Wel
l Pe
rmits
To
tal V
olum
etri
c W
ater
Rig
hts
Ass
ocia
ted
with
Wel
l Per
mits
MCM
/Yea
rD
GRE
(BIR
H),
CRD
AM
inis
try
of A
gric
ultu
re:
DG
RE ,
BIRH
, CRD
A
f)To
tal V
olum
e as
soci
ated
w
ith w
ell p
erm
its a
s a
perc
ent o
f Ann
ual B
lue
Gro
undw
ater
Abs
trac
tions
Tota
l Vol
ume
asso
ciat
ed w
ith w
ell
perm
its a
s a
perc
ent o
f Ann
ual B
lue
Gro
undw
ater
Abs
trac
tions
MCM
/Yea
rD
GRE
(BIR
H),
CRD
AM
inis
try
of A
gric
ultu
re:
DG
RE ,
BIRH
, CRD
A
g)N
umbe
r of
unl
icen
sed
wel
ls
Num
ber
of u
nlic
ense
d w
ells
N
umbe
rD
GRE
(BIR
H),C
RDA
Min
istr
y of
Agr
icul
ture
:D
GRE
, BI
RH, C
RDA
h)Ir
riga
tion
and
drai
nage
re
late
d Co
mpl
aint
s as
a
perc
enta
ge o
f irr
igati
on
Wat
er U
sers
Ann
ual n
umbe
r of
com
plai
nts
that
re
late
dire
ctly
to ir
riga
tion
issu
esN
umbe
r/Ye
ar
-Ann
ual n
umbe
r of
com
plai
nts
that
rela
te d
irect
ly
to ir
riga
tion
issu
es -N
umbe
r of
reso
lved
Irri
gatio
n co
mpl
aint
s
DG
GRE
E, C
RDA
Min
istr
y of
Agr
icul
ture
:D
GG
REE
, CRD
A
i)Wat
er s
uppl
y an
d Sa
nita
tion
rela
ted
Com
plai
nts
as a
per
cent
age
of S
ervi
ced
Hou
seho
lds
Ann
ual n
umbe
r of
com
plai
nts
that
re
late
dire
ctly
to w
ater
sup
ply
and
sani
tatio
n se
rvic
es.
Num
ber/
Year
-Ann
ual n
umbe
r of
com
plai
nts
that
rela
te d
irect
ly
to w
ater
sup
ply
and
sani
tatio
n se
rvic
es-N
umbe
r of
reso
lved
Wat
er S
uppl
y an
d Sa
nita
tion
com
plai
nts
SON
EDE,
DG
GRE
E,
CRD
AO
NA
S
Min
istr
y of
Agr
icul
ture
: D
GG
REE,
SON
EDE,
DG
RE, C
RDA
Min
istr
y of
Env
ironm
ent:
O
NA
S, A
NPE
j)Num
ber
of W
ater
Sup
ply
Met
ers
Inst
alle
d as
a
Perc
ent o
f Tot
al N
umbe
r of
Co
vere
d H
ouse
hold
s
Num
ber
of W
ater
Sup
ply
Met
ers
Inst
alle
d as
a P
erce
nt o
f Tot
al N
umbe
r of
Cov
ered
Hou
seho
lds
%D
GG
REE,
SO
NED
ED
GG
REE,
SON
EDE
k)N
umbe
r of
Gro
undw
ater
M
eter
s In
stal
led
as a
pe
rcen
t of S
ervi
ced
Hou
seho
lds
Num
ber
of G
roun
dwat
er M
eter
s In
stal
led
as a
per
cent
of S
ervi
ced
Hou
seho
lds
%D
GG
REE,
SO
NED
E,
DG
RED
GG
REE,
SO
NED
E, D
GRE
l)Num
ber
of S
urfa
ce
Irri
gatio
n M
eter
s In
stal
led
as a
% o
f Sur
face
Irri
gatio
n W
ater
Per
mits
Num
ber
of S
urfa
ce Ir
riga
tion
Met
ers
Inst
alle
d as
a %
of S
urfa
ce Ir
riga
tion
Wat
er P
erm
its
%D
GG
REE,
DG
RE, B
IRH
DG
GRE
E, D
GRE
, BIR
H

43
National State of the W
ater (SOW
) Indicators
Tunisia 2012 State of the Water Report
MEW
INA
m)P
hysi
cal D
omes
tic W
ater
Lo
sses
Phys
ical
Dom
estic
Wat
er L
osse
s%
SON
EDE,
DG
GRE
ESO
NED
E, D
GG
REE
M1
)Cor
rupti
on in
the
wat
er s
ecto
rCo
rrup
tion
in th
e w
ater
sec
tor:
-A
nnua
l num
ber
of il
lega
l dri
lling
, ill
egal
tapp
ing
wat
er, w
ater
theft
.
Corr
uptio
n in
the
wat
er s
ecto
r:
-Ann
ual n
umbe
r of
ille
gal d
rilli
ng w
orks
, ille
gal
tapp
ing
wat
er, w
ater
theft
.
DG
RE, D
GG
REE,
BPE
HD
GRE
,BIR
H,
DG
GRE
E, C
RDA
, SO
NED
E,
SECA
DEN
ORD
, Min
istr
y of
In
teri
or, M
inis
try
of Ju
stice
M2)
Nati
onal
str
ateg
y of
G
roun
dwat
er P
rese
rvati
on
Nati
onal
str
ateg
y of
Gro
undw
ater
Pr
eser
vatio
n in
pla
ce (y
es/n
o): a
na
tiona
l pla
n de
dica
ted
entir
ely
to
grou
ndw
ater
reso
urce
s, w
ith m
ore
than
3 e
ntitie
s in
volv
ed, a
nd w
ith a
ll gr
ound
wat
er u
se s
ecto
rs a
ddre
ssed
co
uld
qual
ify a
s a
natio
nal s
trat
egy
of
GW
P.
Nati
onal
str
ateg
y of
Gro
undw
ater
Pre
serv
ation
in
plac
e (y
es/n
o): a
nati
onal
pla
n de
dica
ted
entir
ely
to g
roun
dwat
er re
sour
ces,
with
mor
e th
an 3
en
tities
invo
lved
, and
with
all
grou
ndw
ater
use
se
ctor
s ad
dres
sed
coul
d qu
alify
as
a na
tiona
l st
rate
gy o
f GW
P.(A
rtific
ial r
echa
rge,
wat
er c
ode,
Par
ticip
ator
y w
ater
man
agem
ent,
etc
.)
DG
RE, B
IRH
, DG
GRE
E,
BPEH
DG
RE, B
IRH
, BPE
H
M 3
)Dat
abas
e na
tura
l di
sast
ers
Nati
onal
dat
abas
e na
tura
l dis
aste
rs in
pl
ace
(Yes
or
no)
Nati
onal
dat
abas
e na
tura
l dis
aste
rs in
pla
ce (Y
es
or n
o)IN
M, D
GAC
TA, D
GRE
, Ci
vil P
rote
ction
, M
inis
try
of In
teri
or,
Min
istr
y of
A
gric
ultu
re, M
inis
try
of E
nviro
nmen
t,
Min
istr
y of
Equ
ipm
ent
INM
, DG
ACTA
, DG
RE,
Civi
l Pro
tecti
on, M
inis
try
of In
teri
or, M
inis
try
of
Agr
icul
ture
, Min
istr
y of
En
viro
nmen
t, M
inis
try
of
Equi
pmen
t
M 4
)Mon
itori
ng a
nd
prev
entio
n sy
stem
of r
isks
re
late
d to
wat
er
-Mon
itori
ng s
yste
m o
f ris
ks re
late
d to
wat
er-P
reve
ntion
sys
tem
of r
isks
rela
ted
to
wat
er
-Mon
itori
ng s
yste
m o
f ris
ks re
late
d to
wat
er-P
reve
ntion
sys
tem
of r
isks
rela
ted
to w
ater
DG
ACTA
, DG
RE, I
NM
, Ci
vil P
rote
ction
, M
inis
try
of In
teri
or,
Min
istr
y of
A
gric
ultu
re, M
inis
try
of E
nviro
nmen
t,
Min
istr
y of
Equ
ipm
ent
DG
ACTA
,DG
RE, I
NM
, Ci
vil P
rote
ction
, Min
istr
y of
Inte
rior
, Min
istr
y of
A
gric
ultu
re, M
inis
try
of
Envi
ronm
ent,
Min
istr
y of
Eq
uipm
ent
M 5
)Nati
onal
str
ateg
y fo
r th
e co
nser
vatio
n of
soi
l and
w
ater
in p
lace
: (Ye
s or
No)
% o
f dev
elop
ed a
rea
agai
nst e
rosi
on,
com
pare
d to
the
tota
l agr
icul
tura
l la
nd (%
)
(All
man
aged
acti
ons/
Tota
l agr
icul
tura
l are
a)D
GAC
TAD
GAC
TA
Rate
of a
reas
whi
ch w
ere
the
subj
ect
of p
rese
rvati
on a
nd c
onso
lidati
on,
with
resp
ect t
o al
l dev
elop
ed a
rea
agai
nst e
rosi
on (%
)
(All
cons
olid
ation
and
pre
serv
ation
acti
ons/
Tota
l de
velo
ped
area
aga
inst
ero
sion
) D
GAC
TAD
GAC
TA
Redu
ction
of w
ater
loss
es r
unoff
(%) i
n th
e de
velo
pmen
t are
a ag
ains
t ero
sion
Re
ducti
on o
f wat
er lo
sses
run
off (%
) in
the
deve
lope
d ar
ea a
gain
st e
rosi
onD
GAC
TA ,
DG
RE, B
PEH
DG
ACTA
, DG
RE

44 Tunisia 2012 State of the Water Report
MEW
INA
M 6
)Nati
onal
exp
ertis
e in
the
field
of w
ater
and
sa
nita
tion
Eval
uatio
n of
Nati
onal
exp
ertis
e in
th
e fie
ld o
f wat
er a
nd s
anita
tion
in a
gi
ven
year
(exp
erts
, con
sulti
ng fi
rms,
co
mpa
nies
, cor
pora
tions
, etc
.)
Eval
uatio
n of
nati
onal
exp
ertis
e in
the
field
of
wat
er a
nd s
anita
tion
in a
giv
en y
ear
(exp
erts
, co
nsul
ting
firm
s, c
ompa
nies
, cor
pora
tions
, etc
.)
BPEH
, DG
REBP
EH, D
GRE
n) O
vera
ll W
ater
Use
Effi
cien
cyTh
e ra
tio o
f the
diff
eren
ce b
etw
een
the
tota
l with
draw
als
from
ori
gina
l so
urce
s (s
urfa
ce w
ater
, ren
ewab
le
and
non-
rene
wab
le g
roun
dwat
er,
and
desa
linat
ed w
ater
) and
the
was
tew
ater
and
dra
inag
e flo
ws
to th
e w
ithdr
awal
s fr
om O
rigi
nal S
ourc
es
expr
esse
d as
a p
erce
ntag
e.
100*
((W
ithdr
awal
s fr
om o
rigi
nal S
ourc
es-
Was
tew
ater
and
Dra
inag
e ou
tflo
ws)
/With
draw
als
from
Ori
gina
l Sou
rces
)
DG
RE, D
GG
REE,
ON
AS
DG
RE, D
GG
REE,
ON
AS,
CRD
A
o)W
ater
Sus
tain
abili
ty/
Dep
letio
n In
dex
The
ratio
of t
he to
tal w
ithdr
awal
s fr
om
orig
inal
sou
rces
incl
udin
g gr
een
wat
er
cons
umpti
ons
by ra
infe
d ag
ricu
lture
to
the
tota
l ren
ewab
le w
ater
reso
urce
s (B
lue
and
Gre
en W
ater
).
%D
GRE
, DG
GRE
E,
SON
EDE
DG
RE, D
GG
REE,
SO
NED
E,
CRD
A
p)W
aste
wat
er a
nd D
rain
age
Outf
low
sW
aste
wat
er a
nd A
gric
ultu
ral D
rain
age
flow
ing
out o
f the
sys
tem
.
BCM
/Yea
rD
GG
REE,
ON
AS,
DG
RED
GG
REE,
ON
AS,
DG
RE, C
RDA
q)Tr
ansb
ound
ary
Was
tew
ater
and
Dra
inag
e O
utflo
ws
Was
tew
ater
and
Agr
icul
tura
l Dra
inag
e flo
win
g ou
t of t
he c
ount
ry’s
bor
ders
.
BCM
/Yea
rD
GG
REE,
ON
AS,
DG
RED
GG
REE,
ON
AS,
DG
RE, C
RDA
r)Co
mm
erci
al W
ater
Los
ses
Com
mer
cial
Wat
er L
osse
s
BCM
/Yea
rSO
NED
E, D
GG
REE,
D
GBG
TH,
SECA
DEN
ORD
SON
EDE,
DG
GRE
E, D
GBG
TH,
SECA
DEN
ORD
s)Ph
ysic
al Ir
riga
tion
Wat
er
Loss
esPh
ysic
al Ir
riga
tion
Wat
er L
osse
sBC
M/Y
ear
DG
GRE
ED
GG
REE,
CRD
A
t)N
umbe
r of
Wat
er re
late
d ci
tatio
ns (W
ater
Law
s En
forc
emen
t)N
umbe
r of
Wat
er re
late
d ci
tatio
ns
(Wat
er L
aws
Enfo
rcem
ent)
Num
ber
DG
AJ,
DG
RE, B
IRH
, D
GG
REE,
SO
NED
E,
AN
PE, O
NA
S
DG
AJ,
DG
RE, B
IRH
, DG
GRE
E,
SON
EDE,
AN
PE, O
NA
S
u)N
umbe
r of
Wat
er U
sers
A
ssoc
iatio
nsN
umbe
r of
Wat
er U
sers
Ass
ocia
tions
Num
ber
DG
GRE
ED
GG
REE,
CRD
A
v)W
ater
Use
rs A
ssoc
iatio
ns
Agr
icul
tura
l Lan
d Co
vera
ge
Wat
er U
sers
Ass
ocia
tions
Agr
icul
tura
l La
nd C
over
age
% o
f Agr
icul
tura
l Lan
dD
GG
REE
DG
GRE
E, C
RDA
4.1.
15 W
ater
&
Iner
natio
nal
Rela
tions
a)Tr
ansb
ound
ary
wat
er
bodi
es’ d
epen
denc
y Ra
tioTh
e pe
rcen
t of a
nnua
l vol
umes
ab
stra
cted
from
tran
sbou
ndar
y w
ater
bo
dies
to to
tal a
nnua
l ava
ilabl
e w
ater
re
sour
ces.
-Ann
ual v
olum
es a
bstr
acte
d fr
om tr
ansb
ound
ary
wat
er b
odie
s /T
otal
ann
ual a
vaila
ble
wat
er
reso
urce
s.
DG
RE, D
GBG
TH, B
PEH
DG
RE, D
GBG
TH, C
RDA

45
National State of the W
ater (SOW
) Indicators
Tunisia 2012 State of the Water Report
MEW
INA
b)Sh
ared
Wat
ers
rela
ted
Bila
tera
l/M
ultil
ater
al
Agr
eem
ents
and
/or
M
oU a
nd C
oope
ratio
n M
echa
nism
s.
The
num
ber
of B
ilate
ral/
Mul
tilat
eral
A
gree
men
ts a
nd/o
r M
oU a
nd
Coop
erati
on M
echa
nism
s a
parti
cula
r co
untr
y is
invo
lved
in. T
hese
ag
reem
ents
sho
uld
be s
olel
y in
tend
ed
to tr
ansb
ound
ary
wat
er
-Num
ber
of M
ultil
ater
al/
Bila
tera
l Agr
eem
ents
Min
istr
y of
A
gric
ultu
re: D
CI,
DG
RE, D
GBG
THM
inis
try
of F
orei
gn
Affa
irs
Min
istr
y of
Agr
icul
ture
: DCI
, D
GRE
, DG
BGTH
Min
istr
y of
Fo
reig
n A
ffairs
.
c)N
umbe
r of
rip
aria
ns
shar
ing
all s
hare
d w
ater
bo
dies
Num
ber
of r
ipar
ian’
s sh
arin
g al
l sha
red
wat
er b
odie
sN
umbe
r of
rip
aria
n’s
in e
ach
wat
er b
ody
Min
istr
y of
A
gric
ultu
re:
DG
RE,
BIRH
, IN
S
Min
istr
y of
Agr
icul
ture
: D
GRE
, BIR
H, I
NS
d) N
umbe
r of
Sha
red
Wat
er
Reso
urce
sN
umbe
r of
Sha
red
Wat
er R
esou
rces
Num
ber
of S
hare
d W
ater
Res
ourc
esD
GRE
DG
RE
Num
ber o
f N
atio
nal S
OW
indi
cato
rs: 1
48 (i
n bl
ack
colo
r in
Tabl
e 6)
Num
ber o
f A
dditi
onal
Spe
cific
indi
cato
rs: 3
1 (in
red
colo
r in
tabl
e 6)
Tota
l Num
ber o
f N
atio
nal S
OW
indi
cato
rs: 1
79 in
dica
tors

46 Tunisia 2012 State of the Water Report
MEW
INA
Selected National & Country Specific SOW Indicators:
The review and analysis of all the listed indicators enable the selection of the following set:
(Definitions, Methodology, Institutions in charge of measuring and/or estimating the indicator and Source of data are given in table 6.
Table 7. A new selected set of National SOW indicators for TunisiaNo. Code Water Related Indicators Units
* 1 Water & Availability
1 1-1 Annual Spatially Averaged Precipitation Depth MM/Year
2 1-2 Annual Precipitation Volume BCM/Year
* * Blue Water
3 1-3 Internal Renewable Surface Water (IRSW) BCM/Year
4 1-4 Internal Renewable Groundwater (IRG) BCM/Year
5 1-5Total Internal Renewable Blue Water Resources
(TIRBWR)=(IRSW+IRG) BCM/Year
6 1-6 External Surface Water Inflow (ESWI) BCM/Year
7 1-7 External Surface Water Outflow (ESWO) BCM/Year
8 1-8 External Groundwater Inflow (EGI) BCM/Year
9 1-9 External Groundwater outflow (EGO) BCM/Year
10 1-10Total External Renewable Blue Water Resources
Inflow(TERBWR)=(ESWI+EGI) BCM/Year
11 1-11Total Renewable Blue Surface Water
(TRBSW)=(IRSW)+(ESWI)-(ESWO) BCM/Year
12 1-12Total Renewable Blue Groundwater
(TRBG)=(IRG)+(EGI)-(EGO) BCM/Year
13 1-13Overlap between Surface Water and Groundwater
(OSWG) BCM/Year
14 1-14Total Renewable Blue Water Resources
(TRBWR)=(TRBSW)+(TRBG)-(OSWG) BCM/Year
15 1-15 Total Exploitable Non-Renewable Groundwater (TNRG) BCM/Year
16 1-16 Total Blue Water Resources (TBWR) BCM/Year
* * Green Water
17 1-17 Water for Rain-fed Agricultural Consumption BCM/Year
18 1-18 Water for Rain-fed Pasture Consumption BCM/Year
19 1-19 Water for Rain-fed Forest Consumption BCM/Year
20 1-20 Total Renewable Green Water Resources (TRGWR) BCM/Year
21 1-21Total Renewable Water Resources (TRWR)=(TRBWR+TRGWR) BCM/Year
22 1-22Total Conventional Water Resources (TCWR)= TRWR+TNRG = TBWR+TRGWR BCM/Year
* * Non-Conventional Water
23 1-23 Produced Municipal Wastewater (PMW) BCM/Year
24 1-24 Produced Industrial Wastewater (PIW) BCM/Year
25 1-25 Produced Agricultural Drainage (PAD) BCM/Year

47
National State of the W
ater (SOW
) Indicators
Tunisia 2012 State of the Water Report
MEW
INA
26 1-26 Produced Desalinated Water (PDW) BCM/Year
27 1-27Total Non-Conventional Water Resources (TNCWR)=
(PMW)+(PIW)+(PAD)+(PDW) BCM/Year
28 1-28Total Available Water Resources (TAWR) = TCWR+TNCWR BCM/Year
* 2 Water & Uses
29 2-1 Withdrawals for Domestic Water Use BCM/Year
30 2-2 Withdrawals for Industrial Water Use BCM/Year
31 2-3 Withdrawals for Agricultural Water Use BCM/Year
32 2-4 Annual Total Water Withdrawals BCM/Year
33 2-5 Green Water Consumption for Agriculture Water Use BCM/Year
34 2-6 Total Agricultural Water Uses BCM/Year
35 2-7 Withdrawals from Blue Surface Water BCM/Year
36 2-8 Withdrawals from Blue Renewable Groundwater BCM/Year
37 2-9 Withdrawals from Blue Non-Renewable Groundwater BCM/Year
38 2-10 Total Withdrawals from Blue Water BCM/Year
39 2-11 Agricultural Drainage Water Reuse BCM/Year
41 2-13Total Withdrawals from Non-Conventional Water Resources BCM/Year
43 2-15 Greenwater Consumption for Livestock Fodder Water Use BCM/Year
47 2-19 Bottled Water Production BCM/Year
* 3 Water & Land Use Changes
50 3-1 Total Irrigated Agricultural Land ha
51 3-2 Total Rain-fed Agricultural Land ha
52 3-3 Total Pasture Land ha
53 3-4 Total Forests Land ha
54 3-5 Urban Encroachment on Green Cover ha lost/Year
* *Impact of Urban Encroachment on water Resources (Indicators listed below)
55 3-6 Decrease in Groundwater Recharge BCM/Year
56 3-7 Decrease in Water Consumptions of Green Cover BCM/Year
57 3-8 Increase in Surface Runoff BCM/Year
58 3-9 Increase in Domestic Water Withdrawals BCM/Year
* 4 Water & Services
* * Water Coverage and Accessibility
59 4-1 Improved Urban Water Supply Coverage %
60 4-2 Improved Rural Water Supply Coverage %
61 4-3 Improved Urban Sanitation Coverage %
62 4-4 Improved Rural Sanitation Coverage %
63 4-5 Improved Water Supply Coverage %
64 4-6 Improved Sanitation Coverage %
* * Water Infrastructure
65 4-7 Length of Water Supply Networks km
66 4-8 Length of Sewage Networks km
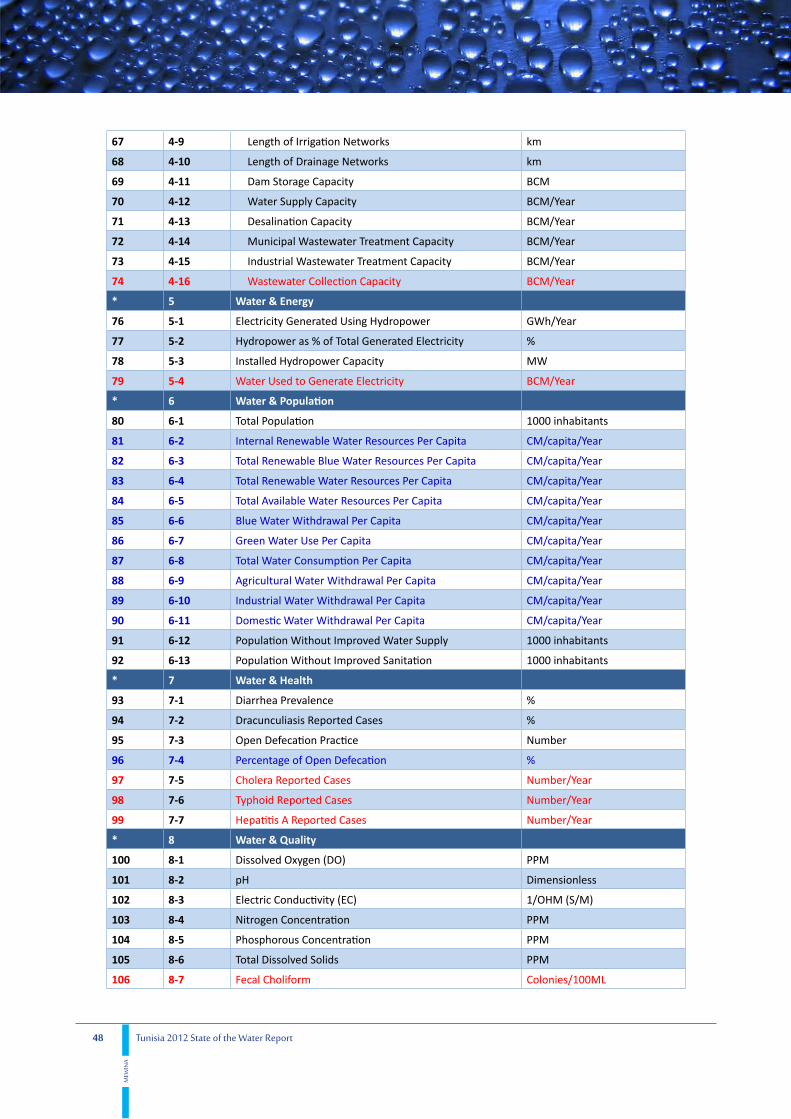
48 Tunisia 2012 State of the Water Report
MEW
INA
67 4-9 Length of Irrigation Networks km
68 4-10 Length of Drainage Networks km
69 4-11 Dam Storage Capacity BCM
70 4-12 Water Supply Capacity BCM/Year
71 4-13 Desalination Capacity BCM/Year
72 4-14 Municipal Wastewater Treatment Capacity BCM/Year
73 4-15 Industrial Wastewater Treatment Capacity BCM/Year
74 4-16 Wastewater Collection Capacity BCM/Year
* 5 Water & Energy
76 5-1 Electricity Generated Using Hydropower GWh/Year
77 5-2 Hydropower as % of Total Generated Electricity %
78 5-3 Installed Hydropower Capacity MW
79 5-4 Water Used to Generate Electricity BCM/Year
* 6 Water & Population
80 6-1 Total Population 1000 inhabitants
81 6-2 Internal Renewable Water Resources Per Capita CM/capita/Year
82 6-3 Total Renewable Blue Water Resources Per Capita CM/capita/Year
83 6-4 Total Renewable Water Resources Per Capita CM/capita/Year
84 6-5 Total Available Water Resources Per Capita CM/capita/Year
85 6-6 Blue Water Withdrawal Per Capita CM/capita/Year
86 6-7 Green Water Use Per Capita CM/capita/Year
87 6-8 Total Water Consumption Per Capita CM/capita/Year
88 6-9 Agricultural Water Withdrawal Per Capita CM/capita/Year
89 6-10 Industrial Water Withdrawal Per Capita CM/capita/Year
90 6-11 Domestic Water Withdrawal Per Capita CM/capita/Year
91 6-12 Population Without Improved Water Supply 1000 inhabitants
92 6-13 Population Without Improved Sanitation 1000 inhabitants
* 7 Water & Health
93 7-1 Diarrhea Prevalence %
94 7-2 Dracunculiasis Reported Cases %
95 7-3 Open Defecation Practice Number
96 7-4 Percentage of Open Defecation %
97 7-5 Cholera Reported Cases Number/Year
98 7-6 Typhoid Reported Cases Number/Year
99 7-7 Hepatitis A Reported Cases Number/Year
* 8 Water & Quality
100 8-1 Dissolved Oxygen (DO) PPM
101 8-2 pH Dimensionless
102 8-3 Electric Conductivity (EC) 1/OHM (S/M)
103 8-4 Nitrogen Concentration PPM
104 8-5 Phosphorous Concentration PPM
105 8-6 Total Dissolved Solids PPM
106 8-7 Fecal Choliform Colonies/100ML

49
National State of the W
ater (SOW
) Indicators
Tunisia 2012 State of the Water Report
MEW
INA
* 9 Water & Ecosystems
111 9-1 Number of Wetlands Sites Acknowledged by RAMSAR Number
112 9-2 Total Wetlands Areas ha
113 9-3 Total Freshwater Species Count Number
114 9-4 Number of Endangered Species Number
115 9-5 Number of Invasive Species Number
* 10 Water & Climate
* * Extreme Weather Events
116 10-1 Number of Class 1 Flood Events Number
117 10-2 Number of Class 1.5 Flood Events Number
118 10-3 Number of Class 2 Flood Events Number
120 10-5 Drought Events Number
121 10-6 Cost of Annual Damage Caused by Floods $ - % of GDP
122 10-7 Cost of Annual Damage Caused by Droughts $ - % of GDP
123 10-8 Annual Human Losses Related to Floods Number
124 10-9 Annual Human Losses Related to Droughts Number
125 10-10 Unusual Weather Events (Snow, Hail,……) Number/Type
126 10-11 National Climate Change Adaptation Plan Yes/No
* 11 Water & Socio-Economics
* * Water Productivity
127 11-1 Industrial Water Productivity $/CM
128 11-2 Agricultural Water Productivity “Crop Per Drop” $/CM
129 11-3 Employment in Agriculture “Job Per Drop” Jobs/MCM
129 11-4 Employment in Industry “Job Per Drop” Jobs/MCM
* * Tariffs and Affordability
131 11-5Water and Sanitation Charges as % of Average
Household Income %
* 12 Water & Finance
132 12-1Percentage of National Budget Directed to Water & Sanitation Sector %
133 12-2Operation & Maintenance Cost Recovery for Water Supply and Sanitation %
134 12-3 Percent of GDP Directed to Sanitation & Hygiene %
135 12-4 Foreign Aid for Water & Sanitation Million US$
136 12-5 Operation& Maintenance Cost Recovery for Irrigation %
* 13 Water & Trade
140 13-1 Agricultural Virtual Water Export BCM/Year
141 13-2 Agricultural Virtual Water Import BCM/Year

50 Tunisia 2012 State of the Water Report
MEW
INA
* 14 Water & Governance
142 14-1 IWRM Plan Yes/No
143 14-2 National Water and Sanitation M&E & R System Yes/No
144 14-3 Surface Water Permits Issued to Date Number
145 14-4Total Volumetric Rights Assosciated with surface Water Permits BCM/Year
146 14-5Volume associated with surface Water permits as a Percent of Annual Blue Surface Water Withdrawals %
147 14-6 Groundwater Well Permits Issued to Date Number
148 14-7Total Volumetric Water Rights Associated with Well Permits BCM/Year
149 14-8Total Volume associated with well permits as a percent of Annual Blue Groundwater Abstractions %
150 14-9 Number of unlicensed wells Number
151 14-10Irrigation & Drainage Related Complaints as a percentage of Irrigation Water Users Number/Year
152 14-11Water supply and Sanitation Related Complaints as a percentage of Serviced Households Number/Year
153 14-12Number of Water Supply Meters Installed as a Percent of Total Number of Covered Households %
154 14-13Number of Groundwater Meters Installed as a percent of Serviced Households Number
155 14-14Number of Surface Irrigation Meters Installed as a % of Surface Irrigation Water Permits %
156 14-15 Physical Domestic Water Losses BCM/Year
157 14-16 Overall Water Use Efficiency %
158 14-17 Water Sustainability/ Depletion Index %
159 14-18 Wastewater and Drainage Outflows BCM/Year
160 14-19 Transboundary Wastewater and Drainage Outflows BCM/Year
161 14-20 Commercial Water Losses BCM/Year
162 14-21 Physical Irrigation Water Losses BCM/Year
163 14-22Number of Water related citations (Water Laws Enforcement) Number
164 14-23 Number of Water Users Associations Number
165 14-24 Water Users Associations Agricultural Land Coverage % of Ag. Land
* 15 Water & International Relations
166 15-1 Transboundary Water Dependency Ratio %
167 15-2
Shared Waters related Bilateral/ Multilateral Agreements and/or Memorandums of Understanding and Cooperation Mechanisms Number
168 15-4 Number of Riparians sharing all shared water bodies Number
169 15-6 Number of Shared Water Resources Number
This selected new set of National & Country Specific SOW Indicators includes: 98 Primary indicators, 32 Secondary Derived Indicators, and 22 Specific Indicators.
We will develop in the following pages, these National & Country Specific SOW Indicators, with their 2012 values and their corresponding historical data.

51
National State of the W
ater (SOW
) Indicators
Tunisia 2012 State of the Water Report
MEW
INA
3.2.
Sha
red
Aqu
ifer S
OW
Ind
icat
ors
The
Nor
th W
este
rn S
ahar
a A
quife
r Sys
tem
(NW
SAS)
is sh
ared
by
Alg
eria
, Lib
ya a
nd T
unisi
a.
Thi
s se
ctio
n pr
esen
ts th
e fu
ll lis
t of
indi
cato
rs u
sed,
with
thei
r de
finiti
on, t
he m
etho
dolo
gy to
mea
sure
, est
imat
e an
d re
port
val
ue, a
nd th
e in
stitu
tions
in c
harg
e of
mea
surin
g an
d/or
est
imat
ing
the
indi
cato
r.
Tabl
e 8.
A s
elec
ted
set o
f NW
SAS
SOW
indi
cato
rsW
hole
Aqu
ifer
Indi
cato
rsU
nits
Defi
niti
onM
etho
dolo
gy to
mea
sure
, esti
mat
e an
d re
port
val
ueIn
stitu
tion
in
char
geSo
urce
of
data
Wat
er &
Ava
ilabi
lity
Inte
rnal
Ren
ewab
le
Gro
undw
ater
(IRG
)BC
M/Y
ear
IRG
: G
roun
dwat
er R
echa
rge
is th
e to
tal v
olum
e of
wat
er
ente
ring
und
ergr
ound
sou
rces
of
wat
er (t
ypic
ally
aqu
ifers
) w
ithin
a c
ount
ry’s
bor
ders
fr
om e
ndog
enou
s (in
tern
al)
prec
ipita
tion
and
surf
ace
wat
er
flow
(FAO
)
If no
t mea
sure
d, IR
G c
an b
e es
timat
ed b
y hy
drol
ogic
al
mod
elin
g (P
hysi
cally
-Bas
ed D
istr
ibut
ed M
odel
s): P
reco
rds,
So
il ty
pe m
aps,
Lan
d us
e m
aps,
Irri
gatio
n an
d dr
aina
ge
map
s, E
TP in
puts
, Sur
face
run
off a
nd c
atch
men
t out
lets
, Re
char
ge o
f gro
undw
ater
aqu
ifers
by
prec
ipita
tion.
Gro
undw
ater
rech
arge
from
Sur
face
wat
er fl
ows
can
eith
er
be e
stim
ated
from
obs
erva
tion
wel
ls o
r m
odel
ed th
roug
h Su
rfac
e-G
roun
dwat
er C
oupl
ed m
odel
s.
DG
RE, C
MCR
DA
, DG
RE, O
SS
Tota
l Exp
loita
ble
Non
-Re
new
able
Gro
und
Wat
er R
esou
rces
BCM
/Yea
rTh
e an
nual
ext
ract
able
am
ount
of
non
-ren
ewab
le g
roun
dwat
er
acco
rdin
g to
a p
re s
peci
fied
safe
yi
eld
that
is d
icta
ted
by a
pre
sp
ecifi
ed s
usta
inab
ility
per
iod
(x
num
ber
of y
ears
).
TEN
RGW
R ca
n be
esti
mat
ed b
y hy
drol
ogic
al m
odel
ing
(Phy
sica
lly-B
ased
Dis
trib
uted
Mod
els)
: P re
cord
s, S
oil t
ype
map
s, L
and
use
map
s, Ir
riga
tion
and
drai
nage
map
s, E
TP
inpu
ts, S
urfa
ce r
unoff
and
cat
chm
ent o
utle
ts, R
echa
rge
of
grou
ndw
ater
aqu
ifers
by
prec
ipita
tion,
Sat
ellit
e im
ager
y.G
roun
dwat
er re
char
ge fr
om S
urfa
ce w
ater
flow
s ca
n ei
ther
be
esti
mat
ed fr
om o
bser
vatio
n w
ells
or
mod
eled
thro
ugh
Surf
ace-
Gro
undw
ater
Cou
pled
mod
els.
Th
e TE
NRG
WR
extr
acta
ble
annu
ally
, acc
ordi
ng to
a
pre
spec
ified
saf
e yi
eld,
is d
icta
ted
by a
pre
spe
cifie
d su
stai
nabi
lity
peri
od (x
num
ber
of y
ears
).
DG
RE, C
MCR
DA
, DG
RE, O
SS
Coun
try’
s A
rea
Insi
de
The
Aqu
ifer
km2
(Map
ped)
Coun
try’
s A
rea
insi
de th
e Sh
ared
A
quife
rM
appe
d D
GRE
, CM
CRD
A, D
GRE
, O
SS
Pote
ntial
Vol
ume
for
Each
Cou
ntry
BCM
Coun
try’
s Po
tenti
al G
roun
dwat
er
Volu
me
insi
de th
e Sh
ared
A
quife
r
Can
be
estim
ated
by
hydr
olog
ical
mod
elin
g (P
hysi
cally
-Ba
sed
Dis
trib
uted
Mod
els)
: P re
cord
s, S
oil t
ype
map
s, L
and
use
map
s, Ir
riga
tion
and
drai
nage
map
s, E
TP in
puts
, Sur
face
ru
noff
and
cat
chm
ent o
utle
ts, R
echa
rge
of g
roun
dwat
er
aqui
fers
by
prec
ipita
tion,
Sat
ellit
e im
ager
y.
DG
RE, C
MCR
DA
, DG
RE, O
SS
Inflo
w to
Eac
h Co
untr
yBC
M/Y
ear
Long
-ter
m a
vera
ge a
nnua
l qu
antit
y of
gro
undw
ater
an
nual
ly e
nter
ing
the
coun
try,
ta
king
into
con
side
ratio
n tr
eatie
s (F
AO)
Exte
rnal
Gro
undw
ater
Inflo
w (E
GI)
: Lo
ng-t
erm
ave
rage
an
nual
qua
ntity
of g
roun
dwat
er a
nnua
lly e
nter
ing
the
coun
try,
taki
ng in
to c
onsi
dera
tion
trea
ties
(FAO
).Es
timat
ed fr
om p
iezo
met
ric
map
s, o
bser
vatio
n w
ells
or
mod
eled
thro
ugh
Gro
undw
ater
mod
els.
DG
RE, C
MCR
DA
, DG
RE, O
SS

52 Tunisia 2012 State of the Water Report
MEW
INA
Who
le A
quife
r In
dica
tors
Uni
tsD
efini
tion
Met
hodo
logy
to m
easu
re, e
stim
ate
and
repo
rt v
alue
Insti
tuti
on in
ch
arge
Sour
ce o
f da
ta
Outf
low
from
Eac
h Co
untr
yBC
M/Y
ear
Long
-ter
m a
vera
ge a
nnua
l qu
antit
y of
gro
undw
ater
leav
ing
the
coun
try
(FAO
)
Exte
rnal
Gro
undw
ater
outf
low
(EG
O) :
Lon
g-te
rm a
vera
ge
annu
al q
uanti
ty o
f gro
undw
ater
leav
ing
the
coun
try
(FAO
) Es
timat
ed fr
om p
iezo
met
ric
map
s, o
bser
vatio
n w
ells
or
mod
eled
thro
ugh
Gro
undw
ater
mod
els.
No
EGO
tow
ards
nei
ghbo
ring
cou
ntri
es, b
ut to
war
ds th
e se
a in
cas
e of
coa
stal
aqu
ifers
.
DG
RE, C
M
CRD
A, D
GRE
, OSS
Pieo
zom
etri
c W
ater
H
eads
Met
ers
(Map
ped)
Pieo
zom
etri
c W
ater
Hea
ds
Map
ped
DG
RE, C
MCR
DA
, DG
RE, O
SS
Dep
th fr
om w
ater
to
Base
men
t/ C
onfin
ing
Laye
r (U
ncon
fined
A
quife
r)
Met
ers
(Map
ped)
Dep
th fr
om w
ater
to B
asem
ent/
Co
nfini
ng L
ayer
(Unc
onfin
ed
Aqu
ifer)
Map
ped
DG
RE, C
MCR
DA
, DG
RE, O
SS
Dep
th to
Wat
er T
able
(U
ncon
fined
Aqu
ifer)
Met
ers
(Map
ped)
The
verti
cal d
ista
nce
from
the
grou
nd s
urfa
ce to
the
wat
er
Tabl
e in
cas
e of
unc
onfin
ed
aqui
fers
Map
ped
DG
RE, C
MCR
DA
, DG
RE, O
SS
Dep
th to
Pie
zom
etri
c Su
rfac
e (C
onfin
ed
Aqu
ifer)
Met
ers
(Map
ped)
The
verti
cal d
ista
nce
from
the
grou
nd le
vel t
o th
e pi
ezom
etri
c le
vel
Map
ped
DG
RE, C
MCR
DA
, DG
RE, O
SS
Dep
th fr
om P
iezo
met
ric
surf
ace
to B
asem
ent/
Bo
ttom
of c
onfin
ed
aqui
fer
Met
ers
(Map
ped)
The
verti
cal d
ista
nce
from
the
grou
nd s
urfa
ce to
the
bott
om
of th
e co
nfine
d w
ater
bea
ring
fo
rmati
on
Map
ped
DG
RE, C
MCR
DA
, DG
RE, O
SS
Wat
er &
Use
s
With
draw
als
from
Blu
e G
roun
dwat
erBC
M/Y
ear
Tota
l abs
trac
tions
from
gr
ound
wat
er s
ourc
es, i
nclu
ding
no
n re
new
able
sou
rces
per
yea
r
Tota
l ann
ual a
bstr
actio
ns fr
om g
roun
dwat
er s
ourc
es,
incl
udin
g no
n re
new
able
sou
rces
(F
low
mea
sure
men
t, s
atel
lite
imag
ery)
DG
RE,B
IRH
,CRD
A,
CMCR
DA
, BIR
H,
SON
EDE,
DG
GRE
E,
DG
RE, O
SS
With
draw
als
from
Exp
loita
ble
Non
-Ren
ewab
le
Gro
undw
ater
BCM
/Yea
rTo
tal a
nnua
l vol
umes
abs
trac
ted
from
exp
loita
ble
non-
rene
wab
le
reso
urce
s, n
amel
y, fo
ssil
grou
ndw
ater
.
Tota
l ann
ual v
olum
es a
bstr
acte
d fr
om e
xplo
itabl
e no
n-re
new
able
reso
urce
s, n
amel
y, fo
ssil
grou
ndw
ater
.(F
low
mea
sure
men
t, s
atel
lite
imag
ery)
DG
RE, C
MCR
DA
, DG
RE, O
SS
Extr
actio
n Zo
nes
of th
e A
quife
rN
umbe
rs/
Map
ped
Extr
actio
n zo
nes
of th
e aq
uife
r, w
ithou
t any
ris
k N
umbe
rs/
Map
ped
DG
RE ,
CMCR
DA
,DG
RE, O
SS
Ann
ually
Obs
erve
d D
raw
dow
n (A
vera
ge &
Map
ped)
Met
ers
Ann
ually
Obs
erve
d D
raw
dow
n(A
vera
ge &
Map
ped)
DG
RE ,
CMCR
DA
,DG
RE, O
SS

53
National State of the W
ater (SOW
) Indicators
Tunisia 2012 State of the Water Report
MEW
INA
Who
le A
quife
r In
dica
tors
Uni
tsD
efini
tion
Met
hodo
logy
to m
easu
re, e
stim
ate
and
repo
rt v
alue
Insti
tuti
on in
ch
arge
Sour
ce o
f da
ta
Wat
er &
Lan
d U
se
Chan
ge
Tota
l Irr
igat
ed
Agr
icul
tura
l Lan
dha
Tota
l wat
er m
anag
ed a
gric
ultu
ral
area
Are
a (h
a)D
GG
REE,
CM
DG
GRE
E, D
GED
A,
CRD
As,
CN
T, O
SS
Tota
l Rai
nfed
A
gric
ultu
ral L
and
haTo
tal r
ain
fed
agri
cultu
ral a
rea
Are
a (h
a)D
GPA
, CM
DG
PA, D
GG
REE,
D
GED
A, C
RDA
s,
CNT,
OSS
Tota
l Pas
ture
Are
aha
Tota
l Pas
ture
Are
aA
rea
(ha)
DG
F, O
EP, C
M
DG
F, O
EP, D
GPA
, D
GED
A, C
RDA
Tota
l For
ests
Are
aha
Tota
l For
ests
Are
aA
rea
(ha)
DG
F, C
MD
GF,
DG
EDA
, CRD
A
Urb
an E
ncro
achm
ent o
n A
gric
ultu
ral L
and
ha/Y
ear
Is th
e lo
ss o
f agr
icul
tura
l lan
d ca
used
by
urba
niza
tion,
and
is
expr
esse
d by
agr
icul
tura
l are
a lo
st/
year
.
The
reco
mm
ende
d ap
proa
ch d
epen
ds o
n th
e pr
esen
ce o
f hi
gh re
solu
tion
Land
sat S
atel
lite
imag
es fo
r di
ffere
nt y
ears
fo
r th
e ar
ea o
r co
untr
y of
inte
rest
. The
se im
ages
are
sim
ply
over
laid
and
the
diffe
renc
e in
are
a be
twee
n th
em is
stu
died
by
Geo
grap
hica
l Inf
orm
ation
Sys
tem
(GIS
) soft
war
e.
DG
GRE
E, D
GPA
, D
GAC
TA, C
MD
GG
REE,
DG
PA,
DG
EDA
, CRD
As,
CN
T, O
SS
The
Dec
reas
e in
G
roun
dwat
er R
echa
rge
caus
ed b
y U
rban
En
croa
chm
ent
BCM
/Yea
r T
he D
ecre
ase
in G
roun
dwat
er
Rec
harg
e ca
used
by
Urb
an
Encr
oach
men
t
Map
ped
DG
RE, O
SS
DG
RE,O
SS,O
TED
D,
CNT
Wat
er &
Pop
ulati
on
Tota
l Aqu
ifer
boun
d an
d de
pend
ent p
opul
ation
Num
ber
Tota
l Aqu
ifer
boun
d an
d de
pend
ent p
opul
ation
To
tal A
quife
r bo
und
and
depe
nden
t pop
ulati
on
DG
RE, B
IRH
, CM
D
GRE
, BIR
H,
OSS
Inte
rnal
Ren
ewab
le
Wat
er R
esou
rces
Per
Ca
pita
CM/C
apita
The
max
imum
theo
retic
al
amou
nt o
f wat
er p
rodu
ced
inte
rnal
ly a
nd a
ctua
lly a
vaila
ble,
on
a p
er p
erso
n ba
sis
IRW
R /
Tota
l pop
ulati
on in
m3 /
y/c.
DG
RE, I
NS,
CMD
GRE
, DG
BGTH
, BP
EH, I
NS,
OSS
Gro
undw
ater
W
ithdr
awal
Per
Cap
itaCM
/Cap
itaTo
tal a
nnua
l abs
trac
tions
from
gr
ound
wat
er s
ourc
es in
clud
ing
non-
rene
wab
le g
roun
dwat
er a
nd
seco
ndar
y fr
eshw
ater
sou
rces
(w
ater
pre
viou
sly
with
draw
n an
d re
turn
ed),
on a
per
per
son
basi
s.
Tota
l ann
ual a
bstr
actio
ns/
Tota
l pop
ulati
on in
m3 /
y/c.
DG
RE, D
GG
REE,
IN
S, C
MD
GRE
, DG
BGTH
, D
GG
REE,
BPE
H,
INS,
OSS
Wat
er &
Qua
lity
Conc
entr
ation
of
Chlo
ride
in T
he A
quife
rs
Dom
ain
PPM
/ M
appe
dCo
ncen
trati
on o
f Chl
orid
e in
the
Aqu
ifers
Dom
ain
Map
ped
D
GRE
, BIR
H, C
M
DG
RE, B
IRH
, OSS

54 Tunisia 2012 State of the Water Report
MEW
INA
Who
le A
quife
r In
dica
tors
Uni
tsD
efini
tion
Met
hodo
logy
to m
easu
re, e
stim
ate
and
repo
rt v
alue
Insti
tuti
on in
ch
arge
Sour
ce o
f da
ta
Nitr
ate
Conc
entr
ation
PPM
/ M
appe
dN
itrat
e Co
ncen
trati
onM
appe
d
DG
RE, B
IRH
, CM
D
GRE
, BIR
H, O
SS
Elec
tric
Con
ducti
vity
1/O
HM
(S
/M)
Elec
tric
Con
ducti
vity
Map
ped
D
GRE
, BIR
H, C
M
DG
RE, B
IRH
, OSS
To
tal D
isso
lved
Sol
ids
PPM
/ M
appe
dTo
tal D
isso
lved
Sol
ids
Map
ped
D
GRE
, BIR
H, C
M
DG
RE, B
IRH
, OSS
Fluo
ride
Con
cen t
ratio
nPP
M/
Map
ped
Fluo
ride
Con
cent
ratio
nM
appe
d
DG
RE, B
IRH
, CM
D
GRE
, BIR
H, O
SS
Wat
er &
Eco
syst
ems
Num
ber
of
Gr o
undw
ater
Bas
ed
Ecos
yste
ms
Num
ber
Num
ber
of G
roun
dwat
er B
ased
Ec
osys
tem
sN
umbe
r
DG
F, W
WF,
MC
DG
F, W
WF,
OSS
Num
ber
of R
AM
SAR
Wet
land
s in
The
Aqu
ifer
Dom
ain
Num
ber
Num
ber
of R
AM
SAR
Wet
land
s in
Th
e A
quife
r D
omai
nN
umbe
rD
GF,
WW
F, M
C D
GF,
WW
F, O
SS
Num
ber
of E
ndan
gere
d Sp
ecie
sN
umbe
rN
umbe
r of
End
ange
red
Spec
ies
Num
ber
DG
F, W
WF,
MC
DG
F, W
WF,
OSS
Num
ber
of In
vasi
ve
Spec
ies
Num
ber
Num
ber
of In
vasi
ve S
peci
esN
umbe
r D
GF,
WW
F, M
C D
GF,
WW
F, O
SS
Wat
er &
Gov
erna
nce
IWRM
Pla
n (Y
es/N
o)Ye
s/N
oIW
RM P
lan
(Yes
/No)
IWRM
Pla
n (Y
es/N
o)D
GRE
, BIR
H ,
MC
DG
RE,B
IRH
, CR
DA
, O
SS
Wel
l Per
mits
to d
ate
Num
ber
Wel
l Per
mits
to d
ate
Wel
l Per
mits
to d
ate
DG
RE, B
IRH
, MC
D
GRE
,BIR
H,
CRD
A ,
OSS
Volu
met
ric
Gro
undw
ater
Rig
hts
BCM
/Yea
rVo
lum
etri
c G
roun
dwat
er R
ight
sVo
lum
etri
c G
roun
dwat
er R
ight
sD
GRE
, BIR
H, M
C
DG
RE,B
IRH
, CR
DA
, O
SS
Unl
icen
sed
Gro
undw
ater
A
bstr
actio
ns
BCM
/Yea
rU
nlic
ense
d G
roun
dwat
er
Abs
trac
tions
Unl
icen
sed
Gro
undw
ater
Abs
trac
tions
DG
RE, B
IRH
, MC
D
GRE
,BIR
H,
CRD
A ,O
SS
Wat
er &
Inte
rnati
onal
Re
lati
ons

55
National State of the W
ater (SOW
) Indicators
Tunisia 2012 State of the Water Report
MEW
INA
Who
le A
quife
r In
dica
tors
Uni
tsD
efini
tion
Met
hodo
logy
to m
easu
re, e
stim
ate
and
repo
rt v
alue
Insti
tuti
on in
ch
arge
Sour
ce o
f da
ta
Dep
ende
ncy
Ratio
of
Each
Rip
aria
n Co
untr
y%
The
perc
ent o
f ann
ual v
olum
es
abst
ract
ed fr
om tr
ansb
ound
ary
wat
er b
odie
s to
tota
l ann
ual
rene
wab
le w
ater
reso
urce
s.
-Ann
ual v
olum
es a
bstr
acte
d fr
om tr
ansb
ound
ary
wat
er
bodi
es /
Tota
l ann
ual r
enew
able
wat
er re
sour
ces.
DG
RE, D
GBG
TH,
BPEH
, MC
DG
RE,D
GBG
TH,
CRD
A, O
SS
Bila
tera
l / M
ultil
ater
al
Agr
eem
ents
&
Coop
erati
on P
roto
col
or M
OU
s Be
twee
n Ri
pari
ans
Num
ber
The
num
ber
of B
ilate
ral a
nd/
or M
ultil
ater
al a
gree
men
ts &
Co
oper
ation
Pro
toco
l or
MO
Us
betw
een
Ripa
rian
s, a
par
ticul
ar
coun
try
is in
volv
ed in
. The
se
agre
emen
ts s
houl
d be
sol
ely
inte
nded
to tr
ansb
ound
ary
wat
er
-Mul
tilat
eral
/ Bi
late
ral A
gree
men
ts &
Coo
pera
tion
Prot
ocol
or
MO
Us
betw
een
Ripa
rian
s-N
umbe
r of
Rip
aria
ns in
eac
h w
ater
bod
y
Min
istr
y of
A
gric
ultu
re:
DCI
, DG
RE,
DG
BGTH
, MC
M
inis
try
of
Fore
ign
Affa
irs
Min
istr
y of
A
gric
ultu
re: D
CI,
DG
RE, D
GBG
TH,
OSS
Min
istr
y of
Fo
reig
n A
ffairs
.
Pres
ence
of O
ther
Tr
ansb
oudr
ay B
odie
s in
Ri
pari
an C
ount
ries
Num
ber
Oth
er T
rans
boud
ray
Bodi
es in
Ri
pari
an C
ount
ries
Oth
er T
rans
boud
ray
Bodi
es in
Rip
aria
n Co
untr
ies
DG
RE, B
IRH
, MC
DG
RE, B
IRH
, OSS
Tota
l: 40
indi
cato
rs

56 Tunisia 2012 State of the Water Report
MEW
INA
Thi
s sec
tion
cons
ists o
f a
data
shee
t ind
icat
ing
the
valu
es a
ssig
ned
to e
ach
indi
cato
r, al
ong
with
the
units
of
mea
sure
men
t, th
e m
easu
rem
ent
year
, the
sou
rce
of d
ata,
and
any
rem
arks
. All
repo
rted
val
ues
are
for t
he y
ear 2
012.
In th
e un
likel
y ca
se w
here
val
ues
are
only
ava
ilabl
e fo
r a
year
prio
r to
2012
an
extra
pola
tion
met
hod
is us
ed to
est
imat
e th
e 20
12 v
alue
.
4.1.
The
Nat
iona
l SO
W D
ata
Tabl
e 9.
Nati
onal
SO
W d
ata
shee
t ind
icati
ng th
e va
lues
ass
igne
d to
eac
h in
dica
tor,
unit,
mea
sure
men
t yea
r, an
d so
urce
Indi
cato
rU
nits
Valu
esSo
urce
Rem
arks
Valu
es20
12So
urce
(V 2
012)
Rem
arks
Wat
er &
Ava
ilabi
lity
Ann
ual S
paci
ally
Ave
rage
d P
reci
pita
tion
Dep
thM
M/Y
ear
230.
00FA
O A
QU
AST
ATA
nnua
l Av
erag
e15
3.0
DG
RE R
ainf
all
Dire
ctor
y
Ann
ual A
vera
geH
ydro
logi
cal
Year
201
2-13
(Defi
cit
Year
in ra
in)
Ann
ual P
reci
pita
tion
Volu
me
BCM
/Yea
r36
.00
CED
ARE
/AW
CA
A23
.7D
GRE
Rai
nfal
l D
irect
ory
Ann
ual A
vera
geH
ydro
logi
c Ye
ar 2
012-
13(D
efici
t Yea
r in
rain
)
Blue
Wat
er
Inte
rnal
Ren
ewab
le S
urfa
ce W
ater
(IRS
W)
BCM
/Yea
r2.
70M
EWIN
A R
AR
AA
2.70
0D
GRE
AA
Inte
rnal
Ren
ewab
le G
roun
dwat
er (I
RG)
BCM
/Yea
r2.
10M
EWIN
A R
AR
AA
1.55
4D
GRE
AA
Tota
l Int
erna
l Ren
ewab
le B
lue
Wat
er R
esou
rces
(T
IRBW
R)=(
IRSW
+IRG
)-(O
SWG
)BC
M/Y
ear
4.80
FAO
AQ
UA
STAT
AA
3.85
4D
GRE
AA
Exte
rnal
Sur
face
Wat
er In
flow
(ESW
I)BC
M/Y
ear
0.30
FAO
AQ
UA
STAT
AA
0.32
0D
GRE
AA
Exte
rnal
Sur
face
Wat
er O
utflo
w (E
SWO
)BC
M/Y
ear
0.18
FAO
AQ
UA
STAT
AA
0.19
0D
GRE
AA
Exte
rnal
Gro
undw
ater
Inflo
w (E
GI)
BCM
/Yea
r0.
10FA
O A
QU
AST
ATA
A0.
100
DG
REA
A
Exte
rnal
Gro
undw
ater
Outf
low
(EG
O)
BCM
/Yea
r0.
00FA
O A
QU
AST
ATA
A0.
000
DG
REA
A
Tota
l Ext
erna
l Ren
ewab
le B
lue
Wat
er R
esou
rces
In
flow
(TER
BWR)
=(ES
WI+
EGI)
BCM
/Yea
r0.
40FA
O A
QU
AST
ATA
A0.
420
DG
REA
A
4. I
ndic
ator
s Va
lues

57
Indicators Values
Tunisia 2012 State of the Water Report
MEW
INA
Tota
l Ren
ewab
le B
lue
Surf
ace
Wat
er
(TRB
SW)=
(IRSW
)+(E
SWI)-
(ESW
O)
BCM
/Yea
r2.
82FA
O A
QU
AST
ATA
A2.
830
DG
REA
A
Tota
l Ren
ewab
le B
lue
Gro
undw
ater
(T
RBG
)=(IR
G)+
(EG
I)-(E
GO
)BC
M/Y
ear
2.20
FAO
AQ
UA
STAT
AA
1.65
4D
GRE
AA
Ove
rlap
Bet
wee
n Su
rfac
e W
ater
and
G
roun
dwat
er (O
SWG
)BC
M/Y
ear
0.40
FAO
AQ
UA
STAT
AA
0.40
0D
GRE
AA
Tota
l Ren
ewab
le B
lue
Wat
er R
esou
rces
(T
RBW
R)=(
TRBS
W)+
(TRB
GW
)-(O
SWG
)BC
M/Y
ear
4.62
FAO
AQ
UA
STAT
AA
4.08
4D
GRE
AA
Tota
l Exp
loita
ble
Non
-Ren
ewab
le G
roun
dwat
er
(TN
RG)
BCM
/Yea
r-
--
0.61
(201
2)an
d 0.
72 (
2050
) as
Mod
el p
roje
ction
sD
GRE
, OSS
,CM
AA
Tota
l Blu
e W
ater
Res
ourc
es1-
(TBW
R)=(
TBSW
)+(T
BGW
)-(O
SWG
)2-
(TBW
R)=(
TRBW
R)+(
TNRB
WR)
BCM
/Yea
r-
--
(1) 4
.694
(2) 4
.694
DG
REA
A
Mob
iliza
tion
of S
urfa
ce W
ater
(spe
cific
indi
cato
r)BC
M/Y
ear
--
AA
2.18
8D
GRE
,DG
BGTH
AA
Gre
en W
ater
Wat
er fo
r Ra
in-f
ed A
gric
ultu
re C
onsu
mpti
ons
BCM
/Yea
r5.
52CE
DA
RE/A
WC
AA
5.50
0D
GG
REE
AA
Wat
er fo
r Ra
in-f
ed P
astu
re C
onsu
mpti
onBC
M/Y
ear
5.95
CED
ARE
/AW
CA
A6.
000
DG
GRE
EA
A
Wat
er fo
r Ra
in-f
ed F
ores
t Con
sum
ption
BCM
/Yea
r1.
33CE
DA
RE/A
WC
AA
1.50
0D
GG
REE
AA
Tota
l Ren
ewab
le G
reen
Wat
er R
esou
rces
(T
RGW
R)BC
M/Y
ear
12.8
1CE
DA
RE/A
WC
AA
13.0
00D
GRE
AA
Tota
l Ren
ewab
le W
ater
Res
ourc
es
(TRW
R)=(
TRBW
R+TR
GW
R)BC
M/Y
ear
17.4
1CE
DA
RE/A
WC
AA
17.0
84D
GRE
AA
Tota
l Con
venti
onal
Wat
er R
esou
rces
(TCW
R)=(
TRW
R)+(
TNRG
)=(T
BWR+
(TRG
WR)
BCM
/Yea
r-
--
17.6
9417
.694
DG
RED
GRE
AA
AA
Non
-Con
venti
onal
Wat
er
Prod
uced
Mun
icip
al a
nd In
dust
rial
Was
tew
ater
(P
MW
) +(P
IW)
BCM
/Yea
r0.
38CE
DA
RE/A
WC
AA
0.2
76O
NA
SA
APM
W=
0.23
9PI
W =
0.0
37
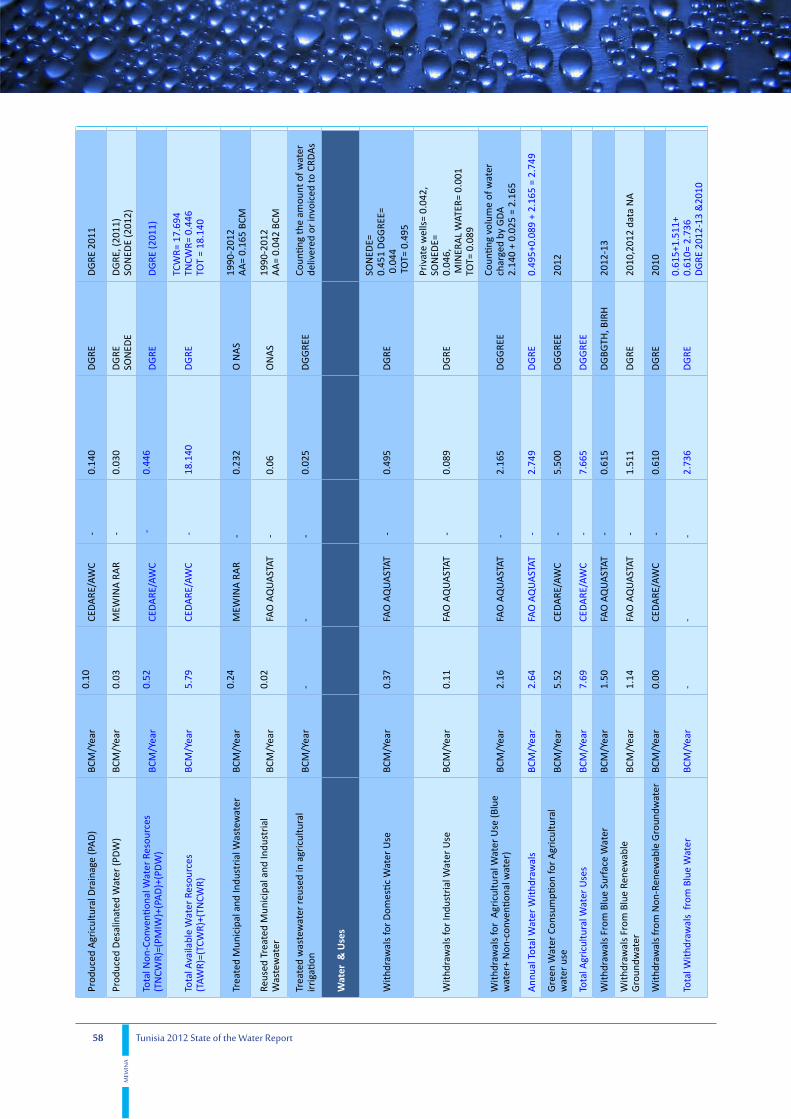
58 Tunisia 2012 State of the Water Report
MEW
INA
Prod
uced
Agr
icul
tura
l Dra
inag
e (P
AD
)BC
M/Y
ear
0.10
CED
ARE
/AW
C -
0.14
0D
GRE
DG
RE 2
011
Prod
uced
Des
alin
ated
Wat
er (P
DW
)BC
M/Y
ear
0.03
MEW
INA
RA
R -
0.03
0D
GRE
SON
EDE
DG
RE, (
2011
)SO
NED
E (2
012)
Tota
l Non
-Con
venti
onal
Wat
er R
esou
rces
(T
NCW
R)=(
PMIW
)+(P
AD
)+(P
DW
)BC
M/Y
ear
0.52
CED
ARE
/AW
C -
0.44
6D
GRE
DG
RE (2
011)
Tota
l Ava
ilabl
e W
ater
Res
ourc
es
(TAW
R)=(
TCW
R)+(
TNCW
R)BC
M/Y
ear
5.79
CED
ARE
/AW
C -
18.1
40D
GRE
TCW
R= 1
7.69
4TN
CWR=
0.4
46TO
T =
18.1
40
Trea
ted
Mun
icip
al a
nd In
dust
rial
Was
tew
ater
BCM
/Yea
r0.
24M
EWIN
A R
AR
-0.
232
O N
AS
1990
-201
2A
A=
0.16
5 BC
M
Reus
ed T
reat
ed M
unic
ipal
and
Indu
stri
al
Was
tew
ater
BCM
/Yea
r0.
02FA
O A
QU
AST
AT-
0.06
ON
AS
1990
-201
2A
A=
0.04
2 BC
M
Trea
ted
was
tew
ater
reus
ed in
agr
icul
tura
l ir
riga
tion
BCM
/Yea
r-
--
0.02
5D
GG
REE
Coun
ting
the
amou
nt o
f wat
er
deliv
ered
or
invo
iced
to C
RDA
s
Wat
er &
Use
s
With
draw
als
for
Dom
estic
Wat
er U
seBC
M/Y
ear
0.37
FAO
AQ
UA
STAT
-0.
495
DG
RE
SON
EDE=
0.45
1 D
GG
REE=
0.0
44 T
OT=
0.4
95
With
draw
als
for
Indu
stri
al W
ater
Use
BCM
/Yea
r0.
11FA
O A
QU
AST
AT -
0.08
9D
GRE
Priv
ate
wel
ls=
0.04
2,SO
NED
E=0.
046,
MIN
ERA
L W
ATER
= 0.
001
TOT=
0.0
89
With
draw
als
for
Agr
icul
tura
l Wat
er U
se (B
lue
wat
er+
Non
-con
venti
onal
wat
er)
BCM
/Yea
r2.
16FA
O A
QU
AST
AT-
2.16
5D
GG
REE
Coun
ting
volu
me
of w
ater
ch
arge
d by
GD
A2.
140
+ 0.
025
= 2.
165
Ann
ual T
otal
Wat
er W
ithdr
awal
sBC
M/Y
ear
2.64
FAO
AQ
UA
STAT
-2.
749
DG
RE0.
495+
0.08
9 +
2.16
5 =
2.74
9
Gre
en W
ater
Con
sum
ption
for
Agr
icul
tura
l w
ater
use
BCM
/Yea
r5.
52CE
DA
RE/A
WC
-5.
500
DG
GRE
E20
12
Tota
l Agr
icul
tura
l Wat
er U
ses
BCM
/Yea
r7.
69CE
DA
RE/A
WC
-7.
665
DG
GRE
E
With
draw
als
From
Blu
e Su
rfac
e W
ater
BCM
/Yea
r1.
50FA
O A
QU
AST
AT -
0.61
5D
GBG
TH, B
IRH
2012
-13
With
draw
als
From
Blu
e Re
new
able
G
roun
dwat
erBC
M/Y
ear
1.14
FAO
AQ
UA
STAT
-1.
511
DG
RE20
10,2
012
data
NA
With
draw
als
from
Non
-Ren
ewab
le G
roun
dwat
erBC
M/Y
ear
0.00
CED
ARE
/AW
C -
0.61
0D
GRE
2010
Tota
l With
draw
als
from
Blu
e W
ater
BCM
/Yea
r-
--
2.73
6D
GRE
0.61
5+1.
511+
0.61
0= 2
.736
DG
RE 2
012-
13 &
2010

59
Indicators Values
Tunisia 2012 State of the Water Report
MEW
INA
Agr
icul
tura
l Dra
inag
e W
ater
Use
BCM
/Yea
r-
--
0.02
0D
GRE
2011
With
draw
als
from
Des
alin
ated
Wat
erBC
M/Y
ear
--
-0.
030
SON
EDE,
DG
RE (P
riva
te)
2012
2011
Tota
l With
draw
als
from
Non
-Con
venti
onal
W
ater
Res
ourc
esBC
M/Y
ear
--
-0.
110
DG
RE20
12
Gre
en W
ater
Con
sum
ption
for
Live
stoc
k Fo
dder
W
ater
Use
BCM
/Yea
r-
--
0.76
0D
GPA
, DG
EDA
, D
GSA
,O
EP20
12
Bott
led
Wat
er P
rodu
ction
BCM
/Yea
r-
--
0.00
1O
ffice
of
Ther
mal
ism
&
Hyd
roth
erap
y
2012
Wat
er &
Land
use
Cha
nge
Tota
l Irr
igat
ed A
gric
ultu
ral L
and
ha38
5 00
0.00
FAO
AQ
UA
STAT
-
421,
000
.00
DG
GRE
ED
GG
REE
Tota
l Rai
n-Fe
d A
gric
ultu
ral L
and
ha4
491
000.
00CE
DA
RE/A
WC
-4,
953
,550
.00
DG
PAD
GED
A 2
012
Tota
l For
est L
and
ha1
085
000.
00W
orld
Re
ssou
rces
In
stitu
te -
1, 1
51,2
18.0
0D
GF
DG
F
Tota
l Nat
ural
Pas
ture
Lan
dha
4 84
0 00
0.00
CED
ARE
/AW
C -
4, 8
95,0
00.0
0D
GF,
DG
EDA
DG
F
Urb
an E
ncro
chm
ent o
n G
reen
Cov
erha
lost
/Yea
r-
--
10,0
00
DG
ACTA
,OTE
DD
, CN
TD
GAC
TA,O
TED
D, C
NT
Impa
ct o
f Urb
an E
ncro
chm
ent o
n W
ater
Re
sour
ces
(Ind
icat
ors
liste
d be
low
)
Dec
reas
e in
Gro
undw
ater
Rec
harg
eBC
M/Y
ear
--
-0.
0012
6D
GRE
DG
RE
Dec
reas
e in
Wat
er C
onsu
mpti
ons
of G
reen
Co
ver
BCM
/Yea
r-
--
0.03
0D
GED
A, D
GPA
, DG
FD
GED
A, D
GPA
, DG
F
Incr
ease
in S
urfa
ce R
unoff
BCM
/Yea
r-
--
0.03
126
DG
RED
GRE
Incr
ease
in D
omes
tic W
ater
With
draw
als
BCM
/Yea
r-
--
0.03
0D
GG
REE,
SON
EDE
DG
GRE
E,SO
NED
E
Wat
er &
Serv
ices
Wat
er C
over
age
and
Acc
essi
bilil
ity
Impr
oved
Urb
an W
ater
Sup
ply
Cove
rage
(S
ecto
r M
inis
try)
%10
0.00
MEW
INA
RA
R -
100.
00SO
NED
ED
GG
REE
SON
EDE

60 Tunisia 2012 State of the Water Report
MEW
INA
Impr
oved
Rur
al W
ater
Sup
ply
Cove
rage
(Sec
tor
Min
istr
y)%
94.0
0M
EWIN
A R
AR
-93
.4SO
NED
ED
GG
REE
SON
EDE
(49.
7%) +
DG
GRE
E (4
3.7%
)
Impr
oved
Urb
an S
anita
tion
Cove
rage
(Sec
tor
Min
istr
y)%
84.7
0M
EWIN
A R
AR
- 98.9
4
85.4
ON
AS
1994
-201
2, A
A=
74,5
%
INS
INS
2009
2012
NA
Impr
oved
Rur
al S
anita
tion
Cove
rage
(Sec
tor
Min
istr
y)%
5.50
MEW
INA
RA
R - 83
.95
5.1
0NA
S-
INS
INS
2009
2012
NA
Impr
oved
Wat
er S
uppl
y Co
vera
ge (S
ecto
r M
inis
try)
%98
.00
MEW
INA
RA
R -
97.8
SON
EDE
DG
GRE
EU
rban
+ R
ural
Impr
oved
San
itatio
n Co
vera
ge (S
ecto
r M
inis
try)
%57
.00
MEW
INA
RA
R - 94
.44
58.4
ON
AS
-
INS
INS
2009
2012
NA
Wat
er In
fras
truc
ture
Leng
th o
f Wat
er S
uppl
y N
etw
orks
Km47
,544
.00
(with
out
DG
GRE
E)M
EWIN
A R
AR
-
SON
EDE:
48,4
59.0
0 km
D
GG
REE:
78
,100
.5km
TOTA
L:12
6,55
9.5
km
SON
EDE
DG
GRE
E
-SO
NED
E,
1983
-201
2 A
A=
31,5
63.5
km
; -D
GG
REE,
196
5-20
12A
A=
29,6
43.9
5 km
Leng
th o
f Se
ewag
e N
etw
orks
Km-
--
15,3
64O
NA
S20
12
Leng
th o
f Irr
igati
on N
etw
orks
Km-
--
NA
DG
GRE
E-
Leng
th o
f Dra
inag
e N
etw
orks
Km-
--
NA
DG
GRE
E-
Dam
Sto
rage
Cap
acity
(Ins
talle
d)BC
M2.
66FA
O A
QU
AST
AT -
2.15
2D
GBG
TH20
12
Wat
er S
uppl
y Ca
paci
tyBC
M/Y
ear
--
-0.
755
SON
EDE
2012
Des
alin
ation
Cap
acity
BCM
/Yea
r -
Sect
or M
inis
try
-
-0.0
25 (S
ON
EDE)
, no
t inc
lude
d dr
inki
ng
wat
er tr
eatm
ent a
nd
defe
rriz
ation
pla
nts
capa
city
-0.0
10 (P
riva
te
stati
ons)
TOT:
0.0
35
SON
EDE
0.02
5 BC
M/Y
ear
by S
ON
EDE
& 0
.010
BCM
/Yea
r by
pri
vate
st
ation
s
Mun
icip
al W
aste
wat
er T
reat
men
t Cap
acity
BCM
/Yea
r-
--
0.29
83O
NA
S-
Indu
stri
al W
aste
wat
er T
reat
men
t Cap
acity
BCM
/Yea
r-
--
0.01
93O
NA
S-

61
Indicators Values
Tunisia 2012 State of the Water Report
MEW
INA
Was
tew
ater
Col
lecti
on C
apac
ityBC
M/Y
ear
--
-0.
234
ON
AS
-
Wat
er &
Ene
rgy
Elec
tric
ity G
ener
ated
Usi
ng H
ydro
pow
erG
Wh/
Year
160
IH
A20
0811
0.56
STEG
2012
Hyd
ropo
wer
as
% o
f Tot
al G
ener
ated
Ele
ctri
city
%-
--
1ST
EG20
12
Inst
alle
d H
ydro
pow
er C
apac
ityM
W70
.00
IHA
2008
66.0
0ST
EG20
12
Wat
er U
sed
to G
ener
ate
Ele
ctri
city
BCM
/Yea
r-
--
0.83
0 84
8ST
EG20
12
Wat
er &
Pop
ulati
on
Tota
l Pop
ulati
on10
00 in
habi
tant
s10
365.
00In
dex
Mun
di -
10,7
76. 4
00IN
SJu
ly 2
012
(INS)
Inte
rnal
Ren
ewab
le W
ater
Res
ourc
es P
er C
apita
CM
/cap
ita/Y
ear
463.
10CE
DA
RE/A
WC
-1,
564
DG
RE20
12
Tota
l Ren
ewab
le B
lue
Wat
er R
esou
rces
Per
Ca
pita
CM/c
apita
/Yea
r44
6.02
CED
ARE
/AW
C -
378.
9D
GRE
2012
Tota
l Ren
ewab
le W
ater
Res
ourc
es P
er C
apita
CM/c
apita
/Yea
r16
79.4
0CE
DA
RE/A
WC
-1,
585.
3D
GRE
2012
Tota
l Ava
ilabl
e W
ater
Res
ourc
es P
er C
apita
CM/c
apita
/Yea
r-
--
1,68
3.0
DG
RE
2012
Blue
Wat
er W
ithdr
awal
Per
Cap
itaCM
/cap
ita/Y
ear
254.
69CE
DA
RE/A
WC
-25
4.00
DG
RED
GBG
TH20
10
Gre
en W
ater
Use
Per
Cap
itaCM
/cap
ita/Y
ear
1236
.08
CED
ARE
/AW
C -
1,20
6.00
DG
GRE
EA
A
Tota
l Wat
er C
onsu
mpti
on P
er C
apita
CM/c
apita
/Yea
r14
90.7
7CE
DA
RE/A
WC
-1,
460.
00D
GRE
AA
Agr
icul
tura
l Wat
er W
ithdr
awal
Per
Cap
itaCM
/cap
ita/Y
ear
208.
86CE
DA
RE/A
WC
-20
1.00
DG
GRE
EA
A
Indu
stri
al W
ater
With
draw
al P
er C
apita
CM/c
apita
/Yea
r10
.61
CED
ARE
/AW
C -
8.25
DG
REA
A
Dom
estic
Wat
er W
ithdr
awal
Per
Cap
itaCM
/cap
ita/Y
ear
35.2
1CE
DA
RE/A
WC
-46
.0SO
NED
E, D
GG
REE
AA
Popu
latio
n W
ithou
t Im
prov
ed W
ater
Sup
ply
1000
inha
bita
nts
103.
65CE
DA
RE/A
WC
--2
40 (S
ON
EDE)
,-2
39.9
(IN
S)SO
NED
E, IN
S,
DG
GRE
E19
93-2
013
(INS)
*(IN
S 20
09)
Popu
latio
n W
ithou
t Im
prov
ed S
anita
tion
1000
inha
bita
nts
414.
60CE
DA
RE/A
WC
-57
9.70
0 (IN
S)IN
S19
66-2
009
(INS)
(INS
2009
)
Wat
er &
Qua
lity
Dis
solv
ed O
xyge
n (D
O)
ppm
--
-
V1 :
7.7-
8.5
V2 :
5.4-
6.4
V3 :
NA
V4 :
NA
In h
ot s
pots
of
AN
PE C
ontr
ol
Net
wor
k of
Wat
er
Pollu
tion
2010
-20
12.
COPE
AUAQ
UA
POLE
V1 :
Med
jerd
aV2
: Be
ja d
ams
V3 :
Bize
rte
lago
onV4
: N
abeu
l G
roun
dwat
er

62 Tunisia 2012 State of the Water Report
MEW
INA
pHD
imen
sion
less
--
-
V1 :
7.8-
11.2
V2 :
8.0-
8.4
V3 :
7.7-
8.8
V4 :
8.4-
8.7
2004
-201
2 (W
adi
El B
ey, K
orba
la
goon
, Biz
erte
la
ke)
2006
-201
2: (W
adi
Mel
iane
Hal
g El
M
enze
l log
oon,
G
har
El M
elh
lago
on)
COPE
AUAQ
UA
POLE
V1 :
Med
jerd
aV2
: Be
ja d
ams
V3 :
Bize
rte
lago
onV4
: N
abeu
l G
roun
dwat
er
Elec
tric
Con
ducti
vity
(EC)
( m
S/c
m)
--
-
V1 :
1.5-
2.5
V2 :
0.2-
0.5
V3 :
1.7-
46.8
V4 :
2.0-
7.0
In h
ot s
pots
of
AN
PE C
ontr
ol
Net
wor
k of
Wat
er
Pollu
tion
2010
-201
2CO
PEAU
AQU
APO
LE
V1 :
Med
jerd
aV2
: Be
ja d
ams
V3 :
Bize
rte
lago
onV4
: N
abeu
l G
roun
dwat
er
Nitr
ogen
Con
cent
ratio
n(N
O3)
ppm
--
-
V1 :
NA
V2 :
NA
V3 :
2.0-
128.
2V4
: N
A
2004
-201
2 (W
adi
El B
ey, K
orba
la
goon
, Biz
erte
la
ke)
2006
-201
2: (W
adi
Mel
iane
Hal
g El
M
enze
l log
oon
Gha
r El
Mel
h la
goon
)CO
PEAU
V1 :
Med
jerd
aV2
: Be
ja d
ams
V3 :
Bize
rte
lago
onV4
: N
abeu
l G
roun
dwat
er
Phos
phor
ous
Con
cent
ratio
n(P
O4)
ppm
--
-
V1 :
1.3-
33.0
V2 :
0.4-
9.7
V3 :
0.1-
71.8
V4 :
0.1-
0.7
In h
ot s
pots
of
AN
PE C
ontr
ol
Net
wor
k of
Wat
er
Pollu
tion
2006
-201
2C0
PEAU
V1 :
Med
jerd
aV2
: Be
ja d
ams
V3 :
Bize
rte
lago
onV4
: N
abeu
l G
roun
dwat
er
Tota
l Dis
solv
ed S
olid
s (T
DS)
ppm
--
-
V1 :
730-
1480
V2 :
110-
220
V3 :
950-
3780
0V4
: 12
00-5
500
2004
-201
2 (W
adi
El B
ey, K
orba
la
goon
, Biz
erte
la
ke)
2006
-201
2: (W
adi
Mel
iane
Hal
g El
M
enze
l log
oon,
G
har
El M
elh
lago
on)
COPE
AU
V1 :
Med
jerd
aV2
: Be
ja d
ams
V3 :
Bize
rte
lago
onV4
: N
abeu
l G
roun
dwat
er
Bact
erio
logi
cal A
naly
sis
-Num
ber
of
Sam
ples
-Uns
uita
ble
Case
s (U
C)
--
--4
8,25
1 sa
mpl
es-U
C : 1
.5%
SON
EDE
1.5%
<N
T 09
-14
limit
and
< W
HO
thre
shol
d
Feca
l Cho
lifor
mCo
loni
es/1
00 m
l-
--
1-3
SON
EDE
Com
plie
s w
ith th
e st
anda
rds

63
Indicators Values
Tunisia 2012 State of the Water Report
MEW
INA
Wat
er &
Hea
lth
Dia
rrhe
a Pr
eval
ence
% o
f chi
ldre
n un
der
5 ye
ars
old
5.80
WH
O
-6.
48D
HM
PEA
A=5
.80
(200
0-20
13)
Dra
cunc
ulia
sis
Repo
rted
Cas
es%
0.00
WH
O-
0.00
DH
MPE
DH
MPE
, 201
3
Ope
n D
efec
ation
Pra
ctice
Num
ber
--
-34
8,54
0IN
SRG
PH 2
009
Perc
enta
ge o
f Ope
n D
efec
ation
%-
--
3.2
INS
RGPH
200
9
Chol
era
Repo
rted
Cas
esN
umbe
r/Ye
ar-
--
0.0
DH
MPE
AA
=0.0
0(2
000-
2013
)
Hep
atitis
A R
epor
ted
Case
s
Num
ber/
year
-
--
412
DH
MPE
412
new
repo
rted
cas
es in
201
2
Inci
denc
e ra
te
(Cas
es n
umbe
r /1
00 0
00
inha
bita
nts)
--
-3.
82D
HM
PEA
A=7
.33
(200
0-20
13)
Typh
oid
feve
r Re
port
ed C
ases
Num
ber/
year
--
-28
DH
MPE
28 n
ew re
port
ed c
ases
in 2
012
Inci
denc
e ra
te
(Cas
es n
umbe
r /1
00 0
00
inha
bita
nts)
--
-0.
26D
HM
PEA
A=0
.55
(200
0-20
13)
Wat
er &
Eco
syst
ems
Num
ber
of W
etla
nds
Site
s A
ckno
wle
dged
by
RAM
SAR
Num
ber
--
-35
DG
For
êts,
RA
MSA
R, W
WF,
MAV
A40
in
2013
Tota
l Wet
land
s a
reas
ha-
--
877,
467
DG
For
êts,
RA
MSA
R, W
WF,
MAV
A1,
608,
024
ha in
201
3
Tota
l Fre
shw
ater
Spe
cies
Cou
ntN
umbe
r-
--
260
terr
estr
ial p
lant
sp
ecie
s, 5
0 aq
uatic
pl
ant s
peci
es,
140
bird
spe
cies
( m
ost o
f whi
ch a
re
mig
rato
ry).
7 sp
ecie
s of
fres
hwat
er fi
sh in
da
ms.
DG
For
êts,
RA
MSA
R, W
WF,
MAV
A-
Num
ber
of E
ndan
gere
d S
peci
esN
umbe
r-
--
Seve
ral s
peci
es (>
10)
DG
For
êts,
RA
MSA
R, W
WF,
MAV
A-

64 Tunisia 2012 State of the Water Report
MEW
INA
Num
ber
of In
vasi
ve S
peci
esN
umbe
r-
--
>500
,000
bird
s in
w
inte
r fr
om A
sia
and
Euro
pe (d
ucks
, coo
ts
and
flam
ingo
s
DG
For
êts,
RA
MSA
R, W
WF,
MAV
A-
Wat
er &
Clim
ate
Extr
eme
Wea
ther
Eve
nts
Num
ber
of C
lass
1 F
lood
Eve
nts
Num
ber
--
-0
DG
RE-
Num
ber
of C
lass
1.5
Flo
od E
vent
sN
umbe
r-
--
1D
GRE
in fa
ct tw
o su
cces
sive
floo
ds
(Feb
ruar
y-M
arch
201
2)
Num
ber
of C
lass
2 F
lood
Eve
nts
Num
ber
--
-0
DG
RE-
Dro
ught
Eve
nts
Num
ber
--
-0
DG
RE-
Cost
of A
nnua
l Dam
age
Caus
ed b
y Fl
oods
$- %
GD
P-
--
14,0
00 h
a of
cer
eals
la
nd lo
stCi
vil P
rote
ction
NA
Cost
of A
nnua
l Dam
age
Caus
ed b
y D
roug
hts
$-%
GD
P-
--
0D
GRE
-
Ann
ual H
uman
Los
ses
Rela
ted
to F
lood
sN
umbe
r-
--
Seve
ral d
eath
s re
cord
edEv
acua
tion
of s
ever
al
villa
ges
Civi
l Pro
tecti
onN
A
Ann
ual H
uman
Los
ses
Rela
ted
to D
roug
hts
Num
ber
--
-0
DG
RE-
Unu
sual
Wea
ther
Eve
nts
(Sno
w, H
ail,…
)N
umbe
r/Ty
pe-
--
Snow
:13
Even
ts in
20
12H
ail:
16 E
vent
s in
20
12
INM
-
Nati
onal
Clim
ate
Chan
ge A
dapt
ation
Pla
nYe
s/N
o-
--
Yes
OTE
DD
, DG
REM
inis
try
of E
nviro
nmen
t,
Min
istr
y of
Agr
icul
ture
Wat
er &
Soci
o-Ec
onom
ics
Wat
er &
Pro
ducti
vity
Indu
stri
al W
ater
Pro
ducti
vity
(GD
P/W
ater
Use
)$/
CM13
8.83
CED
ARE
/AW
C -
145.
33IN
S, D
GRE
GD
P=12
.934
75 B
$W
U=0
.089
BCM
/Yea
r
Agr
icul
tura
l Wat
er P
rodu
ctivi
ty (G
DP/
Wat
er
Use
)$/
CM0.
41CE
DA
RE/A
WC
-0.
51IN
S, D
GRE
DG
GRE
E
GD
P=3.
8939
2 B$
WU
=7.6
65BC
M/Y
ear
Empl
oym
ent i
n A
gric
ultu
re “
Job
Per
Dro
p”Jo
bs/M
CM97
.46
CED
ARE
/AW
C -
71.7
5IN
S, D
GRE
DG
GRE
E
WU
=7.6
65BC
M/Y
ear
Num
ber
of e
mpl
oyed
per
sons
in
agri
cultu
re :5
50,0
12
Empl
oym
ent i
n In
dust
ry “
Job
Per
Dro
p”Jo
bs/M
CM-
--
11, 9
93.6
7IN
S, D
GRE
WU
=0.0
89 B
CM/Y
ear
Num
ber
of e
mpl
oyed
per
sons
in
indu
stry
: 1,0
67,4
37

65
Indicators Values
Tunisia 2012 State of the Water Report
MEW
INA
Wat
er &
Aff
orda
bilit
y
Wat
er a
nd S
anita
tion
Char
ges
as %
of A
vera
ge
Hou
seho
ld In
com
e %
0.01
1 (IN
S)Ca
lcul
ated
/ M
EWIN
A R
AR
2011
1.26
INS
(201
0)
1980
-201
0 (IN
S)Th
e su
rvey
is q
uinq
uenn
ial
(201
0), l
ast s
urve
y 20
10
Wat
er &
Fin
ance
Perc
enta
ge o
f Nati
onal
Bud
get d
irect
ed to
W
ater
& S
anita
tion
Sect
or%
--
-1.
9
INS,
Min
istr
y of
Fi
nanc
e, M
inis
try
of A
gric
ultu
re,
ON
AS,
DH
MPE
1.8
in 2
013
Ope
ratio
n &
Mai
nten
ance
Cos
t Rec
over
y fo
r W
ater
Sup
ply
and
Sani
tatio
n%
--
- 70
80.7
SON
EDE
Urb
an W
ater
Sup
ply
DG
GRE
ERu
ral W
ater
Sup
ply
Perc
ent o
f GD
P di
rect
ed to
San
itatio
n an
d H
ygie
ne%
--
-0.
13IN
S, O
NA
S, D
HM
PE0.
13 in
201
3
Fore
ign
Aid
for
Wat
er a
nd S
anita
tion
Mill
ion
US$
106.
31CE
DA
RE/A
WC
-
-14.
2 SO
NED
E-5
3.22
ON
AS
TOT
: 67.
42
DG
FIO
P, D
GCI
, M
inis
try
of
Fina
nce,
Min
istr
y of
Pla
n&
Inte
rnati
onal
Co
op, S
ON
EDE,
ON
AS.
DG
FIO
P,D
GCI
, Min
istr
y of
Fi
nanc
e, M
inis
try
of P
lan&
In
tern
ation
al C
oope
ratio
n,
SON
EDE,
ON
AS
Ope
ratio
n &
Mai
nten
ance
Cos
t Rec
over
y fo
r Ir
riga
tion
%-
--
64
(Irri
gate
d ar
eas
)D
GG
REE
DG
GRE
E
Wat
er &
Tra
de
Virt
ual W
ater
Impo
rts
rela
ted
to T
rade
in th
e A
gric
ultu
ral S
ecto
rBC
M/Y
ear
13.0
1CE
DA
RE/A
WC
-10
.22
DG
CE-
Virt
ual W
ater
Exp
orts
rela
ted
to T
rade
in th
e A
gric
ultu
ral S
ecto
rBC
M/Y
ear
-4.7
8CE
DA
RE/A
WC
--6
.03
DG
CE-
Virt
ual-W
ater
net
Flo
w R
elat
ed to
Tra
de in
the
Agr
icul
tura
l Sec
tor
BCM
/Yea
r8.
23CE
DA
RE/A
WC
-4.
19D
GCE
-
Wat
er &
Gov
erna
nce
IWRM
Pla
nYe
s/N
o-
--
Yes
DG
RE, B
PEH
-
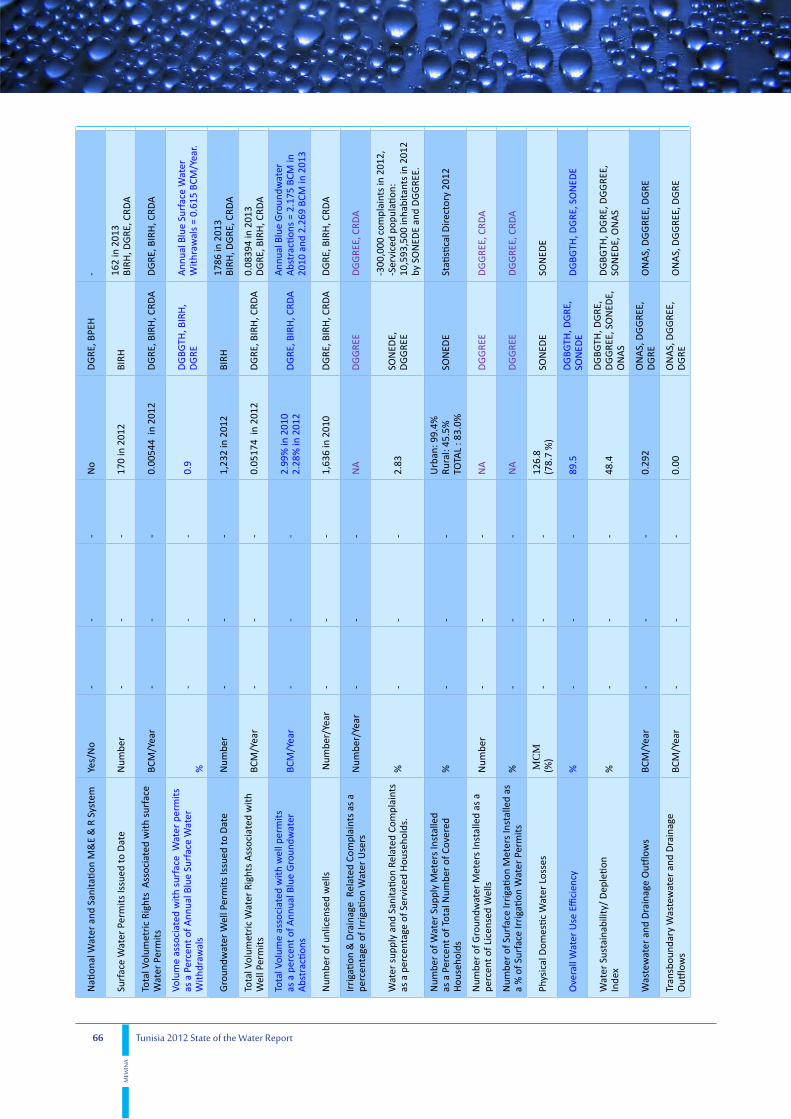
66 Tunisia 2012 State of the Water Report
MEW
INA
Nati
onal
Wat
er a
nd S
anita
tion
M&
E &
R S
yste
mYe
s/N
o-
--
No
DG
RE, B
PEH
-
Surf
ace
Wat
er P
erm
its Is
sued
to D
ate
Num
ber
--
-17
0 in
201
2BI
RH16
2 in
201
3BI
RH, D
GRE
, CRD
A
Tota
l Vol
umet
ric
Righ
ts A
ssoc
iate
d w
ith s
urfa
ce
Wat
er P
erm
itsBC
M/Y
ear
--
-0.
0054
4 in
201
2D
GRE
, BIR
H, C
RDA
DG
RE, B
IRH
, CRD
A
Volu
me
asso
ciat
ed w
ith s
urfa
ce W
ater
per
mits
as
a P
erce
nt o
f Ann
ual B
lue
Surf
ace
Wat
er
With
draw
als
%-
--
0.9
DG
BGTH
, BIR
H,
DG
REA
nnua
l Blu
e Su
rfac
e W
ater
W
ithra
wal
s =
0.61
5 BC
M/Y
ear.
Gro
undw
ater
Wel
l Per
mits
Issu
ed to
Dat
eN
umbe
r-
--
1,23
2 in
201
2BI
RH17
86 in
201
3BI
RH, D
GRE
, CRD
A
Tota
l Vol
umet
ric
Wat
er R
ight
s A
ssoc
iate
d w
ith
Wel
l Per
mits
BCM
/Yea
r-
--
0.05
174
in 2
012
DG
RE, B
IRH
, CRD
A0.
0839
4 in
201
3D
GRE
, BIR
H, C
RDA
Tota
l Vol
ume
asso
ciat
ed w
ith w
ell p
erm
its
as a
per
cent
of A
nnua
l Blu
e G
roun
dwat
er
Abs
trac
tions
BCM
/Yea
r-
--
2.99
% in
201
02.
28%
in 2
012
DG
RE, B
IRH
, CRD
AA
nnua
l Blu
e G
roun
dwat
er
Abs
trac
tions
= 2
.175
BCM
in
2010
and
2.2
69 B
CM in
201
3
Num
ber
of u
nlic
ense
d w
ells
Num
ber/
Year
--
-1,
636
in 2
010
DG
RE, B
IRH
, CRD
AD
GRE
, BIR
H, C
RDA
Irri
gatio
n &
Dra
inag
e R
elat
ed C
ompl
aint
s as
a
perc
enta
ge o
f Irr
igati
on W
ater
Use
rsN
umbe
r/Ye
ar-
--
NA
DG
GRE
ED
GG
REE,
CRD
A
Wat
er s
uppl
y an
d Sa
nita
tion
Rela
ted
Com
plai
nts
as a
per
cent
age
of S
ervi
ced
Hou
seho
lds.
%-
--
2.83
SON
EDE,
DG
GRE
E
-300
,000
com
plai
nts
in 2
012,
-S
ervi
ced
popu
latio
n:
10,5
93,5
00 in
habi
tant
s in
201
2 by
SO
NED
E an
d D
GG
REE.
Num
ber
of W
ater
Sup
ply
Met
ers
Inst
alle
d as
a P
erce
nt o
f Tot
al N
umbe
r of
Cov
ered
H
ouse
hold
s%
--
-U
rban
: 99.
4%Ru
ral:
45.5
%TO
TAL
: 83.
0%SO
NED
ESt
atisti
cal D
irect
ory
2012
Num
ber
of G
roun
dwat
er M
eter
s In
stal
led
as a
pe
rcen
t of L
icen
sed
Wel
lsN
umbe
r-
--
NA
DG
GRE
ED
GG
REE,
CRD
A
Num
ber
of S
urfa
ce Ir
riga
tion
Met
ers
Inst
alle
d as
a
% o
f Sur
face
Irri
gatio
n W
ater
Per
mits
%-
--
NA
DG
GRE
ED
GG
REE,
CRD
A
Phys
ical
Dom
estic
Wat
er L
osse
s M
CM
(%)
--
-12
6.8
(78.
7 %
)SO
NED
ESO
NED
E
Ove
rall
Wat
er U
se E
ffici
ency
%-
--
89.5
DG
BGTH
, DG
RE,
SON
EDE
DG
BGTH
, DG
RE, S
ON
EDE
Wat
er S
usta
inab
ility
/ D
eple
tion
Inde
x%
--
-48
.4D
GBG
TH, D
GRE
, D
GG
REE,
SO
NED
E,
ON
AS
DG
BGTH
, DG
RE, D
GG
REE,
SO
NED
E, O
NA
S
Was
tew
ater
and
Dra
inag
e O
utflo
ws
BCM
/Yea
r-
--
0.29
2O
NA
S, D
GG
REE,
D
GRE
ON
AS,
DG
GRE
E, D
GRE
Tran
sbou
ndar
y W
aste
wat
er a
nd D
rain
age
Outf
low
sBC
M/Y
ear
--
-0.
00O
NA
S, D
GG
REE,
D
GRE
ON
AS,
DG
GRE
E, D
GRE

67
Indicators Values
Tunisia 2012 State of the Water Report
MEW
INA
Com
mer
cial
Dom
estic
Wat
er L
osse
sBC
M/Y
ear
(%)
--
-0.
0343
(21.
3 %
)SO
NED
ESO
NED
E
Phys
ical
Irri
gatio
n W
ater
Los
ses
BCM
/Yea
r-
--
38%
(Esti
mat
ed)
BCM
/Yea
r N
AD
GG
REE
Effici
ency
rate
in ir
riga
ted
plot
s=77
% in
201
2
Num
ber
of W
ater
rela
ted
cita
tions
(Wat
er L
aws
Enfo
rcem
ent)
Num
ber
--
-18
8BI
RH, D
GRE
267
in 2
013
BIRH
, DG
RE, C
RDA
Num
ber
of W
ater
Use
rs A
ssoc
iatio
nsN
umbe
r-
--
2,58
0D
GG
REE
1,32
7 W
UA
(GA
D) W
ater
Sup
ply
+ 1,25
3 W
UA
( G
AD
) Irr
igati
on
Wat
er U
sers
Ass
ocia
tions
Agr
icul
tura
l Lan
d Co
vera
ge%
of A
g. L
and
--
-
47,5
% o
f Irr
igat
ed
area
s,1.
0 %
of A
gric
ultu
ral
land
DG
GRE
E20
0,00
0 ha
cov
ered
in 2
012
Wat
er &
Inte
rnati
onal
Rel
ation
s
Tran
sbou
ndar
y W
ater
Bod
ies
Dep
ende
ncy
Ratio
%8.
00CE
DA
RE/A
WC
-6.
5D
GRE
((32
0+10
0 +
+149
+61
0)/
(18,
140)
)*10
0
Shar
ed W
ater
s re
late
d Bi
late
ral/
Mul
tilat
eral
A
gree
men
ts a
nd/o
r M
emor
andu
ms
of
Und
erst
andi
ng a
nd C
oope
ratio
n M
echa
nism
sN
umbe
r-
--
10S
S,D
GRE
, AN
RH,
GW
ACo
nsul
tatio
n M
echa
nism
Num
ber
of R
ipar
ians
sha
ring
all
shar
ed w
ater
bo
dies
Num
ber
--
-1,
700,
000
inha
bita
nts
0SS,
DG
RE, I
NS
Estim
ated
from
201
4 IN
S ce
nsus
.
Num
ber
of S
hare
d W
ater
Res
ourc
esN
umbe
r-
--
2 Sh
ared
aqu
ifers
+ 1
Sh
ared
riv
er
0SS,
DG
RE, A
NRH
, G
WA
2 Sh
ared
aqu
ifers
:NW
SAS
&
Dje
ffara
pla
in,&
1 Sh
ared
riv
er:
Med
jerd
a
Tota
l: 15
5 in
dica
tors
incl
udin
g 22
add
ition
al sp
ecifi
c in
dica
tors

68 Tunisia 2012 State of the Water Report
MEW
INA
COMMENTS ON THE 2012 INDICATORS VALUES:
Definitions, Methodology of calculation and institutions in charge of measuring and/or estimating the indicators are given in Table 5.
1. Water & Availability:
Annual Spacially Averaged Precipitation Depth 153.0 mm in 2012/13 measured on 690 stations (Deficit year in rain)
Annual Average Precipitation Volume: 153.0 mm*154 922 km2 = 23.7 BCM/Year
Blue Water:
• Internal Renewable Groundwater (IRGW): (IRGW)= (TIGW)-(INRGW) = (2.164)-(0.610) = 1.554 BCM/Year
• Total Internal Renewable Blue Water Resources (TIRBWR)= (IRSW)+(IRGW) –(OSWGW)= (2.7)+(1.554)- (0.400)= 3.854 BCM/Year
• External Surface Water Inflow (ESWI) = 0.320 BCM/Year • External Surface Water Outflow (ESWO) = 0.190 BCM/Year as follows.Table 10. External surface water inflow and External Surface Water outflow in Tunisia
Basin Wadi Area in Tunisia (km²)
Area in Algeria (km²)
Algerians basins input at the
boundary (MCM)
Tunisians basins input at the
boundary (MCM)
Extreme North West
Zarga 21.25 9
Mellila 104 51
Barbra 200 17.5 8 91
Upstream Bougouss
23 8 4 11
Melkeir Edir 65 16 7 30
Subtotal 1 28 183
Mejrda Ennemra 44 8
Mejrda 32.2 1430 145 4
Mellegue Mellegue, Horihie, Ezzarga, Sammaa
17.2 6405 120 2
Subtotal 2 273 6
Extreme South West
Safsaf 1218 12
Kébir 805 4
Horchane 504 1
Laouej 256 0.5
Subtotal 3 17.5
Total 441 10725 318.5≈320 189≈190

69
Indicators Values
Tunisia 2012 State of the Water Report
MEW
INA
• Total External Renewable Blue Water Resources Inflow (TERBWR)=(ESWI+(EGI)= 0.320 + 0.100 = 0.420 BCM/Year
• Total Renewable Blue Surface Water (TRBSW)= (IRSW)+(ESWI)-(ESWO)= (2.700) + (0.320) – (0.190) = 2.830 BCM/Year
• Total Renewable Blue Groundwater (TRBG)=(IRG)+(EGI)-(EGO) = (1.554)+ (0.100) – (0.00)= 1.654 BCM/Year
• Overlap between Surface Water and Groundwater (OSWG)= 0.400 BCM/Year, corresponding to the low water flows of wadi during dry seasons
• Total Renewable Blue Water Resources (TRBWR)=(TRBSW)+(TRBG)-(OSW)= (2.830) + (1.654) - (0.400) = 4.084 BCM/Year
• Total Exploitable Non-Renewable Groundwater (TNRG) TENRGW= 0.610 BCM/ Year in 2012 (Source: GW Abstraction Directory), TENRGW= 0.720 BCM/Year in 2050 (Source: NWSAS projection of the mathematical model)
• Total Blue Water Resources (TBWR)(TBWR)= (TBSWR)+ (TBGWR)- (OSWGW)=(2.830) +( 2.264+0.100)- (0.400)= 4.694 BCM/Year, (TBWR)=(TRBWR)+ (TNRBWR)=(4.084)+ (0.610) = 4.694 BCM/Year
Green Water:
Green Waters cover rainwater intercepted by: (i) rain-fed agriculture (field crops and dry agriculture), (ii) forests and rangelands. The covered areas are:
• Field crops: 1,764,500 ha:• Cereals: 1,244,000 ha• Fodder: 436,000 ha• Leguminous: 84,500 ha
• Dry arboriculture: 1,995,000 ha• Olive trees: 1,549,000 ha• Olive and almond trees intercropped: 165,000 ha• Olive and fruit trees intercropped: 69,500 ha• Vineyards: 18,500 ha• Almond trees: 193,000 ha
• Forests and Rangelands: 5,505,800 ha• Forests: 666,300 ha• Rangelands: 4,326,000 ha• Alfa and halophyte plants: 513,500 ha
Green water is calculated on the basis of annual plant needs. These needs are generally satisfied when the annual rainfall for the current year is equal to or greater than the average annual rainfall in the country, and well distributed in time and space. The areas indicating field crops and dry arboriculture are derived from the annual survey on monitoring the crop season developed by DGEDA (Agricultural sector indicators, January 2012), while the area covered by forests and Alfa grass are the responsibility of DG Forestry. The assumptions considered in the survey are: (i) the max, min, and average plant needs.
Water for Rain-fed Agriculture Consumptions: 5.500 BCM/Year

70 Tunisia 2012 State of the Water Report
MEW
INA
Water for Rain-fed Pasture Consumption: 6.000 BCM/Year
Water for Rain-fed Forest Consumption: 1.500 BCM/Year
Total Renewable Green Water Resources (TRGWR): 13.000 BCM/ Year
Total Renewable Water Resources: (TRWR)=(TRBWR+TRGWR)= (4.084) + (13.000) = 17.084 BCM/Year
Total Conventional Water Resources: (TCWR)=(TRWR)+(TNRG)=(17.084) + (0.610) = 17.694 BCM/Year, (TCWR)=(TBWR)+(TRGWR)= (4.694) + (13.000)= 17.694 BCM/Year
Non Conventional Water:
Produced Municipal and Industrial Wastewater (PMIW): (0.239 + 0.037)= (0.276) BCM in 2012 (Source: ONAS Annual Report 2012)
Treated Municipal and Industrial Wastewater (TMIW): 0.232 BCM in 2012 (Source: ONAS Annual Report 2012)
Reused Treated Municipal and Industrial Wastewater: 0.06 BCM in 2012 (Source: ONAS Annual Report 2012)
Treated wastewater reused in agricultural irrigation: 0.025 BCM in 2012 (Source: DGGREE Annual Report 2012)
Produced Agricultural Drainage (PAD): 0.140 BCM in 2012 (DGRE 2011)
Produced Desalinated Water (PDW): 0.030 BCM in 2012 of which 19.7 MCM produced in 2012 by SONEDE, and about 10 MCM by private sector (Source DGRE, 2011)
Total Non-Conventional Water Resources (TNCWR)=(PMIW)+(PAD)+(PDW)=( 0.276)+(0.140)+(0.030) = 0.446 BCM
Total Available Water Resources (TAWR)=(TCWR)+(TNCWR)= (17.694)+ (0.446)= 18.140 BCM/Year
2. Water & Uses:
• Withdrawals for Domestic Water Use: (Water Supply by SONEDE) + (Water Supply by DGGREE) = (0.451) + (0.044)= 0.495 BCM/Year (Source: SONEDE 2012 Annual report and DGGREE 2012 Annual report)
• Withdrawals for Industrial Water Use: (Water Supply by SONEDE) + ( Own resources: private wells) +(Mineral water plants) = (0.046) +(0.042) + (0.001) = 0.089 BCM/Year
• Withdrawals for Agricultural Water Use (Blue water+ Non-conventional water) = (2.140) + (0.025)= 2.165 BCM in 2012
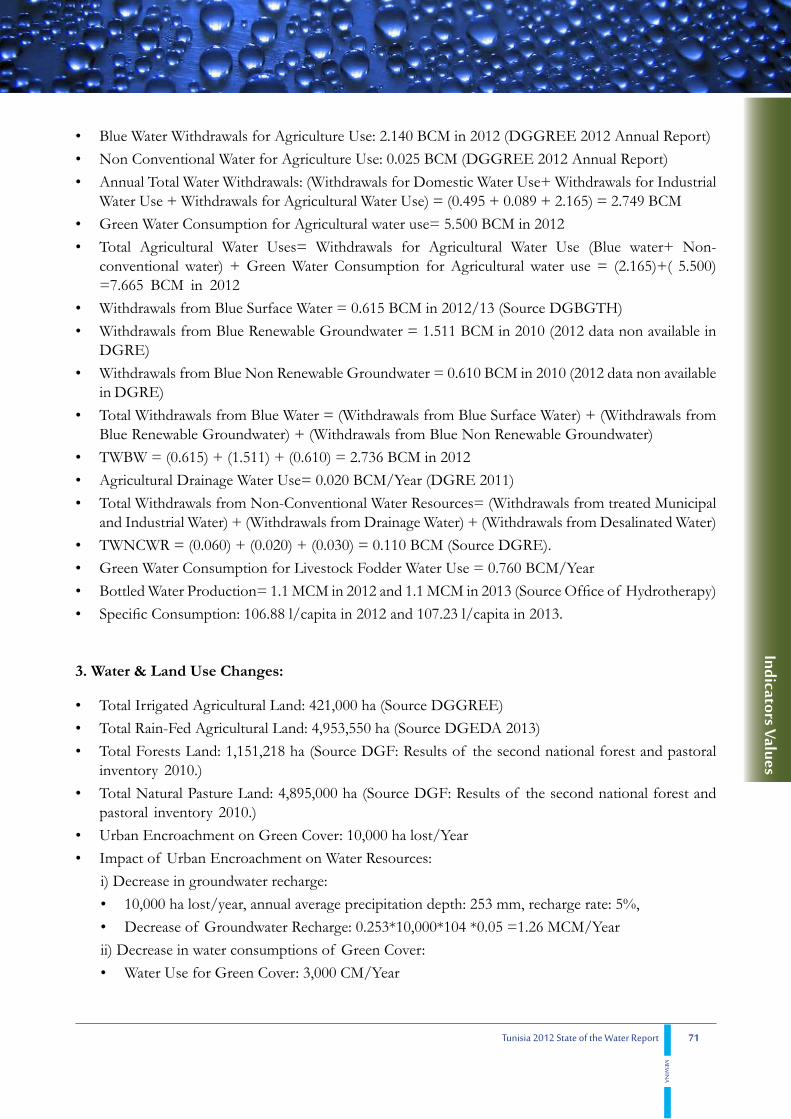
71
Indicators Values
Tunisia 2012 State of the Water Report
MEW
INA
• Blue Water Withdrawals for Agriculture Use: 2.140 BCM in 2012 (DGGREE 2012 Annual Report)• Non Conventional Water for Agriculture Use: 0.025 BCM (DGGREE 2012 Annual Report)• Annual Total Water Withdrawals: (Withdrawals for Domestic Water Use+ Withdrawals for Industrial
Water Use + Withdrawals for Agricultural Water Use) = (0.495 + 0.089 + 2.165) = 2.749 BCM• Green Water Consumption for Agricultural water use= 5.500 BCM in 2012• Total Agricultural Water Uses= Withdrawals for Agricultural Water Use (Blue water+ Non-
conventional water) + Green Water Consumption for Agricultural water use = (2.165)+( 5.500) =7.665 BCM in 2012
• Withdrawals from Blue Surface Water = 0.615 BCM in 2012/13 (Source DGBGTH)• Withdrawals from Blue Renewable Groundwater = 1.511 BCM in 2010 (2012 data non available in
DGRE)• Withdrawals from Blue Non Renewable Groundwater = 0.610 BCM in 2010 (2012 data non available
in DGRE)• Total Withdrawals from Blue Water = (Withdrawals from Blue Surface Water) + (Withdrawals from
Blue Renewable Groundwater) + (Withdrawals from Blue Non Renewable Groundwater)• TWBW = (0.615) + (1.511) + (0.610) = 2.736 BCM in 2012• Agricultural Drainage Water Use= 0.020 BCM/Year (DGRE 2011)• Total Withdrawals from Non-Conventional Water Resources= (Withdrawals from treated Municipal
and Industrial Water) + (Withdrawals from Drainage Water) + (Withdrawals from Desalinated Water)• TWNCWR = (0.060) + (0.020) + (0.030) = 0.110 BCM (Source DGRE).• Green Water Consumption for Livestock Fodder Water Use = 0.760 BCM/Year• Bottled Water Production= 1.1 MCM in 2012 and 1.1 MCM in 2013 (Source Office of Hydrotherapy)• Specific Consumption: 106.88 l/capita in 2012 and 107.23 l/capita in 2013.
3. Water & Land Use Changes:
• Total Irrigated Agricultural Land: 421,000 ha (Source DGGREE)• Total Rain-Fed Agricultural Land: 4,953,550 ha (Source DGEDA 2013)• Total Forests Land: 1,151,218 ha (Source DGF: Results of the second national forest and pastoral
inventory 2010.)• Total Natural Pasture Land: 4,895,000 ha (Source DGF: Results of the second national forest and
pastoral inventory 2010.)• Urban Encroachment on Green Cover: 10,000 ha lost/Year• Impact of Urban Encroachment on Water Resources:
i) Decrease in groundwater recharge: • 10,000 ha lost/year, annual average precipitation depth: 253 mm, recharge rate: 5%, • Decrease of Groundwater Recharge: 0.253*10,000*104 *0.05 =1.26 MCM/Yearii) Decrease in water consumptions of Green Cover:• Water Use for Green Cover: 3,000 CM/Year
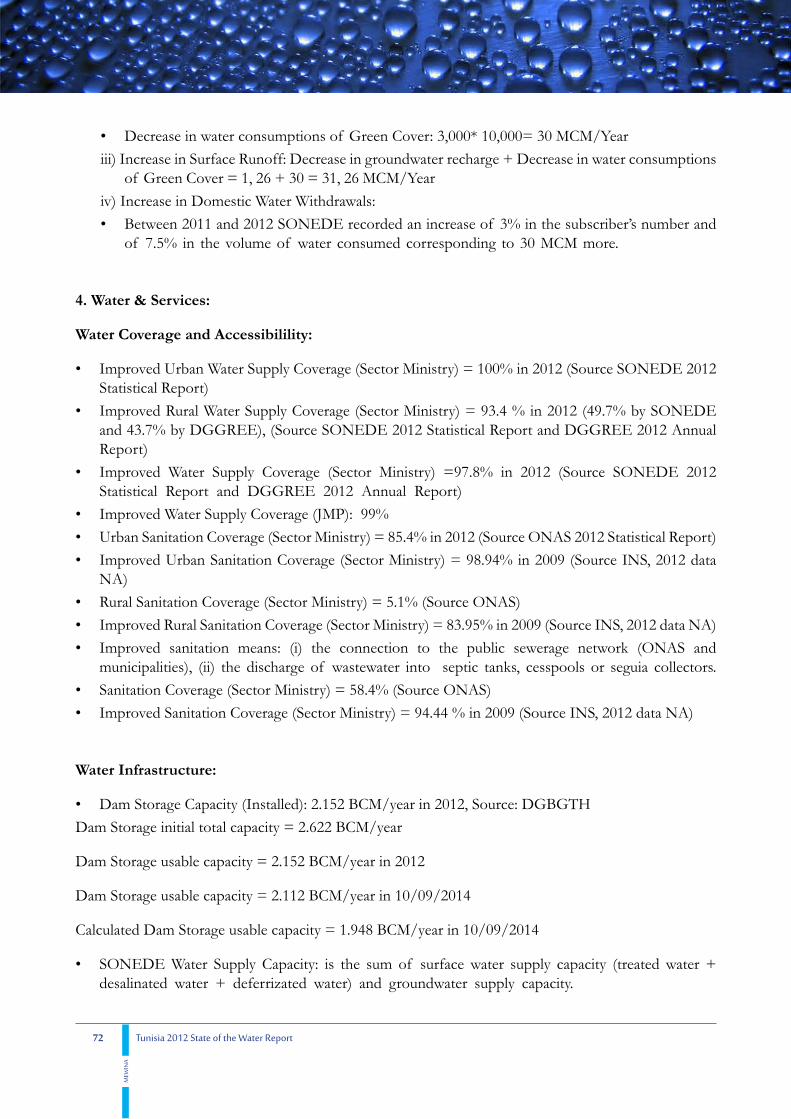
72 Tunisia 2012 State of the Water Report
MEW
INA
• Decrease in water consumptions of Green Cover: 3,000* 10,000= 30 MCM/Yeariii) Increase in Surface Runoff: Decrease in groundwater recharge + Decrease in water consumptions
of Green Cover = 1, 26 + 30 = 31, 26 MCM/Yeariv) Increase in Domestic Water Withdrawals: • Between 2011 and 2012 SONEDE recorded an increase of 3% in the subscriber’s number and
of 7.5% in the volume of water consumed corresponding to 30 MCM more.
4. Water & Services:
Water Coverage and Accessibilility:
• Improved Urban Water Supply Coverage (Sector Ministry) = 100% in 2012 (Source SONEDE 2012 Statistical Report)
• Improved Rural Water Supply Coverage (Sector Ministry) = 93.4 % in 2012 (49.7% by SONEDE and 43.7% by DGGREE), (Source SONEDE 2012 Statistical Report and DGGREE 2012 Annual Report)
• Improved Water Supply Coverage (Sector Ministry) =97.8% in 2012 (Source SONEDE 2012 Statistical Report and DGGREE 2012 Annual Report)
• Improved Water Supply Coverage (JMP): 99% • Urban Sanitation Coverage (Sector Ministry) = 85.4% in 2012 (Source ONAS 2012 Statistical Report)• Improved Urban Sanitation Coverage (Sector Ministry) = 98.94% in 2009 (Source INS, 2012 data
NA)• Rural Sanitation Coverage (Sector Ministry) = 5.1% (Source ONAS)• Improved Rural Sanitation Coverage (Sector Ministry) = 83.95% in 2009 (Source INS, 2012 data NA)• Improved sanitation means: (i) the connection to the public sewerage network (ONAS and
municipalities), (ii) the discharge of wastewater into septic tanks, cesspools or seguia collectors. • Sanitation Coverage (Sector Ministry) = 58.4% (Source ONAS)• Improved Sanitation Coverage (Sector Ministry) = 94.44 % in 2009 (Source INS, 2012 data NA)
Water Infrastructure:
• Dam Storage Capacity (Installed): 2.152 BCM/year in 2012, Source: DGBGTH Dam Storage initial total capacity = 2.622 BCM/year
Dam Storage usable capacity = 2.152 BCM/year in 2012
Dam Storage usable capacity = 2.112 BCM/year in 10/09/2014
Calculated Dam Storage usable capacity = 1.948 BCM/year in 10/09/2014
• SONEDE Water Supply Capacity: is the sum of surface water supply capacity (treated water + desalinated water + deferrizated water) and groundwater supply capacity.

73
Indicators Values
Tunisia 2012 State of the Water Report
MEW
INA
SONEDE WSC = (0.4652 + 0.0254 + 0.0079) + (0.2566) = 0.4984 + 0.2566 = 0.755 BCM in 2012
DGGREE Rural Water Supply Capacity (NA) must be added, such as private desalinated water capacity (10 MCM/Year).
• SONEDE Desalination Capacity: 0.0254 BCM in 2012 (not included drinking water treatment and deferrization plants capacity).
Private Desalination stations must be added (10 MCM/Year).
5. Water & Energy:
• Electricity Generated Using Hydropower: 110.56 GWh/Year by 7 hydropower plants built between 1956 and 2003 (Source: STEG 2012)
• Hydropower as % of Total Generated Electricity: Electricity Generated Using Hydropower (GWh)/ Total Generated Electricity (GWh) = (110.56) / (14 123.2)*100 = (0.7) # 1 % in 2012 (Source: STEG 2012)
• Installed Hydropower Capacity: 66.00 MW in 2012 disaggregated as follows: (1) Nebeur Hydropower plant: 13 MW, (2) El Aroussia : 4.8 MW, (3) Fernana: 9.7 MW, (4) Kasseb: 0.66 MW, (5) Sidi Salem: 36 MW, (6) Bouheurtma: 1.2 MW, (7) and Sejnane: 0.6 MW (Source STEG 2012).
• Water Used to Generate Electricity: 830.8 MCM in 2012 disaggregated as follows: (1) Nebeur Hydropower plant: 44.5 MCM, (2) El Aroussia : 0.0 MCM, (3) Fernana: 37.9 MCM, (4) Kasseb: 32.4 MCM, (5) Sidi Salem: 701.7 MCM, (6) Bouheurtma: 14.3 MCM, (7) and Sejnane: 0.0 MCM (Source STEG 2012).
6. Water & Population:
• Internal Renewable Water Resources Per Capita = (Total Internal Renewable Blue Water Resources (TIRBWR) + Total Renewable Green Water Resources (TRGWR))/ Population = 3.854 BCM/Year + 13.000 BCM/Year)/ 10 776 400 capita = 1,564 CM/Capita/Year.
• Total Renewable Blue Water Resources Per Capita: (TRBWR)=((TRBSW)+(TRBG)-(OSWG))/ Population =((2.830) + (1.654) + (0.400))/10 776 400 = 4.084/ 10 776 400 = 378.9 CM/Capita/Year
• Total Renewable Water Resources Per Capita: (TRWR) = (TRBWR+TRGWR) Per Capita = (4.084+ 13.000)/ 10 776 400 = 17.084 / 10 776 400 = 1,585.3 CM/Capita/ Year.
• Total Available Water Resources Per Capita: (TAWR) = ((TCWR) + (TNCWR))/ Population) = ((17.694)+ (0.446))/ 10 776 400 = 1,683.0 CM/Capita/Year.
• Blue Water Withdrawal Per Capita: Total Withdrawals from Blue Water = (Withdrawals from Blue Surface Water) + (Withdrawals from Blue Renewable Groundwater) + (Withdrawals from Blue Non Renewable Groundwater)
TWBW = (0.615) + (1.511) + (0.610) = 2.736 BCM in 2012
Blue Water Withdrawal Per Capita: 2.736 BCM /10 766 400 = 254 CM/Capita/Year

74 Tunisia 2012 State of the Water Report
MEW
INA
• Green Water Use Per Capita: Total Renewable Green Water Resources (TRGWR)/ Population: (13.000 BCM/Year)/ 10 776 400 = 1206 CM/Capita/Year.
• Total Water Consumption Per Capita: (Blue Water Withdrawal + Green Water Use)/ Population = (2.736+ 13.000 BCM/Year)/ 10 776 400 = 15.736 / 10 776 400 = 1460 CM/Capita/Year.
• Agricultural Water Withdrawal Per Capita: (Blue water+ Non-conventional water) = (2.140)+ (0.025)= 2.165 / 10 776 400 = 201 CM /Capita/Year in 2012
• Industrial Water Withdrawal Per Capita: (Water Supply by SONEDE) + (Own resources: private wells) +(Mineral water plants) = (0.046) +(0.042) + (0. 001) = 0.089 BCM/Year
Industrial Water Withdrawal Per Capita: 0.089 /10 776 000 = 8.25 CM /Capita/Year in 2012
• Domestic Water Withdrawal Per Capita: (Water Supply by SONEDE) + (Water Supply by DGGREE)= (0.451) + (0.044)= 0.495 BCM/Year (Source: SONEDE 2012 Annual report and DGGREE 2012 Annual report)
Domestic Water Withdrawal Per Capita = (0.495 BCM/Year)/ 10 776 400 = 46 CM /Capita/Year in 2012
• Population without Improved Water Supply: 240 000 inhabitants in 2012 (Source SONEDE and DGGREE 2012))
239 900 inhabitants in 2012 (Source INS 2012)
• Population without Improved Sanitation: 579 700 inhabitants in 2012 (Source INS)
7. Water & Health:
• Diarrhea Prevalence (% of children under 5 years old) = 6.48% in 2012 (Source DHMPE). The annual Average 2000-2013 is 5.80%.
• Dracunculiasis Reported Cases (%) = 0.00 % in 2012 (Source DHMPE), unsignaled in Tunisia for a long time.
• Open Defecation Practice (Number) = (85 218 households *4.09)= 348 540 inhabitants in 2012 (Source INS, RGPH 2009 edited in 2012)
• Percentage of Open Defecation (%) = (348 540)/ (10 776 400) = 3.2 % (Source INS, RGPH 2009 edited in 2012)
• Cholera Reported Cases (Number per year) = 0.00 % in 2012 (Source DHMPE). The Annual Average 2000-2013 is 0.00 %.
• Hepatitis A Reported Cases = 412 new reported cases in 2012 (Source DHMPE)Incidence rate (Cases number /100 000 inhabitants) = 3.82 in 2012 (Source DHMPE). The Annual Average 2000-2013 is 7.33 %
• Typhoid fever Reported Cases = 28 new reported cases in 2012 (Source DHMPE)• Incidence rate (Cases number /100 000 inhabitants) = 0.26 in 2012 (Source DHMPE). The Annual
Average 2000-2013 is 0.55 %

75
Indicators Values
Tunisia 2012 State of the Water Report
MEW
INA
8. Water & Quality:
Institutions that ensure monitoring and evaluation of water quality are: (i) DGRE (BIRH) for the quality of natural water through its network (TDS, nitrates), (ii) SONEDE for physico-chemical and bacteriological quality of drinking water (50 000 samples /year), (iii) DHMPE also performs control operations on public wells and water supply networks (residual chlorine and bacteriological analyzes) on drinking water, wastewater, and treated wastewater (total of 50 000 samples / year), (iv) ONAS for water at the entrance and exit of its WWTP, (v) and ANPE for controlling water pollution (COPEAU) in receiving environments.
The 2012 data were drawn from the 2012 annual report of ANPE related to the network of monitoring water quality in Tunisia, being edited.
This network is composed of water sampling stations, installed on: (i) three watersheds (wadi Medjerda, wadi Miliane and wadi El Bey), (ii) three lagoons (Bizerte, Ghar El Melh and Halg El Menjel) (iii) sebkha of Korba, (iv) wadis and dams in the north of Tunisia, (v) and groundwater resources. This network has undergone modifications and extensions in recent years. At least two sampling campaigns are conducted annually and the results are published in the corresponding directory.
Table 11. Water Quality parameters (2012 data)Dissolved Oxygen (mg O2/l)
pH Electric Conductivity(mS/cm)
Nitrogen Concentration (mg/l) # NO3
Phosphorus Concentration(mg/l) # PO4
TDS(mg/l)
Medjerda Watershed main stream, up to down(March-April 2012)
7.7-8.5 7.8-11.2 1.5-2.5 NA 1.3-33 730-1,480
Miliane Watershed main stream, up to down(February-September 2012)
1.6-4.1<PNT 09.85 (6 mg/l)
8.0-8.3Conform to PNT 09.85
1.5-13.6 NA 0.7-10.0 1,130-7,900
Wadi El Bey (February-November 2012)
NA 6.16-9.0 1.1-11.41 3.0-150 NA 713-6,112
Bizerte lagoon(January-December 2012)
NA 7.7-8.77 1.73-46.8 2.0-128.2 0.1-71.8 950-37,800
Jendouba dams (April 2012) 4.9-6.4 7.8-8.4 0.13-1.22 NA 1.3-13.8 60-600
Beja dams (April 2012) 5.39-6.45 8.0-8.4 0.22-0.45 NA 0.4-9.7 110-220
Bizerte dams (September 2012)
4.6-6.06 8.41-8.77 0.4-1.06 NA NA 201-534
Nabeul dams (January 2012) NA 8.7-8.8 0.25-4.2 NA 0.3-3.7 300-3,000
Nabeul Groundwater (January 2012)
NA 8.4-8.7 2.0-7.0 NA 0.1-0.7 1,200-5,500
Kairouan Groundwater (February 2012)
NA 8.2-8.5 0.5-4.2 2.5-8.5 0.05-1.7 400-3,500
Sfax Groundwater(January 2012)
NA 7.5-8.5 2.2-6.5 NA NA 1,500-4,300
Source: ANPE, Réseau de surveillance de la qualité de l’eau en Tunisie- Rapport annuel 2012.
Water quality must comply with the NT.09.14 standard, which specifies the values of the following parameters should be as follows: pH between 6-9, Conductivity 180 micro-Siemens / cm, Dissolved Oxygen 6 mg / l, Nitrates between 10-50 mg / l, Phosphorus 0.05-0.2 mg / l, Phosphates 0.1-0.5 mg /

76 Tunisia 2012 State of the Water Report
MEW
INA
l, and Total Choliform 500-1000 units / 100 ml.
Regarding the bacteriological analysis, SONEDE conducted in 2012 bacteriological analysis of 48,251 samples. Different analyzes have resulted in an average percentage of 98.5% suitable cases.
The table below summarizes the evolution of sampling and bacteriological analysis for the period (1995-2012):
The average percentage of cases unsuitable for all Tunisia, at 1.5% in 2012, is still below the limit required by the NT 09.14 and 5% threshold tolerated by the World Health Organization standard.
Table 12. Bacteriological analysis, historical data (1995-2012)
Source: SONEDE
9. Water & Ecosystems:
Wetlands in Tunisia:
Tunisia has:
• 211 natural wetlands, and• 866 artificial wetlands. Tunisia has (in 2013), 40 wetlands of international importance, on the list of the RAMSAR Convention, which contributes to the conservation and enhancement of wetlands in the world.
2007 State: 19 wetlands in Tunisia covering an area of 713,903 ha
2012 State: 35 wetlands in Tunisia covering an area of 877,467 ha
2013 State: 40 wetlands in Tunisia covering an area of 1,608,024 ha
Table 13. State of 2013 RAMSAR sites
Name of the Wetland Registration date on the list of the Ramsar Convention Governorate Area (ha)
Sebkhet Sijoumi 07/10/2007 Tunis 2,979
Ghar el Melh Lagoon & Delta of Medjerda 07/10/2007 Bizerte and Ariana 10,168
Ichkeul Lake 24/03/1981 Bizerte 12,600

77
Indicators Values
Tunisia 2012 State of the Water Report
MEW
INA
Name of the Wetland Registration date on the list of the Ramsar Convention Governorate Area (ha)
Lake and bog of Majel Ech Chitan 07/10/2007 Bizerte 7
Lebna Dam 07/10/2007 Nabeul 1,174
Lagoon od Eastern Cap Bon 07/10/2007 Nabeul 504
Sebkhet Soliman 07/10/2007 Nabeul 808
Oued el Hajar Dam 02/02/2012 Nabeul 254
Sidi Abdelmoumen Dam 02/02/2012 Nabeul 31
Sidi el Barrak Dam 02/02/2012 Beja 2,734
Dar Fatma Bogs 07/10/2007 Jendouba 20
Ain Dahab 07/10/2007 Siliana 560
Sabkhet Halk el Menzel & Oued Essed 02/02/2012 Sousse 1,450
Sabkhet el Kelbia 07/10/2007 Sousse 8,732
Sabkhet Sidi el Hani 02/02/2012 Sousse 36,000
Sidi Saad Dam 02/02/2012 Kairouan 8,650
Merguellil Dam 02/02/2012 Kairouan 20,000
Monastir Salines 02/02/2012 Monastir 1,000
Sabkhet Noual 07/10/2007 Sidi Bouzid 17,060
Thyna Saline 07/10/2007 Sfax 3,343
Kerkennah 02/02/2012 Sfax 15,000
Kneiss islands with intertidal zones 07/10/2007 Sfax 22,027
Oued Rmal 02/02/2012 Zaghouan 620
Garaet Douza 02/02/2012 Gafsa 1,400
Gorges of Thelja 02/02/2012 Gafsa 675
Chott el Guettar 02/02/2012 Gafsa 7,400
Chott el Djerid 07/10/2007 Tozeur and Kebili 586,187
Oasis Wetlands of Kebili 07/10/2007 Kebili 2,419
Djerba Ras Rmel 07/10/2007 Mednine 1,856
Djerba Guellala 07/10/2007 Mednine 2,285
Djerba Bin el Ouedian 07/10/2007 Mednine 12,082
Bhiret el Bibane 07/10/2007 Mednine 39,266
Gulf of Boughrara 02/02/2012 Mednine 50,000
Oued Dekouk 02/02/2012 Tataouine 5,750
Garaet Sidi Mansour 07/10/2007 Gafsa 2,426
Tunis Lake 2013 Tunis/Ben Arous 2,243
Ghedir El Goulla and Mornaguia dams 2013 Manouba/Tunis 273
Melaabi Dam 2013 Nabeul 98
Complex Wetlands of Chott El Guettaia & Sebkhet Dreiaa with Akarit, Rekhama et El Maleh wadis
2013Sfax
Gabes4,845
Complex Wetlands of Sebkhet Oum Ez-Zessar & Sebkhet El Grine 2013 Mednine 9,195
Total : 40 1,608,024

78 Tunisia 2012 State of the Water Report
MEW
INA
In Tunisia, the wetlands support 260 terrestrial plant species, 50 aquatic plant species and 140 bird species, most of which are migratory. Wetlands host annually in winter, more than 500,000 birds from Asia and Europe. For example, Tunisia is home to an annual average of 250,000 ducks and coots in January, 58% of the Maghrebian population and 25,000 flamingos, one-third of the Mediterranean population.
Water& Ecosystems indicators (2012) are:
• Number of Wetlands Sites Acknowledged by RAMSAR: 35 (2012) then 40 (2013)• Total Wetlands areas: 877,467 (2012) then 1,608,024 ha (2013)• Total Freshwater Species Count: 260 terrestrial plant species, 50 aquatic plant species,140 bird species
( most of which are migratory) • Number of Endangered Species: Several species (>10) • Number of Invasive Species: >500,000 birds in winter from Asia and Europe (ducks, coots and
flamingos).Source:
(i) Les zones humides d’importance internationale en Tunisie, 35 sites RAMSAR ; WWF, MAVA Fondation pour la nature, MA DGF.
(ii) Atlas des aires protégées en Tunisie
10. Water & Socio-Economics:
Water Productivity:
• Industrial Water Productivity: Industrial GDP/( Industrial Water Withdrawal), Economic Value added (in US$) per cubic meter of water withdrawn by industry.
IWP=12.93475 (B$)/0.089 (BCM/Year)= 145.33 $/CM in 2012
Source INS, DGRE.
• Agricultural Water Productivity: Economic Value added (in US$) per cubic meter of water withdrawn by agriculture: it is the gross agricultural revenue divided by the total agricultural water consumption (including irrigation withdrawals and rain fed agriculture green water consumption)
AWP=3.89392 (B$)/7.665 (BCM/Year) = 0.51 $/CM in 2012.
Source: INS, DGRE, DGGREE.
• Employment in Agriculture “Job Per Drop”: The ratio of total labor employed in Agriculture to the total agricultural withdrawals (including irrigation withdrawals and rain fed agriculture green water consumption) = 55,012 persons/7.665 BCM/Year= 71.75 Jobs/MCM in 2012.
Source: INS, DGRE, DGGREE.
• Employment in Industry “Job Per Drop”: The ratio of total labor employed in Industry to the total

79
Indicators Values
Tunisia 2012 State of the Water Report
MEW
INA
industrial withdrawals= 1,037,437 persons/0.089 BCM/Year= 11, 993.67 Jobs/MCM in 2012.Source INS, DGRE.
Tariffs & Affordability:
• Water and Sanitation Charges as % Average Household Income: Data are for 2010 because the survey is quinquennial.
Water and Sanitation Charges= 22.996 DT (Invoice) +3.015 DT (Water tanks) +6.645 DT (Mineral water) = 32.656 DT per person in 2010 (Source: INS)
Average Household Income: 4,861.1 DT in 2010 (Source INS).
Water and Sanitation Charges as % Average Household Income= 32.656 DT*100/4,861.1 DT = 0.7% in 2012
11. Water & Finance:
• Percentage of National Budget directed to Water & Sanitation Sector: Water and Sanitation Budget/Total National Budget
2012 Value: Water & Sanitation Budget = 492.8 MTDN= 308.9856 106 $, Total National Budget =25,551.0 MTDN = 16,020.447 106 $ and % of National Budget directed to Water & Sanitation Sector is 308.9856 106 $/ 16, 020.447 106 $ = 1.9%.
2013 Value: % of National Budget directed to Water & Sanitation Sector is: 1.8%.
Source: INS, Ministry of Finance, Ministry of Agriculture, ONAS, DHMPE.
• Percentage of GDP directed to Sanitation and Hygiene: Sanitation and Hygiene Budget/GDP2012 Value: Sanitation and Hygiene Budget = 91.5 MTDN = 57.3705 106 $, GDP = 70,584.6 MTDN = 44.256544 109 $ and % of GDP for Sanitation and Hygiene is 57.3705 106 $/44.256544 109 $ = 0.13%.
2013 Value: % of GDP for Sanitation and Hygiene is also: 0.13%
Source: INS, ONAS, DHMPE
• Operation & Maintenance Cost Recovery for Water Supply and Sanitation =80.7% in 2012 (Source SONEDE)
• Operation & Maintenance Cost Recovery for Irrigation =64% in 2012 (Source DGGREE)• Foreign Aid for Water and Sanitation: Not Available
12. Water & Trade:
Hoekstra and Chapagain (2001) provided reference tables that provide the approximate volume of water needed to produce one kilogram of different crop, animal, and industrial products. Therefore, the volume

80 Tunisia 2012 State of the Water Report
MEW
INA
of water used to produce a certain product can be estimated by multiplying these reference values (or any similar values provided in the national and global literature) by the total annual produced amount of the same product. In the same manner, it is possible to estimate the amount of water embedded in imported and exported products
• Virtual Water Imports, Exports and Virtual-Water Net Flow Related to Trade in the Agricultural Sector:
Virtual Water Imports: 10 225.342 MCM in 2012
Virtual Water Exports: 6 032.021 MCM in 2012
Virtual-Water Net Flow: 4 193.321 MCM in 2012
Source: DGCE (Ministry of Trade)
Table 14. Virtual-water net flow: importation/exportation 2012 Item Virtual Water Imports
MCM (1)Virtual Water ExportsMCM (2)
Virtual-Water Net FlowMCM (3)(3)=(1)-(2) expressedin (+x MCM or –x MCM)
Wheat and Flour 2,177.738992 2.674670 2,175.064322
Maize 777.317715 1.363500 775.954215
Rice 40.678996 0 40.678996
Barley 692.821940 0 692.821940
Potatoes 3.120180 1.214565 1.905615
Pulses (total) 22.403842 2.080244 20.323598
Vegetables (total) 7.645755 9.726600 -2.080845
Fruits (total) 5.485025 72.199400 -66.714375
Sugar (Refined) 738.920811 1.361874 737.558937
Fats & Oils (total) 5,479.956000 5,689.260000 -209.304000
Red Meat 153.792228 0.743856 153.048372
Poultry Meat 6.322140 3.431142 2.890998
Eggs 1.198800 0 1.198800
Milk & Dairy products. 117.940000 247.965000 -130.025000
Total 10,225.342 424 6,032.020 851 4,193.321 573

81
Indicators Values
Tunisia 2012 State of the Water Report
MEW
INA
Figure 3. Virtual-water net flow: importation/exportation 2012 (Graph)
13. Water & Governance:
- Physical Domestic Water Losses:
Water losses:
Water losses are either, visible (commercial) losses or actual (physical) losses. It is for this reason that the IWA uses the concept of volume not sold or unbilled water: Non Revenue Water (NRW) in establishing water balance. The concept of Water Not recorded (unaccounted For Water: UFW) is increasingly neglected also because of the confusion it could generate as a result of different interpretations.
Apparent water losses or Commercial losses (CL): is the volume of water consumed but integrated into losses due to measurement errors (imprecision meters) and consumption diverted (fraud).
Actual water losses or Physical losses (PL): is the volume of effective water loss from service to the subscriber meter. They cover all types of leaks (pipes, connections), pipes rupture, overflowing tanks, etc…
The losses distribution on SONEDE water supply networks in 2012 is recorded as follows:

82 Tunisia 2012 State of the Water Report
MEW
INA
Table 15. Commercial & Physical Water Losses on SONEDE networks (2012)
Losses Production Distribution Total
MCM % MCM % MCM %
Commercial Water Losses 12.1 7.5 22.2 13.8 34.3 21.3
Physical Domestic Water Losses 39.2 24.3 87.7 54.4 126.8 78.7
Total 51.3 31.8 109.9 68.2 161.2 100.0
• Overall Water Use Efficiency: 100* ((Withdrawals from Original Sources- Wastewater and Drainage outflows) / Withdrawals from Original Sources)
Withdrawals from Original Sources= Withdrawals from surface water, renewable and non-renewable groundwater, and desalinated water = 0.615 + 1.511 + 0.610 +0.030 = 2.766 BCM in 2012
Wastewater and Drainage Outflows: Wastewater and Agricultural Drainage flowing out of the system= (0.232- 0.060) + (0.140 – 0.020) = 0.292 BCM in 2012.
Overall Water Use Efficiency: 100*(2.766 – 0.292)/ (2.766) = 89.5 % in 2012.
Source: DGBGTH, DGRE, DGGREE, SONEDE, ONAS
• Water Sustainability/ Depletion Index: is the ratio of the Total Withdrawals from Original sources including green water consumptions by rainfed agriculture to The Total Renewable Water Resources (Blue and Green Water).
TSI = (2.766+ 5.5)/ (4.084+ 13.000) = 48.4 % in 2012.
Source: DGBGTH, DGRE, DGGREE, SONEDE, ONAS.
• Number of Water Users Associations: 2580 Groupings of Agricultural Development, composed of: 1327 WUA (GAD) for Water Supply and 1253 WUA (GAD) for Irrigation
• Water Users Associations Agricultural Land Coverage: 200,000 ha covered by Irrigation WUA, representing 47, 5% of Irrigated areas (421,000 ha), and 1.0 % of Agricultural land (19,759,500 ha) in 2012.
14. Water & International Relations:
• Transboundary Water bodies’ dependency Ratio: the percent of annual volumes abstracted from transboundary water bodies to total annual available water resources.
Annual volumes abstracted from transboundary water body = (Total External Renewable Blue Water Resources Inflow) + (Withdrawals from NWSAS Blue Non Renewable Groundwater)+ (Withdrawals from Djeffara plain Groundwater) = (0.320+ 0.100) + (0.610)+ (0.149)= 1.179 BCM/Year
Total Annual Available Water Resources= 18.140 BCM/Year
TWBDR = (1.179)/ (18.140) = 6.5 % in 2012
• Shared Waters related Bilateral/ Multilateral Agreements and/or Memorandums of Understanding and Cooperation Mechanisms: Currently there is only the Concertation mechanism launched in

83
Indicators Values
Tunisia 2012 State of the Water Report
MEW
INA
December 2007.• Number of Shared Water Resources: Mainly 2 Shared Aquifers (NWSAS shared by Algeria, Libya, and Tunisia; and Djeffara plain by Libya and Tunisia), then the Transboundary Medjerda watershed shared by Algeria and Tunisia.
• Number of Riparians sharing all shared water bodies: estimated at 1,700,000 riparians, distributed as follows: Shared Medjerda river ((400,000 inhab), Djeffara plain (600,000 inhab), and NWSAS (700,000 Inhab).

84 Tunisia 2012 State of the Water Report
MEW
INA
4.2.
The
Nor
th W
este
rn S
ahar
a A
quife
r SO
W D
ata
Tabl
e 16
. Nor
th W
este
rn S
ahar
a A
quife
r Sy
stem
dat
a sh
eet
indi
catin
g th
e va
lues
ass
igne
d to
eac
h in
dica
tor,
unit,
mea
sure
men
t ye
ar, a
nd s
ourc
e
Who
le A
quife
r In
dica
tors
Uni
tsW
hole
A
quife
r Va
lue
(201
2)
Alg
eria
(2
012)
Liby
a(2
012)
Tuni
sia
(201
2)N
otes
So
urce
Wat
er &
Ava
ilabi
lity
Inte
rnal
Ren
ewab
le G
roun
dwat
er (I
RG)
BCM
/Yea
r1.
1 0.
6 0.
27
0.2
Sour
ce: O
SS
Tota
l Exp
loita
ble
Non
-Ren
ewab
le G
roun
d W
ater
Re
sour
ces
BCM
/Yea
r7.
745
6.10
2 0.
946
0.6
97So
urce
: OSS
,N
WSA
Sm
odel
Sce
nari
o
Coun
try’
s A
rea
Insi
de T
he A
quife
rkm
2 (M
appe
d)1,
000,
000
670,
000
250,
000
80,0
00
Sour
ce: 0
SS
Pote
ntial
Vol
ume
for
Each
Cou
ntry
BCM
30,0
0020
,388
7,
282
2,33
0 So
urce
: Bab
aSy,
OSS
In
flow
to E
ach
Coun
try
BCM
/Yea
r 1
.10.
6 0.
27
0.2
201
2
Outf
low
from
Eac
h Co
untr
yBC
M/Y
ear
2.82
31.
975
0.29
6 0.
551
Out
lets
Pieo
zom
etri
c W
ater
Hea
dsM
eter
s (M
appe
d)
M
appe
d
Dep
th fr
om w
ater
to B
asem
ent/
Con
finin
g La
yer
(Unc
onfin
ed A
quife
r)M
eter
s (M
appe
d) -
- -
- M
appe
d
Dep
th to
Wat
er T
able
(Unc
onfin
ed A
quife
r)M
eter
s (M
appe
d) -
- -
- M
appe
d
Dep
th to
Pie
ozom
etri
c Su
rfac
e (C
onfin
ed
Aqu
ifer)
Met
ers
(Map
ped)
- -
- -
Map
ped
Dep
th to
the
bott
om o
f con
fined
lay
er (C
onfin
ed
aqui
fer)
Met
ers
(Map
ped)
- -
- -
Map
ped
Wat
er &
Use
s
W
ithdr
awal
s fr
om B
lue
Gro
undw
ater
BCM
/Yea
r2.
784
2.00
6 0.
258
0.52
So
urce
: Cou
ntri
es
With
draw
als
from
Exp
loita
ble
Non
-Ren
ewab
le
Gro
undw
ater
BCM
/Yea
r1.
684
1.4
060
0.32
20
12
Extr
actio
n Zo
nes
of T
he A
quife
rN
umbe
rs/
Map
ped
83
3 2
-Alg
eria
: Art
esia
n Ba
sin,
Occ
iden
tal
Basi
n, M
ya W
adi
-Lib
ya: G
hada
mes
, Juf
ra, S
yrte
-Tun
isia
: Cho
tts,
Tun
isia
n O
utle
t
Ann
ually
Obs
erve
d D
raw
dow
n (A
vera
ge&
Map
ped)
Met
ers
1.41
2.
05
1.07
1.
12
Sour
ce: C
ount
ries
Wat
er &
Lan
d U
se C
hang
e
Tota
l Irr
igat
ed A
gric
ultu
ral L
and
ha27
0,00
0 20
2,00
0 30
,000
38
,000
O
SS 2
012

85
Indicators Values
Tunisia 2012 State of the Water Report
MEW
INA
Tota
l Rai
nfed
Agr
icul
tura
l Lan
dha
- -
-13
3,30
0 D
GED
A 2
012
Tota
l Pas
ture
Are
aha
- -
-2,
377,
150
DG
EDA
, 201
2 To
tal F
ores
ts A
rea
ha-
--
5,86
0 D
GED
A, 2
012
Urb
an E
ncro
achm
ent o
n A
gric
ultu
ral L
and
ha/Y
ear
- -
- In
sign
ifica
nt
-Th
e D
ecre
ase
in G
roun
dwat
er R
echa
rge
caus
ed
by U
rban
Enc
roac
hmen
tBC
M/Y
ear
- -
- In
sign
ifica
nt
-
Wat
er &
Pop
ulati
on
Tota
l Aqu
ifer
boun
d an
d de
pend
ent p
opul
ation
Num
ber
4,80
0,00
0 3,
000,
000
1,10
0,00
0 70
0,00
0 Es
timati
on 2
012
Inte
rnal
Ren
ewab
le W
ater
Res
ourc
es P
er C
apita
CM/C
apita
239
200
245
286
- G
roun
dwat
er W
ithdr
awal
Per
Cap
itaCM
/Cap
ita58
0 66
9 23
4.5
743
2012
Wat
er &
Qua
lity
Conc
entr
ation
of C
hlor
ide
in T
he A
quife
rs
Dom
ain
PPM
/ M
appe
d-
- -
NA
-
Nitr
ate
Conc
entr
ation
PPM
/ M
appe
d-
- -
NA
-
Elec
tric
Con
ducti
vity
1/O
HM
(S/M
) -
- -
NA
-To
tal D
isso
lved
Sol
ids
PPM
/ M
appe
d14
4-97
22
144-
9722
-
1440
-520
0 O
SS (M
appe
d)
Fluo
ride
Con
cent
ratio
nPP
M/
Map
ped
- -
- N
A -
Wat
er &
Eco
syst
ems
Num
ber
of G
roun
dwat
er B
ased
Eco
syst
ems
Num
ber
- -
-6
Ecos
yste
ms
(Wet
land
s)
1.S
ebkh
et G
uett
ar -
Gaf
sa2.
Sebk
hat E
l Ham
ma
- Gab
es3.
Cho
tt F
edje
j4.
Chott
Dje
rid
5.Ch
ott G
hars
a6.
Arti
ficia
l lak
es –
Kebi
liTO
TAL
ARE
A: 1
,347
,600
ha
3 Ec
osys
tem
s (N
ation
al
Park
s)
1.Je
bil-K
ebili
2.D
ghou
mes
-Toz
eur
3.Sa
nger
Jabb
es-T
atao
uine
TOTA
L A
REA
: 44
5,00
0 ha
2 Ec
osys
tem
s (W
ildlif
e Pa
rks)
1.Th
elja
-Gaf
sa2.
Oue
d Ed
kouk
-Tat
aoui
neTO
TAL
ARE
A :
8675
ha

86 Tunisia 2012 State of the Water Report
MEW
INA
Num
ber
of R
AM
SAR
Wet
land
s in
The
Aqu
ifer
Dom
ain
Num
ber
--
- 7
1. G
araa
t Sid
i Man
sour
-Gaf
sa2.
Cho
tt D
jeri
d3.
Oas
is o
f Keb
ili4.
Oue
d D
ebou
k - T
atao
uine
5.G
orge
s of
The
lja -
Gaf
sa6.
Chott
Gue
ttar
- Gaf
sa7.
Chott
Gue
taya
te- G
abes
TOTA
L A
REA
: 60
9,70
2 ha
Num
ber
of E
ndan
gere
d Sp
ecie
sN
umbe
r-
- -
NA
-N
umbe
r of
Inva
sive
Spe
cies
Num
ber
- -
- N
A
-
Wat
er &
Gov
erna
nce
IWRM
Pla
n (Y
es/N
o)Ye
s/N
oN
o -
- N
o -
Wel
l Per
mits
to d
ate
CM/C
apita
- -
- 80
2
012
Volu
met
ric
Gro
undw
ater
Rig
hts
BCM
/Yea
r-
-
0.01
35
201
2
Unl
icen
sed
Gro
undw
ater
Abs
trac
tions
BCM
/Yea
r-
- -
4168
Wat
er p
oint
s0.
222B
CM /
Yea
r 2
008
Wat
er &
Inte
rnati
onal
Rel
ation
s
Dep
ende
ncy
Ratio
of E
ach
Ripa
rian
Cou
ntry
%3
61
2.9
520
/18,
140=
2.9
Bila
tera
l / M
ultil
ater
al A
gree
men
ts &
Co
oper
ation
Pro
toco
l or
MO
Us
Betw
een
Ripa
rian
sN
umbe
r1
1 1
1 C
once
rtati
on M
echa
nism
Pres
ence
of O
ther
Tra
nsbo
udra
y Bo
dies
in
Ripa
rian
Cou
ntri
esN
umbe
r10
3 (N
WSA
S+Ta
oude
ni+M
edje
rda
rive
r)
4(N
WSA
S +
NSA
S +
Dje
ffara
+
Mor
zouk
ba
sin)
3 (N
WSA
S +
Dje
ffara
pl
ain
+ , M
edje
rda
shar
ed r
iver
)

87
Analysis & Trends
Tunisia 2012 State of the Water Report
MEW
INA
5. Analysis & Trends
5.1. Analysis of the National State of Water
Table 17. Analysis of the National SOW (Additional specific indicators and Historical Data)
Indicator Category Data Source Additional specific indi-cators (22)
Historical data
Water& Availability Available for 2012 DGRE, DGGREE, SONEDE, ONAS No specific indicators -Annual Average Precipitation Depth:1983-2013-Annual Average Precipitation Volume: 1983-2013-IRSW: 1968-2012-IRGW: 1968-2012-TIRBWR: 1968-2012-TMIW: 1990-2012-Reused TMIW: 1990-2012
Water& Uses Available for 2012 DGRE, DGBGTH, DGGREE, SONEDE, ONAS
-Green Water Consump-tion for Livestock Fodder Water Use -Bottled Water Produc-tion
-Withdrawal from Domestic Water Use:2002-2013-Withdrawal for Industrial Water Use: 2002-2013-Withdrawal from BSW: 2008-2013-Withdrawal from BRGW: 2001-2011--Withdrawal from BNRGW: 2001-2011-Withdrawal from Desalinated Water: 2007-2012
Water& Land Use Changes
Some data not available for 2012
DGGREE, DGPA, DG FORETS, OEP No specific indicators -Total Irrigated Agricultural Land:1970-2012-Total Forests Land: 1995-2000 -Total Pasture Land: 1995-2000
Water& Services Available for 2012 DGGREE, SONEDE, ONAS, INS -Wastewater Collection Capacity
-Improved Urban Water Sup-ply Coverage: 1984-2012-Improved Rural WSC: 1984-2012-Improved Urban Sanitation Coverage: 1994-2012-Improved Water Supply Cov-erage:1984-2012-Length of WS networks: 1983-2012 (SONEDE) & 1965-2012 (DGGREE)
Water & Energy Available for 2012 STEG, DGBGTH -Water used to generate Electricity
-Electricity Generated using Hydropower: 2000-2012-Installed Hydropower Capaci-ty: 1965-2012-Water Used to generate Elec-tricity:2008-2012
Water & Population Available for 2012 DGRE, DGGREE, SONEDE, INS No specific indicators -Total Population: 1921-2013-Population without improved WS: 1993-2013-Population without improved Sanitation: 1966-2009

88 Tunisia 2012 State of the Water Report
MEW
INA
Water & Quality Available for 2012 ANPE, SONEDE, DHMPE, ONAS -Fecal Choliform -Dissolved Oxygen: 2010-2012 (COPEAU Directory)-pH: 2004-2012 (CD)-Electric Conductivity: 2011-2012 (CD)-Nitrogen: 2004-2012 (CD)-Phosphorous: 2006-2012-TDS: 2004-2006-Fecal Choliform: 1995-2012
Water& Health Available for 2012 DHMPE -Cholera reported cases-Typhoid reported cases-Hepatitis A reported cases
-Diarrhea Prevalence: 2000-2013-Cholera reported cases: 2000-2013-Hepatitis A reported cases: 2000-2013-Typhoid Fever reported cases: 2000-2013
Water & Climate Available for 2012 DGRE -Drought events-Cost of annual damage caused by floods- Cost of annual damage caused by droughts-Annual Human Losses related to Floods- Annual Human Losses related to Droughts-Unusual Weather events (Snow, Hail,…)-National CC Adaptation Plan
-Flood-Events: 1969-2012-Drought Events: 1969-2013-Drougths-Floods:861-2013-Unusual Weather: Events:1983-2012
Water & Socio-Eco-nomics
Sometimes not available for 2012
DGRE, DGGREE, CGABE, INS No specific indicators -Water and Sanitation Charges as % of Average Household Income: 1980-2010
Water & Finance Sometimes not available for 2012
CGABE, Ministry of cooperation and regional development
No specific indicators -Percentage of National Bud-get directed to Water & Sani-tation: 2008-2013-Percent of GDP directed to Sanitation & Hygiene: 2008-2013
Water& Trade Data available for 2012 Ministry of Trade, DGCE No specific indicators --Virtual Water Imports relat-ed to trade in the agricultural sector: 1993-2003- Virtual Water IExports relat-ed to trade in the agricultural sector: 1993-2003- Virtual Water Net Flow relat-ed to trade in the agricultural sector: 1993-2003
Water & Gover-nance
Some data not available for 2012
DGRE, BIRH, DGGREE, DGACTA, SONEDE, BPEH
-Commercial Water Losses-Physical Irrigation Water Losses-Number of Water relat-ed Citations (Water Laws Enforcement)- Number of Water Users Associations- Water Users Associa-tions Agricultural Land Coverage
--Surface Water Permits is-sued: 2008-2013-Total Volumetric Rights as-sociated with Surface Water Permits: 2008-2013-Groundwater Wells Permits: 2008-2013- Total Volumetric Water Rights associated with Well Permits: 2008-2013-Number of Water related Citations (Water Laws Enforce-ment): 2010-2013
Water & Interna-tional Relations
Available for 2012 DGRE, BPEH No specific indicators No Historical Data

89
Analysis & Trends
Tunisia 2012 State of the Water Report
MEW
INA
5.2. Inventory of Available Historical Data for Each Indicator
Table 18. Inventory of available historical data, annual average, and 2012 values
Indicator Category Units Historical data Annual Average
Values2012 Remarks
Water & Availability
Annual Average Precipitation Depth MM/Year1983/84-2012/13Figure 4
252.9 153.00 Source : DGRE Pluviometric Directories
Annual Average Precipitation Volume BCM/Year
1983/84-2012/13Figure 4
39.2 23.7 Source : DGRE Pluviometric Directories
Blue Water
Internal Renewable Surface Water (IRSW) BCM/Year 1968-2012
Figure 5
Last estimation2.700
2.700Division of the country into seven watershedsSuccessive estimations
Internal Renewable Groundwater (IRG) BCM/Year 1968-2012
Figure 5 1.554 1.554 Successive estimations
Total Internal Renewable Blue Water Resources (TIRBWR) =(IRSW+IRG) - (OSWG)
BCM/Year 1968-2012Figure 5 3.854 3.854 Successive estimations
External Surface Water Inflow (ESWI) BCM/Year No Historical
Data 0.320 0.320 DGRE
External Surface Water Outflow (ESWO) BCM/Year No Historical
Data 0.190 0.190 DGRE
External Groundwater Inflow (EGI) BCM/Year No Historical Data 0.100 0.100 DGRE
External Groundwater Outflow (EGO) BCM/Year No Historical
Data 0.000 0.000 DGRE
Total External Renewable Blue Water Resources Inflow (TERBWR) =(ESWI+EGI)
BCM/Year No Historical Data 0.420 0.420 DGRE
Total Renewable Blue Surface Water (TRBSW) = (IRSW) + (ESWI) -(ESWO)
BCM/Year No Historical Data 2.830 2.830 2.7 + 0.320 – 0.190 = 2.830
Total Renewable Blue Groundwater (TRBG)=(IRG)+(EGI)-(EGO) BCM/Year No Historical
Data 1.654 1.654 1.554 + 0.100 – 0.000 = 1.654
Overlap between Surface Water and Groundwater (OSW) BCM/Year No Historical
Data 0.400 0.400 DGRE
Total Renewable Blue Water Resources (TRBWR) = (TRBSW) + (TRBG )- (OSG)
BCM/Year No Historical Data 4.084 4.084 2.830 +1.654 – 0.400 =
4.084
Total Exploitable Non Renewable Groundwater (TENRG) BCM/Year No Historical
Data 0.610 0.610 in 2012 DGRE, OSS, CM
Total Blue Water Resources (BWR) = (TRBWR + TENRG) BCM/Year No Historical
Data 4.694 4.694 DGRE
Mobilization of Surface Water (specific indicator) BCM/Year 2010-2012 2.159 2.188 DGRE, DGBGTH
Green Water
Water for Rain-fed Agricultural Consumption BCM/Year No Historical
Data 5.500 5.500 DGRE, DGPA, DGEDA, DGF
Water for Rain-fed Pasture Consumption BCM/Year No Historical
Data 6.000 6.000 DGRE, DGPA, DGEDA, DGF
Water for Rain-fed Forest Consumption BCM/Year No Historical
Data 1.500 1.500 DGRE, DGPA, DGEDA, DGF

90 Tunisia 2012 State of the Water Report
MEW
INA
Total Renewable Green Water Resources (TRGWR) BCM/Year No Historical
Data 13.000 13.000 DGRE, DGPA, DGEDA, DGF
Total Renewable Water Resources (TRWR) = (TRBWR + TRGWR) BCM/Year No Historical
Data 17.084 17.084 DGRE, DGPA, DGEDA, DGF
Total Conventional Water Resources : (TCWR) = TRWR+ TNRG = TBWR + TRGWR
BCM/Year No Historical Data
17.69417.694
17.69417.694 DGRE, DGPA, DGEDA, DGF
Non Conventional Water
Produced Municipal Wastewater (PMW) BCM/Year No Historical
Data - 0.239 ONAS
Produced Industrial Wastewater (PIW) BCM/Year No Historical
Data - 0.037 ONAS
Produced Agricultural Drainage (PAD) BCM/Year No Historical
Data- - 0.140 DGGREE, DGRE (2011)
Produced Desalinated Water (PDW) BCM/Year 2007-2012Figure 11 - 0.030 SONEDE, DGRE (2011)
Total Non-Conventional Water Resources (TNCWR) = (PMW) +(PIW) + (PAD) + (PDW)
BCM/Year No Historical Data - 0.446 DGRE, DGGREE, SONEDE,
ONAS
Total Available Water Resources (TAWR) = (TCWR) + (TNCWR) BCM/Year No Historical
Data - 18.140 DGRE
Treated Municipal and Industrial Wastewater BCM/Year 1990-2012 0.165 0.232 1990-2012
AA= 0.165 BCM
Reused Treated and Industrial Municipal Wastewater BCM/Year 1990-2012 0.042 0.06 1990-2012
AA= 0.042 BCM
Treated wastewater reused in agricultural irrigation BCM/Year 1990-2012 - 0.025
Counting the amount of water delivered or invoiced to CRDAs
Water & Uses
Withdrawals for Domestic Water Use
BCM/Year 2002-2013 - 0.495 SONEDE=0.451 DGGREE=0.044 TOT=0.495
Withdrawals for Industrial Water Use
BCM/Year 2002-2013-
0.089
SONEDE=0.046 MINERAL WATER= 0.001PRIVATE WELLS=0.042TOT= 0.089
Withdrawals for Agricultural Water Use (Blue water + Non-conventional water)
BCM/Year No Historical Data - 2.165 Counting volume of water
charged by GDA2.140 + 0.025 = 2.165
Annual Total Water Withdrawals BCM/Year No Historical Data - 2.749 0.495 + 0.089 + 2.165 =
2.749
Green Water consumptions for Agriculture Water Use BCM/Year No Historical
Data 5500 5.500 DGRE, 2012
Total Agricultural Water Uses BCM/Year No Historical Data - 7.665 DGGREE
Withdrawals From Blue Surface Water BCM/Year 2008-2013
Figure 8 0.589 0.615 DGBGTH, BIRH, 2012-13
Withdrawals From Blue Renewable Groundwater BCM/Year 2001-2011 for
Deep Aquifers (Figure 10)1980-2010 for Shallow Aquifers (Figure 9)
1.194 (Deep Aquifers
0.692 (Shallow Aquifers)
1.511 in 2010 1.590 in 2011,2012 data NA
Withdrawals from Non-Renewable Groundwater BCM/Year 2001-2011 0.610 0.610 in 2010 0.564 in 2011 (CI+CT)
Total Withdrawals from Blue Water BCM/Year No Historical Data - 2.736
0.615 + 1.511 + 0.610 = 2.736DGRE, 2012/13

91
Analysis & Trends
Tunisia 2012 State of the Water Report
MEW
INA
Agricultural Drainage Water Use BCM/Year No Historical Data 0.020 0.020 DGRE, 2011
Withdrawal from Desalinated Water BCM/Year
2007-2012 (SONEDE)Figure 11
0.019 (SONEDE) 0.030 (SONEDE
+ Private)
SONEDE, 2012DGRE, 2011
Total Withdrawals From Non-Conventional Water Resources BCM/Year No Historical
Data - 0.110 0.060+0.030+0.020 =0.110
Green Water Consumption for Livestock Fodder Water Use BCM/Year 2002-2013 0.765 0.760 DGPA, DGEDA, DGSA,OEP,
2012
Bottled Water Production BCM/Year 2012-2013 0.001 0.001
0.001 BCM in 2013Office of Thermalism & Hydrotherapy 2012, 2013
Water &Land use Change
Total Irrigated Agricultural Land Ha 1970-2012Figure 12
301,807 421,000.00 DGGREE
Total Rain-Fed Agricultural Land ha No Historical Data - 4, 953,550.00 DGEDA
Total Pasture Land ha 1995-2012Figure 13 4, 509,320 4, 895,000.00 DGEDA
Total Forest Land ha 1995-2012Figure 13 1, 087,888 1, 151,218.00 DGF
Urban Encroachment on Green Cover ha lost/Year No Historical
Data - 10.00010.000 ha lost/Year estimatedDGACTA, OTEDD, CNT
Impact of Urban Encroachment on Water Resources (Indicators listed below)
Decrease in Groundwater Recharge
BCM/Year No Historical Data - 0.00126 DGRE
Decrease in Water Consumptions of Green Cover
BCM/Year No Historical Data - 0.030 DGEDA, DGPA, DGF
Increase in Surface Runoff BCM/Year No Historical Data - 0.03126 DGRE
Increase in Domestic Water Withdrawals
BCM/Year No Historical Data - 0.030 SONEDE, DGGREE
Water & Services
Water Coverage and Accessibilility
Improved Urban Water Supply Coverage (Sector Ministry) % 1984-2012
Figure 14 100 100 SONEDE
Improved Rural Water Supply Coverage (Sector Ministry) % 1984-2012
Figure 14 67.0 93.4 SONEDE (49.7%), DGGREE (43.7%)
Improved Urban Sanitation Coverage (Sector Ministry) %
1994-2012Figure 15 74.5 85.4 ONAS
No Historical Data - 98.94 INS (2009)
2012 Data NA
Improved Rural Sanitation Coverage (Sector Ministry) %
No Historical Data - 5.1 ONAS
No Historical Data - 83.95 INS (2009)
2012 Data NA
Improved Water Supply Coverage (Sector Ministry)
% 1984-2012Figure 14 84.6 97.8 Urban + Rural
SONEDE, DGGREE
Improved Sanitation Coverage (Sector Ministry) %
No Historical Data - 58.4 ONAS
No Historical Data - 94.44 INS (2009)
2012 Data NA
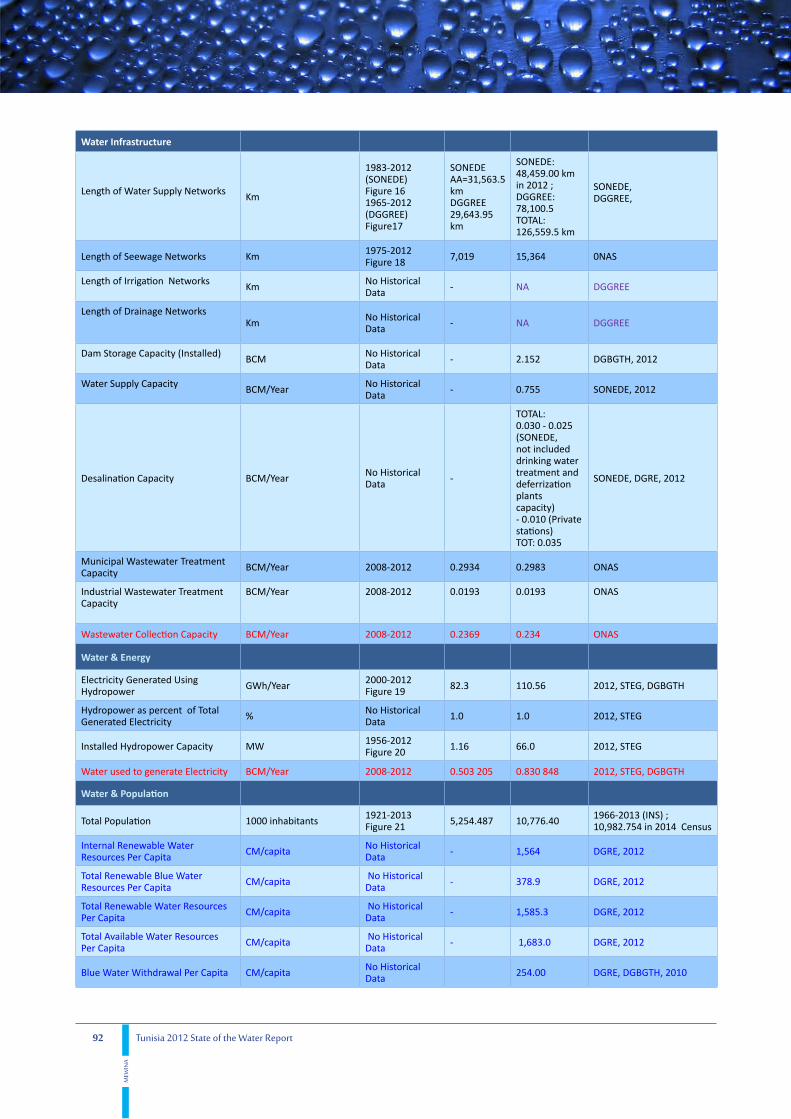
92 Tunisia 2012 State of the Water Report
MEW
INA
Water Infrastructure
Length of Water Supply Networks Km
1983-2012 (SONEDE)Figure 161965-2012 (DGGREE)Figure17
SONEDE AA=31,563.5 kmDGGREE 29,643.95 km
SONEDE:48,459.00 km in 2012 ;DGGREE: 78,100.5TOTAL: 126,559.5 km
SONEDE, DGGREE,
Length of Seewage Networks Km 1975-2012Figure 18 7,019 15,364 0NAS
Length of Irrigation Networks Km No Historical Data - NA DGGREE
Length of Drainage NetworksKm No Historical
Data - NA DGGREE
Dam Storage Capacity (Installed) BCM No Historical Data - 2.152 DGBGTH, 2012
Water Supply Capacity BCM/Year No Historical Data - 0.755 SONEDE, 2012
Desalination Capacity BCM/Year No Historical Data -
TOTAL: 0.030 - 0.025 (SONEDE, not included drinking water treatment and deferrization plants capacity)- 0.010 (Private stations)TOT: 0.035
SONEDE, DGRE, 2012
Municipal Wastewater Treatment Capacity BCM/Year 2008-2012 0.2934 0.2983 ONAS
Industrial Wastewater Treatment Capacity
BCM/Year 2008-2012 0.0193 0.0193 ONAS
Wastewater Collection Capacity BCM/Year 2008-2012 0.2369 0.234 ONAS
Water & Energy
Electricity Generated Using Hydropower GWh/Year 2000-2012
Figure 19 82.3 110.56 2012, STEG, DGBGTH
Hydropower as percent of Total Generated Electricity % No Historical
Data 1.0 1.0 2012, STEG
Installed Hydropower Capacity MW 1956-2012Figure 20 1.16 66.0 2012, STEG
Water used to generate Electricity BCM/Year 2008-2012 0.503 205 0.830 848 2012, STEG, DGBGTH
Water & Population
Total Population 1000 inhabitants 1921-2013Figure 21 5,254.487 10,776.40 1966-2013 (INS) ;
10,982.754 in 2014 Census
Internal Renewable Water Resources Per Capita CM/capita No Historical
Data - 1,564 DGRE, 2012
Total Renewable Blue Water Resources Per Capita CM/capita No Historical
Data - 378.9 DGRE, 2012
Total Renewable Water Resources Per Capita CM/capita No Historical
Data - 1,585.3 DGRE, 2012
Total Available Water Resources Per Capita CM/capita No Historical
Data - 1,683.0 DGRE, 2012
Blue Water Withdrawal Per Capita CM/capita No Historical Data 254.00 DGRE, DGBGTH, 2010

93
Analysis & Trends
Tunisia 2012 State of the Water Report
MEW
INA
Green Water Use Per Capita CM/capita No Historical Data - 1,206.00 DGRE, DGGREE
Total Water Consumption Per Capita CM/capita No Historical
Data - 1,460.00 DGGREE, DGRE
Agricultural Water Withdrawal Per Capita CM/capita No Historical
Data - 201.00 DGGREE, DGRE
Industrial Water Withdrawal Per Capita CM/capita No Historical
Data - 8.25 DGRE
Domestic Water Withdrawal Per Capita CM/capita No Historical
Data - 46.0 SONEDE, DGGREE
Population Without Improved Water Supply 1000 inhabitants 1993-2013 -
-240 (SONEDE),-239.9(INS)
1993-2013 (INS)*(INS 2009)
Population Without Improved Sanitation 1000 inhabitants 1966-2009 - 579.700 (INS) 1966-2009 (INS)
*(INS 2009)
Water & Quality
Dissolved Oxygen (DO) Ppm In hot spots of ANPE Control Network of Water Pollution2010-2012
-
V1 : 7.7-8.5V2 : 5.4-6.4V3 : NAV4 : NA
V1 : Medjerda WadiV2 : Beja damsV3 : Bizerte lagoonV4 : Nabeul Groundwater
pH Dimensionless
2004-2012 (Wadi El Bey, Korba lagoon, Bizerte lake)2006-2012: (Wadi Meliane Halg El Menzel logoon, Ghar El Melh lagoon)
-
V1 : 7.8-11.2V2 : 8.0-8.4V3 : 7.7-8.8V4 : 8.4-8.7
V1 : Medjerda WadiV2 : Beja damsV3 : Bizerte lagoonV4 : Nabeul Groundwater
Electric Conductivity (EC) ( m S/cm)
In hot spots of ANPE Control Network of Water Pollution2010-2012
-
V1 : 1.5-2.5V2 : 0.2-0.5V3 : 1.7-46.8V4 : 2.0-7.0
V1 : Medjerda WadiV2 : Beja damsV3 : Bizerte lagoonV4 : Nabeul Groundwater
Nitrogen Concentration (NO3)
ppm
2004-2012 (Wadi El Bey, Korba lagoon, Bizerte lake)2006-2012: (Wadi Meliane Halg El Menzel logoon Ghar El Melh lagoon)
-
V1 : NAV2 : NAV3 : 2.0-128.2V4 : NA
V1 : Medjerda WadiV2 : Beja damsV3 : Bizerte lagoonV4 : Nabeul Groundwater
Phosphorous Concentration(PO4)
ppm
In hot spots of ANPE Control Network of Water Pollution2006-2012
-
V1 : 1.3-33.0V2 : 0.4-9.7V3 : 0.1-71.8V4 : 0.1-0.7
V1 : Medjerda WadiV2 : Beja damsV3 : Bizerte lagoonV4 : Nabeul Groundwater
Total Dissolved Solids ppm
2004-2012 (Wadi El Bey, Korba lagoon, Bizerte lake)2006-2012: (Wadi Meliane Halg El Menzel logoon, Ghar El Melh lagoon)
-
V1 : 730-1480V2 : 110-220V3 : 950-37800V4 : 1200-5500
V1 : Medjerda WadiV2 : Beja damsV3 : Bizerte lagoonV4 : Nabeul Groundwater
Bacteriological Analysis
-Number of samples
-Unsuitable Cases (UC) %
1995-2012 (SONEDE)
-48,050 samples
-48,251 samples-UC :1.5%
1.5% <NT 09-14 limit and < WHO threshold

94 Tunisia 2012 State of the Water Report
MEW
INA
Fecal Choliform Colonies/100 ml 2009-2012SONEDE 1-3 1-3 Complies with the
standards
Water & Health
Diarrhea Prevalence % of children under 5 years old
2000-2013(Figure 22) 5.80 6.48 DHMPE, 2013
Dracunculiasis Reported Cases % 2000-2013 0.00 0.00 DHMPE, 2013
Open Defecation Practice Number No Historical Data - 348,540 INS, RGPH 2009
Percentage of Open Defecation % No Historical Data - 3.2 INS, RGPH 2009
Cholera Reported Cases Number/Year 2000-2013Figure 22 0.00 0.0 DHMPE, 2013
Typhoid fever reported cases
Number/year 2000-2013Figure 22 61 28
28 new reported cases in 2012DHME, 2013
Incidence rate (Cases number /100 000 inhabitants)
2000-2013Figure 22 0.55 0.26 DHMPE, 2013
Hepatitis A Reported Cases
Number/year 2000-2013Figure 22 675 412
412 new reported cases in 2012DHMPE, 2013
Incidence rate (Cases number /100 000 inhabitants)
2000-2013Figure 22 7.33 3.82 DHMPE, 2013
Water & Ecosystems
Number of Wetlands Sites Acknowledged by RAMSAR Number 1981-2013
Figure 23 1.2 35 40 in 2013
Total Wetlands areas ha 1981-2013Figure 23 48,728 877,467 1,608,024 in 2013
Total Freshwater Species Count NumberNo Historical Data -
260 terrestrial plant species, 50 aquatic plant species,140 bird
species ( most of which are migratory).7 species of freshwater fish in dams.
DG Forêts, RAMSAR, WWF,MAVA
Number of Endangered Species Number No Historical Data - Several species
(>10) DG Forêts, RAMSAR, WWF,MAVA
Number of Invasive Species Number No Historical Data -
>500,000 birds in winter from Asia and Europe (ducks, coots and flamingos)
DG Forêts, RAMSAR, WWF,MAVA
Water & Climate
Extreme Weather Events
Flood Events in the Last Four Decades. Number
1969-2012 :21 Flood Events(9 Class 1+7 Class 1.5+5 Class 2)
21/44=0.47
1 Flood Event in February -March 2012(Class 1.5)
Flood Events : 1969, 1973 (2), 1979, 1982 (2), 1986, 1990, 1995, 2000, 2003 (2), 2004, 2005, 2006, 2007, 2009 (2), 2011 (2), 2012.
Flood Events in 1969-1980 Number
1969-19804 Flood Events.( 1 Class 1.5 + 3 Class 2)
4/12=0.33 -Flood Events: 1969, 1973 (March), 1973 (December) and 1979 (March).

95
Analysis & Trends
Tunisia 2012 State of the Water Report
MEW
INA
Flood Events 1981-1990 Number4 Flood Events.(2 Class 1+ 2 Class 1.5)
4/10=0.4 - Flood Events : 1982 (2), 1986, 1990
Flood Events 1991-2000 Number2 Flood Events(1 Class 1 + 1 Class 1.5)
2/10=0.2 - Flood Events: 1995, 2000
Flood Events 2001-2010 Number
2001-20108 Flood Events.(5 Class 1+1 Class 1.5 +2 Class 2)
8/10=0.8 -
Flood Events: 2003 (2), 2004,2005,2006,2007, 2009 (April), 2009 (September).
Flood Events 2011-2013 Number
2011-20123 Flood Events.(1 Class 1+ 2 Class 1.5)
3/3=1.0
1 Flood Event in February -March 2012(Class 1.5)
Flood Events: 2011 (2), 2012
Drought Events in the Last Four Decades. Number
1969-2013(12 Drought Events)
12/45=0.27 (0) Drought Events in 2012
Drought Events: 1977, 1987, 1988, 1993, 1994, 1996, 1999, 2001, 2002, 2008, 2010, 2013
Drought Events in 1969-1980 Number1969-1980(1 Drought Event)
1/11=0.1 - Drought Events: 1977,
Drought Events 1981-1990 Number1981-1990(2 Drought Events)
2/11=0.2 - Drought Events: 1987, 1988,
Drought Events 1991-2000 Number1991-2000(4 Drought Events)
4/11=0.4 - Drought Events: 1993, 1994, 1996, 1999,
Drought Events 2001-2010 Number2001-2010(4 Drought Events)
4/11=0.4 - Drought Events: 2001, 2002, 2008, 2010,
Drought Events 2011-2013 Number2011-2013(1 Drought Event)
1/3= 0.33 (0) Drought Events in 2012 Drought Events: 2013
Cost of Annual Damage Caused by Floods $-% GDP 1969-2012
240 MDT/44 years = 5.5 MDT/Year
5.5 MDT/Year=3.1 M$/Year%GDP=0.007(Non significant value)
GDP 2012 (109$)= 44.25654GDP 2013 (109$)= 47.43029
Cost of Annual Damage caused by Droughts $-% GDP 1969-2013 NA NA NA
Annual Human Losses related to Floods Number 1969-2012 800/44 # 20/year -
Annual Human Losses related to Droughts Number 1969-2013 NA NA NA
Unusual Weather Events (Snow, Hail,…)
Number/Type 1983-2012 129 Snow EventsAA =129/31 =4.2159 Hail EventsAA = 159/31= 5.13
13 Snow Events in 201216 Hail Events in 2012
INM, 2013
National Climate Change Adaptation Plan Yes/No - - Yes -
Water &Socio-Economics
Water Productivity
Industrial Water Productivity (GDP/Water Use) $/CM No Historical
Data - 145.33 GDP=12.93475B$WU=0.089 BCM/Year

96 Tunisia 2012 State of the Water Report
MEW
INA
Agricultural Water Productivity (GDP/Water Use) $/CM No Historical
Data - 0.51GDP=3.89392 B$WU=7.665BCM/Year
Employment in Agriculture “ Job per Drop” Jobs/MCM No Historical
Data - 71.75
WU=7.665 BCM/YearNumber of employed persons in agriculture: 550,012
Employment in Industry “Job per Drop Jobs/MCM No Historical
Data - 11, 993.67
WU=0.089 BCM/YearNumber of employed persons in industry:1,067,437
Tariffs and Affordability
Water and Sanitation Charges as % of Average Household Income % 1980-2010 - 1.26 in 2010
1980-2010 (INS)The survey is quinquennial (last survey 2010)
Water & Finance
Percentage of National Budget directed to Water & Sanitation Sector
% 2008-2013 2.07 1.9 1.8 in 2013
Operation & Maintenance Cost Recovery for Water Supply and Sanitation
% -2007-2012
-59.0
80 .770.0
- Water Supply (Source SONEDE)- Rural Water Supply (Source DGGREE)
Percent of GDP directed to Sanitation and Hygiene % 2008-2013 0.15 0 .13 0 .13 in 2013
Foreign Aid for Water and Sanitation (loans and grants) Million US$ 2009-2010
1997-2012--
14.253.22TOT: 67.42
SONEDEONAS
Operation & Maintenance Cost Recovery for Irrigation % 2007-2012 80 64 Irrigated Areas
Source : DGGREE
Water & Trade
Virtual Water Imports related to Trade in the Agricultural Sector BCM/Year 1993-2013 - 10.22 Source : DGCE, Ministry
of Trade
Virtual Water Exports related to Trade in the Agricultural Sector BCM/Year 1993-2013 - -6.03 Source : DGCE, Ministry
of Trade
Virtual-Water net Flow Related to Trade in the Agricultural Sector BCM/Year 1993-2013 - 4.19 Source : DGCE, Ministry
of Trade
Water & Governance
IWRM Plan Yes/No - - Yes DGRE, BPEH
National Water and Sanitation M&E & R System
Yes/No - - No DGRE, BPEH
Surface Water Permits Issued to Date Number 2008-2013
Figure 26 165 170 162 in 2013BIRH, DGRE, CRDA
Total Volumetric Rights Associated with surface Water Permits BCM/Year 2008-2013
Figure 26 0.00552 0.00544 0.00583 in 2013BIRH, DGRE, CRDA
Volume associated with surface Water permits as a Percent of Annual Blue Surface Water Withdrawals
% 2008-2012 0.937 0.9Annual Blue Surface Water Withdrawals: O.615 BCM/Year.
Groundwater Well Permits Issued to Date Number 2008-2013
Figure 26 1,304 1,232 1786 in 2013BIRH, DGRE, CRDA
Total Volumetric Water Rights Associated with Well Permits BCM/Year 2008-2013
Figure 26 0.05593 0.05174 0.08394 in 2013BIRH, DGRE, CRDA

97
Analysis & Trends
Tunisia 2012 State of the Water Report
MEW
INA
Total Volume associated with well permits as a percent of Annual Blue Groundwater Abstractions
% 2008-2012 - 2.99 in 2010 2.28 in 2012
Annual Blue Groundwater Abstractions : 2.175 BCM in 2010 and 2.269 BCM in 2012
Number of unlicensed wells Number/Year No Historical Data - 1,636 in 2010 BIRH, DGRE, CRDA
Irrigation & Drainage Related Complaints as a percentage of Irrigation Water Users
% No Historical Data - NA NA
Water supply and Sanitation Related Complaints as a percentage of Serviced Households.
% 2009-2012 - 2.83
-300,000 complaints in 2012, -Serviced population: 10,593,500 inhabitants in 2012 by SONEDE and DGGREE.
Number of Water Supply Meters Installed as a Percent of Total Number of Covered Households
% 2009-2012 -Urban : %99.4Rural : 45.5%Total : 83%
SONEDEStatistical Directory 2012
Number of Groundwater Meters Installed as a percent of Licensed Wells
% No Historical Data - NA NA
Number of Surface Irrigation Meters Installed as a % of Surface Irrigation Water Permits
% No Historical Data - NA NA
Physical Domestic Water Losses MCM(%) 2009-2012 - 126.8 MCM
(78.7%) SONEDE
Overall Water Use Efficiency % No Historical Data - 89.5 DGBGTH, DGRE, SONEDE
Water Sustainability/ Depletion Index % No Historical
Data - 48.4 DGBGTH, DGRE, DGGREE, SONEDE, ONAS
Wastewater and Drainage Outflows BCM/Year No Historical Data - 0.292 ONAS, DGGREE, DGRE
Transboundary Wastewater and Drainage Outflows
BCM/Year No Historical Data - 0.00 ONAS, DGGREE, DGRE
Commercial Water Losses BCM/Year(%) 2009-2012 - 0.0343
(21 .3%) SONEDE
Physical Irrigation Water Losses BCM/Year - - 38% estimatedDGGREEEfficiency rate in irrigated plots = 77%
Number of Water related citations (Water Laws Enforcement) Number 2008-2013 224 188 267 in 2013
BIRH, DGRE, CRDA
Number of Water Users Associations Number No Historical
Data -
2,580(1,327 Water Supply + 1,253 Irrigation)
DGGREE
Water Users Associations Agricultural Land Coverage % of Ag. Land No Historical
Data -
47,5% of Irrigated areas,1.0 % of Agricultural land
DGGREE
Water & International Relations
Transboundary Water Bodies Dependency Ratio % No Historical
Data - 6.5 ((149+610) + (320+100) / (18.140)) * 100
Shared Waters related Bilateral/ Multilateral Agreements and/or Memorandums of Understanding and Cooperation Mechanisms
Number - - 1 Consultation Mechanism
Number of Riparians sharing all shared water bodies Number - - 2 Estimated from INS census
2014
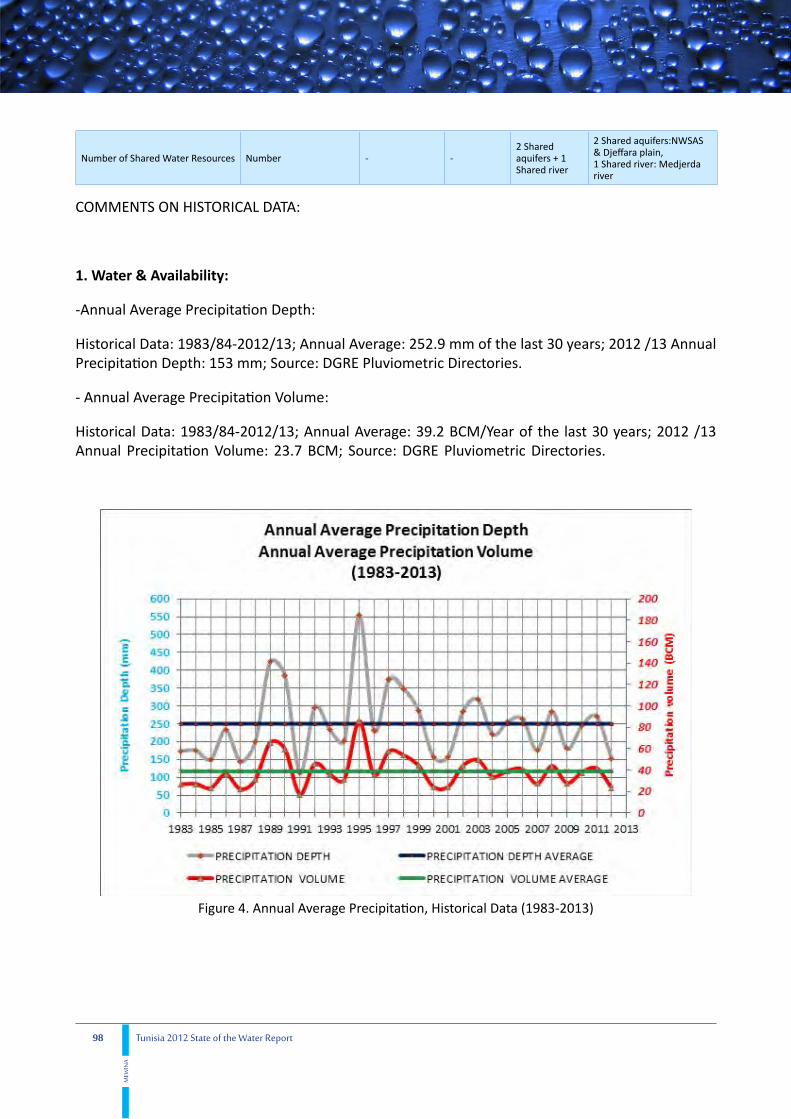
98 Tunisia 2012 State of the Water Report
MEW
INA
Number of Shared Water Resources Number - -2 Shared aquifers + 1 Shared river
2 Shared aquifers:NWSAS & Djeffara plain,1 Shared river: Medjerda river
COMMENTS ON HISTORICAL DATA:
1. Water & Availability:
-Annual Average Precipitation Depth:
Historical Data: 1983/84-2012/13; Annual Average: 252.9 mm of the last 30 years; 2012 /13 Annual Precipitation Depth: 153 mm; Source: DGRE Pluviometric Directories.
- Annual Average Precipitation Volume:
Historical Data: 1983/84-2012/13; Annual Average: 39.2 BCM/Year of the last 30 years; 2012 /13 Annual Precipitation Volume: 23.7 BCM; Source: DGRE Pluviometric Directories.
Figure 4. Annual Average Precipitation, Historical Data (1983-2013)

99
Analysis & Trends
Tunisia 2012 State of the Water Report
MEW
INA
• Internal Renewable Surface Water (IRSW): The latest estimates of surface water were made in 1990, the potential was 2,700 MCM / Year, since the numbers have not changed.
Historical Data: 1968-2005; most recent estimate: 2,700 MCM/Year, Source: DGRE
IRSW= 2,700 MCM/Year
Table 19. Successive estimations of Tunisia Water Resources (1968-2005) in MCM/Year
Year 1968 1972 1980 1985 1990 1996 2000 2005
Surface Water 2000 2000 2580 2630 2700 2700 2700 2700
Phreatic Groundwater 160 230 490 590 670 720 737 745
Deep Groundwater 600 900 1030 1100 1170 1250 1399 1419
Total 2760 3130 4100 4320 4540 4570 4836 4864
Figure 5. Successive estimations of Tunisia Water Resources (1968-2005) in MCM/Year
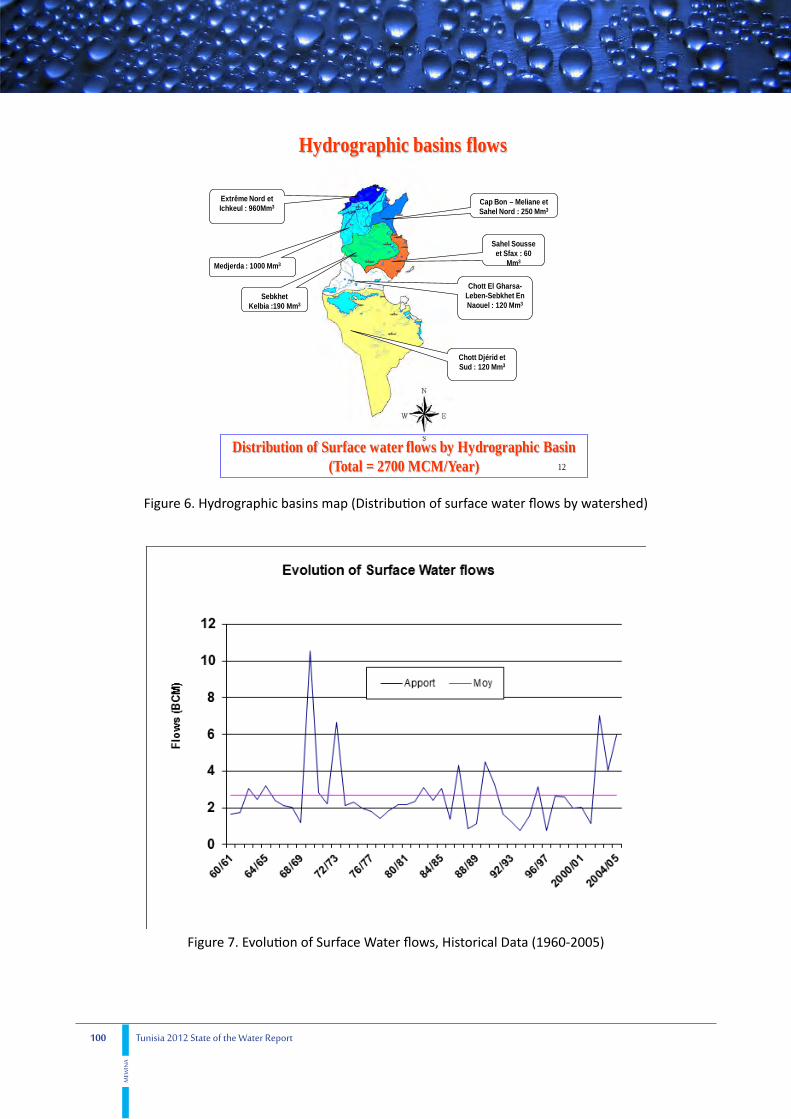
100 Tunisia 2012 State of the Water Report
MEW
INA
12
Hydrographic basins flows
Chott El Gharsa-Leben-Sebkhet En Naouel : 120 Mm3
Chott Djérid et Sud : 120 Mm3
Sahel Sousse et Sfax : 60
Mm3
Cap Bon – Meliane et Sahel Nord : 250 Mm3
Extrême Nord et Ichkeul : 960Mm3
Sebkhet Kelbia :190 Mm3
Medjerda : 1000 Mm3
Distribution of Surface water flows by Hydrographic Basin(Total = 2700 MCM/Year)
Figure 6. Hydrographic basins map (Distribution of surface water flows by watershed)
Figure 7. Evolution of Surface Water flows, Historical Data (1960-2005)

101
Analysis & Trends
Tunisia 2012 State of the Water Report
MEW
INA
• Internal Renewable Groundwater (IRG): The latest estimates of groundwater resources were made in 2005, the potential was 2,164 MCM / Year, since the numbers have not changed.
IRG= (Phreatic Groundwater Resources + Deep Groundwater Resources) – (Non Renewable Groundwater) = (0,745 + 1,419) – 0,61= 1,554 MCM/Year.
Historical Data: 1968-2005; most recent estimate: 1,554 MCM/Year, Source: DGRE
• Total Internal Renewable Blue Water Resources (TIRBWR)=(IRSW+IRG)- (OSWG) = 2.700 + 1.554 – 0.400 = 3.854 BCM/Year
• Total Renewable Blue Surface Water (TRBSW) = (IRSW)+(ESWI)-(ESWO)= 2.7 + 0.320 – 0.190 = 2.830 BCM/Year.
• Total Renewable Blue Groundwater (TRBG)=(IRG)+(EGI)-(EGO) = 1.554 + 0.100 – 0.000 = 1.654 BCM/Year
• Overlap between Surface Water and Groundwater (OSW) = 0.400 BCM/Year• Total Renewable Blue Water Resources (TRBWR)=(TRBSW)+(TRBG)-(OSG) = 2.830 +1.654 –
0.400 = 4.084 BCM/Year• Total Blue Water Resources: (TBWR) = (TBSWR) + (TBGWR) – (OSWGW) = 2.830 +2.264 +
0.100 – 0.400= 4.694 BCM/Year or (TBWR) = (TRBWR + TNRBWR) = 4.084 + 0.610 = 4.694 BCM/Year.
2. Water & Uses:
• Annual Total Water Withdrawals: 0.495 + 0.089 + 2.165 = 2.749 BCM/Year• Total Agricultural Water Uses: 7.665 BCM/Year• Total Withdrawals from Blue Water: 0.615 + 1.511 + 0.610 = 2.736 BCM/Year• Total Withdrawals from Non Conventional Water Resources: 0.060 + 0.030 + 0.020 =0.110 BCM/
Year• Withdrawals from Blue Surface Water:
Table 20: Withdrawals from dams
Hydrological Year 2008/2009 2009/2010 2010/2011 2011/2012 2012/2013 Annual Average
Withdrawals (MCM) 576 613 534 608 615 589
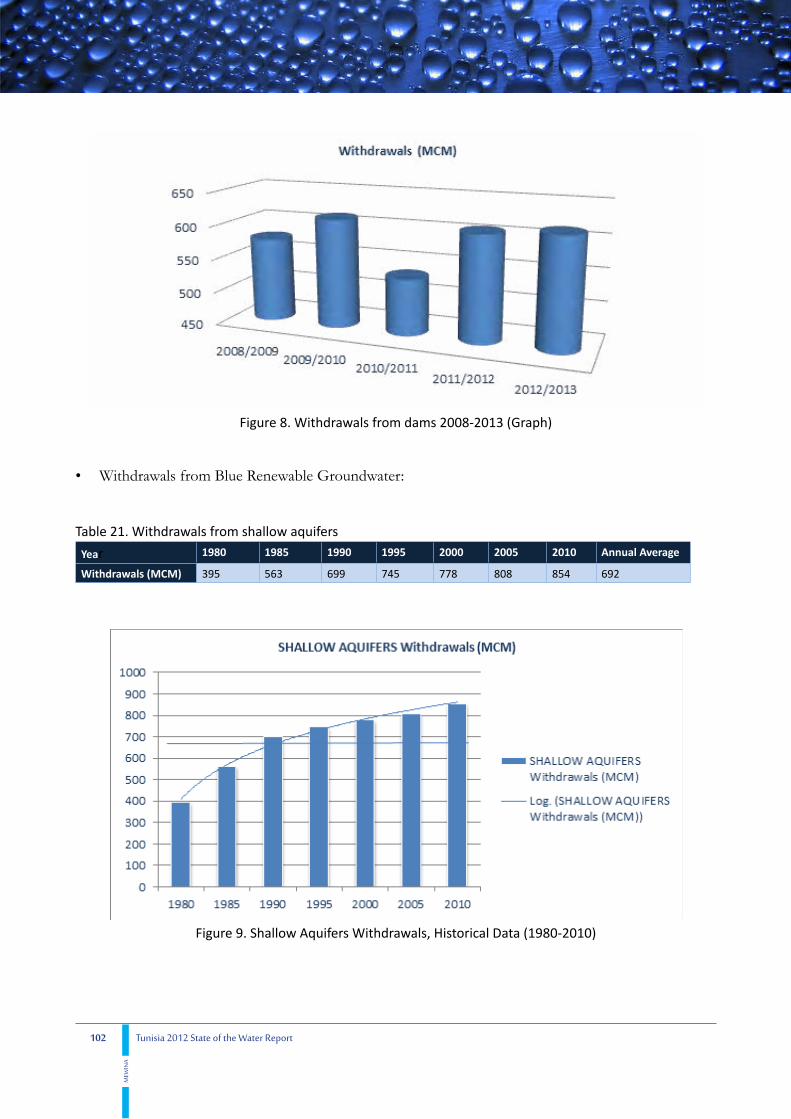
102 Tunisia 2012 State of the Water Report
MEW
INA
Figure 8. Withdrawals from dams 2008-2013 (Graph)
• Withdrawals from Blue Renewable Groundwater:
Table 21. Withdrawals from shallow aquifers
Year 1980 1985 1990 1995 2000 2005 2010 Annual Average
Withdrawals (MCM) 395 563 699 745 778 808 854 692
Figure 9. Shallow Aquifers Withdrawals, Historical Data (1980-2010)

103
Analysis & Trends
Tunisia 2012 State of the Water Report
MEW
INA
Table 22. Withdrawals from deep aquifers included NRGWYear 2001 2002 2003 2004 2005 2006 2007 2008 2009 2010 2011 AA
Withdrawals (MCM) 1,119 1,135 1,110 1,127 1,143 1,171 1,188 1,227 1,243 1,321 1,346 1,194
Source: DGRE
Figure 10. Deep Aquifers Withdrawals, Historical Data (2001-2011)
• Withdrawals from Desalinated Water:
Table 23. Withdrawals from desalinated water (SONEDE)
Year 2007 2008 2009 2010 2011 2012 AA
Withdrawals (MCM) 18.2 18.2 19.5 19.7 19.3 19.7 19.1
Figure 11. Desalinated Water Withdrawals, Historical Data 2007-2012 (SONEDE)

104 Tunisia 2012 State of the Water Report
MEW
INA
Table 23a. Green Water Consumption for Livestock Fodder Water Use (2002-2013)
YearLivestock fodder areas (Rain fed areas) (ha)
Green Water Consumption for Livestock fodder water use(BCM/Year)
2002/2003 252,250 0.757
2003/2004 243,617 0.731
2004/2005 235,275 0.706
2005/2006 244,400 0.733
2006/2007 251,350 0.754
2007/2008 258,880 0.777
2008/2009 257,964 0.774
2009/2010 262,836 0.789
2010/2011 281,535 0.845
2011/2012 261,307 0.784
2012/2013 253,206 0.760
Annual Average 254,783 0.765
Source: Ministry of Agriculture
Green Water Consumption for Livestock fodder water use= 0.760 BCM in 2012/2013.
3. Water & Land Use Changes:
• Total Irrigated Agricultural Land:
Table 24. Irrigated Areas (1000 ha)Year 1970 1975 1980 1985 1990 1995 1998 2000 2008 2009 2010 2011 Annual Average
Irrigated Area 1000 ha 164 185 208 223 243 260 273 275 416 416.95 418.5 421 301.807
Source: DGGREE
Figure 12. Irrigated Area, Historical Data (1970-2011)

105
Analysis & Trends
Tunisia 2012 State of the Water Report
MEW
INA
• Total Rain-Fed Agricultural Land: 4,953,550 ha in 2012 and 4,970,930 ha in 2013 (Source DGEDA)• Total Forest & Pasture Land: Historical Data: 1995-2012
Table 25. Total Forest & Pasture Lands (ha)1995 2010 2012 Annual Average
Total Forest Land (ha) 970,818 1, 141,628 1, 151,218 1, 087,888
Total Pasture Land (ha) 4, 132,186 4, 500,775 4, 895,000 4, 509,320
Source: DGF
Figure 13. Total Forest and Pasture land, Historical Data (1995-2012)
4. Water & Services:
Water Coverage and Accessibilility:
• Improved Urban Water Supply Coverage (Sector Ministry): 100%, Historical Data: 1984-2012, Source: SONEDE.
• Improved Rural Water Supply Coverage (Sector Ministry): 93.4%, Historical Data: 1984-2012, Source: SONEDE, DGGREE.
• Total Access to Water Supply (Urban + Rural): 97.8 %. This percentage is broken down as follows: • Percentage covered drinking water piped directly onto premises, including public taps, protected
public dug wells and springs: 97.1 % (Source: INS, RNPE 2011).• Percentage covered by private dug/tube wells, bottled water and harvested rainwater: 2.9 %.
• Total Access to Sanitation Facilities (Urban + Rural): 94.4 %. This percentage is broken down as follows: • Percentage covered by piped sewer system: 60.4 % (Source INS), while ONAS gives 58.4 %.• Percentage of improved access to sanitation facilities: 34 % (Septic tanks, pit latrines, cesspools
and seguia collectors)

106 Tunisia 2012 State of the Water Report
MEW
INA
• Shared facilities: 2.4 %• Other unimproved: 3.2 %
Figure 14. Water Supply Coverage indicators, Historical Data (1984-2012)
• Improved Urban Sanitation Coverage (Sector Ministry): 85.4%, Historical Data: 1994-2012, Source ONAS
IUSC = 98.94 % (2009 Value), No Historical Data, 2012 Data non Available, Source INS.

107
Analysis & Trends
Tunisia 2012 State of the Water Report
MEW
INA
Figure 15. Urban Sanitation Coverage, Historical Data (1994-2012)Source ONAS
• Improved Rural Sanitation Coverage (Sector Ministry): 5, 1 % in 2012, No Historical Data, Source ONAS
IRSC = 83.95 % in 2009, No Historical Data, 2012 Data non Available, Source INS
Water Infrastructure:
• Length of Water Supply Networks:SONEDE: Historical Data (1983-2012), Annual Average 31,563.5 km, Length: 48,459 km in 2012, Source: SONEDE.
DGGREE: Historical Data (1965-2012), Annual Average 29,643.95 km, Length: 78,100.5 km in 2012, Source: DGGREE

108 Tunisia 2012 State of the Water Report
MEW
INA
Figure 16. Water Supply Network Length, Historical Data (1983-2012) SONEDE
Figure 17. Water Supply Network Length, Historical Data (1965-2012) DGGREE
• Length of Sewage Networks:Historical Data (1975-2012), Annual Average: 7,019 km, Length: 15,364 km in 2012, Source: ONAS

109
Analysis & Trends
Tunisia 2012 State of the Water Report
MEW
INA
Figure 18. Length of ONAS Sewage pipe Networks, Historical Data (1975-2012)
• Municipal Wastewater Treatment Capacity:Historical Data (2008-2012), Annual Average: 0.2934 BCM, Municipal Wastewater Treatment Capacity: 0.2983 BCM in 2012.
• Industrial Wastewater Treatment Capacity:Historical Data (2008-2012), Annual Average: 0.0193 BCM, Industrial Wastewater Treatment Capacity: 0.0193 BCM in 2012.
Table 25a. Municipal & Industrial Wastewater Treatment Capacity, Historical Data (2008-2012)Year 2008 2009 2010 2011 2012 Annual
Average
Municipal Wastewater Treatment Capacity (MCM/Year)
289.2 290.8 294.5 294.5 298.3 293.4
Industrial Wastewater Treatment Capacity (MCM/Year)
19.3 19.3 19.3 19.3 19.3 19.3
Wastewater Collection Capacity (MCM/Year)
234.5 238.8 240.0 237.3 234.0 236.9
Source: ONAS
5. Water & Energy:
• Electricity Generated Using Hydropower: 110.56 GWh/Year by 7 hydropower plants built between 1956 and 2003, Historical Data: 2000-2012, Annual Average: 82.3 GWh/Year, (Source: STEG 2012).

110 Tunisia 2012 State of the Water Report
MEW
INA
• Hydropower as % of Total Generated Electricity: Electricity Generated Using Hydropower (GWh)/ Total Generated Electricity (GWh) = (110.56) / (14 123.2)*100 = (0.7) # 1 % in 2012 (Source: STEG 2012)
• Installed Hydropower Capacity: 66.00 MW in 2012 disaggregated as follows: (1) Nebeur Hydropower plant: 13 MW, (2) El Aroussia : 4.8 MW, (3) Fernana: 9.7 MW, (4) Kasseb: 0.66 MW, (5) Sidi Salem: 36 MW, (6) Bouheurtma: 1.2 MW, (7) and Sejnane: 0.6 MW (Source STEG 2012), Historical Data: 1956-2012, Annual Average: 1.16 MW (Source STEG 2012).
• Water Used to Generate Electricity: 830.8 MCM in 2012 disaggregated as follows: (1) Nebeur Hydropower plant: 44.5 MCM, (2) El Aroussia : 0.0 MCM, (3) Fernana: 37.9 MCM, (4) Kasseb: 32.4 MCM, (5) Sidi Salem: 701.7 MCM, (6) Bouheurtma: 14.3 MCM, (7) and Sejnane: 0.0 MCM, Historical Data: 2008-2012, Annual Average: 503, 205 MCM/Year (Source STEG 2012).
Figure 19. Electricity Generated Using Hydropower, Historical Data (2000-2012)

111
Analysis & Trends
Tunisia 2012 State of the Water Report
MEW
INA
Photo 1. Turbining (Beni Metir Dam)Source: STEG
Table 26. Installed Hydropower CapacityYear Hydropower Plants Number Pump sets Number Installed Hydropower Capacity (MW)
1956 2 3 17.8
1958 1 1 8.5
1962 - 1 1.2
1969 1 1 0.66
1983 1 1 36
2003 2 2 1.8
TOTAL 7 9 66

112 Tunisia 2012 State of the Water Report
MEW
INA
Figure 20. Installed Hydropower Capacity, Historical Data (1956-2013)
Photo 2. Hydro electricity Generation

113
Analysis & Trends
Tunisia 2012 State of the Water Report
MEW
INA
6. Water & Population :
• Total Population: Different national censuses in Tunisia gave the following results:
Table 27. Population Growth (1921-2014)
Census Year Number of inhabitants
1921 2, 093, 939
1926 2, 159, 708
1931 2, 410, 692
1936 2, 608, 313
1946 3, 230, 952
1956 3, 783, 169
1966 4, 533, 351
1975 5, 588, 209
1984 6, 966, 175
1994 8, 785, 711
2004 9, 910, 872
2014 10, 982, 754
Figure 21. Population Growth, Historical Data (1921-2014)
• Internal Renewable Water Resources Per Capita = (Total Internal Renewable Blue Water Resources (TIRBWR) + Total Renewable Green Water Resources (TRGWR))/ Population = 3.854 BCM/Year + 13.000 BCM/Year)/ 10 776 400 capita = 1564 CM/Capita/Year.
• Total Water Consumption Per Capita: 1,460 CM/capita• Agricultural Water Withdrawal Per Capita: 201.0 CM/capita

114 Tunisia 2012 State of the Water Report
MEW
INA
• Industrial Water Withdrawal Per Capita: 8.25 CM/capita• Domestic Water Withdrawal Per Capita: 46.0 CM/capita
7. Water & Quality:
Parameters monitored are: Dissolved Oxygen, pH, Electric Conductivity, Nitrogen and Phosphorous concentrations, Total Dissolved Solids, and Fecal Choliform.
• Historical Data for Wadi El Bey (Hot spot in Nabeul Governorate): 2004-2012
Table 28. Water Quality Historical Data Wadi El Bey (2004-2012)Sampling Date April 2004 June 2005 May 2006 Oct 2006 April 2007 Nov 2007 May 2008 Nov 2008
pH (Dimensionless) 6.3-7.9 6.3-8.2 6.7-8.2 6.3-8 6.3-8 6.7-8.4 7-8 6.7-8
SalinityTDS (g/l)
1.2-2.1 0.9-1.8 1.6-4.4 1.1-2.4 0.7-2 1-2 0.7-5.2 1.1-7.2
Nitrates(mg/l)
50-410 50-325 60-325 45-260 40-140 10-85 10-70 (March)
10-250
March 2009 Sept 2009 Febr 2010 Sept 2010 May 2011 Sept 2011 Febr 2012 Nov 2012 NQE
7-8.3 6.5-7.8 7-8 7.5-8 7-8.5 7-8.5 8.2-8.5 7 .3-7.6 6-9
O.5-2.3 0.7-2.5 2.5-3 2-2.5 1-3 1-3.5 1.5-1.81.1 11 -
10-20 10-90 - 10-30 1-15 67-97 - 3-80 50
Source: ANPE, 2013
Watershed of Wadi El Bey:
The watershed of Wadi El Bey covers an area of 464 km2. He is the main water course in the region of Grombalia- Bou Argoub Soliman. It is fed by various industrial, agricultural and domestic discharges.
Effluent composition of Wadi El Bey watershed, namely releases from Grombalia WWTP and those from industries, affect directly some parameters indicators of Wadi El Bey water quality as salinity and COD whose concentration increases dramatically.
• Historical Data for SONEDE drinking water (bacteriological analysis):
8. Water & Health:
• Diarrhea Prevalence (% of children under 5 years old) = 6.48% in 2012 (Source DHMPE). Historical Data: 2000-2013, the annual Average 2000-2013 is 5.80%.
• Dracunculiasis Reported Cases (%) = 0.00 % in 2012 (Source DHMPE), unsignaled in Tunisia for a long time.
• Open Defecation Practice (Number) = (85 218 households *4.09) = 348 540 inhabitants in 2012 (Source INS, RGPH 2009 edited in 2012)
• Percentage of Open Defecation (%) = (348 540)/ (10 776 400) = 3.2 % (Source INS, RGPH 2009

115
Analysis & Trends
Tunisia 2012 State of the Water Report
MEW
INA
edited in 2012)• Cholera Reported Cases (Number per year) = 0.00 % in 2012 (Source DHMPE). The Annual Average
2000-2013 is 0.00 %.• Hepatitis A Reported Cases = 412 new reported cases in 2012 (Source DHMPE)Incidence rate (Cases number /100 000 inhabitants) = 3.82 in 2012 (Source DHMPE). The Annual Average 2000-2013 is 7.33 %
• Typhoid fever Reported Cases = 28 new reported cases in 2012 (Source DHMPE)Incidence rate (Cases number /100 000 inhabitants) = 0.26 in 2012 (Source DHMPE). The Annual Average 2000-2013 is 0.55 %
Table 29. Historical Data on Water & Health Indicators (2000-2013)
Year
Diarrhea Prevalence
(% of children under 5 years
old)
Typhoid feverIncidence rate (Cases number
/100 000 inhabitants)
Hepatitis AIncidence rate (Cases number
/100 000 inhabitants)
CholeraIncidence
(Cases number)
Drinking Water
Salinity(% Sampling
< 2 g/l)
2000 5,7 0,70 4,75 0 -
2001 5,4 0,45 9,75 0 -
2002 6,24 0,31 10,77 0 -
2003 6,5 0,47 7,29 0 83,9
2004 5,38 1,71 9,51 0 82,5
2005 5,6 1,01 7,21 0 85,7
2006 5,45 0,60 6,30 0 84,4
2007 5,11 0,47 12,74 0 89,2
2008 6,7 0,48 8,47 0 87,4
2009 4,67 0,49 7,23 0 87,4
2010 5,13 0,27 6,81 0 86,8
2011 5,68 0,17 2,23 0 88,0
2012 6,48 0,26 3,82 0 87,6
2013 7,2 0,36 5,70 0 85,7
Average 5,80 0,55 7,33 0 86,2

116 Tunisia 2012 State of the Water Report
MEW
INA
Figure 22. Historical Data on Water & Health Indicators (2000-2013)
9. Water & Ecosystems:
Historical Data: 1981-2013
• 35 Wetlands Sites Acknowledged by RAMSAR in 2012; 40 Wetlands Sites Acknowledged by RAMSAR in 2013; Annual Average: 1.2 sites
• Total Wetlands areas: 877,467 ha in 2012; Total Wetlands areas: 1,608,024 ha in 2013; AA: 48,727 ha
Table 30. Number and Areas of Wetlands Sites, Historical Data (1981-2013)Date 1981 2007 2012 2013
Number of Wetlands Sites Acknowledged by RAMSAR 1 19 35 40
Total Wetlands areas (ha) 12,600 713,903 877,467 1,608,024

117
Analysis & Trends
Tunisia 2012 State of the Water Report
MEW
INA
Figure 23. Number and Areas of Wetlands Sites, Historical Data (1981-2013)

118 Tunisia 2012 State of the Water Report
MEW
INA
Figure 24. Ramsar Wetlands map

119
Analysis & Trends
Tunisia 2012 State of the Water Report
MEW
INA
10. Water & Climate:
• Flood Events in the Last Four Decades: Historical Data (1969-2012), 21 Flood Events (9 Class 1+7 Class 1.5+5 Class 2), these events occurred in1969, 1973 (2), 1979, 1982 (2), 1986, 1990, 1995, 2000, 2003 (2), 2004, 2005, 2006, 2007, 2009 (2), 2011 (2), and 2012; Annual Average: 21/44= 0.47; only one Flood Event occurred in February -March 2012 (Class 1.5). Source DGRE
• Drought Events in the Last Four Decades: Historical Data (1969-2013), 12 Drought Events, these events occurred in 1977, 1987, 1988, 1993, 1994, 1996, 1999, 2001, 2002, 2008, 2010, and 2013, Annual Average: 12/45 =0.27; only one Drought Event occurred in 2013. Source DGRE
• Cost of Annual Damage Caused by Floods: Historical Data (1969-2012), Cost: 240 MDT/44 years #5.5 MDT/Year =3.1 M$/Year.
GDP 2013 (109$) = 47.43029; Cost of Annual Damage Caused by Floods in % GDP= 0.007.
• Annual Human Losses Related to Floods: Historical Data (1969-2012), AA= 800/44 # 20/Year• Unusual Weather Events (Snow, Hail,…): Historical Data (1983-2012), 129 Snow Events ,AA
=129/31 =4.2 and 159 Hail Events, AA = 159/31= 5.13.
In 2012, 13 Snow Events and 16 Hail Events occurred. Source INM
Photo 3. Overflow of wadi MedjerdaSource: DGRE

120 Tunisia 2012 State of the Water Report
MEW
INA
Photo 4. Flooded Mabtouh Plain downstream of wadi Medjerda
Source: DGRE
Photo 5. Flood Event in September 2009 in Redeyef –Gafsa (Destruction of the CPG railway in Redeyef)

121
Analysis & Trends
Tunisia 2012 State of the Water Report
MEW
INA
Photo 6. Flood Event in September 2009 in Redeyef –Gafsa (Destruction of the irrigation pipe of Tabedit-Richet Naam)
Photo 7. Flood Event in September 2009 in Redeyef –Gafsa (Destruction of works of water and soil conservation in Tarfaoui river)

122 Tunisia 2012 State of the Water Report
MEW
INA
CHRONOLOGY OF DROUGHTS- FLOODS PERIODS IN TUNISIA(861-2005)
707
733
861
873
879
920
921
928
929
953
988
1004
1020
1022
1033
1040
1041
1042
1076
1090
1097
1147
1180
1310
1325
1348
1354
1456
1457
1570
1605
1612
1640
1700
1726
1727
1758
1761
1762
1805
1829
1867
1902
1907
1911
1914
1922
1927
1931
1932
1935
1938
1943
1948
1956
1958
1959
1961
1962
1964
1965
1969
1973
1977
1982
1987
1988
1990
1993
1994
1996
1999
2000
2001
2002
2003
FLOODS & DROUGHTS IN TUNISIA
Figure 25. Chronology of Droughts-Floods in Tunisia, Historical Data (861-2005)
11. Water & Socio-Economics:
Water Productivity:
• Industrial Water Productivity: IWP=12.93475 (B$)/0.089 (BCM/Year)= 145.33 $/CM in 2012, Source INS, DGRE.
• Agricultural Water Productivity: AWP=3.89392 (B$)/7.665 (BCM/Year) = 0.51 $/CM in 2012, Source: INS, DGRE, DGGREE.
• Employment in Agriculture “Job Per Drop”: 55,012 persons/7.665 BCM/Year= 71.75 Jobs/MCM in 2012, Source: INS, DGRE, DGGREE.
• Employment in Industry “Job Per Drop”: 1,037,437 persons/0.089 BCM/Year= 11, 993.67 Jobs/MCM in 2012, Source INS, DGRE.
Tariffs & Affordability:
• Water and Sanitation Charges as % Average Household Income: Data are for 2010 because the survey is quinquennial.
Water and Sanitation Charges= 22.996 DT (Invoice) +3.015 DT (Water tanks) +6.645 DT (Mineral water) = 32.656 DT per person in 2010 (Source: INS)

123
Analysis & Trends
Tunisia 2012 State of the Water Report
MEW
INA
Average Household Income: 4,861.1 DT in 2010 (Source INS).
Water and Sanitation Charges as % Average Household Income= 32.656 DT*100/4,861.1 DT = 0.7% in 2012
12. Water & Finance:
• Percentage of National Budget directed to Water & Sanitation Sector: 2012 Value: Water & Sanitation Budget = 492.8 MTDN= 308.9856 106 $, Total National Budget =25 551.0 MTDN = 16 020.447 106 $ and % of National Budget directed to Water & Sanitation Sector is 308.9856 106 $/ 16 020.447 106 $ = 1.9%.
2013 Value: % of National Budget directed to Water & Sanitation Sector is: 1.8%; Source: INS, Ministry of Finance, Ministry of Agriculture, ONAS, DHMPE.
• Percentage of GDP directed to Sanitation and Hygiene: 2012 Value: Sanitation and Hygiene Budget = 91.5 MTDN = 57.3705 106 $, GDP = 70 584.6 MTDN = 44.256544 109 $ and % of GDP for Sanitation and Hygiene is 57.3705 106 $/44.256544 109 $ = 0.13%.
2013 Value: % of GDP for Sanitation and Hygiene is also: 0.13%; Source: INS, ONAS, DHMPE
• Operation & Maintenance Cost Recovery for Water Supply and Sanitation =80.7% in 2012 (Source SONEDE)
• Operation & Maintenance Cost Recovery for Irrigation =64 %in 2012 (Source DGGREE)• Foreign Aid for Water and Sanitation: 14.2 Million US$ in 2012 for SONEDE and 53.22 Million US$
in 2012 for ONAS. TOTAL: 67.42 Million US$ in 2012.
13. Water & Trade:
Historical Data: 1993-2013
• Virtual Water Imports, Exports and Virtual-Water Net Flow Related to Trade in the Agricultural Sector:
Virtual Water Imports: 10,225.342 MCM in 2012
Virtual Water Exports: 6,032.021 MCM in 2012
Virtual-Water Net Flow: 4,193.321 MCM in 2012
Source: DGCE (Ministry of Trade)
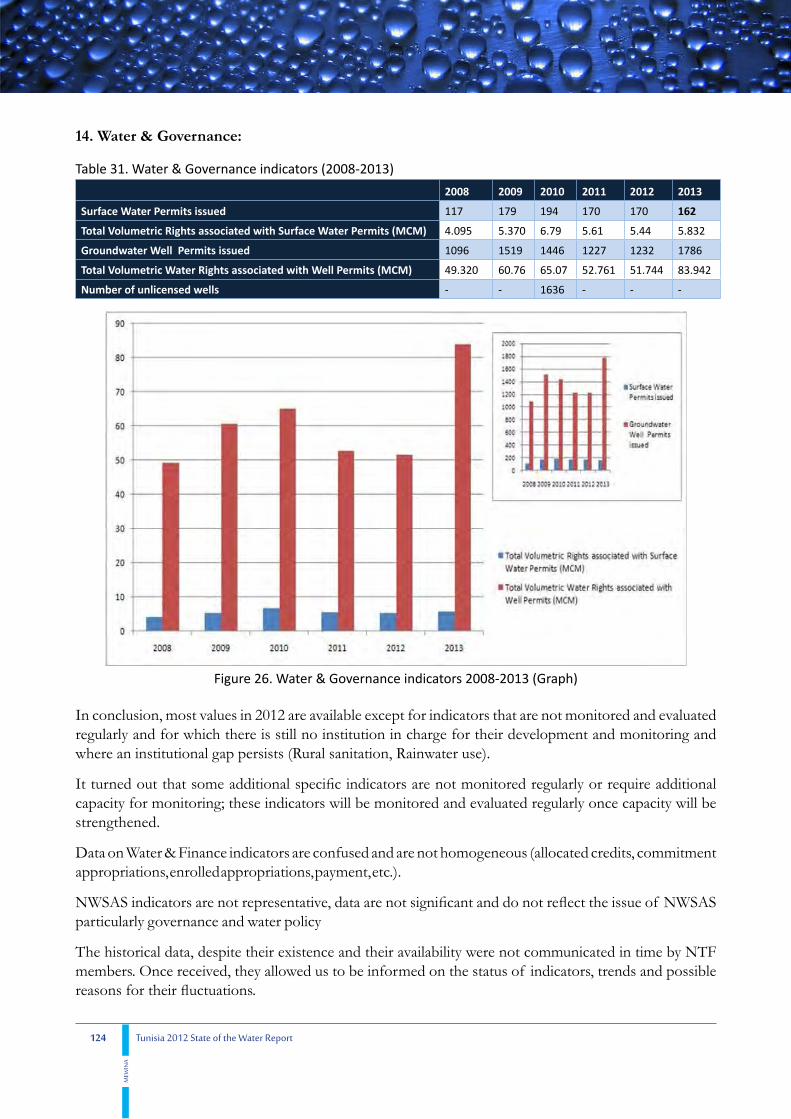
124 Tunisia 2012 State of the Water Report
MEW
INA
14. Water & Governance:
Table 31. Water & Governance indicators (2008-2013)
2008 2009 2010 2011 2012 2013
Surface Water Permits issued 117 179 194 170 170 162
Total Volumetric Rights associated with Surface Water Permits (MCM) 4.095 5.370 6.79 5.61 5.44 5.832
Groundwater Well Permits issued 1096 1519 1446 1227 1232 1786
Total Volumetric Water Rights associated with Well Permits (MCM) 49.320 60.76 65.07 52.761 51.744 83.942
Number of unlicensed wells - - 1636 - - -
Figure 26. Water & Governance indicators 2008-2013 (Graph)
In conclusion, most values in 2012 are available except for indicators that are not monitored and evaluated regularly and for which there is still no institution in charge for their development and monitoring and where an institutional gap persists (Rural sanitation, Rainwater use).
It turned out that some additional specific indicators are not monitored regularly or require additional capacity for monitoring; these indicators will be monitored and evaluated regularly once capacity will be strengthened.
Data on Water & Finance indicators are confused and are not homogeneous (allocated credits, commitment appropriations, enrolled appropriations, payment, etc.).
NWSAS indicators are not representative, data are not significant and do not reflect the issue of NWSAS particularly governance and water policy
The historical data, despite their existence and their availability were not communicated in time by NTF members. Once received, they allowed us to be informed on the status of indicators, trends and possible reasons for their fluctuations.

125
Policy Recomm
endations
Tunisia 2012 State of the Water Report
MEW
INA
The existing system of monitoring, evaluation and reporting of the state of water, in Tunisia, despite its shortcomings and limitations, helps to the knowledge of the state of water and environment in the country. So that, it can fully play its role, and be in line with the efficient systems at regional, continental and global scale, it is necessary to improve, enrich, strengthen, expand and upgrade it. For this, we recommend the following reforms:
• Complete the development of Water Information System (SINEAU) and its various components to evolve as a decision support system that can be used on progress in water sector
• Construct information sub-systems (or DBMSs) within the related institutions that do not have them, to be integrated in SINEAU
• Lift the institutional gap of rural sanitation and rainwater management (use)• Enhancement of institutional arrangements• Establish departments or entities dealing with monitoring, evaluation and reporting of the status of
water in key institutions in charge of water, and reform the relevant legislative texts.• Implementation of M&E&R sub-systems in all the institutions in charge of water resources• Implementation of a national M&E&R system at the central level and appoint DGRE or BPEH of
its management• Improving Monitoring process• Implementation of a dissemination and awareness strategy• Capacity building and strengthening training program• Establish a MEWINA unit within DGRE or BIRH.
6. Policy Recommendations

126 Tunisia 2012 State of the Water Report
MEW
INA
ReferencesBesbes M, Hamdene A, Chahed J and Hamza M, 2008. World water Development Report 3. Case study in Tunisia. Document prepared for WWAP (UN. World Water Assessment Program).
Chahed J., Hamdane A., and Besbes M. 2008. A comprehensive water balance of Tunisia: blue water, green water and virtual water. Water International, 33:4, 415-424
Chaieb H. and Hamza.M. 2013. Responses to Misr consult questionnaires based on data collected from Tunisia MEWINA project national taskforce.
DGF/GTZ.1994 : Gestion de la faune sauvage et des parcs nationaux en Tunisie
DGF. 1995: Résultats du premier inventaire forestier national en Tunisie
DGF. 1995: Résultats du premier inventaire pastoral national en Tunisie
DGF.2010 : Inventaire des forêts par télédétection, Résultats du deuxième inventaire forestier et pastoral national
DGF/ WWF Bureau de Tunis, Programme Méditerranée.2012 : Les zones humides d’importance internationale en Tunisie, 35 sites RAMSAR
DGRE : Annuaires pluviométriques, hydrométriques, exploitation des nappes phréatiques et profondes, suivi de la qualité des eaux souterraines.
Lebdi.F. 2009. National needs assessment and delineate UNDP interventions in Tunisia. UNDP Press.
INS, Institut National de la Statistique. 2013. Population statistics for Tunisia. Available at: http://www.ins.nat.tn. Accessed: March. 2013.
INS, Institut National de la Statistique. 2014. http://rgph 2014.ins.tn
Jemmali H., and Matoussi M. 2013. A multidimensional analysis of water poverty at local scale: application of improved water poverty index for Tunisia. Water Policy. 15: 98-115.
Khanfir R., El Echi M., Louati M., Marzouk A., Frigui H., and Alouini A.1998. EAU21: Stratégie du secteur de l’eau en Tunisie à long terme 2030. Ministère de l’Agriculture. République Tunisienne.
Maplecroft. 2012. Water Stress Index Values for 2012. Available at: www.maplecroft.com. Accessed: March, 2013.
MARH. 2007. National Strategy for the adaptation of Tunisian agriculture and ecosystems to climate change. Ministère de l’Agriculture et des Ressources Hydrauliques. République Tunisienne.
MEED.2007. Protection of Ecosystems from Climate Change and Climate Change Adaptation Report. République Tunisienne.
MEED/ANPE/OTEDD/GTZ.2010: Etude de l’évolution urbaine de l’agglomération du Grand Sousse

127
References
Tunisia 2012 State of the Water Report
MEW
INA
MEED/ANPE/AQUAPOLE/LIFE/COPEAU : Réseau de contrôle de la pollution de l’eau en Tunisie, Rapports annuels 2006-2012
MEWINA RAR.2014: Tunisia Water Sector M&E Rapid Assessment Report, Mohamed Hamdi Nour, Mekki Hamza.
ONAS. 2012. Statistiques des Abonnés ONAS. 2012 Annual Report. Office National de l’Assainissement. République Tunisienne. http://www.onas.nat.tn.
SONEDE. 2012. Société Nationale d’Exploitation et de Distribution des Eaux. Annual Report. République Tunisienne.
SONEDE/DCPEG/DSP.2012 : Rapport des statistiques, Année 2012
SONEDE/DCPEG/DSP.2013 : Rapport des statistiques, Année 2013
SONEDE/DCPEG/DSP.2014 : Les statistiques de la SONEDE (2002-2013)
STEG. 2013. La société tunisienne d’électricité et du gaz. Available at: http://www.steg.com.tn/fr. Accessed on: March,2013.
UNDP. 2013. United Nations Development Program. Country Profile: International Human Development Indicators. Available at: http://hdrstats.undp.org/. Accessed on : March, 2013.

128 Tunisia 2012 State of the Water Report
MEW
INA
Annex
AMCOW Water and Sanitation M&E Template
Country Background Information Sheet
Country Name: Tunisia
Items Information
1. Population trends for the last 4 years, and GDP. Years 2000 2010 2011 2012 2013
Urban pop. 5979900 6971600 7055400 7156145* 7241575*
Rural pop. 3572600 3575500 3618400 3621408* 3644952*
Total pop. 9552500 10547100 10673800 10777553* 10886527*
GDP (109 USD) 18.45468 39.77751 40.58608 44.25654** 47.43029***Source : INS (* pop on 1st July, **semi-final, *** provisional); 1DT=0.627 USD on 27/3/2013.
2. Basis of the existing water sector Policy/ Reform and potential policytargets.
Important issues addressed in the existing Water Sector Reform?Public policy of water in Tunisia was established based on the following strategic objectives: (i) ensure the supply of drinking water to all inhabitants (ii) develop tourism and ensure food security of the country by restricting imports of food and agricultural products and by encouraging the export (iii) stabilize rural incomes. Actually other objectives are added such as improving the efficiency of irrigation systems ensuring better use of water resources. Thus the objective sought by the state is that the share of irrigated agriculture in the national production passes from 35% to 50%. These policies have gone through two major steps that led to a switch from a policy based on the sustained mobilization of water resources in order to improve the supply, to a policy of management and valorization of these water resources in order to manage the global demand.Meanwhile the focus is more on finding unconventional resources. This research includes: (i) the reuse of treated wastewater, and to a certain extent, desalination of brackish and saline water, (ii) and integrated water resources management (IWRM).
The objectives of the new water policy in Tunisia seek to: (i) ensure continuing suitability between needs and water resources by increasing supply and controlling of the demand, (ii) identify imbalances at the scale of natural regions of the country (iii) consider ways to readjust imbalances in the context of integrated management.This evolving policy hasn’t ceased to be modernized and completed to address key issues and resulted in the development of national or sector strategies and action plans and programs to implement these strategies.
Major reforms in the water sector and sanitation:BPEH restructuring, revision of the Water Code, Renaissance of the National Council of water, review of legal, regulatory and contractual hydraulic groups framework, review of the Tunisian standard NT09-14 on the quality of drinking water; revision of the NT106-03 on the reuse of treated wastewater; workshop to launch the project development and implementation of SINEAU (26/03/2013), national Consultation Workshop on the review and analysis of the state of implementation strategies and / or action plans for wastewater in Tunisia (05/03/2013), water table on the water local management (25/12/2013), local governance legal framework of water in Tunisia (27/05/2014),consultation workshop on governance and financing of water sector (18/02/2014) ...
Main potential targets by 2016:(i) mobilization of 95% of water resources, (ii) the irrigated area using water-saving equipment reaches 93% (iii) 90% of the cost of water for irrigation systems and rural water supply is recovered (iv) efficiency rate of the parcel irrigated is 78%(v) accessibility to drinking water in rural areas is 98%

129
Annexes
Tunisia 2012 State of the Water Report
MEW
INA
3. Knowledge of international and African Milestones on Water and Sanitation.
Which are the ones well known and used in the county? Specify how it is used.--The Millennium Development Goals (MDGs) adopted by the General Assembly of the United Nations (UN) in 2000,who declared the decade 2005-2015 as the Decade of Water for Life, target international goals in the sector of water and the environment. Goal 7 aims to preserve the environment, and by2015, the percentage of the population that does not have sustainable access to safe drinking water or to sanitation will be reduced to half its value now (target 7c).The rates achieved by the country in terms of water supply and sanitation are as follows:Accessibility to drinking water is 100% in urban areas and 93.9%in rural areas. For sanitation, the rate of access is 99% in urban areas and 84% in rural areas, which reflects the significant efforts made in this area.
-The shared African water vision 2025 aims that Africa have equitable and sustainable management of water resources for poverty alleviation, socio-economic development , regional cooperation and the preservation of the environment. The realization of this vision depends on four axes: (i) strengthening the governance of water resources, (ii) improving the efficiency of water usage (iii) meeting the urgent needs for water, (iv) strengthening financing of water in the future. These areas are broken down into 12 targets. For example, for axis3 target1, the African vision plans to reduce by 25% in 2005 and 75% by 2015 the proportion of people without access to safe drinking water and sanitation. The rate of inaccessibility to water and sanitation in Tunisia in 2013 was reduced respectively by 91.9% and 77.8% and are therefore in line with the objectives of the African Water Vision 2025. The efforts performed by Tunisia for the achievement of the vision targets meet the objectives in general.
-Sharm Elscheickh commitments to accelerate the achievement of water and sanitation in Africa, signed by the Heads of State and Government of the African Union, on the occasion of the 11th Ordinary Session of conference in Sharm Elscheickh, Egypt, from 30 June to 1 July 2008, these commitments are also considered for the monitoring of the progress to achieve the various targets.
4. Trend of the 3 latest reviews in national water Policy and Reforms.
Reviews Review 1 Review 2 Review 3
Drivers of the Reviews
WATER - 21; Study of the water sector in Tunisia long term 2030 (MARH 1998)
The project PISEAU 1
(2007-2001)
- The project PISEAU 2 (2008-2014)
- study of the sustainable management of water resources (2008)
Targeted Impacts and effectiveness
-Introduction of the IWRM
-management of water demand
- Use of non-conventional water
Improvement of rural water supply
- Optimization of monitoring of surface water and groundwater
- design of SINEAU
-Improvement of governance
- Implementation of subsystems S & E and SINEAU
- Participative management of groundwater
- Pilot operations of rural sanitation
-Quality improvement and enhancement of TW
- Implementation of SOW M&E&R system
- Revision and amendment of the Water Code. Bill revising and implementing decrees
(2010-2014)
- Water Rights in the new constitution (Article 44) (2014)

130 Tunisia 2012 State of the Water Report
MEW
INA
5. Comments on the national water sector regarding the strengths, weaknesses, opportunities, threats and outstanding problems.
Water resources of the country are limited. In order to exploit and develop this potential, Tunisia has established the legislative framework and institutions necessary for the realization of ambitious programs on the water sector. It has developed policies, national strategies and action plans for the sustained mobilization, management, protection and enhancement of water resources. The important improvements mobilization, storage, transfer and handling produced water in recent decades, with the development of various sectors of the economy and significantly reduced the vulnerability to the vagaries of climate: water security, mitigation the effect of drought, protection against flooding. Tunisia raised the challenge of mobilizing her water resources to serve the socio-economic development and welfare of its population, so that the Tunisian now has a level of water comfort that has not been matched in the past. Today, Tunisia faces the problems of, effective management, integrated and sustainable conservation, resource protection and enhancement of its maximum, to meet growing demand, future needs and control risks.
The sector has achieved remarkable performance in terms of water supply and sanitation with a very positive impact on the quality of life and economic activity. Despite the achievements, the water sector still faces problems that hinder its proper functioning particularly in terms of monitoring and evaluation. Among these problems, we can mention : IWRM is still under development, the water stakeholders are not yet fully involved, ineffective management of groundwater, storm water is not used outside the agriculture sector ,pricing and the mismatch between the price of drinking water production and sales of, the institutional gap for rural sanitation ...
Similarly, the national information system on water (SINEAU) offers a dynamic database and a unified system to all sub systems management. However, monitoring and evaluation is still under development, and only some subsystems (SYGREAU, COPEAU) are operational. Also, governance needs to be improved or even enhanced by the introduction and application of the principles of good governance

131
Annexes
Tunisia 2012 State of the Water Report
MEW
INA
Country Water and Sanitation Performances Evaluation Sheet
Country Name: Tunisia
Performance Category Country Information
Theme 1: Infrastructure of water for economic development.PC. 1.1. Water and EnergyTarget: Increase the use of hydro-energy by 10% between 2000 and 2015.
-The national theoretical hydropower potential is estimated at 1000 GWh, the theoretical exploitable potential is 250 GWh, the economically feasible is 165 GWh and the installed capacity is currently estimated at 66 MW on a set of eight hydro-electric dams. The hydropower is nearly 1% of the total energy produced by the country.-Specific actions taken to achieve the target: STEG proceeded to achieve the following: (i) renovation and modernization of old hydro power plants by using modern equipment like static excitation, microprocessor based controls, electronic governors, high speed static relays, data logger, vibration monitoring etc; but it is not enough to achieve the target
Level of achievement
years (i) 2000 2010 2011 2012 2013
- Hydroelectric potential economically feasible GWh(P) 160 165 165 165 165
-Hydro-electric capacity installed MWh(C) 64 66 66 66 66
-Index of the usage of the hydropower (HpuI = C/P) 0.4 0.4 0.4 0.4 0.4
Growth rate RiHpuI(%) = (HpuIi -HpuI2000)/HpuI2000 - 0 0 0 0 -Sources of verification and specific comments: Annual operating report of STEG Centre for Hydraulics Production which is part of the Department of Renewable Energy Production attached itself to the Central Directorate of Electricity Production. The economically feasible hydropower potential and the installed hydroelectric capacity have not changed since several years. Target will not be achieved in 2015.
PC. 1.2. Water and Agriculture
Targets: -Increase water productivity Rain fed agriculture & Irrigation by 30% from 2000 to 2015.
and
-Increase the size of irrigated areas by 50% from 2000 to 2015
-Specific actions taken to achieve the target:Improving the efficiency of water use
Level of achievement for agricultural productivity:
Years (i) 2000 2010 2011 2012 2013
-Agricultural GDP (109 USD) (A) 1.62832 3.06728 3.42405 3.84175 3.88802
-Total water withdrawn for irrigated and rain fed agriculture (109 m3)(B)
6.040(1.879*+ 4.161**)
8.634(2.203*+ 6.431**)
9.310(2.210*+ 7.100**)
6.279(2.247*+ 4.032**)
8.373(2.313*+ 6.060**)
-Water Return to Environment 109 m3 (C) 0.133 0.140 0.150 0.130 0.140
Water productivity (USD/m3) Wp=A/(B-C) 0.27562 0.36111 0.37380 0.62477 0.47224
Rate of increase RiWp(%) = (Wpi-Wp2000)/Wp2000
- 31.01 36.62 126.67 71.33
*Total water withdrawn for irrigated areas: surface water+ groundwater ** Total water withdrawn for rain fed agriculture Water Return to Environment is estimated

132 Tunisia 2012 State of the Water Report
MEW
INA
- Achievement on irrigated areas:
Years (i) 2000 2010 2011 2012 2013
-Irrigated areas(IA) in hectares 275 000* 418 500* 420 000* 421 000* 437 500**
Rate of increase RiIA(%) = (IAi-IA2000) /IA2000
- 52.18 52.72 53.09 59.09
*Source DGGREE**Source DGEDA
Sources of verification: INS, DGEDA and DGGREE Agricultural GDP : source DGEDA of MA Course of 27/03/13 : 1TDN : 0.627 USD Conclusions: The rate of increase of water productivity has surpassed 30% and therefore the target was
achieved The rate of increase of irrigated area has surpassed 50% and therefore the target was achieved.
PC. 1.3. Water for multiple Uses
Target: Increase the Water Demand Satisfaction Index (WDSI) by 10% from 2000 to 2015.
Specific actions taken so far for the milestone:Achievement:
Years (i) 2000 2010 2011 2012 2013
- *Total all sectors Water Demand 109m3 (A) 9.553 10.547 10.673 10.777 10.886
- **Total all sectors water supply (B) 10.760 15.027 16.334 10.608 14.488
- WDSI = B/A 1.126 1.424 1.530 0.984 1.331
Rate of increase RiWDSI (%) = (WDSIi -WDSI2000)/ WDSI2000)
- 26.4 35.8 -12.6 18.2
* Value is calculated based on 1000 m3/capita/yr as per AMCOW guidelines** Values include blue, green, grey, and silver waters Target is met but is highly controlled by the fluctuation in green water. Also, the 1000 m3/capita/yr might not be realistic for Tunisia
Sources of verification:Surface water abstraction from dams (DGBGTH), pumping from rivers ( wadis) (BIRH) groundwater abstraction from deep aquifers (DGRE), precipitation intercepted by rain fed (estimated), use of treated waste water (ONAS, DGGREE), use of desalinated water (SONEDE and private users), use of rainwater tanks-majels (INS).
Theme 2: Management and protection of water resources
PC. 2.1: Transboundary basins and water resources management
Specific actions taken so far for the milestone:Establishment of a consultative mechanism for the joint management of the North Western Sahara Aquifer System(NWSAS), operated by Tunisia, Algeria and Libya
Existence of a Management Plan for Effective Water or IWRM plan and year of adoption:- There is no stated plan for the Integrated Water Resources Management; however the main institutions responsible for water work separately for the promotion of IWRM through its various components, as well as improving governance and effective management of water resources.- A national plan for Integrated Water Resources Management at the national level and across borders, which identifies priority steps that must be taken to reform the system of water management to the principles of IWRM to develop by 2015.
Target: Develop a national Water Efficiency Plan by 2015.
Elements of the legislative and regulatory environment:- The water code developed in 1975 is being revised and / or redesigned to update it and to adapt to current conditions. It remains the most appropriate instrument for the preservation and protection of water resources.- The recent Renaissance of the National Council of Water (Decree No. 407/2010 dated March 9, 2010) will assist the Minister to decide on strategic issues in the sector, while involving all stakeholders in the water, including civil society.

133
Annexes
Tunisia 2012 State of the Water Report
MEW
INA
Elements of institutional arrangements:- The BPEH recently renewed and charged by the Minister’s office, in coordination with stakeholders in the hydraulic sector, to: (i) planning the mobilization of conventional water resources and the development of non-conventional water resources in order to meet the medium and long term, growing needs of water consummation in different sectors, (ii) annual program allocation of water resources to different users in order to develop such resources, (iii) ensure the ongoing monitoring of deployment of the hydraulic sector especially in emergency situations, which consist mainly in periods of drought or floods or during any failures in any production or distribution water facility, (iv) ensure coordination between institutions producers and distributors of water resources in the hydraulic field.- The BPEH is in charge of coordinating the study of strategic water in 2050 in Tunisia.- DGRE is responsible for the coordination and management of the national information system on water (SINEAU).
Elements of Financial Structure:- The investment project in water sector (PISEAU 2) is financed by the IBRD, AfDB and AFD. The implementation of SINEAU and the strategic study on Water 2050 are financed by the AWF. The revision of the Water Code is funded by BIRH while preservation strategy groundwater is funded by the European Union. Efficient project management of water resources and the study of the sustainable management of water resources are funded by GIZ.
Management instruments:Existence of tools and methods that help decision makers to take the best decision. These instruments are: the Water Code, the National Council for water, The hydraulic public water domain commission, the National Commission for Sustainable Development, SINEAU, BPEH, and BIRH etc.Sources of verification and specific comments: - Ministry in charge of Water and institutions.
PC. 2.2. TransboundaryInfrastructureDevelopment RainwaterTarget: Increase by 10% from 2008- 2015.
Not applicable
PC. 2.3. GroundwaterTarget: AGC Roadmapimplemented atMore than 80%.
Not applicable
PC. 2.4. Rainwater
Target: Increase the share of rainwater use in total municipal water consumption up to 10% by 2015.
Specific actions taken so far for the milestone: - Encouraging the use of rainwater
Achievement:
Years (i) 2008 2011 2012 2013
- Total municipal water supply(A) 488.8 563.7 601.3 628.7
- Rainwater use (Mm3) (B) 12.6 8.76 10.20 10.7*
- Water use from other sources (Mm3) (C) (41.7+83.7) (44.0+69.3) (44.4+57.2) (45.0+46.1)
Total municipal water consumption (%) (Twc = A+B+C) 626.8 659.7 713.1 689.0
Percentage of rainwater usepRu (%)=B/Twc . 2.01 1.32 1.43 1.55
*estimated at 90 000 families.
Sources of verification and specific comments:-The quantities of water are removed from municipal provided statistical reports SONEDE, storm water are estimated on the basis of the general census of population and housing 2004 and on the results of the Labor Force Survey 2009 of INS; the withdrawals from wells and boreholes come from DGRE directories.-The figures for rainwater used needs to be revised and better defined

134 Tunisia 2012 State of the Water Report
MEW
INA
PC. 3.1. Urban Water Supply
PC. 3.2. Urban Sanitation
PC. 3.3. Rural Water Supply
PC. 3.3. Rural Sanitation and Hygiene
Specific actions taken so far for the milestone:Developing Infrastructure of water supply and sanitation in urban and rural areas especially in the North West and in the South regions.Achievement in water supply:
Years (i) 1990 2010 2011 2012 2013
-Urban access (%) 100 100 100 100 100
-Rural access (%) 38,7 93,5 93,8 93,4 93,9
-Total access (%) (W) 75,4 97,8 97,9 97,8 98,0
Rate of Inaccessibility reduction for waterIRwat (%) = (Wi-W1990)/ (100-W1990)
- 91.0 91.5 91.0 91.9
Target: Reduce by 50% from 1990 to 2015, the proportion of the population without improved drinking water source, and the proportion without improved sanitation facility (Urban/Rural /Total).
Achievement in improved sanitation:
Years (i) 1990 2010 2011 2012 2013
-Urban access (%) 9498
9898
99*97 (JMP)
97 (JMP)
-Rural access (%) 4384
8484
84*77 (JMP)
77 (JMP)
-Total access (%) (S) 7394
93.894
94*89 (JMP)
90(JMP)
Rate of Inaccessibility reduction for sanitationIRsan (%) = (S
i-S1990)/(100-S1990)- 77.8 77.0 77.8 77.8*
2013 figures are estimatedTargets are achieved based on national and JMP improved water supply and sanitation definitions
Sources of verification:The data sources are: (i) the INS through censuses of 1974, 1984, 1994, 2004 and INS national survey on population and housing for 2009It is recommended to remove the institutional shortcomings of rural sanitation and extend the scope of ONAS rural or load another appropriate institution management, (iii) MDG 2011 report, AfDB, AEC, AU, and UNDP(data of 1990 and 2008), (iv) African Water Report to AU. Summit 31/01/2014 for WHO/UNICEF/JMP data.
PC. 4.1. Adaptation to Climate Change
Specific actions taken so far for the milestone (New initiatives to improve resilience):Developing a strategy, action plans and programs for implementationExistence of a National Climate Change Adaptation Strategy and Year of adoption: A national adaptation strategy of Tunisian agriculture and ecosystems to climate change (MARH, 2006) and a study on the protection of ecosystems and adaptation to climate change (ME, 2007), have been developed. This strategy is based on sectoral strategies related to water resources, ecosystems, agro-ecosystems and the agricultural sector as a whole. This strategy was adopted.
Target: Develop and implement, at least 1 Climate Change Adaptation Strategy by 2015.
Existence of Actions Plans on Water for Climate Change resilience:Action plans and implementation of this strategy based on: (i) the control of excess water in wet years by the development of surface storage techniques (structural design for a multi-year adjustment) and underground (recharge of ground water), (ii) the future management / risk management, focusing mainly on the mobilization of new resources, optimizing management, water conservation, rationalization and enhancement of water, (iii) and concrete measures for the development of legislation, institutional, and especially the strengthening of modest capacity to adapt to climate change. It is a series of action plans for drought, flooding, water quality, protection of wetlands, coastal management ...

135
Annexes
Tunisia 2012 State of the Water Report
MEW
INA
Existence of Programmes for implementing the Actions plans: Detailed activities programs for the implementation of action plans exist, they are broken down by component:1)climate: (i) establishment of a monitoring system based on climate and remote sensing early warning to the farm level, (ii) implementation of a System for Collecting Real Time Hydrological measurements and Announcement Flood Tunisian wadis (SYCOHTRAC) (iii) dissemination of information in the form of climate indices in all economic sectors, (iv) conduct a study on the sustainable management of water resources in Tunisia (OTEDD) (v) conduct a study on early warning system for the management of risks to climate extremes and climate change in Tunisia.2) water resources: (i) revise the Water Code and commit to implement it rigorously to protect water resources and taking into consideration the climate change, (ii) further review the water pricing by taking into account the conservation of ecosystem services.3) ecosystems: (i) continue the program of water management - however by ecosystem, rather than by watershed - to take into account the environmental benefits of these services(4) agricultural systems: (i) rigorously enforce the planned agricultural map (use of land and crops) while adapting to future climate change.A system of M & E for adaptation to climate change (case of agriculture) is being implemented by OTEDD.
Sources of verification and Specific comments:Sources of verification are: (i) for climate: MA, DGRE, INM, OTEDD (ii) for water resources: MA, DGRE, BIRH, SONEDE, DGGREE (iii) for ecosystems: MA, ME (iv) and for agricultural systems: MA, DGPA, CRDA.
PC. 4.2. Water-related Hazards
Specific actions taken so far for the milestone (water disaster prevention initiatives):There is a national committee to fight against natural disasters and to organize rescue efforts. There is also a regional committee for combating water related hazards in each governorate. These committees have operations manuals and plans for disaster preparedness and disaster management.
Target: Establish at least 1 Early warning System for disaster prevention at national level by 2015.
Existence of Early Warning Disaster prevention System and Year of establishment:o For the prevention and management of flood risks, the DGRE has put in place in 2008, a system to collect hydrological measurements in real time and announcements of flood in Tunisian wadis (SYCOHTRAC). This system allows the acquisition, collection, processing and dissemination of information in real time, enabling a quick decision during heavy rainfall and floods. It is a network of operational alert for a good understanding of climatic events, providing early warnings for the protection of property and persons against the devastating effects of extreme events. It includes :( i) a network of 130 automatic observation stations for measuring rainfall and water levels in wadis and dams, powered by solar panels. It is equipped with data acquisition system that stores collected information and transmitting the information via (GSM) modules with capture, storage
and transmission of data through the network mobile (GSM) (ii) eleven call centers and data retrieval based on the DGRE, DGBGTH, and the CRDA (iii) and a computer system (WINMONI) for managing the stations, alarming and gathering and validating the data in the data base SYCOHTRAC. The SYCOHTRAC is also a tool for decision support that allows the consultation and data visualization in real time. A software program (PHy) (rainfall, Hydrometry) allows the access to the database through the WEB technology via the intranet network (AGRINET) of MA allowing operators and decision-maker to: (i) check the database under tabular and / or graphical forms, (ii) editing the rainfall or hydrological sheets, (iii) and take immediate and adequate decisions.
o In addition, the AMU countries have established a Maghrebian observatory for the drought, which is a part of the drought early warning system (SMAS) project. The objectives are: the prevention of environmental degradation caused by drought, improving the diagnosis capabilities of the drought crisis and the development of adaptation strategies to reduce the impact of drought using an early warning system (EWS) allowing a regular monitoring of environmental change in the Maghreb countries, and strengthening institutional ability for early warning and drought risk management. The expected results are: (i) the production of indicators of structural and economic vulnerabilities in each country, (ii) the development of structural vulnerability maps, (iii) the integration of EWS products in development plans, (iv) and spreading of EWS products on the Web. The current monitoring tools for measuring the drought impacts, in Tunisia are: (i) meteorological indicators (compared to normal, deciles, or standard precipitation index SPI, reflecting periods of deficit and excess rainfall), agronomic indicators, socio-economic indicators, hydrological, ecological, and socio-economic (ii) remote sensing, (iii) and climate forecasts.

136 Tunisia 2012 State of the Water Report
MEW
INA
o Similarly, the DHMPE of the Ministry of Health is also working very hard at the prevention and management of health risks associated with water and the environment in case of natural disasters. Regarding the monitoring of the state of drought in different meteorological stations in the country, INM develops cards of Standard Precipitation Index (SPI); the mapping of this index shows the areas that are affected by drought.
-Elements of risk knowledge are: Sectoral studies, documents and guides exist as guide of the sustainable management of water resources, drought guide, and management of extreme climate change. They clarify the risks and provide appropriate responses and mitigation strategies to address a specific risk. Observation networks and monitoring of specific indicators and early warning systems help to know the risks.
- Elements of the Monitoring, analysis and prediction of risks: Monitoring, analysis and forecasts of the risks are conducted with a monitoring and information system.-Elements of the Communication or dissemination of alerts and warnings: Alerts and warnings are communicated or distributed according to an agreed communication strategy on risk management. All channels of monitoring and information can be used.
-Elements of local capacity to respond to the warnings received: There are emergency plans and supporting infrastructure at multiple levels.-Sources of verification and specific comments: national committee to fight against natural disasters and rescue organization and the regional committees in each governorate.
PC. 5.1. Institutional arrangementsPC. 5.2. Ethics, transparency, empowerment
Specific actions taken so far for the milestone: - Restructuring of BPHE, revision of the Water Code, establishment of the national Water Council ,workshop to launch and implement the development project of SINEAU (26/03/2013) ,national consultation workshop on the review and analysis of the state of implementation of strategies and / or action plans for wastewater in Tunisia (05/03/2013), water table on the water local management (25/12/2013), local governance legal framework of water in Tunisia (27/05/2014),consultation workshop on governance and financing of water sector (18/02/2014) ...
PC. 5.3. Public and private roles
PC. 5.4. Right to water
PC. 5.5. Regulatory approaches
Existence of policies and reforms of the water, and when the last update: in reference to the following documents:
-WATER 21 - Study of the water sector in Tunisia long-term 2030 (MARH 1998)- PISEAU project 1 (2001-2007) followed by PISEAU 2 (2008-2014)- Study of the sustainable management of water resources (2008)- Revision and amendment of the Water Code. Bill revising and implementing decrees (2010-2014)
- Water Rights in the new constitution (Article 44) (2014)
Target: Institute/update, by 2015, water sector policy reforms that reflect good governance principles of:
-Existence of Water sector policy that reflects good governance principles, and Year of latest update:-The study of the water sector (1998) established the future strategic direction of the sector and laid the basis and the foundations of integrated water resources management (IWRM)The study recommends an integrated approach for the management of water resources and taking into consideration at the same time the management of groundwater and surface water, the management of the quantity and quality of water and the balanced participation between state and users. In addition, it recommends that while pursuing the mobilization of new water resources, a strategy of “demand management” should be conducted in order to reduce losses and protect the quality of water resources, improve the socio-economic effects for the use of water and to minimize environmental damage.
(i) Partnership commitment; (ii) ethics -transparency, equity and fairness; (iii) responsibility and accountability; (iv) inclusiveness, participation, predictability and responsiveness; and (v) coherence.
It seems that we are moving towards a future where allocations between the various water usages are optimized economically and the available water resources are used with an integrated manner. The principles and frameworks of management must ensure a transformation towards a sustainable and equitable solution for everyone.
The long-term strategic study of the water sector in Tunisia is based on the prediction of the resources for future mobilization projects and on the evolution of the demand for some socio-economic indicators...

137
Annexes
Tunisia 2012 State of the Water Report
MEW
INA
Given the limited water potential of the country, the increased needs will lead to a rigorous and sustainable integrated management of the resource by:(i) searching for new resources, (ii) the use of non-conventional waters (iii) improving the efficiency of water infrastructure and water conservation (iv) the management of water quality, preservation of the resource and the protection of ecosystems and the environment, (v) mitigation of extreme events (droughts and floods) (vi) the optimization of data collecting systems , accessibility to the information for everyone and the development of a water information system (vi) the development of a public-private-partnership (vii) the implementation of legislation and strengthening the responsibilities of the water management institutions(viii) and the search for tools and appropriate , innovative and diversified funding
- PISEAU also aims to: (a) promote the integrated management of water resources by (i) the establishment and implementation of an institutional framework and implementation of sectoral reforms to adopt a management demand (changes in tariff policy, new institutional arrangements), (ii) improving the capacity of government, GIC and private sector operators to manage resources in an efficient manner, and (iii) better real-time management of surface and groundwater, and (b) promote the conservation of water resources and environmental protection. PISEAU 1 is based on the following investment components: irrigation management, rural water supply, groundwater management, conservation of water resources and environmental protection, and capacity building. PISEAU 2 continues the investment in the same components. It supports the strengthening of the monitoring networks of water resources, the establishment of the: SINEAU, monitoring system for soil quality and pollution control , groundwater management, the conduct of pilot operations on rural sanitation and improving the quality and value of treated wastewater.
- The study of the water sector and PISEAU also recommended that the governance of water and sanitation must be improved.
Governance is a complex process that involves the participation at several levels beyond the state.The water governance has four main interrelated dimensions: (i) a social dimension that is equitable use of the resource, (ii) an environmental dimension that allows sustainable use of the resource and ecosystem integrity, (iii) an economic dimension: efficient use of the resource, the role of water in economic growth, and (iv) a political dimension to ensure that all stakeholders, users and citizens have equal access to water opportunities.
The characteristics of good governance are: efficiency, sustainability, participation, accountability, integration, ethics, motivation, transparency, fairness, consistency, openness, and communication.The keys for a good governance are: political will and public-private partnership with respect to the needs and dignity, regulations for the quality of services, service providers efficient and accountable, good policies, effective institutional structures, and public participation.- Revision and amendment of the Water Code. Bill revising and implementing decrees (2010-2014)
The new Water Code deals with the objectives and general principles, delimitation and preservation of public water domain, governance in the water sector, regimes to use the water, uses and water utilities, prevention and risks related to water, regime control and monitoring, and transitional and final provisions.- Water Rights in the new constitution (Article 44) (2014)Article 44: “The right to water is guaranteed. The water preservation and the rationalization of its operating is the responsibility of the State and the society. “
Elements on Partnership and commitment: ONAS has already initiated activities in partnership with the private sector for the operation of sanitation facilities (network, pumping stations and treatment plants). The rate of private sector involvement in the operation of the infrastructure was 12% in 2005, rose to 16% in 2011 and fell to 13% in 2012 and 2013. Similarly SONEDE intends financing, building and operating sea water desalination plant of Djerba by BOT concession contract.Elements on Ethics - transparency, equity and fairness:existence of legislative and regulatory frameworks

138 Tunisia 2012 State of the Water Report
MEW
INA
Elements on responsibility and accountability:each institution knows and accepts responsibility for his actions, existence of legislative and regulatory frameworksElements on inclusiveness, participation, predictability and responsiveness:Duty to respond to the need of the demand, clear objectives and impact assessment existence of manuals of procedures.Elements on Coherence:coherent frameworks Sources of verification:The documents mentioned above. However, it is necessary to update and consolidate the 2015 political reforms in the area of water and sanitation, which reflect the principles of good governance.
PC. 6.1. Financing Local Authorities
Targets:
-Allocate immediately at least 0.5 % of GDP to sanitation & hygiene.
Specific actions taken so far for the milestone:Water, sanitation and hygiene budget in recent years is still insufficient to achieve the targets.Achievement for GDP allocation: (MTDN) 1 TDN=0.627 $ on 27/03/2013
Years (i) 2008 2011 2012 2013
- GDP (A1)55 267.8(34.652911 109$)
64 730.6(40.586086 109$)
70 584.6*(44.256544 109$)
75 646.4*(47.430293 109$)
- Sanitation and Hygiene Budget (B1)
93.0(58.311 106$)
109.1(68.4057 106$)
91.5(57.3705 106$)
96.9(60.7563 106$)
Percentage of GDP for Sanitation and HygienegdpSH (%) = B1/A1
0.17 0.17 0.13 0.13
and
-Allocate immediately 5% of national budget for water & sanitation.
*2012 semi-final; 2013 provisional (Source INS)Sanitation data: Source ONAS 06/2014Hygiene data: Source DHMPE 30/06/2014Achievement for national budget allocation: (MTDN) 1 TDN=0.627 $ on 27/03/2013
Years (i) 2008 2011 2012 2013
- Total National Budget (A2)
16 068.3
(10 074.824 106$)
20 350.0
(12 759.45 106$)
25 551.0
(16 020.477 106$)
26 792.0
(16 798.584 106$)
- Water and Sanitation Budget (B2)
396.6
(248.6682 106$)
424.3
(266.0361 106$)
492.8
(308.9856 106$)
480.2
(301.0854 106$)
Percentage of national Budget to Water and Sanitation
BdgWS (%) = B2/A2
2.5 2.1 1.9 1.8
Sources of verification (i) For GDP and total national budget of the country, the source is INS (ii) Water, sanitation and hygiene budget, the data source is the Ministry of Finance, Ministry of Agriculture (GBO program), ONAS and DHMPE.Need to bring the percentage to 0.5% of GDP on hygiene and sanitation and to 5% the percentage of GDP national budget for water and sanitation.
PC. 6.2. Pricing Strategies
PC. 6.3.Pro-poor financing Strategies
Specific actions taken so far for the milestone:Describe the Water Tariff Structure: Minimum life line demand (l / person / day): 20 m 3/ connection / quarter or 45 l / person / day.Minimum salary of the population SMIG (48 hours per week): TDN 319,904 or $ 189.38.Rate (USD or EURO / local currency): 1 Tunisian dinar for $ 0.592 (24/06/14).

139
Annexes
Tunisia 2012 State of the Water Report
MEW
INA
Target: Set by 2015, water tariff system that addresses cross-subsidy and the need of poor.
Example for Indicator: Lifeline Water (l/ca/day): 100 Minimum salary of the population (TD/month): 319.9 For a hypothetical 5 persons family: water used = 100 l/c/d * 5 * 30 /1000= 15 m3
(minimum billed =20 m3) cost at 0.155 TD /m3 = 3.1 TD
% of minimum monthly income = 3.1/319.9 = 1 % < 3%
Target is met.Tariff Structure: The water tariff was adjusted 2 times in 2013. The first adjustment by decree of 13.06.2013 and the second by decree of 26.12.2013 (in force).
Consumption categories (m3/ quarter) Rate (local currency mls/m3 and USD/m3)
0-20 155 mls/m3 which is 0,09 USD/m3
21-40 270 which is 0,159
41-70 365 which is 0,216
71-100 665 which is 0,393
101-150 815 which is 0,482
151-500 1135 which is 0,672
≥ 501 1190 which is 0,704
Adjustments for cross-subsidy:
Adjustments Rate
Rural hydrants (Standpipes) 155 mls/m3 = 0,09 USD/m3
Tourism 1190 mls/m3 = 0,704 USD/m3
Fixed charges are in addition to this fee, the value is determined by the diameter of the counters: D15 (DT 4.400 / quarter), D20 (8.160), D30 (15.080), D40 (27.700), D60 and D80 (70.400), D100 (113.250) and D150 (295.000).This tariff reflects the equalization and access for the poor (social group) and encourages saving water.
Tariff for rural areas if any: Same price for Connecting Rural, while for the population served by hydrant, the price is social. Describe the sanitation services pricing if there is any:
Consumption categories (m3/quarter) Rate in millimes/m 3 and USD/m 3
0-20 17 mls/m3 = 0.010 USD/m3
21-40 28 mls/m3(0-20), 170 (21-40)
41-70 180 (0-20) then 285 (21-70)
71-100 285 (0-70) and 472 (71 - 100)
101-150 300 (0-70) then 490 (71-150)
>= 151 300 (0-70) then 606 (after 71)
Fixed charges (RF) to be added:• Tourism usage: RF = 8688 + 1080 mls/m 3
• Industrial usage and polluting activities: RF = 8688 + {617 mls/m 3: equipped & low pollution or 845 mls/m 3: average pollution or 845+410*Q mls/m3: heavy pollution}, Q = coefficient of pollution• Industrial usage not connected: {equipped and low pollution: 0 or polluter: RF = 8688 + 617 mls/m 3}• Administrative usage: RF = 8688 + 845 mls/m 3
• Other usages: commercial, professional or other: RF = 8688 + {Consumption <10 m 3/quarter: 574 mls/m 3 or consumption> 10 m 3/quarter: 717 mls/m 3}
Sources of verification:SONEDE for water billing and ONAS for sanitation billing

140 Tunisia 2012 State of the Water Report
MEW
INA
PC. 7.1. Education and capacity development
Target: To be identified.
Not to be reported.
PC. 7.2. Information
Target: Enhance by 2016, the national water and sanitation Monitoring, Evaluation and Reporting (M&E, &R) Systems in a way to be in line with the pan African M&E.
Specific actions taken so far for the milestone: - launching of the development project and establishment of SINEAU 26/03/2013 in Tunis.
- Strengthening of the existing monitoring and evaluation and reporting systems to be in line with the Pan African SE.Existence of national Water & Sanitation M&E, & R System, and Year of Establishment:-There is no ‘’declared’’ M&E&R water and sanitation national system, on the other hand some institutions have management sub-systems for the data from the water sector such as the SYGREAU for the DGRE, the COPEAU for the ANPE, the SISOLS for the DGACTA and the aggregate monitoring system of the water sector under implementation at the BPEH, while other institutions have simple databases.
-The SINEAU: the national information system on water, which presents a dynamic portal, must bring together all the existing and the future sub systems. A workshop on the development project and the establishment of SINEAU just took place on 26/3/2013 in Tunis.
Recent updates in the M&E System:
Items Year 1 Year 2 Year 3 Target year
- New incorporated elements(PISEAU 1 : 2001-2007)(PISEAU 2 : 2009-2014)
Study of the SYGREAU,COPEAU, SISols and other databases and data management system (SGD)
Study, design and development of the SINEAU
Study, design and development of the SINEAU
2007
-Improvement and harmonization of the existing sub management information systems existing at the regional and national level.-Establishment of a data management system (SGD) in a way to be in line with the Pan African M&E System ( AMCOW)to track the progress towards achieving the MGDs OMD .
Establishment of theSINEAU
2012-Tunisia’s water sector M&E Rapid Assessment Report-NWSAS Transboundary Rapid Assessment Report
Establishment of the SINEAU
2013-Development of a minimum set of indicators, standards and criteria for water & sanitation sector in
Establishment of the SINEAU
2014-National Baseline State of the Water Report- National Action Plan for SOW Reporting Mechanism Report
2014
(MEWINA project: 2012-2014)-Implementation of water resources M&E&R system at national level in line with the Pan African system-Establishment of MEWINA Project Management Unit-Operational MEWINA national focal unit
Tunisia-National state of the water monitoring and evaluation operational framework and guidelines
2015-2019
Drivers IWRM Governance improvement
Achievement of the targets
2015

141
Annexes
Tunisia 2012 State of the Water Report
MEW
INA
Elements of the pan African M&E incorporated:-Improvement, harmonization and strengthening of the existing sub management information systems (SMIS).- Establishment of a data management system in line with the Pan African system of monitoring and evaluation (AMCOW)
Sources of verification: DGRE/MA
PC. 7.3. Water and TechnologiesTarget: To be identified.
Not to be reported.
PC. 7.4. Professional Networks/ AssociationsTarget: To be identified.
• Not to be reported.
