tunable diode laser measurements of hydrothermal/volcanic co2 … · 2020-06-10 · m. pedone et...
TRANSCRIPT

Solid Earth, 5, 1209–1221, 2014
www.solid-earth.net/5/1209/2014/
doi:10.5194/se-5-1209-2014
© Author(s) 2014. CC Attribution 3.0 License.
Tunable diode laser measurements of hydrothermal/volcanic CO2
and implications for the global CO2 budget
M. Pedone1,2, A. Aiuppa1,2, G. Giudice2, F. Grassa2, V. Francofonte2, B. Bergsson1,3, and E. Ilyinskaya4
1DiSTeM, Università di Palermo, via Archirafi 36, 90123 Palermo, Italy2Istituto Nazionale di Geofisica e Vulcanologia, Sezione di Palermo, via Ugo La Malfa 153, 90146 Palermo, Italy3Icelandic Meteorological Office, Bústaðavegur 7, 150 Reykjavík, Iceland4British Geological Survey, Murchison House, West Mains Road, Edinburgh, EH9 3LA, UK
Correspondence to: M. Pedone ([email protected])
Received: 1 August 2014 – Published in Solid Earth Discuss.: 27 August 2014
Revised: 21 October 2014 – Accepted: 28 October 2014 – Published: 2 December 2014
Abstract. Quantifying the CO2 flux sustained by low-
temperature fumarolic fields in hydrothermal/volcanic envi-
ronments has remained a challenge, to date. Here, we ex-
plored the potential of a commercial infrared tunable laser
unit for quantifying such fumarolic volcanic/hydrothermal
CO2 fluxes. Our field tests were conducted between
April 2013 and March 2014 at Nea Kameni (Santorini,
Greece), Hekla and Krýsuvík (Iceland) and Vulcano (Aeo-
lian Islands, Italy). At these sites, the tunable laser was used
to measure the path-integrated CO2 mixing ratios along cross
sections of the fumaroles’ atmospheric plumes. By using a
tomographic post-processing routine, we then obtained, for
each manifestation, the contour maps of CO2 mixing ratios
in the plumes and, from their integration, the CO2 fluxes. The
calculated CO2 fluxes range from low (5.7± 0.9 t d−1; Krý-
suvík) to moderate (524± 108 t d−1; La Fossa crater, Vul-
cano). Overall, we suggest that the cumulative CO2 contri-
bution from weakly degassing volcanoes in the hydrothermal
stage of activity may be significant at the global scale.
1 Introduction
The chemical composition of volcanic gas emissions can pro-
vide hints concerning the mechanisms of magma ascent, de-
gassing and eruption (Allard et al., 2005; Burton et al., 2007;
Oppenheimer et al., 2009, 2011), and can add useful infor-
mation for interpreting the dynamics of fluid circulation at
dormant volcanoes (Giggenbach, 1996; Chiodini et al., 2003,
2012).
Carbon dioxide (CO2) is, after water vapour, the main con-
stituent of volcanic (Giggenbach, 1996) and hydrothermal
(Chiodini et al., 2005) gases, and has attracted the atten-
tion of volcanologists because it can contribute to tracking
magma ascent prior to eruption (Aiuppa et al., 2007, 2010).
The volcanic/hydrothermal CO2 flux sustained by diffuse
soil degassing can be measured relatively easily during sur-
veys (Chiodini et al., 1996, 2005; Favara at al., 2001; Hernán-
dez, 2001; Cardellini et al., 2003; Inguaggiato et al., 2005,
2012; Pecoraino et al., 2005; Mazot et al., 2011) or with per-
manent installations (Brusca et al., 2004; Carapezza et al.,
2004; Werner and Cardellini, 2006; Inguaggiato et al., 2011).
In contrast, the volcanic CO2 flux contributed by open vents
and/or fumarolic fields is more difficult to measure, since
the volcanic CO2 gas signal is diluted – upon atmospheric
transport – into the overwhelming background air CO2 sig-
nal. Such volcanic CO2 flux emissions have been quanti-
fied for only ∼ 30 volcanic sources, based upon simultane-
ous measurement of SO2 fluxes (via UV spectroscopy) and
CO2/SO2 plume ratios (via direct sampling, Fourier trans-
form infrared (FTIR) spectroscopy, or the Multi-GAS; see
Published by Copernicus Publications on behalf of the European Geosciences Union.

1210 M. Pedone et al.: Tunable diode laser measurements of hydrothermal/volcanic CO2
Figure 1. The study areas. (a) Nea Kameni summit crater (Greece), (b) Hekla summit (Iceland), (c) Krýsuvík hydrothermal field, and
(d) La Fossa crater (Vulcano Island). In each picture, the positions of GasFinder and retro-reflectors are shown with letters and numbers,
respectively.
Burton et al., 2013). This methodology is however not ap-
plicable to the countless number of quiescent volcanoes with
low-temperature (SO2-free) emissions (Aiuppa et al., 2013).
As a consequence, the available data set of volcanic CO2
fluxes is still incomplete, making estimates of the global vol-
canic CO2 flux inaccurate (Burton et al., 2013).
In this paper, we discuss the use of tunable diode
laser spectrometers (TDLSs) for estimating vol-
canic/hydrothermal CO2 fluxes from quiescent volcanoes.
TDLSs are increasingly used in air monitoring (Gianfrani et
al., 1997a) and, more recently, for volcanic gas observations
(Gianfrani et al., 1997b, 2000; De Natale et al., 1998;
Richter, 2002). Pedone et al. (2014) recently reported
on the first direct observation of the volcanic CO2 flux
from the fumaroles of the Campi Flegrei (the Phlegraean
Fields, southern Italy), by using a portable tunable diode
laser (TDL) system. Here we extend this previous work,
discussing the results of TDL observations at four additional
quiescent volcanoes: Nea Kameni (Santorini, Greece),
Hekla and Krýsuvík (Iceland), and Vulcano Island (Aeolian
Islands, Italy) (Fig. 1). We selected these volcanoes because
they display a range of fumarolic activity from weak
(Krýsuvík, Hekla) to moderate (Vulcano Island). While
there is strong argument for the global volcanic CO2 budget
being dominated by a relatively small number of strong
emitters (Shinohara, 2013), weakly degassing volcanoes
dominate – at least in number – the population of historically
active volcanoes on Earth. This study contributes to better
characterizing the typical levels of CO2 emission from such
feeble volcanic point sources.
2 Background
Santorini, the site of the famous Minoan eruption ∼ 3600 yr
ago (Druitt et al., 1999), is an island located in the Aegean
Sea, part of the Cyclades Archipelago. Santorini has a sur-
face of 75.8 km2 and is presently made up of five islands
(Thera, Therasia, Aspronisi, Palea Kameni and Nea Ka-
meni) that constitute the active intra-caldera volcanic field
(Dominey-Howes and Minos-Minopulos, 2004). Four peri-
ods of unrest in the 20th century have culminated into small-
scale eruptions in 1925–1926, 1928, 1939–1941 and 1950
(Fyticas et al., 1990). Outside the caldera, volcanic activ-
ity has been recorded in AD 1649–1650, in the Kolumbo
submarine volcano (Vougioukalakis et al., 1994). Since the
last eruption in 1950, the volcano has remained quiescent
(Tsapanos et al., 1994; Papazakos et al., 2005; ISMOSAV,
2009). In early 2011, geodetic monitoring revealed a new
Solid Earth, 5, 1209–1221, 2014 www.solid-earth.net/5/1209/2014/

M. Pedone et al.: Tunable diode laser measurements of hydrothermal/volcanic CO2 1211
Figure 2. Output of the tomographic algorithm, and example for the Nea Kameni campaign, 9 April 2013 is shown. (a) Geometric recon-
struction of the field experimental set-up and (b) tomographic matrix. The script uses a data inversion procedure to assign an averaged CO2
mixing ratio (in ppm) to each cell of the matrix. (c) CO2 mixing ratios (ppm) contour map. GasFinder and retro-reflectors positions are
shown with letters and numbers, respectively. “Fum4”, “Fum5” and “Fum6” are the positions of main degassing vents; blue triangles are the
permanent INGV-PA stations; the red arrow depicts the principal direction of plume dispersal.
stage of caldera-wide uplift (Newman et al., 2012; Parks et
al., 2012), accompanied by swarms of shallow earthquakes.
This unrest lasted from January 2011 to April 2012 (Parks
et al., 2013). Degassing activity at Santorini is currently con-
centrated in a small, hydrothermally altered area on top of
Nea Kameni islet (Parks et al., 2013), where a number of
weakly fuming fumaroles (mostly CO2, water vapour and
air-derived gases; temperatures of 93–97 ◦C) are concen-
trated (Tassi et al., 2013). A recent survey carried out by
Parks et al. (2013) indicated increased diffuse CO2 emis-
sions between September 2010 and January 2012; this period
was characterized by a change in the degassing pattern, with
an increase in soil CO2 emissions peaking at 38± 6 t d−1 in
January 2012 (Parks et al., 2013). Tassi et al. (2013) exam-
ined the response of fumarole composition to the 2011–2012
unrest, and reported increasing CO2 concentrations (and de-
creasing δ13C–CO2) from May 2011 to February 2012, sug-
gesting increased mantle CO2 contribution. During the sur-
vey on 9 April 2013, we investigated the central portion
of the soil CO2 degassing structure identified by Parks et
al. (2013), right on top of the most actively degassing Nea
Kameni summit crater (Figs. 1a and 2).
Hekla is one of the most active volcanoes in Europe. Its
historical volcanic activity, petrology and geochemistry of
volcanic rocks have been the subject of several studies (e.g.
Thorarinsson, 1967; Sigmarsson, 1992). Hekla (63.98◦ N,
19.70◦W; 1490 m a.s.l) is located in the southern part of Ice-
land at the intersection of the South Iceland Fracture Zone
and the Eastern Volcanic Zone (Thordarsson and Larsen,
2007 and references therein). Five Plinian eruptions have
been identified in the historical record, most recently in
AD 1104 (Thorarinsson, 1967; Larsen et al., 1999). In re-
cent decades, Hekla has erupted frequently, at an average
rate of one eruption per decade, and most recently in 2000
(Höskuldsson et al., 2007). Gas information has long re-
mained missing, because Hekla appears to be only degassing
during eruptions. Very recently, Ilyinskaya et al. (2014) iden-
tified a weakly degassing, warm ground on the summit of
www.solid-earth.net/5/1209/2014/ Solid Earth, 5, 1209–1221, 2014

1212 M. Pedone et al.: Tunable diode laser measurements of hydrothermal/volcanic CO2
Table 1. CO2 fluxes (in t d−1) and standard deviation (1σ ) calculated in this study. The survey duration (in h), the number of CO2 readings
(with R2> 0.95), and the plume vertical transport speed (in m s−1) are also given for each site.
Volcano Date Survey Number of Gas speed (m s−1 ) CO2 flux (t d−1)
duration (h) readings (±1 σ ) (±1 σ )
Nea Kameni 9 April 2013 4 1070 1.20± 0.4 63± 22
Hekla 2 July 2013 1 985 1.00± 0.5 15± 7
Krýsuvík 5 July 2013 1.5 1150 1.17± 0.18 5.7± 0.9
Vulcano 11 March 2014 2 1757 1.00± 0.20 524± 108
the Hekla 1980–1981 crater (Fig. 1b), and studied the com-
position of this gas using data from a permanent Multi-GAS
instrument and field campaigns using an accumulation cham-
ber installed by INGV-PA (Istituto Nazionale di Geofisica e
Vulcanologia, Sezione di Palermo) and IMO (Icelandic Me-
teorological Office) in 2012. These authors provided evi-
dence for this gas spot being the only current surface mani-
festation at Hekla. This degassing field was therefore the site
of our measurement survey with the TDL on 2 July 2013 (see
Fig. 1b).
Krýsuvík (Fig. 1c) is one of five presently active geother-
mal areas on the Reykjanes Peninsula, in Iceland (Markússon
and Stefansson, 2011). Geothermal activity at Krýsuvík in-
cludes hot grounds, steaming vents, steam-heated hot springs
and mud pots, and pervasive surface alteration. The most im-
portant surface manifestations are confined to the Sveifluháls
area, including Austurengjahver and the small areas of Seltún
and Hveradalur (Markússon et al., 2011). On 5 July 2013, we
performed TDL observations in Hveradalur (63◦53, 449′ N,
22◦4, 190′W; Fig. 1c). This area included two major fu-
marolic manifestations (indicated as “FumA” and “FumB”
in our study. The fumarolic vent “FumA” is monitored by a
permanent Multi-GAS instrument deployed in a joint moni-
toring program led by the British Geological Survey (BGS),
INGV and IMO.
Vulcano is a volcanic island belonging to the Aeolian Is-
lands in the southern Tyrrhenian Sea (Italy). Since the last
eruption in 1888–1990, this closed-conduit volcanic system
has been characterized by intense fumarolic activity concen-
trated on the summit of La Fossa crater (Fig. 1d), a small
(391 m a.s.l.; 2 km in diameter) < 5 ka old pyroclastic cone.
Degassing activity has shown signs of intensification in the
last few decades, including increased fumarole temperatures
(Badalamenti et al., 1991; Chiodini et al., 1995; Capasso et
al., 1997), and episodic variations of gas/steam ratios (Chio-
dini et al., 1996; Capasso et al., 1999; Paonita et al., 2002,
2013). The CO2 flux from the La Fossa fumarolic field has
been measured previously by Aiuppa et al. (2005, 2006), Mc-
Gonigle et al. (2008), Tamburello et al. (2011) and Inguag-
giato et al. (2012). On 11 March 2014, we measured the CO2
emissions from La Fossa using the measurement configura-
tion of Fig. 1d.
3 Methods
The tunable diode laser spectroscopy technique (TDLS) re-
lies on measuring the absorbance due to the absorption of
IR radiation (at specific wavelengths) by a target gas. Like
in previous work at Campi Flegrei (Pedone et al., 2014),
we used a GasFinder 2.0 Tunable Diode Laser (produced by
Boreal Laser Inc.), a transmitter/receiver unit that can mea-
sure CO2 mixing ratios over linear open paths of up to 1 km
distance, operating in the 1.3–1.7 µm wavelength range. Ra-
diation emitted by the IR laser transmitter propagates to a
gold plated retro-reflector mirror, where it is reflected back
to the receiver and focused onto a photodiode detector. In-
coming light is converted into an electrical waveform, and
processed to determine in real-time the linear CO2 column
amount (in ppm×m) along the optical path, using the pro-
cedure described in Tulip (1997). CO2 column amounts are
converted into average CO2 mixing ratios (in ppm) along the
path by knowledge of path lengths (measured with an IR
manual telemeter, 1 m resolution). A portable meteorological
station was continuously recording (frequency= 1 Hz) dur-
ing the measurements to restrict post-processing to sampling
intervals characterized by similar meteorological conditions.
Instrumental accuracy is evaluated using a correlation coef-
ficient (R2), which is a measure of the similarity between
the waveforms of the sample and reference signals. Accord-
ing to the manufacturer’s data sheets, an accuracy of±2 % is
achieved for R2> 0.95 (Trottier et al., 2009).
In the field, the GasFinder was set to measure CO2 mixing
ratios at a 1 Hz rate (Pedone et al., 2014). Alignment between
the laser unit and the retro-reflector mirror was optimized
using a red visible aiming laser and a sighting scope. The
size of the retro-reflector mirror was chosen as to adjust the
returning light level to a desired value, depending on the path
length and the expected amount of absorbed radiation.
4 Results and discussions
4.1 Field operations
The GasFinder operated for more than 10 h during the
four field campaigns (more than 4 h at Nea Kameni on
9 April 2013; 1 h at Hekla on 2 July 2013; 1.5 h at
Solid Earth, 5, 1209–1221, 2014 www.solid-earth.net/5/1209/2014/

M. Pedone et al.: Tunable diode laser measurements of hydrothermal/volcanic CO2 1213
Figure 3. Time series of CO2 mixing ratios (ppm) and meteoro-
logical conditions for the Nea Kameni example (∼ 4 h of observa-
tions). The meteorological measurements were acquired from the
INGV-type station temporarily installed on the summit crater (ex-
cept wind speed, which was measured using a portable weather
station). T case: temperature inside the station (◦C); T air: out-
side air temperature (◦C); Wind dir: wind direction (◦ N); Wind
Speed: average wind speed (0.2 m s−1, blue line) during field oper-
ation; dashed black line: CO2 background average. CO2 measure-
ments at plume margins, oscillating close to the background values,
are plotted. In-plume cross sections (CO2 mixing ratios peaking at
∼ 600 ppm) are shown. CO2 average values (ppm) for each laser-
mirror path are also given. The right vertical axis refers to the mete-
orological parameters (blue units, range of 0–1, for the wind speed;
black units, range of 0–200, for the air and case temperature, and
wind direction).
Krýsuvík on 5 July 2013; and more than 2 h at Vulcano on
11 March 2014, Table 1). Measuring at 1 Hz, the GasFinder
acquired more than 9000 readings of path-integrated CO2
mixing ratios. However, we concentrate here onto a subset of
data (1070 readings for Nea Kameni; 985 readings for Hekla;
1150 readings for Krýsuvík; and 1757 for Vulcano Island,
Table 1), extracted from the original data set based on data
quality criteria (the same described in Pedone et al., 2014):
we selected readings characterized by high accuracy (R2 val-
ues > 0.95, optimal light values), and taken during phases of
stable wind direction and speed.
The environmental parameters were monitored using a
portable weather station, equipped with a data logger, that
was temporarily installed in each of the survey sites. As an
example, Fig. 3 shows time series of CO2 mixing ratios (ac-
quired by the TDL) and ambient parameters (air temperature,
temperature inside the station, and wind speed/direction)
recorded by the meteorological station, during 4 h of acqui-
sition at Nea Kameni (Fig. 3, Table 1). Wind was nearly
absent and stable (mean speed, ∼ 0.2 m s−1; blue line in
Fig. 3) during the time covered by TDL observations, mak-
ing conditions ideal for TDL operations (especially for ac-
curate quantification of plume transport speed; see below).
Northern trending winds prevailed during the field campaign
at Nea Kameni (red arrow in Fig. 2); southern trending winds
Figure 4. Contour map of CO2 mixing ratios (ppm), Hekla cam-
paign of 2 July 2013. GasFinder and retro-reflector positions are
shown with letters and numbers, respectively. Blue triangle: INGV-
PA/IMO station; red arrow: principal direction of plume dispersal.
at Hekla (red arrow in Fig. 4); and north-western trending
winds at both Krýsuvík (red arrows in Fig. 5) and La Fossa
crater at Vulcano Island (red arrow in Fig. 6).
Figure 1 shows the GasFinder operational field set-up at
the four volcanoes. In each picture, the GasFinder unit po-
sitions are expressed by letters; while retro-reflectors posi-
tions are expressed by numbers (Fig. 1). During each cam-
paign, and at each of the degassing areas, the position of the
GasFinder unit was sequentially moved (e.g. from positions
A to F in Fig. 1a) so as to scan the plume from different
viewing directions and angles. We acquired along each sin-
gle GasFinder–retro-reflector path (e.g. path A-1 in Fig. 1a)
for ∼ 4–5 min, before rotating the instrument head to mea-
sure along the subsequent path (e.g. A-2). The number of
operated paths ranged from 9 (Hekla) to 36 (Nea Kameni
and Vulcano), and the entire measurement grid (i.e. the to-
tal number of possible GasFinder–retro-reflector paths) was
covered in a few h at most.
4.2 CO2 mixing ratios and plume transport speed
The highest CO2 mixing ratios (∼ 1050 ppm) were measured
at Hekla (Fig. 4), while the lowest mixing ratios values were
www.solid-earth.net/5/1209/2014/ Solid Earth, 5, 1209–1221, 2014

1214 M. Pedone et al.: Tunable diode laser measurements of hydrothermal/volcanic CO2
Figure 5. CO2 Contour map of CO2 mixing ratios (ppm), Krýsu-
vík campaign of 5 July 2013. GasFinder and retro-reflectors posi-
tions are shown with letters and numbers, respectively. “FumA” and
“FumB”: positions of main degassing vents; blue triangle: INGV-
PA/IMO station; red arrow: principal direction of plume dispersal.
detected at Nea Kameni and Krýsuvík (peaking at 590 ppm
and< 500 ppm, respectively, see Figs. 2 and 5). Intermediate
CO2 mixing ratios (∼ 900 ppm) were detected at La Fossa
crater at Vulcano Island (Fig. 6), reflecting gas contributions
from fumarolic vents located on the rim and in the inner wall
of the crater.
Background readings were obtained in each of the mea-
surement sites by pointing the laser beam toward a mir-
ror, positioned upwind of the fumarolic area (Pedone et al.,
2014). Background values of< 400 ppm were observed in all
the analysed areas (Figs. 2–6).
During each campaign, the vertical plume transport speed
was measured by a video camera pointing toward the fu-
marolic vents, and acquiring sequences of images of each
Figure 6. Contour map of CO2 mixing ratios (ppm), La Fossa
campaign, Vulcano Island, 11 March 2014. GasFinder and retro-
reflectors positions are shown with letters and numbers, respec-
tively. Red arrow: principal direction of plume dispersal.
visible rising plume at 25 frames per second (see Aiuppa et
al., 2013; Pedone et al., 2014). The sequences of frames were
later post-processed to calculate the time-averaged plume
transport speed, after converting camera pixels into distances
(using a graduated pole, positioned close to the vent). Plume
transport vertical speeds are reported in Table 1, and con-
verge at 1–1.2 m s−1 at all volcanoes.
4.3 Contouring of in-plume CO2 mixing ratios
At each of the four volcanoes, we combined the available
set of path-integrated mixing ratio data to derive a two-
dimensional reconstruction of CO2 distribution (in ppm) in
the plume cross section, between the GasFinder position(s)
and the retro-reflectors.
In order to achieve this, we used a Matlab script (released
by the authors, and available on request; see Pedone et al.,
2014 for more details), to (i) create a matrix containing infor-
mation on the geometry of the experimental setup (an exam-
ple is given in Fig. 2 for Nea Kameni) and (ii) use this matrix
Solid Earth, 5, 1209–1221, 2014 www.solid-earth.net/5/1209/2014/

M. Pedone et al.: Tunable diode laser measurements of hydrothermal/volcanic CO2 1215
to obtain a bi-dimensional reconstruction of CO2 concentra-
tions in a cross section of the atmospheric plumes, starting
from the raw GasFinder data set. In order to start the cal-
culations, the Matlab script was initialized with the coordi-
nates of the laser and retro-reflectors positions. The addi-
tional input data was a column vector, containing the mean
CO2 column amount (in ppm×m) obtained for the different
GasFinder–retro-reflector paths. With these inputs, the script
performed a data inversion using a least-squares method, pre-
viously described by Pedone et al. (2014). The geometric ma-
trix (Fig. 2a) generated by the Matlab algorithm, is a geomet-
ric reconstruction of the experimental set-up (the explored
space was divided into 16 equally sized cells; the cells sep-
arated by the red lines in Fig. 2a). The scripts used the data
inversion procedure to assign an averaged CO2 mixing ratio
(in ppm) to each cell of the 4× 4 matrix (the same 16 cells as
Fig. 2a). Using sets of synthetic data to test the algorithm, we
estimated an error of ≤ 3 % associated with these individual
cell mixing ratios.
The so-called tomographic matrix (Fig. 2b) was then inter-
polated with the Surfer software to obtain the contour maps
of Figs. 2c and 4–6. We used the point Kriging geo-statistical
method to interpolate the available data and produce an inter-
polated grid (Isaaks and Srivastava, 1989). Figure 2c is the
contour map of CO2 mixing ratios obtained at Nea Kameni.
This map (obtained by interpolation of the tomographic ma-
trix of Fig. 2b) shows the distribution of CO2 mixing ratios
in the roughly horizontal atmospheric cross section, cover-
ing the area between the GasFinder (A–F) and retro-reflector
(1–6) positions (Fig. 1a). The figure shows that, in spite of the
feeble degassing activity present, a CO2 plume is imaged by
our observations on the eastern, inner rim of the Nea Kameni
crater. Low CO2 mixing ratios (∼ 390 ppm) are outputted by
the Matlab routine on the north-western portion of the in-
vestigated area, while higher CO2 mixing ratios (from 490
to ∼ 540 ppm) are identified on the east, where the main gas
emission vents are located. The peak CO2 mixing ratio of
∼ 590 ppm is located in correspondence to one principal gas
vent (marked as “Fum6” in Fig. 2c).
Similar results have been obtained at Hekla, Krýsuvík and
Vulcano. Figure 4 is a contour map of CO2 mixing ratios at
the Hekla measurement site (Fig. 1b). Given the positioning
of GasFinder and retro-reflectors, the Matlab-derived contour
map is here relative to an hypothetical horizontal cross sec-
tion, taken at about 1 m height above the warm degassing
ground identified by Ilyinskaya et al. (2014) on the rim of
the 1980–1981 summit crater of Hekla (Figs. 1b and 4). In
this area, the background CO2 mixing ratio was evaluated at
around 400 ppm. The peak CO2 mixing ratio (∼ 1050 ppm)
was detected in the central portion of the investigated area, in
the same sector where the highest soil CO2 fluxes have been
observed (Ilyinskaya et al., 2014).
The CO2 contour map obtained at Krýsuvík is shown
in Fig. 5. In this area, CO2 mixing ratios ranged from
350–380 ppm at the periphery of the exhaling area, and up
Figure 7. Our TDL CO2 map for Nea Kameni volcano (same as
Fig. 2) compared with the soil CO2 flux map of Parks et al. (2013).
The study of Parks et al. (2013) covered a wider exhaling area that
contributes a diffuse CO2 output of 38± 6 t d−1 (in January 2012),
or ∼ 60 % of our 63± 22 t d−1 fumarolic CO2 output. Left, (mod-
ified from Parks et al., 2013): red square: survey area investigated
from Parks et al. (2013); blue square: our survey area; red dots: po-
sition of fumaroles (from Tassi et al., 2013); yellow box: the area
with elevated diffuse degassing (Parks et al., 2013 and Chiodini et
al., 1998); black dashed circles: summit craters.
to ∼ 500 ppm near the two main fumarolic vents (“FumA”
and “FumB” in Fig. 5).
The CO2 distribution map of La Fossa crater at Vulcano
Island is shown in Fig. 6. The highest CO2 mixing ratios (up
to 880 ppm; Fig. 6) were detected in correspondence of the
principal fumaroles (“F0”, “F5” and “F11”) of the crater rim
and the “FA” fumarolic field in the inner wall of the crater.
4.4 Calculation of the CO2 flux
The ability of the TDL to contour CO2 mixing ratios in a
volcanic gas plume cross section (Figs. 2–6) opens the way to
quantification of the fumarolic CO2 output from each of the
studied areas. In order to calculate the CO2 output from each
fumarolic area, we integrated each set of CO2 mixing ratio
values in each CO2 contour map (Figs. 2, and 4–6), to obtain
a CO2 integrated column amount (ICA) over the entire plume
cross section. This ICA was then multiplied by the vertical
plume transport speed, yielding a CO2 flux. The calculated
CO2 fluxes are listed, for each site and each campaign, in
Table 1. The accuracy (1σ ) of the mean flux estimates are
calculated from error propagation theory applied to both ICA
and plume transport vertical speed.
Applying this procedure to the contour map of Fig. 2,
we estimate a CO2 flux from Nea Kameni fumaroles of
63± 22 t d−1. This fumarolic output is ∼ 4 times higher than
the total diffuse discharge from the soils of 15.4 t d−1 re-
ported by Chiodini et al. (1998), and ∼ 1.5 times higher
than the soil CO2 output of 38± 6 t d−1 estimated (in Jan-
uary 2012) by Parks et al. (2013). One of the advantages of
using the Tunable Diode Laser is the possibility to capture
simultaneously the CO2 contributions from both diffuse soil
degassing and concentrated emissions (fumaroles). Our CO2
concentration map of Fig. 2, and the CO2 output we derive
www.solid-earth.net/5/1209/2014/ Solid Earth, 5, 1209–1221, 2014
1216 M. Pedone et al.: Tunable diode laser measurements of hydrothermal/volcanic CO2
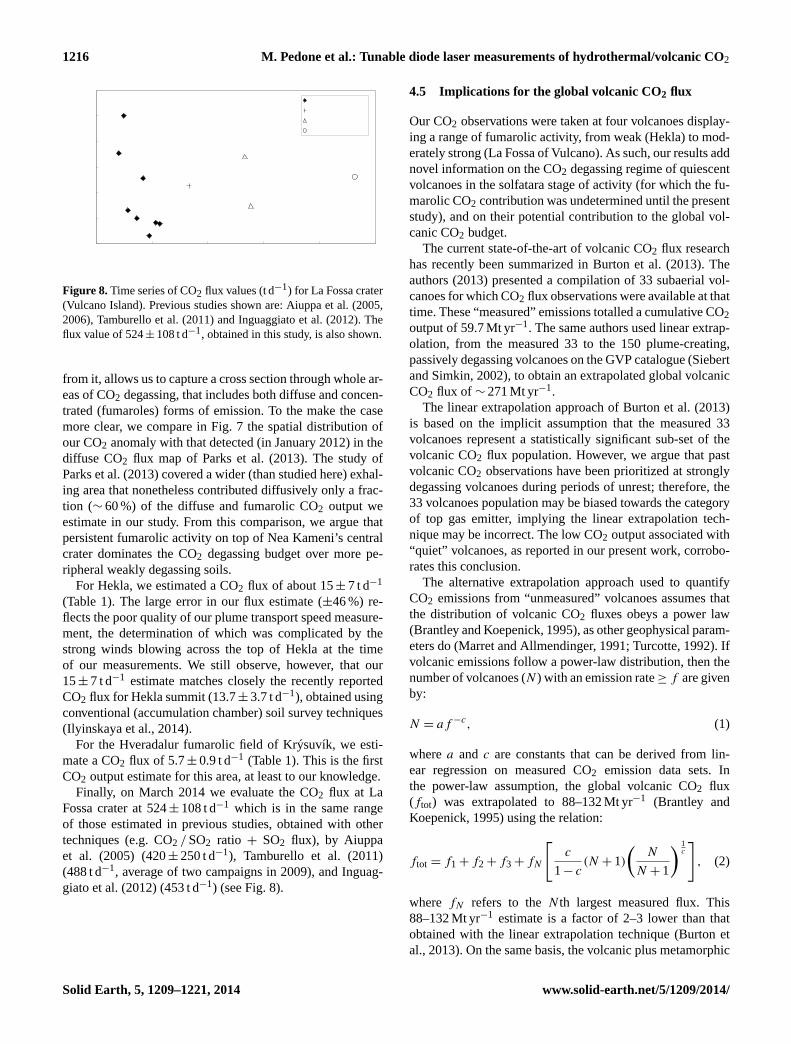
Figure 8. Time series of CO2 flux values (t d−1) for La Fossa crater
(Vulcano Island). Previous studies shown are: Aiuppa et al. (2005,
2006), Tamburello et al. (2011) and Inguaggiato et al. (2012). The
flux value of 524± 108 t d−1, obtained in this study, is also shown.
from it, allows us to capture a cross section through whole ar-
eas of CO2 degassing, that includes both diffuse and concen-
trated (fumaroles) forms of emission. To the make the case
more clear, we compare in Fig. 7 the spatial distribution of
our CO2 anomaly with that detected (in January 2012) in the
diffuse CO2 flux map of Parks et al. (2013). The study of
Parks et al. (2013) covered a wider (than studied here) exhal-
ing area that nonetheless contributed diffusively only a frac-
tion (∼ 60 %) of the diffuse and fumarolic CO2 output we
estimate in our study. From this comparison, we argue that
persistent fumarolic activity on top of Nea Kameni’s central
crater dominates the CO2 degassing budget over more pe-
ripheral weakly degassing soils.
For Hekla, we estimated a CO2 flux of about 15± 7 t d−1
(Table 1). The large error in our flux estimate (±46 %) re-
flects the poor quality of our plume transport speed measure-
ment, the determination of which was complicated by the
strong winds blowing across the top of Hekla at the time
of our measurements. We still observe, however, that our
15± 7 t d−1 estimate matches closely the recently reported
CO2 flux for Hekla summit (13.7± 3.7 t d−1), obtained using
conventional (accumulation chamber) soil survey techniques
(Ilyinskaya et al., 2014).
For the Hveradalur fumarolic field of Krýsuvík, we esti-
mate a CO2 flux of 5.7± 0.9 t d−1 (Table 1). This is the first
CO2 output estimate for this area, at least to our knowledge.
Finally, on March 2014 we evaluate the CO2 flux at La
Fossa crater at 524± 108 t d−1 which is in the same range
of those estimated in previous studies, obtained with other
techniques (e.g. CO2 /SO2 ratio + SO2 flux), by Aiuppa
et al. (2005) (420± 250 t d−1), Tamburello et al. (2011)
(488 t d−1, average of two campaigns in 2009), and Inguag-
giato et al. (2012) (453 t d−1) (see Fig. 8).
4.5 Implications for the global volcanic CO2 flux
Our CO2 observations were taken at four volcanoes display-
ing a range of fumarolic activity, from weak (Hekla) to mod-
erately strong (La Fossa of Vulcano). As such, our results add
novel information on the CO2 degassing regime of quiescent
volcanoes in the solfatara stage of activity (for which the fu-
marolic CO2 contribution was undetermined until the present
study), and on their potential contribution to the global vol-
canic CO2 budget.
The current state-of-the-art of volcanic CO2 flux research
has recently been summarized in Burton et al. (2013). The
authors (2013) presented a compilation of 33 subaerial vol-
canoes for which CO2 flux observations were available at that
time. These “measured” emissions totalled a cumulative CO2
output of 59.7 Mt yr−1. The same authors used linear extrap-
olation, from the measured 33 to the 150 plume-creating,
passively degassing volcanoes on the GVP catalogue (Siebert
and Simkin, 2002), to obtain an extrapolated global volcanic
CO2 flux of ∼ 271 Mt yr−1.
The linear extrapolation approach of Burton et al. (2013)
is based on the implicit assumption that the measured 33
volcanoes represent a statistically significant sub-set of the
volcanic CO2 flux population. However, we argue that past
volcanic CO2 observations have been prioritized at strongly
degassing volcanoes during periods of unrest; therefore, the
33 volcanoes population may be biased towards the category
of top gas emitter, implying the linear extrapolation tech-
nique may be incorrect. The low CO2 output associated with
“quiet” volcanoes, as reported in our present work, corrobo-
rates this conclusion.
The alternative extrapolation approach used to quantify
CO2 emissions from “unmeasured” volcanoes assumes that
the distribution of volcanic CO2 fluxes obeys a power law
(Brantley and Koepenick, 1995), as other geophysical param-
eters do (Marret and Allmendinger, 1991; Turcotte, 1992). If
volcanic emissions follow a power-law distribution, then the
number of volcanoes (N ) with an emission rate≥ f are given
by:
N = af−c, (1)
where a and c are constants that can be derived from lin-
ear regression on measured CO2 emission data sets. In
the power-law assumption, the global volcanic CO2 flux
(ftot) was extrapolated to 88–132 Mt yr−1 (Brantley and
Koepenick, 1995) using the relation:
ftot = f1+ f2+ f3+ fN
[c
1− c(N + 1)
(N
N + 1
) 1c
], (2)
where fN refers to the N th largest measured flux. This
88–132 Mt yr−1 estimate is a factor of 2–3 lower than that
obtained with the linear extrapolation technique (Burton et
al., 2013). On the same basis, the volcanic plus metamorphic
Solid Earth, 5, 1209–1221, 2014 www.solid-earth.net/5/1209/2014/
M. Pedone et al.: Tunable diode laser measurements of hydrothermal/volcanic CO2 1217
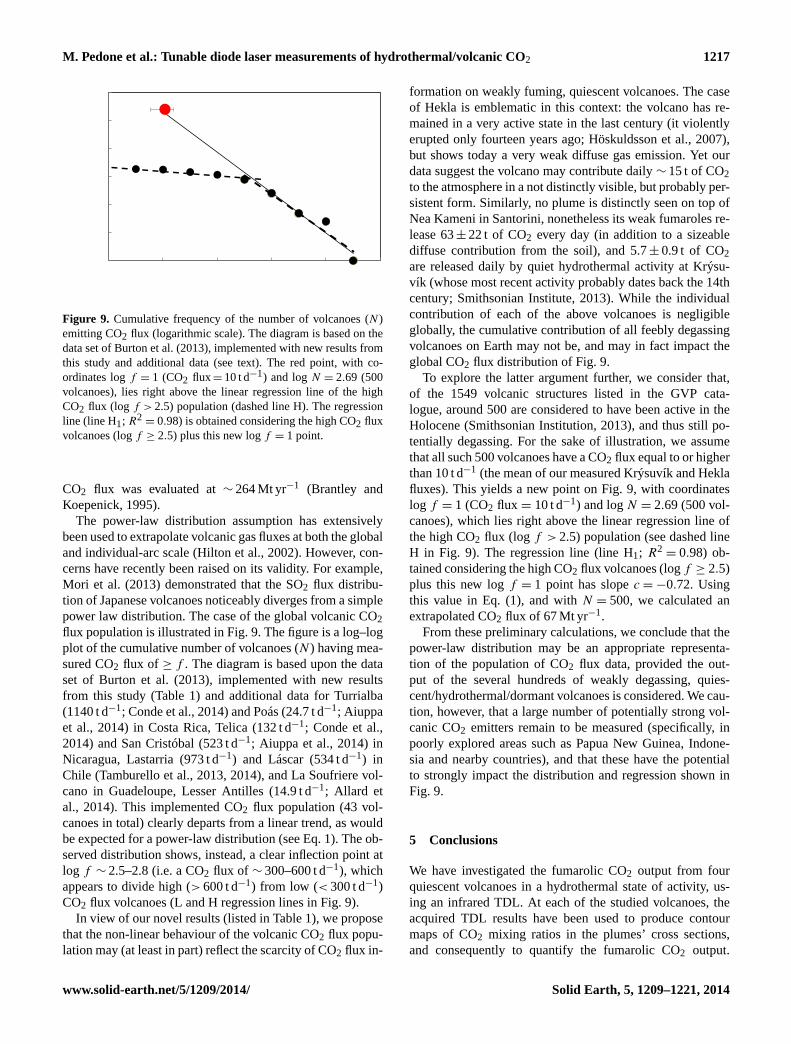
Figure 9. Cumulative frequency of the number of volcanoes (N )
emitting CO2 flux (logarithmic scale). The diagram is based on the
data set of Burton et al. (2013), implemented with new results from
this study and additional data (see text). The red point, with co-
ordinates log f = 1 (CO2 flux= 10 t d−1) and log N = 2.69 (500
volcanoes), lies right above the linear regression line of the high
CO2 flux (log f > 2.5) population (dashed line H). The regression
line (line H1; R2= 0.98) is obtained considering the high CO2 flux
volcanoes (log f ≥ 2.5) plus this new log f = 1 point.
CO2 flux was evaluated at ∼ 264 Mt yr−1 (Brantley and
Koepenick, 1995).
The power-law distribution assumption has extensively
been used to extrapolate volcanic gas fluxes at both the global
and individual-arc scale (Hilton et al., 2002). However, con-
cerns have recently been raised on its validity. For example,
Mori et al. (2013) demonstrated that the SO2 flux distribu-
tion of Japanese volcanoes noticeably diverges from a simple
power law distribution. The case of the global volcanic CO2
flux population is illustrated in Fig. 9. The figure is a log–log
plot of the cumulative number of volcanoes (N ) having mea-
sured CO2 flux of ≥ f . The diagram is based upon the data
set of Burton et al. (2013), implemented with new results
from this study (Table 1) and additional data for Turrialba
(1140 t d−1; Conde et al., 2014) and Poás (24.7 t d−1; Aiuppa
et al., 2014) in Costa Rica, Telica (132 t d−1; Conde et al.,
2014) and San Cristóbal (523 t d−1; Aiuppa et al., 2014) in
Nicaragua, Lastarria (973 t d−1) and Láscar (534 t d−1) in
Chile (Tamburello et al., 2013, 2014), and La Soufriere vol-
cano in Guadeloupe, Lesser Antilles (14.9 t d−1; Allard et
al., 2014). This implemented CO2 flux population (43 vol-
canoes in total) clearly departs from a linear trend, as would
be expected for a power-law distribution (see Eq. 1). The ob-
served distribution shows, instead, a clear inflection point at
log f ∼ 2.5–2.8 (i.e. a CO2 flux of ∼ 300–600 t d−1), which
appears to divide high (> 600 t d−1) from low (< 300 t d−1)
CO2 flux volcanoes (L and H regression lines in Fig. 9).
In view of our novel results (listed in Table 1), we propose
that the non-linear behaviour of the volcanic CO2 flux popu-
lation may (at least in part) reflect the scarcity of CO2 flux in-
formation on weakly fuming, quiescent volcanoes. The case
of Hekla is emblematic in this context: the volcano has re-
mained in a very active state in the last century (it violently
erupted only fourteen years ago; Höskuldsson et al., 2007),
but shows today a very weak diffuse gas emission. Yet our
data suggest the volcano may contribute daily ∼ 15 t of CO2
to the atmosphere in a not distinctly visible, but probably per-
sistent form. Similarly, no plume is distinctly seen on top of
Nea Kameni in Santorini, nonetheless its weak fumaroles re-
lease 63± 22 t of CO2 every day (in addition to a sizeable
diffuse contribution from the soil), and 5.7± 0.9 t of CO2
are released daily by quiet hydrothermal activity at Krýsu-
vík (whose most recent activity probably dates back the 14th
century; Smithsonian Institute, 2013). While the individual
contribution of each of the above volcanoes is negligible
globally, the cumulative contribution of all feebly degassing
volcanoes on Earth may not be, and may in fact impact the
global CO2 flux distribution of Fig. 9.
To explore the latter argument further, we consider that,
of the 1549 volcanic structures listed in the GVP cata-
logue, around 500 are considered to have been active in the
Holocene (Smithsonian Institution, 2013), and thus still po-
tentially degassing. For the sake of illustration, we assume
that all such 500 volcanoes have a CO2 flux equal to or higher
than 10 t d−1 (the mean of our measured Krýsuvík and Hekla
fluxes). This yields a new point on Fig. 9, with coordinates
log f = 1 (CO2 flux = 10 t d−1) and log N = 2.69 (500 vol-
canoes), which lies right above the linear regression line of
the high CO2 flux (log f > 2.5) population (see dashed line
H in Fig. 9). The regression line (line H1; R2= 0.98) ob-
tained considering the high CO2 flux volcanoes (log f ≥ 2.5)
plus this new log f = 1 point has slope c =−0.72. Using
this value in Eq. (1), and with N = 500, we calculated an
extrapolated CO2 flux of 67 Mt yr−1.
From these preliminary calculations, we conclude that the
power-law distribution may be an appropriate representa-
tion of the population of CO2 flux data, provided the out-
put of the several hundreds of weakly degassing, quies-
cent/hydrothermal/dormant volcanoes is considered. We cau-
tion, however, that a large number of potentially strong vol-
canic CO2 emitters remain to be measured (specifically, in
poorly explored areas such as Papua New Guinea, Indone-
sia and nearby countries), and that these have the potential
to strongly impact the distribution and regression shown in
Fig. 9.
5 Conclusions
We have investigated the fumarolic CO2 output from four
quiescent volcanoes in a hydrothermal state of activity, us-
ing an infrared TDL. At each of the studied volcanoes, the
acquired TDL results have been used to produce contour
maps of CO2 mixing ratios in the plumes’ cross sections,
and consequently to quantify the fumarolic CO2 output.
www.solid-earth.net/5/1209/2014/ Solid Earth, 5, 1209–1221, 2014

1218 M. Pedone et al.: Tunable diode laser measurements of hydrothermal/volcanic CO2
The highest output (524± 108 t d−1) is obtained at La Fossa
of Vulcano Island, the only volcano of the four where a
persistent atmospheric plume is observed. The lowest CO2
output (5.7± 0.9 t d−1) is associated with hydrothermal ac-
tivity at Krýsuvík, with intermediate emissions at Hekla
(15± 7 t d−1) and Nea Kameni (63± 22 t d−1). The latter
three volcanoes all currently display weak exhalative activity
rather than predominant plume emission. We therefore sug-
gest that a 5.7–63 t d−1 CO2 output range may be character-
istic of many of the ∼ 500 volcanoes active in the Holocene,
in spite of the majority lacking obvious surface manifes-
tations of degassing. Assuming a representative CO2 out-
put of 10 t d−1 for such 500 Holocene volcanoes, we argue
that the global population of CO2 emissions may approach a
simple power-law distribution. This conclusion will remain
somewhat speculative, however, until new measurements be-
come available for the several potentially strong volcanic
CO2 point sources (e.g. Papua New Guinea, Indonesia) that
are missing from the global CO2 data set.
Our results here suggest that the TDL technique can assist
CO2 output determinations at volcanoes covering a range of
activities and surface degassing manifestations. Compared to
other more consolidated gas sensing techniques (e.g. FTIR),
the TDL has the disadvantages that only one species (CO2
in our case) can be measured at same time (against multi-
species simultaneous detection by FTIR), and that no passive
measurement is possible (FTIR uses passive sources such as
the sun or hot rocks/magma). Advantages include, however,
lower cost (a commercial TDL is a factor of 2–3 cheaper than
FTIR), user-friendly operation and processing, and robust-
ness for use in harsh/aggressive volcanic environments. Our
results and that of Pedone et al. (2014) indicate, in particular,
that the GasFinder can operate in a variety of volcanic condi-
tions, provided the plume is not condensing and/or optically
thick (fog and/or other obstacles within the laser-mirror path
can reduce its functionality during field operations). Such
versatility and robustness, and the availability on the mar-
ket of pan-tilt units that can be interfaced to the GasFinder
to rapidly scan a target gas emission from a fixed position,
open new prospects for semi-continuous, automatic CO2 flux
observations. We suggest that, although measurements will
remain restricted to periods with stable meteorological con-
ditions and good visibility, semi-permanent TDL volcano in-
stallations may pave the way to acquisition of volcanic CO2
output time series with temporal resolution of 10 s of min-
utes.
Author contributions. M. Pedone carried out the field campaigns
in the study areas and drafted the manuscript. A. Aiuppa enabled
the realization of the study and actively contributed to drafting the
manuscript. G. Giudice participated and provided technical support
during field campaigns. F. Grassa provided important suggestions
during data processing. V. Francofonte provided technical assis-
tance during the field work. B. Bergsson and E. Ilyinskaya partici-
pated and provided technical support during field campaigns in Ice-
land. All authors read and approved the final manuscript.
Acknowledgements. The research leading to these results has
received funding from the European Research Council un-
der the European Union’s Seventh Framework Programme
(FP7/2007/2013)/ERC grant agreement no. 1305377, and from the
FP7 grant Futurevolc. The handling topical editor, Albert Galy,
and the reviewers, T. A. Mather and G. Williams-Jones, are
acknowledged for their constructive reviews. The authors would
like to acknowledge technical assistance from Boreal Laser Inc.,
in particular Michael Sosef. The authors also acknowledge IMO
(Icelandic Meteorological Office) staff, in particular Melissa Pfeffer
and Richard Yeo for support during field work. Nicolas Cristou
is thanked for technical assistance during the field campaign at
Santorini Island. Dario Gharehbaghian, a student at the University
of Bologna, and Lorenza Li Vigni, a student at the University of
Palermo, are acknowledged for their support during field work at
Vulcano Island.
Edited by: A. Galy
References
Aiuppa, A., Federico, C., Giudice, G., and Gurrieri, S.: Chemi-
cal mapping of a fumarolic field: La Fossa Crater, Vulcano Is-
land (Aeolian Islands, Italy), Geophys. Res. Lett., 32, L13309,
doi:10.1029/2005GL023207, 2005.
Aiuppa, A., Federico, C., Giudice, G., Gurrieri, S., and Valenza, M.:
Hydrothermal buffering of the SO2/H2S ratio in volcanic gases:
Evidence from La Fossa Crater fumarolic field, Vulcano Island,
Geophys. Res. Lett., 33, L21315, doi:10.1029/2006GL027730,
2006.
Aiuppa, A., Moretti, R., Federico, C., Giudice, G., Gurrieri, S., Li-
uzzo, M., Papale, P., Shinohara, H., and Valenza, M.: Forecasting
Etna eruptions by real-time observation of volcanic gas compo-
sition, Geology, 35, 1115–1118, 2007.
Aiuppa, A., Bertagnini, A., Métrich, N., Moretti, R., Di Muro, A.,
Liuzzo, M., and Tamburello, G.: A model of degassing for Strom-
boli volcano, Earth Planet. Sc. Lett., 295, 195–204, 2010.
Aiuppa, A., Tamburello, G., Di Napoli, R., Cardellini, C., Chiodini,
G., Giudice, G., Grassa, F., and Pedone, M.: First observations
of the fumarolic gas output from a restless caldera: Implications
for the current period of unrest (2005–2013) at Campi Flegrei,
Geochem. Geophy. Geosy., 14, 1525–2027, 2013.
Aiuppa, A., Robidoux, P., Tamburello, G., Conde, V., Galle, B.,
Avard, G., Bagnato, E., De Moor, M., Martinez, M., and Munoz,
A.: Gas measurements from the Costa Rica-Nicaragua volcanic
segment suggest possible along-arc variations in volcanic gas
chemistry, EPSL, 407, 134–147, 2014.
Allard, P., Burton, M., and Muré, F.: Spectroscopic evidence for
lava fountain driven by previously accumulated magmatic gas,
Nature, 433, 407–410, 2005.
Allard, P., Aiuppa, A., Beauducel, F., Calabrese, S., Di Napoli, R.,
Gaudin, D., Crispi, O., Parello, F., Hammouya, G., and Tambu-
rello, G.: Steam and gas emission rate from La Soufriere vol-
Solid Earth, 5, 1209–1221, 2014 www.solid-earth.net/5/1209/2014/

M. Pedone et al.: Tunable diode laser measurements of hydrothermal/volcanic CO2 1219
cano, Guadeloupe (Lesser Antilles): implications for the mag-
matic supply during degassing unrest, Chem. Geol., 384, 76–93,
2014.
Badalamenti, B., Chiodini, G., Cioni, R., Favara, R., Francofonte,
S., Gurrieri, S., Hauser, S., Inguaggiato, S., Italiano, F., Magro,
G., Nuccio, P. M., Parello, F., Pennisi, M., Romeo, L., Sortino,
F., Valenza, M., and Vurro, F.: Special field workshop at Vulcano
(Aeolian Islands) during summer 1998: geochemical result, Acta
Vulcanol., 1, 223–227, 1991.
Brantley, S. L. and Koepenick, K. W.: Measured carbon dioxide
emissions from Oldoinyo Lengai and shewed distribution of pas-
sive volcanic fluxes, Geology, 23, 933–936, 1995.
Brusca, L., Inguaggiato, S., Longo, M., Madonia, P., and
Maugeri, R.: The 2002-2003 eruption of Stromboli (Italy):
Evaluation of the volcano activity by means of continu-
ous monitoring of soil temperature, CO2 flux, and meteo-
rological parameters, Geochem. Geophy. Geosy., 5, Q12001,
doi:10.1029/2004GC000732, 2004.
Burton, M. R., Mader, H. M., and Polacci, M.: The role of gas per-
colation in quiescent degassing of persistently active basaltic vol-
canoes, Earth Planet. Sc. Lett., 264, 46–60, 2007.
Burton, M. R., Sawyer, G. M., and Granieri, D.: Deep Carbon Emis-
sions from Volcanoes, Rev. Mineral. Geochem., 75, 323–354,
2013.
Capasso, G., Favara, R., and Inguaggiato, S.: Chemical features and
isotopic composition of gaseous manifestations on Vulcano Is-
land (Aeolian Islands, Italy): an interpretative model of fluid cir-
culation, Geochim. Cosmochim. Ac., 61, 3425–3440, 1997.
Capasso, G., Favara, R., Francofonte, S., and Inguaggiato, S.:
Chemical and isotopic variations in fumarolic discharge and ther-
mal waters at Vulcano Island (Aeolian Islands, Italy) during
1996: evidence of resumed volcanic activity, J. Volcanol. Geoth.
Res., 88, 167–175, 1999.
Carapezza, M. L., Inguaggiato, S., Brusca, L., and Longo, M.: Geo-
chemical precursors of the activity of an open-conduit volcano:
The Stromboli 2002-2003 eruptive events, Geophys. Res. Lett.,
31, L07620, doi:10.1029/2004GL019614, 2004.
Cardellini, C., Chiodini, G., and Frondini, F.: Application of
stochastic simulation to CO2 flux from soil: Mapping and
quantification of gas release, J. Geophys. Res., 108, 2425,
doi:10.1029/2002JB002165, 2003.
Chiodini, G., Cioni, R., Marini, L., and Panichi, C.: Origin of the
fumarolic fluids of Vulcano Island, Italy and implications for vol-
canic sorveillance, B. Volcanol., 57, 99–110, 1995.
Chiodini, G., Frondini, F., and Raco, B.: Diffuse emission of CO2
from the Fossa crater, Vulcano Island (Italy), B. Volcanol., 58,
41–50, 1996.
Chiodini, G., Cioni, R., Guidi, M., Raco, B., and Marini, L.: Soil
CO2 flux measurements in volcanic and geothermal areas, Appl.
Geochem. 13, 543–552, 1998.
Chiodini, G., Todesco, M., Caliro, S., Del Gaudio, C., Macedonio,
G., and Russo, M.: Magma degassing as a trigger of bradyseismic
events; the case of Phlegrean Fields (Italy), Geophys. Res. Lett.,
30, 8, 1434, doi:10.1029/2002GL01679, 2003.
Chiodini, G., Granieri, D., Avino, R., Caliro, S., Costa, A., and
Werner, C.: Carbon dioxide diffuse deggasing and estimation of
heat release from volcanic and hydrothermal systems, J. Geo-
phys. Res., 110, B08204, doi:10.1029/2004JB003542, 2005.
Chiodini, G., Caliro, S., De Martino, P., Avino, R., and Ghepardi, F.:
Early signals of new volcanic unrest at Campi Flegrei caldera?,
Insights from geochemical data and physical simulations, Geol-
ogy, 40, 943–946, 2012.
Conde, V., Robidoux, P., Avard, G., Galle, B., Aiuppa, A., Muñoz,
A., and Giudice, G.: Measurements of SO2 and CO2 by
combining DOAS, Multi-GAS and FTIR: Study cases from
Turrialba and Telica volcanoes, Int. J. Earth Sci., in press,
doi:10.1007/s00531-014-1040-7, 2014.
De Natale, P., Gianfrani, L., De Natale, G., and Cioni, R.: Gas
concentration measurements with DFB lasers to monitor vol-
canic activity SPIE Proceedings Series, Applications of Photonic
Technology-3, 3491, 783–787, 1998.
Dominey-Howes, D. and Minos-Minopoulos, D.: Perceptions of
hazard and risk on Santorini, J. Volcanol. Geotherm. Res., 137,
285–310, 2004.
Druitt, T. H., Edwards, L., Mellors, R. M., Pyle, D. M., Sparks, R.
S. J., Lanphere, M., Davies, M., and Barreiro, B.: Santorini Vol-
cano, Memoirs, Geological Society, London, 19, 1–157, 1999.
Favara, R., Giammanco, S., Inguaggiato, S., and Pecoraino, G.:
Preliminary estimate of CO2 output from Pantelleria Island vol-
cano (Sicily, Italy): Evidence of active mantle degassing, Appl.
Geochem., 16, 883–894, 2001.
Fytikas, M., Kolios, N., and Vougioukalakis, G. E.: Post-Minoan
volcanic activity on the Santorini volcano. Volcanic hazard and
risk. Forecasting possibilities, in: Thera and the Aegean World
III Vol.2, edited by: Hardy, D. A., Keller, J., Galanopoulos, V.P.,
Flemming, N. C., and Druitt, T. H., The Thera Foundation, Lon-
don, 183–198, 1990.
Gianfrani, L., Gagliardi, G., Pesce, G., and Sasso, A.: High sensi-
tivity detection of NO2 by using a 740 nm semiconductor diode
laser, Appl. Phys., B64, 487–491, 1997a.
Gianfrani, L., Gabrysch, M., Corsi, C., and De Natale, P.: De-
tection of H2O and CO2 with destributed feedback diode
lasers: measurement of broadening coefficients and assessment
of the accuracy levels for volcanic monitoring, Appl. Optics, 36,
9481–9486, 1997b.
Gianfrani, L., De Natale, P., and De Natale, G.: Remote sensing of
volcanic gases with a DFB-laser-based fiber spectrometer, Appl.
Phys. B, 70, 467–470, 2000.
Giggenbach, W. F.: Chemical composition of volcanic gases in
Monitoring and Mitigation of Volcanic Hazards, in: Monitoring
and mitigation of volcano hazards, edited by Scarpa, R., Tilling,
R. I., Springer, Berlin, 221–256, 1996.
Hernández, P. A., Notsu, K., Salazar, J. M., Mori, T., Natale, G.,
Okada, H., Virgili, G., Shimoike, Y., Sato, M., and Pèrez, N. M.:
Carbon dioxide degassing by advective flow from Usu volcano,
Japan, Science, 292, 83–86, 2001.
Hilton, D. R., Fisher, T. P., and Marty, B.: Noble gases and volatile
recycling at subduction zones, Rev. Mineral. Geochem., 47,
319–370, 2002.
Höskuldsson, Á., Óskarsson, N., Pedersen, R., Grönvold, K.,
Vogfjörð, K., and Ólafsdóttir, R.: The millennium eruption of
Hekla in February 2000, B. Volcanol., 70, 169–182, 2007.
Ilyinskaya, E., Aiuppa, A., Bergsson, B., Di Napoli, R., Fridriksson,
T., Oladottir, A. A., Oskarsson, F., Grassa, F., Pfeffer, M., Lech-
ner, K., Yeo, R., and Giudice, G.: Degassing regime of Hekla
volcano 2012–2013, Geochim. Cosmochim. Ac., accepted, 2014.
www.solid-earth.net/5/1209/2014/ Solid Earth, 5, 1209–1221, 2014

1220 M. Pedone et al.: Tunable diode laser measurements of hydrothermal/volcanic CO2
Inguaggiato, S., Martin-Del Pozzo, A. L., Aguayo, A., Capasso, G.,
and Favara, R.: Isotopic, chemical and dissolved gas constraints
on spring water from Popocatépetl (Mexico): Evidence of gas-
water interaction magmatic component and shallow fluids, J. Vol-
canol. Geoth. Res., 141, 91–108, 2005.
Inguaggiato, S., Vita, F., Rouwet, D., Bobrowski, N., Morici, S., and
Sollami, A.: Geochemical evidence of the renewal of volcanic
activity inferred from CO2 soil and SO2 plume fluxes: The 2007
Stomboli eruption (Italy), B. Volcanol., 73, 443–456, 2011.
Inguaggiato, S., Mazot, A., Diliberto, I. S., Inguaggiato, C., Mado-
nia, P., Rouwet, D., and Vita, F.: Total CO2 output from Vulcano
island (Aeolian Islands, Italy), Geochem. Geophy. Geosy., 13,
Q02012, doi:10.1029/2011GC003920, 2012.
Isaaks, E. H. and Srivastava, R. M.: An Introduction to Applied
Geostatistics, Oxford University Press, New York, 561 pp., 1989.
ISMOSAV: Website of the Institute for the Study and Monitoring of
the Santorini Volcano, available at: http://ismosav.santorini.net/,
2009.
Larsen, G., Dugmore, A. J., and Newton, A. J.: Geochemistry of
historical-age silicic tephras in Iceland, Holocene, 9, 463–471,
1999.
Markússon, S. H. and Stefánsson, A.: Geothermal surface alteration
of basalts, Krýsuvík Iceland-alteration mineralogy, water chem-
istry and the effects of acid supply on the alteration process, J.
Volcanol. Geoth. Res., 206, 46–59, 2011.
Marret, R. and Almendinger, R. W.: Estimates of strain due to brit-
tle faulting: Sampling of fault populations, J. Struct. Geol., 13,
735–738, 1991.
Mazot, A., Rouwet, D., Taran, Y., Inguaggiato, S., and Varley, N.:
CO2 and He degassing at El Chichón volcano (Chiapas, Mex-
ico): Gas flux, origin, and relationship with local and regional
tectonics, B. Volcanol., 73, 423–441, 2011.
McGonigle, A. J. S., Aiuppa, A., Giudice, G., Tamburello, G., Hod-
son, A. J., and Gurrieri, S.: Unmanned aerial vehicle measure-
ments of volcanic carbon dioxide fluxes, Geophys. Res. Lett.,
35, L06303, doi:10.1029/2007GL032508, 2008.
Mori, T., Shinohara, H., Kazahaya, K., Hirabayashi, J., Matsushima,
T., Mori, T., Ohwada, M., Odai, M., Iino, H., and Miyashita, M.:
Time-averaged SO2 fluxes of subduction-zone volcanoes: Ex-
ample of a 32-year exhaustive survey for Japanese volcanoes, J.
Geophys. Res., 118, 8662–8674, 2013.
Newman, A. V., Stiros, S., Feng, L., Psimoulis, P., Moschas, F.,
Saltogianni, V., Jiang, Y., Papazachos, C., Panagiotopoulos, D.,
Karagianni, E., and Vamvakaris, D.: Recent geodetic unrest
at Santorini Caldera, Greece, Gephys. Res. Lett., 39, L06309,
doi:10.1029/2012GL051286, 2012.
Oppenheimer, C, Lomakina, A., Kyle, P. R., Kingsbury, N. G., and
Boichu, M.: Pulsatory magma supply to a phonolite lava lake,
Earth Planet. Sc. Lett. 284, 392–398, 2009.
Oppenheimer, C., Moretti, R., Kyle, P. R., Eschenbacher, A.,
Lowenstern, J. B., Hervig, R. L., and Dunber, N. W.: Mantle to
surface degassing of alkalic magmas at Erebus volcano, Antarc-
tica, Earth Planet. Sc. Lett., 306, 261–271, 2011.
Paonita, A., Favara, R., Nuccio, P. M., and Sortino, F.: Genesis of
fumarolic emissions as inferred by isotope mass balances: CO2
and water at Vulcano Island, Italy, Geochim. Cosmochim. Ac.,
66, 759–772, 2002.
Paonita, A., Federico, C., Bonfanti, P., Capasso, G., Inguaggiato,
S., Italiano, F., Madonia, P., Pecoraino, G., and Sortino, F.: The
episodic and abrupt geochemical changes at La Fossa fumaroles
(Vulcano Island, Italy) and related constraints on the dynamics,
structure, and compositions of the magmatic system, Geochim.
Cosmochim. Ac., 120, 158–178, 2013.
Papazachos, B. C., Dimitriadis, S. T., Panagiotopoulos, D. G., Pa-
pazachos, C. B., and Papadimitriou, E. E.: Deep structure and
active tectonics of the southern Aegean volcanic arc, Dev. Vol-
cano., 7, 47–64, 2005.
Parks, M. M., Biggs, J., England, P., Mather, T. A., Nomikou, P.,
Palamartchouk, K., Papanikolaou, X., Paradissis, D., Parsons, B.,
Pyle, D. M., Raptakis, C., and Zacharis, V.: Evolution of San-
torini volcano dominated by episodic and rapid fluxes of melt
from depth, Nat. Geosci., 5, 749–754, 2012.
Parks, M. M., Caliro, S., Chiodini, G., Pyle, D. M., Mather, T.
A., Berlo, K., Edmonds, M., Biggs, J., Nomikou, P., and Rap-
takis, C.: Distinguishing contributions to diffuse CO2 emissions
in volcanic areas from magmatic degassing and thermal decar-
bonation using soil gas 222Rn–δ13C systematics: Application to
Santorini volcano, Greece, Earth Planet. Sc. Lett., 377–378, 180-
190, 2013.
Pecoraino, G., Brusca, L., D’Alessandro, W., Giammanco, S., In-
guaggiato, S., and Longo, M.: Total CO2 output from Ischia Is-
land volcano (Italy), Geochem. J., 39, 451–458, 2005.
Pedone, M., Aiuppa, A., Giudice, G., Grassa, F., Cardellini, C.,
Chiodini, G., and Valenza, M.: Volcanic CO2 flux measure-
ment at Campi Flegrei by Tunable Diode Laser absorption Spec-
troscopy, B. Volcanol., 76, 812, doi:10.1007/s00445-014-0812-z,
2014.
Richter, D., Erdelyi, M., Curl, R. F., Tittel, F. K., Oppenheimer, C.,
Duffell, H. J., and Burton, M.: Field measurements of volcanic
gases using tunable diode laser based mid-infrared and Fourier
transform infrared spectrometers, Opt. Laser. Eng., 37, 171–186,
2002.
Shinohara, H.: Volatile flux from subduction zone volcanoes: In-
sights from a detailed evaluation of the fluxes from volcanoes in
Japan, J. Volcanol. Geoth. Res., 268, 46–63, 2013.
Siebert, L. and Simkin, T.: Volcanoes of the World: an Illustrated
Catalog of Holocene Volcanoes and their Eruptions, Smithsonian
Institution Digital Information Series GVP-3, available at: http:
//www.volcano.si.edu/list_volcano_holocene.cfm, 2002.
Sigmarsson, O., Condomines, M., and Fourcade, S.: A detailde Th,
Sr and O isotope study of Hekla: differentiation processes in an
Icelandic volcano, Contrib. Mineral. Petr., 112, 20–34, 1992.
Smithsonian Institution: available at: http://www.volcano.si.edu/
data_criteria.cfm, 2013.
Tamburello, G., Kantzas, E. P., McGonigle, A. J. S., Aiuppa, A.,
and Giudice, G.: UV camera measurements of fumarole field de-
gassing (La Fossa crater, Vulcano Island), J. Volcanol. Geoth.
Res., 199, 47–52, 2011.
Tamburello, G., Hansteen, T. H., Bredemeyer, S., Aiuppa, A., and
Giudice, G.: Gas fluxes and compositions of two active volcanoes
in Northern Chile: Lascar and Lastarria, American Geophysical
Union Fall Meeting 2013, abstract #V31B-2703, 2013.
Tamburello, G., Hansteen, T. H., Bredemeyer, S., Aiuppa, A., and
Tassi, F.: Gas emissions from five volcanoes in northern Chile
and implications for the volatiles budget of the Central Volcanic
Zone, Geophys. Res. Lett., 41, 4961–4969, 2014.
Tassi, F., Vaselli, O., Papazachos, C., Giannini, L., Chiodini, G.,
Vougioukalakis, G. E., Karagianni, E., Vamvakaris, D., and Pana-
Solid Earth, 5, 1209–1221, 2014 www.solid-earth.net/5/1209/2014/

M. Pedone et al.: Tunable diode laser measurements of hydrothermal/volcanic CO2 1221
giotopoulos, D.: Geochemical and isotopic changes in the fu-
marolic and submerged gas discharge during the 2011–2012
unrest at Santorini caldera (Greece), B. Volcanol., 75, 711,
doi:10.1007/s00445-013-0711-8, 2013.
Thorarinsson, S.: The eruption of Hekla 1947-48, Soc. Sci. Isl.,
1–183, 1967.
Thordarson, T. and Larsen, G.: Volcanism in Iceland in historical
time: volcano types, eruption styles and eruptive history, The
eruption of Hekla 1947–1948, I. The eruption of Hekla in histor-
ical times, Atephrochronological study. Visindafelag Islendinga,
Reykjavik, J. Geodyn., 43, 118–152, 2007.
Trottier, S., Gunter, W. D., Kadatz, B., Olson, M., and Perkins,
E. H.: Atmospheric Monitoring for the Pembina Cardium CO2
Monitoring Project using Open Path Laser Technology, Sci. Dir.
Energ. Proc., 1, 2307–2314, 2009.
Tsapanos, T. M., Galanopoulos, D., and Burton, P. W.: Seismicity in
the Hellenic Volcanic Arc: relation between seismic parameters
and the geophysical fields in the region, Geophys. J. Int., 117,
677–694, 1994.
Tulip, J.: Gas detector, United States Patent, 5637 872 250/338.5,
1997.
Turcotte, D. L.: Fractals and Chaos in Geology and Geophysics,
Cambridge University Press, 52–64, 1992.
Vougioukalakis, G. E., Mitropoulos, D., Perissoratis, C., An-
drinopoulos, A., and Fytikas, M.: The submarine volcanic centre
of Coloumbo, Santorini, Greece, Bull. Soc. Geol. Greece XXX,
3, 351–360, 1994.
Werner, C. and Cardellini, C.: Comparison of carbon dioxide emis-
sions with fluid upflow, chemistry, and geologic structures at
the Rotorua geothermal system, New Zealand, Geothermics, 35,
221–238, 2006.
www.solid-earth.net/5/1209/2014/ Solid Earth, 5, 1209–1221, 2014