tumor-specific but not nonspecific cell-free circulating dna can be used to monitor disease response...
TRANSCRIPT
Tumor-specific but not nonspecific cell-free circulating DNAcan be used to monitor disease response in lymphoma
Kimberley Jones,1,2 Jamie P. Nourse,1 Colm Keane,1,3 Pauline Crooks,1 David Gottlieb,4
David S. Ritchie,5 Devinder Gill,2,3 and Maher K. Gandhi1,2,3*
Recently, nontumor specific circulating DNA was shown to be elevated in a broad range of lymphomas,implicating a role as a potential biomarker. Epstein-Barr virus’ (EBV) presence within a proportion of lym-phomas implies EBV-DNA has potential as a lymphoma-specific disease response biomarker. However,application would be restricted to EBV-associated lymphomas. Neither detailed comparison has beenperformed of lymphoma-specific versus nonspecific DNA as disease response biomarkers nor have thekinetics of circulating DNA during treatment been established, and the optimal methodology remainsunknown. We prospectively evaluated DNA levels and clinical response of 63 lymphoma patients. DNA wasmeasured in paired serum, plasma, and cell samples at five predetermined time-points taken prior, duringand following treatment. Both cell-free (c-f) circulating EBV-DNA (in EBV-associated lymphoma) and non-specific c-f DNA levels (in all lymphomas) were elevated and discriminatory at presentation compared tohealthy controls. Nonspecific c-f DNA was significantly associated with baseline serum lactate dehydrogen-ase. Within EBV-associated lymphomas at presentation, there was a strong correlation between specificand nonspecific circulating c-f DNA (r 5 0.9, P < 0.0001). However, only c-f EBV-DNA correlated withclinical/radiological response. In addition, c-f EBV-DNA, and not nonspecific c-f DNA, provided an earlymarker of relapsed and refractory disease. Serum versus plasma, and single versus multiple-copy EBV-gene targets were equivalent. Lymphoma-specific DNA is a disease response biomarker; however,nonspecific DNA reflected neither lymphoma-specific DNA nor therapeutic response. Lymphoma diseaseresponse can be monitored by blood tests, but new lymphoma-specific biomarkers need to be identified tobroaden applicability. Am. J. Hematol. 87:258–265, 2012. VVC 2011 Wiley Periodicals, Inc.
IntroductionIn lymphoma, tumor burden and treatment response are
currently assessed by clinical evaluation supplemented bycomputerized tomography or positron emission tomography(PET) scans. Although invaluable, these methods havetheir limitations and interpretation can be difficult [1].Disease response biomarkers have the potential to enableclinicians to monitor their patient’s progress by a simpletest. They may also serve as an early predictor of diseaserelapse. There are currently no such markers in lymphoma.It is known that indirect blood markers of biological activitysuch as serum lactate dehydrogenase (LDH) are frequentlyelevated at baseline in a variety of lymphomas includingHodgkin lymphoma, diffuse large B-cell lymphoma(DLBCL), and post-transplant lymphoproliferative disorder(PTLD) [2–4]. However, once therapy has commenced itslack of specificity precludes its clinical value as a measureof disease response. A noninvasive, highly specific bio-marker that accurately reflects response to therapy wouldgreatly assist treatment-related decision making.Recently, it has been established that nonspecific circu-
lating DNA is elevated in lymphoma patients of various his-tological subtypes. One study assessing nontumor-specificcirculating cell-free (c-f) DNA levels at presentation found asignificant association with elevated LDH levels [5]. A sub-sequent study found elevated levels at presentation thatdecreased once in remission [6]. Thus, data suggest thatc-f circulating DNA has potential as part of the lymphomadiagnostic work-up and to evaluate therapeutic response,with the advantage of wide-spread applicability to varioushistological subtypes.Alternatively, the demonstration that c-f tumor-derived
DNA is elevated in the plasma or serum of cancer patientsraises the possibility of a highly specific blood biomarkerthat accurately reflects tumor load [7–9]. Epstein-Barr virus(EBV) is a ubiquitous herpes-virus that is present within the
malignant tissue of a variety of lymphomas, albeit only in aproportion of cases [10]. The presence of EBV within thelymphomatous node and the close proximity of the lymph-oid and blood circulation indicates potential as a highlytumor-specific biomarker. Accordingly, we and other groupshave shown that EBV-DNA is increased in the peripheralblood of patients with a variety of EBV-associated cancersincluding classical Hodgkin lymphoma (cHL), PTLD, extra-nodal NK-T cell lymphoma, and nasopharyngeal carcinoma[11–14]. In cHL, plasma EBV-DNA is associated withadverse biological characteristics [15]. Viral load appears tobecome undetectable in remission but remains high inrefractory disease or returns at relapse, supporting the useof EBV-viral load as a biomarker for EBV-positive lym-phoma patients [12,13,16,17]. Importantly, it is yet to be
Conflict of interest: Nothing to report.
Additional Supporting Information may be found in the online version of thisarticle.
*Correspondence to: Maher K. Gandhi, Clinical Immunohaematology Labora-tory, Queensland Institute of Medical Research, 300 Herston Rd., Brisbane,QLD, 4006, Australia. E-mail: [email protected]
1Clinical Immunohaematology Laboratory, Queensland Institute of MedicalResearch, Brisbane, Australia; 2School of Medicine, University of Queensland,Brisbane, Australia; 3Department of Haematology, Princess AlexandraHospital, Brisbane, Australia; 4Blood and Marrow Transplant Service, West-mead Hospital, Sydney, New South Wales, Australia; 5Department of Haema-tology, Peter MacCallum Cancer Centre and University of Melbourne, Mel-bourne, Australia
Contract grant sponsors: NHMRC (Australia), the Leukaemia Foundation,the Cancer Council of Queensland, the Queensland Smart State, LeukaemiaFoundation Scholarship, the Australian Centre for Vaccine Development,Boehringer Ingelheim Fonds.
Received for publication 19 October 2011; Revised 2 November 2011;Accepted 4 November 2011
Am. J. Hematol. 87:258–265, 2012.
Published online 8 November 2011 in Wiley Online Library (wileyonlinelibrary.com).DOI: 10.1002/ajh.22252
Research Article
VVC 2011 Wiley Periodicals, Inc.
American Journal of Hematology 258 http://wileyonlinelibrary.com/cgi-bin/jhome/35105

established if the viral load mimics tumor burden duringtreatment. This data are essential to assess the role ofEBV-DNA as a disease response biomarker.Neither detailed comparison has been performed of
tumor-specific versus nonspecific DNA as biomarkers inlymphoma nor have the kinetics of circulating DNA duringtreatment or the optimal methodology been established.With this in mind, we prospectively evaluated and com-pared EBV-viral load and c-f human genomic DNA levels(using albumin as the target gene) with clinical response in63 lymphoma patients. DNA was measured in pairedserum, plasma, and cellular samples at five predeterminedtime-points taken prior, during and following treatment, andresults stratified by EBV-tissue status.
MethodsPatients. Newly diagnosed lymphoma adult patients (aged = 18
years), classified according to the World Health Organization classifica-tion criteria [18], were eligible. All patients were enrolled before therapy.To provide a histologically relevant EBV-tissue negative control popula-tion, both EBV-tissue positive and negative patients were recruited.Inclusion was restricted to lymphoma patients with specific morphologi-cal subtypes. These were HL, DLBCL, B-cell PTLD, lymphomatoidgranulomatosis (LYG), and angioblastic T-cell lymphoma (AITL). HL,DLBCL, and B-cell PTLD accounted for 92% of patients. The histolo-gies were chosen as it was known that in a proportion of patients,EBV-positivity would likely be present within B-cells in the malignanttissue. With respect to HL, DLBCL, PTLD, and LYG, EBV-positivity isfound within the malignant B-cell. By contrast, AITL is characterized bya malignant T-cell population surrounded by infiltrating B-cells thatare typically EBV-positive. EBV-tissue positivity was confirmed byEBV-encoded RNA in situ hybridization (EBER-ISH) in conjunction withhematoxylin and eosin staining, as previously described [12]. Patientswith EBV-positive tissue are hence forth referred to as having EBV-associated lymphoma, and EBV-negative tissue patients are referred toas having non-EBV-associated lymphoma. Patients that were positivefor human immunodeficiency virus or with active Hepatitis B or C infec-tion were excluded. Full clinical annotation was prospectively recorded.This was a noninterventional study in which therapy was applied as perclinician’s preference and varied by histological subtype. HL patientswere treated with ‘‘ABVD’’ [19], DLBCL and LYG received ‘‘CHOP-R’’ or‘‘Hyper-CVAD’’ [20,21] and PTLD with reduction in immunosuppression(RIS) combined with rituximab either as monotherapy or in combinationwith chemotherapy (‘‘CHOP-R’’) [22].
Peripheral blood samples (30 to 50 ml in EDTA tubes and 8 ml inserum tubes) were taken at five defined time-points: at diagnosis,immediately before second and third therapy, 1 month post-therapy,and 6 months post-therapy [23]. The response to therapy was clinicallyevaluated at each time-point. Radiological assessment was performedat diagnosis, at an interim time-point, 1 month and 3 to 6 months aftercompletion of all therapy, and responses classified as per standardcriteria [24].
Serum, plasma, and peripheral blood mononuclear cells (PBMC)were processed as previously outlined [23]. EBV-seropositive healthy
subjects served as a healthy control population. The study was per-formed under the auspices of the Australasian Leukaemia and Lym-phoma Group. This study conformed to the Declaration of Helsinki andwritten informed consent was provided by all donors in accordance withparticipating hospitals/research institute Human Research Ethics Com-mittee guidelines.
DNA extraction and quantitative real-time PCR determination of theEBV-DNA load in the plasma and PBMC. DNA from plasma and se-rum (850–1000 ll) and PBMC (<5 3 106 cells) was extracted usingthe QIAamp DNA Blood Mini Kit (Qiagen, Valencia, USA). EBV-PCRprimer sets were used from two different gene sequences; the single-copy BALF5 (90 base-pair amplicon) and the multiple but variable copynumber BAMH1W (115 base-pair amplicon) both described previously[25,26]. Primers and probe for the human albumin gene were alsoused as previously described [27]. PCR primers were synthesized bySigma Aldrich (Castle Hill, Australia) and probes by Biosearch Technol-ogies (Novato, USA). Rotorgene 3000 real-time PCR machine (CorbettResearch, Sydney, Australia) was used to run the 20 ll reactions withPlatinum Quantitative PCR SuperMix-UDG (Invitrogen, Carlsbad, USA).For each real-time run, levels were quantified against a standard curvewith serially diluted EBV-DNA extracted from the Namalwa cell line (sixstandards, 1:5 dilutions) or from Human genomic DNA (four standards,1:2 dilutions; Roche Diagnostics, Indianapolis, USA). For plasma andserum samples, results were expressed as either Human genome (dip-loid) or EBV genome copies per ml. For PBMC samples, the EBV-DNAload was normalized to albumin level and was expressed as the num-ber of EBV copies per 106 PBMC.
Statistics. Accuracy of circulating c-f nonspecific DNA and EBV-viralload as biomarkers at diagnosis and of disease response was meas-ured by receiver operating characteristic (ROC) curves. ROC curveanalysis was also used to define cut-off thresholds for c-f nonspecificDNA and c-f EBV-DNA. The Mann-Whitney test was used to comparegroups, and Wilcoxon matched-pairs signed rank test was used tocompare paired samples. We defined accurate results as the valueswithin 10% of the expected value and used two-tailed Fisher’s exacttest to compare accuracy, sensitivity, and specificity. The correlation ofresults was assessed using Pearson analysis and the agreementbetween matched values was assessed using Bland-Altman plot analy-sis. The statistical analysis was performed using Graphpad Prism 5.0(Graphpad Software Inc, California).
Results
Patient characteristicsSixty-three lymphoma patients were accrued from three
centers. There were 30 EBV-associated lymphoma patients(mean age: 43 years, range: 18–89; female/male ratio 17/13) and 33 non-EBV-associated lymphoma patients (meanage: 45 years, range: 18–89; female/male ratio 16/17).Patient characteristics are provided in Table I. In addition,17 healthy control PBMC samples and 13 healthy controlplasma samples were collected (26 healthy donors intotal, mean age: 41 years, range: 20–62; female/male ratio16/10).
TABLE I. Patient Characteristics
Histology EBER-ISH No. of patients Gender Mean age LDH (Mean; Range) No. of stage I/II B-Symptoms
PTLDNEGATIVE 5 3F:2M 57 258; 193–347 2 4 Yes: 1 NoPOSITIVE 8 6F:2M 45 274; 102–708 4 3 Yes: 5 No
Hodgkin LymphomaNEGATIVE 23 11F:12M 37 350; 109–1331 10 10 Yes: 13 NoPOSITIVE 13 5F:8M 37 291; 178–551 7 4 Yes: 9 No
Diffuse Large B-cell LymphomaNEGATIVE 5 2F:3M 71 421; 184–784 2 2 Yes: 3 NoPOSITIVE 4 2F:2M 58 486; 143–1217 2 1 Yes: 3 No
Lymphomatoid GranulomatosisNEGATIVE 0 – – – – –POSITIVE 4 4F 42 536; 212–1102 1 1 Yes: 3 No
Angioimmunoblastic T-cell lymphomaNEGATIVE 0 – – – – –POSITIVE 1 1M 58 238 0 1 Yes
TotalNEGATIVE 33 16F:17M 45 348; 109–1331 14 16 Yes: 17 NoPOSITIVE 30 17F:13M 43 343; 102–1102 14 10 Yes: 20 No
American Journal of Hematology 259
research article

Nonspecific circulating DNA correlates withLDH levels at diagnosis but has no valueas a disease response biomarkerUsing albumin as the target gene and plasma as the
DNA source, we quantified circulating c-f nonspecific DNAlevels in 63 lymphoma patients at all available time-pointsand on 13 healthy control plasma samples. We found thatcirculating nonspecific c-f DNA levels were increased inpatient samples at diagnosis compared to healthy controls(patient mean 5 1622 genomes/ml, range 89–8603genomes/ml; healthy mean 5 297 genomes/ml, range 16–2108 genomes/ml, P < 0.0001, Fig. 1A). Pretreatment non-specific c-f DNA levels were elevated in HL (P < 0.0001),PTLD (P 5 0.0007), and DLBCL (P 5 0.0021) when com-pared with healthy subjects. There was no difference innonspecific c-f DNA levels between HL, PTLD, and DLBCLsamples pretherapy. ROC analysis was used to test thediagnostic performance of real-time quantitative PCR to dis-criminate between healthy controls and lymphoma patients.The area under the curve (AUC) was 0.8901 (95% C.I.0.77–1.01). We chose a baseline cut-off threshold for c-fnonspecific DNA of 150 human genomes/ml of plasma.This value provided optimal sensitivity and specificity usingROC analysis of pretreatment compared to healthy controlsamples (95% sensitivity and 69% specificity).Comparison of diagnostic nonspecific circulating c-f DNA
load revealed a correlation with LDH levels (P 5 0.0024).However no correlation was seen with other clinical param-eters, including age, gender, stage, and B-symptoms.Despite elevated nonspecific circulating DNA at presenta-
tion, sequential assays taken within the same patient atdefined time-points did not reflect response to treatment.Using a paired analysis, circulating nonspecific c-f DNAlevels at all time-points were compared for patients who
were in complete remission (as defined by radiological andclinical assessment at the 1 month post-treatment time-point) (Fig. 1A shows results in 42 patients with completetime-courses, and Fig. 1B–D shows paired analysis forPTLD, HL, and DLBCL, respectively). No significant differ-ences were seen for all comparisons between time-points.In addition, ROC analysis between diagnostic and 1 monthpost-treatment remission samples was not significant withpoor sensitivity and specificity ratios [area under the curve(AUC) 5 0.6043], CI% 0.47–0.73, 5% sensitivity, and 100%specificity. Further studies are required to definitively estab-lish if circulating c-f DNA has a potential role as a baselinescreen. However, sequential circulating c-f DNA did notreflect therapeutic response.
Single-copy EBV-DNA gene targets are equallysensitive and specific as multiple copy genes targetsInitially, we determined the optimum methodology for
EBV-DNA by real-time PCR. We compared the sensitivity,precision, and accuracy of two EBV primers from eight sep-arate PCR runs using fivefold dilutions of Namalwa DNAranging from 25,000 to 8 EBV genome copies, run in tripli-cate. As shown in Fig. 2A, the mean and standard error ofBALF5 and BAMH1W were similar. Two-tailed Fisher’sexact test was used to compare the accuracy of BALF5and BAMH1W amplification at a level of 10% variation fromthe expected value. We found no difference between thetwo primers.We then compared BAMH1W and BALF5 results in 113
plasma samples from our patient cohort (Fig. 2B). ROCanalysis was used to choose the optimum cut-off thresholdof 100 EBV genomes/ml of plasma. This gave 94% sensi-tivity and 67% specificity when comparing samples frombefore treatment EBV-associated lymphomas to before
Figure 1. Circulating cell-free nonspecific DNA in complete responders. (A) Circulating cell-free (c-f) nonspecific DNA in 42 lymphoma patients, regardless of EBER-ISHstatus, with a full time-course and who achieved complete response by the 1 month post-treatment time-point. Lymphoma patient c-f nonspecific DNA was significantlyelevated at presentation compared to 13 healthy controls (P > 0.0001). No significant differences were seen between paired samples at all subsequent time-points,including remission samples at 1 month and 6 months post-treatment. Line and error bars represent the mean and SEM. (B–D) Sequential circulating cell-free nonspecificDNA in (B) HL complete responders, (C) B-cell PTLD complete responders, and (D) DLBCL complete responders. No significant differences were seen between pairedsamples at all time-points. * A 6months post-treatment time-point was available in only one DLBCL patient.
260 American Journal of Hematology
research article

treatment non-EBV-associated lymphoma controls. Interest-ingly, the multiple-copy gene BAMH1W was not more sen-sitive than the single-copy gene BALF5.Primer specificity was analyzed based on false positives
(non-EBV-associated lymphoma patients with positive viralloads) and on false negatives (EBV-positive lymphomapatients with negative viral loads at diagnosis). No signifi-cant differences were seen between specificity of BAMH1Wand BALF5. The false positive rates for values above thecut-off for BAMH1W and BALF5 were 1% and 0%, respec-tively. The false negative rates for values below the cut-offof BAMH1W and BALF5 were both 2%. The BALF5 andBAMH1W results strongly correlated (r 5 0.9694, P <0.0001); however, the Bland-Altman analysis showed pooragreement between the samples (Bias of 200.4 ± 924.8SD). This is not surprising considering the variability inBAMH1W copy number between different EBV strains [28].Importantly, when Pearson correlation was limited to valuesbelow 100 EBV genome copies/ml of plasma, the correla-tion was poor (r 5 0.4721) but remained strong above thisthreshold (r 5 0.9610, Fig. 2C), supporting the previouslydefined cut-off of 100 EBV genomes/ml. Our results indi-cate that the multiple-copy gene BAMH1W was not moresensitive than BALF5. We concluded that the risk of
increased variability between patient results by using themultiple-copy BAMH1W gene was not outweighed by anysignificant increase in sensitivity and used the BALF5primer for the remainder of our study.
Serum and plasma are equivalent but notinterchangeable sources of c-f EBV-DNATo determine the optimal source of c-f EBV-DNA, we
used the BALF5 primers in 105 matched serumand plasma samples from our patient cohort. These werechosen from 28 EBV-associated and non-EBV-associatedB-cell PTLD and cHL patients with complete time-courses(three EBV-PTLD, eight EBV1 PLTD, eight EBV-HL, andnine EBV1HL). We found no significant difference betweenthe paired samples (P 5 0.7641) and a strong correlation(r 5 0.9639, P < 0.0001, Fig. 2D,E). Sensitivity and specific-ity were analyzed using the two-tailed Fisher’s exact test.Plasma was found to be significantly more sensitive thanserum when comparing values above zero (total positive val-ues P 5 0.0488, comparison of positive values in one sourceversus zero values in the other source P 5 0.0026). How-ever, when the sensitivity analysis was restricted to valuesabove a 100 copies/ml cut-off, no significant difference insensitivity was found. No significant differences were seen
Figure 2. Comparison of multicopy and single-copy EBV-gene targets, as well as plasma and serum as a source of circulating cell-free EBV-DNA (A) Accuracy andprecision of BAMH1W and BALF5. Results of eight separate PCR runs using diluted Namalwa EBV-DNA samples are presented as fold change from expected value. Thecircles and triangles represent the mean of BALF5 and BAMH1W, respectively. The error bars represent the SD. No significant differences were seen. (B) Correlation ofBAMH1W and BALF5 results from 113 patients samples. The results strongly correlated (r 5 0.9694, P > 0.0001). The data are presented on a log 10 scale; thus, nil valuesare not shown. (C) Correlation of BAMH1W and BALF5 results above and below the cut-off threshold of 100 copies/ml. A poor correlation (0.4721) was found below thecut-off threshold, whereas values above the threshold remained strongly correlated (0.9610). (D) No significant difference was seen between plasma and serum EBV-DNAload from 105 paired patient samples. Line and error bars represent the mean and SEM. (E) Plasma and serum EBV-DNA strongly correlated (r 5 0.9639, P < 0.0001).
American Journal of Hematology 261
research article

between specificity of plasma and serum. The false positiverates for values above the cut-off for plasma and serum are2.3% and 4.5%, respectively. The false negative for valuesbelow the cut-off of plasma and serum were 41% and 47%.Bland-Altman plots were used to assess the agreement ofvalues between paired serum and plasma viral loads. Theseillustrate relatively poor agreement between serum andplasma (Bias 5 345.6, SD of Bias 2666). Thus, althoughplasma and serum were equally sensitive and specific andstrongly correlated, values were not identical. This demon-strates that although plasma and serum are equivalentsources, they cannot be used interchangeably. To permitcomparison with nonspecific c-f DNA, EBV-DNA was meas-ured in plasma for the remaining components of the study.
In untreated EBV-associated lymphoma patients,plasma EBV-DNA was elevated and correlated withnonspecific circulating plasma DNAPretherapy c-f (plasma) and cell-associated viral loads
were compared between EBV-associated and non-EBV-associated lymphoma patients of matching histologies. Inaddition, EBV-associated lymphoma pretherapy viral loadswere compared with healthy control samples. As illustratedin Supporting Information Figure S1, c-f but not cell-associ-ated viral loads were significantly elevated at presentation.EBV-associated lymphoma c-f EBV-DNA loads were signifi-cantly different from both non-EBV-associated lymphomaand healthy control samples (P < 0.0001 and P 5 0.0002,respectively). The majority of the EBV-associated lym-phoma patients had c-f EBV-DNA above the cut-off thresh-old (67%, 20 out of 30), as opposed to 6% (2 out of 33) ofthe non-EBV-associated lymphoma samples and none ofthe healthy controls. In contrast, pretherapy cell-associatedEBV-associated lymphoma viral loads were not significantlydifferent from non-EBV-associated and healthy controls(P 5 0.3078 and P 5 0.7120, respectively). To assess sen-sitivity and specificity of cell-associated and c-f EBV-DNAload as a biomarker of disease at presentation, ROCcurves were generated. Plasma viral loads distinguishedEBV-associated from non-EBV-associated lymphomapatients (AUC 5 0.8182, P < 0.0001, 95% CI 0.70–0.93and using a 100 copies/ml cut-off 94% sensitivity and 67%specificity) and from healthy control subjects (AUC 50.8727, P 5 0.00029, 95% CI 0.77–0.98, with 67% sensi-tivity and 100% specificity). For cell-associated viral loads,ROC analysis showed that EBV-DNA did not distinguishpretherapy EBV-associated lymphoma blood whencompared with non-EBV-associated lymphoma and healthycontrol samples (AUC 5 0.5938, 95% CI 0.40–0.79, P 50.3023 and AUC 5 0.5386, 95% CI 0.33–0.75, P 50.7053, respectively). In addition, cell-associated viral loadshad a false positive rate of 60% when compared with the6% false positive rate for plasma.Interestingly, paired analysis showed that EBV-associated
lymphoma patient EBV-DNA loads strongly correlated withmatched nonspecific circulating c-f DNA values (r 5 0.6301,P 5 0.0002). EBV-associated lymphoma patient viral loadswere also compared with clinical parameters, including age,gender, stage, B-symptoms LDH, and relevant prognosticscore. No association was found between these and eithercell-associated or c-f diagnostic viral loads.
Plasma EBV-DNA load reflects therapeutic responsein EBV-associated lymphomaWe analyzed the viral load during treatment and com-
pared this with disease response as defined by radiologicaland clinical assessment. Supporting Information Figure S2is a schematic diagram of the EBV-associated lymphomapatients. Of the 30 EBV-associated lymphoma patients, we
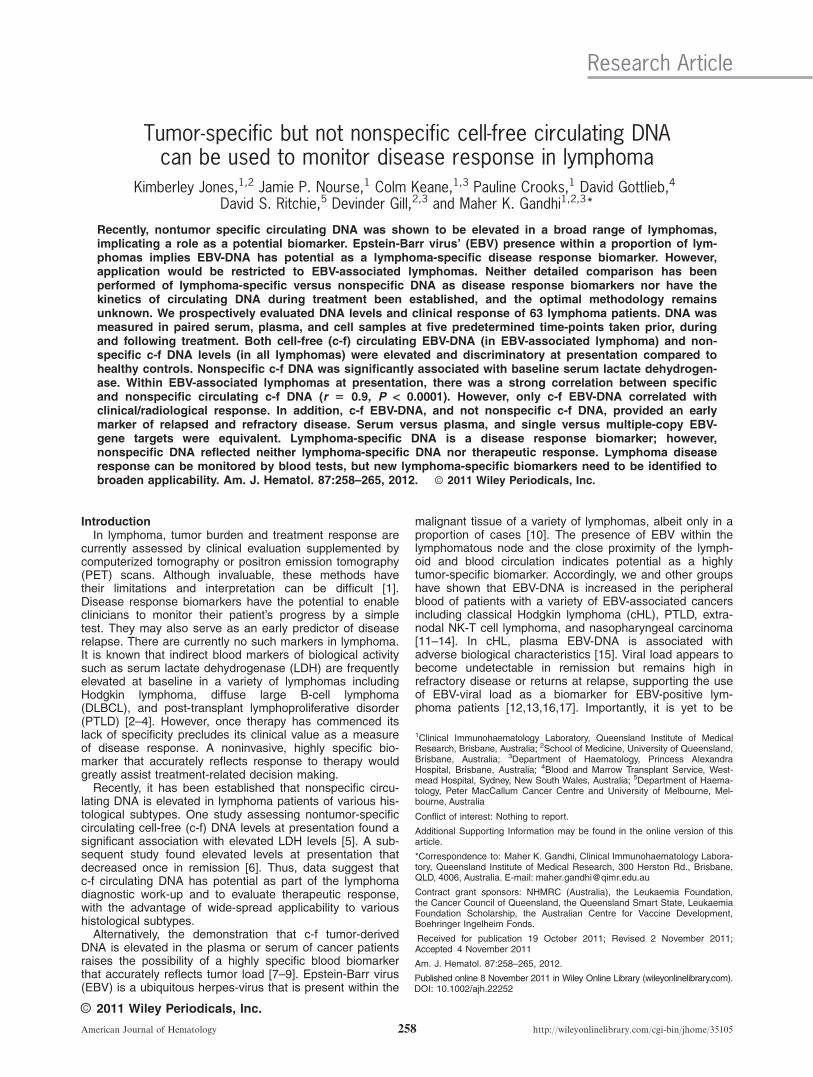
had a full time-course on 22 (at least four sequential sam-ples including at presentation and a post-treatment time-point), all of whom achieved complete remission by the 1month post-treatment time-point and all but one remain inclinical/radiological remission. Of the 21 in complete remis-sion, eight patients had nil/below cut-off viral loads at pre-sentation and remained nil/below cut-off throughout treat-ment (two HL, four B-cell PTLD, and one DLBCL). Theremaining 13 patients had viral loads above threshold atpresentation. Of these 13 patients, nine had a nil/belowcut-off viral load at the pre-second treatment time-point. Allof these nine, except one, remained nil/below cut-off for thesubsequent time-points. The one patient who did notremain nil/below cut-off had a spike of EBV-DNA at thepre-third treatment time-point which occurred within thecontext of an episode of sepsis requiring hospitalization.Following convalescence, the viral load dropped to nil bythe 1 month post time-point and remained nil/below cut-offthereafter. Of the four patients with positive viral loads atthe pre-second time-point, one had nil/below cut-off viralload by the pre-third time-point, one achieved nil/below cut-off viral load by the 1 month post time-point and the othertwo did not achieve nil/below cut off viral loads until the 6months post-treatment time-point. Of note, the two patientswith positive viral loads at the 1 month post-treatment time-points had viral loads only modestly above threshold (137copies/ml and 112 copies/ml). Figure S3 illustrates that atcorresponding time-points, there was no associationbetween c-f viral load and c-f nonspecific DNA changes inthe 21 sustained complete response patients with a com-plete time-course. Figure 3 is restricted to the EBV-associ-ated lymphoma patients with raised EBV-DNA at presenta-tion and shows that individual viral load time-courses corre-spond to therapeutic response, whereas circulatingnonspecific plasma DNA does not (10 individual viral loadtime courses shown in Fig. 3, the remaining three areshown in Fig. 4). In the remaining eight of thirty EBV-asso-ciated lymphoma patients in whom only a partial time-course was available, EBV-DNA was elevated in seven atpresentation. In these patients, available EBV-DNA valuesat subsequent time-points were consistent with therapeuticresponse (data not shown).To compare cellular with plasma EBV-DNA as a disease
response biomarker, paired diagnostic and 1 month post-treatment samples were assayed in patients in completeremission at the 1 month post-treatment time-point (Sup-porting Information Fig. S4). Paired c-f EBV-positive patientviral loads at diagnosis significantly differed from remissionsamples (P 5 0.0005). ROC analysis of paired samplesillustrated that plasma EBV-DNA could be used to indicatedisease response (AUC 5 0.7872, 95% CI 0.65–0.93, P 50.0011 with 64% sensitivity and 91% specificity abovecut-off). In keeping with the reduction of circulating B-cellnumbers with therapy, cell-associated EBV viral loads werereduced (P 5 0.0117). However, ROC analysis plots werenot significant (AUC 5 0.7041, 95% CI 0.48–0.90, P 50.076912), indicating that cell-associated EBV loads werenot a useful disease response biomarker.
In patients with refractory/relapsed disease or with per-sistent low-grade FDG-PET avidity, tumor-specific butnot nonspecific c-f DNA is a biomarker of diseaseresponseOf the 30 EBV-associated lymphoma patients, one
patient (patient 23) had refractory disease and one patientrelapsed (patient 70). The patient with refractory disease(AITL) died before the 6 months post-treatment evaluation.This patient had a high viral load at diagnosis (15,000 cop-ies/ml) and continued to have a high viral load at the 1month post-treatment time-point (885 copies/ml). Pre-sec-
262 American Journal of Hematology
research article
ond and pre-third treatment time-points were not available.A complete time-course was available for patient 70. Thispatient (DLBCL) had a high viral load at diagnosis (13,460copies/ml) and achieved complete clinical/radiologicalremission by 1 month post-treatment. The viral loaddropped to nil at the pre-second therapy time-point andremained nil for the pre-third therapy and 1 month post-therapy samples. The viral load returned to high levels at 6months post-therapy (2020 copies/ml) preceding clinical/ra-diological evidence of relapse. Clinical examination and ra-diological imaging confirmed a relapse at 9 months post-treatment, at which time an additional sample was takenand a very high viral load was observed (30,100 copies/ml). In addition to the two EBV-associated relapse/refrac-tory patients, one non-EBV associated lymphoma patienthad refractory disease at the end of therapy, which thenprogressed. The viral load was nil at all time-points; how-ever, the nonspecific DNA load did not reflect progressivedisease (Fig. 4).Importantly, plasma EBV-DNA was also a useful
biomarker in patients with persistent low-grade FDG-PETavidity at 1 month following treatment. Three of the 13EBV-associated lymphoma patients who had viral loads atpresentation and dropped to nil by the pre-second therapytime-point, had persistent low-grade FDG-PET avidity at the1 month post-therapy time-point. With ongoing clinicalfollow-up, these patients did not relapse, indicating thatthey were in complete remission at the end of therapy,which was accurately reflected by their 1 month post-therapy EBV-DNA values (Fig. 4).
DiscussionA noninvasive biomarker that accurately reflects lympho-
mas response to therapy would be of great clinical benefit.However, the study of disease response biomarkers inlymphoma has been relatively neglected. Our aim was tocompare lymphoma-specific with nonspecific circulating
DNA. We prospectively evaluated the kinetics of tumor-spe-cific and nonspecific circulating c-f DNA at fixed sequentialtime-points taken prior, during and following therapy in 63lymphoma patients. Values were compared with clinical andradiological response. Our results indicate that althoughcirculating nonspecific DNA loads were elevated at presen-tation, levels were not indicative of lymphoma burdenonce therapy had commenced. In contrast, circulating c-fEBV-DNA (but not cell-associated EBV-DNA) did reflecttherapeutic response in EBV-associated lymphomas.A prior study that quantified genomic DNA in lymphoma
using primers to the b-globin housekeeping gene foundthat elevated nonspecific DNA was associated withincreased lymphoma risk and that nonspecific circulatingc-f DNA was raised in HL and DLBCL compared to healthycontrols [5]. Notably, Hohaus et al. also observed signifi-cant associations with advanced stage disease, presenceof B-symptoms, elevated LDH levels, and increased age[5]. The most significant association seen was with elevatedLDH. LDH level has previously been used for assessinglymphoma burden, prognosis, and stratifying treatment [3].We also found a strong correlation between nonspecificcirculating c-f DNA load and LDH levels at presentation butnot with other clinical parameters. Further prospective stud-ies with larger patient numbers are required to definitelyclarify the role of nonspecific circulating c-f DNA as partof the diagnostic screen in specific lymphoma histologicalsubtypes.The elevation of nonspecific circulating c-f DNA at pre-
sentation suggested the assay had potential as a diseaseresponse biomarker. Unlike highly tumor-specific basedassays, nonspecific DNA would have broad applicability toa variety of lymphomas. To test this, a study was conductedin pediatric aggressive (predominantly Burkitts) lymphoma,but the results were inconclusive [6]. Blood was takenbefore and at the end of (but not during) therapy. In11 evaluable patients, the authors found that following
Figure 3. Plasma EBV-DNA load reflects therapeutic response in EBV-associated lymphoma patients with elevated viral load at presentation, whereas circulating non-specific plasma DNA does not. Comparison of therapeutic response, cell-free nonspecific DNA and EBV-DNA in EBV-associated lymphoma patients that had elevatedEBV-DNA at presentation. Dotted lines represent cell-free nonspecific DNA, whereas solid lines represent EBV-DNA. The arrows represent the timing of the radiologicalassessment. (A) Patient 14, HL treated with ABVD; (B) Patient 25, PTLD treated with RIS, methotrexate and radiotherapy; (C) Patient 27, HL treated with ABVD; (D)Patient 29, HL treated with ABVD; (E) Patient 41, PTLD treated with RIS and Rituximab; (F) Patient 45 PTLD treated with RIS and Rituximab; (G) Patient 53, LYG treatedwith CHOP-R; (H) Patient 54, HL treated with ABVD; (I) Patient 63, HL treated with ABVD; and (J) Patient 78, LYG treated with Hyper-CVAD.
American Journal of Hematology 263
research article

cessation of chemotherapy nonspecific circulating c-f DNAsignificantly declined to levels comparable with healthy sub-jects in seven responders but remained above controls oreven rose above presentation levels in the remaining threedespite ongoing remission [6]. Our approach was to com-pare nonspecific with tumor-specific circulating c-f DNA.We prospectively obtained sequential blood samples at fivedefined time-points prior, during and following therapy.EBV-DNA was chosen as the lymphoma-specific marker,because EBV is known to be present within the malignantlymph nodes in a proportion of patients with specific histol-ogies [10]. Our and others previous work indicates thatEBV-DNA may have a role as a disease response bio-marker in EBV-associated lymphomas [12,13,29,30]. To ourknowledge, ours is the first detailed comparison of lym-phoma-specific and nonspecific circulating c-f DNA as adisease response biomarker. At presentation, we found astrong correlation between specific and nonspecific circulat-ing c-f DNA. The timing of the second and third sampleswas on the day of but immediately before second and thirdtherapy cycles, so as to minimize release of nonspecificDNA into the circulation from chemotherapy induceddestruction of nonmalignant cells. However, once therapyhad commenced, nonspecific c-f DNA levels remainedequivalent to presentation at all subsequent time-points. Incontrast, c-f EBV-DNA did reflect clinical and radiologicalresponse in all of the EBV-associated lymphoma patients inwhom EBV-DNA was elevated at presentation. In thesepatients, viral load cleared in patients obtaining remission,
generally before cessation of therapy. In several cases,values declined but remained marginally elevated abovethreshold but reduced to below threshold with continuedsurveillance. Circulating c-f EBV-DNA remained elevated inan EBV-associated lymphoma patient with refractory dis-ease and returned to elevated levels in an EBV-associatedlymphoma patient who relapsed at 9 months post-treat-ment. In addition, c-f viral loads reflected disease responsein EBV-associated lymphoma patients with persistent low-grade FDG-PET avidity that was not associated with subse-quent relapse. Furthermore, c-f viral loads distinguishedEBV-associated from non-EBV-associated lymphomapatients and from healthy control subjects. Thus, it appearsthat lymphoma-specific DNA has a role as a diseaseresponse biomarker, at least in those patients with elevatedloads at presentation, within the HL, LYG, DLBCL, andPTLD lymphoma subtypes included within our study.There is currently a lack of protocol consistency between
laboratories assaying EBV-DNA. Although quantitative real-time PCR is widely used, most methods are developed inhouse and there is a large degree of deviation betweenprotocols. A study comparing interlaboratory results from28 laboratories using a panel of samples found significantvariation [31]. Although a universal viral load quantificationmethod would permit standardized interpretation of results,the optimal choice of DNA source (serum, plasma, or cell-associated) and amplified gene remains to be determined.We, therefore, utilized the opportunity that the clinical sam-ples provided to compare these parameters. Ours is the
Figure 4. Tumor-specific but not nonspecific cell-free DNA load reflects therapeutic response in patients with refractory/relapsed disease or with persistent low-gradeFDG-PET avidity. Dotted lines represent the cell-free nonspecific DNA, whereas solid lines represent the EBV-DNA. The arrows represent the timing of the radiologicalassessment. (A–C) Comparison of cell-free nonspecific DNA and EBV-DNA in EBV-associated lymphoma patients that had persistent low-grade FDG-PET avidity ofuncertain significance at 1 month post-treatment. All three patients were in clinical complete remission at the 1 month post-treatment time-point, and remain disease freewith ongoing follow-up. (A) Patient 75, HL treated with ABVD; (B) Patient 77, LYG treated with CHOP-R; (C) Patient 84, HL treated with ABVD. (D–F) Comparison of cell-free nonspecific DNA and EBV-DNA in EBV-associated and non-EBV-associated lymphoma patients that had relapsed/ refractory disease. (D) Patient 70, EBV-associatedDLBCL treated with CHOP-R; (E) Patient 23, EBV-associated AITL treated with CHOP; and (F) Patient 81, non-EBV-associated HL treated with ABVD.
264 American Journal of Hematology
research article
first large series to compare serum and plasma as sourcesof circulating c-f EBV-DNA. Our results are conclusive thatthe two are equivalent but not interchangeable. By contrast,cell-associated EBV-DNA did not distinguish pretherapyEBV-associated lymphoma samples from non-EBV-associ-ated lymphoma and healthy control samples, nor was it ofvalue as a disease response biomarker. This latter findingis in line with our previous data and that of other groups’findings using measurements of cell-associated or wholeblood EBV-DNA [12,15,32–35]. To our knowledge, we alsopresent the first large scale comparison of multiple versussingle-copy EBV-gene targets as a disease response bio-marker. BALF5 is consistently present as a single-copygene in the EBV genome. In contrast, BAMH1W is a multi-ple-copy gene with varying copy numbers between EBVstrains, ranging from 7 to 11 copies per genome [28].Studies have suggested that a multiple-copy gene may bemore sensitive, enabling detection of lower levels ofvirus and superior detection of early stage disease or anyresidual disease post-therapy [36]. The disadvantage isthat the variable copy number of BAMH1W limits theability to precisely quantify the number of viral genomes.Our data demonstrates that sensitivity was not enhancedby the use of multiple versus single-copy EBV-gene targets.As both genes provided equivalent results, we propose thatsingle, nonvariable copy genes are likely to be the optimalchoice as this permits precise quantification regardless ofthe viral strain. In addition, ROC analysis confirmed thatthe optimal cut-off value (to minimize false positives)was above the limits of the assay, thus, increased sensitiv-ity would not increase the precision of EBV-DNA as abiomarker.To our knowledge, this is the first detailed comparison of
lymphoma-specific versus nonspecific DNA as diseaseresponse biomarkers in lymphoma. Our results indicatethat both circulating c-f nonspecific DNA and lymphoma-specific DNA are elevated at presentation. However, onlylymphoma-specific DNA reflected therapeutic response.Lymphoma disease response can be monitored by bloodtests, but new lymphoma-specific biomarkers need to beidentified to broaden applicability.
AcknowledgmentsThe authors thank the Australasian Leukaemia and
Lymphoma Group, under whose auspices this study wasconducted. MKG and KJ designed this study, interpretedthe data, and wrote the manuscript; KJ collected andprocessed the samples, conducted the experimental stud-ies, analyzed the data, and performed statistical analysis;PC assisted processing the samples; JPN, CK, D Gottlieb,DSR, and D Gill contributed to study design and the writingof this manuscript.
References1. Jones K, Gandhi MK. Can a blood test monitor lymphoma? Leuk Lymphoma
2010;51:957–959.2. Garcia R, Hernandez JM, Caballero MD, et al. Serum lactate dehydrogenase
level as a prognostic factor in Hodgkin’s disease. Br J Cancer 1993;68:1227–1231.
3. Hourigan MJ, Doecke J, Mollee PN, et al. A new prognosticator for post-transplant lymphoproliferative disorders after renal transplantation. Br JHaematol 2008;141:904–907.
4. A predictive model for aggressive non-Hodgkin’s lymphoma. N Engl J Med1993;329:987–994.
5. Hohaus S, Giachelia M, Massini G, et al. Cell-free circulating DNA inHodgkin’s and non-Hodgkin’s lymphomas. Ann Oncol 2009;20:1408–1413.
6. Machado AS, Da Silva Robaina MC, Magalhaes De Rezende LM, et al.Circulating cell-free and Epstein-Barr virus DNA in pediatric B-non-Hodgkinlymphomas. Leuk Lymphoma 2010;51:1020–1027.
7. Anker P, Mulcahy H, Chen XQ, et al. Detection of circulating tumour DNA inthe blood (plasma/serum) of cancer patients. Cancer Metastasis Rev1999;18:65–73.
8. Wang BG, Huang HY, Chen YC, et al. Increased plasma DNA integrity incancer patients. Cancer Res 2003;63:3966–3968.
9. Vasioukhin V, Anker P, Maurice P, et al. Point mutations of the N-ras gene inthe blood plasma DNA of patients with myelodysplastic syndrome or acutemyelogenous leukaemia. Br J Haematol 1994;86:774–779.
10. Gandhi MK. Epstein-Barr virus-associated lymphomas. Expert Rev Anti InfectTher 2006;4:77–89.
11. Gallagher A, Armstrong AA, MacKenzie J, et al. Detection of Epstein-Barrvirus (EBV) genomes in the serum of patients with EBV-associated Hodgkin’sdisease. Int J Cancer 1999;84:442–448.
12. Gandhi MK, Lambley E, Burrows J, et al. Plasma Epstein-Barr virus (EBV)DNA is a biomarker for EBV-positive Hodgkin’s lymphoma. Clin Cancer Res2006;12:460–464.
13. Au WY, Pang A, Choy C, et al. Quantification of circulating Epstein-Barr virus(EBV) DNA in the diagnosis and monitoring of natural killer cell and EBV-positive lymphomas in immunocompetent patients. Blood 2004;104:243–249.
14. Lin JC, Wang WY, Chen KY, et al. Quantification of plasma Epstein-Barr virusDNA in patients with advanced nasopharyngeal carcinoma. N Engl J Med2004;350:2461–2470.
15. Hohaus S, Santangelo R, Giachelia M, et al. The viral load of Epstein-Barrvirus (EBV) DNA in peripheral blood predicts for biological and clinical charac-teristics in Hodgkin lymphoma. Clin Cancer Res 2011;17:2885–2892.
16. Tsai DE, Douglas L, Andreadis C, et al. EBV PCR in the diagnosis andmonitoring of posttransplant lymphoproliferative disorder: results of a two-armprospective trial. Am J Transplant 2008;8:1016–1024.
17. Jo SA, Hwang SH, Kim SY, et al. Quantitation of whole blood Epstein-Barrvirus DNA is useful for assessing treatment response in patients with non-Hodgkin’s lymphoma. Int J Lab Hematol 2010;32:e106–e113.
18. Swerdlow SH,Webber SA,Chadburn A, et al., editors. WHO classification oftumours of haematopoietic and lymphoid tissues,4th ed. Lyon: InternationalAgency for Research on Cancer; 2008.
19. Canellos GP, Anderson JR, Propert KJ, et al. Chemotherapy of advancedHodgkin’s disease with MOPP, ABVD, or MOPP alternating with ABVD. NEngl J Med 1992;327:1478–1484.
20. Coiffier B, Lepage E, Briere J, et al. CHOP chemotherapy plus rituximabcompared with CHOP alone in elderly patients with diffuse large-B-celllymphoma. N Engl J Med 2002;346:235–242.
21. Keane C, Gibbs S, Seymour JF, et al. The Hyper-CVAD chemotherapy regi-men has an adverse long-term impact on the ability to mobilize peripheralblood stem cells, which can be readily circumvented by using the early cyclesfor mobilization. Hematol Oncol 2006;24:159–163.
22. Trappe R, Hinrichs C, Appel U, et al. Treatment of PTLD with rituximab andCHOP reduces the risk of renal graft impairment after reduction of immuno-suppression. Am J Transplant 2009;9:2331–2337.
23. Gandhi MK, Lambley E, Duraiswamy J, et al. Expression of LAG-3 by tumor-infiltrating lymphocytes is coincident with the suppression of latent membraneantigen-specific CD81 T-cell function in Hodgkin lymphoma patients. Blood2006;108:2280–2289.
24. Cheson BD, Pfistner B, Juweid ME, et al. Revised response criteria for malig-nant lymphoma. J Clin Oncol 2007;25:579–586.
25. Kimura H, Morita M, Yabuta Y, et al. Quantitative analysis of Epstein-Barrvirus load by using a real-time PCR assay. J Clin Microbiol 1999;37:132–136.
26. Wagner HJ, Wessel M, Jabs W, et al. Patients at risk for development ofposttransplant lymphoproliferative disorder: Plasma versus peripheral bloodmononuclear cells as material for quantification of Epstein-Barr viral load byusing real-time quantitative polymerase chain reaction. Transplantation 2001;72:1012–1019.
27. Gault E, Michel Y, Dehee A, et al. Quantification of human cytomegalovirusDNA by real-time PCR. J Clin Microbiol 2001;39:772–775.
28. Ryan JL, Fan H, Glaser SL, et al. Epstein-Barr virus quantitation by real-timePCR targeting multiple gene segments: A novel approach to screen for thevirus in paraffin-embedded tissue and plasma. J Mol Diagn 2004;6:378–385.
29. Clave E, Agbalika F, Bajzik V, et al. Epstein-Barr virus (EBV) reactivation in allo-geneic stem-cell transplantation: Relationship between viral load, EBV-specificT-cell reconstitution and rituximab therapy. Transplantation 2004;77: 76–84.
30. van Esser JW, Niesters HG, Thijsen SF, et al. Molecular quantification of viralload in plasma allows for fast and accurate prediction of response to therapyof Epstein-Barr virus-associated lymphoproliferative disease after allogeneicstem cell transplantation. Br J Haematol 2001;113:814–821.
31. Preiksaitis JK, Pang XL, Fox JD, et al. Interlaboratory comparison of epstein-barr virus viral load assays. Am J Transplant 2009;9:269–279.
32. Yang J, Tao Q, Flinn IW, et al. Characterization of Epstein-Barr virus-infectedB cells in patients with posttransplantation lymphoproliferative disease: Disap-pearance after rituximab therapy does not predict clinical response. Blood2000;96:4055–4063.
33. Tsai DE, Nearey M, Hardy CL, et al. Use of EBV PCR for the diagnosis andmonitoring of post-transplant lymphoproliferative disorder in adult solid organtransplant patients. Am J Transplant 2002;2:946–954.
34. Oertel S, Trappe RU, Zeidler K, et al. Epstein-Barr viral load in whole blood ofadults with posttransplant lymphoproliferative disorder after solid organ transplan-tation does not correlate with clinical course. Ann Hematol 2006;85:478–484.
35. Suzuki R, Yamaguchi M, Izutsu K, et al. Prospective measurement ofEpstein-Barr virus DNA in plasma and peripheral blood mononuclear cells ofextranodal NK/T-cell lymphoma, nasal type. Blood, 2011 Oct 7. [Epub aheadof print].
36. Stevens SJ, Pronk I, Middeldorp JM. Toward standardization of Epstein-Barrvirus DNA load monitoring: Unfractionated whole blood as preferred clinicalspecimen. J Clin Microbiol 2001;39:1211–1216.
American Journal of Hematology 265
research article