tui group factbook · tui group factbook december 2016 . 2 urs •always use ... q1 q2 q3 q4 fy16...
TRANSCRIPT

TUI Group Factbook December 2016

2
Pri
mary
colo
urs
• Always use
TUITypeLight
• Font size14pt
• Line spacing 6 pt
• titles in TUI-Dark
Blue
• Bullet points &
standard text in
TUI-Dark Blue
Conve
nti
ons
Functio
nal
New TUI-Blue 50%
194.230.250
TUI-Dark Blue
9.42.94
New TUI-Blue
112.203.244
New TUI-Green
170.215.0
TUI-Yellow
255.225.0
TUI-Red
239.0.0
TUI-Black
0.0.0
TUI-White
255.255.255
New TUI-Grey
115.115.115
New TUI-Grey 25%
220.220.220 Ach
rom
atic
TUI Group at a glance
A clear structure to deliver growth and value
Marketing & Sales in
Source Markets
Tour operator
• Travel Agencies
• Internet Portals
• Mobile Services
• Destination Services
• Airlines
Revenue
€15.4bn
EBITA
€635m
19.2 million
customers
1 Thomson Cruise result included within Source Market (UK)
Tourism
2 TUI Cruises
Hotels & Resorts
Hotelportfolio
• 303 hotels
• 213,500 beds
• Well known brands
Revenue
€619m
EBITA
€287m
78%
occupancy
Cruises
Cruise ship fleet
• 14 cruise ships across 3 brands
• TUI Cruises, Hapag-Lloyd Cruises
& Thomson Cruises
Revenue
€297m
EBITA
€130m
103%
occupancy
1
²
TUI Group – Revenue: €17.2bn, Underlying EBITA: €1,001m

3
Pri
mary
colo
urs
• Always use
TUITypeLight
• Font size14pt
• Line spacing 6 pt
• titles in TUI-Dark
Blue
• Bullet points &
standard text in
TUI-Dark Blue
Conve
nti
ons
Functio
nal
New TUI-Blue 50%
194.230.250
TUI-Dark Blue
9.42.94
New TUI-Blue
112.203.244
New TUI-Green
170.215.0
TUI-Yellow
255.225.0
TUI-Red
239.0.0
TUI-Black
0.0.0
TUI-White
255.255.255
New TUI-Grey
115.115.115
New TUI-Grey 25%
220.220.220 Ach
rom
atic Cruises (including Thomson)
Integrated model enables us to deliver around 50% of
earnings from content
Our content businesses are less seasonal
FY16 Q1 Q2 Q3 Q4
€1,001m
€504m
FY16 Q1 Q3 Q2 Q4
Content Businesses Underlying EBITA FY16
Group Underlying EBITA FY16 1 Hotels and Cruises (TUI Cruises, Thomson Cruises, & Hapag-Lloyd Cruises) 2 Pro forma numbers for Thomson Cruises
Content businesses mix
Hotels Source Markets,
Destination Services
& All Other
Growth in content is de-risked through our direct customer relationships
2
1
4
Pri
mary
colo
urs
• Always use
TUITypeLight
• Font size14pt
• Line spacing 6 pt
• titles in TUI-Dark
Blue
• Bullet points &
standard text in
TUI-Dark Blue
Conve
nti
ons
Functio
nal
New TUI-Blue 50%
194.230.250
TUI-Dark Blue
9.42.94
New TUI-Blue
112.203.244
New TUI-Green
170.215.0
TUI-Yellow
255.225.0
TUI-Red
239.0.0
TUI-Black
0.0.0
TUI-White
255.255.255
New TUI-Grey
115.115.115
New TUI-Grey 25%
220.220.220 Ach
rom
atic
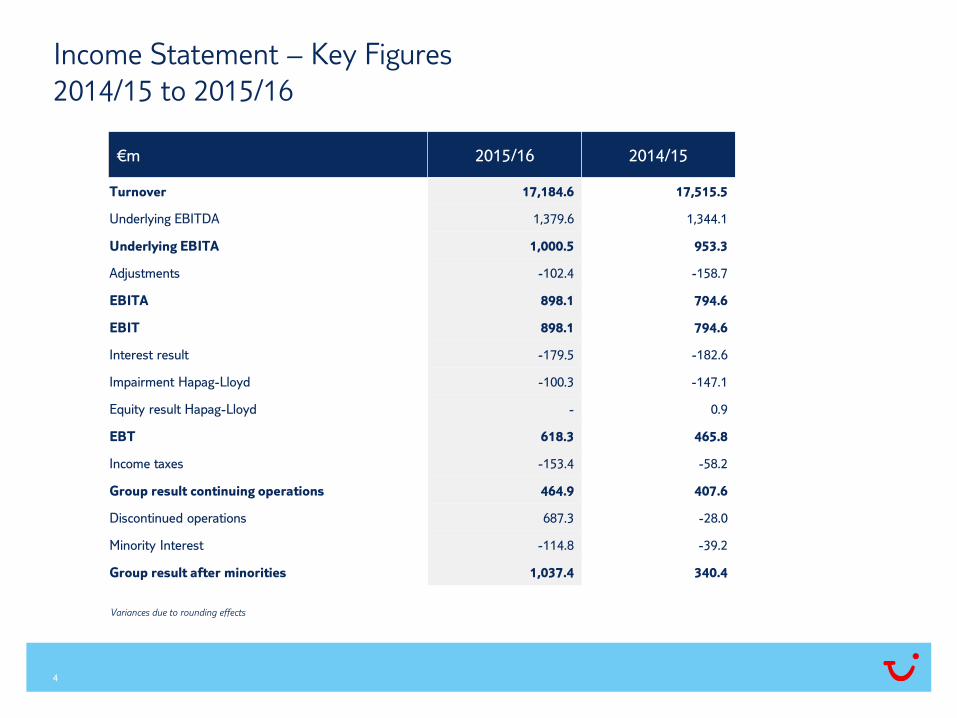
Income Statement – Key Figures
2014/15 to 2015/16
€m 2015/16 2014/15
Turnover 17,184.6 17,515.5
Underlying EBITDA 1,379.6 1,344.1
Underlying EBITA 1,000.5 953.3
Adjustments -102.4 -158.7
EBITA 898.1 794.6
EBIT 898.1 794.6
Interest result -179.5 -182.6
Impairment Hapag-Lloyd -100.3 -147.1
Equity result Hapag-Lloyd - 0.9
EBT 618.3 465.8
Income taxes -153.4 -58.2
Group result continuing operations 464.9 407.6
Discontinued operations 687.3 -28.0
Minority Interest -114.8 -39.2
Group result after minorities 1,037.4 340.4
Variances due to rounding effects

5
Pri
mary
colo
urs
• Always use
TUITypeLight
• Font size14pt
• Line spacing 6 pt
• titles in TUI-Dark
Blue
• Bullet points &
standard text in
TUI-Dark Blue
Conve
nti
ons
Functio
nal
New TUI-Blue 50%
194.230.250
TUI-Dark Blue
9.42.94
New TUI-Blue
112.203.244
New TUI-Green
170.215.0
TUI-Yellow
255.225.0
TUI-Red
239.0.0
TUI-Black
0.0.0
TUI-White
255.255.255
New TUI-Grey
115.115.115
New TUI-Grey 25%
220.220.220 Ach
rom
atic
Underlying EBITDA
2014/15 to 2015/16
In €m 2015/16 2014/15 Change
Northern Region 541.7 629.8 -88.1
Central Region 109.0 127.9 -18.9
Western Region 108.3 85.5 22.8
Source Markets 759.0 843.2 -84.2
Hotels & Resorts 377.9 343.2 34.7
Cruises 148.9 97.6 51.3
Other Tourism 65.3 73.2 -7.9
Tourism 1,351.1 1,357.4 -6.3
All Other Segments 28.5 -13.2 41.8
TUI Group continuing operations 1,379.6 1,344.1 35.5
* unaudited figures
*

6
Pri
mary
colo
urs
• Always use
TUITypeLight
• Font size14pt
• Line spacing 6 pt
• titles in TUI-Dark
Blue
• Bullet points &
standard text in
TUI-Dark Blue
Conve
nti
ons
Functio
nal
New TUI-Blue 50%
194.230.250
TUI-Dark Blue
9.42.94
New TUI-Blue
112.203.244
New TUI-Green
170.215.0
TUI-Yellow
255.225.0
TUI-Red
239.0.0
TUI-Black
0.0.0
TUI-White
255.255.255
New TUI-Grey
115.115.115
New TUI-Grey 25%
220.220.220 Ach
rom
atic
Earnings Per Share (continuing operations)
€m Reported Pro forma*
2015/16 2014/15 2015/16 2014/15
EBITA 898 795 1,001 953
Net interest expense -180 -183 -180 -163
H-L AG book value adjustment and equity result -100 -146 - -
EBT 618 466 821 790
Tax rate 25% 12% 25% 25%
Tax charge -153 -58 -205 -197
Minority interest -111 -56 -111 -90
Hybrid dividend - -11 - -11
Net income 354 341 504 492
Basic number of shares 584 513 587 587
Basic Earnings per Share (€) 0.61 0.66 0.86 0.84
* Pro forma number of shares excludes 6.5m shares relating to employee stock options and Employee Benefits Trust; figures are rounded
Excludes convertible
bond interest
Underlying effective
tax rate calculated
based on underlying
EBT, adjusted for
convertible bond
interest
Pro forma minority
interest excludes TUI
Travel for full year
Pro forma NOSH
based on issued share
capital as at 30.9.16

7
Pri
mary
colo
urs
• Always use
TUITypeLight
• Font size14pt
• Line spacing 6 pt
• titles in TUI-Dark
Blue
• Bullet points &
standard text in
TUI-Dark Blue
Conve
nti
ons
Functio
nal
New TUI-Blue 50%
194.230.250
TUI-Dark Blue
9.42.94
New TUI-Blue
112.203.244
New TUI-Green
170.215.0
TUI-Yellow
255.225.0
TUI-Red
239.0.0
TUI-Black
0.0.0
TUI-White
255.255.255
New TUI-Grey
115.115.115
New TUI-Grey 25%
220.220.220 Ach
rom
atic
Cash Flow
In €m 2015/16 2014/15*
EBITA reported** 898.1 794.6
Depreciation** 407.0 420.2
Working capital 271.8 -82.8
Other cash effects 63.7 17.5
At equity income** -187.2 -114.0
Dividends received from JVs and associates 82.2 81.3
Tax paid -186.4 -148.4
Interest (cash) -71.2 -73.3
Pension contribution -335.6 -184.3
Operating Cashflow 942.4 710.8
Net capex -533.4 -496.8
Net investments 758.9 -174.1
Net pre-delivery payments -48.7 11.9
Free Cashflow 1,119.2 51.8
Dividends & Hybrid Interest -341.1 -306.3
Movement in Cash Net of Debt 778.1 -254.5
*Prior year restated due to exclusion of Hotelbeds & Travelopia in reported EBITDA
**Continuing ops basis – non-continuing adjustment in Other cash effects
8
Pri
mary
colo
urs
• Always use
TUITypeLight
• Font size14pt
• Line spacing 6 pt
• titles in TUI-Dark
Blue
• Bullet points &
standard text in
TUI-Dark Blue
Conve
nti
ons
Functio
nal
New TUI-Blue 50%
194.230.250
TUI-Dark Blue
9.42.94
New TUI-Blue
112.203.244
New TUI-Green
170.215.0
TUI-Yellow
255.225.0
TUI-Red
239.0.0
TUI-Black
0.0.0
TUI-White
255.255.255
New TUI-Grey
115.115.115
New TUI-Grey 25%
220.220.220 Ach
rom
atic
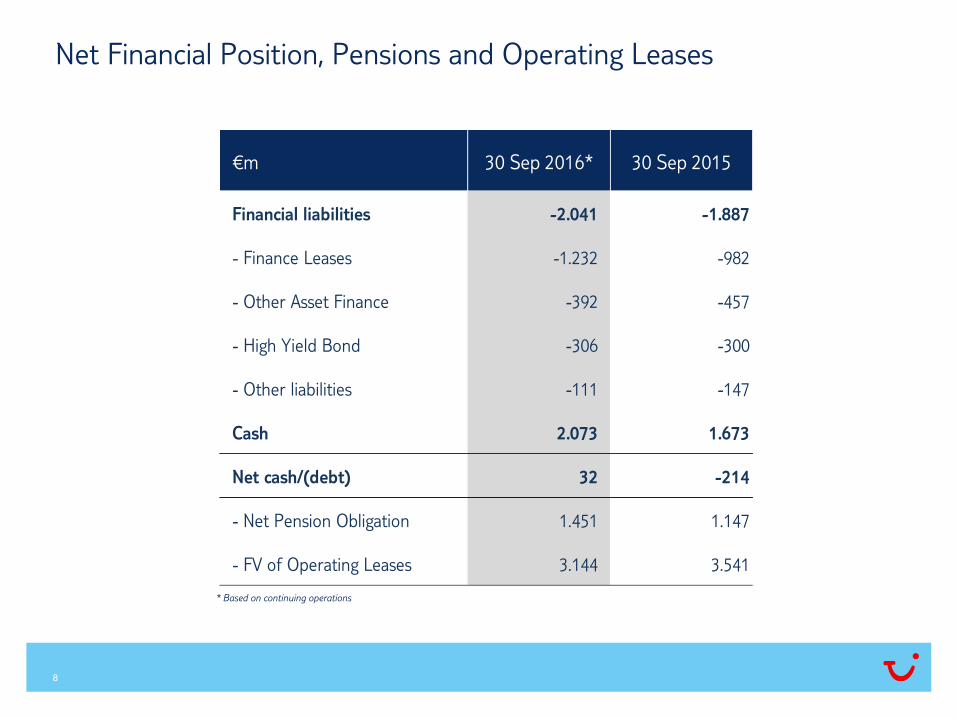
Net Financial Position, Pensions and Operating Leases
€m 30 Sep 2016* 30 Sep 2015
Financial liabilities -2.041 -1.887
- Finance Leases -1.232 -982
- Other Asset Finance -392 -457
- High Yield Bond -306 -300
- Other liabilities -111 -147
Cash 2.073 1.673
Net cash/(debt) 32 -214
- Net Pension Obligation 1.451 1.147
- FV of Operating Leases 3.144 3.541
* Based on continuing operations

9
Pri
mary
colo
urs
• Always use
TUITypeLight
• Font size14pt
• Line spacing 6 pt
• titles in TUI-Dark
Blue
• Bullet points &
standard text in
TUI-Dark Blue
Conve
nti
ons
Functio
nal
New TUI-Blue 50%
194.230.250
TUI-Dark Blue
9.42.94
New TUI-Blue
112.203.244
New TUI-Green
170.215.0
TUI-Yellow
255.225.0
TUI-Red
239.0.0
TUI-Black
0.0.0
TUI-White
255.255.255
New TUI-Grey
115.115.115
New TUI-Grey 25%
220.220.220 Ach
rom
atic
Key Sources of Funding 30 September 2016
Instrument Issue Maturity Amount €mInterest %
p.a.*
Revolving Credit Facility Sep 14 Dec 20 1,750** E/L +1.55
High Yield Bond Sep 14 Oct 19 300 4.5
Finance leases Various Various 1,232 Various
*Upgrade of our rating by Moody’s has reduced our RCF interest margin from 1.7% to 1.55% p.a as of 27/04/2016.
**Including a tranche of €215.0m for the issue of bank guarantees
Note: €300m Senior Notes with a coupon of 2.125% p.a was issued post Balance Sheet date on 26 October 2016. The notes will mature on 26 October 2021.
The High Yield Bond was repaid in full post Balance Sheet date on 18 November 2016.

10
Pri
mary
colo
urs
• Always use
TUITypeLight
• Font size14pt
• Line spacing 6 pt
• titles in TUI-Dark
Blue
• Bullet points &
standard text in
TUI-Dark Blue
Conve
nti
ons
Functio
nal
New TUI-Blue 50%
194.230.250
TUI-Dark Blue
9.42.94
New TUI-Blue
112.203.244
New TUI-Green
170.215.0
TUI-Yellow
255.225.0
TUI-Red
239.0.0
TUI-Black
0.0.0
TUI-White
255.255.255
New TUI-Grey
115.115.115
New TUI-Grey 25%
220.220.220 Ach
rom
atic
FX and Fuel
Hedging as at 2 December 2016
Hedging Winter 2016/17 Summer 2017 Winter 2017/18
Euro 95% 82% 40%
US Dollars 90% 75% 45%
Jet Fuel 92% 88% 66%

11
Pri
mary
colo
urs
• Always use
TUITypeLight
• Font size14pt
• Line spacing 6 pt
• titles in TUI-Dark
Blue
• Bullet points &
standard text in
TUI-Dark Blue
Conve
nti
ons
Functio
nal
New TUI-Blue 50%
194.230.250
TUI-Dark Blue
9.42.94
New TUI-Blue
112.203.244
New TUI-Green
170.215.0
TUI-Yellow
255.225.0
TUI-Red
239.0.0
TUI-Black
0.0.0
TUI-White
255.255.255
New TUI-Grey
115.115.115
New TUI-Grey 25%
220.220.220 Ach
rom
atic
Financial Target Ratios 2015/16
In €m 15/16
Gross debt 2,041
Pensions 1,451
NPV operating leases 3,320
Debt 6,812
Reported EBITDAR 2,050
Leverage Ratio 3.3x
Reported EBITDAR 2,050
Rentals - interest component* 248
Net interest expense 180
Interest charges 428
Coverage Ratio 4.8x
* Simplified approach - one third of long-term rental expense

12
Pri
mary
colo
urs
• Always use
TUITypeLight
• Font size14pt
• Line spacing 6 pt
• titles in TUI-Dark
Blue
• Bullet points &
standard text in
TUI-Dark Blue
Conve
nti
ons
Functio
nal
New TUI-Blue 50%
194.230.250
TUI-Dark Blue
9.42.94
New TUI-Blue
112.203.244
New TUI-Green
170.215.0
TUI-Yellow
255.225.0
TUI-Red
239.0.0
TUI-Black
0.0.0
TUI-White
255.255.255
New TUI-Grey
115.115.115
New TUI-Grey 25%
220.220.220 Ach
rom
atic
Source Markets
Summary 2015/16
Figures shown as a percentage of revenue unless otherwise stated
* Excludes strategic ventures in Canada and Russia/CIS
Northern
Region
Central
Region
Western
Region
Total Source
Markets
Customers (000)* 7,388 6,828 5,016 19,231
External turnover (€m) 7,001 5,567 2,870 15,438
Underlying EBITA (€m) 461 88 86 635
EBITA Margin (%) 6.6 1.6 3.0 4.1
Direct distribution mix 92 47 70 72
Online mix 62 15 52 43

13
Pri
mary
colo
urs
• Always use
TUITypeLight
• Font size14pt
• Line spacing 6 pt
• titles in TUI-Dark
Blue
• Bullet points &
standard text in
TUI-Dark Blue
Conve
nti
ons
Functio
nal
New TUI-Blue 50%
194.230.250
TUI-Dark Blue
9.42.94
New TUI-Blue
112.203.244
New TUI-Green
170.215.0
TUI-Yellow
255.225.0
TUI-Red
239.0.0
TUI-Black
0.0.0
TUI-White
255.255.255
New TUI-Grey
115.115.115
New TUI-Grey 25%
220.220.220 Ach
rom
atic
Package
(with flight)
Flight only
Overland
Customers split by holiday type
Accommodation
40%
Direct Operating Cost split
Accommodation only
Source Markets
Summary 2015/16
Other
Fuel
Aircraft
lease / 3P
flying cost
Other airline
All other
Accommodation

14
Pri
mary
colo
urs
• Always use
TUITypeLight
• Font size14pt
• Line spacing 6 pt
• titles in TUI-Dark
Blue
• Bullet points &
standard text in
TUI-Dark Blue
Conve
nti
ons
Functio
nal
New TUI-Blue 50%
194.230.250
TUI-Dark Blue
9.42.94
New TUI-Blue
112.203.244
New TUI-Green
170.215.0
TUI-Yellow
255.225.0
TUI-Red
239.0.0
TUI-Black
0.0.0
TUI-White
255.255.255
New TUI-Grey
115.115.115
New TUI-Grey 25%
220.220.220 Ach
rom
atic
TUI
Thomas
Cook
Jet2
Cosmos
Source Markets: Northern Region – UK (2015/16)
• Leading tourism brands with high levels of direct
distribution and unique & differentiated
holidays driving superior performance
• Key growth drivers - broader & more flexible
customer offering, modernised cruise offering,
long-haul
• Platform improvements (IT, airline) delivering
improved customer experience and enabling
opportunities for profitable top-line growth
Seasonality
H2 (Summer)
71% customers
H1 (Winter)
29% customers
over 90% of pax flown
by own airlines
Customers 6.0m
EBITA Margin 7.0%
Market Share* Positioning Key Figures
Holidays
S16 top 3 destinations
• Spain (incl. Canaries)
• Greece
• Cyprus
Distribution
* Company estimates, 2015 data
All others
58%
34%
8%
2015/16
Third party
Own retail*
Online
* includes Owned Retail, Franchise Retail and Call Centre

15
Pri
mary
colo
urs
• Always use
TUITypeLight
• Font size14pt
• Line spacing 6 pt
• titles in TUI-Dark
Blue
• Bullet points &
standard text in
TUI-Dark Blue
Conve
nti
ons
Functio
nal
New TUI-Blue 50%
194.230.250
TUI-Dark Blue
9.42.94
New TUI-Blue
112.203.244
New TUI-Green
170.215.0
TUI-Yellow
255.225.0
TUI-Red
239.0.0
TUI-Black
0.0.0
TUI-White
255.255.255
New TUI-Grey
115.115.115
New TUI-Grey 25%
220.220.220 Ach
rom
atic
TUI
Thomas
Cook
Kuoni
All
others
Source Markets: Northern Region – Nordic (2015/16)
Seasonality
H2 (Summer)
57% customers
H1 (Winter)
43% customers
Market Share* Positioning Key Figures
Holidays Distribution
* Company estimates, 2015 data
• Online driven business
• High levels of unique content
• Higher proportion of winter holidays than
other European source markets
• TUI rebrand commenced November 2016
c55% of pax flown by
own airlines
S16 top 3 destinations
• Greece
• Spain (incl. Canaries)
• Cyprus
75%
15%
10%
2015/16
Third party
Own retail*
Online
Customers 1.4m
EBITA Margin 3.2%
* includes Owned Retail, Franchise Retail and Call Centre

16
Pri
mary
colo
urs
• Always use
TUITypeLight
• Font size14pt
• Line spacing 6 pt
• titles in TUI-Dark
Blue
• Bullet points &
standard text in
TUI-Dark Blue
Conve
nti
ons
Functio
nal
New TUI-Blue 50%
194.230.250
TUI-Dark Blue
9.42.94
New TUI-Blue
112.203.244
New TUI-Green
170.215.0
TUI-Yellow
255.225.0
TUI-Red
239.0.0
TUI-Black
0.0.0
TUI-White
255.255.255
New TUI-Grey
115.115.115
New TUI-Grey 25%
220.220.220 Ach
rom
atic
TUI
Thomas
Cook
DER FTI Gp
All
others
Source Markets: Central Region – Germany (2015/16)
Seasonality
H2 (Summer)
67% customers
H1 (Winter)
33% customers
Market Share* Positioning Key Figures
Holidays Distribution
* Company estimates, 2015 data - rebased based on GfK Tour
Operator Market Share data
c60% of pax flown by
own airline
S16 top 3 destinations
• Spain (incl. Canaries)
• Greece
• Turkey
• Strong holiday brands
• Fragmented market, dominated by large
number of third party travel agencies
• Focussed on increasing controlled distribution
(both offline and online) and profitably growing
market share and driving further operational
efficiency improvements
14%
31%
55%
2015/16
Third party
Own retail*
Online
Customers 6.3m
EBITA Margin 1.5%
**Germany and Austria excl. L‘tur
**
*includes Owned Retail, Franchise Retail and Call Centre
17
Pri
mary
colo
urs
• Always use
TUITypeLight
• Font size14pt
• Line spacing 6 pt
• titles in TUI-Dark
Blue
• Bullet points &
standard text in
TUI-Dark Blue
Conve
nti
ons
Functio
nal
New TUI-Blue 50%
194.230.250
TUI-Dark Blue
9.42.94
New TUI-Blue
112.203.244
New TUI-Green
170.215.0
TUI-Yellow
255.225.0
TUI-Red
239.0.0
TUI-Black
0.0.0
TUI-White
255.255.255
New TUI-Grey
115.115.115
New TUI-Grey 25%
220.220.220 Ach
rom
atic
TUI
Thomas
Cook
Corendon
All others
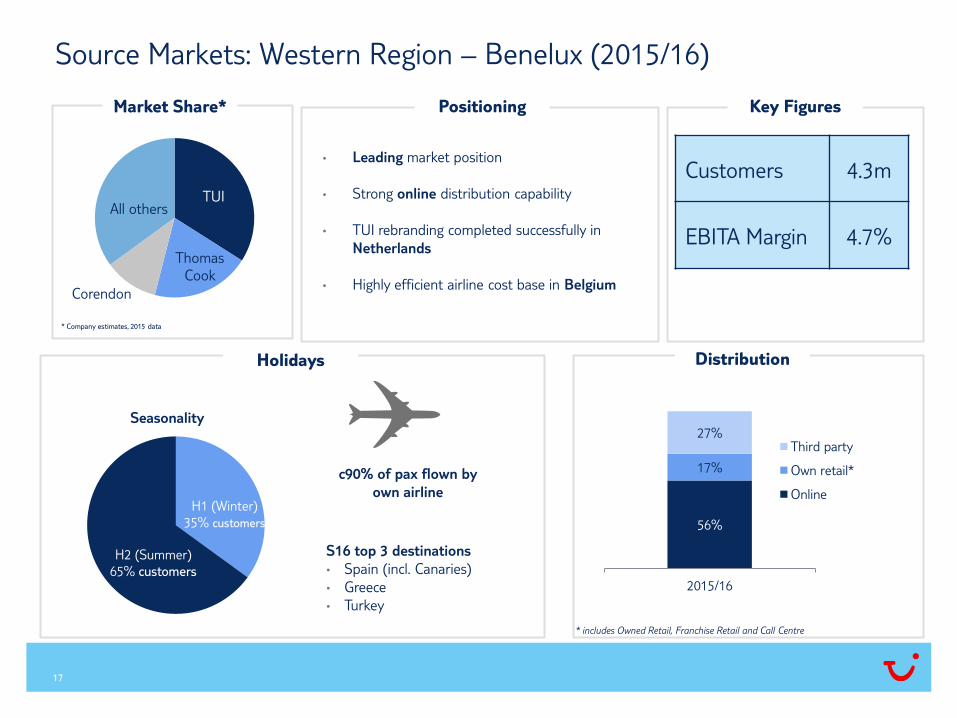
Source Markets: Western Region – Benelux (2015/16)
Seasonality
H2 (Summer)
65% customers
H1 (Winter)
35% customers
Market Share* Positioning Key Figures
Holidays Distribution
* Company estimates, 2015 data
c90% of pax flown by
own airline
S16 top 3 destinations
• Spain (incl. Canaries)
• Greece
• Turkey
• Leading market position
• Strong online distribution capability
• TUI rebranding completed successfully in
Netherlands
• Highly efficient airline cost base in Belgium
56%
17%
27%
2015/16
Third party
Own retail*
Online
Customers 4.3m
EBITA Margin 4.7%
* includes Owned Retail, Franchise Retail and Call Centre
18
Pri
mary
colo
urs
• Always use
TUITypeLight
• Font size14pt
• Line spacing 6 pt
• titles in TUI-Dark
Blue
• Bullet points &
standard text in
TUI-Dark Blue
Conve
nti
ons
Functio
nal
New TUI-Blue 50%
194.230.250
TUI-Dark Blue
9.42.94
New TUI-Blue
112.203.244
New TUI-Green
170.215.0
TUI-Yellow
255.225.0
TUI-Red
239.0.0
TUI-Black
0.0.0
TUI-White
255.255.255
New TUI-Grey
115.115.115
New TUI-Grey 25%
220.220.220 Ach
rom
atic
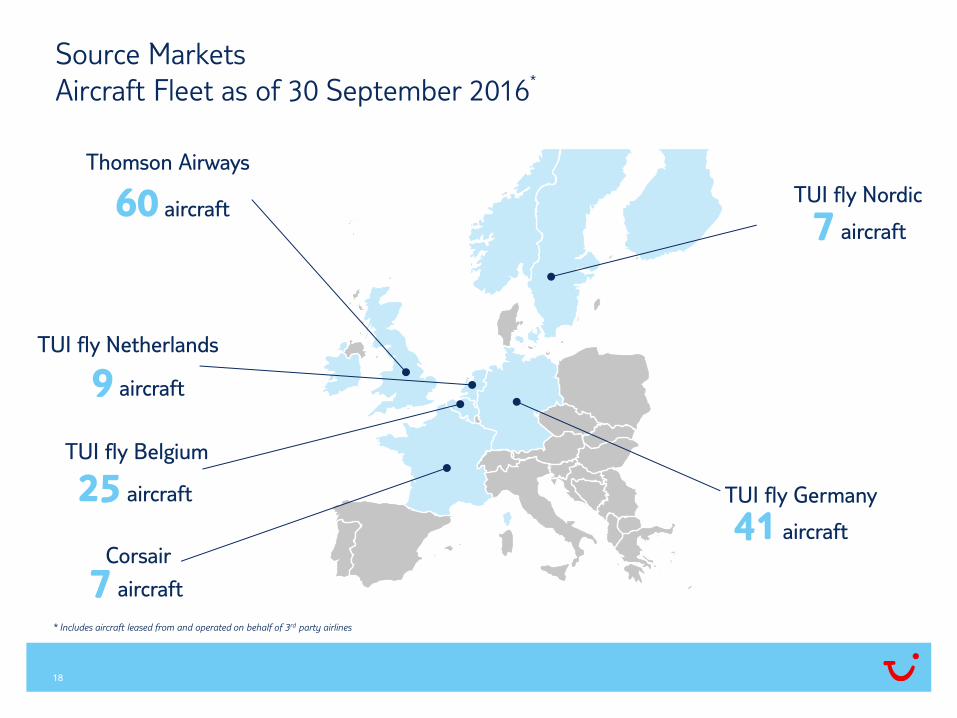
Source Markets
Aircraft Fleet as of 30 September 2016
* Includes aircraft leased from and operated on behalf of 3rd party airlines
9 aircraft
25 aircraft
41 aircraft
7 aircraft 60 aircraft
Thomson Airways
TUI fly Netherlands
TUI fly Belgium
7 aircraft
Corsair
TUI fly Nordic
TUI fly Germany
*

19
Pri
mary
colo
urs
• Always use
TUITypeLight
• Font size14pt
• Line spacing 6 pt
• titles in TUI-Dark
Blue
• Bullet points &
standard text in
TUI-Dark Blue
Conve
nti
ons
Functio
nal
New TUI-Blue 50%
194.230.250
TUI-Dark Blue
9.42.94
New TUI-Blue
112.203.244
New TUI-Green
170.215.0
TUI-Yellow
255.225.0
TUI-Red
239.0.0
TUI-Black
0.0.0
TUI-White
255.255.255
New TUI-Grey
115.115.115
New TUI-Grey 25%
220.220.220 Ach
rom
atic
Source Markets
Aircraft Order Book Deliveries 16/17 17/18 18/19 19/20 20/21
B737 NG - - - - -
B737-MAX - 5 18 18 12
B787-8 - - - - -
B787-9 1 2 - - -
Firm order book deliveries 2017-2021 1 7 18 18 12
Financial Years (FY) ending 30 September; figures correct as at 30 September 2016
16/17 17/18 18/19 19/20 20/21
B737-MAX - - - 2 9
B787-9 - - 1 - -
Option order book deliveries 2017-2021 - - 1 2 9
Financial Years (FY) ending 30 September; figures correct as at 30 September 2016
In addition to the above firm orders, TUI Group has further aircraft options :

20
Pri
mary
colo
urs
• Always use
TUITypeLight
• Font size14pt
• Line spacing 6 pt
• titles in TUI-Dark
Blue
• Bullet points &
standard text in
TUI-Dark Blue
Conve
nti
ons
Functio
nal
New TUI-Blue 50%
194.230.250
TUI-Dark Blue
9.42.94
New TUI-Blue
112.203.244
New TUI-Green
170.215.0
TUI-Yellow
255.225.0
TUI-Red
239.0.0
TUI-Black
0.0.0
TUI-White
255.255.255
New TUI-Grey
115.115.115
New TUI-Grey 25%
220.220.220 Ach
rom
atic
Source Markets
Aircraft Commitments by Financing Type
Operating Lease* Finance Lease Owned Total
As at 30 September 2015 124 15 8 147
Order book financing - 1 - 1
External Lessor deliveries 7 - - 7
External Lessor Returns (6) - - (6)
As at 30 September 2016 125 16 8 149
Financing ~€2bn ~€1bn ~€0.1bn €3.0bn
* Includes aircraft leased from and operated on behalf of 3rd party airlines
21
Pri
mary
colo
urs
• Always use
TUITypeLight
• Font size14pt
• Line spacing 6 pt
• titles in TUI-Dark
Blue
• Bullet points &
standard text in
TUI-Dark Blue
Conve
nti
ons
Functio
nal
New TUI-Blue 50%
194.230.250
TUI-Dark Blue
9.42.94
New TUI-Blue
112.203.244
New TUI-Green
170.215.0
TUI-Yellow
255.225.0
TUI-Red
239.0.0
TUI-Black
0.0.0
TUI-White
255.255.255
New TUI-Grey
115.115.115
New TUI-Grey 25%
220.220.220 Ach
rom
atic
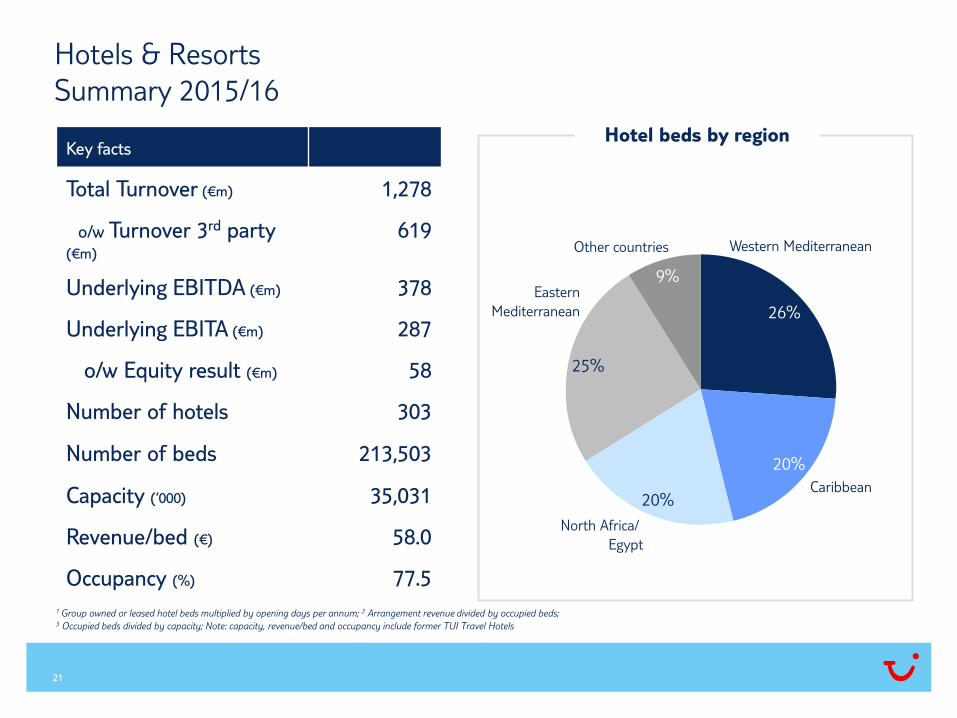
Hotels & Resorts
Summary 2015/16
Hotel beds by region
30%
Key facts
Total Turnover (€m) 1,278
o/w Turnover 3rd party (€m)
619
Underlying EBITDA (€m) 378
Underlying EBITA (€m) 287
o/w Equity result (€m) 58
Number of hotels 303
Number of beds 213,503
Capacity (‘000) 35,031
Revenue/bed (€) 58.0
Occupancy (%) 77.5
1 Group owned or leased hotel beds multiplied by opening days per annum; 2 Arrangement revenue divided by occupied beds; 3 Occupied beds divided by capacity; Note: capacity, revenue/bed and occupancy include former TUI Travel Hotels
20%
Other countries
25%
North Africa/
Egypt
Eastern
Mediterranean
20% Caribbean
26%
Western Mediterranean
9%

22
Pri
mary
colo
urs
• Always use
TUITypeLight
• Font size14pt
• Line spacing 6 pt
• titles in TUI-Dark
Blue
• Bullet points &
standard text in
TUI-Dark Blue
Conve
nti
ons
Functio
nal
New TUI-Blue 50%
194.230.250
TUI-Dark Blue
9.42.94
New TUI-Blue
112.203.244
New TUI-Green
170.215.0
TUI-Yellow
255.225.0
TUI-Red
239.0.0
TUI-Black
0.0.0
TUI-White
255.255.255
New TUI-Grey
115.115.115
New TUI-Grey 25%
220.220.220 Ach
rom
atic
Hotels & Resorts
Long-term Performance
30% 80,6 78,7
77,5
84,7 85,9
89,6
FY14 FY15 FY16
Hotels & Resorts2 RIU2
54,0 55,0
58,0
50,5
57,1
60,3
FY14 FY15 FY16
Hotels & Resorts2 RIU
9,3
10,5
12,3
FY14 FY15 FY16
ROIC % Revenue Per Bed € Occupancy Rates %
ROIC increased from 10.5% to 12.3% in FY 16, compared with segmental WACC of 6.5%
1 FY14 excludes TUI Travel Hotels 2 Includes Hotels in Turkey
1 1

23
Pri
mary
colo
urs
• Always use
TUITypeLight
• Font size14pt
• Line spacing 6 pt
• titles in TUI-Dark
Blue
• Bullet points &
standard text in
TUI-Dark Blue
Conve
nti
ons
Functio
nal
New TUI-Blue 50%
194.230.250
TUI-Dark Blue
9.42.94
New TUI-Blue
112.203.244
New TUI-Green
170.215.0
TUI-Yellow
255.225.0
TUI-Red
239.0.0
TUI-Black
0.0.0
TUI-White
255.255.255
New TUI-Grey
115.115.115
New TUI-Grey 25%
220.220.220 Ach
rom
atic
Hotels & Resorts
2016 Hotel Summary by concept

24
Pri
mary
colo
urs
• Always use
TUITypeLight
• Font size14pt
• Line spacing 6 pt
• titles in TUI-Dark
Blue
• Bullet points &
standard text in
TUI-Dark Blue
Conve
nti
ons
Functio
nal
New TUI-Blue 50%
194.230.250
TUI-Dark Blue
9.42.94
New TUI-Blue
112.203.244
New TUI-Green
170.215.0
TUI-Yellow
255.225.0
TUI-Red
239.0.0
TUI-Black
0.0.0
TUI-White
255.255.255
New TUI-Grey
115.115.115
New TUI-Grey 25%
220.220.220 Ach
rom
atic
Hotels & Resorts
Financing Structure 2015/16
Risk and return profile (illustrative)
Managed
Leased
Owned
++
Ris
k
Return ++
Average duration of management, Lease & Franchise contracts:
10 years, mainly with option for renewal for another 5 years
Financing structure
46%
10%
6%
38%
3% Lease
Franchise
15%
Ownership
44%
Management

25
Pri
mary
colo
urs
• Always use
TUITypeLight
• Font size14pt
• Line spacing 6 pt
• titles in TUI-Dark
Blue
• Bullet points &
standard text in
TUI-Dark Blue
Conve
nti
ons
Functio
nal
New TUI-Blue 50%
194.230.250
TUI-Dark Blue
9.42.94
New TUI-Blue
112.203.244
New TUI-Green
170.215.0
TUI-Yellow
255.225.0
TUI-Red
239.0.0
TUI-Black
0.0.0
TUI-White
255.255.255
New TUI-Grey
115.115.115
New TUI-Grey 25%
220.220.220 Ach
rom
atic
Hotels & Resorts
Profit analysis 2015/16
* As at 30/9/2016 - financing structure : Management 44%, Ownership 38%, Lease 15%, Franchise 3%
160
Owned & leased hotels*
35,031
Capacity
77.5%
Occupancy
x 58.00€
Rate
x €1,574m
Bed revenue
=
€m
1,574
Bed revenue
324
Other
1,898
Total
1,278
o/w fully
consolidated
620
o/w
associated
o/w turnover internal 659
o/w turnover 3rd party 619
Underlying EBITDA (incl. associated EAT) 378 320 58
Underlying EBITA (incl. associated EAT) 287 229 58
Turnover owned & leased
Tables contain unaudited figures and includes former TUI Travel Hotels

26
Pri
mary
colo
urs
• Always use
TUITypeLight
• Font size14pt
• Line spacing 6 pt
• titles in TUI-Dark
Blue
• Bullet points &
standard text in
TUI-Dark Blue
Conve
nti
ons
Functio
nal
New TUI-Blue 50%
194.230.250
TUI-Dark Blue
9.42.94
New TUI-Blue
112.203.244
New TUI-Green
170.215.0
TUI-Yellow
255.225.0
TUI-Red
239.0.0
TUI-Black
0.0.0
TUI-White
255.255.255
New TUI-Grey
115.115.115
New TUI-Grey 25%
220.220.220 Ach
rom
atic
Hotels & Resorts RIU – Key figures 2015/16
* unaudited figures
35%
53%
7% 5%
Management
Ownership
Lease
Franchise
Financing structure (%)
28%
5%
49%
3%
15% Western Med.
North Africa
Caribbean
Eastern Med.
Other
Total
86,184
Hotel beds by region (%)
94
Hotels
€m
Riu 100%-view* Total o/w RIUSA II(fully consolidated)
o/w Riu Hotels(consolidated at equity)
Riu in
TUI accounts
Turnover 1,112 796 316 796
Underlying EBITA 405 273.5 131 318.3
EBITA-Margin 36%
EAT 314 221 93
o/w EAT to TUI (50%) 156 111 44.8 156
ROIC (incl. Goodwill) 20%
ROIC (excl. Goodwill) 26%

27
Pri
mary
colo
urs
• Always use
TUITypeLight
• Font size14pt
• Line spacing 6 pt
• titles in TUI-Dark
Blue
• Bullet points &
standard text in
TUI-Dark Blue
Conve
nti
ons
Functio
nal
New TUI-Blue 50%
194.230.250
TUI-Dark Blue
9.42.94
New TUI-Blue
112.203.244
New TUI-Green
170.215.0
TUI-Yellow
255.225.0
TUI-Red
239.0.0
TUI-Black
0.0.0
TUI-White
255.255.255
New TUI-Grey
115.115.115
New TUI-Grey 25%
220.220.220 Ach
rom
atic
Hotels & Resorts RIU Portfolio
M = Management; O = Ownership; L = Lease; F = Franchise; figures at 30 Sep 2016
Eastern Med.: 2 hotels
Mexico
Jamaica
Costa Rica
Panama
Aruba
USA
Bahamas
Dom. Rep.
Cape Verde
Morocco
Sri Lanka
Spain
Portugal
Bulgaria
Turkey
St. Martin
Caribbean: 38 hotels
F L O
47%
M
53%
F
100%
L O M
Western Med.: 33 hotels
F
9%
L
18%
O
64%
M
9%
North Africa: 7 hotels
O L F
71%
M
29%
Other: 14 hotels
L F M
57%
O
43%
Germany
Mauritius
Ireland

28
Pri
mary
colo
urs
• Always use
TUITypeLight
• Font size14pt
• Line spacing 6 pt
• titles in TUI-Dark
Blue
• Bullet points &
standard text in
TUI-Dark Blue
Conve
nti
ons
Functio
nal
New TUI-Blue 50%
194.230.250
TUI-Dark Blue
9.42.94
New TUI-Blue
112.203.244
New TUI-Green
170.215.0
TUI-Yellow
255.225.0
TUI-Red
239.0.0
TUI-Black
0.0.0
TUI-White
255.255.255
New TUI-Grey
115.115.115
New TUI-Grey 25%
220.220.220 Ach
rom
atic
Hotels & Resorts
Robinson – Key figures 2015/16
* unaudited figures
Turnover 194 192
Underlying EBITA 39 42
EBITA-Margin 20% 22%
EAT (100% TUI) 15 12
ROIC 13% 14%
Robinson in TUI accounts* 15/16 14/15
29%
14% 39%
18%
Western Med.
North Africa
Eastern Med.
Other
Total
15,342
25%
58%
17%
Management
Ownership
Lease
Financing structure (%) Hotel beds by region (%)
24
Clubs
Robinson Club Maldives
€m

29
Pri
mary
colo
urs
• Always use
TUITypeLight
• Font size14pt
• Line spacing 6 pt
• titles in TUI-Dark
Blue
• Bullet points &
standard text in
TUI-Dark Blue
Conve
nti
ons
Functio
nal
New TUI-Blue 50%
194.230.250
TUI-Dark Blue
9.42.94
New TUI-Blue
112.203.244
New TUI-Green
170.215.0
TUI-Yellow
255.225.0
TUI-Red
239.0.0
TUI-Black
0.0.0
TUI-White
255.255.255
New TUI-Grey
115.115.115
New TUI-Grey 25%
220.220.220 Ach
rom
atic
Hotels & Resorts Robinson Portfolio
M = Management; O = Ownership; L = Lease; F = Franchise; figures at 30 Sep 2016
Spain
Portugal
Switzerland
Germany
Austria
Turkey
Greece
Italy
Morocco
Egypt Maldives
Eastern Med.: 7 clubs
Western Med.: 6 clubs
North Africa: 3 clubs
F L O
33%
M
33%
Other: 8 clubs
33%
Tunisia
100%
M F L O
F L
25%
O
25%
M
50%
O F
14%
L
14%
M
72%
30
Pri
mary
colo
urs
• Always use
TUITypeLight
• Font size14pt
• Line spacing 6 pt
• titles in TUI-Dark
Blue
• Bullet points &
standard text in
TUI-Dark Blue
Conve
nti
ons
Functio
nal
New TUI-Blue 50%
194.230.250
TUI-Dark Blue
9.42.94
New TUI-Blue
112.203.244
New TUI-Green
170.215.0
TUI-Yellow
255.225.0
TUI-Red
239.0.0
TUI-Black
0.0.0
TUI-White
255.255.255
New TUI-Grey
115.115.115
New TUI-Grey 25%
220.220.220 Ach
rom
atic
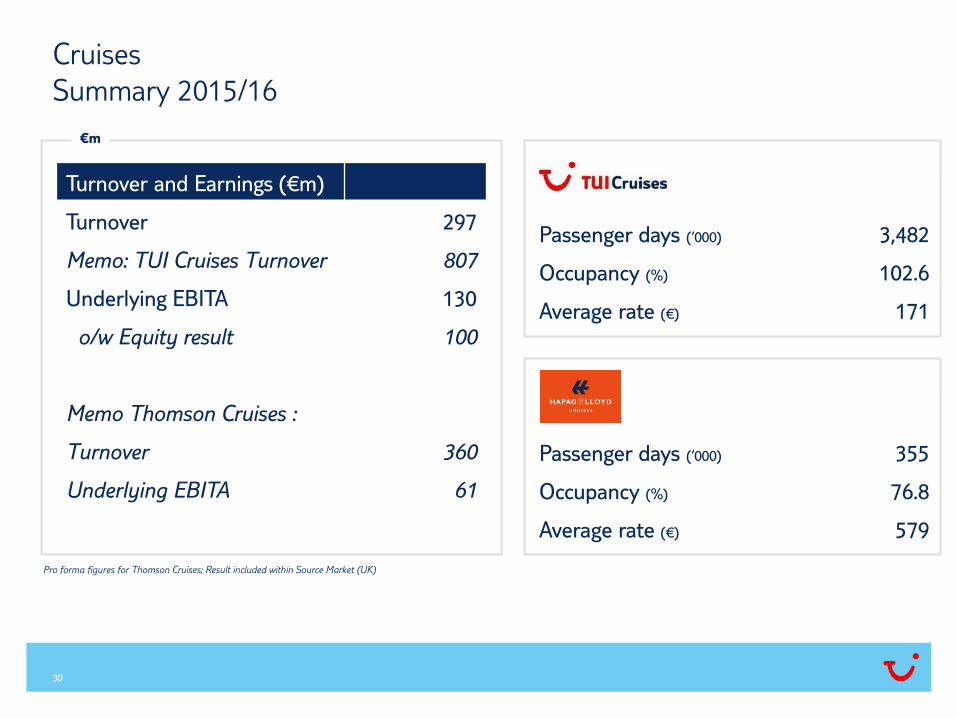
€m
Cruises
Summary 2015/16
Turnover and Earnings (€m)
Turnover 297
Memo: TUI Cruises Turnover 807
Underlying EBITA 130
o/w Equity result 100
Memo Thomson Cruises :
Turnover 360
Underlying EBITA 61
Passenger days (‘000) 3,482
Occupancy (%) 102.6
Average rate (€) 171
Passenger days (‘000) 355
Occupancy (%) 76.8
Average rate (€) 579
Pro forma figures for Thomson Cruises; Result included within Source Market (UK)

31
Pri
mary
colo
urs
• Always use
TUITypeLight
• Font size14pt
• Line spacing 6 pt
• titles in TUI-Dark
Blue
• Bullet points &
standard text in
TUI-Dark Blue
Conve
nti
ons
Functio
nal
New TUI-Blue 50%
194.230.250
TUI-Dark Blue
9.42.94
New TUI-Blue
112.203.244
New TUI-Green
170.215.0
TUI-Yellow
255.225.0
TUI-Red
239.0.0
TUI-Black
0.0.0
TUI-White
255.255.255
New TUI-Grey
115.115.115
New TUI-Grey 25%
220.220.220 Ach
rom
atic
Cruises
Long-term performance
Hapag-Lloyd Cruises Cruises ROIC % TUI Cruises
171 169 171
102,3 102,7 102,6
FY14 FY15 FY16
Av Daily Rate Occupancy %
3,3
17,3
21,3
FY14 FY15 FY16
450
536 579
68.2 76.2 76.8
FY14 FY15 FY16
Av Daily Rate Occupancy %
Turnaround
of Hapag-
Lloyd
ROIC increased from 17.2% to 21.3% in FY 16, compared with a segmental WACC of 7.5%

32
Pri
mary
colo
urs
• Always use
TUITypeLight
• Font size14pt
• Line spacing 6 pt
• titles in TUI-Dark
Blue
• Bullet points &
standard text in
TUI-Dark Blue
Conve
nti
ons
Functio
nal
New TUI-Blue 50%
194.230.250
TUI-Dark Blue
9.42.94
New TUI-Blue
112.203.244
New TUI-Green
170.215.0
TUI-Yellow
255.225.0
TUI-Red
239.0.0
TUI-Black
0.0.0
TUI-White
255.255.255
New TUI-Grey
115.115.115
New TUI-Grey 25%
220.220.220 Ach
rom
atic
Cruises
TUI Cruises fleet
Berths
Year of
construction
Operating
model
Mein
Schiff 3
Wholly
owned
2,506
2014
Wholly
owned
Mein
Schiff 1
1,924
1996
1,912
1997
Wholly
owned
Mein
Schiff 2
Wholly
owned
2,506
2015
(June)
Mein
Schiff 4
Mein
Schiff 5
Wholly
owned
2,534
2016
(July)
Mein
Schiff 6
Wholly
owned
2,534
2017
(new build)
New Mein
Schiff 1
Wholly
owned
2,860
2018
(new build)
New Mein
Schiff 2
Wholly
owned
2,860
2019
(new build)
* MS1 and MS2 to replace 2 ships in UK fleet following delivery of new MS1 and new MS2
* *

33
Pri
mary
colo
urs
• Always use
TUITypeLight
• Font size14pt
• Line spacing 6 pt
• titles in TUI-Dark
Blue
• Bullet points &
standard text in
TUI-Dark Blue
Conve
nti
ons
Functio
nal
New TUI-Blue 50%
194.230.250
TUI-Dark Blue
9.42.94
New TUI-Blue
112.203.244
New TUI-Green
170.215.0
TUI-Yellow
255.225.0
TUI-Red
239.0.0
TUI-Black
0.0.0
TUI-White
255.255.255
New TUI-Grey
115.115.115
New TUI-Grey 25%
220.220.220 Ach
rom
atic
Cruises
Hapag-Lloyd Cruises fleet
Year of
construction
Operating
model
Berths
Europa
1999
Wholly owned
4081
Hanseatic
1993
Bareboatcharter
175
Europa 2
2013
Wholly owned
5161
Bremen
1990
Wholly owned
155
1) Additional sofa-bed in most of the suites (usable for persons up to the age of 6, 10, 12 or 15 years)
Expedition
New build
2019
Wholly owned
240
Expedition
New build
2019
Wholly owned
240
Exp. 2018

34
Pri
mary
colo
urs
• Always use
TUITypeLight
• Font size14pt
• Line spacing 6 pt
• titles in TUI-Dark
Blue
• Bullet points &
standard text in
TUI-Dark Blue
Conve
nti
ons
Functio
nal
New TUI-Blue 50%
194.230.250
TUI-Dark Blue
9.42.94
New TUI-Blue
112.203.244
New TUI-Green
170.215.0
TUI-Yellow
255.225.0
TUI-Red
239.0.0
TUI-Black
0.0.0
TUI-White
255.255.255
New TUI-Grey
115.115.115
New TUI-Grey 25%
220.220.220 Ach
rom
atic
Cruises
Thomson Cruises fleet
Year of
construction
Operating
model
Berths
1984
Finance Lease
Thomson
Celebration
1,262
1986
Finance Lease
Thomson
Dream
1,533
1992
Operating Lease
Thomson
Majesty
1,462
1983
Operating Lease
Thomson
Spirit
1,254
Thomson Cruises is reported within Source Markets (UK) and not in the Cruise segment
1995
Finance Lease
TUI
Discovery
1,830
1994
Wholly owned
TUI
Discovery 2 - 2017
1,836
Exp. 2018 Exp. 2020 Exp. 2017 Exp. 2017 Exp. 2026 Built 1994