2018 - tui group · this annual report of the tui group was prepared for the fi nancial year (fy)...
TRANSCRIPT
AN
NU
AL
RE
PO
RT
OF
TH
E T
UI
GR
OU
P 2
01
820
18 2018A N N U A L R E P O R T O F T H E T U I G R O U P
FINANCIAL HIGHLIGHTS
€ million
2018 2017 Var. % Var. % at
constant
currency
Turnover 19,523.9 18,535.0 + 5.3 + 6.3
Underlying EBITA1
Hotels & Resorts 425.7 356.5 + 19.4 + 38.7
Cruises 324.0 255.6 + 26.8 + 27.0
Destination Experiences 44.7 35.1 + 27.4 + 33.6
Holiday Experiences 794.4 647.2 + 22.7 + 33.8
Northern Region 254.1 345.8 – 26.5 – 27.4
Central Region 89.1 71.5 + 24.6 + 25.0
Western Region 109.3 109.2 + 0.1 + 0.1
Markets & Airlines 452.5 526.5 – 14.1 – 14.6
All other segments – 99.9 – 71.6 – 39.5 – 31.4
TUI Group 1,147.0 1,102.1 + 4.1 + 10.9
Discontinued operations – – 1.2 n. a. –
Total 1,147.0 1,100.9 + 4.2 + 11.0
EBITA2, 4 1,060.2 1,026.5 + 3.3 + 10.4
Underlying EBITDA4 1,563.9 1,541.7 + 1.4
EBITDA4 1,498.5 1,490.9 + 0.5
EBITDAR4 2,219.9 2,240.9 – 0.9
Net profi t for the period 780.2 910.9 – 14.3
Earnings per share4 € 1.18 1.36 – 13.2
Equity ratio (30 Sept.) 3 % 27.8 24.9 + 2.9
Net capex and investments (30 Sept.) 827.0 1,071.9 – 22.8
Net cash (30 Sept.)4 123.6 583.0 – 78.8
Employees (30 Sept.) 69,546 66,577 + 4.5
Diff erences may occur due to roundingThis Annual Report of the TUI Group was prepared for the fi nancial year (FY) from 1 October 2017 to 30 September 2018. The terms for previous years were renamed accordingly.In FY 2018 we have adjusted our segmental reporting to refl ect the growing strategic importance of the services delivered in our destinations. Destination Experiences is now reported separately in the segmental structure, and within Holiday Experiences together with Hotels & Resorts and Cruises. The further businesses of former Other Tourism and All other segments have been combined into All other segments. There are no changes to the total numbers. The prior year’s reference fi gures were restated accordingly.1 In order to explain and evaluate the operating performance by the segments, EBITA adjusted for one-off eff ects (underlying
EBITA) is presented. Underlying EBITA has been adjusted for gains/losses on disposal of investments, restructuring costs according to IAS 37, ancillary acquisition costs and conditional purchase price payments under purchase price allocations and other expenses for and income from one-off items.
2 EBITA comprises earnings before interest, taxes and goodwill impairments. EBITA includes amortisation of other intangible assets. It does not include the result from the measurement of interest hedges, and in the prior year did not include results from container shipping operations.
3 Equity divided by balance sheet total in %, variance is given in percentage points.4 Continuing operations
»We are on track because we have undergone a transformation. This year,
in particular, has shown that the realignment we launched in 2014 to focus
on the hotel, cruise and destination business has now become TUI’s special strength. Only five years ago, a similar
summer would have left its mark on TUI, too. We have now become an integrated
hotel and cruise group. We develop, we invest and we operate. And we
are increasingly becoming a digital and platform organisation.«
Friedrich Joussen, CEO of TUI AG

2
annualreport2018.tuigroup.com
Additional content in the interactive financial report 2018
3 reasons to invest in TUI
TUI Group 2018 in figures
HTML tables

3
CONTENTS
4 TUI Group 2018 in figures6 Letter to our shareholders10 Guidance12 Group Executive Committee14 Report of the Supervisory Board22 Audit Committee Report
COMBINED MANAGEMENT REPORT28 TUI Group strategy32 Corporate profile40 Risk report56 Overall assessment by the Executive Board
and report on expected developments60 Business review82 Non-financial Declaration100 Annual financial statements of TUI AG103 TUI share108 Information required under takeover law
CORPORATE GOVERNANCE112 Executive Board and Supervisory Board115 Corporate Governance Report
CONSOLIDATED FINANCIAL STATEMENTS AND NOTES152 Income statement152 Earnings per share153 Statement of comprehensive income154 Financial position156 Statement of changes in Group equity158 Cash flow statement159 Notes
259 Responsibility statement by management260 Independent auditor’s report268 Forward-looking statements

4
TUI GROUP 2018 IN F IGURES
~150 AIRCRAFT
23.0 % ROIC
€ 1,147 M UNDERLYING EBITA
€ 19.5 BNTURNOVER
€ 0.72 DIVIDEND PER SHARE
€ 1.17 UNDERLYING EPS
Markets &
Airlines
Financial
highlights
27 M CUSTOMERS21 million from European source markets
5
115 DESTINATIONS
16 CRUISE SHIPS380
HOTELS
Holiday
Experiences

6 L E T T E R TO OU R SH A R E HO L DE R S
LE T TER TO OUR SHAREHOLDERS
2018 was another growth year for TUI. We delivered on our promises in a challenging market environment. Our operating result again delivered double-digit growth for the fourth time in a row – it grew by nearly eleven per cent at constant currency in the completed financial year.
The robust results delivered in 2018 are particularly gratifying given that we were operating under exceptional circumstances last year. In the UK, the exchange rate and purchasing power of sterling were adversely affected by Brexit. Air traffic in Europe faced particular challenges. And in our Euro-pean home markets, we experienced a record summer – with a summer heatwave lasting right into the autumn. This brought its weight to bear on results in our sector in the course of the financial year.
I would like to extend a special word of thanks to our customers who chose to travel with TUI and its brands, and to you, our shareholders, for your loyalty to TUI. Let me also thank all the employees who looked after our guests and again created unforgettable moments during their holidays in 2018. The Executive Board and the Supervisory Board will be proposing another increase in the dividend to 0.72 euros for the completed year to the Annual General Meeting.
We are on track because we have undergone a transformation. This year, in particular, has shown that the realignment we launched in 2014 to focus on the hotel, cruise and destination business has now become TUI’s special strength. Only five years ago, a similar summer would have left its mark on TUI, too, as the Group’s focus and earnings structure were too one-sided and above all excessively geared to our classical tour operation business. We have now become an integrated hotel and cruise group. We develop, we invest and we operate. And we are increasingly becoming a digital and platform organisation.
Today’s success is important. However, what do we need to do to stay on track and keep growing? We used 2018 to define our position. Are we fit for further growth? How are we going to further enhance the quality, efficiency and strength of today’s businesses? And where do our strong global TUI brand and the increasing digitalisation of our businesses create
Dear shareholders,

7L E T T E R TO OU R SH A R E HO L DE R S
new growth areas for the Group? Let me comment on some of the decisions we took:
Our classical tour operation business is characterised by strong compe-tition, seasonality and low margins in European source markets. That is why we must identify synergies and enhance our efficiency. Since the summer, we have clustered the Group’s worldwide tour operators and airlines into Markets & Airlines, managed by an Executive Board member. We have to learn more from one another, rapidly transfer successful models from one market to another and harmonise non-customer-facing activities. This transformation has begun and will enhance the efficiency and com-petitiveness of our classical tour operation business. Where markets have already achieved the required level of maturity, TUI is already fully digital. TUI Nordic in Scandinavia is an example of that. We will not ignore the social and cultural particularities of our markets and customers, but we will be at the forefront of this transformation in other countries, too.

8 L E T T E R TO OU R SH A R E HO L DE R S
Today, 70 per cent of our operating result is delivered by holiday experi-ences developed and designed by us: hotels, cruise ships, excursions and activities in the holiday regions. This is where customers experience the strength of the TUI brand. These holiday moments make holidays with TUI so special and personal. We are growing and investing in this segment so as to strengthen it. Despite the large variety of holiday experiences offered by TUI Group, we want them to display a distinctive signature. This includes our Group’s own hotel brands such as TUI Blue, Riu, Robinson, TUI Magic Life, hotel concepts such as TUI Sensimar, TUI Sensatori and TUI Family Life, global hotel purchasing with our partners, the cruise lines and destination activities.
This is where we are seeking further growth. We know our customers very well, we know when they travel where, and what services they appreciate, be it holiday destinations, hotel rooms, cruise suites, excursions or activities. If we put this knowledge to smart use, we can create great value added for our customers – and for us, as we will be able to generate additional turnover and earnings. We have paved the way for that growth through our comprehensive digitalisation strategy and our investments in IT as well as new technologies, which are increasingly paying off. Here, too, our transformation as a digital company has progressed and opened up new growth areas.
The destination activities market, in particular, is delivering extremely strong growth, promising highly attractive returns and still typically features many small, local providers. With more than 27 million customers – thereof around 21 million guests from our European source markets, a highly professional international team on the ground, a strong digital infrastructure and networked customer systems, we are well placed to take a leading international position in this market for tours and excursions and to deliver very profitable growth. Usually, several months pass after a holiday booking before our customers depart for their trip. That period offers us great potential to submit personalised offerings for activities in the destination to our customers – from the ‘Select your room’ option via special excursions through to reservations for restaurants, sporting programmes and wellness facilities.
Having identified the growth potential in this area, we made investments in the completed year by purchasing two companies. By acquiring destina-tion management from Hotelbeds Group, we doubled the footprint of Destination Experiences from 23 to 49 countries. We now have a team on the ground in almost every major destination in the world and are able to

9L E T T E R TO OU R SH A R E HO L DE R S
develop new products and services for our customers. This summer, we purchased the Milan-based technology start-up Musement. The Italian company has developed a platform that already pools a great portfolio of holiday experiences and offers its users customised excursions. Integrating this approach into our business with 27 million has enormous potential. We expect this acquisition, the further development of our digital plat-form and the expansion of our offering to contribute substantially to our future growth.
Dear shareholders, we are transforming our traditional portfolio, strength-ening today’s successful and profitable business lines and investing in digital platforms for our future growth. I hope that the year 2018 and the progress achieved in the past few years have convinced you that TUI has been and will remain a good investment. TUI is the world’s leading integrated tourism group. Supported by a great team of 69,500 employees around the world, the Executive Board is committed to ensuring that things stay that way. Tourism is and remains one of the world’s biggest and most stably growing industries. There is no reason and no indication to believe that demand for travel will decline – on the contrary. We have identified potential in many new markets, in particular in the countries of South East Asia, where we are expanding our hotel portfolio and building TUI’s position.
I would be delighted to be able to welcome you personally to our Annual General Meeting in Hanover. Birgit Conix, the successor to our long-standing CFO Horst Baier, will take part for the first time. Let me use this oppor-tunity to extend my sincerest thanks to Horst Baier once again. He was our CFO throughout FY 2018. Horst Baier played a key role in designing and delivering our successful transformation over the past few years. He has always been a reliable advisor and partner to my Executive Board colleagues and myself.
We are working to continue our successful performance in 2019. Thank you very much for your support and loyalty.
Best regards,
Friedrich Joussen CEO of TUI AG

10 GUIDA NC E
GUIDANCE
K E Y F IGURE SOutlook FY 20181
GUIDA NCE ACHIE VE ME NTActual FY 2018
GUIDA NCEActual 2018 rebased
TURNOVER IN € BN
IN EXCESS OF
3 %2, 3 19.5 + 6.3 %2 19.52
EBITA (UNDERLY ING) IN € M
AT LEAST
+ 10 % 2 1,147 + 10.9 %2 1,1874
ADJUSTMENTS IN € M
~ 80 costs 87 costs
NET C APEX AND INVESTMENTS IN € BN
1.2 0.8
LEVERAGE RAT IO
3.00(X) – 2.25(X) 2.7(X)
1 As published on 13 December 2017, unless otherwise stated2 Variance year-on-year assuming constant foreign exchange rates are applied to the result
in the current and prior period and based on the current group structure3 Excluding cost inflation relating to currency movements4 The starting variable for the forecast is the rebased underlying EBITA . This rebased figure was
determined by increasing the underlying EBITA of FY 2018 by the negative effect from the revaluation of euro denominated loans in Turkey amounting to € 40 m, translated at actual rates for the FY 2018.
5 Including PDPs, excluding aircraft assets financed by debt or finance leases

11GUIDA NC E
K E Y F IGURE SOutlook FY 20181
GUIDA NCE ACHIE VE ME NTActual FY 2018
GUIDA NCEActual 2018 rebased
TURNOVER IN € BN
IN EXCESS OF
3 %2, 3 19.5 + 6.3 %2 19.52
EBITA (UNDERLY ING) IN € M
AT LEAST
+ 10 % 2 1,147 + 10.9 %2 1,1874
ADJUSTMENTS IN € M
~ 80 costs 87 costs
NET C APEX AND INVESTMENTS IN € BN
1.2 0.8
LEVERAGE RAT IO
3.00(X) – 2.25(X) 2.7(X)
GU IDA NCEFY 2019
APPROX IMATELY
+ 3 %2, 3
AT LEAST
+ 10 %2
3.00(X) – 2.25(X)
~ 125 costs
~ 1.0 – 1.25

12 GROU P E X EC U T I V E COM MI T T E E
GROUP E XECUTIVE COMMIT TEE
FRIEDRICH JOUSSEN
CEO
THOMAS ELLERBECK
Group Director Corporate & External Affairs
DR HILKA SCHNEIDER
Group Director Legal, Compliance & Board Office
DAVID BURLING
Member of the Executive Board;
CEO Markets & Airlines
Please refer to our website for CVs www.tuigroup.com/ en-en/about-us/about-tui-group/management
KENTON JARVIS
CEO Aviation and Business Improvement;
Director Markets
BIRGIT CONIX
Member of the Executive Board (from July 2018);
CFO

13GROU P E X EC U T I V E COM MI T T E E
ELIE BRUYNINCKX
CEO Western Region
DR ELKE ELLER
Member of the Executive Board;
Human Resources, Personnel DirectorSEBASTIAN EBEL
Member of the Executive Board;
CEO Hotels & Resorts, Cruises, Destination Experiences
HORST BAIER
Member of the Executive Board;
CFO (until September 2018)
PETER KRUEGER
Group Director Strategy, M & A, Investor Relations
FRANK ROSENBERGER
Member of the Executive Board;
IT, Future Markets
ERIK FRIEMUTH
Group Chief Marketing Officer & Managing Director TUI Hotels & Resorts
HENRIK HOMANN
Group Director Strategy (until June 2018)
14 R E P OR T OF T HE SUPE RV IS ORY BOA R D
Ladies and Gentlemen,
After we completed the post-merger integration of TUI AG and TUI Travel plc last year, we again demonstrated in the financial year just completed that we – the Executive Board, the employees and the Supervisory Board – have together created the right strategic positioning for our organisation. We have established an internationally operating, integrated tourism company with a successful, sustainable business model.
Despite various challenges we faced at both national and inter-national levels, we increased our underlying EBITA by more than 10 % year-on-year at constant currency. This has also enabled us to clearly stand out from our main competitors, some of whom had to lower their guidance in the completed financial year. We again successfully mastered a number of special challenges, such as the insolvencies of Air Berlin and its subsidiary Niki, the prolonged, exceptional good weather in Europe this summer which limited demand for travel, and also the weakening of the Turkish lira. This confirms that we took the right decision in transforming TUI into an integrated tourism company with a broad value-chain.
We will not rest on our laurels but consistently pursue our trans-formation roadmap. After leveraging synergies from the merger and the transformation of our business model, we will now focus on selective investments mainly in the Hotels and Cruises segments and efficiency enhancement. We will also make a priority of con-tinued digitalisation, which opens up new opportunities for TUI at all levels. Especially with our broad customer portfolio, the potential of Artificial Intelligence offer high chances for optimisation.
At our meetings, we regularly discussed the strategic development of our business model with the Executive Board. To implement this, following comprehensive review and discussion, the Superviso-ry Board approved a number of key acquisition projects, in par-ticular the repurchase of incoming agencies from Hotelbeds Group, enabling us to expand our offering in the Destination Experiences segment from 23 to 49 countries. This segment was further re-shaped with the acquisition of Musement, transforming the seg-
ment from offline to a fully digitalised business. We also approved investments in a new generation of TUI Cruises ships and the construction of a further expedition liner for the fleet operated by Hapag-Lloyd Cruises.
Looking ahead to future challenges, another major priority of our deliberations in the Supervisory Board was Brexit. Throughout the year, we paid detailed attention to the various scenarios and the resulting potential impacts on our business model as well as measures to be derived.
As in this year, Corporate Governance will be another focus area next year. The UK Corporate Governance Code was recently fundamen-tally revised. Meanwhile, the commission in charge of the German Code is also planning to carry out a major review from the middle of next year.
Let me use this opportunity to thank Sir Michael Hodgkinson on behalf of the entire Supervisory Board for his outstanding efforts and commitment as a member of the TUI AG Supervisory Board. Sir Michael Hodgkinson has rendered lasting services above all to the merger of the two TUI companies and the subsequent integration management. The same applies to our former CFO Horst Baier, who stepped down from the Executive Board towards the end of the financial year. He was instrumental in shaping our organisa-tion’s successful course over a long period of time. We would like to thank both of them and wish them all the best for their future.
After 14 years of active participation, Mrs Carmen Riu Güell will resign her mandate at the end of the Annual General Meeting on 12 February 2019. She has made a very intensive contribution to the strategy discussion, particularly in the restructuring of our hotel business, and has set important accents. It will then be proposed to the Annual General Meeting to elect Mr Joan Trian Riu to replace her as member of the Supervisory Board. Mr Joan Trian Riu has extensive knowledge and experience in the tourism business and finance.
REPORT OF THE SUPERVISORY BOARD

15R E P OR T OF T HE SUPE RV IS ORY BOA R D
The Supervisory Board of TUI AG at its meeting on 10 October 2018 in the Hanover head office
1 Angelika Gifford2 Prof. Klaus Mangold (Chairman)3 Frank Jakobi (Vice Chairman)4 Valerie Frances Gooding5 Carmen Riu Güell6 Dr Dieter Zetsche7 Carola Schwirn8 Prof. Edgar Ernst9 Janis Carol Kong10 Alexey Mordashov11 Anette Strempel12 Ortwin Strubelt13 Michael Pönipp14 Andreas Barczewski15 Peter Long (Vice Chairman)16 Peter Bremme17 Mag. Stefan Weinhofer18 Coline Lucille Mc Conville19 Dr Dierk Hirschel20 Wolfgang Flintermann
1 2 3 4 5
6 7 8
910
11
1213
14
16 17 1915 18 20

16 R E P OR T OF T HE SUPE RV IS ORY BOA R D
Cooperation between the Executive Board and the Supervisory Board
In a stock corporation under German law, there is a mandatory strict separation of the Executive Board and the Supervisory Board. While the management of the company is the exclusive task of the Executive Board, the Supervisory Board is in charge of advising and overseeing the Executive Board. As the oversight body, the Supervisory Board provided on-going advice and super-vision for the Executive Board in managing the Company in FY 2018, as required by the law, the Articles of Association and its own Terms of Reference.
Its actions were guided by the principles of good and responsible corporate governance. Our monitoring activities essentially served to ensure that the management of business operations and the management of the Group were lawful, orderly, fit for purpose and commercially robust. The individual advisory and oversight tasks of the Supervisory Board are set out in Terms of Reference. Ac-cordingly, the Supervisory Board is, for instance, closely involved in entrepreneurial planning processes and the discussion of strategic projects and issues. Moreover, there is a defined list of specific Executive Board decisions requiring the consent of the Supervisory Board, some of which call for detailed review in advance and require the analysis of complex facts and circumstances from a supervisory and consultant perspective (own business judgement).
TUI AG falls within the scope of the German Industrial Co-Deter-mination Act (MitbestG). Its Supervisory Board is therefore composed of an equal number of shareholder representatives and employee representatives. Employee representatives within the meaning of the Act include a senior manager (section 5 (3) of the German Works Council Constitution Act) and three trade union representatives. All Supervisory Board members have the same rights and obligations and they all have one vote in voting processes. In the event of a tie, a second round of voting can take place according to the Terms of Reference for the Supervisory Board, in which case I as Chairman of the Supervisory Board have the casting vote.
In written and verbal reports, the Executive Board provided us with regular, timely and comprehensive information at our meetings and outside our meetings. The reports encompassed all relevant facts about strategic development, planning, business performance and the position of the Group in the course of the year, the risk situation, risk management and compliance, but also reports from
the capital markets (e. g. from analysts), media reports and reports on current events (e. g. crises). The Executive Board discussed with us all key transactions of relevance to the Company and the further development of the Group. Any deviations in business performance from the approved plans were explained in detail. The Supervisory Board was involved in all decisions of fundamental relevance to the Company in good time. We fully discussed and adopted all resolutions in accordance with the law, the Articles of Association and our Terms of Reference. We regularly prepare for these decision based on documents provided by the Executive Board to the Supervisory Board and its committees in advance. We were also swiftly informed about any urgent topics arising in between the regular meetings. As Chairman of the Supervisory Board, I was also regularly informed by the Executive Board about current business developments and key transactions in the Company between Supervisory Board meetings.
Deliberations in the Supervisory Board and its Committees
Prior to Supervisory Board meetings, the shareholder representa-tives on the Supervisory Board and the employees’ representatives met in separate meetings, which were regularly also attended by Executive Board members.
Apart from the full Supervisory Board, a total of four commit-tees were in place in the completed financial year: the Presiding Committee, Audit Committee, Strategy Committee and Nomination Committee. The Mediation Committee formed pursuant to sec-tion 27 (3) of the Co-Determination Act did not have to meet. The Chairman of each committee provides regular and comprehensive reports about the work performed by the committee at the ordi-nary Supervisory Board meetings.
In FY 2018, as in prior years, we again recorded a consistently high meeting attendance despite a large number of meetings. Average attendance was 92.8 % (previous year 93.8 %) at plenary meetings and 85.3 % (previous year 97.6 %) at committee meetings. The majority of Supervisory Board members attended significantly more than half the Supervisory Board meetings and meetings of the committees on which they sat in FY 2018. Members unable to attend a meeting usually participated in the voting through proxies. Preparation of all Supervisory Board members was greatly facilitated by the practice of distributing documents in advance in the run-up to the meetings and largely dispensing with handouts at meetings.

17R E P OR T OF T HE SUPE RV IS ORY BOA R D
Attendance at meetings of the Supervisory Board in FY 2018
Attendance at meetings of the Supervisory Board 2018
Name
Supervisory
Board
Presiding
Committee
Audit
Committee
Nomination
Committee
Strategy
Committee
Prof. Klaus Mangold (Chairman)1 9 (9)1 10 (10)1 7 (7) 2 (2)1 5 (5)
Frank Jakobi (Deputy Chairman)2 9 (9)2 10 (10) 3 (5)
Sir Michael Hodgkinson (Deputy Chairman)2 4 (4)2 5 (5) 2 (2)
Andreas Barczewski 9 (9) 6 (7)
Peter Bremme 8 (9) 8 (10)
Prof. Edgar Ernst 8 (9) 7 (7)1
Wolfgang Flintermann 9 (9)
Angelika Gifford 9 (9) 4 (5)
Valerie Frances Gooding 8 (9) 3 (5)
Dr Dierk Hirschel 9 (9) 7 (7)
Janis Carol Kong 9 (9) 7 (7)
Peter Long (Deputy Chairman)2 8 (9)2 5 (10) 5 (5)1
Coline Lucille McConville 9 (9) 7 (7)
Alexey A. Mordashov 4 (9) 6 (10) 0 (2) 5 (5)
Michael Pönipp 9 (9) 7 (7)
Carmen Riu Güell 6 (9) 8 (10) 2 (2)
Carola Schwirn 9 (9)
Anette Strempel 9 (9) 10 (10)
Ortwin Strubelt 8 (9) 10 (10) 7 (7)
Stefan Weinhofer 9 (9)
Dr Dieter Zetsche 5 (5)
Attendance at meetings in % 92.8 84.7 98.2 75.0 83.3
Attendance at Committee meetings in % 85.3
(In brackets: number of meetings held) 1 Chairman of Committee2 Deputy Chairman of Committee
Key topics discussed by the Supervisory Board
The Supervisory Board held nine meetings. In addition, two resolu-tions were adopted by written circulation. The meetings focused on the following issues:
1. At its meeting on 17 October 2017, the Supervisory Board considered current business performance. The discussions also focused on Brexit. In this context, we talked in detail about any measures to be adopted by the Group in the event of a hard Brexit. Our deliberations also focused on the efficiency programme at TUI fly, the situation of Air Berlin, the effects of the EU Network and Information Security Directive and the approval of the diversity concept for the Supervisory Board and the Executive Board. In the framework of Executive Board matters, we discussed the status of negotiations on the revised service contracts reflecting the new remuneration structure effective from FY 2018. The Supervisory Board furthermore approved the budget for FY 2018.
2. At its extraordinary meeting on 15 November 2017, the Super-visory Board addressed in detail the negotiations of the new service contracts for the Executive Board members applicable from FY 2018. These extensive deliberations focused on key conditions and the definition of performance indicators.
3. At its meeting on 12 December 2017, the Supervisory Board discussed in detail the annual financial statements of TUI Group and TUI AG, each having received an unqualified audit opinion from the auditors, the Combined Management Report for TUI Group and TUI AG, the Report by the Supervisory Board, the Corporate Governance Report and the Remuneration Report. The discussions were also attended by representatives of the auditors. The Audit Committee had already considered these reports the previous day. Following its own review, the Super-visory Board endorsed the findings of the auditors. We then approved the financial statements prepared by the Executive Board and the Combined Management Report for TUI AG and the Group. The annual financial statements for 2018 were

18 R E P OR T OF T HE SUPE RV IS ORY BOA R D
thereby adopted. Moreover, the Supervisory Board approved the Report by the Supervisory Board, the Corporate Govern-ance Report and the Remuneration Report. It also adopted the invitation to the ordinary AGM 2018 and the proposals for resolutions to be submitted to the AGM. Alongside the HR and Social Report, we received a number of other reports, including on the results of the TUIgether 2017 employee survey and on the situation at Air Berlin and TUI fly. In the framework of Executive Board matters, we adopted the core elements of the remuneration system for the service contracts for the Execu-tive Board members applicable from FY 2018, fixed the quota for female representation on the Executive Board and confirmed the appointment of Frank Rosenberger, currently a deputy member, as an ordinary member of the Executive Board with effect from 1 January 2018. The Supervisory Board also heard a status report on the expansion of capacity at TUI Cruises GmbH.
4. On 12 February 2018, the Supervisory Board mainly discussed TUI AG’s interim statements and report for the quarter ending 31 December 2017 and prepared the 2018 Annual General Meeting. The Supervisory Board was also given a report on the sales process for an investment and updates on the revision of the UK Corporate Governance Code and on business perfor-mance in source market Germany. We adopted resolutions on transactions requiring the Supervisory Board’s consent, approving the expansion of capacity for TUI Cruises GmbH and the potential issue of a corporate bond for aircraft financing purposes.
5. At its meeting on 13 February 2018, the Supervisory Board elected Peter Long as its new second Deputy Chairman, as Sir Michael Hodgkinson had stepped down from the Supervisory Board that day upon the close of the 2018 AGM. We also elected new members for the Supervisory Board committees.
6. At the extraordinary Supervisory Board meeting on 13 March 2018, held in the form of a conference call, we intensively debated and approved the acquisition of Destination Management from Hotelbeds Group. We also appointed Birgit Conix as an Executive Board member. From FY 2019, she will take over as CFO.
7. On 28 March 2018, we approved the application submitted by Sebastian Ebel to release him temporarily from his duties for a sabbatical from 16 April 2018 up to and including 15 June 2018.
8. On 8 May 2018, we debated TUI AG’s interim report for the second quarter ending on 31 March 2017 and the half-year financial report. We also resolved to adjust the remuneration for Dr Elke Eller and fixed the targets for the performance-
related remuneration component for Birgit Conix. The Super-visory Board subsequently heard a report on the development of senior executives in the light of succession planning for the Executive Board, including personnel development for the top management level. We were then briefed about the approach to Brexit moving forward, the status of negotiations around Corsair, the IT security structure, and the Security, Health & Safety organisation. We discussed on-going developments regarding the issue of a corporate bond for aircraft financing purposes. We also adopted resolutions on transactions requiring the Supervisory Board’s consent, including the issue of employ-ee shares, the expansion of capacity at Hapag-Lloyd Cruises GmbH, and an alternative financing instrument for aircraft financing. We furthermore approved the Group Manual for equity trading by persons with limited trading authorisation.
9. At its extraordinary meeting on 22 May 2018, which was held as a conference call, the Supervisory Board discussed approval of a change in the business allocation plan for the Executive Board in order to align the Group’s organisational structure with its strategy.
10. On 28 August 2018 (by written circulation), the Supervisory Board approved the increase in the Company’s capital stock for the issue of employee shares under the oneShare employee share programme for FY 2018.
11. During a three-day strategy offsite meeting on 11 and 12 Sep-tember 2018, we scrutinised the key trends in the tourism market, the business opportunities in China and South East Asia, the focus for strategic development, prospects for market consolidation and Brexit-related challenges. However, we also devoted detailed discussion to our future strategic orientation in the online market resulting from the acquisition of an estab-lished online platform. At the meeting, the Supervisory Board engaged deeply in very constructive and open dialogue about tackling the challenges of the future together with the members of the Executive Board, including the managers in charge of the topics presented.
Following this deliberation of strategic topics, on 13 Septem-ber 2018 the Supervisory Board comprehensively debated the consolidated five-year plan and Executive Board matters. We were also given reports on information security and on progress with the creation of a single purchasing platform. The meeting likewise focused on the status of negotiations on the disposal of Corsair. We concluded by adopting a resolution on a trans-action requiring our consent in connection with the acquisition of Musement S.p.A.
19R E P OR T OF T HE SUPE RV IS ORY BOA R D
Meetings of the Presiding Committee
The Presiding Committee takes the lead on various Executive Board issues (including succession planning, new appointments, terms and conditions of service contracts, remuneration, proposals for the remuneration system). It also prepares the meetings of the Supervisory Board. Alongside the members of the committee, Dr Dieter Zetsche has been a regular guest attending the meetings of the Presiding Committee since his election as a member of TUI AG’s Supervisory Board. In the period under review, the Presiding Committee held ten meetings.
Members of the Presiding Committee
• Prof. Klaus Mangold ( Chairman)
• Peter Bremme• Carmen Riu Güell• Sir Michael Hodgkinson
(until 13 February 2018)
• Frank Jakobi• Peter Long
(from 13 February 2018)• Alexey Mordashov• Anette Strempel• Ortwin Strubelt
1. At its meeting on 17 October 2017, the Presiding Committee discussed Executive Board issues, including deliberations on various topics related to Executive Board remuneration for the completed financial year and the current financial year as well as the business allocation plan for the Executive Board. The committee also discussed the preliminary findings from the TUIgether employee survey and follow-up measures.
2. At its extraordinary meeting on 3 November 2017, the Presiding Committee considered the status of the negotiations about the new service contracts for the members of the Executive Board in connection with the revision of the remuneration system. We adopted resolutions on variable annual pay for FY 2018 and discussed a review of the appropriateness of Executive Board remuneration and pensions carried out by an external remuneration consultant. We also discussed the succession for the CFO.
3. At its extraordinary meeting on 27 November 2017, after further deliberation, the Presiding Committee recommended the appointment of Dr Dieter Zetsche as a member of TUI AG’s Supervisory Board and again discussed the succession for the CFO.
4. On 12 December 2017, the Presiding Committee discussed Executive Board matters. In that context, it again discussed the status of negotiations on the new service contracts for the Executive Board members and the search for a successor to the CFO. It also adopted resolutions to confirm the appointment of
Frank Rosenberger as an ordinary Executive Board member and the fixing of a female quota for Executive Board members.
5. On 12 February 2018, the Presiding Committee considered and confirmed the performance indicators for the annual bonus for FY 2018 and addressed ongoing succession planning for the CFO. It furthermore discussed the future composition of the Supervisory Board and its committees.
6. At its extraordinary meeting on 28 February 2018, the Commit-tee auditioned candidates selected as potential successors to the CFO. A specific recommendation for the Supervisory Board members was then adopted.
7. At the extraordinary meeting of the Presiding Committee held as a conference call on 23 March 2018, the Committee carefully considered a resolution on a sabbatical for Sebastian Ebel.
8. On 7 May 2018, we discussed the report on senior executive development and Executive Board matters, which included in particular the contractual conditions for Dr Elke Eller and for the CFO. We also discussed the current CFO’s plan for stepping down.
9. At the extraordinary Presiding Committee meeting on 16 May 2018, held as a conference call, the Presiding Commit-tee dealt in detail with changes in the business allocation plan for the Executive Board.
10. On 11 September 2018, the Presiding Committee discussed the termination agreement for the CFO and the appointment of his successor.
AU D I T CO M M I T T E E
Members of the Audit Committee:
• Prof. Edgar Ernst ( Chairman)
• Andreas Barczewski• Dr Dierk Hirschel• Janis Kong
• Prof. Klaus Mangold• Coline McConville• Michael Pönipp• Ortwin Strubelt
The Audit Committee held seven ordinary meetings in the financial year under review. For the tasks and the advisory and resolution- related issues discussed by the Audit Committee, we refer to the comprehensive report on page 22.
N O M I N AT I O N CO M M I T T E E
The Nomination Committee proposes suitable shareholder candi-dates to the Supervisory Board for its election proposals to the Annual General Meeting or appointment by the district court.

20 R E P OR T OF T HE SUPE RV IS ORY BOA R D
Members of the Nomination Committee, which held two meetings:
• Prof. Klaus Mangold ( Chairman)
• Carmen Riu Güell• Sir Michael Hodgkinson
(until 13 February 2018)
• Peter Long (from 13 February 2018)
• Alexey Mordashov
1. At its meeting on 17 October 2017, the Nomination Committee discussed the future composition of the Supervisory Board, representation for the shareholders on the committees and the diversity concept for the Supervisory Board.
2. At its extraordinary meeting on 27 November 2017, the Nomi-nation Committee adopted a resolution to recommend to the 2018 AGM that Dr Dietsche Zetsche be elected to TUI AG’s Supervisory Board.
S T R AT E G Y CO M M I T T E E
The Strategy Committee was established on 9 February 2016 by resolution of the Supervisory Board. Its task is to advise the Executive Board in developing and implementing the corporate strategy. The Committee met six times in the financial year under review. Apart from Committee members, the meetings of the Strategy Committee have been regularly attended by Dr Dieter Zetsche since his election to TUI AG’s Supervisory Board.
The members of the Strategy Committee, which met five times, are:
• Peter Long (Chairman)• Angelika Gifford• Valerie Gooding
• Frank Jakobi• Prof. Klaus Mangold• Alexey Mordashov
1. At its meeting on 18 October 2017, the Committee dealt extensively with the Group’s aviation strategy and business development in South East Asia.
2. At its meeting on 11 December 2017, the Committee again discussed the aviation strategy and business performance in South East Asia. We also defined performance indicators as a basis for the Group’s strategy.
3. On 12 February 2018 we deliberated on the airline strategy and business development in South East Asia, which was an overall focus of this year’s work by the Strategy Committee. Moreover, the Strategy Committee heard a report on the sta-tus of the online strategy in different source markets. We also discussed relevant key indicators.
4. At its extraordinary meeting on 5 March 2018, the Committee discussed the strategic importance of the acquisition of Destination Management from Hotelbeds Group and prepared a corresponding draft resolution for the Supervisory Board plenary meeting.
5. From 8 to 12 May 2018, the Committee went on a trip to the People’s Republic of China to explore opportunities for strategic expansion in source market China. To that end, we engaged in dialogue with Chinese companies to benefit from experience and to discuss fundamental orientation with a view to strategic partnerships.
CO R P O R AT E G OV E R N A N C E
Due to the primary quotation of the TUI AG share on the London Stock Exchange and the constitution of the Company as a German stock corporation, the Supervisory Board naturally grants regular and very careful consideration to the recommendations around German and British corporate governance. Apart from the manda-tory observance of the rules of the German Stock Corporation Act (AktG), German Industrial Co-Determination Act (MitbestG), the Listing Rules and the Disclosure and Transparency Rules, TUI AG had announced in the framework of the merger that the Company was going to observe both the German Corporate Governance Code (DCGK) and – as far as practicable – the UK Corporate Governance Code (UK GCG).
For the DCGK – conceptually founded, inter alia, on the German Stock Corporation Act – we issued an unqualified declaration of compliance for 2018 pursuant to section 161 of the German Stock Corporation Act, together with the Executive Board. By contrast, there are some deviations from the UK CGC due for the most part to the different concepts underlying a one-tier management system for a public listed company in the UK (one-tier board) and the two-tier management system comprised of Executive Board and Supervisory Board in a stock corporation based on German law.
More detailed information on corporate governance, the declaration of compliance for 2018 pursuant to section 161 of the German Stock Corporation Act and the declaration on the UK CGC is provided in the Corporate Governance Report in the present Annual Report, prepared by the Executive Board and the Supervisory Board (from page 112), as well as on TUI AG’s website.
Conflicts of interest
In the period under review, the Supervisory Board continuously monitored for conflicts of interest and found that no conflict of interest occurred in FY 2018.
Audit of the annual and consolidated financial statements of TUI AG and the Group
The Supervisory Board reviewed the annual and consolidated financial statements and the financial reporting to establish whether they were in line with applicable requirements. Deloitte GmbH Wirtschaftsprüfungsgesellschaft, Hanover, audited the annual financial statements of TUI AG prepared in accordance with the provisions of the German Commercial Code (HGB), as well as the combined management report of TUI AG and TUI Group, and the

21R E P OR T OF T HE SUPE RV IS ORY BOA R D
consolidated financial statements for FY 2018 prepared in accord-ance with the provisions of the International Financial Reporting Standards (IFRS), and issued their unqualified audit certificate. The above documents, the Executive Board’s proposal for the use of the net profit available for distribution and the audit reports by the auditors had been submitted in good time to all members of the Supervisory Board. They were discussed in detail at the Audit Committee meeting on 11 December 2018 and the Supervisory Board meeting on 12 December 2018, convened to discuss the annual financial statements, where the Executive Board provided comprehensive explanations of these statements. At those meetings, the Chairman of the Audit Committee and the auditors reported on the audit findings, having determined the key audit areas for the financial year under review beforehand with the Audit Committee. Neither the auditors nor the Audit Committee identified any weaknesses in the early risk detection and internal control system. On the basis of our own review of the annual financial statements of TUI AG and TUI Group and the combined management report, we did not have any grounds for objections and therefore concur with the Executive Board’s evaluation of the situation of TUI AG and TUI Group. Upon the recommendation of the Audit Committee, we approve the annual financial statements for FY 2018; the annual financial statements of TUI AG are thereby adopted. We comprehensively discussed the proposal for the appropriation of profits with the Executive Board and approved the proposal in the light of the current and expected future financial position of the Group.
Composition of the Executive Board and Supervisory Board
The composition of the Executive Board and Supervisory Board as at 30 September 2018 is presented in the tables on pages 112 for the Supervisory Board and page 114 for the Executive Board.
S U P E R V I S O RY B OA R D
Upon the close of the 2018 AGM, the second Deputy Chairman of the Supervisory Board, Sir Michael Hodgkinson, stepped down from the Supervisory Board. At the same AGM, Dr Dieter Zetsche was elected to serve on TUI AG’s Supervisory Board for the next five years.
The Supervisory Board elected Peter Long as its new second Deputy Chairman.
P R E S I D I N G CO M M I T T E E
Sir Michael Hodgkinson stepped down from the Supervisory Board and thus also the Presiding Committee with effect from the close of the 2018 AGM. The Supervisory Board elected Peter Long as the fourth shareholder representative on the Presiding Committee.
N O M I N AT I O N CO M M I T T E E
Sir Michael Hodgkinson also stepped down from the Nomination Committee from the close of the 2018 AGM. The Supervisory Board elected Peter Long as his successor on the Nomination Committee.
E X E C U T I V E B OA R D
At the meeting on 13 March 2018, Birgit Conix was appointed to the Executive Board with effect from 15 July 2018 for a period of three years.
Horst Baier stepped down from the Executive Board with effect from the close of 30 September 2018. He is succeeded by Birgit Conix.
Word of thanks
The Supervisory Board expressly thanks all employees of TUI Group for their day-to-day dedication, which has again contributed to a very successful financial year.
Hanover, 12 December 2018
On behalf of the Supervisory Board:
Prof. Klaus MangoldChairman of the Supervisory Board

22 AU DI T COM MI T T E E R E P O R T
Dear Shareholders,
as the Audit Committee, it is our job to assist the Supervisory Board in carrying out its monitoring function during the financial year, particularly in relation to accounting and financial reporting for the TUI Group, as required by legal regulations, the German Corporate Governance Code as well as the UK Corporate Governance Code and the Supervisory Board Terms of Reference.
In addition to these core functions, we are responsible in particular for monitoring the effectiveness and proper functioning of internal controls, the risk management system, the internal audit depart-ment and the legal compliance system.
Furthermore, the Audit Committee is responsible for selecting external auditors. The selected auditors are then required to be put forward by the Supervisory Board to the Annual General Meeting for appointment. Following the appointment by the Annual General Meeting, the Supervisory Board formally commissions the external auditors with the task of auditing the annual financial statements and consolidated financial statements and reviewing the half-year financial statements as well as possible additional interim financial information, which comply with the requirements for half-year financial statements.
The Audit Committee was elected by the Supervisory Board directly after the annual general meeting 2016 and currently consists of the following eight Supervisory Board members:
• Prof. Edgar Ernst ( Chairman)• Andreas Barczewski• Dr Dierk Hirschl• Janis Carol Kong
• Prof. Klaus Mangold• Coline Lucille McConville• Michael Pönipp• Ortwin Strubelt
The membership of the Audit Committee members corresponds to the duration of their appointment to the Supervisory Board. There are no personnel changes to report in the composition of this committee since the last election.
Both the Chairman of the Audit Committee and the remaining members of the Audit Committee are seen by the Supervisory Board as meeting the criterion of being independent. In addition to the Chairman of the Audit Committee, at least one other member is required to have expertise in the field of accounting and experience in the use of accounting principles and internal control systems.
The Audit Committee has six regular meetings a year and additional topic-specific meetings may also be convened. These topic-specific meetings include one meeting in which the Executive Board explains to the Audit Committee the key content of the pre-close trading updates published shortly before the reporting date of the annual financial statements. The remaining meeting dates and agendas are geared in particular towards the Group’s reporting cycle and the agendas of the Supervisory Board.
The Chairman of the Audit Committee reports on the work of the Audit Committee and its proposals in the Supervisory Board meeting that follows each Audit Committee meeting.
Apart from the Audit Committee members, the meetings have been attended by the Chairman of the Executive Board, the CFO and depending on the topics covered the Directors Group Financial Accounting & Reporting, Group Audit, Group Legal, Group Com-pliance & Risk and Group Treasury & Insurance.
The external auditors have also been invited to meetings on relevant topics. Wherever required, additional members of TUI Group senior management and operational management have been asked to attend Audit Committee meetings, as have external consultants.
Where it was deemed necessary to go into further detail on specific topics or cases, the Chairman of the Audit Committee held – in addition to Audit Committee meetings – individual meetings with the relevant Executive Board, senior management or auditor rep-resentatives. The Chairman of the Audit Committee reported on the key findings and conclusions from these meetings in the next Audit Committee meeting.
The members took part in the Audit Committee meetings as shown in the table on page 17.
Implementation of the European General Data Protection Regulation
Since 25 May 2018, the European General Data Protection Regu-lation (EU GDPR) is in place. Even though we are convinced that data protection, especially of customer data, has always been a high-priority matter within TUI, the new EU GDPR implemented
AUDIT COMMIT TEE REPORT

23AU DI T COM MI T T E E R E P O R T
new and extended regulations that need to be taken into account. In our meetings we regularly received reports on the status of the implementation in the single business units.
Based upon this , we can report, that the implementation according to the specific national regulations was finished on time and that we are convinced that TUI took appropriate measures to comply with the EU GDPR rules.
Reliability of financial reporting and monitoring of accounting process
The Executive Board of a German stock corporation (Aktien-gesellschaft) alone is responsible for preparing its Annual Report & Accounts (ARA). Section 243(2) of the German Commercial Code (HGB) requires the ARA to be clearly structured and to give a realistic overview of the company’s financial situation. This is equivalent to the requirement of the UK Corporate Governance Code (UK CGC) for the ARA to be fair, balanced and understandable. Even though the evaluation of this requirement has not been transferred to the Audit Committee, the Executive Board is comfortable that the submitted ARA satisfies the requirements of both legal systems.
In order to be sure ourselves of the reliability of both the annual financial statements and interim reporting, we have requested that the Executive Board informs us in detail about the Group’s business performance and its financial situation. This was done in the four Audit Committee meetings that took place directly before the financial statements in question were published. In these meetings, the relevant reports were discussed and the auditors also reported in detail on key aspects of the financial statements and on the findings of their audit or review.
In order to monitor accounting, we examined individual aspects in great detail. In addition, the accounting treatment of key balance sheet items were reviewed, in particular goodwill, advance payments for tourism services and other provisions. In consultation with the auditors, we made certain that the assumptions and estimates underlying the balance sheet were appropriate. In addition, any material legal disputes and key accounting issues arising from the operating businesses were assessed by the Audit Committee.
In the period under review, we focused above all on the following individual subjects:
As the transfer of the existing local brands to the uniform TUI brand in the course of the ‘OneTUI’ project is completed, we asked the management to inform us about the costs and benefits of the project during this financial year. Based on these information we estimate the costs as appropriate and justified by the sustainable benefits from a uniform international brand.
Moreover, we discussed the results from a tax inspection for the Riu group, which led to additional taxes in this financial year. The Spanish tax authorities questioned the allocation of taxable profits to the companies involved in the sales organisation of the Riu group in different countries. We received a report on details of this issue and on the next steps to be taken. Additionally, we required a con-firmation that there are no other similar organisational structures within the Riu group.
Each quarterly reporting we asked for a report on the risks from guarantee and advance payment mechanisms related to Group and third-party hotels in Turkey and North Africa and on the counter-measures being undertaken, even though the bookings showed a noticeable recovery for these destinations in this financial year.
Besides, we gathered information about corporate transactions of the financial year. Furthermore, we also examined TUI’s investing activity in the following areas: Airlines, Hotels & Resorts, Cruises and IT. We obtained explanations of the key investments within the Group divisions and the earnings contributions from these investments.
The Audit Committee also discussed the going concern and viability statement analysis prepared by the company to support the statements made in the half-year report and the ARA.
Starting with FY 2018, the management report must contain infor-mation on corporate social responsibility (CSR). TUI started to publish the respective information already in FY 2017. The respon-sibility for the review of the content lies with the Supervisory Board. The Supervisory Board decided to take support from the Group Audit department of TUI. Accordingly, we asked Group Audit to inform us about the findings of their evaluation during this finan-cial year and we are convinced that the content of the CSR report is suitable and fair.
In addition, the consistency of the reconciliation from profit before tax to the key figure ‘underlying earnings’ and the material adjust-ments were discussed for all quarterly reports and for the annual financial statements.
Our evaluation of all discussed aspects of accounting and financial reporting is in line with that of both management and the Group auditors.
24 AU DI T COM MI T T E E R E P O R T
Effectiveness of internal controls and the risk management system
The Audit Committee recognises that a robust and effective system of internal control is critical to achieving reliable and consistent business performance. To fulfil its legal obligation to examine the effectiveness of internal controls and the risk management system, the Audit Committee is informed regularly about their current status and also about the further development of them.
The Group has continued to evolve its internal control framework which is underpinned by the COSO concept. Regular testing by management of the key financial controls is now a matter of routine in the larger businesses, and in our two largest source markets (UK and Germany) more widespread testing of internal controls is conducted.
Within the Group, the compliance function is further broken down into three areas: Finance, Legal and IT. These teams play a crucial role in improving controls across the Group and identifying areas where more focus is required. The Group auditors also report to us on any weaknesses they find in the internal control system of individual Group companies, and management tracks these items to ensure that they are addressed on a timely basis.
As stated from page 40 of the risk report, the Audit Committee receives regular reports on the performance and effectiveness of the risk management system. The Risk Oversight Committee is an important management committee within the Group and we are satisfied that there is appropriate, active management of risk throughout the Group.
The Group Audit department ensures the independent monitoring of implemented processes and systems as well as of core projects and reports directly to the Audit Committee in each regular meeting. In the period under review, the Audit Committee was not provided with any audit findings indicating material weaknesses in internal controls or the risk management system. As well as this, talks are held regularly between the Chairman of the Audit Committee and the Director of Group Audit for the purposes of closer consultation. The audits planned by the Group Audit department for the following year were presented to the Audit Committee in detail, discussed and approved. The Audit Committee feels that the effectiveness of the Group Audit department is ensured through this regular consultation.
The legal compliance system was examined via checklists and, for the first time, also by a self-assessment of the entities. The group-wide, uniformly implemented system was presented to us and we received a report about the conducted risk analysis and the measures derived from it. In addition to the core elements of the internal control and risk management system, the Group’s hedging policy was part of the reporting to us during the year.
Whistleblower systems for employees in the event of compliance breaches
Whistleblower systems have been set up across the Group to enable employees to draw attention to potential breaches of compliance guidelines.
Reporting on the legal compliance system included information about the group-wide standardisation of these whistleblower systems and we were also shown the main findings during the current financial year from this system.
Examination of auditor independence and objectivity
For FY 2018, the Audit Committee recommended to the Supervi-sory Board that it proposes Deloitte GmbH Wirtschaftsprüfungs-gesellschaft (Deloitte) to the Annual General Meeting as auditors. Following the commissioning of Deloitte as auditors by the Annual General Meeting in February 2018, the Supervisory Board ap-pointed Deloitte with the task of auditing the 2018 annual financial statements and reviewing the half-year financial statements as per 31 March 2018.
The Chairman of the Audit Committee discussed with Deloitte in advance the audit plan for the annual financial statements as at 30 September 2018, including the key areas of focus for the audit and the main companies to be audited from the Group’s perspective. Based on this, the Audit Committee firmly believes that the audit has taken into account the main financial risks to an appropriate degree and is satisfied that the auditors are independent and objective in how they conduct their work.
The audit fees were discussed with the auditors and we are convinced that the amount of these costs is reasonable. Based on the regular reporting by the auditors, we have every confidence in the effectiveness of the external audit. Therefore, we decided to recommend to the Supervisory Board that it propose to the Annual General Meeting to elect Deloitte as auditors for the FY 2019 as well. In a tender process in the FY 2016, Deloitte was selected as auditors and continued to be auditor since the first election by the Annual General Meeting in 2017.
In order to ensure the independence of the auditors, any non-audit services to be performed by the auditors must be submitted to the Audit Committee for approval before commissioning. Depending on the amount involved, the Audit Committee makes use of the option of delegating the approval to the company. The Audit Committee Chairman is only involved in the decision once a specified cost limit has been reached. Insofar as the auditor has performed services that do not fall under the Group audit, the nature and extent of these have been explained to the Audit Committee. This process complies with the company’s existing guideline regarding the

25AU DI T COM MI T T E E R E P O R T
approval of non-audit services and it takes into account the require-ments from the AReG regulations on prohibited non-audit services and on limitations of the scope of non-audit services. In FY 2018, these non-audit services accounted for 7 % of the auditor’s over-all fee of € 9,8 million.
I would like to take this opportunity to thank the Audit Committee members, the auditors and the management for their hard work over the past financial year.
Hanover, 11 December 2018
Prof. Edgar ErnstChairman of the Audit Committee

Far away from the beaten track: the polar regions are an unrivalled natural spectacle. TUI’s expedition vessels
offer holiday makers a voyage of the third kind.
»
READ MORE ABOUT THE WONDERS OF THE ANTARC TIC IN OUR MAGAZINE ARTICLE ‘CUTTING ICE ’ .

COMBINED MANAGEMENT REPORT*
* The present combined Management Report has been drawn up for both the TUI Group and TUI AG. It was prepared in accordance with sections 289, 289 (a), 315 and 315 (a) of the German Commercial Code (HGB) and German Accounting Standards (DRS) numbers 17 and 20.
The combined Management Report also includes the RemunerationReport, the Corporate Governance Report and the Financial Highlights.
63 Group earnings
67 Segmental performance
73 Net assets
75 Financial position of the Group
82 Non-financial Declaration
100 Annual financial statements of TUI AG
103 TUI share
108 Information required under takeover law
28 TUI Group strategy
32 Corporate profile
32 How we do it – Group structure
35 Value-oriented Group management
40 Risk report
56 Overall assessment by the Executive Board
and report on expected developments
60 Business review
60 Macroeconomic industry and market framework

28 COMBI NE D M A N AGE ME N T R E P O R T » T U I G roU p S T r AT e Gy
TUI GROUP STR ATEGY
1 21 m Markets & Airlines customers plus a further 2 m for Cruise and from our JVs in Canada and Russia = 23 m2 4 m customers direct and via 3rd party channels to our Hotels & Resort and Cruise brands3 This number includes group hotels and 3rd party concept hotels as at end of FY 20184 As at end of FY 20185 This number relates to Markets & Airlines and All other segments
~150 TUI Aircraft, 3rd party flying Owned/managed/JV
ROIC FY18: 14%
Owned/JVROIC FY18: 23%
3803
Hotels
Own, 3rd party committed & non-committed
164
Ships
3rd party distribution
3rd party distribution
Growth, diversification
ROIC FY18: 80%5
GROUP PLATFORMS
Owned/JVROIC FY18: 26%
115Destinations
3rd party distribution
Customer, knowledge, service & fulfillment
Integrateddistribution
Integrateddistribution
Integrateddistribution
23m customers1 4m customers2
HOLIDAY EXPERIENCES – ~70% EBITA
Digitalisation, efficiency, diversification
Markets & Airlines – ~30% EBITA
Rest Own & Committed

29COMBI NE D M A N AGE ME N T R E P O R T » T U I G roU p S T r AT e Gy
Strategy & Business Model
The leisure travel market has consistently outperformed world output growth over the last decade. This market is also projected to remain very attractive in the future. However, the traditional tour operator and package holiday market remains highly competitive. Online Travel Agencies have started to combine hotel and flight offerings by providing customers with dynamic packaging. In addition, airline operators now provide holiday accommodation as an add-on to de-risk their own flight capacity, supported by increasingly sourcing hotels directly. Meanwhile it is increasingly likely that there will be new market entrants, for example in the form of global tech companies.
Against this background, TUI has strategically moved away from the traditional tour operator model and developed into an integrated provider of Holiday Experiences. We have invested in our own product offerings, enabling us to create unique holidays for our customers, which is a key differentiation factor from our competi-tors. A TUI customer could be inspired by TUI, and book with TUI, and then experience a TUI flight, TUI transfer in destination, TUI hotel / cruise and TUI activity, as part of our end to end integrated product offering. This means our customers receive a holistic and seamless experience, while TUI receives more accurate information about what our customers truly want, helping our aim to further facilitate individualised offerings. From an end to end customer journey perspective, around 70 % of our underlying EBITA comes from our own and committed differentiated products.
H O L I DAY E X P E R I E N C E S
TUI operates 380 hotels and 16 cruise ships globally through owner-ship, JVs, management contracts, leases or franchise, and maintains a strong position in the growing tours & activities market with our 150 k excursion and activity offerings. Our differentiated hotel and club brand portfolio, our uniquely positioned German and UK cruise brands, and our global tours, activities and services destination business is well diversified to mitigate content cluster risks.
Details see from page 32
Our strong and in the future fully digitalised risk management tools within distribution and purchasing, allow us to optimise occupancy and yield. 23 m customers come through our Markets & Airlines, including joint ventures in Canada and Russia, complemented by 4 m customers sold either directly by Holiday Experiences, or via third parties. An optimised and in the future fully dynamic allocation of around 100 m bed nights and approx. € 5 bn third party hotel beds purchasing volume globally, will further contribute to our yield maximisation. As part of our divisional strategy, we continue to invest into the growth and diversification of our hotel and cruise portfolio, leading to a more seasonally robust business mix deliver-ing superior margins. Looking ahead, building a new Southeast Asia hotel cluster is a strategic priority. In addition we have a strong pipeline of new ship deliveries in the coming years.
The global and pre-dominantly offline, fast growing tours and activities market, worth over € 150 bn is highly fragmented with over 300 k providers and therefore offers a strong growth and consolidation opportunity for TUI Group. By acquiring the Hotelbeds Destination Management business and the technology platform specialist Musement, TUI has built a leading and fully digitalised Destination Experiences business. From FY 2019 onwards we operate in 49 countries with over 150 k excursions and activities in destinations in our inventory for our own and third party customers. This set up allows us to offer our 27 m customers excursions and activities, in particular even prior to the customers’ arrival in the destination. The trust in our brand and our strong fulfillment capa-bilities allow us to fulfill our customers’ expectations from order intake to payment.

30 COMBI NE D M A N AGE ME N T R E P O R T » T U I G roU p S T r AT e Gy
M A R K E T S & A I R L I N E S
TUI operates a customer centric and diversified distribution and fulfillment business across Europe. We combine leveraging our strong market and customer knowledge, driving customer satis-faction and retention, with service and fulfillment. Packaging and purchasing is increasingly driven through our digital platforms and our own airlines, supported by third party flights, facilitate the link between customer demand and our own, as well as third party committed and non-committed hotel and cruise offerings.
Enhancing efficiency by harmonising these regional market organi-sations, which include our airlines as well, is a key strategic priority.
In addition, we intend to diversify our existing market footprint further. Through our fully digital LTE platform, we are pursuing a low risk entry strategy, simultaneously improving our position to yield our Holiday Experiences’ risk capacity through additional new source market demand.
G R O U P P L AT F O R M S
Our Group platform initiatives, in particular around IT and digitalised customer relationship management, will enable us to enhance our Group yields further. By individualising our offerings and identifying the next best activity for our customers, enabled by our integrated content management and distribution business model, we enhance customer satisfaction and drive our ancillary yields, a win-win opportunity. As an example, our select your room initiative, allows our customers to book their preferred and specific hotel room, which moves our offering from room category pricing to individualised room pricing.
It is the integrated and double diversified nature of our business, which sets us apart from the competition. Our integrated business model proves to be robust, offering flexibility to react to external challenges, either in one of our Markets & Airlines or destinations.
Our employees
Qualified and engaged employees are a major pre-requisite for TUI’s long-term success. We are aiming to be an attractive employer, encouraging our employees to engage with passion and personality. One of the key elements of our global HR strategy, therefore, is to attract and promote people with talent and to retain them by offering attractive employment conditions. In 2018, our engagement index* is 76, one point below previous year’s value. Our goal is to achieve a colleague engagement score of over 80 by 2020 in order to be among the Top 25 global companies.
At the same time, digital transformation creates technical, cultural and organisational challenges for our employees. However, digitalisation also creates opportunities for personalised lifestyles and work design. We are seeking to actively address these requirements and the permanent change taking place in the world of work so as to shape the future together.
* The Engagement Index comprises the individual commitment and the team commitment of our employees. Individual commitment means not only overall satisfaction, but also the willingness for recommendation, the pride to work for a company as well as the belief in its future viability.

31COMBI NE D M A N AGE ME N T R E P O R T » T U I G roU p S T r AT e Gy
Capital Allocation
We will continue to operate within a clearly defined and disciplined capital allocation framework. Our strong cash generation allows us to invest, pay dividends and strengthen the balance sheet. Since the merger, we have generated around € 2 bn of disposal proceeds, which we have reinvested primarily into our higher margin, lower seasonality and better quality Holiday Experiences business, with a ROIC hurdle rate for growth investments of at least 15 % on av-erage. We also invest via ring-fenced joint ventures, make use of highly efficient asset finance and other finance instruments, as well as more ‘asset light’ hotel management contracts, to optimise the cash flow available to shareholders.
Finally, we have a clear financial policy to ensure balance sheet stability, targeting a leverage ratio of 3.0 times to 2.25 times and coverage ratio of 5.75 times to 6.75 times.
Summary
Looking ahead, we continue to expect to deliver superior annual earnings growth with improved seasonality, strong cash conversion and strong ROIC performance. This will be driven by benefits of our digitalisation efforts, efficiency measures and differentiation strategy through the disciplined expansion of own hotel and cruise, plus destination experience content.
Please refer to the Guidance section from page 56 for further details.
Our environment
For TUI Group, economic, environmental and social sustainability is a fundamental management principle and a cornerstone of our strategy for continually enhancing the value of our Company. This is the way we create the conditions for long-term economic success and assume responsibility for sustainable development in the tourism sector.
The goals we set ourselves in our ‘Better Holidays, Better World‘ sustainability strategy include ‘Step lightly’, where we aim to reduce the environmental impact of our business operations and to fix clear, ambitious goals for improvements in all Group areas.
Greenhouse gas emissions and the impact of these emissions on climate change pose one of the major global challenges for the tourism sector. In FY 2018, TUI Group’s total emissions increased year-on-year in absolute terms, primarily due to the growth in Airlines & Aviation. At 66.7 g CO2 / pkm, specific carbon emissions of our airlines were flat year-on-year. This means that we already operate one of Europe’s most carbon-efficient airlines and continually seek to deliver further improvements.
Our goal: We will operate the most carbon-efficient airlines in Europe and cut the carbon intensity of our operations by 10 % by 2020 (baseline year 2014).

32 COMBI NE D M A N AGE ME N T R E P O R T » Cor p or AT e prof Il e
CORPOR ATE PROFILE
How we do it – Group structure
TUI AG parent company
TUI AG is TUI Group’s parent company headquartered in Hanover and Berlin. It holds direct or, via its affiliates, indirect interests in the principal Group companies conducting the Group’s operating business in individual countries. Overall, TUI AG’s group of consol-idated companies comprised 285 direct and indirect subsidiaries at the balance sheet date. A further 17 affiliated companies and 27 joint ventures were included in TUI AG’s consolidated financial statements on the basis of at equity measurement.
For further details on principles and methods of consolidation and
TUI Group shareholdings see pages 161 and 251.
O R G A N I S AT I O N A N D M A N AG E M E N T
TUI AG is a stock corporation under German law, whose basic prin-ciple is dual management by two boards, the Executive Board and the Supervisory Board. The Executive and Supervisory Boards cooperate closely in governing and monitoring the Company. The Executive Board is responsible for the overall management of the Company.
The appointment and removal of Board members is based on sections 84 et seq. of the German Stock Corporation Act in com-bination with section 31 of the German Co-Determination Act. Amendments to the Articles of Association are effected on the basis of the provisions of sections 179 et seq. of the German Stock Corporation Act in combination with section 24 of TUI AG’s Articles of Association.
E X E C U T I V E B OA R D A N D G R O U P E X E C U T I V E CO M M I T T E E
As at the balance sheet date, the Executive Board of TUI AG consist-ed of the CEO and five other Board members.
For details on Executive Board members see page 114
A Group Executive Committee was set up in order to manage TUI Group strategically and operationally. As at 30 September 2018, the Committee consisted of twelve members who meet under the chairmanship of CEO Friedrich Joussen.
TUI Group structure
Since the merger between TUI AG and TUI Travel PLC in Decem-ber 2014, TUI Group has been a world market leader in tourism. Its core businesses, Holiday Experiences and Markets & Airlines, are clustered into the segments Hotels & Resorts, Cruises and Desti-nation Experiences as well as three regions: Northern, Central and Western Regions. TUI Group also comprises All other segments.
In FY 2018 we have adjusted our segmental reporting to reflect the growing strategic importance of the services delivered in our des-tinations. Destination Experiences is now reported separately in the segmental structure, and within Holiday Experiences together with Hotels & Resorts and Cruises. The further businesses of former Other Tourism and All other segments have been combined into All other segments. There are no changes to the total numbers. The prior year’s reference figures were restated accordingly.
H O L I DAY E X P E R I E N C E S
Holiday Experiences comprises our hotel, cruise and destination activities.
H O L I D AY E X P E R I E N C E S
Hotels & Resorts
Cruises
Destination Experiences
M A R K E T S & A I R L I N E S
Northern Region
Central Region
Western Region
O T H E R
S E G M E N T S

33COMBI NE D M A N AGE ME N T R E P O R T » Cor p or AT e prof Il e
H OT E L S & R E S O R T S
The Hotels & Resorts segment comprises TUI Group’s diversified portfolio of Group hotel brands and hotel companies. The segment includes ownership in hotels, joint ventures with local partners, stakes in companies giving TUI a significant influence, and hotels operated under management contracts.
In FY 2018, Hotels & Resorts comprised a total of 330 hotels with 241,207 beds. 306 TUI Hotels & Resorts, i. e. the majority, are in
the four- or five-star category. 45 % were operated under manage-ment contracts, 40 % were owned by one of the hotel companies, 13 % were leased and 2 % of the hotels were managed under fran-chise agreements.
In addition there are also 50 concept hotels operated by third party hoteliers under the TUI concept brands, TUI Sensatori, TUI Sensimar and TUI Family Life, making a total of 380 Group hotels, incuding third party.
In brackets: previous year
Categories of Hotels & Resorts
Hotel brand 3 stars 4 stars 5 stars Total hotels Beds Main sites
Riu
3 46 41 90 82,638
Spain, Mexico, Caribbean,
Cape Verde, Portugal, Morocco
Robinson – 18 6 24 14,403 Spain, Greece, Turkey, Austria
Blue Diamond
2 10 14 26 27,016
Cuba, Dom. Rep., Jamaica,
Mexico, Saint Lucia
Other hotel companies 19 117 54 190 117,150 Spain, Greece, Turkey, Egypt
Total 24 191 115 330 241,207
TUI Sensatori, TUI Sensimar,
TUI Family – third party concept
hotels – 32 18 50 11,696* Spain, Greece, Italy
* rooms As at 30 September 2018
Riu is the largest hotel company in the portfolio of Hotels & Resorts. The Majorca-based enterprise has a high proportion of regular customers and stands for professionalism and excellent service. Most of the hotels are in the premium and comfort segments and they are predominantly located in Spain, Mexico and the Caribbean.
Robinson, the leading provider in the German-speaking premium club holiday segment, is characterised by its professional sport,
entertainment and event portfolio. Moreover, the clubs offer high- quality hotel amenities, excellent service and spacious architec-ture. Most of the hotels are located in Spain, Greece, Turkey, the Maldives and Austria. The facilities are also aspirational in terms of promoting sustainable development and signing up to specific environmental standards.
Hotels & Resorts financing structure % Hotels & Resorts beds per region %
(45) 45Management
(29) 29Caribbean
2 (3) Franchise
13 (13)Lease
40 (39)Ownership
8 (8)
Other countries
(23) 22Eastern
Mediterranean
22 (22)Western Mediterranean
19 (18) North Africa / Egypt% %

34 COMBI NE D M A N AGE ME N T R E P O R T » Cor p or AT e prof Il e
Blue Diamond is a fast growing resort chain in the Caribbean with a unique approach of tailoring hotels to meet the highest expectations. 26 Blue Diamond resorts are shown in the segment.
Other hotel companies include in particular the Group’s other core brands TUI Blue and TUI Magic Life, as well as our exclusive hotel concepts TUI Sensimar, TUI Sensatori and TUI Family Life. They provide holidays in top locations in our destinations and meet high performance, quality and environmental standards.
C R U I S E S
The Cruises segment consists of the joint venture TUI Cruises, Marella Cruises and Hapag-Lloyd Cruises. With their combined fleet of 16 vessels, the three cruise lines offer different service concepts to serve different target groups.
Cruise fleet by ownership structure
Owned Finance
Lease
Operating
Lease
Total
TUI Cruises
(Joint Venture) 6 – – 6
Marella Cruises 3 2 1 6
Hapag-Lloyd Cruises 3 – 1 4
As at 30 September 2018
Hamburg-based TUI Cruises is a joint venture formed in 2008 between TUI AG and the US shipping company Royal Caribbean Cruises Ltd., in which each partner holds a 50 % stake. With six ships so far, TUI Cruises is top-ranked in the German-speaking premium market for cruises. The Berlitz Cruise Guide, the most important international reference guide for cruise ship ratings, rated Mein Schiff 3, Mein Schiff 4, Mein Schiff 5 and Mein Schiff 6 among the world’s five best liners in the category ‘Large Ships’.
Marella Cruises, operated under the brand Thomson Cruises until October 2017, offers voyages for different segments in the British market with a fleet of six cruise liners.
Hapag-Lloyd Cruises is based in Hamburg, and it holds a position of leadership in the German-language market with its fleet of four liners in the luxury and expedition cruise segments. Its flagships Europa and Europa 2 were again awarded the top rating – the 5-stars-plus category – by the Berlitz Cruise Guide. Its expedition liners include Hanseatic and Bremen. Hanseatic nature and Han-seatic inspiration will complement the luxury expedition segment from 2019.
D E S T I N AT I O N E X P E R I E N C E S
The Destination Experiences segment delivers local services in the worldwide holiday destinations. TUI employs people in 49 countries to ensure these services and is among the top providers of tours, activities and excursions in the destinations. Thanks to the acqui-sition of the technology start-up Musement in October 2018, TUI now has an online platform that gives small and medium-sized companies the opportunity to offer their services in the holiday destinations following quality checks.
M A R K E T S & A I R L I N E S ( F O R M E R LY S A L E S & M A R K E T I N G )
With our three regions Northern, Central and Western Region, we have well positioned sales and marketing structures providing more than 23 m customers (including via our JVs in Canada and Russia) a year with exceptional holiday experiences. Our sales activities are based on online and offline channels that also benefit from TUI’s strong market position. The travel agencies include Group-owned agencies as well as joint ventures and agencies operated by third parties. Thanks to our direct customer access, we are able to build close relationships with our guests, and in future this will allow us to gear their entire holiday experience even more closely to their personal wishes and preferences, giving us a crucial advantage over our competitors. In order to offer our customers a wide choice of hotels, our Markets & Airlines organisations have access to the exclusive portfolio of TUI hotels.
They also have access to third-party bed capacity, some of which have been contractually committed. Our own flight capacity con-tinues to play a key role in our integrated business model. A combi-nation of owned and third-party flying capacity enables us to offer tailor-made travel programmes for each individual source market region and to respond flexibly to changes in customer preferences. Thanks to the balanced management of flight and hotel capacity, we are able to develop high-profile destinations and optimise the margins of both service providers. In FY 2018, we continued to deliver our internal efficiency enhancement programme at one Avi-ation, delivering further economies of scale. In the financial year un-der review, we continued our path towards a modern, fuel- efficient fleet. In 2018, the first Boeing 737 Max jets were delivered. TUI Group has ordered a total of 68 planes of this type, considered to be the state of the art in this category of aircraft. They are sched-uled for delivery by 2023. Overall, there are more than 150 aircraft in the TUI fleet.
N O R T H E R N R E G I O N
The Northern Region segment comprises tour operator activities and airlines in the UK, Ireland and the Nordics. In addition, the Canadian strategic venture Sunwing and the joint venture TUI Russia have been included within this segment.

35COMBI NE D M A N AGE ME N T R E P O R T » Cor p or AT e prof Il e
C E N T R A L R E G I O N
The Central Region segment comprises the tour operator activities and airlines in Germany and the tour operator activities in Austria, Switzerland and Poland.
W E S T E R N R E G I O N
The tour operator activities and airlines in Belgium, the Netherlands and the tour operator activities in France are included within the segment Western Region.
A L L O T H E R S E G M E N T S
The category ‘All other segments’ includes our business activities for the new markets, the French airline Corsair, the corporate centre functions of TUI AG and the interim holdings, as well as the Group’s real estate companies.
Research and development
As a tourism service provider, the TUI Group does not engage in research and development activities comparable with manufacturing companies. This sub-report is therefore not prepared.
Value-oriented Group management
Management system and key performance indicators
A standardised management system has been created to implement value-driven management across the Group as a whole and in its individual business segments. The value-oriented management system is an integral part of consistent Group-wide planning and controlling processes.
Our key financial performance indicators for the development of the earnings position are turnover and the Group’s underlying earnings before interest, taxes and expenses for the measurement of interest hedges and amortisation of goodwill (underlying EBITA). EBITA and underlying EBITA do not include measurement effects from interest hedges. In the prior year it did not include earnings effects from container shipping. Underlying EBITA has been adjusted for gains on disposal of investments, restructuring expenses ac-cording to IAS 37, all effects of purchase price allocations, ancillary acquisition costs and conditional purchase price payments as well as other expenses for and income from one-off items. One-off items carried as adjustments are income and expense items impacting or distorting the assessment of the operating profitability of the segments and the Group due to their level and frequency. These one-off items include in particular major restructuring and inte-gration expenses not meeting the criteria of IAS 37, major expenses for litigation, gains and losses from the sale of aircraft and other material business transactions of a one-off nature.
For the development of the Group’s financial position in FY 2018, we have identified TUI Group’s net capital expenditure and investments and net financial position as key performance indicators.
Instead of the net financial position, we will report the Group’s leverage ratio as the key performance indicator for its financial position from FY 2019.
Key management variables used for regular value analysis are Return On Invested Capital (ROIC) and Economic Value Added. ROIC is compared with the segment-specific cost of capital.
We regard specific CO2 emissions (in g CO2 / PKM) of our aircraft fleet as a key non-financial performance indicator.
In order to track business performance in our segments in the course of the year, we also monitor other secondary non-financial performance indicators, such as customer numbers in Markets & Airlines, and capacity or passenger days, occupancy and average prices in Hotels & Resorts and Cruises.
Information on operating performance indicators is provided in the
sections ‘Segmental performance’ on page 67 and ‘The environment’
on page 86.

36 COMBI NE D M A N AGE ME N T R E P O R T » Cor p or AT e prof Il e
Cost of capital (WACC)
Cost of capital (WACC)
Hotels Cruises Markets &
Airlines3
TUI Group
% 2018 2018 2018 2018
Risk-free interest rate 1.00 1.00 1.00 1.00
Risk adjustment 6.00 6.48 6.47 5.72
Market risk premium 6.50 6.50 6.50 6.50
Beta factor1 0.92 1.00 0.99 0.88
Cost of equity after taxes 7.00 7.48 7.47 6.72
Cost of debt capital before taxes 2.55 2.55 3.66 3.66
Tax shield 0.64 0.05 0.84 0.74
Cost of debt capital after taxes 1.91 2.50 2.82 2.92
Share of equity2 83.26 71.58 63.89 62.32
Share of debt capital2 16.74 28.42 36.11 37.68
WACC after taxes 6.15 6.06 5.79 5.29
Cost of equity before taxes 8.93 7.60 9.17 8.01
Cost of debt capital before taxes 2.55 2.55 3.66 3.66
Share of equity2 83.26 71.58 63.89 62.32
Share of debt capital2 16.74 28.42 36.11 37.68
WACC before taxes 7.86 6.16 7.18 6.37
1 Segment beta based on peer group, group beta based on Capital IQ data base.2 Segment share based on peer group, group share based on Capital IQ data base.3 Due to insufficient statistical significance of Thomas Cook Group plc and H.I.S. Co., Ltd. shown in the standard procedure of beta regression
(average of 60 monthly data points over 5 years), we have performed an alternative beta regression based on average of 104 weekly data points over two years. The alternative beta regression shows statistical significance for all peer companies.
The cost of capital is calculated as the weighted average cost of equity and debt capital (WACC). While the cost of equity reflects the return expected by investors from TUI shares, the cost of debt capital is based on the average borrowing costs of the TUI Group. The cost of capital always shows pre-tax costs, i. e. costs before corporate and investor taxes. The expected return determined in this way is subjected to the same tax level as the underlying earnings included in ROIC.
ROIC and Economic Value Added
ROIC is calculated as the ratio of underlying earnings before interest, taxes and amortisation of goodwill (underlying EBITA) to the average invested interest-bearing capital (invested capital) for the relevant
segment. Given its definition, this performance indicator is not influenced by any tax or financial factors and has been adjusted for one-off items. From a Group perspective, invested capital is derived from liabilities, comprising equity (including non-controlling interests) and the balance of interest-bearing liabilities and interest- bearing assets and an adjustment to reflect the seasonal change in the Group’s net financial position. The cumulative amortisations of purchase price allocations are then added to invested capital.
Apart from ROIC as a relative performance indicator, Economic Value Added is used as an absolute value-oriented performance indicator. Economic Value Added is calculated as the product of ROIC less associated capital costs multiplied by invested interest- bearing capital.

37COMBI NE D M A N AGE ME N T R E P O R T » Cor p or AT e prof Il e
Invested Capital
€ million Notes 2018 2017
Equity 4,333.6 3,533.7
Subscribed capital (23) 1,502.9 1,501.6
Capital reserves (24) 4,200.5 4,195.0
Revenue reserves (25) – 2,005.3 – 2,756.9
Non-controlling interest (27) 635.5 594.0
plus interest bearing financial liability items 3,516.2 3,328.2
Pension provisions and similar obigations (28) 994.8 1,127.4
Non-current financial liabilities (30), (36) 2,250.7 1,761.2
Current financial liabilities (30), (36) 192.2 171.9
Derivative financial instruments (36) 78.5 267.7
less financial assets 3,390.1 3,024.7
Financial assets available for sale (36) 54.3 69.5
Derivative financial instruments (36) 525.0 295.3
Cash and cash equivalents (21), (36) 2,548.0 2,516.1
Other financial assets 262.8 143.8
= Invested Capital before addition of effects from purchase price allocation 4,459.7 3,837.2
Invested Capital excluding effects from purchase price allocation prior year 3,837.2 3,880.1
Seasonal adjustment1 500.0 500.0
Ø Invested capital before addition of effects from purchase price allocation2 4,648.2 4,358.7
Invested Capital before addition of effects from purchase price allocation 4,459.7 3,837.2
plus effects from purchase price allocation 342.0 317.5
= Invested Capital 4,801.7 4,154.7
Invested Capital prior year 4,154.7 4,180.6
Seasonal adjustment1 500.0 500.0
Ø Invested Capital2 4,978.2 4,667.7
ROIC
€ million Notes 2018 2017
Underlying EBITA 1,147.0 1,102.1
Ø Invested Capital2 4,978.2 4,667.7
ROIC % 23.04 23.61
Weighted average cost of capital (WACC) % 6.37 6.75
Value added 829.9 787.0
1 Adjustment to net debt to reflect a seasonal average cash balance2 Average value based on balance at beginning and year-end
For TUI Group, ROIC was 23.04 %, down by 0.57 percentage points year-on-year. With the cost of capital at 6.37 %, this yielded positive Economic Value Added of € 829.9 m (previous year € 787.0 m).

38 COMBI NE D M A N AGE ME N T R E P O R T » Cor p or AT e prof Il e
Group indicators used in the remuneration system for the Executive Board
J E V- R E L E VA N T G R O U P R E S U LT AT CO N S TA N T C U R R E N C Y
When determining the Executive Board’s annual performance- based remuneration (JEV), the Group’s EBT (earnings before taxes) on a constant currency basis is applied with a weighting of 50 %. Using this indicator means that the net financial result is included in calculations of JEV. It is adjusted for foreign exchange effects so that actual management performance can be measured without distortion from the impact of currency translation.
EBT on a constant currency basis was as follows in the financial year under review:
Reconciliation EBT
€ million 2018
Earnings before income taxes 971.5
FX effects from translation to budget rates 88.0
EBT at budget rates 1,059.5
J E V- R E L E VA N T R E T U R N O N I N V E S T E D C A P I TA L ( R O I C )
The Group performance indicator ROIC is applied to JEV with a weighting of 25 %. TUI Group’s ROIC for the calculation of JEV is derived from the ratio of the Group’s EBITA to the average invested interest-bearing capital for the financial year. TUI Group’s ROIC used to calculate JEV was as follows in the financial year under review:
ROIC JEV
€ million 2018
EBITA 1,060.2
Ø Invested capital excl. purchase price allocation* 4,648.4
ROIC JEV % 22.81
* Average value based on balance at beginning and year-end
J E V- R E L E VA N T C A S H F L O W
The third Group performance indicator included in the calculation of JEV is the cash flow component ‘Cash flow to the firm’ with a weighting of 25 %. For this purpose, the cash flow to the firm is calculated using a simplified approach based on the management cash flow calculation, which covers the liquidity parameters directly controlled by the Executive Board (depreciation / amortisation, working capital, income from investments and dividends, net in-vestments) on the basis of TUI Group’s EBITA, adjusted for foreign exchange effects.
The cash flow to the firm used to calculate JEV was as follows in the financial year under review:
Cash Flow to the firm
€ million 2018
EBITA 1,060.2
Effect from translation to budget rates 96.9
EBITA at budget rates 1,157.1
Amortisation (+) / write-backs (–) of other intangible
assets and depreciation (+) / write-backs (–) of property,
plant and equipment 438.3
Delta Working Capital 66.4
Share of result of joint ventures and assoiciates – 297.7
Dividends from joint ventures and assoiciates 222.7
Net capex and investments – 827.0
Cash Flow to the firm 759.7
Reconciliation of change in working capital according to cash flow to the firm
€ million 30 Sep 2018 30 Sep 2017
Non-current assets 4,929.7 4,317.9
less cash and cash equivalents – 2,548.0 – 2,516.1
less non-current liabilities – 6,506.8 – 6,152.1
plus current financial liabilities 192.2 171.9
less current other provisions – 348.3 – 349.9
less net tax receivables – 27.6 – 33.4
less / plus net current derivative
financial instruments – 376.1 1.8
less interest bearing receivables – 55.5 – 49.2
plus current accrued interest 25.6 28.6
Working capital according to
balance sheet – 4,714.8 – 4,580.5
Change in working capital acc. to
balance sheet 134.3
Exchange rate differences – 67.9
Change in working capital acc.
to cash flow to the firm 66.4
U N D E R LY I N G E A R N I N G S P E R S H A R E
When determining the long-term remuneration of the Executive Board (Long Term Incentive Plan – LTIP), the average development of underlying earnings per share from continuing operations (LTIP-relevant EPS) is applied with a weighting of 50 %.

39COMBI NE D M A N AGE ME N T R E P O R T » Cor p or AT e prof Il e
The table below shows TUI Group’s underlying earnings per share. The net interest expense used for the calculation was adjusted for interest portions of the reversal of a provision of € 31.2 m recognised in the financial year under review. A normalised Group tax rate of 20 % was assumed for the calculation. An adjustment was carried for non-controlling interests to reflect the normalised tax rate used in determining underlying earnings per share in the financial year under review. The calculation is based on subscribed capital at the balance sheet date. Underlying earnings per share from continuing operations (LTIP-relevant EPS) developed as follows in the financial year under review:
Pro forma underlying earnings per share TUI Group
€ million 2018 2017
EBITA (underlying) 1,147.0 1,102.1
less: Net interest expense (adjusted) – 119.9 – 119.2
Underlying profit before tax 1,027.1 982.9
Income taxes (20 % assumed tax rate) 205.4 196.6
Underlying Group profit 821.7 786.3
Minority interest (adjusted) 134.8 116.6
Underlying Group profit attributable
to TUI shareholders of TUI AG 686.9 669.7
Number of shares at FY end No. million 587.9 587.0
Underlying earnings per share 1.17 1.14
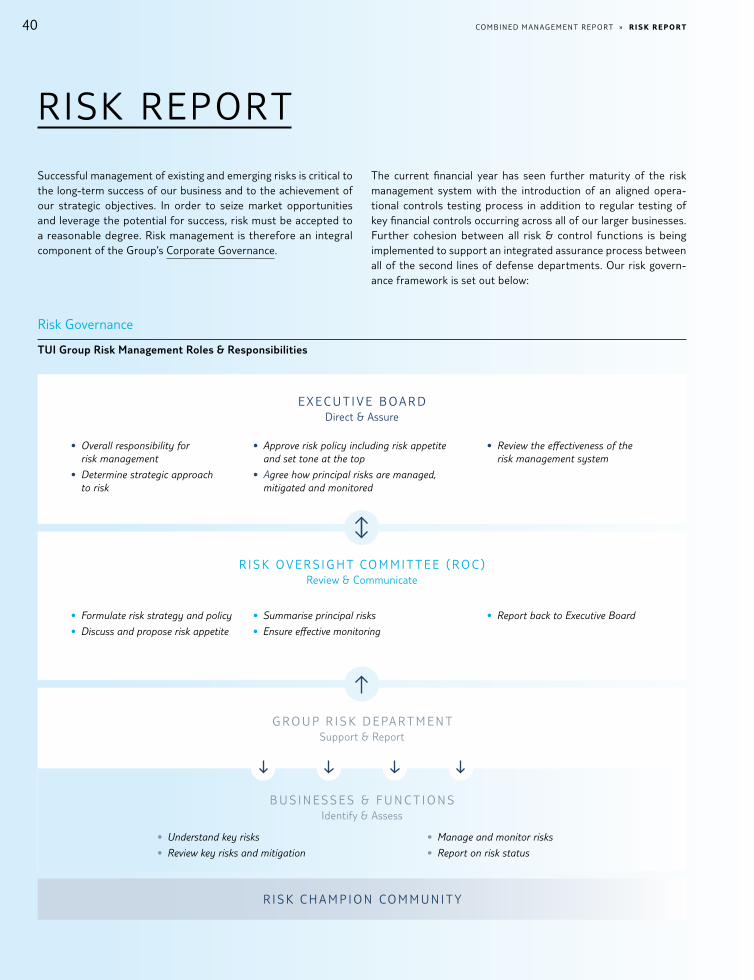
40 COMBI NE D M A N AGE ME N T R E P O R T » r I S K r e p or T
RISK REPORT
Successful management of existing and emerging risks is critical to the long-term success of our business and to the achievement of our strategic objectives. In order to seize market opportunities and leverage the potential for success, risk must be accepted to a reasonable degree. Risk management is therefore an integral component of the Group’s Corporate Governance.
The current financial year has seen further maturity of the risk management system with the introduction of an aligned opera-tional controls testing process in addition to regular testing of key financial controls occurring across all of our larger businesses. Further cohesion between all risk & control functions is being implemented to support an integrated assurance process between all of the second lines of defense departments. Our risk govern-ance framework is set out below:
Risk Governance
R I S K O V E R S I G H T CO M M I T T E E ( R O C )Review & Communicate
• Formulate risk strategy and policy
• Discuss and propose risk appetite
• Report back to Executive Board• Summarise principal risks
• Ensure effective monitoring
TUI Group Risk Management Roles & Responsibilities
• Overall responsibility for risk management
• Determine strategic approach to risk
• Approve risk policy including risk appetite and set tone at the top
• Agree how principal risks are managed, mitigated and monitored
• Review the effectiveness of the risk management system
E X E C U T I V E B O A R DDirect & Assure
R I S K C H A M P I O N CO M M U N I T Y
G R O U P R I S K D E PA R T M E N TSupport & Report
• Understand key risks
• Review key risks and mitigation
• Manage and monitor risks
• Report on risk status
B U S I N E S S E S & F U N C T I O N SIdentify & Assess

41COMBI NE D M A N AGE ME N T R E P O R T » r I S K r e p or T
E X E C U T I V E B OA R D – D I R E C T & A S S U R E
With oversight by the Supervisory Board, the Executive Board determines the strategic direction of the Group and agrees the nature and extent of the risks it is willing to take to achieve its strategic objectives.
To ensure that the strategic direction chosen by the business rep-resents the best of the strategic options open to it, the Executive Board is supported by the Group Strategy function. This function exists to facilitate the Executive Board’s assessment of the risk landscape and development of potential strategies by which it can drive long-term shareholder value. On an annual basis the Group Strategy function develops an in-depth fact base in a consistent format which outlines the market attractiveness, competitive position and financial performance by division and market. These are then used to facilitate debate as to the level and type of risk that the Executive Board finds appropriate in the pursuit of its strategic objectives. The strategy, once fully defined, considered and approved by the Executive Board, is then incorporated into the Group’s three-year roadmap and helps to communicate the risk appetite and expectations of the organisation both internally and externally.
Ultimately, accountability for the Group’s risk management rests with the Executive Board and therefore it has established and maintains a risk management system to identify, assess, manage and monitor risks which could threaten the existence of the company or have a significant impact on the achievement of its strategic objectives: these are referred to as the principal risks of the Group. This risk management system includes an internally- published risk management policy which helps to reinforce the tone set from the top on risk, by instilling an appropriate risk culture in the organisation whereby employees are expected to be risk aware, control minded and ‘do the right thing’. The policy provides a formal structure for risk management to embed it in the fabric of the business. Each principal risk has assigned to it a member of the Executive Committee as overall risk sponsor to ensure that there is clarity of responsibility and to ensure that each of the principal risks are understood fully and managed effectively.
The Executive Board regularly reports to the Audit Committee of the Supervisory Board on the adherence to both the UK and German listing requirements, the overall risk position of the Group, on the individual principal risks and their management, and on the performance and effectiveness of the risk management system as a whole.
R I S K OV E R S I G H T CO M M I T T E E – R E V I E W & CO M M U N I C AT E
On behalf of the Executive Board, the Risk Oversight Committee (the ROC), a subset of the Executive Committee, ensures that business risks are identified, assessed, managed and monitored across the businesses and functions of the Group. Meeting on at least a quarterly basis, the ROC’s responsibilities include considering the principal risks to the Group’s strategy and the risk appetite for each of those risks, assessing the operational effectiveness of the controls in place to manage those risks and any action plans to
further improve controls, as well as reviewing the bottom-up risk reporting from the businesses themselves to assess whether there are any heightened areas of concern.
Senior executives from the Group’s major businesses are required to attend the ROC on a rotational basis and present on the risk and control framework in their business, so that the members of the ROC can ask questions on the processes in place, the risks present in each business and any new or evolving risks which may be on their horizon, and also to seek confirmation that an appropriate risk culture continues to be in place in each of the major businesses.
Chaired by the Chief Financial Officer, other members of the Committee include the CEO Aviation, the directors of Strategy, Financial Accounting, Treasury & Insurance and Group HR. In addi-tion to these, all of the second lines of defense functions including Risk, Financial Control, Legal Compliance, IT Security and Health & Safety are represented on the committee. The director of Group Audit attends as an independent member and therefore is without voting rights.
The ROC reports bi-annually to the Executive Board to ensure that it is kept abreast of changes in the risk landscape and developments in the management of principal risks, and to facilitate regular quality discussions on risk management at the Executive Board meetings.
G R O U P R I S K D E PA R T M E N T – S U P P O R T & R E P O R T
The Executive Board has also established a Group Risk department to ensure that the risk management system functions effectively and that the risk management policy is implemented appropriately across the Group. The department supports the risk management process by providing guidance, support and challenge to manage-ment whilst acting as the central point for coordinating, monitoring and reporting on risk across the Group. It also supports the ROC in fulfilling it’s duties and the reporting to both the Executive and Supervisory Boards. Additionally, Group Risk is responsible for the operation of the risk and control software that underpins the Group’s risk reporting and risk management process.
B U S I N E S S E S & F U N C T I O N S – I D E N T I F Y & A S S E S S
Every business and function in the Group is required to adopt the Group Risk Management policy. In order to do this, each either has their own Risk Committee or includes risk as a regular agenda item at their Board meetings to ensure that it receives the appropriate senior management attention within their business. In addition, the businesses each appoint a Risk Champion, who promotes the risk management policy within their business and ensures its ef-fective application. The Risk Champions are in close contact with Group Risk and are critical both in ensuring that the risk manage-ment system functions effectively, and in implementing a culture of continuous improvement in risk management and reporting.

42 COMBI NE D M A N AGE ME N T R E P O R T » r I S K r e p or T
Risk Reporting
The Group Risk department applies a consistent risk reporting methodology across the Group. This is underpinned by a risk and control software which reinforces clarity of language, visibility of risks, controls and actions and accountability of ownership. Although the process of risk identification, assessment and response is con-tinuous and embedded within the day-to-day operations of the businesses and functions, it is consolidated, reported and reviewed at varying levels throughout the Group on at least a quarterly basis.
Risk Identification: Management closest to the risks identify the risks relevant to the pursuit of the strategy within their business area in the context of four risk types:
• Longer-term strategic and emerging threats;• Medium-term challenges associated with business change• Short-term risks triggered by changes in the external and regu-
latory environment; and• Short-term risks in relation to internal operations and control.
A risk owner is assigned to each risk, who has the accountability and authority for ensuring that the risk is appropriately managed.
Risk Descriptions: The nature of the risk is articulated in line with best practice, stating the underlying concern the risk gives arise to, identifying the possible causal factors that may result in the risk materializing and outlining the potential consequences should the risk crystallise. This allows the businesses, functions and the Group to assess the interaction of risks and potential triggering events and / or aggregated impacts before developing appropriate mitigation strategies for causes and / or consequences.
Risk Assessment: The methodology used is to initially assess the gross (or inherent) risk. This is essentially the worst case scenario, being the product of the impact together with the likelihood of the risk materializing if there are no controls in place to manage, mitigate or monitor the risk. The key benefit of assessing the gross risk is that it highlights the potential risk exposure if controls were to fail completely or not be in place at all. Both impact and likelihood are scored on a rating of 1 to 5 using the criteria shown on the right:

43COMBI NE D M A N AGE ME N T R E P O R T » r I S K r e p or T
Impact Assessment
INS IGNIF IC ANT MINOR MODERATE MAJOR C ATASTROPHIC
QUANTITATIVE < 3 % EBITA* (< € 35 m)
3 – < 5 % EBITA*
( 35 – < € 60 m)5 – < 10 % EBITA*
(60 – < € 120 m)10 – < 15 % EBITA*
(120 – < € 180 m)≥ 15 % EBITA*
( ≥ € 180 m)
QUALITATIVE Minimal impact on Limited impact on Short term impact on Medium term impact on Detrimental impact on
• Global reputation• Programme delivery• Technology reliability• Health & Safety
standards
• Global reputation• Programme delivery• Technology reliability• Health & Safety
standards
• Global reputation• Programme delivery• Technology reliability• Health & Safety
standards
• Global reputation• Programme delivery• Technology reliability• Health & Safety
standards
• Global reputation• Programme delivery• Technology reliability• Health & Safety
standards
* Budgeted underlying EBITA for the financial year ended 30 September 2018
Likelihood Assessment
RARE
< 10 % ChanceUNLIKELY
10 – < 30 % ChancePOSSIBLE
30 – < 60 % ChanceL IKELY
60 – < 80 % ChanceALMOST CERTAIN
≥ 80 % Chance
The next step in the risk reporting process is to assess and document the controls that are currently in place to reduce the likelihood of the risk materializing and / or its impact if it does. Consideration of these then enables the current (or residual) risk score to be assessed, which is essentially the reasonably foreseeable scenario. This measures the impact and likelihood of the risk with the implemented controls in operation. The key benefit of assessing the current risk score is that it provides an understanding of the current level of risk faced today and the reliance on the controls currently in place.
Risk Response: If management are comfortable with the current risk score, the risk is accepted and no further action is required to further reduce the risk. The controls in place continue to be operated and management monitor the risk, the controls and the risk land-scape to ensure that they stay in line with management’s tolerance of the risk.
If management assesses that the current risk score is too high, an action plan will be drawn up with the objective of introducing new or stronger controls that will further reduce the impact and / or likelihood of the risk to an acceptable, tolerable and justifiable level. This is known as the target risk score and is the parameter by which management can ensure the risk is being managed in line
with their overall risk appetite. The risk owner will normally be the individual tasked with ensuring that this action plan is implemented within an agreed timetable.
Each business and function will continue to review their risk register on an ongoing basis through the mechanism appropriate for their business e. g. local Risk Committee.
This bottom-up risk reporting is considered by the ROC alongside the Group’s principal risks. New risks are added to the Group’s principal risk register if deemed to be of a significant nature so that the ongoing status and the progression of key action plans can be managed in line with the Group’s targets and expectations.
A D H O C R I S K R E P O R T I N G
Whilst there is a formal process in place for reporting on risks on a quarterly basis, the process of risk identification, assessment and response is continuous and therefore if required, risks can be reported to the Executive Board outside of the quarterly process, should events dictate that this is necessary and appropriate. Ideally such ad hoc reporting is performed by the business or function which is closest to the risk, but it can be performed by the Group Risk department if necessary.
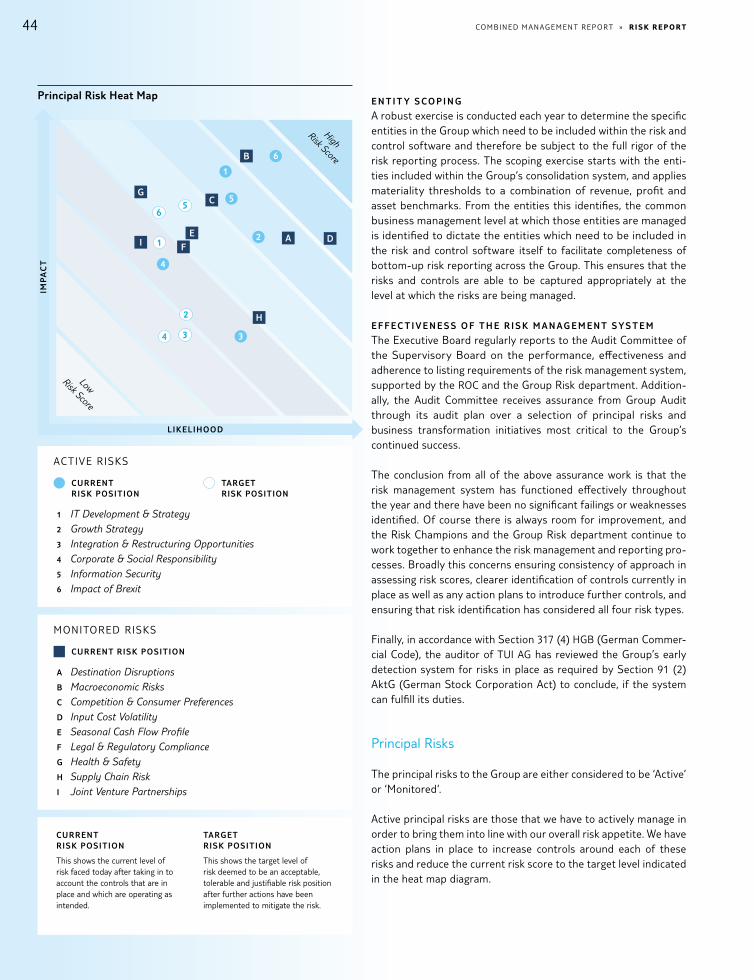
44 COMBI NE D M A N AGE ME N T R E P O R T » r I S K r e p or T
E N T I T Y S CO P I N G
A robust exercise is conducted each year to determine the specific entities in the Group which need to be included within the risk and control software and therefore be subject to the full rigor of the risk reporting process. The scoping exercise starts with the enti-ties included within the Group’s consolidation system, and applies materiality thresholds to a combination of revenue, profit and asset benchmarks. From the entities this identifies, the common business management level at which those entities are managed is identified to dictate the entities which need to be included in the risk and control software itself to facilitate completeness of bottom-up risk reporting across the Group. This ensures that the risks and controls are able to be captured appropriately at the level at which the risks are being managed.
E F F E C T I V E N E S S O F T H E R I S K M A N AG E M E N T S Y S T E M
The Executive Board regularly reports to the Audit Committee of the Supervisory Board on the performance, effectiveness and adherence to listing requirements of the risk management system, supported by the ROC and the Group Risk department. Addition-ally, the Audit Committee receives assurance from Group Audit through its audit plan over a selection of principal risks and business transformation initiatives most critical to the Group’s continued success.
The conclusion from all of the above assurance work is that the risk management system has functioned effectively throughout the year and there have been no significant failings or weaknesses identified. Of course there is always room for improvement, and the Risk Champions and the Group Risk department continue to work together to enhance the risk management and reporting pro-cesses. Broadly this concerns ensuring consistency of approach in assessing risk scores, clearer identification of controls currently in place as well as any action plans to introduce further controls, and ensuring that risk identification has considered all four risk types.
Finally, in accordance with Section 317 (4) HGB (German Commer-cial Code), the auditor of TUI AG has reviewed the Group’s early detection system for risks in place as required by Section 91 (2) AktG (German Stock Corporation Act) to conclude, if the system can fulfill its duties.
Principal Risks
The principal risks to the Group are either considered to be ‘Active’ or ‘Monitored’.
Active principal risks are those that we have to actively manage in order to bring them into line with our overall risk appetite. We have action plans in place to increase controls around each of these risks and reduce the current risk score to the target level indicated in the heat map diagram.
1 IT Development & Strategy2 Growth Strategy3 Integration & Restructuring Opportunities4 Corporate & Social Responsibility5 Information Security6 Impact of Brexit
ACTIVE RISKS
CURRENT RISK POSITION
A Destination DisruptionsB Macroeconomic RisksC Competition & Consumer PreferencesD Input Cost VolatilityE Seasonal Cash Flow ProfileF Legal & Regulatory ComplianceG Health & SafetyH Supply Chain RiskI Joint Venture Partnerships
MONITORED RISKS
Principal Risk Heat Map
CURRENT RISK POSITION
This shows the current level of risk faced today after taking in to account the controls that are in place and which are operating as intended.
TARGET RISK POSITION
This shows the target level of risk deemed to be an acceptable, tolerable and justifiable risk pos ition after further actions have been implemented to mitigate the risk.
1
3
2
6
5
4
1
2
4
56
3
High Risk Score
Low Risk Score
A
B
C
DE
F
G
H
I
IMP
AC
T
L IKELIHOOD
CURRENT RISK POSITION
TARGET RISK POSITION
45COMBI NE D M A N AGE ME N T R E P O R T » r I S K r e p or T
Mitigating FactorsNature of Risk
Active Principal Risks
1 . I T D E V E LO P M E N T & S T R AT E GY
Our focus is on enhancing customer experience by providing engaging, intuitive, seamless and continuous customer service through delivery of leading digital solutions, core platform capabil-ities, underlying technical infrastructure and IT services required to support the Group’s overall strategy for driving profitable top-line growth.
If we are ineffective in our IT strategy or technology development this could impact on our ability to provide leading technology solu-tions in our markets and therefore impacting on our competitive-ness, our ability to provide a superior customer experience and associated impact on quality and operational efficiency. This would ultimately impact on our customer numbers, revenue and prof-itability.
• Developed and communicated (in conjunction with Executives, Business & IT Leadership Teams) the Group’s IT Strategy which is clearly aligned to our overall business objectives and considers external factors such as the pace of technology change and inter-nal factors such as the underlying quality required throughout IT.
• Continuing to implement our online platform in order to enhance customer experience and drive higher conversion rates.
• Implementing a SAP-based central customer platform to collate all information on our customers across their journey to provide a single view of the customer alongside an eCRM platform which will support strategic marketing.
• Placing increased focus on ensuring continuity plans for critical IT systems are in place and regularly tested.
• Cascaded clear technology standards and associated delivery roadmaps which are linked to Group wide and individual market objectives.
• Adopting API, Big Data and Cloud architecture to drive improved speed, productivity and efficiency.
Monitored principal risks are generally inherent to the tourism sector faced by all businesses in the industry. For these, we have controls, processes and procedures in place as a matter of course that serve to mitigate each risk to either minimize the likelihood of the event occurring and / or minimize the impact if it does occur. These risks remain on our risk radar where we regularly monitor the risk, the controls and the risk landscape to ensure that the risk score stays stable and in line with our risk appetite in each case.
In the heat map diagram, the assessment criteria used are shown on page 43. Note that the quantitative impact assessment is based on the budgeted underlying EBITA for the financial year ended 30 September 2018.
FY 2018 Principal Risks
With the UK government formally triggering Article 50 of the Treaty on European Union of Lisbon on 29th March 2017, Brexit continues to remain an active principal risk. Brexit has an impact both on existing principal risks (e. g. Macroeconomic and Input Cost Volatility, particularly for the UK market through the uncertainty it has intro-duced to prospects for future growth rates in the UK economy and the depreciation of sterling since the referendum result in 2016) as well as its own class of principal risk due to the direct potential impact it could have on specific areas of our business model.
The main concern related to Brexit continues to be whether our airlines will continue to have access to EU airspace. We will contin-ue to address the importance of there being a special agreement
for aviation to protect consumer choice with the relevant UK and EU ministers and officials, and are in regular exchange with rele-vant regulatory authorities. We are currently developing scenarios and mitigating strategies for various outcomes, including a ‘hard Brexit’, depending on the political negotiations, with a focus to alleviate any potential impacts from Brexit for the Group. Our Brexit Steering Committee continues to monitor external developments and coordinates measures to be taken ahead of March 2019, when the UK will be formally exiting the European Union. Beyond weekly meetings an the level of different internal Brexit work-streams, the topic is also regularly (bi-weekly / monthly) discussed in the TUI Group Executive Committee (GEC), and the Supervisory Board has been updated quarterly in 2018.
With the EU GDPR regulation being enforced in May 2018, whereby any data breaches may result in a significant financial penalty, the gross score of the Information Security principal risk has increased. Our mitigation strategy including making information security part of everyone’s job continues to focus on managing the likelihood of this risk materializing.
As the brand change program has been successfully implemented in all markets, the related risk is no longer considered principal to the Group.
If the risk detail in the subsequent tables does not suggest other-wise, the risks shown below relate to all segments of the Group. The risks listed are the principal risks to which we are exposed but are not exhaustive and will evolve over time due to the dynamic nature of our business.

46 COMBI NE D M A N AGE ME N T R E P O R T » r I S K r e p or T
Nature of Risk Mitigating Factors
Our key strategic rationale for the Group is to act ’as one’ wherever it makes sense to do so particularly through our Group Platforms, whilst maintaining local differences where the benefit of that differentiation is greater than that of harmonisation.
There are a number of restructuring projects underway across the Group as a result to enable us to achieve these opportunities. Fur-thermore our continuous review of our own businesses and com-petitors means that we have an active programme of acquisitions (e. g. the destination management companies from Hotelbeds this year) and previously business disposals (e. g. Travelopia in FY 2017) with associated integration projects.
There is an inherent risk with any large restructuring or integration programme that we face challenges in managing the complexities associated with further integrating our business, and reducing overlapping activities in order to develop a more lean and stream-lined operating model.
If we are not successful in leveraging and optimizing the identified opportunities this could have a significant impact on our ability to deliver the identified benefits in line with expectations and enhance shareholder value.
3 . I N T E G R AT I O N & R E ST R U C T U R I N G O P P O R T U N I T I E S
• Strong project management structures exist for all of the major restructuring, acquisition and disposal programs, which are underway to ensure that they are managed effectively.
• Project reporting tool ensures enhanced visibility of the pro-gress of major projects as a matter of routine.
• Regular reporting by the major projects to the Executive Board to ensure swift resolution of any issues or to enhance coordina-tion across the Group where required.
2 . G R O W T H ST R AT E GY
We have set ourselves a target of achieving at least 10 % growth in underlying EBITA CAGR (see page 57). This will be driven by growth in our hotel and cruises content, the destination experiences sector as well as top line and efficiency improvements.
Additionally our in-house aviation allows us to introduce extra flexibility into our packages and to utilise our flight capacity in con-junction with own hotel capacity to build high profile destinations.
Asset utilisation of aircraft, cruise ships and hotels is critical to our financial success particularly when in a growth phase.
There is a risk that we could be unsuccessful in maximising oppor-tunities to execute our expansion strategy. This could mean that we fail to achieve some of the initiatives we have embarked upon, which could result in us falling short against the overall growth targets we have set for the business.
• The Executive Board is very focussed on the strategy and mindful of the risks, so there is strong direction and commitment from the top. The remuneration scheme in place for the Executive Board is designed to create incentives for the Group’s sustained growth and robust financial performance (see from page 128).
• The Group Tourism Board plays an important role in coordinating, executing and monitoring the various growth initiatives.
• There are a number of initiatives underway to achieve growth which reduces the risk through diversification.
• Each of the businesses tasked with achieving an element of the growth strategy are still required to maintain sound financial discipline. The Group’s investment criteria and authorisation processes must still be adhered to as we are not prepared to be reckless in the pursuit of growth.
• We continue to maintain strong relationships with the providers of aircraft finance.
• Monitoring the overall market conditions continues to occur so that plans can be adapted or contingency plans invoked if required.
• Using Blockchain technology to manage hotel bed allocation in all markets to be ahead of the competition.
47COMBI NE D M A N AGE ME N T R E P O R T » r I S K r e p or T
Nature of Risk Mitigating Factors
For the Group, economic, environmental and social sustainability is a fundamental management principle and a cornerstone of our strategy for continually enhancing the value of our Company. This is the way we create the conditions for long-term economic success and assume responsibility for sustainable development in the tourism sector.
Our focus is to reduce the environmental impact of our holidays and promote responsible social policies and outcomes both directly through our own business and indirectly via our influence over our supply chain partners, thereby creating positive change for people and communities and being a pioneer of sustainable tourism across the world.
There is a risk that we are not successful in driving forecast social and environmental improvements across our operations, that our suppliers do not uphold our corporate and social responsibility standards and we fail to influence destinations to manage tourism more sustainably.
If we do not maximize our positive impact on destinations and minimize the negative impact to the extent that our stakeholders expect, this could result in a decline in stakeholder confidence, reputational damage, reduction in demand for our products and services and loss of competitive advantage.
Furthermore, if the Group falls short of achieving its sustainable development targets and at the same time the objectives of the UN Paris Climate Change Agreement (December 2015) are not met, this could lead to sustained long-term damage to some of the Group’s current and future destinations, which could also have a material adverse effect on demand for our products and services.
4 . CO R P O R AT E & S O C I A L R E S P O N S I B I L I T Y
• Developed and launched in 2015 the ’Better Holidays, Better World’ 2020 sustainability strategy framework which includes specific targets for key sustainability indicators.
• Established a dedicated sustainability department to work closely with the business and other stakeholders to implement the sustainability strategy.
• Operating one of the most carbon efficient airlines in Europe with continued investment in new, more efficient aircraft (e. g. Boeing 787 Dreamliner & 737 Max) and cruise ships (e. g. the new Mein Schiff 1 & 2).
• Implemented an environmental management system with five of our airlines having achieved ISO 14001 certification.
• Increased measures to influence accommodation suppliers to achieve third party sustainability certification recognized by the Global Sustainable Tourism Council (GSTC).
• TUI Care Foundation expanded to focus on the achievement of 2020 target for charitable donations and sustainability projects, with particular emphasis empowering young people, protecting the natural environment and maximizing the economic benefits of tourism in destinations.

48 COMBI NE D M A N AGE ME N T R E P O R T » r I S K r e p or T
Nature of Risk Mitigating Factors
Our responsibility is to protect the confidentiality, integrity and availability of the data we have to provide to our customers, employees, suppliers and service delivery teams.
This is a dynamic risk due to increased global cyber-crime activity and new regulations (e. g. EU GDPR). At the same time our consol-idation under the TUI brand and our increasing dependence on online sales and customer care channels (web / mobile) increases our exposure and susceptibility to cyber-attacks and hacks.
If we do not ensure we have the appropriate level of security controls in place across the Group, this could have a significant negative impact on our key stakeholders, associated reputational damage and potential for financial implications.
5 . I N F O R M AT I O N S E C U R I T Y
• Continued commitment from the Executive Board in support of key initiatives to ensure all existing and future IT systems are secure by design, that exposure to vulnerability is managed effectively, user access is sufficiently controlled and colleagues are made aware of information security risks through appropri-ate training.
• Launch of a company-wide Information Security awareness campaign to promote secure behaviors amongst our colleagues. Overall goal is to make information security part of everyone’s job.
• Continuous review and testing of all external devices and ongoing monitoring of logs in order to identify any potential threats as and when they arise.
• Continuous improvement through lessons learned from real or simulated cyber incidents.
Our main concern is whether or not all of our airlines will continue to have access to EU airspace as now. If we were unable to continue to fly intra-EU routes, such as from Germany to Spain, this would have a significant operational and financial impact on the Group.
Other areas of uncertainty include the status of our UK employees working in the EU and vice versa and the potential for customer visa requirements for holidays from the UK to the EU.
6 . B R E X I T
• The Executive Board has established a Brexit Steering Committee to monitor developments as the political negotiations take place, assess any impacts on the Group’s business model and coordinate suitable mitigation strategies to be taken ahead of March 2019, when the UK will be formally exiting the European Union.
• In addition we continue to lobby relevant UK and EU ministers, officials and regulators to stress the continued importance of a liberalized and deregulated aviation market across Europe to protect consumer choice in both regions.

49COMBI NE D M A N AGE ME N T R E P O R T » r I S K r e p or T
Nature of Risk Mitigating Factors
Providers of holiday and travel services are exposed to the inher-ent risk of incidents affecting some countries or destinations within their operations. This can include natural catastrophes such as hurricanes or tsunamis; outbreaks of disease such as Ebola; political volatility as has been seen in Egypt and Greece in recent years; the implications of war in countries close to our markets and destinations; and terrorist events such as the tragic incident in Tunisia in 2015.
There is the risk that if such an event occurs, impacting one or more of our destinations that we could potentially suffer signifi-cant operational disruption and costs in our businesses. We may possibly be required to repatriate our customers and / or the event could lead to a significant decline in demand for holidays to the affected destinations over an extended period of time.
Monitored Principal Risks
A . D E ST I N AT I O N D I S R U P T I O N
• Whilst we are unable to prevent such events from occurring, we have well defined crisis management procedures and emergency response plans, which are implemented when an event of this nature occurs, with the focus being on the welfare of our cus-tomers.
• Where the appropriate course of action is to bring customers home immediately, our significant fleet of aircraft allows us to do this smoothly and efficiently.
• Our policy is to follow foreign office advice in each of our markets with regards to non-essential travel. This serves to minimize the exposure of our customers to turbulent regions.
• Due to our presence in all key holiday regions, when a specific destination has been impacted by an external event, we are able to offer alternative destinations to our customers and to remix our destination portfolio away from the affected area in future seasons if necessary.
• We always assume some level of destination disruption each year when setting financial plans and targets, so that we are able to cope with a ‘normal’ level of disruption without it jeop-ardizing achievement of our targets.
Spending on travel and tourism is discretionary and price sensitive. The economic outlook remains uncertain with different markets at different points in the economic cycle. Furthermore, terrorist inci-dents in markets can influence the overall demand for overseas travel. Customers are also waiting longer to book their trips in order to assess their financial situation.
There is the risk that fluctuations in macroeconomic conditions in our markets will impact on the spending power of our customers, which could impact our short-term growth rates and lead to margin erosion.
B . M A C R O E CO N O M I C
• Many customers prioritize their spending on holidays above other discretionary items.
• Creating unique and differentiated holiday products which match the needs of our customers.
• Leveraging our scale to keep costs down and prices competitive.• Having a range of markets so that we are not over exposed to
one particular economic cycle.• Promoting the benefits of travelling with a recognized and leading
tour operator to increase customer confidence and peace of mind.

50 COMBI NE D M A N AGE ME N T R E P O R T » r I S K r e p or T
Nature of Risk Mitigating Factors
The tourism industry is fast-paced and competitive with the emer-gence of new market participants operating new business models, combined with customer tastes and preferences evolving all the time.
In recent years there has been an emergence of successful substi-tute business models such as web-based travel and hotel portals which allow end users to combine the individual elements of a holiday trip on their own and book them separately.
Customer tastes and preferences have evolved in recent years as well, with more booking their holidays online and via mobiles and tablets, and booking closer to the time of travel.
There is the risk that if we do not respond adequately to such business model disruption or if our products and services fail to meet changing customer demands and preferences, that our turn-over, market share and profitability will suffer as a result.
C . CO M P E T I T I O N & C U STO M E R P R E F E R E N C E S
• Our outstanding market position as a leading tourism group, the strength of our brand and our integrated business model enables us to respond robustly to competitive threats.
• The Group is characterized by the continuous development of unique and exclusive holiday experiences, developing new concepts and services which match the needs and preferences of our customers.
• Our integrated business model offers end-to-end customer services, from consultation and booking of holidays via flights with the Group’s own airlines through to Group-owned or oper-ated hotels, resorts and cruise ships. Integration thus facilitates the development and marketing of individual, tailored holiday offerings for customers which is difficult for competitors to replicate.
• Building strong and lasting relationships with our key hotel partners, which further reinforces our ability to develop new concepts exclusive to the Group.
• Focusing on being online throughout the whole of the customer journey – from inspiration, to booking, to the holiday itself, as well as returning and sharing experiences through social media.
A significant proportion of operating expenses are in non-local currency and / or relate to aircraft fuel which therefore exposes the business to fluctuations in both exchange rates and fuel prices.
There is the risk that if we do not manage adequately the volatility of exchange rates, fuel prices and other input costs, then this could result in increased costs and lead to margin erosion, impacting on our ability to achieve profit targets.
There is also the risk that if our hedging policy is too rigid, we may find ourselves unable to respond to competitive pricing pressures during the season without it having a direct detrimental impact on our market position and / or profitability.
Furthermore, changes in macroeconomic conditions can have an impact on exchange rates which, particularly for the £ / € rate and this year for the TRY / € rate, has a direct impact on the translation of non-euro market results into euros, the reporting currency of our Group.
D. I N P U T CO ST V O L AT I L I T Y
• Ensuring that the appropriate derivative financial instruments are used to provide hedging cover for the underlying transactions involving fuel and foreign currency.
• Maintaining an appropriate hedging policy to ensure that this hedging cover is taken out ahead of the markets’ customer booking profiles. This provides a degree of certainty over input costs when planning pricing and capacity, whilst also allowing some flexibility in prices so as to be able to respond to compet-itive pressures if necessary.
• Tracking the foreign exchange and fuel markets to ensure the most up-to-date market intelligence and the ongoing appropri-ateness of our hedging policies.
• Expressing our key profit growth target in constant currency terms so that short term performance can be assessed without the distortion caused by exchange rate fluctuations.
Further information on currency and fuel hedges can be found in the
Notes to the consolidated financial statements in the financial instru-
ments section.
51COMBI NE D M A N AGE ME N T R E P O R T » r I S K r e p or T
Nature of Risk Mitigating Factors
Tourism is an inherently seasonal business with the majority of profits earned in the European summer months. Cash flows are similarly seasonal with the cash high occurring in the summer as advance payments and final balances are received from customers, with the cash low occurring in the winter as liabilities have to be settled with many suppliers after the end of the summer season.
There is the risk that if we do not adequately manage cash bal-ances through the winter low period this could impact on the Group’s liquidity and ability to settle liabilities as they fall due whilst ensuring that financial covenants are maintained.
E . S E A S O N A L C A S H F LO W P R O F I L E
• Our focus on holiday experiences is helping to reduce the seasonality risk, as hotels, cruises and destination experiences have a more evenly distributed profit and cash profile across the year. This is highlighted by the fact that the Group made an underlying operating profit for the second successive year over the nine months to 30 June.
• As our business is spread across a number of markets, there are some counter-cyclical features e. g. winter is a more important season for the Nordic and Canadian markets. Some brands, such as the UK ski brand Crystal Ski, have a different seasonality profile which helps to counter-balance the overall profile.
• The business regularly produces both short term and long term cash forecasts during the year, which the Treasury department use to manage cash resources effectively.
• We have implemented a financial policy which has led to an im-provement in our credit rating and makes it easier to maintain financing facilities at suitable levels.
• Existing financing facilities are considered to be more than sufficient for our requirements and provide ample headroom.
• We continue to maintain high-quality relationships with the Group’s key financiers and monitor compliance with the cove-nants contained within our financing facilities.
• Raising additional finance from the Capital Markets, should it be required, remains an option.
F. L E G A L & R E G U L ATO RY CO M P L I A N C E
Most providers of holiday and travel services operate across a number of economies and jurisdictions, which therefore exposes them to a range of legal, tax and other regulatory laws which must be complied with.
As we are operating from multiple source markets and providing holidays in more than 115 destinations, we are exposed to a range of laws and regulations with which we must comply or else risk incurring fines or other sanctions from regulatory bodies.
• Communication and strong tone from the top concerning com-pliance with laws and regulations.
• Legal Compliance Committee established to ensure appropriate oversight, monitoring and action plans and to further drive the compliance culture across the Group.
• Embedded legal and tax expertise in all major businesses responsible for maintaining high quality relationships with the relevant regulators and authorities.
• Ongoing implementation and review of Compliance Manage-ment System conducted by the Group Legal Compliance de-partment to monitor compliance with regulations and provide expert advice to local teams on specific compliance areas.
52 COMBI NE D M A N AGE ME N T R E P O R T » r I S K r e p or T
Nature of Risk Mitigating Factors
G . H E A LT H & S A F E T Y
For all providers of holiday and travel services, ensuring the health and safety of customers is of paramount importance. This is especially so for us as we are one of world’s leading tourism group selling holidays to over 27 m customers per annum.
There is the risk of accidents or incidents occurring causing illness, injury or death to customers or colleagues whilst on a TUI holiday. This could result in reputational damage to the business and / or financial liabilities through legal action being taken by the affected parties.
• Health and safety functions are established in all businesses in order to ensure there is appropriate focus on health and safety processes as part of the normal course of business.
• Ongoing monitoring is conducted by the Group Security, Health & Safety function to ensure compliance with minimum standards.
• Appropriate insurance policies are in place for when incidents do occur.
H . S U P P L I E R R E L I A N C E
Providers of holiday and travel services are exposed to the inher-ent risk of failure in their key suppliers, particularly hotels. This is further heightened by the industry convention of paying in advance (‘prepayments’) to secure a level of room allocation for the season.
There is the risk that we do not adequately manage our financial exposure should demand drop either for individual hotels and / or for the destination in which the hotels are located and to which the Group still has a level of prepayment outstanding which could result in financial losses.
• Owned and joint venture partner hotels form a substantial part of our program which reduces our inherent risk in this area.
• A robust prepayment authorisation process is established and embedded to both limit the level of prepayments made and ensure that they are only paid to trusted, credit-worthy counterparties.
• Where prepayments are made to external hoteliers, this is to secure access to unique and differentiated product for which demand is inherently higher and more resilient to external events than for commodity product.
• Prepayments are monitored on a timely and sufficiently granular basis to manage our financial exposure to justifiable levels.
I . J O I N T V E N T U R E PA R T N E R S H I P S
It is common for tourism groups to use joint venture partnerships in some of their operations in order to reduce the risk of new ventures or to gain access to additional expertise. There are three significant joint ventures within the Group – Riu, TUI Cruises and Sunwing.
There is the risk that if we do not maintain good relations with our key partners that the ventures’ objectives may not remain consistent with that of the Group which could lead to operational difficulties and jeopardize the achievement of financial targets.
• Good working relationships exist with all of our main joint venture partners and they are fully aligned with and committed to the growth strategy of the Group.
53COMBI NE D M A N AGE ME N T R E P O R T » r I S K r e p or T
Viability Statement
In accordance with provision C2.2 of the 2016 revision of the UK Corporate Governance Code, the Executive Board has assessed the prospect of the Company over a longer period than the twelve months required by the ’Going Concern’ provision. The Executive Board considers annually and on a rolling-basis a three year strategic plan for the business, the latest was approved in Octo-ber 2018 and covers the period to 30 September 2021. A three year horizon is considered appropriate for a fast-moving competi-tive environment such as tourism.
It is also noted that the Group’s current € 1,535.0 m revolving credit limit, which expires in July 2022, is used to manage the seasonality of the Group’s cash flows and is reviewed on a timely basis. The three year plan considers cash flows as well as the financial covenants which the credit facility requires compliance with.
Key assumptions underpinning the three year plan and the associ-ated cash flow forecast is that aircraft and cruise ship finance will continue to be readily available, and that the terms of the UK leaving the EU are such that all of our airlines continue to have access to EU airspace as now.
The Executive Board has conducted a robust assessment of the principal risks facing the company, including those that would threaten its business model, future performance, solvency or liquidity. Sensitivity analysis is applied to the cash flow to model the potential effects should certain principal risks actually occur, individually or in unison. This includes modelling the effects on the cash flow of significant disruption to a major destination in the summer season.
Taking account of the company’s current position, principal risks and the aforementioned sensitivity analysis, the Executive Board has a reasonable expectation that the company will be able to continue in operation and meet its liabilities as they fall due over the three year period of the assessment.
Key features of the internal control and risk management system in relation to the (Group) accounting process (sections 289 (4) and 315 (2) no 5 of the German Commercial Code HGB)
1 . D E F I N I T I O N A N D E L E M E N T S O F T H E I N T E R N A L
CO N T R O L A N D R I S K M A N AG E M E N T S Y S T E M I N
T H E T U I G R O U P
The TUI Group’s internal control system comprises all the principles, processes and measures that are applied to secure effective, efficient and accurate accounting which is compliant with the necessary legal requirements.
The internationally recognised framework of COSO (Committee of Sponsoring Organizations of the Treadway Commission) forms the conceptual basis for TUI Group’s internal control system, consisting of internal controls and the internal monitoring system. The Exec-utive Board of TUI AG, in exercising its function of managing business operations, has entrusted responsibility for the internal control system in the TUI Group to specific Group functions.
The elements of the internal monitoring system in the TUI Group comprise both measures integrated into processes and measures performed independently. Besides manual process controls, e. g. the ‘four-eyes principle’, another key element of the process-related measures are automated IT process controls. Process-related monitoring is also secured by bodies such as the Risk Oversight Committee of TUI AG and by specific Group functions.
The Supervisory Board of TUI AG, in particular its Audit Committee, as well as the Group Auditing department at TUI AG are incorpo-rated into the TUI Group’s internal monitoring system through their audit activities performed independently from business processes. On the basis of section 107 (3) of the German Stock Corporation Act, the Audit Committee of TUI AG deals primarily with the auditing of the annual financial statements, monitoring the accounting process and the effectiveness of the internal control and risk management system. In the Audit Committee Report the reliability of the financial reporting and the monitoring of the financial accounting process as well as the effectiveness of the internal control and risk management system are described.
Audit Committee Report see from page 22
The Group’s auditors have oversight of the TUI Group’s control environment. The audit of the consolidated financial statements by the Group auditor and the audit of the individual financial statements of Group companies included in the consolidated financial statements, in particular, constitute a key non-process- related monitoring measure with regard to Group accounting.
In relation to Group accounting, the risk management system, in-troduced as an Enterprise Risk Management System (ERM System) as a component of the internal control system, also addresses the risk of misstatements in Group bookkeeping and external reporting. Apart from operational risk management, which includes the transfer of risks to insurance companies by creating cover for damage and liability risks and also hedging transactions to limit foreign currency and fuel price risks, the TUI Group’s risk manage-ment system embraces the systematic early detection, manage-ment and monitoring of risks across the Group. A more detailed explanation of the risk management system is provided in the section on the Risk Governance Framework in the Risk Report.

54 COMBI NE D M A N AGE ME N T R E P O R T » r I S K r e p or T
2 . U S E O F I T S Y S T E M S
Bookkeeping transactions are captured in the individual financial statements of TUI AG and of the subsidiaries of TUI AG, through local accounting systems such as SAP or Oracle. As part of the process of preparing their individual financial statements, subsidi-aries complete standardized reporting packages in the Group’s Oracle Hyperion Financial Management 11.1.2.4 (HFM) reporting system. HFM is used as the uniform reporting and consolidation system throughout the Group so that no additional interfaces exist for the preparation of the consolidated financial statements.
Nearly all consolidation processes used to prepare the consolidated financial statements of TUI AG, e. g. capital consolidation, assets and liabilities consolidation and expenses and income elimination including at equity measurement, are generated and fully docu-mented in HFM. All elements of TUI AG’s consolidated financial statements, including the disclosures in the Notes, are developed from the HFM consolidation system. HFM also provides various modules for evaluation purposes in order to prepare complementary information to explain TUI AG’s consolidated financial statements.
The HFM reporting and consolidation system has an in-built work-flow process whereby when businesses promote their data within the system, to signal that their reporting package is complete, they are then locked out from making any further changes to that data. This ensures data integrity within the system and also facilitates a strong audit trail enabling changes to a reporting package to be identified. This feature of the HFM system has been checked and validated by the TUI AG Group Audit department on several occa-sions since the system was introduced.
At their own discretion, TUI AG’s Group auditors select certain individual financial statements from the financial statements entered in the HFM reporting and consolidation system by the Group companies, which are then reviewed for the purposes of auditing the consolidated financial statements.
3 . S P E C I F I C R I S K S R E L AT E D TO G R O U P ACCO U N T I N G
Specific risks related to Group accounting may arise, for example, from unusual or complex business transactions, in particular at critical times towards the end of the financial year. Business trans-actions not routinely processed also entail special risks. The dis-cretion necessarily granted to employees for the recognition and measurement of assets and liabilities may result in further Group accounting-related risks. The outsourcing and transfer of accounting- specific tasks to service companies may also give rise to specific risks. Accounting-related risks from derivative financial instruments are outlined in the Notes to the consolidated financial statements.
4 . K E Y R E G U L AT I O N A N D CO N T R O L AC T I V I T I E S TO
E N S U R E P R O P E R A N D R E L I A B L E (G R O U P ) ACCO U N T I N G
The internal control measures aimed at securing proper and reliable Group accounting ensure that business transactions are fully recorded in a timely manner in accordance with legal requirements and the Articles of Association. This also ensures that assets and liabilities are properly recognised, measured and presented in the financial statements and the consolidated financial statements. The control operations also ensure that bookkeeping records provide reliable and comprehensive information.
Controls implemented to secure proper and reliable accounting include, for instance, analysis of facts and developments on the basis of specific indicators. Separation of administrative, execution, settlement and authorisation functions and the implementation of these functions by different persons reduces the potential for fraudulent operations. Organisational measures also aim to capture any corporate or Groupwide restructuring or changes in sector business operations rapidly and appropriately in Group accounting. They also ensure, for instance, that bookkeeping transactions are correctly recognised in the period in which they occur in the event of changes in the IT systems used by the accounting departments of Group companies. The internal control system likewise ensures that changes in the TUI Group’s economic or legal environment are mapped and that new or amended accounting standards are correctly applied.
The TUI Group’s accounting policies together with the International Financial Reporting Standards (IFRS) in compliance with EU legislation, govern the uniform accounting and measurement principles for the German and foreign companies included in TUI’s consolidated financial statements. They include general accounting principles and methods, policies concerning the statement of financial position, income statement, notes, management report and cash flow statement.
The TUI Group’s accounting policies also govern specific formal requirements for the consolidated financial statements. Besides defining the group of consolidated companies, they include de-tailed guidance on the reporting of financial information by those companies via the group reporting system HFM on a monthly, quarterly and year end basis. TUI’s accounting policies also include, for instance, specific instructions on the initiating, reconciling, accounting for and settlement of transactions between group companies or determination of the fair value of certain assets, especially goodwill.

55COMBI NE D M A N AGE ME N T R E P O R T » r I S K r e p or T
At Group level, specific controls to ensure proper and reliable Group accounting include the analysis and, where necessary, correction of the individual financial statements submitted by the Group companies, taking account of the reports prepared by the auditors and meetings to discuss the financial statements which involve both the auditors and local management. Any further content that requires adjusting can be isolated and processed downstream.
The control mechanisms already established in the HFM consoli-dation system minimize the risk of processing erroneous financial statements. Certain parameters are determined at Group level and have to be applied by Group companies. This includes param-eters applicable to the meas-urement of pension provisions or other provisions and the interest rates to be applied when cash flow models are used to calculate the fair value of certain assets. The central implementation of impairment tests for goodwill recognized in the financial statements secures the application of uniform and standardized evaluation criteria.
5 . D I S C L A I M E R
With the organisational, control and monitoring structures estab-lished by the TUI Group, the internal control and risk management system enables company-specific facts to be captured, processed and recognized in full and properly presented in the Group’s accounts.
However, it lies in the very nature of the matter that discretionary decision-making, faulty checks, criminal acts and other circum-stances, in particular, cannot be ruled out and will restrict the effi-ciency and reliability of the internal control and risk management systems, so that even Group-wide application of the systems cannot guarantee with absolute certainty the accurate, complete and timely recording of facts in the Group’s accounts.
Any statements made relate exclusively to TUI AG and to subsidiaries according to IFRS 10 included in TUI AG’s consolidated financial statements.

56 COMBI NE D M A N AGE ME N T R E P O R T » oV e r A l l A S S e S S Me N T By T He e X e C U T I V e BoA r D A ND r e p or T oN e X pe C T e D De V e lopMe N T S
OVER ALL ASSESSMENT BY THE E XECUTIVE BOARD AND REPORT ON E XPEC TED DE VELOPMENTS
Actual business performance 2018 compared with our forecast
Our business performance in FY 2018 matched our overall expec-tations.
At year-on-year growth of 6.3% on a constant currency basis, TUI Group’s turnover exceeded expectations. We delivered consistently high occupancy rates and yields on a further expansion of our hotel and cruise portfolio. At the same time, the number of customers booking their holiday with us rose in all key source markets this summer, despite the prolonged phase of hot weather in Northern Europe.
In FY 2018 we delivered double-digit growth in our underlying EBITA on a constant currency basis for the fourth consecutive time since the merger. In the financial year under review, TUI Group’s underlying EBITA improved by 4.1 % to € 1,147.0 m. On a constant currency basis for the reporting period and the prior year reference period, this equates to an improvement of 10.9 %. We have thus outperformed the guidance we communicated for FY 2017, which envisaged an increase in our operating result of at least 10 % on a constant currency basis.
The one-off charges adjusted for in our underlying EBITA were slightly higher than expected at €86.8m in the financial year under review. Overall the Group’s EBITA thus improved by 3.3 % to € 1,060.2 m.
TUI Group’s ROIC decreased by 0.57 percentage points to 23.04 % in FY 2017 while our plan assumed a slight increase. With the cost of capital at 6.37 %, this yields positive Economic Value Added of € 829.9 m (previous year € 787.0 m), in line with expectations.
The Group’s net capex and financial investments remained below the target of around € 1.2 bn at € 827.0 m. This was primarily attributable to delays in larger hotel projects.
The net liquidity of € 123.6 m reported as at year-end 2018 devel-oped slightly better than assumed in our most recent guidance, which had still expected a slight net debt. This was mainly due to the Group’s lower net capex and financial investments.
Expected changes in the economic framework
Expected development of world output
Var. % 2019 2018
World + 3.7 + 3.7
Eurozone + 1.9 + 2.0
Germany + 1.9 + 1.9
France + 1.6 + 1.6
UK + 1.5 + 1.4
US + 2.5 + 2.9
Russia + 1.8 + 1.7
Japan + 0.9 + 1.1
China + 6.2 + 6.6
India + 7.4 + 7.3
Source: International Monetary Fund (IMF), World Economic Outlook, October 2018
M AC R O E CO N O M I C S I T UAT I O N
The steady expansion of the world economy continued in calendar year 2018. The International Monetary Fund expects world output to grow by 3.7 % in 2018, flat year-on-year. For 2019, the IMF expects the global economy to again grow by 3.7 % (IMF, World Economic Outlook, October 2018).
M A R K E T T R E N D I N TO U R I S M
UNWTO expects international tourism to continue growing globally during this decade. For the period from 2010 to 2020, average weighted growth of around 3.8 % per annum has been forecast (source: UNWTO, Tourism Highlights, 2018 edition). In the first six months of 2018, international arrivals grew by 6.1 %. UNWTO expects growth of 4 % to 5 % for the full calendar year 2018 (source: UNWTO, World Tourism Barometer, October 2018).

57COMBI NE D M A N AGE ME N T R E P O R T » oV e r A l l A S S e S S Me N T By T He e X e C U T I V e BoA r D A ND r e p or T oN e X pe C T e D De V e lopMe N T S
E F F E C T S O N T U I G R O U P
As one of world’s leading tourism group, TUI Group depends on patterns in consumer demand in the large source markets in which we operate with our hotel, cruise and tour operator brands. Our budget is based on the assumptions used as a basis by the IMF to predict the future development of the global economy.
Apart from trends in consumer sentiment, political stability in the destinations is a further crucial factor affecting demand for holiday products. In our view, our business model is sufficiently flexible to compensate for the currently identifiable challenges.
The expected turnover growth assumed for our source markets in our budget for FY 2019 is in line with UNWTO’s long-term forecast. Our strategic focus is to deliver further efficiency enhancements through the harmonisation of our three regional business segments, which are now operated under the unified TUI brand in all three regions.
Expected development of Group turnover and earnings
T U I G R O U P
The translation of the income statements of foreign subsidiaries in our consolidated financial statements is based on average monthly exchange rates. TUI Group generates a considerable proportion of consolidated turnover and large earnings and cash flow contributions in non-euro currencies, in particular £, $ and SEK. Taking account of the seasonality in tourism, the value of these currencies against the euro in the course of the year therefore strongly impacts the financial indicators carried in TUI AG’s consolidated financial state-
ments. The comments on the expected development of our Group in FY 2019 provided below are based on an assumption of constant currencies for the completed FY 2018.
The key financial performance indicators for our earnings position in FY 2019 are Group turnover and underlying EBITA.
Definition of underlying EBITA see Value-oriented Group management
on page 35
For a meaningful comparison at constant currency between expect-ed earnings and our performance in the completed financial year, the reference figure for underlying EBITA in FY 2018 has been modified. The starting point for the forecast is the rebased under-lying EBITA. This rebased figure was determined by the underlying EBITA of the FY 2018 increased to account for the negative effect of the revaluation of euro-denominated loans in Turkey amounting to € 40 m, translated at actual exchange rates in FY 2018.
Key management variables used for regular value analysis are Return On Invested Capital (ROIC) and Economic Value Added. ROIC is shown against the segment-specific cost of capital.
Future development depends on demand in our source markets and customer segments, input costs and the potential impact of exogenous events beyond our control such as strikes, terror attacks or natural disasters. Whilst these may influence results in the indi-vidual segments, we believe our balanced portfolio of markets and destinations still leaves us well placed to deliver the targets outlined below in FY 2019.
Expected development of Group turnover and underlying EBITA
€ million
2018 FX
effects3
2018
rebased3
20191
Turnover 19,524 19,524 around 3 % growth2
Underlying EBITA 1,147 40 1,187 at least 10 % growth
Adjustments 87 approx. € 125 m costs
1 Variance year-on-year assuming constant foreign exchange rates are applied to the result in the current and prior period and based on the current group structure; guidance relates to continuing operations. For underlying EBITA the expected growth refers to the FY 2018 rebased number.
2 Excluding cost inflation relating to currency movements3 Rebased to take into account € 40 m impact of revaluation of € loan balances in Turkey in FY 2018

58 COMBI NE D M A N AGE ME N T R E P O R T » oV e r A l l A S S e S S Me N T By T He e X e C U T I V e BoA r D A ND r e p or T oN e X pe C T e D De V e lopMe N T S
T U R N OV E R
We expect turnover to grow by around 3 % in FY 2019 on a constant currency basis, excluding cost inflation relating to currency move-ments.
U N D E R LY I N G E B I TA
TUI Group’s underlying EBITA in FY 2019 is expected to grow by at least 10 % versus the rebased prior-year value at constant currency. In order to determine the rebased previous year‘s value, the actual value for the previous year was increased by the effect of the revaluation of euro-denominated loans of Turkish hotel companies.
A DJ U S T M E N T S
In order to deliver further business harmonisation and efficiency in Markets & Airlines, we expect an elevated level of adjustments in FY 2019 of approximately € 125 m.
Details on Goals and Strategies from page 28
Details on Risks in Risk Report from page 40
R O I C A N D E CO N O M I C VA L U E A D D E D
We expect ROIC to reduce slightly in FY 2019. Due to the higher invested capital, Economic Value Added is expected to rise further, depending on the development of TUI Group’s capital costs.
Development in the segments in FY 2019
H O T E L S & R E S O R T S
In the Hotels & Resorts segment, we will continue to expand our portfolio of holiday destinations with a series of planned hotel openings in FY 2019 and beyond. We are thus on track to have opened around 60 additional hotels between the merger and the end of FY 2019. Overall, we expect the segment to deliver growth in underlying EBITA versus the rebased prior-year value at a level below the guidance for the Group of at least 10 % for FY 2019. In order to determine the rebased previous year’s value, the actual value for the previous year was increased by the effect of the re-valuation of euro-denominated loans of Turkish hotel companies.
C R U I S E S
In FY 2019, we will launch three ships for our cruise brands. Bookings for the new ships and the existing fleet continue to perform well. Overall, we therefore expect this segment to deliver growth in underlying EBITA of more than 10 % in FY 2019.
D E S T I N AT I O N E X P E R I E N C E S
With the acquisition of Destination Management and Musement, we have expanded our Destination Experiences segment from
an offline business in 23 countries to a fully digitalised business in 49 countries. We are also developing our customised TUI Tours portfolio. Taking account of the related additional expenses re-quired to expand the digital platforms, we expect this segment to deliver growth in underlying EBITA of more than 10 % in FY 2019.
M A R K E T S & A I R L I N E S
In our Markets & Airlines, we are focusing on the harmonisation of business workflows, in particular for processes, overheads and avi-ation, as well as the delivery of benefits from digitalisation. We expect the challenging market environment to continue. Its impact will primarily be felt in the first half of FY 2019. In FY 2019, we expect the Markets & Airlines to deliver growth in underlying EBITA which is broadly in line with Group guidance.
Expected development of financial position
For the development of the Group’s financial position in FY 2019, we have defined the Group’s net capital expenditure and investments and its leverage ratio as key performance indicators.
Expected development of Group financial position
Expected development vs. PY
FY 2018 FY 2019
Net capex and investments 827.0
around
€ 1.0 – 1.2 bn
Leverage Ratio 2.7 3.00(x) – 2.25(x)
N E T C A P E X A N D I N V E S T M E N T S
In the light of investment decisions already taken and projects in the pipeline, we expect TUI Group’s net capex and financial investments to total around € 1.0 − 1.2 bn in FY 2019. This includes expected down payments on aircraft orders (excluding aircraft assets financed by debt or finance leases) and proceeds from the sale of fixed assets. Capex mainly relates to the launch of new production and booking systems for our markets, maintenance and expansion of our hotel portfolio and the acquisition of two cruise ships.
L E V E R AG E R AT I O
For FY 2019, we are aiming to deliver a leverage ratio of 3.00(x) to 2.25(x).

59COMBI NE D M A N AGE ME N T R E P O R T » oV e r A l l A S S e S S Me N T By T He e X e C U T I V e BoA r D A ND r e p or T oN e X pe C T e D De V e lopMe N T S
Sustainable development
C L I M AT E P R O T E C T I O N A N D E M I S S I O N S
We have identified specific CO2 emissions (in g CO2 / PKM) of our aircraft fleet as a key non-financial performance indicator. These emissions are to be reduced by 10 % by 2020. We also aim to reduce the carbon intensity of our global operations by 10 % by 2020 (against the baseline of 2014).
Overall Executive Board assessment of TUI Group’s current situation and expected development
At the date of preparation of the Management Report (11 Decem-ber 2018), we uphold our positive assessment of TUI Group’s economic situation and guidance for FY 2019. With its finance profile, strong brand and services portfolio, TUI Group is well positioned in the market. In the first few weeks of the new FY 2019, overall business performance was slightly below previous year’s level and has matched expectations.
TUI Group’s underlying EBITA is to grow by at least 10 % in FY 2019 on a constant currency basis compared with the rebased prior-year level. In order to determine the rebased previous year‘s value, the actual value for the previous year was increased by the effect of the revaluation of euro-denominated loans of Turkish hotel companies.
Based on our growth strategy, we reiterate our guidance of at least 10 % CAGR in underlying EBITA for the three years to FY 2020.* Our long-term target for TUI Group’s gross capex amounts 3.5 % of consolidated turnover.
* Based on constant currency growth, three year CAGR from FY 2017 base to FY 2020
Guidance for TUI AG
The future business performance of TUI AG is essentially subject to the same factors as those impacting TUI Group. Due to the business ties between TUI AG and its Group companies, the guidance, opportunities and risks presented for TUI Group are largely mirrored by expectations for TUI AG. The comments made for TUI Group therefore also apply to TUI AG.
Opportunity Report
TUI Group’s opportunity management follows the Group strategy for core business Tourism. Responsibility for systematically identifying and taking up opportunities rests with the operational management of the Hotels & Resorts, Cruises and Destination Experiences segments as well as our source markets. Market scenarios and critical success factors for the individual sectors are analysed and assessed in the framework of the Group-wide planning and control process. The core task of the Group’s Executive Board is to secure profitable growth for TUI Group by optimising the shareholding portfolio and developing the Group structure over the long term.
Overall, TUI Group is well positioned to benefit from opportunities resulting from the main trends in its markets.
O P P O R T U N I T I E S F R O M T H E D E V E L O P M E N T O F T H E
OV E R A L L F R A M E W O R K
Should the economy perform better than expected, TUI Group and its segments would benefit from the resulting increase in demand in the travel market. Moreover, changes in the competitive environment could create opportunities for TUI Group in individual markets.
CO R P O R AT E S T R AT E G Y
We see opportunities for further organic growth in particular by expanding our hotel portfolio, cruise business and the offering of our Destination Experiences segment. As market leader, we also intend to benefit in the long term from demographic change and the resulting expected increase in demand for high-quality travel at an attractive price / performance ratio.
O P E R AT I O N A L O P P O R T U N I T I E S
We intend to improve our competitive position further by offering unique product and further expanding controlled distribution in the source markets, in particular online distribution and via mobile devices. We also see operational opportunities arising from stronger integration of our Destination Experiences segment and tour oper-ation business.

60 COMBI NE D M A N AGE ME N T R E P O R T » BU S I Ne S S r e V Ie w
BUSINESS RE VIE W
Macroeconomic industry and market framework
Macroeconomic development
World Output
Var. % 2018 2017
World + 3.7 + 3.7
Eurozone + 2.0 + 2.4
Germany + 1.9 + 2.5
France + 1.6 + 2.3
UK + 1.4 + 1.7
US + 2.9 + 2.2
Russia + 1.7 + 1.5
Japan + 1.1 + 1.7
China + 6.6 + 6.9
India + 7.3 + 6.7
Source: International Monetary Fund (IMF), World Economic Outlook, October 2018
In calendar year 2018, the global upswing in economic activity achieved the previous year’s level. In its outlook (IMF, World Economic Outlook, October 2018), the International Monetary Fund projects global growth of 3.7 % again for 2018. The outlook had been revised downwards in the course of the year and now reflects the growing downside risks, in particular the trade conflicts between the world’s two largest economies, the United States and China.
Key exchange rates and commodity prices
The exchange rate charts are presented on the basis of the indirect quotation format customary in the foreign exchange market. If the exchange rate falls, the foreign currency is appreciating against the euro. By contrast, if the exchange rate rises, the foreign currency is depreciating against the euro.
Exchange rate US Dollar $ / €
2016 / 17 2017 / 18
1.30
1.20
1.10
1.00
Exchange rate Sterling £ / €
2016 / 17 2017 / 18
0.95
0.90
0.85
0.80
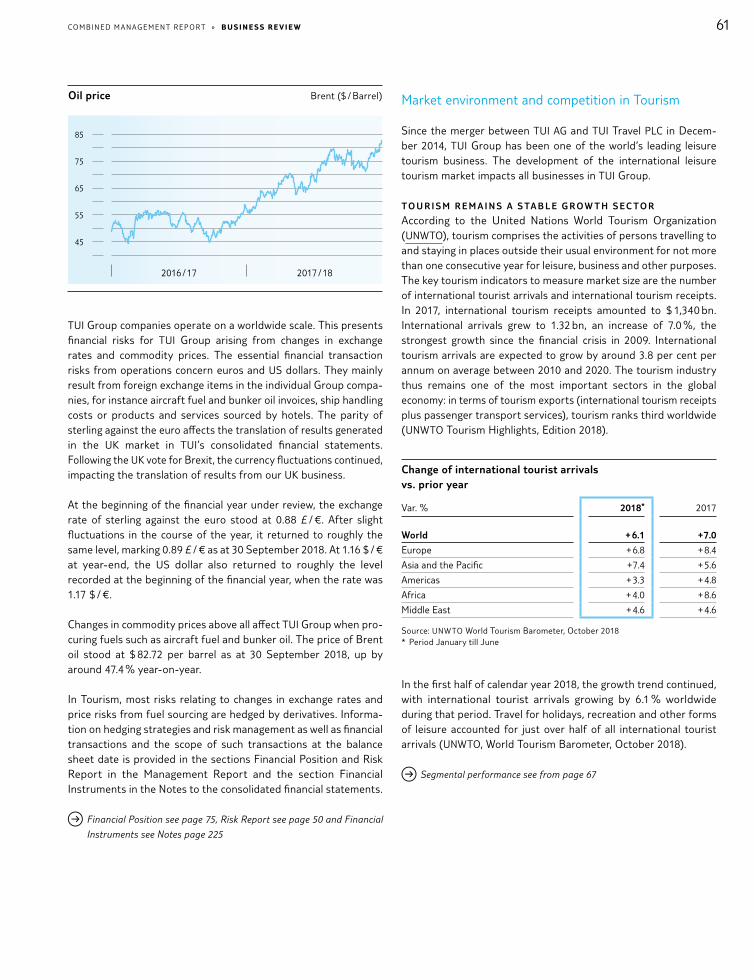
61COMBI NE D M A N AGE ME N T R E P O R T » BU S I Ne S S r e V Ie w
TUI Group companies operate on a worldwide scale. This presents financial risks for TUI Group arising from changes in exchange rates and commodity prices. The essential financial transaction risks from operations concern euros and US dollars. They mainly result from foreign exchange items in the individual Group compa-nies, for instance aircraft fuel and bunker oil invoices, ship handling costs or products and services sourced by hotels. The parity of sterling against the euro affects the translation of results generated in the UK market in TUI’s consolidated financial statements. Following the UK vote for Brexit, the currency fluctuations continued, impacting the translation of results from our UK business.
At the beginning of the financial year under review, the exchange rate of sterling against the euro stood at 0.88 £ / €. After slight fluctuations in the course of the year, it returned to roughly the same level, marking 0.89 £ / € as at 30 September 2018. At 1.16 $ / € at year-end, the US dollar also returned to roughly the level recorded at the beginning of the financial year, when the rate was 1.17 $ / €.
Changes in commodity prices above all affect TUI Group when pro-curing fuels such as aircraft fuel and bunker oil. The price of Brent oil stood at $ 82.72 per barrel as at 30 September 2018, up by around 47.4 % year-on-year.
In Tourism, most risks relating to changes in exchange rates and price risks from fuel sourcing are hedged by derivatives. Informa-tion on hedging strategies and risk management as well as financial transactions and the scope of such transactions at the balance sheet date is provided in the sections Financial Position and Risk Report in the Management Report and the section Financial Instruments in the Notes to the consolidated financial statements.
Financial Position see page 75, Risk Report see page 50 and Financial
Instruments see Notes page 225
Market environment and competition in Tourism
Since the merger between TUI AG and TUI Travel PLC in Decem-ber 2014, TUI Group has been one of the world’s leading leisure tourism business. The development of the international leisure tourism market impacts all businesses in TUI Group.
TO U R I S M R E M A I N S A S TA B L E G R O W T H S E C TO R
According to the United Nations World Tourism Organization (UNWTO), tourism comprises the activities of persons travelling to and staying in places outside their usual environment for not more than one consecutive year for leisure, business and other purposes. The key tourism indicators to measure market size are the number of international tourist arrivals and international tourism receipts. In 2017, international tourism receipts amounted to $ 1,340 bn. International arrivals grew to 1.32 bn, an increase of 7.0 %, the strongest growth since the financial crisis in 2009. International tourism arrivals are expected to grow by around 3.8 per cent per annum on average between 2010 and 2020. The tourism industry thus remains one of the most important sectors in the global economy: in terms of tourism exports (international tourism receipts plus passenger transport services), tourism ranks third worldwide (UNWTO Tourism Highlights, Edition 2018).
Change of international tourist arrivals vs. prior year
Var. % 2018* 2017
World + 6.1 + 7.0
Europe + 6.8 + 8.4
Asia and the Pacific + 7.4 + 5.6
Americas + 3.3 + 4.8
Africa + 4.0 + 8.6
Middle East + 4.6 + 4.6
Source: UNWTO World Tourism Barometer, October 2018 * Period January till June
In the first half of calendar year 2018, the growth trend continued, with international tourist arrivals growing by 6.1 % worldwide during that period. Travel for holidays, recreation and other forms of leisure accounted for just over half of all international tourist arrivals (UNWTO, World Tourism Barometer, October 2018).
Segmental performance see from page 67
Oil price Brent ($ / Barrel)
2016 / 17 2017 / 18
85
75
65
55
45
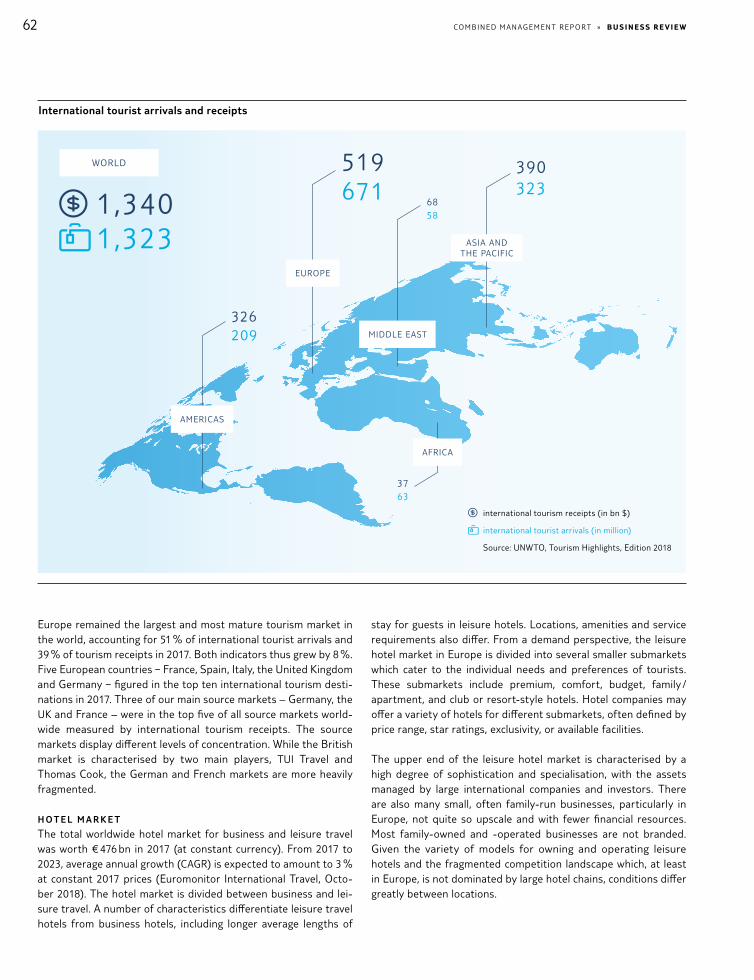
62 COMBI NE D M A N AGE ME N T R E P O R T » BU S I Ne S S r e V Ie w
Europe remained the largest and most mature tourism market in the world, accounting for 51 % of international tourist arrivals and 39 % of tourism receipts in 2017. Both indicators thus grew by 8 %. Five European countries − France, Spain, Italy, the United Kingdom and Germany − figured in the top ten international tourism desti-nations in 2017. Three of our main source markets – Germany, the UK and France – were in the top five of all source markets world-wide measured by international tourism receipts. The source markets display different levels of concentration. While the British market is characterised by two main players, TUI Travel and Thomas Cook, the German and French markets are more heavily fragmented.
H O T E L M A R K E T
The total worldwide hotel market for business and leisure travel was worth € 476 bn in 2017 (at constant currency). From 2017 to 2023, average annual growth (CAGR) is expected to amount to 3 % at constant 2017 prices (Euromonitor International Travel, Octo-ber 2018). The hotel market is divided between business and lei-sure travel. A number of characteristics differentiate leisure travel hotels from business hotels, including longer average lengths of
stay for guests in leisure hotels. Locations, amenities and service requirements also differ. From a demand perspective, the leisure hotel market in Europe is divided into several smaller submarkets which cater to the individual needs and preferences of tourists. These submarkets include premium, comfort, budget, family / apartment, and club or resort-style hotels. Hotel companies may offer a variety of hotels for different submarkets, often defined by price range, star ratings, exclusivity, or available facilities.
The upper end of the leisure hotel market is characterised by a high degree of sophistication and specialisation, with the assets managed by large international companies and investors. There are also many small, often family-run businesses, particularly in Europe, not quite so upscale and with fewer financial resources. Most family-owned and -operated businesses are not branded. Given the variety of models for owning and operating leisure hotels and the fragmented competition landscape which, at least in Europe, is not dominated by large hotel chains, conditions differ greatly between locations.
International tourist arrivals and receipts
5196711,340
1,323
390323
326209
3763
international tourism receipts (in bn $)
international tourist arrivals (in million)
Source: UNWTO, Tourism Highlights, Edition 2018
WORLD
EUROPE
AFRICA
AMERICAS
6858
MIDDLE EAST
ASIA AND THE PACIFIC

63COMBI NE D M A N AGE ME N T R E P O R T » BU S I Ne S S r e V Ie w
C R U I S E M A R K E T
The global cruise industry will generate estimated revenues of around $ 45.6 bn in 2018, an increase of 4.6 % year-on-year. The global estimate suggests that altogether around 26 million guests will have undertaken an ocean cruise in calendar year 2018. The North American market (United States, Caribbean, Canada, Mexico) is by far the largest and most mature cruise market in the world, with approximately 14 million guests and a strong penetration rate of 3.7 % of the total population taking a cruise in 2017.
By contrast, the European cruise markets recorded approximately 6.8 million passengers, with penetration rates varying significantly from country to country, but considerably lower overall. Germany, the United Kingdom & Ireland and France are among the five larg-est cruise markets in Europe. Germany is Europe’s largest cruise market, with 2.1 million passengers in 2018. At 2.7 %, its penetra-tion rate was lower than in the United Kingdom & Ireland. The United Kingdom & Ireland is the second largest cruise market in Europe, with approximately 2.0 million cruise passengers and Europe’s strongest penetration rate of 3.0 % in 2018. (Cruise Market Watch Website, www.cruisemarketwatch.com/market-share, October 2018; CLIA, Cruise Industry Ocean Source Market Report – Australia, 2018)
D E S T I N AT I O N E X P E R I E N C E S
The market for tours and activities in the destinations remains highly fragmented on the supplier side. More than 90 % of the around 300,000 companies are small providers with annual reve-nues of less than € 1 m, almost exclusively providing services to
occasional customers. At global turnover of € 150 bn and annual growth of 7 %, the segment is one of the most attractive tourism areas. With the acquisition of the Italian tech start-up Musement in FY 2019 and of the Destination Management of Hotelbeds in the FY 2018, TUI Group has strengthened its position in the excursions, tours and activities business in the destinations. In future, the combination of a single customer platform and cutting- edge technology will enable the Group to present tailored offerings to its customers both before and during their holiday.
Brand
S T R O N G T U I M A S T E R B R A N D
Our brand with the ‘smile’ – the smiling logo formed by the three letters of our brand name TUI – stands for a consistent customer experience, digital presence and competitive strength. The red smile is as well known as the logo of other leading brands. In order to further leverage the appeal and strength of our core brand and tap the associated growth potential, we have created a global branding and consistent brand experience in recent years. In 2018, TUI played in the Champions League of global brands in almost all markets. TUI is among the best-known travel brands in core Euro-pean countries. The rollout of the TUI brand in the framework of the local rebranding in the past few years has been very successful. In FY 2018, the UK was the last source market to undergo rebranding to TUI when the large local tour operator Thomson was replaced by TUI – here, too, TUI already achieves an aided brand awareness level of 80 %.
Group earnings
Comments on the consolidated income statement
TUI Group’s earnings position continued to show a positive devel-opment in FY 2018. The operating result (underlying EBITA) of TUI
Group’s continuing operations improved by 4.1 % to € 1,147.0 m in the period under review, or by 10.9 % year-on-year on a constant currency basis. This growth was driven in particular by the continued good operating performance in the Holiday Experiences segment.

64 COMBI NE D M A N AGE ME N T R E P O R T » BU S I Ne S S r e V Ie w
Income Statement of the TUI Group for the period from 1 Oct 2017 to 30 Sep 2018
€ million 2018 2017 Var. %
Turnover 19,523.9 18,535.0 + 5.3
Cost of sales 17,542.4 16,535.5 + 6.1
Gross profit 1,981.5 1,999.5 – 0.9
Administrative expenses 1,289.9 1,255.8 + 2.7
Other income 67.4 12.5 + 439.2
Other expenses 3.5 1.9 + 84.2
Financial income 83.8 229.3 – 63.5
Financial expenses 165.5 156.2 + 6.0
Share of result of joint ventures and associates 297.7 252.3 + 18.0
Earnings before income taxes 971.5 1,079.7 – 10.0
Income taxes 191.3 168.8 + 13.3
Result from continuing operations 780.2 910.9 – 14.3
Result from discontinued operations 38.7 – 149.5 n. a.
Group profit 818.9 761.4 + 7.6
Group profit attributable to shareholders of TUI AG 732.5 644.8 + 13.6
Group profit attributable to non-controlling interest 86.4 116.6 – 25.9
T U R N OV E R A N D CO S T O F S A L E S
Turnover
€ million
2018 2017
restated
Var. %
Hotels & Resorts 606.8 679.0 – 10.6
Cruises 901.9 815.0 + 10.7
Destination
Experiences 303.5 202.5 + 49.9
Holiday Experiences 1,812.2 1,696.5 + 6.8
Northern Region 6,854.9 6,601.5 + 3.8
Central Region 6,563.7 6,039.5 + 8.7
Western Region 3,577.6 3,502.2 + 2.2
Markets & Airlines 16,996.2 16,143.2 + 5.3
All other segments 715.5 695.3 + 2.9
TUI Group 19,523.9 18,535.0 + 5.3
TUI Group at constant
currency 19,701.5 18,535.0 + 6.3
Discontinued operations – 829.0 n. a.
Total 19,523.9 19,364.0 + 0.8
In FY 2018, turnover by TUI Group climbed by 5.3 % to € 19.5 bn. On a constant currency basis, turnover grew by 6.3 %. Alongside a year-on-year increase in customer numbers of 4.7 % in the source markets, capacity increases in the Cruises segment, higher average prices in the Hotels & Resorts segment and higher prices in the UK contributed to the turnover growth. Turnover is presented alongside the cost of sales, which was up 6.1 % in the period under review.
G R O S S P R O F I T
Gross profit, i. e. the difference between turnover and the cost of sales, was flat year-on-year at around € 2.0 bn.
A D M I N I S T R AT I V E E X P E N S E S
Administrative expenses rose by € 34.1 m year-on-year to € 1,289.9 m, above all due to higher personnel and IT costs.
F I N A N C I A L R E S U LT
The financial result declined by € 154.8 m to € – 81.7 m. The de-crease was essentially due to the profit of € 172.4 m generated in the prior year from the disposal of the remaining stake in Hapag- Lloyd AG.
S H A R E O F R E S U LT S O F J O I N T V E N T U R E S A N D A S S O C I AT E S
The result from joint ventures and associates comprises the pro-portionate net profit for the year of these companies measured at equity and where appropriate impairments of goodwill for these companies. In the period under review, the at equity result totalled € 297.7 m. The significant increase of € 45.4 m mainly resulted from a higher profit contribution by TUI Cruises.
R E S U LT F R O M CO N T I N U I N G O P E R AT I O N S
The result from continuing operations declined by € 130.7 m to € 780.2 m in FY 2018.
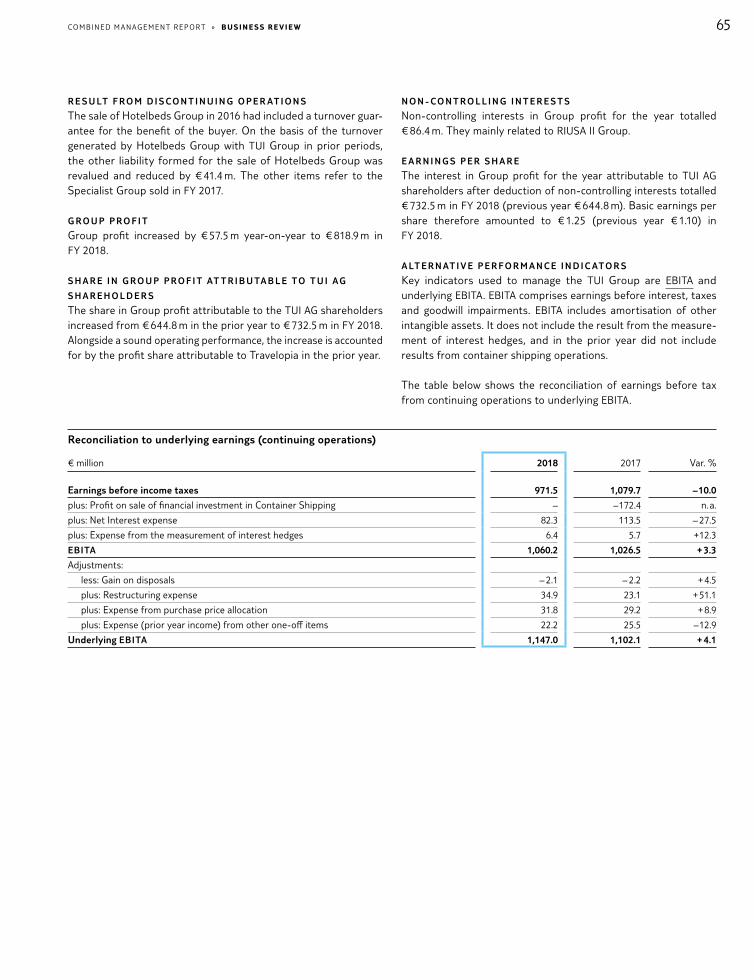
65COMBI NE D M A N AGE ME N T R E P O R T » BU S I Ne S S r e V Ie w
R E S U LT F R O M D I S CO N T I N U I N G O P E R AT I O N S
The sale of Hotelbeds Group in 2016 had included a turnover guar-antee for the benefit of the buyer. On the basis of the turnover generated by Hotelbeds Group with TUI Group in prior periods, the other liability formed for the sale of Hotelbeds Group was revalued and reduced by € 41.4 m. The other items refer to the Specialist Group sold in FY 2017.
G R O U P P R O F I T
Group profit increased by € 57.5 m year-on-year to € 818.9 m in FY 2018.
S H A R E I N G R O U P P R O F I T AT T R I B U TA B L E TO T U I AG
S H A R E H O L D E R S
The share in Group profit attributable to the TUI AG shareholders increased from € 644.8 m in the prior year to € 732.5 m in FY 2018. Alongside a sound operating performance, the increase is accounted for by the profit share attributable to Travelopia in the prior year.
N O N - CO N T R O L L I N G I N T E R E S T S
Non-controlling interests in Group profit for the year totalled € 86.4 m. They mainly related to RIUSA II Group.
E A R N I N G S P E R S H A R E
The interest in Group profit for the year attributable to TUI AG shareholders after deduction of non-controlling interests totalled € 732.5 m in FY 2018 (previous year € 644.8 m). Basic earnings per share therefore amounted to € 1.25 (previous year € 1.10) in FY 2018.
A LT E R N AT I V E P E R F O R M A N C E I N D I C ATO R S
Key indicators used to manage the TUI Group are EBITA and underlying EBITA. EBITA comprises earnings before interest, taxes and goodwill impairments. EBITA includes amortisation of other intangible assets. It does not include the result from the measure-ment of interest hedges, and in the prior year did not include results from container shipping operations.
The table below shows the reconciliation of earnings before tax from continuing operations to underlying EBITA.
Reconciliation to underlying earnings (continuing operations)
€ million 2018 2017 Var. %
Earnings before income taxes 971.5 1,079.7 – 10.0
plus: Profit on sale of financial investment in Container Shipping – – 172.4 n. a.
plus: Net Interest expense 82.3 113.5 – 27.5
plus: Expense from the measurement of interest hedges 6.4 5.7 + 12.3
EBITA 1,060.2 1,026.5 + 3.3
Adjustments:
less: Gain on disposals – 2.1 – 2.2 + 4.5
plus: Restructuring expense 34.9 23.1 + 51.1
plus: Expense from purchase price allocation 31.8 29.2 + 8.9
plus: Expense (prior year income) from other one-off items 22.2 25.5 – 12.9
Underlying EBITA 1,147.0 1,102.1 + 4.1

66 COMBI NE D M A N AGE ME N T R E P O R T » BU S I Ne S S r e V Ie w
The reported earnings (EBITA) of TUI Group rose by € 33.7 m to € 1,060.2 m due to a sound operating performance in FY 2018.
EBITA
€ million
2018 2017
restated
Var. %
Hotels & Resorts 425.6 353.7 + 20.3
Cruises 324.0 255.6 + 26.8
Destination
Experiences 43.1 32.6 + 32.6
Holiday Experiences 792.7 641.9 + 23.5
Northern Region 221.2 309.6 – 28.6
Central Region 72.5 67.3 + 7.7
Western Region 85.1 79.4 + 7.2
Markets & Airlines 378.8 456.3 – 17.0
All other segments – 111.3 – 71.7 – 55.4
TUI Group 1,060.2 1,026.5 + 3.3
TUI Group at constant
currency 1,133.4 1,026.5 + 10.4
Discontinued operations 38.7 – 22.1 n. a.
Total 1,098.9 1,004.4 + 9.4
In order to explain and evaluate the operating performance of the segments, earnings adjusted for special one-off effects (under-lying EBITA) are presented below. Underlying EBITA has been ad-justed for gains on disposal of financial investments, restructuring expenses according to IAS 37, all effects from purchase price allo-cations, ancillary acquisition costs and conditional purchase price payments and other expenses for and income from one-off items.
One-off items carried here include adjustments for income and expense items that reflect amounts and frequencies of occurrence rendering an evaluation of the operating profitability of the seg-ments and the Group more difficult or causing distortions. These items include in particular major restructuring and integration expenses not meeting the criteria of IAS 37, material expenses for litigation, gains and losses from the sale of aircraft and other material business transactions with a one-off character.
TUI Group’s underlying EBITA improved by € 44.9 m to € 1,147.0 m in FY 2018.
Underlying EBITA
€ million
2018 2017
restated
Var. %
Hotels & Resorts 425.7 356.5 + 19.4
Cruises 324.0 255.6 + 26.8
Destination
Experiences 44.7 35.1 + 27.4
Holiday Experiences 794.4 647.2 + 22.7
Northern Region 254.1 345.8 – 26.5
Central Region 89.1 71.5 + 24.6
Western Region 109.3 109.2 + 0.1
Markets & Airlines 452.5 526.5 – 14.1
All other segments – 99.9 – 71.6 – 39.5
TUI Group 1,147.0 1,102.1 + 4.1
TUI Group at constant
currency 1,221.7 1,102.1 + 10.9
Discontinued operations – – 1.2 n. a.
Total 1,147.0 1,100.9 + 4.2
In FY 2018, adjustments worth € 12.5 m were carried for the reduc-tion in pension obligations in the UK and the sale of aircraft assets. On the other hand, expenses of € 31.8 m were incurred for purchase price allocations, and other underlying expenses amounted to € 67.5 m. They mainly related to the following items and circum-stances:
G A I N S O N D I S P O S A L
In FY 2018, gains on disposal of financial assets worth € 2 m had to be adjusted for. They related in particular to the measurement of a stake in the framework of the takeover of Destination Management from Hotelbeds Group.
R E S T R U C T U R I N G CO S T S
In FY 2018, restructuring costs of € 35 m had to be adjusted for. They included an amount of around € 13 m for the realignment of the aviation business in the Nordics. Adjustments also included expenses worth around € 9 m for restructurings at TUI fly in Germany and around € 10 m for the integration of Transat in France.
E X P E N S E S F O R P U R C H A S E P R I C E A L LO C AT I O N S
Expenses for purchase price allocations related in particular to scheduled amortisation of intangible assets from acquisitions made in previous years.
O N E- O F F I T E M S
Net expenses for one-off items of € 22 m included in particular an amount of € 6 m relating to IT projects in Northern and Western Regions. Further expenses worth € 15 m related to reorganisation schemes in regions and destination agencies.

67COMBI NE D M A N AGE ME N T R E P O R T » BU S I Ne S S r e V Ie w
O T H E R S E G M E N T I N D I C ATO R S
Reconciliation to EBITDAR (continuing operations)
€ million 2018 2017 Var. %
EBITA 1,060.2 1,026.5 + 3.3
Amortisation (+) / write-backs (–) of other intangible assets and
depreciation (+) / write-backs (–) of property, plant and equipment 438.3 464.4 – 5.6
EBITDA 1,498.5 1,490.9 + 0.5
Long-term rental, leasing and leasing expenses 721.4 750.0 – 3.8
EBITDAR 2,219.9 2,240.9 – 0.9
EBITDA and underlying EBITDA
EBITDA Underlying EBITDA*
€ million
2018 2017
restated
Var. % 2018 2017
restated
Var. %
Hotels & Resorts 524.3 484.5 + 8.2 524.5 485.2 + 8.1
Cruises 398.3 312.9 + 27.3 398.3 312.9 + 27.3
Destination Experiences 52.1 40.4 + 29.0 53.6 42.9 + 24.9
Holiday Experiences 974.7 837.8 + 16.3 976.4 841.0 + 16.1
Northern Region 281.7 378.6 – 25.6 302.8 402.7 – 24.8
Central Region 95.3 87.6 + 8.8 109.8 89.8 + 22.3
Western Region 107.8 102.0 + 5.7 127.6 126.8 + 0.6
Markets & Airlines 484.8 568.2 – 14.7 540.2 619.3 – 12.8
All other segments 39.0 84.9 – 54.1 47.3 81.4 – 41.9
TUI Group 1,498.5 1,490.9 + 0.5 1,563.9 1,541.7 + 1.4
Discontinued operations 38.7 – 22.1 n. a. – – 1.2 n. a.
Total 1,537.2 1,468.8 + 4.7 1,563.9 1,540.5 + 1.5
* Adjustments according to reconciliation from page 65, excluding amortisation and write-backs.
Segmental performance
Outlook
In FY 2018 we delivered the fourth consecutive year of double digit growth of underlying EBITA at constant currency rates since the merger, with a continued strong ROIC performance. TUI’s sustained strong performance in a challenging market environment demonstrates its successful transformation as an integrated provider of holiday experiences, with strong strategic positioning and diversification across destinations and markets. Looking ahead, we expect growth to continue the benefits of our digitalisation efforts, efficiency measures and differentiation strategy through the disciplined expansion of our own hotel, cruise and destination experience content.
In Hotels & Resorts, our diversified portfolio means we will continue to benefit from growth in demand for Turkey and North Africa, with a normalisation in demand for Spain, including the Canaries. Demand also remains strong for our year round destinations such as Mexico and Cape Verde. We will continue to develop our portfolio of destinations, with a strong pipeline of own hotel openings for FY 2019 and beyond, and we remain on track to open approximately 60 additional hotels since merger by the end of FY 2019.
We will also launch three ships for our cruise brands in FY 2019. Bookings for the new ships and the existing fleet are progressing well, with a continued strong yield performance. Two ships exited our fleets (Marella Spirit and Hapag-Lloyd Cruises’ Hanseatic) in Autumn 2018. Five further new builds are on order for TUI Cruises
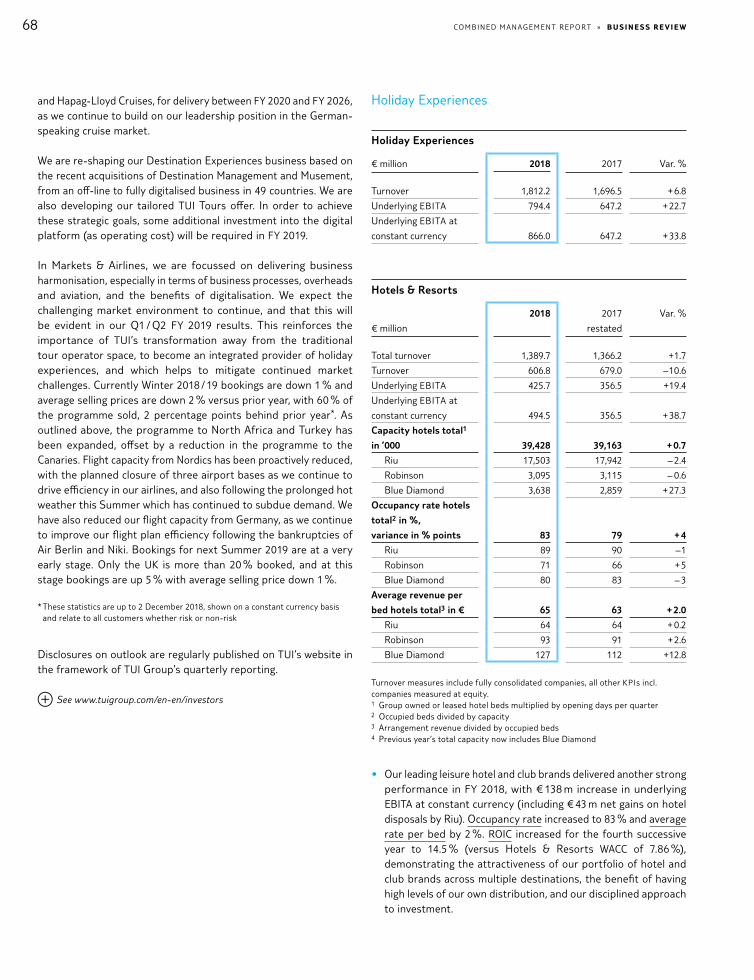
68 COMBI NE D M A N AGE ME N T R E P O R T » BU S I Ne S S r e V Ie w
and Hapag-Lloyd Cruises, for delivery between FY 2020 and FY 2026, as we continue to build on our leadership position in the German- speaking cruise market.
We are re-shaping our Destination Experiences business based on the recent acquisitions of Destination Management and Musement, from an off-line to fully digitalised business in 49 countries. We are also developing our tailored TUI Tours offer. In order to achieve these strategic goals, some additional investment into the digital platform (as operating cost) will be required in FY 2019.
In Markets & Airlines, we are focussed on delivering business harmonisation, especially in terms of business processes, overheads and aviation, and the benefits of digitalisation. We expect the challenging market environment to continue, and that this will be evident in our Q1 / Q2 FY 2019 results. This reinforces the importance of TUI’s transformation away from the traditional tour operator space, to become an integrated provider of holiday experiences, and which helps to mitigate continued market challenges. Currently Winter 2018 / 19 bookings are down 1 % and average selling prices are down 2 % versus prior year, with 60 % of the programme sold, 2 percentage points behind prior year*. As outlined above, the programme to North Africa and Turkey has been expanded, offset by a reduction in the programme to the Canaries. Flight capacity from Nordics has been proactively reduced, with the planned closure of three airport bases as we continue to drive efficiency in our airlines, and also following the prolonged hot weather this Summer which has continued to subdue demand. We have also reduced our flight capacity from Germany, as we continue to improve our flight plan efficiency following the bankruptcies of Air Berlin and Niki. Bookings for next Summer 2019 are at a very early stage. Only the UK is more than 20 % booked, and at this stage bookings are up 5 % with average selling price down 1 %.
* These statistics are up to 2 December 2018, shown on a constant currency basis and relate to all customers whether risk or non-risk
Disclosures on outlook are regularly published on TUI’s website in the framework of TUI Group’s quarterly reporting.
See www.tuigroup.com/en-en/investors
Holiday Experiences
Holiday Experiences
€ million 2018 2017 Var. %
Turnover 1,812.2 1,696.5 + 6.8
Underlying EBITA 794.4 647.2 + 22.7
Underlying EBITA at
constant currency 866.0 647.2 + 33.8
Hotels & Resorts
€ million
2018 2017
restated
Var. %
Total turnover 1,389.7 1,366.2 + 1.7
Turnover 606.8 679.0 – 10.6
Underlying EBITA 425.7 356.5 + 19.4
Underlying EBITA at
constant currency 494.5 356.5 + 38.7
Capacity hotels total1
in ’000 39,428 39,163 + 0.7
Riu 17,503 17,942 – 2.4
Robinson 3,095 3,115 – 0.6
Blue Diamond 3,638 2,859 + 27.3
Occupancy rate hotels
total2 in %,
variance in % points 83 79 + 4
Riu 89 90 – 1
Robinson 71 66 + 5
Blue Diamond 80 83 – 3
Average revenue per
bed hotels total3 in € 65 63 + 2.0
Riu 64 64 + 0.2
Robinson 93 91 + 2.6
Blue Diamond 127 112 + 12.8
Turnover measures include fully consolidated companies, all other KPIs incl. companies measured at equity.1 Group owned or leased hotel beds multiplied by opening days per quarter2 Occupied beds divided by capacity3 Arrangement revenue divided by occupied beds4 Previous year’s total capacity now includes Blue Diamond
• Our leading leisure hotel and club brands delivered another strong performance in FY 2018, with € 138 m increase in underlying EBITA at constant currency (including € 43 m net gains on hotel disposals by Riu). Occupancy rate increased to 83 % and average rate per bed by 2 %. ROIC increased for the fourth successive year to 14.5 % (versus Hotels & Resorts WACC of 7.86 %), demonstrating the attractiveness of our portfolio of hotel and club brands across multiple destinations, the benefit of having high levels of our own distribution, and our disciplined approach to investment.
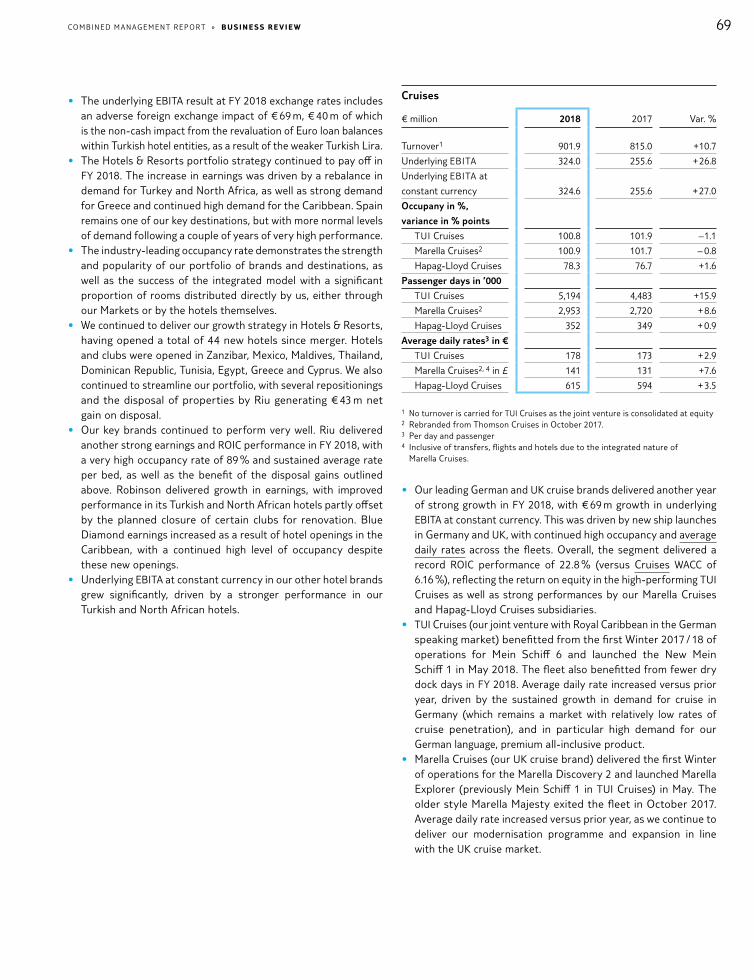
69COMBI NE D M A N AGE ME N T R E P O R T » BU S I Ne S S r e V Ie w
• The underlying EBITA result at FY 2018 exchange rates includes an adverse foreign exchange impact of € 69 m, € 40 m of which is the non-cash impact from the revaluation of Euro loan balances within Turkish hotel entities, as a result of the weaker Turkish Lira.
• The Hotels & Resorts portfolio strategy continued to pay off in FY 2018. The increase in earnings was driven by a rebalance in demand for Turkey and North Africa, as well as strong demand for Greece and continued high demand for the Caribbean. Spain remains one of our key destinations, but with more normal levels of demand following a couple of years of very high performance.
• The industry-leading occupancy rate demonstrates the strength and popularity of our portfolio of brands and destinations, as well as the success of the integrated model with a significant proportion of rooms distributed directly by us, either through our Markets or by the hotels themselves.
• We continued to deliver our growth strategy in Hotels & Resorts, having opened a total of 44 new hotels since merger. Hotels and clubs were opened in Zanzibar, Mexico, Maldives, Thailand, Dominican Republic, Tunisia, Egypt, Greece and Cyprus. We also continued to streamline our portfolio, with several repositionings and the disposal of properties by Riu generating € 43 m net gain on disposal.
• Our key brands continued to perform very well. Riu delivered another strong earnings and ROIC performance in FY 2018, with a very high occupancy rate of 89 % and sustained average rate per bed, as well as the benefit of the disposal gains outlined above. Robinson delivered growth in earnings, with improved performance in its Turkish and North African hotels partly offset by the planned closure of certain clubs for renovation. Blue Diamond earnings increased as a result of hotel openings in the Caribbean, with a continued high level of occupancy despite these new openings.
• Underlying EBITA at constant currency in our other hotel brands grew significantly, driven by a stronger performance in our Turkish and North African hotels.
Cruises
€ million 2018 2017 Var. %
Turnover1 901.9 815.0 + 10.7
Underlying EBITA 324.0 255.6 + 26.8
Underlying EBITA at
constant currency 324.6 255.6 + 27.0
Occupany in %,
variance in % points
TUI Cruises 100.8 101.9 – 1.1
Marella Cruises2 100.9 101.7 – 0.8
Hapag-Lloyd Cruises 78.3 76.7 + 1.6
Passenger days in ’000
TUI Cruises 5,194 4,483 + 15.9
Marella Cruises2 2,953 2,720 + 8.6
Hapag-Lloyd Cruises 352 349 + 0.9
Average daily rates3 in €
TUI Cruises 178 173 + 2.9
Marella Cruises2, 4 in £ 141 131 + 7.6
Hapag-Lloyd Cruises 615 594 + 3.5
1 No turnover is carried for TUI Cruises as the joint venture is consolidated at equity2 Rebranded from Thomson Cruises in October 2017.3 Per day and passenger4 Inclusive of transfers, flights and hotels due to the integrated nature of
Marella Cruises.
• Our leading German and UK cruise brands delivered another year of strong growth in FY 2018, with € 69 m growth in underlying EBITA at constant currency. This was driven by new ship launches in Germany and UK, with continued high occupancy and average daily rates across the fleets. Overall, the segment delivered a record ROIC performance of 22.8 % (versus Cruises WACC of 6.16 %), reflecting the return on equity in the high-performing TUI Cruises as well as strong performances by our Marella Cruises and Hapag- Lloyd Cruises subsidiaries.
• TUI Cruises (our joint venture with Royal Caribbean in the German speaking market) benefitted from the first Winter 2017 / 18 of operations for Mein Schiff 6 and launched the New Mein Schiff 1 in May 2018. The fleet also benefitted from fewer dry dock days in FY 2018. Average daily rate increased versus prior year, driven by the sustained growth in demand for cruise in Germany (which remains a market with relatively low rates of cruise penetration), and in particular high demand for our German language, premium all-inclusive product.
• Marella Cruises (our UK cruise brand) delivered the first Winter of operations for the Marella Discovery 2 and launched Marella Explorer (previously Mein Schiff 1 in TUI Cruises) in May. The older style Marella Majesty exited the fleet in October 2017. Average daily rate increased versus prior year, as we continue to deliver our modernisation programme and expansion in line with the UK cruise market.

70 COMBI NE D M A N AGE ME N T R E P O R T » BU S I Ne S S r e V Ie w
• Hapag-Lloyd Cruises (our luxury and expedition brand) delivered a strong performance and an increase in earnings, with increased occupancy and average daily rate and a good operational perfor-mance offsetting the higher number of dry dock days.
Destination Experiences
€ million 2018 2017 Var. %
Total turnover 594.1 444.8 + 33.6
Turnover 303.5 202.5 + 49.9
Underlying EBITA 44.7 35.1 + 27.4
Underlying EBITA at
constant currency 46.9 35.1 + 33.6
• Our tours, activities and service provider in destination delivered a significant increase in underlying EBITA in FY 2018. This was driven by higher customer volumes in Turkey, Greece and North Africa, efficiencies in Spain, Portugal and Greece, and the inclusion of earnings of Destination Management following completion of the acquisition from Hotelbeds in August 2018.
• Excluding the acquisition of Destination Management, underlying EBITA at constant currency grew by 20 % in FY 2018.
• The acquisition of technology start-up Musement, a leading online platform for tours and activities in destination, was also completed in October 2018. Together with the Destination Management acquisition, this will enable us to grow our Desti-nation Experiences as a fully digitalised provider with destination product offerings in 49 countries.
Markets & Airlines (formerly Sales & Marketing)
Markets & Airlines
€ million 2018 2017 Var. %
Turnover 16,996.2 16,143.2 + 5.3
Underlying EBITA 452.5 526.5 – 14.1
Underlying EBITA at
constant currency 449.8 526.5 – 14.6
Net Promoter Score
(NPS)1 in %,
variance in % points 50 50 –
Direct distribution2 in %,
variance in % points 74 73 + 1
Online distribution3 in %,
variance in % points 48 46 + 2
Customers in ’000 21,127 20,183 + 4.7
1 NPS is measured in customer satisfaction questionnaires completed post-holiday. It is based on the question ‘On a scale of 0 to 10 where 10 is extremely likely and 0 ist not at all likely, how likely is it that you would recommend the brand to a friend, colleague or relative?” and is calculated by taking the percentage of promoters (9s and 10s) less the percentage of detractors (0s through 6s).
2 Share of sales via own channels (retail and online)3 Share of online sales
• Markets & Airlines are leaders in packaged distribution and fulfillment, leveraging their strong market and customer knowl-edge. Against a backdrop of significant and unforseen external challenges – namely, the Summer heatwave and airline disrup-tion – several of our major source markets delivered significant growth in earnings, offset by currency inflation in the UK. Overall Markets & Airlines delivered 4.7 % increase in customer volumes with another year of increased direct and online distribution. Net promoter scores remain high at 50, demonstrating the strength of our customer offer and focus on their holiday experience.
• We are focused on delivering further efficiency improvements through the harmonisation of our three regional businesses, as well as the benefits of digitalisation. Having successfully delivered the TUI rebranding in all of Markets & Airlines, we now have one leadership covering all regions, and have identified further potential for harmonisation in business processes and overheads. In addition, we will continue to expand the synergies from One Aviation.
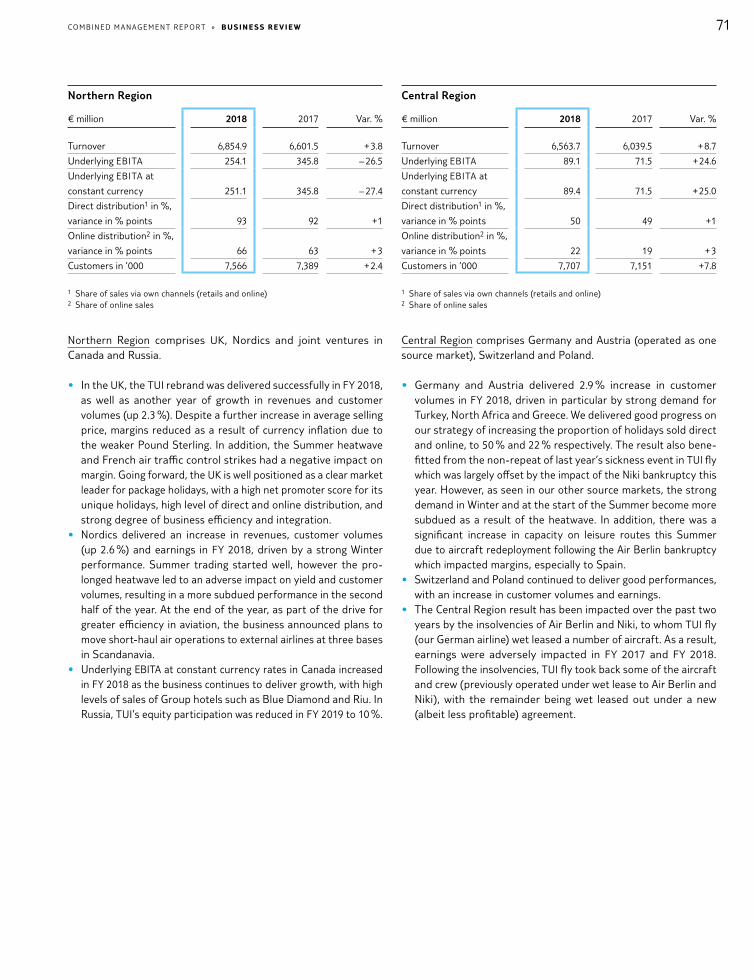
71COMBI NE D M A N AGE ME N T R E P O R T » BU S I Ne S S r e V Ie w
Northern Region
€ million 2018 2017 Var. %
Turnover 6,854.9 6,601.5 + 3.8
Underlying EBITA 254.1 345.8 – 26.5
Underlying EBITA at
constant currency 251.1 345.8 – 27.4
Direct distribution1 in %,
variance in % points 93 92 + 1
Online distribution2 in %,
variance in % points 66 63 + 3
Customers in ’000 7,566 7,389 + 2.4
1 Share of sales via own channels (retails and online)2 Share of online sales
Northern Region comprises UK, Nordics and joint ventures in Canada and Russia.
• In the UK, the TUI rebrand was delivered successfully in FY 2018, as well as another year of growth in revenues and customer volumes (up 2.3 %). Despite a further increase in average selling price, margins reduced as a result of currency inflation due to the weaker Pound Sterling. In addition, the Summer heatwave and French air traffic control strikes had a negative impact on margin. Going forward, the UK is well positioned as a clear market leader for package holidays, with a high net promoter score for its unique holidays, high level of direct and online distribution, and strong degree of business efficiency and integration.
• Nordics delivered an increase in revenues, customer volumes (up 2.6 %) and earnings in FY 2018, driven by a strong Winter performance. Summer trading started well, however the pro-longed heatwave led to an adverse impact on yield and customer volumes, resulting in a more subdued performance in the second half of the year. At the end of the year, as part of the drive for greater efficiency in aviation, the business announced plans to move short-haul air operations to external airlines at three bases in Scandanavia.
• Underlying EBITA at constant currency rates in Canada increased in FY 2018 as the business continues to deliver growth, with high levels of sales of Group hotels such as Blue Diamond and Riu. In Russia, TUI’s equity participation was reduced in FY 2019 to 10 %.
Central Region
€ million 2018 2017 Var. %
Turnover 6,563.7 6,039.5 + 8.7
Underlying EBITA 89.1 71.5 + 24.6
Underlying EBITA at
constant currency 89.4 71.5 + 25.0
Direct distribution1 in %,
variance in % points 50 49 + 1
Online distribution2 in %,
variance in % points 22 19 + 3
Customers in ’000 7,707 7,151 + 7.8
1 Share of sales via own channels (retails and online)2 Share of online sales
Central Region comprises Germany and Austria (operated as one source market), Switzerland and Poland.
• Germany and Austria delivered 2.9 % increase in customer volumes in FY 2018, driven in particular by strong demand for Turkey, North Africa and Greece. We delivered good progress on our strategy of increasing the proportion of holidays sold direct and online, to 50 % and 22 % respectively. The result also bene-fitted from the non-repeat of last year’s sickness event in TUI fly which was largely offset by the impact of the Niki bankruptcy this year. However, as seen in our other source markets, the strong demand in Winter and at the start of the Summer become more subdued as a result of the heatwave. In addition, there was a significant increase in capacity on leisure routes this Summer due to aircraft redeployment following the Air Berlin bankruptcy which impacted margins, especially to Spain.
• Switzerland and Poland continued to deliver good performances, with an increase in customer volumes and earnings.
• The Central Region result has been impacted over the past two years by the insolvencies of Air Berlin and Niki, to whom TUI fly (our German airline) wet leased a number of aircraft. As a result, earnings were adversely impacted in FY 2017 and FY 2018. Following the insolvencies, TUI fly took back some of the aircraft and crew (previously operated under wet lease to Air Berlin and Niki), with the remainder being wet leased out under a new (albeit less profitable) agreement.

72 COMBI NE D M A N AGE ME N T R E P O R T » BU S I Ne S S r e V Ie w
Western Region
€ million 2018 2017 Var. %
Turnover 3,577.6 3,502.2 + 2.2
Underlying EBITA 109.3 109.2 + 0.1
Underlying EBITA at
constant currency 109.3 109.2 + 0.1
Direct distribution1 in %,
variance in % points 73 71 + 2
Online distribution2 in %,
variance in % points 55 54 + 1
Customers in ’000 5,854 5,643 + 3.7
1 Share of sales via own channels (retails and online)2 Share of online sales
Western Region comprises Belgium, Netherlands and France.
• Our market leaders in Belgium and Netherlands continued to grow customer volumes, by 6.8 % in total, with good margins overall and increasing levels of direct and online distribution. Similar to other markets, there was a relatively high level of airline disruption during the early Summer.
• France’s performance was disappointing in FY 2018. The trading environment was very difficult, particularly as a result of the Summer heatwave which impacted on demand, due to the large number of domestic alternatives and overcapacity in the market.
The result has benefitted from the delivery of further cost synergies from the Transat integration, however, this was not enough to offset the challenging trading environment. In addition, further investment was required to launch the TUI brand in the French market at the start of the year.
All other segments
All other segments
€ million
2018 2017
restated
Var. %
Turnover 715.5 695.3 + 2.9
Underlying EBITA – 99.9 – 71.6 – 39.5
Underlying EBITA at
constant currency – 94.1 – 71.6 – 31.4
This segment comprises the business operations for new markets, the scheduled French airline Corsair, and the central corporate functions and interim holdings of TUI Group and the Group’s real estate companies. The increase in operating loss was driven by Corsair, partly as the result of a planned airline maintenance event at the start of the year, and partly due to an aircraft towing incident in Q4.

73COMBI NE D M A N AGE ME N T R E P O R T » BU S I Ne S S r e V Ie w
Net assets
Development of the Group’s asset structure
€ million 30 Sep 2018 30 Sep 2017 Var. %
Fixed assets 9,918.6 9,067.0 + 9.4
Non-current
receivables 763.5 800.6 – 4.6
Non-current assets 10,682.1 9,867.6 + 8.3
Inventories 118.5 110.2 + 7.5
Current receivables 2,257.7 1,682.0 + 34.2
Cash and cash
equivalents 2,548.0 2,516.1 + 1.3
Assets held for sale 5.5 9.6 – 42.7
Current assets 4,929.7 4,317.9 + 14.2
Assets 15,611.8 14,185.5 + 10.1
Equity 4,333.6 3,533.7 + 22.6
Liabilities 11,278.2 10,651.8 + 5.9
Equity and liabilities 15,611.8 14,185.5 + 10.1
The Group’s balance sheet total increased by 10.1 % as against 30 September 2017 to € 15.6 bn.
Vertical structural indicators
Non-current assets accounted for 68.4 % of total assets, compared with 69.6 % in the previous year. The capitalisation ratio (ratio of fixed assets to total assets) decreased from 63.9 % to 63.5 %.
Current assets accounted for 31.6 % of total assets, compared with 30.4 % in the previous year. The Group’s cash and cash equivalents increased by € 31.9 m year-on-year to € 2,548.0 m. They thus ac-counted for 16.3 % of total assets, as against 17.7 % in the previous year.
Horizontal structural indicators
At the balance sheet date, the ratio of equity to non-current as-sets was 40.6 %, as against 35.8 % in the previous year. The ratio of equity to fixed assets was 43.7 % (previous year 39.0 %). The ratio of equity plus non-current financial liabilities to fixed assets was 66.4 %, compared with 58.4 % in the previous year.
Development of the Group’s non-current assets
Structure of the Group’s non-current assets
€ million 30 Sep 2018 30 Sep 2017 Var. %
Goodwill 2,958.6 2,889.5 + 2.4
Other intangible
assets 569.9 548.1 + 4.0
Property, plant and
equipment 4,899.2 4,253.7 + 15.2
Companies measured
at equity 1,436.6 1,306.2 + 10.0
Financial assets
available for sale 54.3 69.5 – 21.9
Fixed assets 9,918.6 9,067.0 + 9.4
Receivables and
assets 537.8 476.9 + 12.8
Deferred tax claims 225.7 323.7 – 30.3
Non-current receivables 763.5 800.6 – 4.6
Non-current assets 10,682.1 9,867.6 + 8.3
G O O D W I L L
Goodwill rose by € 69.1 m to € 2,958.6 m. The increase in the carrying amount is essentially due to the acquisition of the Destination Management business. An opposite effect was driven by the trans-lation of goodwill not managed in TUI Group’s functional currency into euros. In the period under review, no adjustments were required as a result of impairment tests.
P R O P E R T Y, P L A N T A N D E Q U I P M E N T
Property, plant and equipment increased to € 4,899.2 m in the fi-nancial year under review, primarily driven by the acquisition of the cruise ship Marella Explorer, investments in hotel facilities, down payments on aircraft orders and the delivery of aircraft. Property, plant and equipment also comprised leased assets in which Group companies held economic ownership. At the balance sheet date, these finance leases had a carrying amount of € 1,290.2 m, up 11.4 % year-on-year.

74 COMBI NE D M A N AGE ME N T R E P O R T » BU S I Ne S S r e V Ie w
Development of property, plant and equipment
€ million 30 Sep 2018 30 Sep 2017 Var. %
Real estate with hotels 1,262.8 1,040.8 + 21.3
Other land 194.1 165.1 + 17.6
Aircraft 1,415.1 1,207.2 + 17.2
Ships 995.2 860.1 + 15.7
Machinery and fixtures 407.9 361.2 + 12.9
Assets under
construction, payments
on accounts 624.1 619.3 + 0.8
Total 4,899.2 4,253.7 + 15.2
CO M PA N I E S M E A S U R E D AT E Q U I T Y
Seventeen associated companies and 27 joint ventures were measured at equity. At € 1,436.6 m, their value increased by 10.0 % year-on-year as at the balance sheet date.
Development of the Group’s current assets
Structure of the Group’s current assets
€ million 30 Sep 2018 30 Sep 2017 Var. %
Inventories 118.5 110.2 + 7.5
Trade accounts
receivable and
other assets* 2,143.9 1,583.3 + 35.4
Current tax assets 113.8 98.7 + 15.3
Current receivables 2,257.7 1,682.0 + 34.2
Cash and cash
equivalents 2,548.0 2,516.1 + 1.3
Assets held for sale 5.5 9.6 – 42.7
Current assets 4,929.7 4,317.9 + 14.2
* incl. receivables from derivative financial instruments and touristic prepayments
C U R R E N T R E C E I VA B L E S
Current receivables comprise trade accounts receivable and other receivables, current income tax assets and claims from derivative financial instruments. At € 2,257.7 m, current receivables increased by 34.2 % year-on-year.
C A S H A N D C A S H E Q U I VA L E N T S
At € 2,548.0 m, cash and cash equivalents increased by 1.3 % year-on-year.
Unrecognised assets
In the course of their business operations, Group companies used assets of which they were not the economic owner according to the IASB rules. Most of these assets were aircraft, hotel complexes or ships for which operating leases, i. e. rental, lease or charter agreements, were concluded at terms and conditions customary in the sector.
Operating rental, lease and charter contracts
€ million 30 Sep 2018 30 Sep 2017 Var. %
Aircraft 1,547.1 1,461.1 + 5.9
Hotel complexes 675.2 728.4 – 7.3
Travel agencies 212.3 217.1 – 2.2
Administrative buildings 244.0 233.8 + 4.4
Ships, Yachts and
motor boats 1.0 29.2 – 96.6
Other 131.3 107.8 + 21.8
Total 2,810.9 2,777.4 + 1.2
Further explanations as well as the structure of the remaining terms of the financial liabilities from operating rental, lease and charter agreements are provided in the section Other financial lia-bilities in the Notes to the consolidated financial statements.
Information on other intangible, unrecognised assets in terms of brands, customer and supplier relationships and organisational and process benefits is provided in the section TUI Group Corpo-rate Profile; relationships with investors and capital markets are outlined in the section TUI Share.
TUI Group Corporate Profile see page 32; TUI Share from page 103

75COMBI NE D M A N AGE ME N T R E P O R T » BU S I Ne S S r e V Ie w
Financial position of the Group
Principles and goals of financial management
P R I N C I P L E S
TUI Group’s financial management is centrally operated by TUI AG, which acts as the Group’s internal bank. Financial management covers all Group companies in which TUI AG directly or indirectly holds an interest of more than 50 %. It is based on policies covering all cash flow-oriented aspects of the Group’s business activities. In the framework of a cross-national division of tasks within the organ-isation, TUI AG has outsourced some of its operational financial activities to First Choice Holidays Finance Ltd, a British Group company. However, these financial activities are carried out on a coordinated and centralised basis.
G OA L S
TUI’s financial management goals include ensuring sufficient liquidity for TUI AG and its subsidiaries and limiting financial risks from fluctuations in currencies, commodity prices and interest rates as well as default risk of treasury activities.
L I Q U I D I T Y S A F E G UA R D S
The Group’s liquidity safeguards consist of two components:
• In the course of the annual Group planning process, TUI draws up a multi-annual finance budget, from which long-term financ-ing and refinancing requirements are derived. This information and financial market observation to identify refinancing oppor-tunities create a basis for decision-making, enabling appropriate financing instruments for the long-term funding of the Company to be adopted at an early stage.
• TUI uses syndicated credit facilities and bilateral bank loans as well as its liquid funds to secure sufficient short-term cash reserves. Through intra-Group cash pooling, the cash surpluses of individual Group companies are used to finance the cash requirements of other Group companies. Planning of bank transactions is based on a monthly rolling liquidity planning system.
L I M I T I N G F I N A N C I A L R I S K S
The Group companies operate on a worldwide scale. This gives rise to financial risks for TUI Group, mainly from changes in exchange rates, commodity prices and interest rates.
The key operating financial transaction risks relate to the euro, US dollar and pound sterling and changing fuel prices. They mainly result from cost items in foreign currencies held by individual Group companies, e. g. hotel sourcing, aircraft fuel and bunker oil invoices or ship handling costs.
The Group has entered into derivative hedges in various foreign currencies in order to limit its exposure to risks from changes in exchange rates for the hedged items. Changes in commodity prices affect TUI Group, in particular in procuring fuels such as aircraft fuel and bunker oil. These price risks related to fuel procurement are largely hedged with the aid of derivative instruments. Where price increases can be passed on to customers due to contractual agreements, this is also reflected in our hedging behaviour. In order to control risks related to changes in interest rates arising on liquidity procurement in the international money and capital mar-kets and investments of liquid funds, the Group uses derivative interest hedges on a case-by-case basis as part of its interest management system.
In order to limit default risks from settlement payments for derivatives as well as money market investments with banks and investments in money market funds, TUI AG and First Choice Holidays Finance Ltd. have defined credit rating criteria for the selection of their counterparties. Trading and transaction limits are fixed on the basis of the credit ratings granted by the main rating agencies. The credit ratings and the corresponding limits are regularly reviewed. In the event of fair value changes in derivatives or rating changes, new business with these counterparties may temporarily be suspended until the limits can be adequately utilised again. The limits are fixed in consultation between the CFO and the Treasury Department.
The use of derivative hedges is based on underlying transactions; the derivatives are not used for speculation purposes.
More detailed information on hedging strategies and risk manage-ment as well as financial transactions and the scope of such trans-actions at the balance sheet date is provided in the Risk Report and the section Financial instruments in the Notes to the consoli-dated financial statements.
See from page 50 and 225

76 COMBI NE D M A N AGE ME N T R E P O R T » BU S I Ne S S r e V Ie w
Capital structure
Capital structure of the Group
€ million 30 Sep 2018 30 Sep 2017 Var. %
Non-current assets 10,682.1 9,867.6 + 8.3
Current assets 4,929.7 4,317.9 + 14.2
Assets 15,611.8 14,185.5 + 10.1
Subscribed capital 1,502.9 1,501.6 + 0.1
Capital reserves 4,200.5 4,195.0 + 0.1
Revenue reserves – 2,005.3 – 2,756.9 + 27.3
Non-controlling
interest 635.5 594.0 + 7.0
Equity 4,333.6 3,533.7 + 22.6
Non-current
provisions 1,730.3 1,896.1 – 8.7
Current provisions 380.9 382.6 – 0.4
Provisions 2,111.2 2,278.7 – 7.4
Non-current financial
liabilities 2,250.7 1,761.2 + 27.8
Current financial
liabilities 192.2 171.9 + 11.8
Financial liabilities 2,442.9 1,933.1 + 26.4
Other non-current
liabilities 409.5 459.8 – 10.9
Other current
liabilities 6,314.6 5,980.2 + 5.6
Other liabilities 6,724.1 6,440.0 + 4.4
Equity and liabilities 15,611.8 14,185.5 + 10.1
Capital ratios
€ million 30 Sep 2018 30 Sep 2017 Var. %
Non-current capital 8,724.1 7,650.8 + 14.0
Non-current capital
in relation to balance
sheet total % 55.9 53.9 + 2.0*
Equity ratio % 27.8 24.9 + 2.9*
Equity and non-current
financial liabilities 6,584.3 5,294.9 + 24.4
Equity and non-current
financial liabilities
in relation to balance
sheet total % 42.2 37.3 + 4.9*
* Percentage points
Overall, non-current capital increased by 14.0 % to € 8,724.1 m. As a proportion of the balance sheet total, it amounted to 55.9 % (previous year 53.9 %).
The equity ratio was 27.8 % (previous year 24.9 %). Equity and non-current financial liabilities accounted for 42.2 % (previous year 37.3 %) of the balance sheet total at the reporting date.
E Q U I T Y
Subscribed capital and the capital reserves rose slightly year- on-year. The increase of 0.1 % each was driven by the issue of employee shares. Revenue reserves rose by € 751.6 m to €– 2,005.3 m. Non-controlling interests accounted for € 635.5 m of equity.
P R OV I S I O N S
Provisions mainly comprise provisions for pension obligations, for maintenance and other typical operating risks classified as current or non-current, depending on expected occurrence. At the balance sheet date, they accounted for a total of € 2,111.2 m, down by € 167.5 m or 7.4 % year-on-year.
F I N A N C I A L L I A B I L I T I E S
Composition of liabilities
€ million 30 Sep 2018 30 Sep 2017 Var. %
Bonds 296.8 295.8 + 0.3
Liabilites to banks 780.5 381.3 + 104.7
Liabilites from finance
leases 1,342.7 1,226.5 + 9.5
Other financial liabilities 22.9 29.5 – 22.4
Financial liabilities 2,442.9 1,933.1 + 26.4
S T R U C T U R A L C H A N G E S I N F I N A N C I A L L I A B I L I T I E S
The Group’s financial liabilities increased by a total of € 509.8 m to € 2,442.9 m. The structure of liabilities was affected by a slight rise in liabilities from finance leases and an increase in financial liabilities from the issue of a Schuldschein.
OV E R V I E W O F T U I ’ S L I S T E D B O N D
The table below lists the maturities, nominal volumes and annual interest coupon of listed bonds from 2016 with a nominal value of € 300.0 m and a 5-year period to maturity.

77COMBI NE D M A N AGE ME N T R E P O R T » BU S I Ne S S r e V Ie w
Listed bonds
Capital measures
Issuance
Maturity
Amount
initial
€ million
Amount
outstanding
€ million
Interest rate
% p. a.
Senior Notes 2016 October 2016 October 2021 300.0 300.0 2.125
B A N K L OA N S A N D O T H E R L I A B I L I T I E S F R O M
F I N A N C E L E A S E S
Apart from the bonds worth € 300.0 m for the purposes of general corporate financing, TUI AG issued a Schuldschein worth a total of € 425.0 m in July 2018. A fixed interest rate was agreed for three tranches with tenors of 5, 7 and 10 years. Two other tranches with tenors of 5 and 7 years will carry a floating interest rate based on 6-month EURIBOR plus a fixed margin. The resulting interest rate risks are hedged by interest rate transactions with the same terms. At an average tenor of nearly 6.5 years for the Schuldschein, the interest costs amount to around 1.75 % p. a.
Moreover, the Hotels & Resorts and Cruises segments took out separate bank loans, primarily in order to finance investments by these companies. Most liabilities from finance lease contracts are attributable to aircraft as well as one cruise ship. More detailed information, in particular on the remaining terms, is provided under Financial liabilities in the Notes to the consolidated financial statements.
O T H E R L I A B I L I T I E S
Other liabilities totalled € 6,724.1 m, up by € 284.1 m or 4.4 % year-on-year.
See section on Financial liabilities in the Notes, page 217
Off-balance sheet financial instruments and key credit facilities
O P E R AT I N G L E A S E S
The development of operating rental, leasing and charter contracts is presented in the section Net assets in the Management Report.
See page 74
More detailed explanations and information on the structure of the remaining terms of the associated financial liabilities are pro-vided in the section Other financial liabilities in the Notes to the consolidated financial statements. There were no contingent liabil-ities related to special-purpose vehicles.
S Y N D I C AT E D C R E D I T FAC I L I T I E S O F T U I AG
TUI AG signed a syndicated credit facility worth € 1.75 bn in Sep-tember 2014. This syndicated credit facility is available for general corporate financing purposes (in particular in the winter months).
It carries a floating interest rate which depends on the short-term interest rate level (EURIBOR or LIBOR) and TUI’s credit rating plus a margin. At the balance sheet date, an amount of € 102.4 m from this credit facility had been taken up in the form of bank guarantees.
B I L AT E R A L G UA R A N T E E FAC I L I T I E S O F T U I AG W I T H
I N S U R A N C E CO M PA N I E S A N D B A N K S
TUI AG has concluded several bilateral guarantee facilities with various insurance companies with a total volume of £ 85.0 m and € 130.0 m. These guarantee facilities are required for the delivery of tourism services in order to ensure that Group companies are able to meet, in particular, the requirements of European over-sight and regulatory authorities on the provision of guarantees and warranties. The guarantees issued usually have a term of 12 to 18 months. They give rise to a commission in the form of a fixed percentage of the maximum guarantee amount. At the balance sheet date, an amount of £ 27.3 m and € 30.0 m from these guarantee facilities had been used.
TUI AG also concluded bilateral guarantee facilities with a total volume of € 42.5 m with banks to provide bank guarantees in the framework of ordinary business operations. Some of the guarantees have a term of several years. The guarantees granted give rise to a commission in the form of a fixed percentage of the maximum guarantee amount. At the balance sheet date, an amount of € 15.8 m from these guarantee facilities had been used.
Obligations from financing agreements
The Schuldschein worth € 425.0 m from 2018, the bond worth € 300.0 m from 2016 and the credit and guarantee facilities of TUI AG contain a number of obligations. TUI AG has a duty to com-ply with certain financial covenants (as defined in the respective contracts) from its syndicated credit facility worth € 1.75 bn and a number of bilateral guarantee lines. These require (a) compliance with a underlying EBITDAR-to-net interest expense ratio measur-ing TUI Group’s relative charge from the interest result and the lease and rental expenses; and (b) compliance with a net debt- to-underlying EBITDA ratio, calculating TUI Group’s relative charge from financial liabilities. The underlying EBITDAR-to-net interest expense ratio must have a coverage multiple of at least 1.5; net debt must not exceed 3.0 times underlying EBITDA. The financial covenants are determined every six months. They restrict, inter alia, TUI’s scope for encumbering or selling assets, acquiring other companies or shareholdings, or effecting mergers.

78 COMBI NE D M A N AGE ME N T R E P O R T » BU S I Ne S S r e V Ie w
The Schuldschein worth € 425.0 m, the bond worth € 300.0 m and the credit and guarantee facilities of TUI AG also contain additional contractual clauses typical of financing instruments of this type.
Non-compliance with these obligations awards the lenders the right to call in the facilities or terminate the financing schemes for immediate repayment.
Ratings by Standard & Poor’s and Moody’s
TUI AG ratings
2013 2014 2015 2016 2017 2018 Outlook
Standard & Poor’s B B+ BB– BB– BB BB stable
Moody’s B3 B2 Ba3 Ba2 Ba2 Ba2 positive
In the light of improved metrics and continuous operating im-provements as well as resilience against geopolitical events, Moody’s upgraded the corporate rating of ‘Ba2’ with a ‘positive outlook’ in February 2018.
TUI AG’s bond worth € 300.0 m has been assigned a ‘BB’ rating by Standard & Poor’s and a ‘Ba2’ rating by Moody’s. TUI AG’s syndi-cated credit facility worth € 1.75 bn is assigned a ‘BB’ rating by Standard & Poor’s.
Financial stability targets
TUI considers a stable credit rating to be a prerequisite for the further development of the business. In response to the structural improvements resulting from the merger between TUI AG and TUI Travel and the operating performance observed over the past few years, combined with a strengthening business model despite a challenging environment, Moody’s upgraded their TUI ratings with a ‘positive outlook’. We are seeking further improvements in the rating so as to ensure better access to the debt capital markets even in difficult macroeconomic situations, apart from achieving better financing terms and conditions. The financial stability ratios we have defined are leverage ratio and coverage ratio, based on the following basic definitions:
Leverage ratio = (gross financial liabilities + discounted value of financial commitments from lease, rental and leasing agreements + defined-benefit obligations) / (reported EBITDA + long-term leasing and rental expenses); Coverage ratio = (reported EBITDA + long-term leasing and rental expenses) / (net interest expense + ⅓ of
long-term leasing and rental expenses). These basic definitions are subject to specific adjustments in order to reflect current circumstances. For the completed financial year, the leverage ratio was 2.7(x), while the coverage ratio was 6.7(x). We aim to achieve a leverage ratio between 3.00(x) and 2.25(x) and a coverage ratio between 5.75(x) and 6.75(x) for FY 2019.
See (37) Capital management in the Notes on page 239
Interest and financing environment
In the period under review, short-term interest rates remained at an extremely low level compared with historical rates. In some currency areas, the interest rate remained negative throughout the year, with corresponding impacts on returns from money market invest-ments but also on reference interest rates for floating-rate debt.
Quoted credit margins (CDS levels) for corporates in the sub- investment grade area remained almost flat year-on-year. Quota-tions remained on a persistently low level for TUI AG. Refinancing options were available against the backdrop of the receptive capital market environment, and TUI AG took advantage of this in July 2018 by issuing a Schuldschein worth € 425.0 m.
In the completed financial year, in addition to the issue of a Schuldschein worth € 425.0 m, sale-and-lease-back agreements were signed for seven new airplane. These include finance leases for one B787-8 and two B737-8 Max and operating lease agree-ments for one B787-9 and three B737-8 Max.

79COMBI NE D M A N AGE ME N T R E P O R T » BU S I Ne S S r e V Ie w
Liquidity analysis
L I Q U I D I T Y R E S E R V E
In the completed financial year, TUI Group’s solvency was secured at all times by means of cash inflows from operating activities, liquid funds, and bilateral and syndicated credit agreements with banks.
At the balance sheet date, TUI AG, the parent company of TUI Group, held cash and cash equivalents worth € 889.3 m.
R E S T R I C T I O N S O N T H E T R A N S F E R O F L I Q U I D F U N D S
At the balance sheet date, there were restrictions worth around € 0.2 bn on the transfer of liquid funds within the Group that might significantly impact the Group’s liquidity, such as restrictions on capital movements and restrictions due to credit agreements concluded.
C H A N G E O F CO N T R O L
Significant agreements taking effect in the event of a change of control due to a takeover bid are outlined in the chapter on Infor-mation required under takeover law.
See chapter Information required under takeover law
Cash flow statement
Summary cash flow statement
€ million 2018 2017
Net cash inflow from operating activities + 1,150.9 + 1,583.1
Net cash outflow from investing activities – 845.7 – 687.7
Net cash outflow from financing activities – 236.9 – 733.8
Change in cash and cash equivalents
with cash effects + 68.3 + 161.6
The cash flow statement shows the flow of cash and cash equivalents with cash inflows and outflows presented separately for operating, investing and financing activities. The effects of changes in the group of consolidated companies are eliminated. The prior year’s cash flow statement shows the flow of cash and cash equivalents for the continuing and discontinued operations.
In the period under review, cash and cash equivalents rose by € 31.9 m to € 2,548.0 m.
N E T C A S H I N F L O W F R O M O P E R AT I N G AC T I V I T I E S
In the financial year under review, the cash inflow from operating activities amounted to € 1,150.9 m (previous year € 1,583.1 m). The
year-on-year decrease on a positive operating performance was mainly driven by a lower increase in working capital year-on-year as well as a higher one-off payment to pension funds in the UK.
N E T C A S H O U T F L O W F R O M I N V E S T I N G AC T I V I T I E S
In the financial year under review, the cash outflow from investing activities totalled € 845.7 m (previous year € 687.7 m). While the cash outflow for capital expenditure related to property, plant and equipment and financial investments amounted to € 956.2 m, the cash inflow from the sale of property, plant and equipment and financial investments stood at € 192.4 m. The cash outflow of € 135.6 m for the acquisition of consolidated companies almost exclusively relates to the Destination Experiences and Hotels & Resorts segments. The cash outflow for capital expenditure relat-ed to property, plant and equipment and intangible assets and the cash inflow from corresponding sales do not match the additions and disposals shown in the development of fixed assets, as these also include non-cash investments and disposals.
N E T C A S H O U T F L O W F R O M F I N A N C I N G AC T I V I T I E S
The cash outflow from financing activities totals € 236.9 m (previ-ous year € 733.8 m). TUI AG recorded an inflow of cash of € 422.9 m from the issue of an unsecured Schuldschein after deducting bor-rowing costs. TUI Group companies took out further financial lia-bilities worth € 11.3 m. A further cash outflow of € 162.7 m related to the redemption of financial liabilities, including € 106.5 m for finance lease obligations. An amount of € 110.8 m was used for interest payments, while a cash outflow of € 381.8 m related to dividend payments to TUI AG shareholders and a further outflow of € 53.5 m to dividend payments to minority shareholders.
Change in cash and cash equivalents
€ million 2018 2017
Cash and cash equivalents at the
beginning of period + 2,516.1 + 2,403.6
Changes due to changes in exchange rates – 36.4 – 49.1
Cash changes + 68.3 + 161.6
Cash and cash equivalents at the end
of period + 2,548.0 + 2,516.1
Cash and cash equivalents comprise all liquid funds, i. e. cash in hand, bank balances and cheques.
The detailed cash flow statement and additional explanations are provided in the consolidated financial statements and in the section Notes to the cash flow statement in the Notes to the consolidated financial statements.
See page 158 and 241
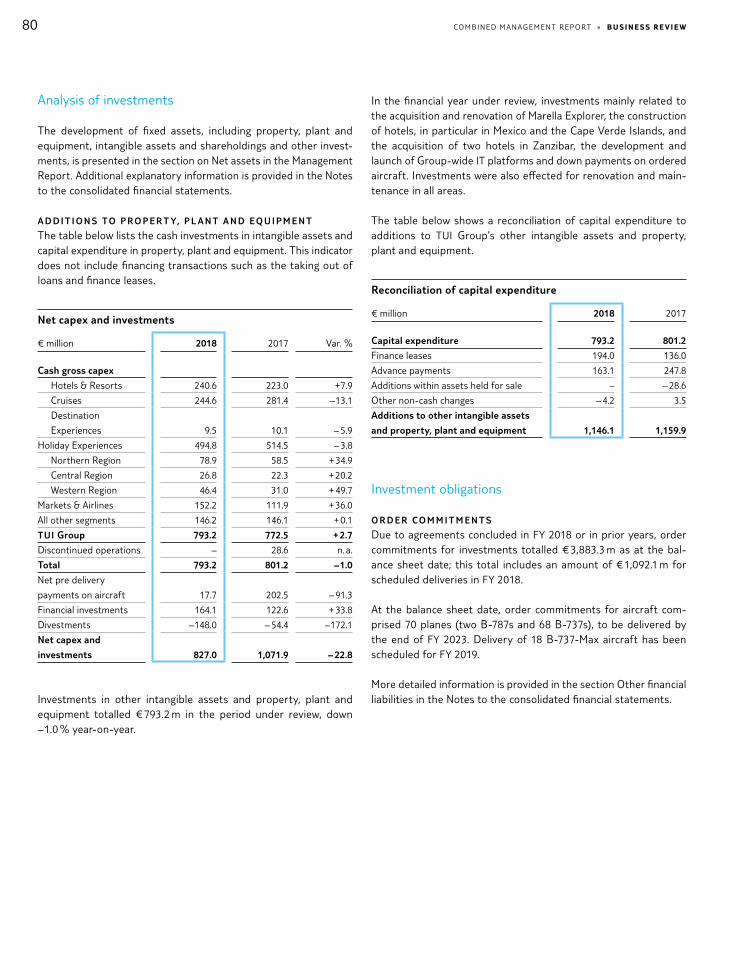
80 COMBI NE D M A N AGE ME N T R E P O R T » BU S I Ne S S r e V Ie w
Analysis of investments
The development of fixed assets, including property, plant and equipment, intangible assets and shareholdings and other invest-ments, is presented in the section on Net assets in the Management Report. Additional explanatory information is provided in the Notes to the consolidated financial statements.
A D D I T I O N S TO P R O P E R T Y, P L A N T A N D E Q U I P M E N T
The table below lists the cash investments in intangible assets and capital expenditure in property, plant and equipment. This indicator does not include financing transactions such as the taking out of loans and finance leases.
Net capex and investments
€ million 2018 2017 Var. %
Cash gross capex
Hotels & Resorts 240.6 223.0 + 7.9
Cruises 244.6 281.4 – 13.1
Destination
Experiences 9.5 10.1 – 5.9
Holiday Experiences 494.8 514.5 – 3.8
Northern Region 78.9 58.5 + 34.9
Central Region 26.8 22.3 + 20.2
Western Region 46.4 31.0 + 49.7
Markets & Airlines 152.2 111.9 + 36.0
All other segments 146.2 146.1 + 0.1
TUI Group 793.2 772.5 + 2.7
Discontinued operations – 28.6 n. a.
Total 793.2 801.2 – 1.0
Net pre delivery
payments on aircraft 17.7 202.5 – 91.3
Financial investments 164.1 122.6 + 33.8
Divestments – 148.0 – 54.4 – 172.1
Net capex and
investments 827.0 1,071.9 – 22.8
Investments in other intangible assets and property, plant and equipment totalled € 793.2 m in the period under review, down – 1.0 % year-on-year.
In the financial year under review, investments mainly related to the acquisition and renovation of Marella Explorer, the construction of hotels, in particular in Mexico and the Cape Verde Islands, and the acquisition of two hotels in Zanzibar, the development and launch of Group-wide IT platforms and down payments on ordered aircraft. Investments were also effected for renovation and main-tenance in all areas.
The table below shows a reconciliation of capital expenditure to additions to TUI Group’s other intangible assets and property, plant and equipment.
Reconciliation of capital expenditure
€ million 2018 2017
Capital expenditure 793.2 801.2
Finance leases 194.0 136.0
Advance payments 163.1 247.8
Additions within assets held for sale – – 28.6
Other non-cash changes – 4.2 3.5
Additions to other intangible assets
and property, plant and equipment 1,146.1 1,159.9
Investment obligations
O R D E R CO M M I T M E N T S
Due to agreements concluded in FY 2018 or in prior years, order commitments for investments totalled € 3,883.3 m as at the bal-ance sheet date; this total includes an amount of € 1,092.1 m for scheduled deliveries in FY 2018.
At the balance sheet date, order commitments for aircraft com-prised 70 planes (two B-787s and 68 B-737s), to be delivered by the end of FY 2023. Delivery of 18 B-737-Max aircraft has been scheduled for FY 2019.
More detailed information is provided in the section Other financial liabilities in the Notes to the consolidated financial statements.

81COMBI NE D M A N AGE ME N T R E P O R T » BU S I Ne S S r e V Ie w
Net financial position
From the H1 2018 interim report onwards, we have adjusted the definition of our net debt. While net debt had previously been cal-culated as the balance between current and non-current financial debt on the one hand and cash and cash equivalents on the other, from now on we also consider short-term interest-bearing invest-ments as deduction items. The majority of these investments have terms of three to six months. In accordance with IFRS regulations, these investments are not shown in the consolidated balance sheet as cash and cash equivalents but as current trade receivables and other assets. The adjustment had no effect on the previous year.
The net liquidity position of the continuing operations decreased by € 459.4 m year-on-year to € 123.6 m as at 30 September 2018.
The year-on-year reduction in the net liquidity position was primarily attributable to the reinvestment of gains on disposal received last year as well as higher touristic prepayments.
Net financial position
€ million 30 Sep 2018 30 Sep 2017 Var. %
Financial debt 2,442.9 1,933.1 + 26.4
Cash and cash
equivalents 2,548.0 2,516.1 + 1.3
Short-term interest-
bearing investments 18.5 – n. a.
Net cash 123.6 583.0 – 78.8

82 COMBI NE D M A N AGE ME N T R E P O R T » NoN - f I N A NC I A l De C l A r AT IoN
NON-FINANCIAL DECL AR ATION
pursuant to the CSR Directive Implementation Act
For TUI Group, economic, environmental and social sustainability is a fundamental management principle and a cornerstone of our strategy for continually enhancing the value of our company and beyond. We recognise that sustainable development is critical for long term economic success and we aspire to pioneer sustainable tourism across our sector.
In the following section we report on sustainability issues which support better understanding of our business’s operations, context and future development, in line with CSR reporting legislation. In compliance with Section 315b, paragraph 1, clause 3 German Commercial Code (HGB) we also refer to relevant aspects of non- financial disclosure found in other parts of the Group manage-ment report.
Within the framework of our materiality analysis we gained insight into the sustainability risks and opportunities. We did not identify any non-financial risks as defined by the CSR-RUG. In particular, we report on our risk management system and principle risks linked with our business activities, business relations and services in our Risk Report from page 40 on.
This non-financial Group statement has been reviewed by the Supervisory Board with regard to aspects of legality, regularity and relevance. Our reporting covers the United Nations Global Compact principles and we regularly review our activities against the United Nations Sustainable Development Goals (SDGs). The goals provide a useful framework with which to view our impact and the contributions we make to a better world. We see a special contribution towards seven of the SDGs – knowing these are also interdependent. A detailed mapping is published in our sus-tainability report.
Business model
TUI Group’s business model as defined in HGB section 289b is outlined from page 28 in the present Annual Report.

83COMBI NE D M A N AGE ME N T R E P O R T » NoN - f I N A NC I A l De C l A r AT IoN
Sustainability strategy and implementation
Our ‘Better Holidays, Better World’ 2015 – 2020 strategy is built around the following core pillars:
• Step lightly, where we commit to operate the most carbon- efficient airlines in Europe and cut the carbon intensity of our operations by 10 % by 2020.
• Make a difference, where we commit to deliver 10 m ‘greener and fairer’* holidays per year by 2020, enabling more local people to share in the benefits of tourism.
• Lead the way, where we commit to invest € 10 m per year by 2020, to support good causes and enhance the positive impacts of tourism, using the TUI Care Foundation to support this work.
• Care more, where we commit to achieve a colleague engagement score of over 80.
* Measured by the number of customers we take to hotels with credible sustainability certification – defined as those recognised or approved by the Global Sustainable Tourism Council (GSTC).
M AT E R I A L I T Y
TUI Group carried out a formal materiality assessment in FY 2018 involving a variety of stakeholder groups. Through a global stake-holder survey and an impact analysis, the most material aspects were identified and prioritized using recognized qualitative and quantitative methods. The graph below shows the major areas where TUI’s stakeholders would like us to focus even more com-mitment and engagement.
For our assessment, we identified the following key stakeholder groups
• Customers• Employees• Financial markets• Media• Non-Governmental Organisations• Politics• Science• Shareholders• Suppliers / Business Partners
TUI Sustainability Strategy 2020
Reducing the environmental impact of holidays
Creating positive change for people and communities
Pioneering sustainable tourism across the world
Building the best place to work where people are passionate about what they do
betterholidaysbetterworld TUI Sustainability Strategy 2020
Step lightly
Make a difference
Lead the way
Care more

84 COMBI NE D M A N AGE ME N T R E P O R T » NoN - f I N A NC I A l De C l A r AT IoN
Findings will now be discussed with senior management and help inform the development of TUI’s sustainability strategy for the next years.
M A N AG I N G S U S TA I N A B I L I T Y
Across TUI Group dedicated and experienced sustainability pro-fessionals work in close collaboration with senior management at Group and at divisional level to help ensure that TUI’s business and sustainability strategies are aligned. Our sustainability colleagues’ role is to drive uptake of more sustainable business practices across the TUI Group and along its supply chain, and to advise the TUI Care Foundation on destination project proposals and imple-mentation. On a regular basis the TUI Group Executive Committee is updated on our performance against the sustainability strategy and on material issues. Also sustainability is regularly on the agenda in divisional management boards, platform boards (i. e. hotels and aviation) and in the risk oversight committee.
As part of TUI’s sustainability management approach, the cor-porate headquarters has been successfully audited against the ISO 14001:2015 environmental standard.
Senior Management from across TUI regularly speak at a range of forums and conferences about the industry’s most material issues and TUI’s response to them. Furthermore sustainability is a key issue whenever we collaborate with destination governments and develop our growth strategy.
Materiality Matrix
ST
AK
EH
OL
DE
R P
ER
SP
EC
TIV
E R
EL
EV
AN
CE
& I
MP
AC
T
BUSINESS PERSPECTIVE RELEVANCE
12
34
5
67
89
10
11
Low Medium High
Low
Med
ium
Hig
h
1 Resource efficiency, sustainable procurement
2 Child protection3 Local value creation &
communities4 Emissions & pollution5 Forced labour6 Creating more sustainable
holidays & engaging customers
7 Fair business conduct8 Customer well-being9 Crisis management10 Colleague working
environment11 Animal welfare & biodiversity

85COMBI NE D M A N AGE ME N T R E P O R T » NoN - f I N A NC I A l De C l A r AT IoN
S U S TA I N A B I L I T Y I N D I C E S A N D AWA R D S
TUI AG is represented in the sustainability index FTSE4Good and on the Ethibel Investment Register. In 2018 TUI was included in the RobecoSam Sustainability Yearbook with a ‘Silver Class’ distinction. TUI participated again in the CDP Climate Change assessment 2018, results being announced in early 2019.
Throughout the year TUI companies have been recognized by a variety of awards. TUI Cruises was awarded in December 2017 with the EcoTrophea at the German Travel Association Awards. In January 2018 TUI fly Belgium won the Brussels Airport Environ-ment Award and in March 2018 TUI fly Germany, TUI Cruises, TUI Germany, Robinson Club and TUI Magic Life ranked high in a consumer research within the sustainability dimension undertaken by the Service Value and Focus in Germany.
G R O U P S U STA I N A B I L I T Y N E T W O R K
Sustainability Managers at head office, source markets and divisions: developing and
coordinating sustainability strategy and specific working groups
D I V I S I O N A L B O A R D S
Regular update presentations to Source Market, Tourism, Hotel & Airline boards
R I S K O V E R S I G H T CO M M I T T E E
Annual update to this committee and meetings with Group Risk Department at regular intervals
to review risk register
Managing sustainability-embedding
G R O U P E X E C U T I V E CO M M I T T E E
Minimum twice yearly agenda slot and update report

86 COMBI NE D M A N AGE ME N T R E P O R T » NoN - f I N A NC I A l De C l A r AT IoN
The environment
Respecting the environment in our products, services and processes is an essential feature of our quality standards. We place priority on improving carbon and resource efficiency. Conserving natural resources and mitigating negative environmental impacts are both in the interests of our business as as well as the future success of travel and tourism.
We face additional environmental challenges at a local level. Plastic waste, for example, is having a negative impact on destinations and ecosystems, especially in the oceans. Fresh water is also likely to become increasingly scarce in the coming years in some destinations.
Tackling climate change is an urgent global challenge. The goal of the Paris Agreement to limit global warming to below 2°C above pre-industrial levels is ambitious and requires that every industry makes a timely transition towards an energy-efficient, lower-carbon future. As a sector leader, TUI has a responsibility to play our part. Carbon emissions are one of the most significant environmental impacts of tourism. Travel and tourism contribute some 5 % (UNEP 2008) of global carbon emissions – half of which is attributable to aviation.
Our ‘Step lightly’ strategy therefore aims to reduce the environ-mental intensity of our operations and sets clear stretch targets for improvement across aviation, cruise, hotels, offices, retail shops and ground transport. TUI has implemented specific carbon reduction initiatives across the business – from airline and cruise efficiency programmes, to retail energy savings and the reduction of printed brochures.
• Our headline goal: We will operate Europe’s most carbon-efficient airlines and reduce the carbon intensity of our operations by 10 % by 2020 (Baseline year 2014)
Carbon dioxide emissions (CO2)
tons 2018 2017 Var. %
Airlines & Aviation 6,393,342 6,115,492 + 4.5
Cruises 850,335 815,582 + 4.3
Hotels 554,666 507,230 + 9.4
Major premises / shops 26,195 29,511 – 11.2
Ground Transport 16,782 15,388 + 9.1
Scope 3 (Other) 78,852 73,254 + 7.6
Group 7,920,172 7,556,457 + 4.8
In FY 2018, TUI Group’s total emissions increased year-on-year in absolute terms, primarly due to growth in its Airline & Aviation sector. The increase in absolute carbon emissions in Hotels is driven by the expansion of TUI’s hotel portfolio. Carbon emissions in Cruises increased by 4.3 % which was the result of the launch of the new Mein Schiff 1 (operated by TUI Cruises) and the first full year reporting of Mein Schiff 6.
Emissions from offices and retail shops significantly declined, mainly due to energy efficiency initiatives in the UK and Germany.
Energy usage by business area
MWh 2018 2017 Var. %
Airlines & Aviation 26,070,988 24,940,489 + 4.5
Cruises 3,227,813 3,077,062 + 4.9
Hotels 1,527,259 1,420,438 + 7.5
Major premises / shops 88,076 91,422 – 3.7
Ground transport 67,283 61,697 + 9.1
Total 30,981,419 29,591,108 + 4.7
E N E R G Y U S AG E BY B U S I N E S S A R E A
As part of TUI’s environmental reporting we have included a breakdown of energy usage by business area. Airlines and Aviation represents more than 84 % of the total energy used.
C L I M AT E P R O T E C T I O N A N D R E S O U R C E E F F I C I E N C Y
BY T U I A I R L I N E S
We already operate one of Europe’s most carbon-efficient airlines and we aim to continuously improve. TUI Airlines’ comparative performance was recognised in November 2017 by the independent climate protection organisation atmosfair, which ranked TUI Airways and TUI fly Germany #1 and #3 respectively as the most carbon- efficient airlines amongst the 200 largest airlines worldwide. TUI Airlines have numerous measures in place to further enhance carbon efficiency. We have implemented the following measures to support our efficiency goals:
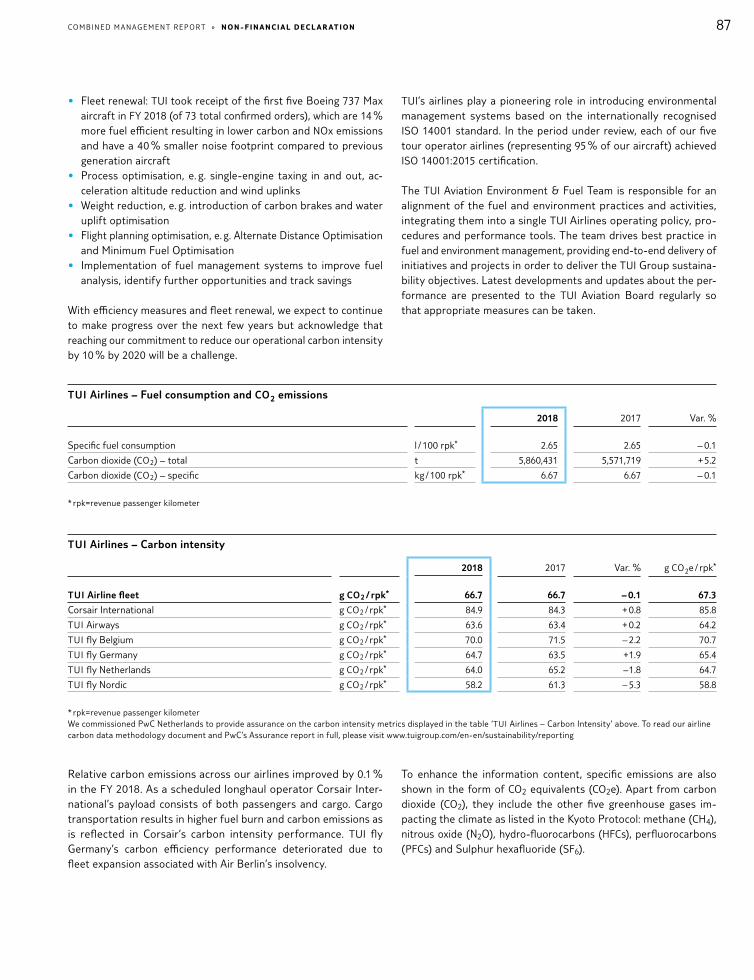
87COMBI NE D M A N AGE ME N T R E P O R T » NoN - f I N A NC I A l De C l A r AT IoN
• Fleet renewal: TUI took receipt of the first five Boeing 737 Max aircraft in FY 2018 (of 73 total confirmed orders), which are 14 % more fuel efficient resulting in lower carbon and NOx emissions and have a 40 % smaller noise footprint compared to previous generation aircraft
• Process optimisation, e. g. single-engine taxing in and out, ac-celeration altitude reduction and wind uplinks
• Weight reduction, e. g. introduction of carbon brakes and water uplift optimisation
• Flight planning optimisation, e. g. Alternate Distance Optimisation and Minimum Fuel Optimisation
• Implementation of fuel management systems to improve fuel analysis, identify further opportunities and track savings
With efficiency measures and fleet renewal, we expect to continue to make progress over the next few years but acknowledge that reaching our commitment to reduce our operational carbon intensity by 10 % by 2020 will be a challenge.
TUI’s airlines play a pioneering role in introducing environmental management systems based on the internationally recognised ISO 14001 standard. In the period under review, each of our five tour operator airlines (representing 95 % of our aircraft) achieved ISO 14001:2015 certification.
The TUI Aviation Environment & Fuel Team is responsible for an alignment of the fuel and environment practices and activities, integrating them into a single TUI Airlines operating policy, pro-cedures and performance tools. The team drives best practice in fuel and environment management, providing end-to-end delivery of initiatives and projects in order to deliver the TUI Group sustaina-bility objectives. Latest developments and updates about the per-formance are presented to the TUI Aviation Board regularly so that appropriate measures can be taken.
TUI Airlines – Fuel consumption and CO2 emissions
2018 2017 Var. %
Specific fuel consumption l / 100 rpk* 2.65 2.65 – 0.1
Carbon dioxide (CO2) – total t 5,860,431 5,571,719 + 5.2
Carbon dioxide (CO2) – specific kg / 100 rpk* 6.67 6.67 – 0.1
* rpk=revenue passenger kilometer
TUI Airlines – Carbon intensity
2018 2017 Var. % g CO2e / rpk*
TUI Airline fleet g CO2 / rpk* 66.7 66.7 – 0.1 67.3
Corsair International g CO2 / rpk* 84.9 84.3 + 0.8 85.8
TUI Airways g CO2 / rpk* 63.6 63.4 + 0.2 64.2
TUI fly Belgium g CO2 / rpk* 70.0 71.5 – 2.2 70.7
TUI fly Germany g CO2 / rpk* 64.7 63.5 + 1.9 65.4
TUI fly Netherlands g CO2 / rpk* 64.0 65.2 – 1.8 64.7
TUI fly Nordic g CO2 / rpk* 58.2 61.3 – 5.3 58.8
* rpk=revenue passenger kilometerWe commissioned PwC Netherlands to provide assurance on the carbon intensity metrics displayed in the table ‘TUI Airlines – Carbon Intensity’ above. To read our airline carbon data methodology document and PwC’s Assurance report in full, please visit www.tuigroup.com/en-en/sustainability/reporting
Relative carbon emissions across our airlines improved by 0.1 % in the FY 2018. As a scheduled longhaul operator Corsair Inter-national’s payload consists of both passengers and cargo. Cargo transportation results in higher fuel burn and carbon emissions as is reflected in Corsair’s carbon intensity performance. TUI fly Germany’s carbon efficiency performance deteriorated due to fleet expansion associated with Air Berlin’s insolvency.
To enhance the information content, specific emissions are also shown in the form of CO2 equivalents (CO2e). Apart from carbon dioxide (CO2), they include the other five greenhouse gases im-pacting the climate as listed in the Kyoto Protocol: methane (CH4), nitrous oxide (N2O), hydro-fluorocarbons (HFCs), perfluorocarbons (PFCs) and Sulphur hexafluoride (SF6).
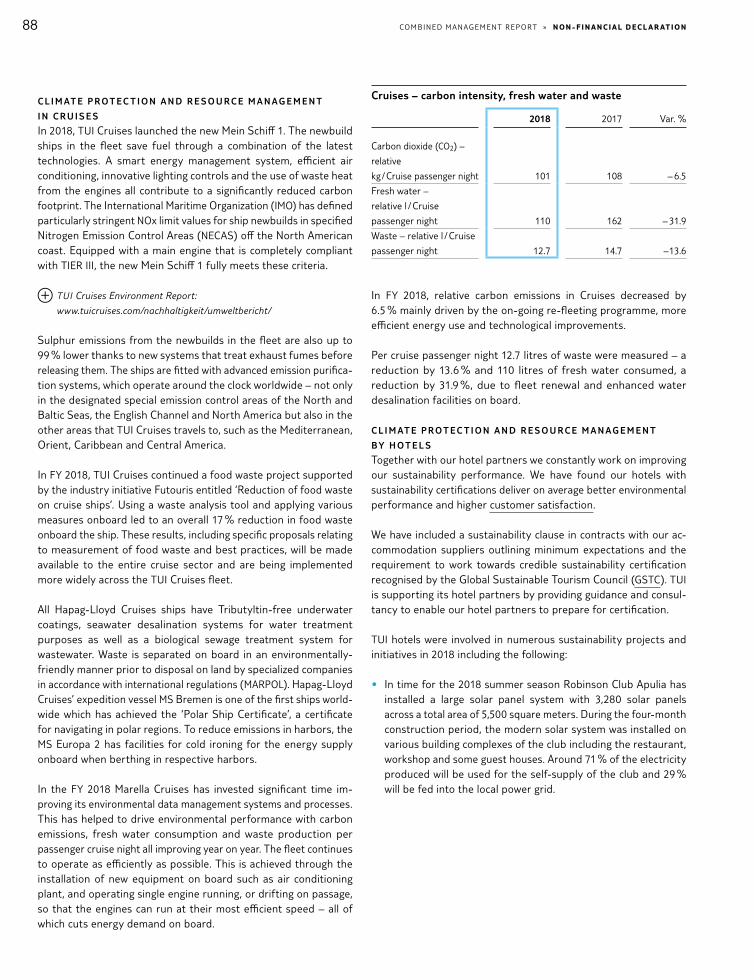
88 COMBI NE D M A N AGE ME N T R E P O R T » NoN - f I N A NC I A l De C l A r AT IoN
C L I M AT E P R O T E C T I O N A N D R E S O U R C E M A N AG E M E N T
I N C R U I S E S
In 2018, TUI Cruises launched the new Mein Schiff 1. The newbuild ships in the fleet save fuel through a combination of the latest technologies. A smart energy management system, efficient air conditioning, innovative lighting controls and the use of waste heat from the engines all contribute to a significantly reduced carbon footprint. The International Maritime Organization (IMO) has defined particularly stringent NOx limit values for ship newbuilds in specified Nitrogen Emission Control Areas (NECAS) off the North American coast. Equipped with a main engine that is completely compliant with TIER III, the new Mein Schiff 1 fully meets these criteria.
TUI Cruises Environment Report:
www.tuicruises.com/nachhaltigkeit/umweltbericht/
Sulphur emissions from the newbuilds in the fleet are also up to 99 % lower thanks to new systems that treat exhaust fumes before releasing them. The ships are fitted with advanced emission purifica-tion systems, which operate around the clock worldwide – not only in the designated special emission control areas of the North and Baltic Seas, the English Channel and North America but also in the other areas that TUI Cruises travels to, such as the Mediterranean, Orient, Caribbean and Central America.
In FY 2018, TUI Cruises continued a food waste project supported by the industry initiative Futouris entitled ‘Reduction of food waste on cruise ships’. Using a waste analysis tool and applying various measures onboard led to an overall 17 % reduction in food waste onboard the ship. These results, including specific proposals relating to measurement of food waste and best practices, will be made available to the entire cruise sector and are being implemented more widely across the TUI Cruises fleet.
All Hapag-Lloyd Cruises ships have Tributyltin-free underwater coatings, seawater desalination systems for water treatment purposes as well as a biological sewage treatment system for wastewater. Waste is separated on board in an environmentally- friendly manner prior to disposal on land by specialized companies in accordance with international regulations (MARPOL). Hapag-Lloyd Cruises’ expedition vessel MS Bremen is one of the first ships world-wide which has achieved the ‘Polar Ship Certificate’, a certificate for navigating in polar regions. To reduce emissions in harbors, the MS Europa 2 has facilities for cold ironing for the energy supply onboard when berthing in respective harbors.
In the FY 2018 Marella Cruises has invested significant time im-proving its environmental data management systems and processes. This has helped to drive environmental performance with carbon emissions, fresh water consumption and waste production per passenger cruise night all improving year on year. The fleet continues to operate as efficiently as possible. This is achieved through the installation of new equipment on board such as air conditioning plant, and operating single engine running, or drifting on passage, so that the engines can run at their most efficient speed – all of which cuts energy demand on board.
Cruises – carbon intensity, fresh water and waste
2018 2017 Var. %
Carbon dioxide (CO2) –
relative
kg / Cruise passenger night 101 108 – 6.5
Fresh water –
relative l / Cruise
passenger night 110 162 – 31.9
Waste – relative l / Cruise
passenger night 12.7 14.7 – 13.6
In FY 2018, relative carbon emissions in Cruises decreased by 6.5 % mainly driven by the on-going re-fleeting programme, more efficient energy use and technological improvements.
Per cruise passenger night 12.7 litres of waste were measured – a reduction by 13.6 % and 110 litres of fresh water consumed, a reduction by 31.9 %, due to fleet renewal and enhanced water desalination facilities on board.
C L I M AT E P R O T E C T I O N A N D R E S O U R C E M A N AG E M E N T
BY H O T E L S
Together with our hotel partners we constantly work on improving our sustainability performance. We have found our hotels with sustainability certifications deliver on average better environmental performance and higher customer satisfaction.
We have included a sustainability clause in contracts with our ac-commodation suppliers outlining minimum expectations and the requirement to work towards credible sustainability certification recognised by the Global Sustainable Tourism Council (GSTC). TUI is supporting its hotel partners by providing guidance and consul-tancy to enable our hotel partners to prepare for certification.
TUI hotels were involved in numerous sustainability projects and initiatives in 2018 including the following:
• In time for the 2018 summer season Robinson Club Apulia has installed a large solar panel system with 3,280 solar panels across a total area of 5,500 square meters. During the four-month construction period, the modern solar system was installed on various building complexes of the club including the restaurant, workshop and some guest houses. Around 71 % of the electricity produced will be used for the self-supply of the club and 29 % will be fed into the local power grid.
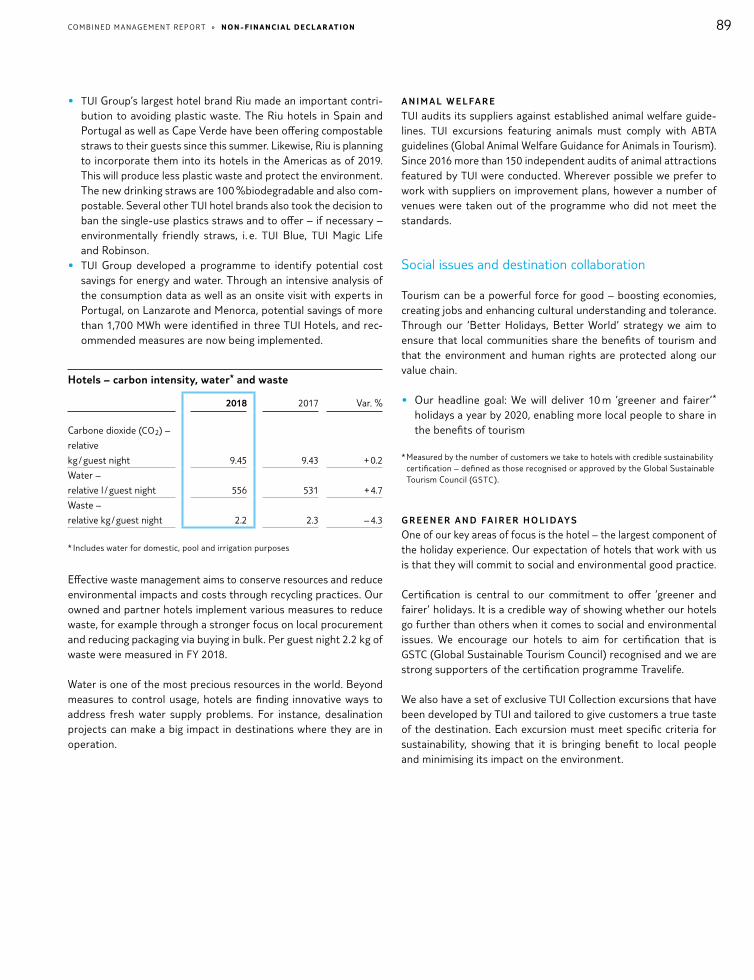
89COMBI NE D M A N AGE ME N T R E P O R T » NoN - f I N A NC I A l De C l A r AT IoN
• TUI Group’s largest hotel brand Riu made an important contri-bution to avoiding plastic waste. The Riu hotels in Spain and Portugal as well as Cape Verde have been offering compostable straws to their guests since this summer. Likewise, Riu is planning to incorporate them into its hotels in the Americas as of 2019. This will produce less plastic waste and protect the environment. The new drinking straws are 100 %biodegradable and also com-postable. Several other TUI hotel brands also took the decision to ban the single-use plastics straws and to offer – if necessary – environmentally friendly straws, i. e. TUI Blue, TUI Magic Life and Robinson.
• TUI Group developed a programme to identify potential cost savings for energy and water. Through an intensive analysis of the consumption data as well as an onsite visit with experts in Portugal, on Lanzarote and Menorca, potential savings of more than 1,700 MWh were identified in three TUI Hotels, and rec-ommended measures are now being implemented.
Hotels – carbon intensity, water* and waste
2018 2017 Var. %
Carbone dioxide (CO2) –
relative
kg / guest night 9.45 9.43 + 0.2
Water –
relative l / guest night 556 531 + 4.7
Waste –
relative kg / guest night 2.2 2.3 – 4.3
* Includes water for domestic, pool and irrigation purposes
Effective waste management aims to conserve resources and reduce environmental impacts and costs through recycling practices. Our owned and partner hotels implement various measures to reduce waste, for example through a stronger focus on local procurement and reducing packaging via buying in bulk. Per guest night 2.2 kg of waste were measured in FY 2018.
Water is one of the most precious resources in the world. Beyond measures to control usage, hotels are finding innovative ways to address fresh water supply problems. For instance, desalination projects can make a big impact in destinations where they are in operation.
A N I M A L W E L FA R E
TUI audits its suppliers against established animal welfare guide-lines. TUI excursions featuring animals must comply with ABTA guidelines (Global Animal Welfare Guidance for Animals in Tourism). Since 2016 more than 150 independent audits of animal attractions featured by TUI were conducted. Wherever possible we prefer to work with suppliers on improvement plans, however a number of venues were taken out of the programme who did not meet the standards.
Social issues and destination collaboration
Tourism can be a powerful force for good – boosting economies, creating jobs and enhancing cultural understanding and tolerance. Through our ‘Better Holidays, Better World’ strategy we aim to ensure that local communities share the benefits of tourism and that the environment and human rights are protected along our value chain.
• Our headline goal: We will deliver 10 m ’greener and fairer’* holidays a year by 2020, enabling more local people to share in the benefits of tourism
* Measured by the number of customers we take to hotels with credible sustainability certification – defined as those recognised or approved by the Global Sustainable Tourism Council (GSTC).
G R E E N E R A N D FA I R E R H O L I DAY S
One of our key areas of focus is the hotel – the largest component of the holiday experience. Our expectation of hotels that work with us is that they will commit to social and environmental good practice.
Certification is central to our commitment to offer ’greener and fairer’ holidays. It is a credible way of showing whether our hotels go further than others when it comes to social and environmental issues. We encourage our hotels to aim for certification that is GSTC (Global Sustainable Tourism Council) recognised and we are strong supporters of the certification programme Travelife.
We also have a set of exclusive TUI Collection excursions that have been developed by TUI and tailored to give customers a true taste of the destination. Each excursion must meet specific criteria for sustainability, showing that it is bringing benefit to local people and minimising its impact on the environment.
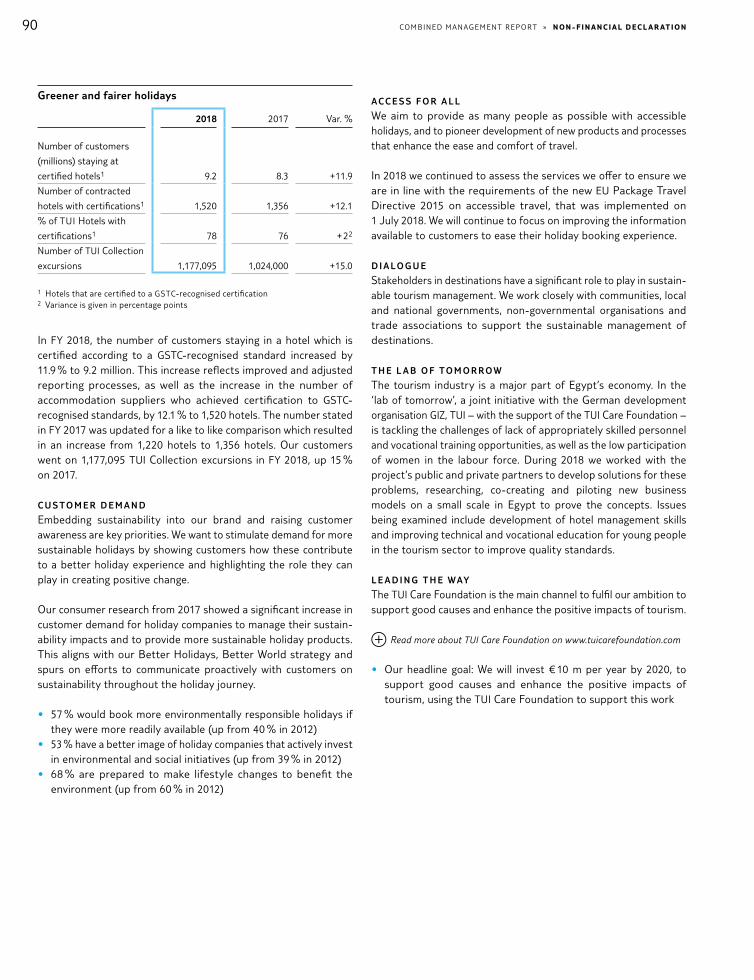
90 COMBI NE D M A N AGE ME N T R E P O R T » NoN - f I N A NC I A l De C l A r AT IoN
Greener and fairer holidays
2018 2017 Var. %
Number of customers
(millions) staying at
certified hotels 1 9.2 8.3 + 11.9
Number of contracted
hotels with certifications 1 1,520 1,356 + 12.1
% of TUI Hotels with
certifications 1 78 76 + 2 2
Number of TUI Collection
excursions 1,177,095 1,024,000 + 15.0
1 Hotels that are certified to a GSTC-recognised certification2 Variance is given in percentage points
In FY 2018, the number of customers staying in a hotel which is certified according to a GSTC-recognised standard increased by 11.9 % to 9.2 million. This increase reflects improved and adjusted reporting processes, as well as the increase in the number of accommodation suppliers who achieved certification to GSTC- recognised standards, by 12.1 % to 1,520 hotels. The number stated in FY 2017 was updated for a like to like comparison which resulted in an increase from 1,220 hotels to 1,356 hotels. Our customers went on 1,177,095 TUI Collection excursions in FY 2018, up 15 % on 2017.
C U S TO M E R D E M A N D
Embedding sustainability into our brand and raising customer awareness are key priorities. We want to stimulate demand for more sustainable holidays by showing customers how these contribute to a better holiday experience and highlighting the role they can play in creating positive change.
Our consumer research from 2017 showed a significant increase in customer demand for holiday companies to manage their sustain-ability impacts and to provide more sustainable holiday products. This aligns with our Better Holidays, Better World strategy and spurs on efforts to communicate proactively with customers on sustainability throughout the holiday journey.
• 57 % would book more environmentally responsible holidays if they were more readily available (up from 40 % in 2012)
• 53 % have a better image of holiday companies that actively invest in environmental and social initiatives (up from 39 % in 2012)
• 68 % are prepared to make lifestyle changes to benefit the environment (up from 60 % in 2012)
ACC E S S F O R A L L
We aim to provide as many people as possible with accessible holidays, and to pioneer development of new products and processes that enhance the ease and comfort of travel.
In 2018 we continued to assess the services we offer to ensure we are in line with the requirements of the new EU Package Travel Directive 2015 on accessible travel, that was implemented on 1 July 2018. We will continue to focus on improving the information available to customers to ease their holiday booking experience.
D I A L O G U E
Stakeholders in destinations have a significant role to play in sustain-able tourism management. We work closely with communities, local and national governments, non-governmental organisations and trade associations to support the sustainable management of destinations.
T H E L A B O F TO M O R R O W
The tourism industry is a major part of Egypt’s economy. In the ‘lab of tomorrow’, a joint initiative with the German development organisation GIZ, TUI – with the support of the TUI Care Foundation – is tackling the challenges of lack of appropriately skilled personnel and vocational training opportunities, as well as the low participation of women in the labour force. During 2018 we worked with the project’s public and private partners to develop solutions for these problems, researching, co-creating and piloting new business models on a small scale in Egypt to prove the concepts. Issues being examined include development of hotel management skills and improving technical and vocational education for young people in the tourism sector to improve quality standards.
L E A D I N G T H E WAY
The TUI Care Foundation is the main channel to fulfil our ambition to support good causes and enhance the positive impacts of tourism.
Read more about TUI Care Foundation on www.tuicarefoundation.com
• Our headline goal: We will invest € 10 m per year by 2020, to support good causes and enhance the positive impacts of tourism, using the TUI Care Foundation to support this work
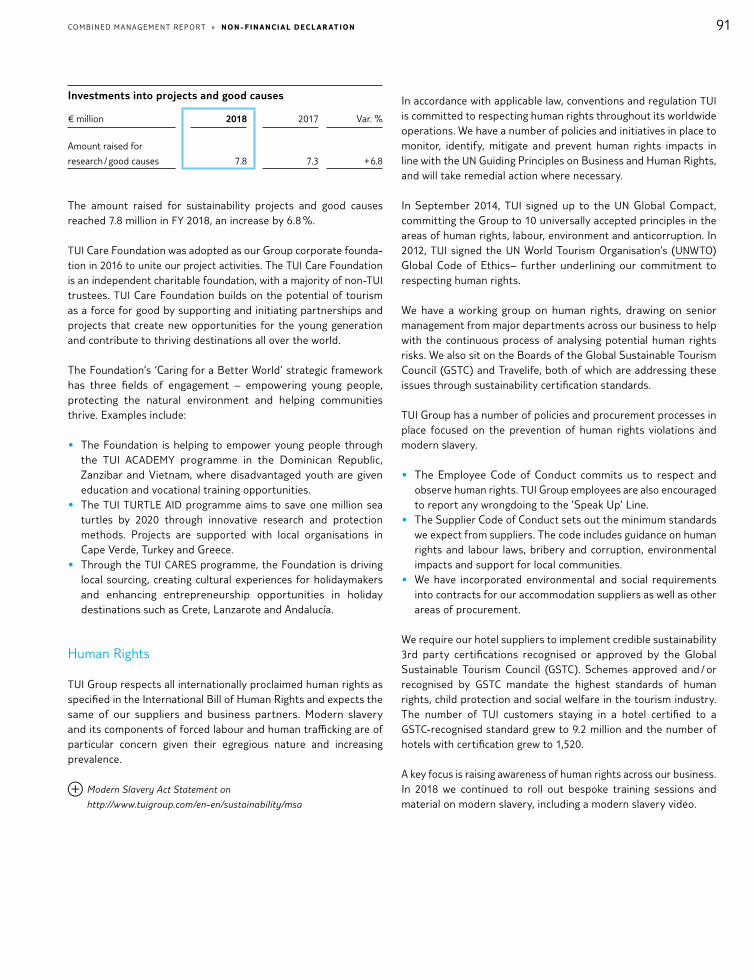
91COMBI NE D M A N AGE ME N T R E P O R T » NoN - f I N A NC I A l De C l A r AT IoN
Investments into projects and good causes
€ million 2018 2017 Var. %
Amount raised for
research / good causes 7.8 7.3 + 6.8
The amount raised for sustainability projects and good causes reached 7.8 million in FY 2018, an increase by 6.8 %.
TUI Care Foundation was adopted as our Group corporate founda-tion in 2016 to unite our project activities. The TUI Care Foundation is an independent charitable foundation, with a majority of non-TUI trustees. TUI Care Foundation builds on the potential of tourism as a force for good by supporting and initiating partnerships and projects that create new opportunities for the young generation and contribute to thriving destinations all over the world.
The Foundation’s ‘Caring for a Better World’ strategic framework has three fields of engagement – empowering young people, protecting the natural environment and helping communities thrive. Examples include:
• The Foundation is helping to empower young people through the TUI ACADEMY programme in the Dominican Republic, Zanzibar and Vietnam, where disadvantaged youth are given education and vocational training opportunities.
• The TUI TURTLE AID programme aims to save one million sea turtles by 2020 through innovative research and protection methods. Projects are supported with local organisations in Cape Verde, Turkey and Greece.
• Through the TUI CARES programme, the Foundation is driving local sourcing, creating cultural experiences for holidaymakers and enhancing entrepreneurship opportunities in holiday destinations such as Crete, Lanzarote and Andalucía.
Human Rights
TUI Group respects all internationally proclaimed human rights as specified in the International Bill of Human Rights and expects the same of our suppliers and business partners. Modern slavery and its components of forced labour and human trafficking are of particular concern given their egregious nature and increasing prevalence.
Modern Slavery Act Statement on
http://www.tuigroup.com/en-en/sustainability/msa
In accordance with applicable law, conventions and regulation TUI is committed to respecting human rights throughout its worldwide operations. We have a number of policies and initiatives in place to monitor, identify, mitigate and prevent human rights impacts in line with the UN Guiding Principles on Business and Human Rights, and will take remedial action where necessary.
In September 2014, TUI signed up to the UN Global Compact, committing the Group to 10 universally accepted principles in the areas of human rights, labour, environment and anticorruption. In 2012, TUI signed the UN World Tourism Organisation’s (UNWTO) Global Code of Ethics– further underlining our commitment to respecting human rights.
We have a working group on human rights, drawing on senior management from major departments across our business to help with the continuous process of analysing potential human rights risks. We also sit on the Boards of the Global Sustainable Tourism Council (GSTC) and Travelife, both of which are addressing these issues through sustainability certification standards.
TUI Group has a number of policies and procurement processes in place focused on the prevention of human rights violations and modern slavery.
• The Employee Code of Conduct commits us to respect and observe human rights. TUI Group employees are also encouraged to report any wrongdoing to the ’Speak Up’ Line.
• The Supplier Code of Conduct sets out the minimum standards we expect from suppliers. The code includes guidance on human rights and labour laws, bribery and corruption, environmental impacts and support for local communities.
• We have incorporated environmental and social requirements into contracts for our accommodation suppliers as well as other areas of procurement.
We require our hotel suppliers to implement credible sustainability 3rd party certifications recognised or approved by the Global Sustainable Tourism Council (GSTC). Schemes approved and / or recognised by GSTC mandate the highest standards of human rights, child protection and social welfare in the tourism industry. The number of TUI customers staying in a hotel certified to a GSTC-recognised standard grew to 9.2 million and the number of hotels with certification grew to 1,520.
A key focus is raising awareness of human rights across our business. In 2018 we continued to roll out bespoke training sessions and material on modern slavery, including a modern slavery video.

92 COMBI NE D M A N AGE ME N T R E P O R T » NoN - f I N A NC I A l De C l A r AT IoN
Over 4,600 TUI Destination Experiences colleagues completed child protection training in 2018. An e-learning module on modern slavery was developed and cascaded by Destination Experiences in 2018 and over 82 % of customer-facing colleagues have completed it. Airline crew in the UK and Nordics receive Vulnerable Children & Trafficking Training during their inductions, where they learn about how to spot trafficking and what to do. Other TUI airlines are in the process of rolling out similar trainings.
TUI Group supports a number of projects and partnerships to protect human rights in our destinations. We raise awareness of modern slavery at TUI hotel partner conferences and support Travelife with road shows. We co-organised hotelier seminars in Thailand with Travelife in April 2018 to discuss modern slavery and influence more hotels to reach sustainability certification standards.
TUI Care Foundation supports a number of projects which protect human rights. In 2018 the Foundation expanded the TUI Academy programme by launching one in Hue, Vietnam. The project is provid-ing education and training to help young vulnerable street workers improve their lives, including providing 350 young people with vocational training. Some 180 street workers will take part in hospitality training in a social enterprise training restaurant being set up in Hue city.
Our employees
Qualified and engaged employees are a major prerequisite for TUI’s long-term success as a leading tourism company. Seeking to recruit, develop and retain the best talents, we therefore adopted a sustainable HR strategy in 2016 designed to make us ‘The best company to work for’. It consists of five core strategic ar eas: Engagement, Leadership, People Development, Organisational Effectiveness and HR Function Development. Within these areas, we have launched 15 strategic projects in total, pursuing them further in the period under review. Thereby we also aim to embed our vision ‘Think Travel. Think TUI.’ and our corporate values ‘Trusted’, ‘Unique’ and ‘Inspiring’ further in our employees’ day-to-day activities.
The Supervisory Board and management are regularly briefed about the implementation status of our HR strategy and the strategic projects. In the completed financial year, we continued to establish an efficient project reporting process, and we intend to build on this further. Beyond that, the definition of KPIs as a control tool will enable us to measure the progress of projects and to depict their sustainability more comprehensively.
Digital transformation is increasingly important for TUI. On the one hand, the provision of products and services to meet our customers’ needs and preferences changes. On the other hand, digitisation also creates technical, cultural and organisational challenges for our employees. Economic and social interdependen-cies are becoming more complex and technological networks more extensive. At the same time, this development also creates the opportunity for our employees to structure their working and private lifes in a manner more in line with their needs. TUI and the Group Works Council are seeking to actively address these requirements and the permanent change taking place in the world of work so as to shape the future together. The policy paper ‘newWork@TUI’, agreed this year, provides the necessary framework and milestones for the journey through digital transformation.
In order to support our goal to become more digital in HR, we have launched the Group-wide HR cloud solution TUI People. It will support us in our employee recruitment, performance reviews, development and retention activities in the long term. Thus, TUI People makes an essential contribution to securing our Company’s competitiveness and the personal development of our employees. In October 2017, we successfully launched the first out of a total of five modules, ‘Performance & Talent Management’, as a pilot project in seven German Group companies. With the start of the new financial year, this module will be rolled out in additional source markets and other German Group companies to support the Group-wide ‘Great Place to Grow’ process. The other modules will be successively implemented in 2019.
C A R E M O R E
We are seeking to be an attractive employer encouraging employees to engage with passion and personality. With ‘Care more’, the fourth pillar of our ‘Better Holidays, Better World’ initiative, our employees are an integral and crucial part of our sustainability strategy. After all, they make TUI the number one in the tourism sector and their satisfaction, engagement and personal development are a key prerequisite for our sustained success. Our goal is to achieve a colleague engagement score of over 80 by 2020 in order to be among the Top 25 global companies. This goal also forms the framework for the implementation of our strategic HR projects.
H R S T R AT E G Y P R OJ E C T S
T U I G E T H E R E M P LOY E E S U R V E Y
TUIgether is TUI’s employee survey, operated in partnership with an independent employee engagement research institute. Now well-established after 3 annual survey cycles from 2015 onward, this year taking account of leadership and employee feedback, a decision was made to hold a Pulse survey.
93COMBI NE D M A N AGE ME N T R E P O R T » NoN - f I N A NC I A l De C l A r AT IoN
The Pulse survey was positioned as an interim ‘health check’ of engagement, providing leaders and teams across the Group a longer timeframe to implement and embed initiatives identified from 2017’s annual survey results. Survey participation scope and results reporting to team level were unchanged, yet a shorter questionnaire was adopted. A further annual survey is planned in 2019, utilising the full question set, when teams and businesses across TUI will be able to assess the impact of their 2017 initiatives in depth.
The Pulse survey focused on our priority topics of Engagement, TUI’s VIBE leadership model – Vision, Inspire, Build Teams, Execute – and three questions assessing follow up process effectiveness.
Increasing digitisation is a common objective across TUI, and to align with that goal, an App, enabling participants to complete the survey via mobile phone or tablet, was trialled in specific populations this year. The App functionality also permits managers to download their team’s results report directly to their mobile phone or tablet if they wish. This is a great benefit, particularly for those managers with geographically dispersed teams who spend significant time travelling.
The TUI Group Engagement Index is 76 in 2018, 2 percentage points above our research institute’s Global norm. Compared to the score of 77 in 2017, it slightly decreased by 1. The overall VIBE leadership index was also stable with 72 compared to 73 in 2017. Furthermore, the sub-indices results of the 4 VIBE pillars have helped our senior leaders to identify appropriate focus areas for the year ahead.
With a participation rate of 75 % we almost achieved our goal of an 80 % response rate.
Clear and transparent results communications and an active involvement in follow up processes at all levels, underpin the TUIgether survey philosophy. There are many ways we deliver on these principles. The results and follow up phase starts with a presentation of the TUI Group overall results to the Group Execu-tive Committee. There is also a clear expectation towards the leaders at all levels to share the results with their own teams and co-create action plans based on the findings.
The inclusion of TUIgether on the Senior Leadership Team con-ference agenda also demonstrates the level of importance the Group Executive Committee places on TUIgether. Regular follow up at senior leadership meetings ensures momentum progressing initiatives is maintained throughout the year. The Supervisory Board also receives results presentations and updates over the course of the year. All these measures combine to set an appro-priate leadership focus on maximising benefit from the survey as a tool to help improve business performance and employee engagement.
Furthermore, the TUIgether results are communicated to our employees via different channels. The team results are communi-cated to the managers who share and discuss these together with their employees in workshops. The overall results are also published in our group intranet. In the course of the already established ‘TUIgether chats’, employees have the possibility to discuss with and raise questions directly to Board members. A new initiative is ‘TUIgether Heroes’. This campaign aims at raising awareness of specific actions taken at local business level and sharing best practices.
Our sustained commitment to TUIgether and delivering a trans-parent and comprehensive range of follow up activity has now established our employee survey as the principle instrument for receiving feedback and supporting continuous business improve-ment across TUI.
E M P LOY E R B R A N D I N G
By creating a uniform employer brand, TUI is seeking to position and establish itself as an attractive employer. The overall goal of our HR strategy, ‘The best company to work for’, provided the framework for developing and launching an employer branding campaign. With this campaign, we aim to attract and recruit the best talents. Our transformation into a more digital company characterised by stronger networking and integration, is reflected in the campaign by the active use of different digital channels and our homogeneous approach to job advertisements. Having been implemented in Germany in the prior financial year, the campaign was rolled out to other regions such as Western Region and TUI Destination Experiences in the period under review. It will shortly be extended to further countries.
O N E S H A R E
OneShare is another strategic project aimed at increasing employee engagement and loyalty. Participation in this programme offers employees around the world the opportunity to subscribe to shares from a joint employee share programme in the long term. The goal is to offer them an attractive investment opportunity while strengthening their identification with TUI. OneShare, launched in 2017 with a total of 18 countries, was successfully rolled out to six additional countries in the reporting period. In addition, the new ‘Golden Shares’ were offered for the first time in 2018. Every participant received 12 additional shares on top of their investment, regardless of the amount invested. In 2018, the rate of participation was 14.1 %, significantly exceeding the target of 10 %. This result reflects the high attractiveness of the offer for our employees.

94 COMBI NE D M A N AGE ME N T R E P O R T » NoN - f I N A NC I A l De C l A r AT IoN
P E O P L E D E V E L O P M E N T
Our success depends on qualified and engaged employees. People Development is therefore one of the key elements of TUI’s HR strategy. Within this area, we have launched a number of projects and programmes to develop specialists and executives in anticipation of future needs, increase diversity within the workforce and promote different career paths.
G R E AT P L AC E TO G R O W
A key milestone in People Development was the Group-wide establishment of the global performance and talent management approach ‘Great Place to Grow’, supported by the IT platform TUI People.
‘Great Place to Grow’ is a three-stage, structured dialogue process between managers and their employees. The first step is the annual planning process of individual goals and development opportunities for the new financial year. The mid- and the year-end dialogue serve to review the individual progress towards the goals and the employee’s current development. The dialogue focuses on the respective tasks and objectives, individual potentials and the implementation of TUI’s values in the employee’s day-to-day activities. Due to clear guidelines and definitions, ‘Great Place to Grow’ secures a uniform understanding of performance, potential and development perspectives, greater transparency and visibility of high potentials, and selective succession management.
The ‘Great Place to Grow’ annual cycle also includes the implemen-tation of ‘Talent Calibration Panels’. Within these, Executives and HR validate and calibrate jointly the performance and potential assessments of employees in their areas. The results achieved for each area also form the basis for the creation of a succession plan.
L E A R N I N G @T U I
TUI sees itself as a learning organisation. We provide regular training and learning sessions to offer our employees personal and technical development opportunities and prepare them for future tasks thoroughly. In order to enhance the dialogue between the companies and segments within TUI and to encourage people to learn from one another and with each other, we carried out a Group-wide Learning Week ‘newWork@TUI − TUI as a Learning Organisation’ in the established format. One of the key topics was digital transformation, which becomes increasingly important in the field of learning. Apart from numerous e-learnings and online training sessions, we also operate our TUI Academies, which offer online training programmes for selected areas. In addition to this, we provide individual, digital learning opportunities at the local level, e. g. online libraries and digital learning hubs.
In the new financial year, we will also launch the TUI People learning module. With this common platform based on state-of-the-art technology, ‘anytime, anywhere’ access and high-quality personal-ised, innovative and intuitive learning programmes, we are aiming to optimally qualify our employees and comprehensively support them in exercising their tasks. Moreover, the joint use of learning schemes delivers synergies and ensures compliance with specific legal requirements within the World of TUI.
S U CC E S S I O N P L A N N I N G & TA L E N T M A N AG E M E N T
Foreseeing succession planning is essential for the success of our Company. In order to secure succession for critical business functions and key roles in line with the respective demands, a specific succession plan for the top management levels was adopted this year. It sets out short-, medium- and long-term succession so that appropriate resources are available at any time if necessary. The status of succession planning is regularly reported to the Supervisory Board.
In order to secure and build a pipeline of specialist and leadership talent, TUI operates a number of programmes including the Group-wide ‘International Graduate Leadership Programme’ as well as already established global programmes like ‘Global High Performance Leadership’, ‘Perspectives’ and ‘Horizons’. In addition, a variety of measures are implemented at local level to develop expert and managerial skills.
I N T E R N AT I O N A L C A R E E R S / G LO B A L 3 6 0
TUI aims to foster international careers and promote employee mobility within the Group. Therefore, the ‘Global 60’ programme was initiated in 2016. Interested employees are given the opportu-nity to make their next career move in another country to gain international work experience, benefit from immersion in another culture and learn about TUI Group from a different perspective. The programme also aims to encourage managers to look beyond their own market when recruiting talents.
At the ‘Global 60 Conference’ held at the end of 2017, the partici-pants of the first ‘Global 60’ programme year met Executive Board members to discuss the pros and cons of international careers and to formulate recommendations for future programme development and ways to translate it into ‘business as usual’. One result of the conference was that the programme was renamed ‘Global 360’. The new name reflects TUI’s internationality and 360-degree view of international careers at all levels and in all functions of the organisation. It also reflects the diverse impacts of the project on culture, operations as well as on the exchange of experience between the source markets and different functions. Thus, the initiative also drives cultural change at TUI towards a more globalised world of work.
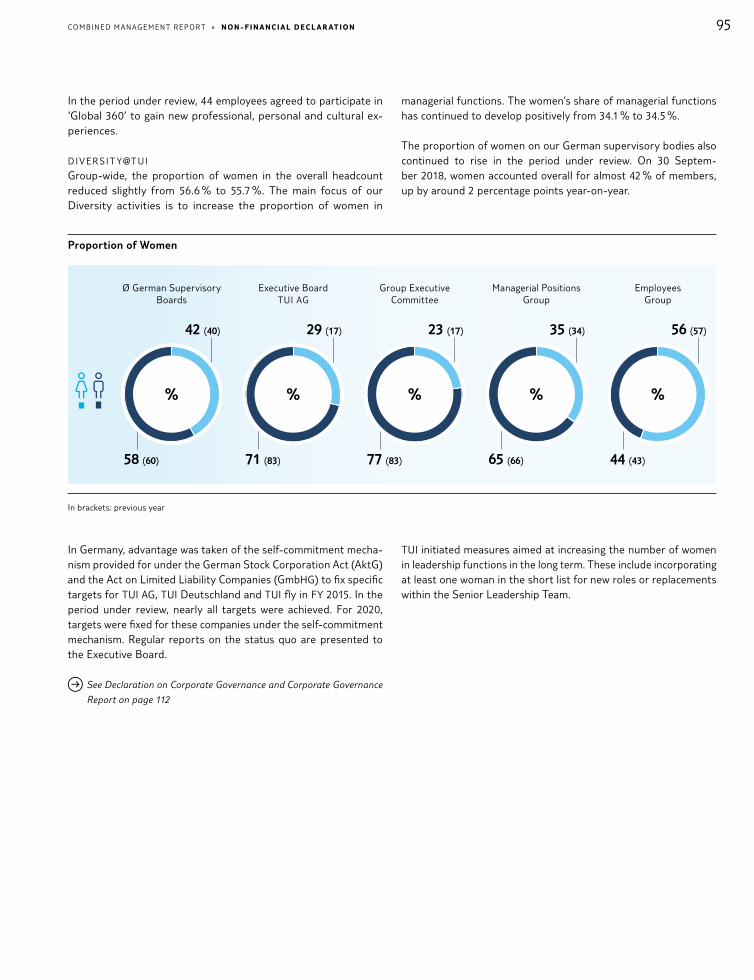
95COMBI NE D M A N AGE ME N T R E P O R T » NoN - f I N A NC I A l De C l A r AT IoN
In the period under review, 44 employees agreed to participate in ‘Global 360’ to gain new professional, personal and cultural ex-periences.
D I V E R S I T Y@T U I
Group-wide, the proportion of women in the overall headcount reduced slightly from 56.6 % to 55.7 %. The main focus of our Diversity activities is to increase the proportion of women in
managerial functions. The women’s share of managerial functions has continued to develop positively from 34.1 % to 34.5 %.
The proportion of women on our German supervisory bodies also continued to rise in the period under review. On 30 Septem-ber 2018, women accounted overall for almost 42 % of members, up by around 2 percentage points year-on-year.
In brackets: previous year
In Germany, advantage was taken of the self-commitment mecha-nism provided for under the German Stock Corporation Act (AktG) and the Act on Limited Liability Companies (GmbHG) to fix specific targets for TUI AG, TUI Deutschland and TUI fly in FY 2015. In the period under review, nearly all targets were achieved. For 2020, targets were fixed for these companies under the self-commitment mechanism. Regular reports on the status quo are presented to the Executive Board.
See Declaration on Corporate Governance and Corporate Governance
Report on page 112
TUI initiated measures aimed at increasing the number of women in leadership functions in the long term. These include incorporating at least one woman in the short list for new roles or replacements within the Senior Leadership Team.
Proportion of Women
71 (83)
29 (17)
Executive Board TUI AG
77 (83)
23 (17)
Group Executive Committee
65 (66)
35 (34)
Managerial Positions Group
44 (43)
56 (57)
Employees Group
58 (60)
42 (40)
Ø German Supervisory Boards
% % % % %
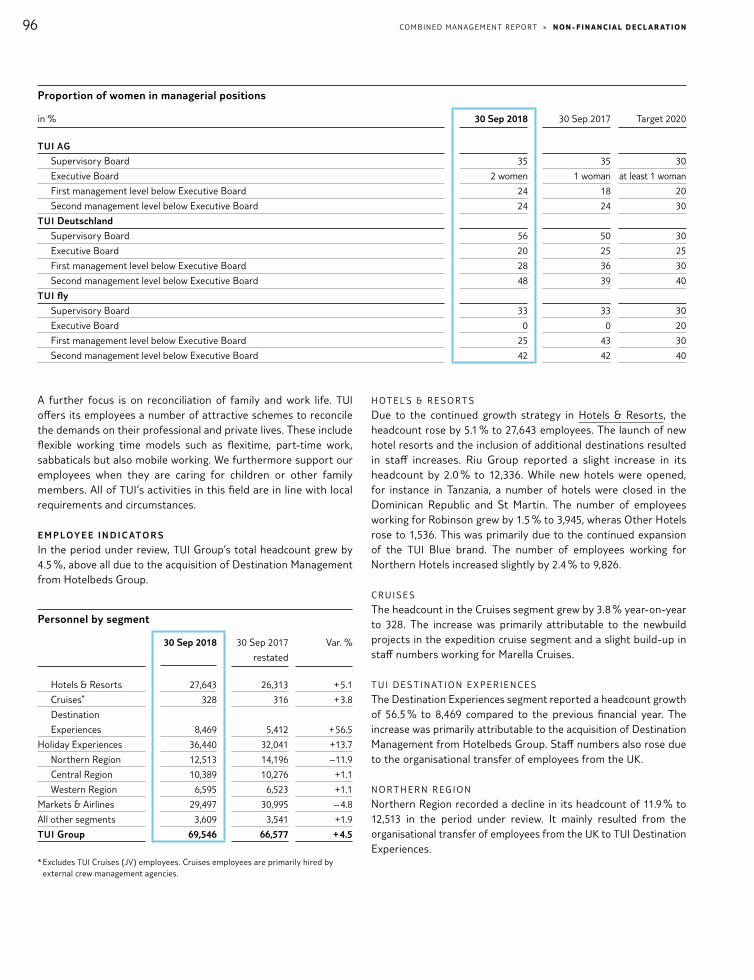
96 COMBI NE D M A N AGE ME N T R E P O R T » NoN - f I N A NC I A l De C l A r AT IoN
Proportion of women in managerial positions
in % 30 Sep 2018 30 Sep 2017 Target 2020
TUI AG
Supervisory Board 35 35 30
Executive Board 2 women 1 woman at least 1 woman
First management level below Executive Board 24 18 20
Second management level below Executive Board 24 24 30
TUI Deutschland
Supervisory Board 56 50 30
Executive Board 20 25 25
First management level below Executive Board 28 36 30
Second management level below Executive Board 48 39 40
TUI fly
Supervisory Board 33 33 30
Executive Board 0 0 20
First management level below Executive Board 25 43 30
Second management level below Executive Board 42 42 40
A further focus is on reconciliation of family and work life. TUI offers its employees a number of attractive schemes to reconcile the demands on their professional and private lives. These include flexible working time models such as flexitime, part-time work, sabbaticals but also mobile working. We furthermore support our employees when they are caring for children or other family members. All of TUI’s activities in this field are in line with local requirements and circumstances.
E M P L OY E E I N D I C ATO R S
In the period under review, TUI Group’s total headcount grew by 4.5 %, above all due to the acquisition of Destination Management from Hotelbeds Group.
Personnel by segment
30 Sep 2018 30 Sep 2017
restated
Var. %
Hotels & Resorts 27,643 26,313 + 5.1
Cruises* 328 316 + 3.8
Destination
Experiences 8,469 5,412 + 56.5
Holiday Experiences 36,440 32,041 + 13.7
Northern Region 12,513 14,196 – 11.9
Central Region 10,389 10,276 + 1.1
Western Region 6,595 6,523 + 1.1
Markets & Airlines 29,497 30,995 – 4.8
All other segments 3,609 3,541 + 1.9
TUI Group 69,546 66,577 + 4.5
* Excludes TUI Cruises (JV) employees. Cruises employees are primarily hired by external crew management agencies.
H OT E L S & R E S O R T S
Due to the continued growth strategy in Hotels & Resorts, the headcount rose by 5.1 % to 27,643 employees. The launch of new hotel resorts and the inclusion of additional destinations resulted in staff increases. Riu Group reported a slight increase in its headcount by 2.0 % to 12,336. While new hotels were opened, for instance in Tanzania, a number of hotels were closed in the Dominican Republic and St Martin. The number of employees working for Robinson grew by 1.5 % to 3,945, wheras Other Hotels rose to 1,536. This was primarily due to the continued expansion of the TUI Blue brand. The number of employees working for Northern Hotels increased slightly by 2.4 % to 9,826.
C R U I S E S
The headcount in the Cruises segment grew by 3.8 % year-on-year to 328. The increase was primarily attributable to the newbuild projects in the expedition cruise segment and a slight build-up in staff numbers working for Marella Cruises.
T U I D E S T I N AT I O N E X P E R I E N C E S
The Destination Experiences segment reported a headcount growth of 56.5 % to 8,469 compared to the previous financial year. The increase was primarily attributable to the acquisition of Destination Management from Hotelbeds Group. Staff numbers also rose due to the organisational transfer of employees from the UK.
N O R T H E R N R E G I O N
Northern Region recorded a decline in its headcount of 11.9 % to 12,513 in the period under review. It mainly resulted from the organisational transfer of employees from the UK to TUI Destination Experiences.

97COMBI NE D M A N AGE ME N T R E P O R T » NoN - f I N A NC I A l De C l A r AT IoN
C E N T R A L R E G I O N
The headcount in Central Region was almost flat year-on-year at 10,389 as at the balance sheet date. In Germany and Austria, staffing numbers remained more or less constant. Switzerland reported a slight increase in its headcount to 509 employees. Due to the opening of new shops, staff numbers rose, in particular in Poland, which recorded an increase to 671 employees.
W E S T E R N R E G I O N
Compared to the previous financial year, the headcount in Western Region grew by 1.1 % to 6,595. Staffing numbers rose in the Nether-land airline and Belgium airline. On the other hand, the number of employees working in France decreased.
A L L OT H E R S E G M E N T S
At 3,609 employees, the headcount in the category All Other Segments was nearly flat year-on-year. The number of employees working for the Corporate Centre rose by 9.3 % to 317, above all as new functions were built up. The number of employees working for Head Office functions in the UK grew by 4.5 % to 299. Due to organisational changes in India, Future Markets reduced its headcount by 21.1 % to 359.
Personnel by region*
30 Sep 2018 30 Sep 2017 Var. %
Germany 10,345 10,274 + 0.7
Great Britain 11,770 13,354 – 11.9
Spain 9,952 9,607 + 3.6
Other EU 22,594 20,911 + 8.0
North and South America 5,005 4,535 + 10.4
Other regions 9,880 7,896 + 25.1
TUI Group 69,546 66,577 + 4.5
* By domicile of company
At 79 %, the majority of our employees are employed in Europe. The reported decline of employees in Great Britain to 17 % is mainly attributable to an organisational transfer of employees to TUI Destination Experiences. The number of employees working in Germany amounted to around 15 %, followed by Spain with around 14 %.
Due to the acquisition of Destination Management from Hotelbeds Group, TUI operates in 11 additional countries. This particularly explains the increase of employees outside Europe.
Other employee indicators
TUI Group Germany
in % 30 Sep 2018 30 Sep 2017 30 Sep 2018 30 Sep 2017
Employment structure
Number of employees 69,546 66,577 10,345 10,274
Employees, female 55.7 56.6 68.4 68.4
Females in managerial positions 34.5 34.1 35.4 33.9
Employees in part-time, total 16.4 17.3 38.8 37.9
Employees in part-time, female 25.6 26.2 49.1 47.8
Employees, fixed-term employment contract 28.4 30.0 12.7 14.2
Age structure
Employees up to 20 years 4.8 5.1 2.8 3.1
Employees 21 – 30 years 29.3 30.1 19.6 20.1
Employees 31 – 40 years 26.6 26.4 22.3 22.9
Employees 41 – 50 years 23.8 23.7 30.1 30.8
Employees more than 50 years 15.5 14.7 25.2 23.1
Company affiliation
up to 5 years 55.7 54.0 34.1 33.6
6 – 10 years 13.9 14.9 11.7 12.8
11 – 20 years 20.4 20.8 30.2 30.8
21 – 30 years 8.0 8.3 19.1 17.9
more than 30 years 2.0 2.0 4.9 4.9
Vocational training in Germany
Number of trainees – – 565 571
Trainees, female – – 77.5 79.0
Training rate – – 5.5 5.6
Number of trainees gained certification in finanical year – – 190 193
Hiring rate – – 71.6 73.1

98 COMBI NE D M A N AGE ME N T R E P O R T » NoN - f I N A NC I A l De C l A r AT IoN
Personnel costs
€ million 2018 2017 Var. %
Wages and salaries 1,982.3 1,896.4 + 4.5
Social security
contributions 299.7 293.0 + 2.3
Pension costs 154.3 167.6 – 7.9
Total 2,436.3 2,357.0 + 3.4
The pay package offered by TUI Group is made up of various components, reflecting the framework conditions in different countries and companies. It also reflects the appropriateness of remuneration and customary market rates. Depending on the function concerned, a fixed basic salary may go hand in hand with variable components. TUI Group uses these variable factors to honour individual performance and to enable employees to partici-pate in the Company’s strategic and long-term success. Moreover, senior management have share options and are thus able to benefit directly when the Company grows in value.
In the period under review, TUI Group’s personnel costs increased by 3.4 % to € 2,436 m. The year-on-year increase in expenses for wages and salaries was mainly attributable to higher staff numbers in operating areas as well as pay rises.
O T H E R H R A R E A S
P E N S I O N S C H E M E S
Many TUI Group companies offer their employees pension schemes in the form of direct insurance contracts and individual or direct commitments to build up a private pension, or they pay additional contributions to pension schemes for their employees. In Germany, collective contracts have been concluded in order to meet the legal entitlement to deferred compensation. These schemes were devised to take advantage of fiscal and social security opportunities, particularly for employee-funded company pension schemes through direct insurance.
PA R T-T I M E E A R LY R E T I R E M E N T
To further increase the flexibility of their company HR and succes-sion planning, Group companies in Germany are able to make use of the opportunities provided under the German Part-Time Early Retirement Act, enabling people to shift gradually from employment to retirement. This opportunity is partly supported by current collective bargaining contracts and company agreements, and is increasingly being taken up. At the balance sheet date, € 9.4 m was provided through a capital investment model for the 227 employees working under part-time early retirement contracts in order to hedge their accrued assets against employer insolvency.
G LO B A L E M P LOY M E N T S TAT E M E N T
A further milestone achieved during the period under review was the resolution to publish a Global Employment Statement. It is aimed at fair and respectful treatment of employees at all levels and compliance with applicable law and industrial standards. Our TUI Global Employment Statement aims to make a Group-wide commitment to promote human rights, no discrimination, no forced labor, no child labour, salaries and benefits, freedom of association and collective bargaining, health and safety, diversity as well as people development and feedback culture. This commitment should be applied both to our own employees and those of our contractual partners.
E M P LOY E E R E P R E S E N TAT I V E S
TUI Group has a large number of co-determination bodies at a national and international, company and supra-company level. They include local works councils, company works councils and the Group Works Council. The members of these bodies represent the interests of our Group’s employees in Germany. Through their statutory rights of participation and initiative, they ensure representation of the interests of employees on all issues and projects of relevance to staff members and compliance with employee rights.
The Group Works Council is the top-level body for representing the interests of employees in German companies in accordance with legislation on industrial relations. In FY 2018, it consisted of 28 members from 21 companies. By delegating their representatives to the Group Works Council, the respective bodies obtain continuous and up-to-date information about structural and operational chal-lenges within the Group. Due to their co-determination activities and their active participation in response to the needs and issues that call for action, they have a high penetration rate among the Group’s employees. In this context, both the Group Works Council and the local works councils in Germany have made an important contribution to the implementation of the HR strategy through the conclusion of accompanying works council agreements.
A key project was the conclusion of an agreement on the launch of long-term worktime accounts for German Group companies. This has laid the basis for employees to take up options for paid time off later in their career in the form, for example, of early retirement or a sabbatical. The next step is to implement the model.
At a European level, TUI’s Europe Forum ensures a proper process of information and consultation on cross-border issues affecting the interests of employees in at least two member states of the European Economic Area (and Switzerland). TUI’s Europe Forum represents the interests of employees in companies abroad, there-by performing important work in supporting the companies and integrating their employees. In FY 2018, 45 employee representa-tives from 14 countries were delegated to the Forum. The area of focus of the TEF in the period under review included the establish-ment of a cross-border Group Occupational Health Management system and various strategic projects in European countries.

99COMBI NE D M A N AGE ME N T R E P O R T » NoN - f I N A NC I A l De C l A r AT IoN
Security, Health & Safety
In the reporting period, TUI AG’s Group Security, Health & Safety (Group SHS) team continued to refine our holistic, Group-wide safety concept for customers and employees, the Company’s reputation and assets. Dialogue on a regular basis with our subsidiaries and Group departments provides the basis for professional safety management in line with needs and requirements. Group SHS focuses on pro-active and sustainable action. It continually monitors and analyses developments in the destinations, prepares response measures and manages exceptional situations. In conjunction with subsequent follow-up measures (lessons learnt and process adjust-ments), this cycle is implemented as a continuous, interconnected process.
The period under review saw the development and implementation of standardised, Group-wide frameworks such as guidelines, opera-tional instructions and processes. They ensure fast and pertinent responses to safety-critical events and pro-active protection from risks.
Examples include guidelines for safety measures within Hotels & Resorts, for business travel or for event and crisis management. These frameworks are based on a holistic risk analysis, taking account of incidents, nature-related, social and political develop-ments in destinations, health-related information and safety- relevant briefings from government agencies. They form the basis for advice provided by Group SHS, e. g. in the form of safety training, consulting, defined actions or planning documents.
The frameworks are applicable group-wide. Shareholdings in which management control does not lie with TUI AG, are advised to imple-ment the frameworks. On this basis, security and safety functions across the Group cooperate within a network coordinated by Group SHS. This ensures full Group coverage and a coordinated approach on safety-related issues tailored to the needs of the activities concerned.
Implementation of these safety standards is ensured by regular trips to destinations and to our Hotels & Resorts for the purposes of consultancy and evaluation. In the period under review, Group SHS carried out fifteen evaluation visits to various destinations. Apart from obtaining local insights into the safety standards of our hotels, this dialogue with hotel managers and with representatives of both TUI Destination Experiences and safety and tourism authorities provides an overview of the destination concerned and the challenges it poses to TUI as an integrated travel group. Reporting to manage-ment creates the opportunity to initiate and orchestrate further measures.
In the reporting period, numerous audits embedded in the quality assurance process were carried out. Apart from safety audits, Group SHS launched around 5,400 safety and security audits.
In addition to this consultancy work, particular weight is attached to professional development and awareness-building for our own staff. Travel agency and airport station staff received additional safety and security advice tailored to their specific areas of activity.
TUI AG operates a Group-wide event and crisis management system. It was successfully applied, for instance, in connection with tropical storms, earthquakes and wildfires as well as health-relevant events. Apart from aggregating data and analysing the local situa-tion, our event management frameworks ascertain how guests and employees are affected and what support they need, as well as coordinating with local public agencies, European bodies and other partners. 24 / 7 control centres form the basis for fast and pertinent responses to critical events. Appropriate reporting ensures that management is informed and continually updated on all key events and developments.
Compliance / Anti-corruption and anti-bribery
Details of TUI Group’s anti-corruption and anti-bribery measures are presented in the Corporate Governance section on Compliance from page 125 in the present Annual Report.

100 COMBI NE D M A N AGE ME N T R E P O R T » A N N UA l f I N A NC I A l S TAT e Me N T S of T U I AG
ANNUAL F INANCIAL STATEMENTS OF TUI AG
Condensed version according to German Commercial Code (HGB)
Earnings position of TUI AG
The annual financial statements of TUI AG were prepared in accordance with the provisions of the German Commercial Code (HGB), taking account of the complementary provisions of the German Stock Corporation Act (AktG), and audited by Deloitte GmbH Wirtschaftsprüfungsgesellschaft, Hanover. They are published in the federal gazette. The annual financial statements have been made permanently available on the Internet at www.tuigroup.com and can be requested in print from TUI AG.
In the present Annual Report, the Management Report of TUI AG has been combined with the Management Report of TUI Group.
Income statement of TUI AG
€ million 2018 2017 Var. %
Turnover 122.7 45.4 + 170.3
Other operating income 326.4 392.6 – 16.9
Cost of materials 7.7 7.6 + 1.3
Personnel costs 67.9 49.9 + 36.1
Depreciation 1.3 1.0 + 30.0
Other operating
expenses 349.3 500.4 – 30.2
Net income from
investments 1,010.0 933.3 + 8.2
Write-downs of
investments 128.8 58.1 + 121.7
Net interest 5.2 8.7 – 40.2
Taxes on income
and profit – 67.2 15.7 n. a.
Profit after taxes 976.5 747.3 + 30.7
Other taxes – 6.9 5.6 n. a.
Net profit for the year 983.4 741.7 + 32.6
The earnings position of TUI AG, the Group’s parent company, is primarily determined by the appropriation of profits by its Group companies, either directly associated with TUI AG via profit and loss transfer agreements or distributing their profits to TUI AG based on relevant resolutions.
T U R N OV E R A N D O T H E R O P E R AT I N G I N CO M E
The increase in turnover in the financial year under review mainly resulted from higher licensing revenue due to the launch of a changed licensing fee model. The decline in other operating income was primarily attributable to a year-on-year decline in gains on exchange. This income was offset by expenses for exchange losses of a similar amount, carried in other operating expenses. Apart from the gains on exchange, other operating income primarily included income from the elimination of intercompany services, carried alongside expenses of almost the same amount passed on to TUI AG from other Group companies, also carried in other oper-ating expenses.
E X P E N S E S
Personnel costs rose versus FY 2017. Pension expenses increased primarily due to transfers to pension provisions. The increase in personnel costs was driven in particular by bonus payments and share options from multi-year remuneration models for members of the boards.
Other operating expenses mainly comprised the cost of financial and monetary transactions, charges, fees, services, transfers to impairments, other administrative costs as well as expenses for exchange losses and the intercompany elimination of services. Other operating expenses declined in particular due to the decrease in expenses for exchange losses.
N E T I N CO M E F R O M I N V E S T M E N T S
In the financial year under review, TUI AG’s net income from invest-ments was driven by the distribution of profits by TUI Cruises GmbH and by TUI Travel Holdings via TUI Travel Ltd. in the context with the acquisition of TUI Nordics Holding AB. Net income from investments also included income from profit transfers from hotel companies and companies allocable to central operations. It also comprised expenses for loss transfers from Group companies, resulting in a corresponding reduction in net income from invest-ments. Loss transfers increased year-on-year.

101COMBI NE D M A N AGE ME N T R E P O R T » A N N UA l f I N A NC I A l S TAT e Me N T S of T U I AG
W R I T E - D O W N S O F I N V E S T M E N T S
In the period under review, write-downs of investments mainly related to write-downs of a subsidiary allocated to central opera-tions as well as an investment in a Turkish hotel. In the period under review, write-downs were also effected on loans to Group companies.
I N T E R E S T R E S U LT
The decline in the interest result was partly attributable to an increase in interest expenses (to affiliated companies). This effect was not fully offset by the increase in non-current loans to Group companies by TUI AG and the associated interest income.
TA X E S
In the period under review, taxes related to income taxes and other taxes. They did not include any deferred taxes.
N E T P R O F I T F O R T H E Y E A R
For FY 2018, TUI AG posted a net profit for the year of € 983.4 m.
Net assets of TUI AG
TUI AG’s net assets and financial position as well as its balance sheet structure reflect its function as the TUI Group’s parent company. The balance sheet total rose by 6.1 % to € 10.4 bn in FY 2018.
Abbreviated balance sheet of TUI AG (financial statement according to German Commercial Code)
€ million 30 Sep 2018 30 Sep 2017 Var. %
Intangible assets /
property, plant and
equipment 21.9 19.4 + 12.9
Investments 7,998.8 7,078.9 + 13.0
Fixed assets 8,020.7 7,098.3 + 13.0
Receivables / Trade
securities 1,470.5 1,644.4 – 10.6
Cash and cash
equivalents 889.3 1,039.0 – 14.4
Current assets 2,359.8 2,683.4 – 12.1
Prepaid expenses 0.5 0.7 – 28.6
Assets 10,381.0 9,782.4 + 6.1
Equity 5,801.5 5,192.7 + 11.7
Special non-taxed items 0.1 0.1 –
Provisions 361.9 462.5 – 21.8
Bonds 300.0 300.0 –
Other liabilities 3,917.4 3,827.1 + 2.4
Liabilities 4,217.4 4,127.1 + 2.2
Liabilities 10,381.0 9,782.4 + 6.1
F I X E D A S S E T S
At the balance sheet date, fixed assets almost exclusively consisted of investments. The increase in investments was mainly attributable to the acquisitions of TUI Nordic Holding AB and TUI Portugal SA as well as the implementation of capital increases by subsidiaries.
C U R R E N T A S S E T S
The decrease in current assets of 12.1 % to € 2,359.8 m was mainly driven by the decline in cash and cash equivalents and receivables / securities, which had included short-term money market funds in the prior year.
T U I AG ’ S C A P I TA L S T R U C T U R E
E Q U I T Y
TUI AG’s equity increased by € 608.8 m to € 5,801.5 m. The sub-scribed capital of TUI AG consists of no-par value shares, each representing an equal portion in the capital stock. The proportionate share in the capital stock per share is around € 2.56. At the end of FY 2018, the subscribed capital of TUI AG rose due to the issue of employee shares. At the end of the financial year under review, subscribed capital comprised 587,901,304 shares.
In FY 2018, capital reserves rose by € 5.9 m due to the issue of employee shares and share-based payments. Revenue reserves exclusively consisted of other revenue reserves. The Articles of Association do not contain any provisions concerning the formation of reserves.
The profit for the year amounted to € 983.4 m. Taking account of the profit carried forward of € 814.0 m, net profit available for distribution totalled € 1,797.4 m. A proposal will be submitted to the Annual General Meeting to use the net profit available for distribution for the financial year under review to distribute a dividend of € 0.72 per no-par value share and to carry the amount of € 1,374.1 m, remaining after deduction of the dividend total of € 423.3 m, forward on new account. The equity ratio rose to 55.9 % (previous year 53.1 %) in FY 2018.
P R O V I S I O N S
Provisions decreased by € 100.6 m to € 361.9 m. They consisted of pension provisions worth € 144.5 m (previous year € 136.0 m), tax provisions worth € 122.6 m (previous year € 196.1 m) and other provisions worth € 94.8 m (previous year € 130.4 m).
While pension provisions rose slightly year-on-year in the financial year under review, tax provisions and provisions for invoices outstanding, personnel costs and other risks declined versus the prior year.
L I A B I L I T I E S
TUI AG’s liabilities totalled € 4,217.4 m, up by € 90.3 m or 2.2 %.
102 COMBI NE D M A N AGE ME N T R E P O R T » A N N UA l f I N A NC I A l S TAT e Me N T S of T U I AG
In October 2016, TUI AG issued an unsecured bond worth € 300.0 m maturing in October 2021. TUI AG used the proceeds from the is-sue of this bond to cancel and repay a five-year bond issued in September 2014 ahead of its maturity date. In July 2018, TUI AG issued an unsecured Schuldschein with banks with a total volume of € 425.0 m for general corporate financing purposes with different tenors of five to ten years.
The increase in liabilities was mainly driven by the transactions of the TUI AG subsidiaries included in its cash pool.
TUI’s net financial position (cash and cash equivalents as well as marketable securities less bonds and Schuldschein) declined year-on-year, amounting to a clearly positive position of € 164.3 m in the period under review.
C A P I TA L A U T H O R I S AT I O N R E S O L U T I O N S
Information on new or existing resolutions concerning capital authorisation, adopted by Annual General Meetings, is provided in the next chapter on Information Required under Takeover Law.

103COMBI NE D M A N AGE ME N T R E P O R T » T U I S H A r e
TUI SHARE
TUI share has gained 61 % since the merger with TUI Travel
The TUI share has outperformed significantly over the four-year period. The share’s Total Shareholder Return (TSR) has increased by 61 % since the announcement of the merger with TUI Travel in June 2014, considerably outperforming the FTSE 100 (+ 31 %) and DAX 30 (+ 23 %) indices. In a market environment characterised by macroeconomic and geopolitical challenges, TUI Group delivered the total announced merger synergies of € 100 m, accelerated the Group’s transformation as a leading provider of holiday products and launched important digitalisation initiatives. During that period, the Group has paid dividends worth around € 1.6 bn to its share-holders (including the dividend proposal for FY 2018) and in-creased its operating result by more than 10 % on a constant currency basis for the fourth consecutive year. The share price performance demonstrates TUI Group’s strong positioning as a leading provider with own hotel and cruise products and unique holiday experiences with its own direct distribution. Our strategy of double diversification, i. e. our balanced portfolio of markets and destinations, creates resilience and enables us to flexibly respond to different market conditions. It forms the basis for the further implementation of our growth roadmap.
TUI share continues considerable outperformance in FY 2018
The TUI share started off the current financial year at a price of € 14.53. Supported by strong business results, further progress in the transformation of the Group and the presentation of new digitalisation strategy, the TUI share gained significantly in the course of the year. Shortly after the Capital Markets Day for analysts and investors with a special focus on the cruise segment, the share price closed at its full year high of € 20.66 on 17 May 2018.
The market environment was subsequently characterised by external challenges: On the one hand, it was adversely affected by flight disruptions, driven primarily by air traffic control strikes in France. On the other hand, customers’ booking behaviour was impacted by the sustained period of exceptionally hot weather in Northern Europe this summer. TUI’s share also saw impact from announce-ments of lowered profit guidance by other travel and tourism com-panies. Moreover, the trade dispute between the US and China as well as Turkey intensified further, causing increasing uncertainty in the international capital markets and, among others, a strong fall in the Turkish lira.
At the end of the financial year under review, the TUI share turned positive again, benefiting from high booking numbers and the reiteration of the operating profit guidance at constant currency. This further demonstrates the strength and resilience of our transformed business model in a challenging environment. The Total Shareholder Return of the TUI share rose by a total of 17 % in 2018, while FTSE 100 only gained 6 % and DAX 30 lost around 5 %.
TUI share data
30 September 2018
WKN TUAG00
ISIN DE000TUAG000
Stock exchange centres London, Xetra, Hanover
Reuters / Bloomberg TUIGn.DE / TUI1.GR (Frankfurt);
TUIT.L / TUI:LN (London)
Stock category Registered ordinary shares
Capital stock € 1,502,945,818
Number of shares 587,901,304
Market capitalisation bn € 9.7
Market capitalisation bn £ 8.7

104 COMBI NE D M A N AGE ME N T R E P O R T » T U I S H A r e
160
120
130
140
150
110
100
90
80
TUI share price (FY 2018) in %
TUI (TSR) DAX 30 FTSE 100
30 SEPTEMBER 2017 28 SEPTEMBER 2018
220
140
160
180
200
120
100
80
60
TUI Share price since the merger announcement of TUI AG with TUI Travel PLC in %
TUI (TSR) DAX 30 FTSE 100
24 JUNE 2014 2015 2016 2017 28 SEPTEMBER 2018

105COMBI NE D M A N AGE ME N T R E P O R T » T U I S H A r e
Long-term development of the TUI share (Xetra)
€ 2014 2015 2016 2017 2018
High 6.97 17.71 17.21 14.90 20.66
Low 3.14 9.84 10.17 11.46 14.34
Year-end share price 6.70 16.35 12.69 14.38 16.56
Quotations, indices and trading
The TUI share has its primary listing in the Premium segment of the Main Market of the London Stock Exchange and is included in FTSE’s UK Index Series including FTSE 100, the UK’s major share index. It also has a secondary listing in the electronic trading system Xetra and at the Hanover Stock Exchange.
TUI AG is represented in the sustainability index FTSE4Good and on the Ethibel Investment Register. In 2018 TUI was included in the RobecoSam Sustainability Yearbook with a ‘Silver Class’ distinction. TUI participated again in the CDP Climate Change assessment 2018, results being announced in early 2019.
In FY 2018, the average daily trading volume at the London Stock Exchange was around 1.3 million shares, while about 0.6 million shares were traded on Xetra. Across all trading platforms, the trading volume in the UK amounted to around 3.4 million shares, with around 1.8 m shares traded in the euro line. Both the sterling and the euro lines thus delivered strong liquidity for trading by institutional and retail investors.
Analyst recommendations
Analysis and recommendations by financial analysts are a key decision-making factor for institutional and private investors. In the financial year under review, more than 20 analysts regularly pub-lished studies on TUI Group. In September 2018, 63 % of analysts issued a recommendation to ‘buy’ the TUI share, with 32 % rec-ommending ‘hold’. One analyst recommended ‘sell’.
Analysts’ Recommendations (30 SEPTEMBER 2018) in %
63.2Buy
5.3Sell
31.5Hold
%

106 COMBI NE D M A N AGE ME N T R E P O R T » T U I S H A r e
Shareholder structure
* 24.998 %
The current shareholder structure and the voting right notifications
pursuant to section 33 of the German Securities Trading Act are avail-
able online at: www.tuigroup.com/en-en/investors/share/shareholder-
structure and www.tuigroup.com/de-de/investoren/news
At the end of FY 2018, around 75 % of TUI shares were in free float. Around 7 % of all TUI shares were held by private shareholders, around 65 % by institutional investors and financial institutes and around 28 % by strategic investors. Analysis of the share register shows that most shares are being held by investors from EU countries.
Dividend policy
Development of dividends and earnings of the TUI share
€ 2014 2015 2016 2017 2018
Earnings per share + 0.26 + 0.64 + 1.78 + 1.10 1.25
Dividend 0.33 0.56 0.63 0.65 0.72
In the framework of the merger with TUI Travel, TUI Group defined a dividend policy under which the dividend increases in line with the growth in underlying EBITA at constant currency. A proposal will therefore be submitted to the Annual General Meeting to distribute a dividend of € 0.72 per no-par value share to the share-holders for FY 2018.
Investor Relations
Open and continuous dialogue and transparent communication form the basis for our Investor Relations work with our private shareholders, institutional investors, equity and credit analysts and lenders. There are three reasons to invest in the TUI share:
53.6EU
65.1Institutional
investors
16.7North America
6.6 Private investors
3.4 Riu Hotels S. A.
24.9*
Alexey Mordashov
29.7Other
Shareholder structure (30 SEPTEMBER 2018) in % Geographical shareholder structure (30 SEPTEMBER 2018) in %
% %

107COMBI NE D M A N AGE ME N T R E P O R T » T U I S H A r e
1STRONG STRATEGIC POSITION
Our integrated business model covers the entire value chain in tourism – from distribution through aviation, accommoda-tion in the hotel or on board the cruise liner all the way to excursions organised by our local incoming agencies in the destinations. TUI covers the entire customer journey to drive customer satisfaction and loyalty and hence profitability. We are convinced that this provides us with a strategic advantage over our competitors.
2STRONG EARNINGS GROWTH
TUI operates in a growth market and considerably increased its operating result over the past few years thanks to its strong positioning. Underlying EBITA grew by more than 10 % for the fourth consecutive year at constant currency. We will deliver future growth, supported by the further implementa-tion of our growth roadmap and the increasing delivery of the benefits from our digitalisation initiatives.
3STRONG CASH GENERATION
TUI is characterised by balance sheet stability and strong operating cash conversion. The Group has defined a clear financial policy, improved its coverage ratio* and leverage ratio over the past few years and pays an attractive dividend to its shareholders.
* We define our cash conversion as the difference between underlying EBITDA less net normalised net capex and financial investments in relation to adjusted EBITDA .
More details about Investor Relations online at:
www.tuigroup.com/de-de/investoren
In the completed financial year, many discussions were held, centring on the growth strategy for the integrated tourism group, the digital-isation initiatives and the business performance in the individual segments, enabling stakeholders to make a realistic assessment of TUI Group’s future development. In this context, TUI’s management team sought dialogue with investors at roadshows and conferences in London, Dublin, Frankfurt, Berlin, Munich, Zurich, Vienna, Milan, Madrid, Amsterdam, Brussels, Paris, Oslo, Copenhagen, Tokyo, New York, Boston, Chicago, Montreal and Toronto.
TUI’s Investor Relations team also makes every effort to engage in direct contact with private investors. TUI Group’s IR team sought dialogue with this target group on many occasions, such as events organised by shareholder associations. Another key platform for exchanges with private shareholders was the IR stall at TUI’s Annual General Meeting. TUI also offers a broad range of information for its analysts, investors and private shareholders on its website. All results conference calls were transmitted live and comprehensive informa-tion on the Capital Markets Day was presented on the website.
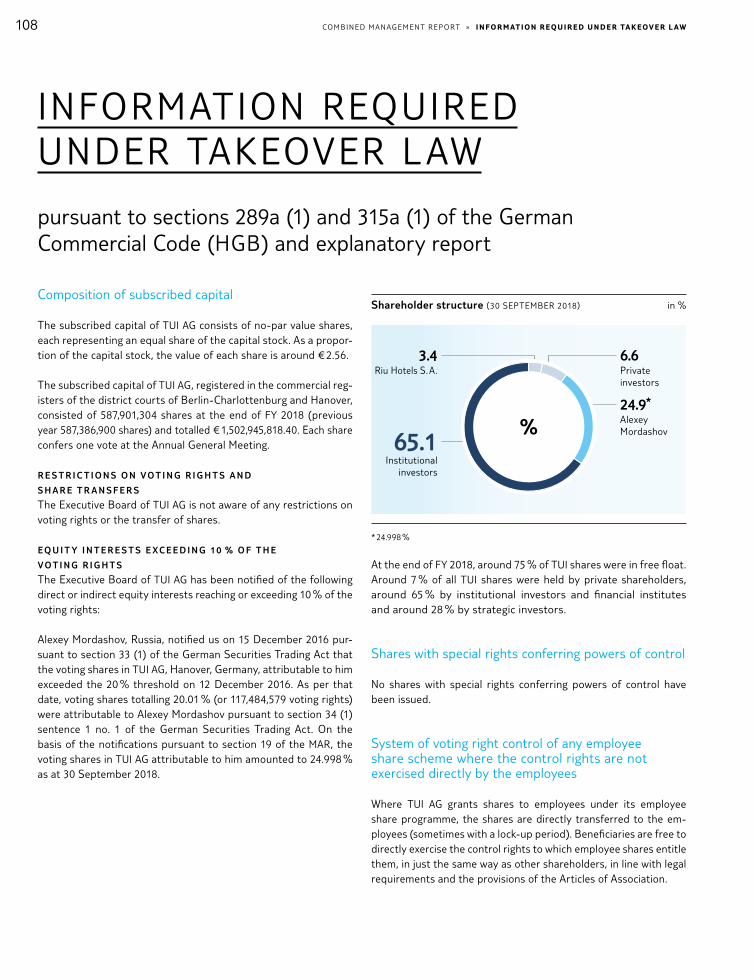
108 COMBI NE D M A N AGE ME N T R E P O R T » I Nfor M AT IoN r e qU Ir e D UNDe r TA K e oV e r l Aw
INFORMATION REQUIRED UNDER TAKEOVER L AW
pursuant to sections 289a (1) and 315a (1) of the German Commercial Code (HGB) and explanatory report
Composition of subscribed capital
The subscribed capital of TUI AG consists of no-par value shares, each representing an equal share of the capital stock. As a propor-tion of the capital stock, the value of each share is around € 2.56.
The subscribed capital of TUI AG, registered in the commercial reg-isters of the district courts of Berlin-Charlottenburg and Hanover, consisted of 587,901,304 shares at the end of FY 2018 (previous year 587,386,900 shares) and totalled € 1,502,945,818.40. Each share confers one vote at the Annual General Meeting.
R E S T R I C T I O N S O N VO T I N G R I G H T S A N D
S H A R E T R A N S F E R S
The Executive Board of TUI AG is not aware of any restrictions on voting rights or the transfer of shares.
E Q U I T Y I N T E R E S T S E XC E E D I N G 10 % O F T H E
VO T I N G R I G H T S
The Executive Board of TUI AG has been notified of the following direct or indirect equity interests reaching or exceeding 10 % of the voting rights:
Alexey Mordashov, Russia, notified us on 15 December 2016 pur-suant to section 33 (1) of the German Securities Trading Act that the voting shares in TUI AG, Hanover, Germany, attributable to him exceeded the 20 % threshold on 12 December 2016. As per that date, voting shares totalling 20.01 % (or 117,484,579 voting rights) were attributable to Alexey Mordashov pursuant to section 34 (1) sentence 1 no. 1 of the German Securities Trading Act. On the basis of the notifications pursuant to section 19 of the MAR, the voting shares in TUI AG attributable to him amounted to 24.998 % as at 30 September 2018.
* 24.998 %
At the end of FY 2018, around 75 % of TUI shares were in free float. Around 7 % of all TUI shares were held by private shareholders, around 65 % by institutional investors and financial institutes and around 28 % by strategic investors.
Shares with special rights conferring powers of control
No shares with special rights conferring powers of control have been issued.
System of voting right control of any employee share scheme where the control rights are not exercised directly by the employees
Where TUI AG grants shares to employees under its employee share programme, the shares are directly transferred to the em-ployees (sometimes with a lock-up period). Beneficiaries are free to directly exercise the control rights to which employee shares entitle them, in just the same way as other shareholders, in line with legal requirements and the provisions of the Articles of Association.
65.1Institutional
investors
6.6 Private investors
3.4 Riu Hotels S. A.
24.9*
Alexey Mordashov
Shareholder structure (30 SEPTEMBER 2018) in %
%
109COMBI NE D M A N AGE ME N T R E P O R T » I Nfor M AT IoN r e qU Ir e D UNDe r TA K e oV e r l Aw
Appointment and removal of Executive Board members and amendments to the Articles of Association
The appointment and removal of Executive Board members is based on sections 84 et seq. of the German Stock Corporation Act in combination with section 31 of the German Co-Determination Act. Amendments to the Articles of Association are based on the provisions of sections 179 et seq. of the German Stock Corpora-tion Act in combination with section 24 of the Articles of Associa-tion of TUI AG.
Powers of the Executive Board to issue or buy back shares
The Annual General Meeting of 13 February 2018 authorised TUI AG’s Executive Board to acquire own shares of up to 5 % of the capital stock. The authorisation will expire on 12 August 2019. The Annual General Meeting of 13 February 2018 adopted a resolution to create authorised capital for the issue of employee shares worth € 30.0 m. The Executive Board of TUI AG is authorised to use this approved capital by 12 February 2023 in one or several trans-actions by issuing employee shares against cash contribution. In the completed financial year, 514,404 new employee shares were issued, so that the authorised capital totalled around € 28.7 m at the balance sheet date.
The Annual General Meeting of 9 February 2016 adopted a resolu-tion to create conditional capital of € 150.0 m for the issue of bonds. The authorisation to issue bonds with conversion options or warrants as well as profit-sharing rights and income bonds (with or without fixed terms) of up to a nominal amount of € 2.0 bn will expire on 8 February 2021. The Annual General Meeting of 9 Feb-ruary 2016 also adopted a resolution to create authorised capital for the issue of new registered shares against cash contribution worth a maximum of € 150.0 m. The authorisation will expire on 8 February 2021. The Annual General Meeting on 9 February 2016 furthermore adopted a resolution to create authorised capital for the issue of new shares of € 570.0 m against cash contributions or contributions in kind. The issue of new shares against contribu-tions in kind has been limited to € 300.0 m. The authorisation will expire on 8 February 2021.
To date, the authorisations approved in 2016 have not been used.
See (23) Subscribed capital in the Notes on page 206 and (6) Sub-
scribed capitel in the Financial Statements of TUI AG.
Significant agreements taking effect in the event of a change of control of the Company following a takeover bid, and the resulting effects
Some of TUI AG’s outstanding financing instruments contain change of control clauses. A change of control occurs in particular
if a third partly directly or indirectly acquires control over at least 50 % or the majority of the voting shares in TUI AG.
In the event of a change of control, the holders of the Schuldschein worth € 425.0 m and of the fixed-interest senior bond worth € 300.0 m must be offered a buyback.
For the syndicated credit line worth € 1.75 bn, of which € 102.4 m had been used via bank guarantees as at the balance sheet date, a right of termination by the lenders has been agreed in the event of a change of control. This also applies to several bilateral guarantee lines with a total volume of £ 85.0 m, concluded with various insur-ance companies. At the balance sheet date, an amount of £ 27.3 m had been used.
Beyond this, there are no agreements in guarantee, leasing, option or other financial contracts that might cause material early re-demption obligations that would be of significant relevance for the Group’s liquidity.
Apart from the financing instruments mentioned above, a frame-work agreement between the Riu family and TUI AG includes a change of control clause. A change of control occurs if a shareholder group represents a predefined majority of AGM attendees or if one third of the shareholder representatives on the Supervisory Board are attributable to a shareholder group. In the event of a change of control, the Riu family is entitled to acquire at least 20 % and at most all shares held by TUI in RIUSA II S.A. A similar agreement concerning a change of control at TUI AG has been concluded with the El Chiaty Group. Here, too, a change of control occurs if a shareholder group represents a predefined majority of AGM attendees or if one third of the shareholder representatives on the Supervisory Board are attributable to a shareholder group. In that case, the El Chiaty Group is entitled to acquire at least 15 % and at most all shares held by TUI in the joint hotel companies in Egypt and the United Arab Emirates. A change of control agreement has also been concluded for the joint venture TUI Cruises between Royal Caribbean Cruises Ltd and TUI AG for the event that a change of control occurs in TUI AG. The agreement gives the part-ner the right to demand termination of the joint venture and to purchase the stake held by TUI AG at a price which is lower than the selling price of their own stake.
Compensation agreements have not been concluded between the Company and Executive Board members or employees in the event of a takeover bid.

The Cape Verde Islands deep in the Atlantic Ocean are a perfect place to relax with about 350 days of
sunshine a year. TUI is extending its presence on the isle of Sal, where the Robinson Club Cabo Verde will open
in late 2019.
»
READ MORE ABOUT SAL’S BLUE SK IES AND THE NEW ROBINSON CLUB IN OUR MAGAZINE
ARTICLE ‘SUN SOAKED’ .
CORPOR ATE GOVERNANCE
112 Executive Board and Supervisory Board
115 Corporate Governance Report
115 Statement on Corporate Governance
(as part of the Management Report)
128 Remuneration Report

COR P OR AT E GOV E R N A NC E » e X e C U T I V e BoA r D A ND SU pe rV I S ory BoA r D112
E XECUTIVE BOARD AND SUPERVISORY BOARD
Supervisory Board
Name
Function / Occupation
Location
Initial
Appointment
Appointed
until AGM
Other Board Memberships 2
Number of
TUI AG shares
(direkt und indirekt)2
Prof. Klaus Mangold
Chairman of the Supervisory Board of TUI AGChairman of the Supervisory Board of Rothschild GmbHChairman of the Supervisory Board of Knorr-Bremse AG
Stuttgart
7 Jan 2010
2021
a) Continental AG Knorr-Bremse AG3
b) Alstom S. A. Baiterek Holding JSC Rothschild GmbH3
0
Frank Jakobi1
Deputy Chairman of the Supervisory Board of TUI AGTravel Agent
Hamburg
15 Aug 2007
2021
600
Sir Michael Hodgkinson
Deputy Chairman fo the Supervisory Board of TUI AG
London
11 Dec 2014
13 Feb 2018
b) Keolis (UK) Limited3
Keolis Amey Docklands Ltd. World Airport Partners GmbH
7,980
Andreas Barczewski1 Aircraft Captain Hanover 10 May 2006 2021 a) TUIfly GmbH4 0
Peter Bremme1
Regional Head of the Special Services Division of ver.di – Vereinte Dienstleistungsgewerkschaft
Hamburg
2 Jul 2014
2021
a) TÜV Nord AG
0
Prof. Edgar Ernst
President of Deutsche Prüfstelle für Rechnungslegung (DPR)
Bonn
9 Feb 2011
2021
a) Metro AG VONOVIA SE 4
0
Wolfgang Flintermann1
Group Director Financial Accounting & Reporting, TUI AG
Großburgwedel
13 Jun 2016
2021
a) Deutscher Reisepreis- Sicherungsverein VVaG
382
Angelika Gifford Supervisory Board Member and Technology Executive Kranzberg 26 Mar 2012 2021 a) ProSiebenSat1 Media SE b) Rothschild & Co 4,100
Valerie Frances Gooding
Member of supervisory bodies in different companies
Weybridge
11 Dec 2014
2020
b) Vodafone Group PLC Aviva Insurance Ltd. Aviva Life Holdings
994
Dr Dierk Hirschel1 Business unit manager of the trade-unition ver.di – Vereinte Dienstleistungsgewerkschaft Berlin 16 Jan 2015 2021 a) DZ-Bank AG 0
Janis Kong
Member of supervisory bodies in different companies
London
11 Dec 2014
2020
b) Bristol Airport Ltd. Copenhagen Airport Portmeirion Group PLC
South West Airports Ltd.Roadis Transportation Holding S. L. U.
5,985
Peter Long Chairman Countrywide PLC London 9 Feb 2016 2021 b) Countrywide PLC3 10,317
Coline McConville
Member of supervisory bodies in different companies
London
11 Dec 2014
2020
b) Fevertree Drinks PLC Inchape PLC
Travis Perkins PLC
0
Alexey Mordashov
Chairman Board of Directors of PAO Severstal
Moscow
9 Feb 2016
2021
b) AO ‘Severstal Management’ 3
PJSC ‘Power Machines’ 3Nord Gold S. E.
146,963,612
Michael Pönipp1
Hotel Manager
Hanover
17 Apr 2013
2021
a) TUI Deutschland GmbH MER-Pensionskasse VVaG
469
Carmen Riu Güell
Managing Director RIUSA II S. A.
Palma de Mallorca
14 Feb 2005
2021
b) Hotel San Francisco S. A. Productores Hoteleros Reunidos S. A.
RIU Hotels S. A.RIUSA II S. A.
19,854,616
Carola Schwirn1
Department Coordinator in the Transportation Divisionof ver.di – Vereinte Dienstleistungsgewerkschaft
Berlin
1 Aug 2014
2021
0
Anette Strempel1 Travel Agent Hemmingen 2 Jan 2009 2021 1,729
Ortwin Strubelt1 Travel Agent Hamburg 3 Apr 2009 2021 2,228
Stefan Weinhofer1 International Employee Relations Coordinator at TUI AG Vienna 9 Feb 2016 2021 b) TUI Austria Holding GmbH 0
Dr Dieter Zetsche Chairman of the Board of Management Daimler AG Stuttgart 13 Feb 2018 2023 b) Vita Health LLC 0
1 Representative of the employees 2 Information refers to 30 September 2018 or date of resignation from the
Supervisory Board of TUI AG in FY 2018. 3 Chairman4 Deputy Chairman
a) Membership in supervisory boards within the meaning of section 125 of the German Stock Corporation Act (AktG)
b) Membership in comparable German and non-German bodies of companies within the meaning of section 125 of the German Stock Corporation Act (AktG)

COR P OR AT E GOV E R N A NC E » e X e C U T I V e BoA r D A ND SU pe rV I S ory BoA r D 113
E XECUTIVE BOARD AND SUPERVISORY BOARD
Supervisory Board
Name
Function / Occupation
Location
Initial
Appointment
Appointed
until AGM
Other Board Memberships 2
Number of
TUI AG shares
(direkt und indirekt)2
Prof. Klaus Mangold
Chairman of the Supervisory Board of TUI AGChairman of the Supervisory Board of Rothschild GmbHChairman of the Supervisory Board of Knorr-Bremse AG
Stuttgart
7 Jan 2010
2021
a) Continental AG Knorr-Bremse AG3
b) Alstom S. A. Baiterek Holding JSC Rothschild GmbH3
0
Frank Jakobi1
Deputy Chairman of the Supervisory Board of TUI AGTravel Agent
Hamburg
15 Aug 2007
2021
600
Sir Michael Hodgkinson
Deputy Chairman fo the Supervisory Board of TUI AG
London
11 Dec 2014
13 Feb 2018
b) Keolis (UK) Limited3
Keolis Amey Docklands Ltd. World Airport Partners GmbH
7,980
Andreas Barczewski1 Aircraft Captain Hanover 10 May 2006 2021 a) TUIfly GmbH4 0
Peter Bremme1
Regional Head of the Special Services Division of ver.di – Vereinte Dienstleistungsgewerkschaft
Hamburg
2 Jul 2014
2021
a) TÜV Nord AG
0
Prof. Edgar Ernst
President of Deutsche Prüfstelle für Rechnungslegung (DPR)
Bonn
9 Feb 2011
2021
a) Metro AG VONOVIA SE 4
0
Wolfgang Flintermann1
Group Director Financial Accounting & Reporting, TUI AG
Großburgwedel
13 Jun 2016
2021
a) Deutscher Reisepreis- Sicherungsverein VVaG
382
Angelika Gifford Supervisory Board Member and Technology Executive Kranzberg 26 Mar 2012 2021 a) ProSiebenSat1 Media SE b) Rothschild & Co 4,100
Valerie Frances Gooding
Member of supervisory bodies in different companies
Weybridge
11 Dec 2014
2020
b) Vodafone Group PLC Aviva Insurance Ltd. Aviva Life Holdings
994
Dr Dierk Hirschel1 Business unit manager of the trade-unition ver.di – Vereinte Dienstleistungsgewerkschaft Berlin 16 Jan 2015 2021 a) DZ-Bank AG 0
Janis Kong
Member of supervisory bodies in different companies
London
11 Dec 2014
2020
b) Bristol Airport Ltd. Copenhagen Airport Portmeirion Group PLC
South West Airports Ltd.Roadis Transportation Holding S. L. U.
5,985
Peter Long Chairman Countrywide PLC London 9 Feb 2016 2021 b) Countrywide PLC3 10,317
Coline McConville
Member of supervisory bodies in different companies
London
11 Dec 2014
2020
b) Fevertree Drinks PLC Inchape PLC
Travis Perkins PLC
0
Alexey Mordashov
Chairman Board of Directors of PAO Severstal
Moscow
9 Feb 2016
2021
b) AO ‘Severstal Management’ 3
PJSC ‘Power Machines’ 3Nord Gold S. E.
146,963,612
Michael Pönipp1
Hotel Manager
Hanover
17 Apr 2013
2021
a) TUI Deutschland GmbH MER-Pensionskasse VVaG
469
Carmen Riu Güell
Managing Director RIUSA II S. A.
Palma de Mallorca
14 Feb 2005
2021
b) Hotel San Francisco S. A. Productores Hoteleros Reunidos S. A.
RIU Hotels S. A.RIUSA II S. A.
19,854,616
Carola Schwirn1
Department Coordinator in the Transportation Divisionof ver.di – Vereinte Dienstleistungsgewerkschaft
Berlin
1 Aug 2014
2021
0
Anette Strempel1 Travel Agent Hemmingen 2 Jan 2009 2021 1,729
Ortwin Strubelt1 Travel Agent Hamburg 3 Apr 2009 2021 2,228
Stefan Weinhofer1 International Employee Relations Coordinator at TUI AG Vienna 9 Feb 2016 2021 b) TUI Austria Holding GmbH 0
Dr Dieter Zetsche Chairman of the Board of Management Daimler AG Stuttgart 13 Feb 2018 2023 b) Vita Health LLC 0
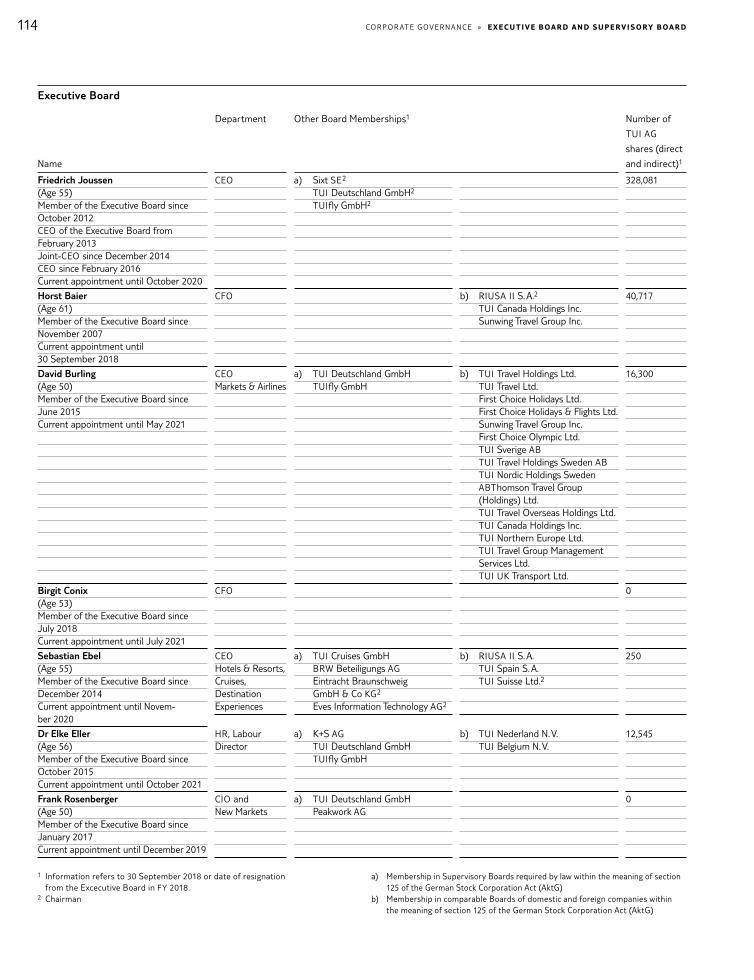
114 COR P OR AT E GOV E R N A NC E » e X e C U T I V e BoA r D A ND SU pe rV I S ory BoA r D
Executive Board
Name
Department
Other Board Memberships1
Number of
TUI AG
shares (direct
and indirect)1
Friedrich Joussen(Age 55)Member of the Executive Board since October 2012CEO of the Executive Board from February 2013Joint-CEO since December 2014CEO since February 2016Current appointment until October 2020
CEO
a) Sixt SE 2
TUI Deutschland GmbH2
TUIfly GmbH2
328,081
Horst Baier(Age 61)Member of the Executive Board since November 2007Current appointment until 30 September 2018
CFO
b) RIUSA II S. A.2
TUI Canada Holdings Inc. Sunwing Travel Group Inc.
40,717
David Burling(Age 50)Member of the Executive Board since June 2015Current appointment until May 2021
CEO Markets & Airlines
a) TUI Deutschland GmbH TUIfly GmbH
b) TUI Travel Holdings Ltd. TUI Travel Ltd. First Choice Holidays Ltd. First Choice Holidays & Flights Ltd. Sunwing Travel Group Inc. First Choice Olympic Ltd. TUI Sverige AB TUI Travel Holdings Sweden AB TUI Nordic Holdings Sweden ABThomson Travel Group (Holdings) Ltd. TUI Travel Overseas Holdings Ltd. TUI Canada Holdings Inc. TUI Northern Europe Ltd. TUI Travel Group Management Services Ltd. TUI UK Transport Ltd.
16,300
Birgit Conix(Age 53)Member of the Executive Board since July 2018Current appointment until July 2021
CFO
0
Sebastian Ebel(Age 55)Member of the Executive Board since December 2014Current appointment until Novem-ber 2020
CEO Hotels & Resorts, Cruises, Destination Experiences
a) TUI Cruises GmbH BRW Beteiligungs AG Eintracht Braunschweig GmbH & Co KG2
Eves Information Technology AG2
b) RIUSA II S. A. TUI Spain S. A. TUI Suisse Ltd.2
250
Dr Elke Eller(Age 56)Member of the Executive Board since October 2015Current appointment until October 2021
HR, Labour Director
a) K+S AG TUI Deutschland GmbH TUIfly GmbH
b) TUI Nederland N. V. TUI Belgium N. V.
12,545
Frank Rosenberger(Age 50)Member of the Executive Board since January 2017Current appointment until December 2019
CIO and New Markets
a) TUI Deutschland GmbH Peakwork AG
0
1 Information refers to 30 September 2018 or date of resignation from the Excecutive Board in FY 2018.
2 Chairman
a) Membership in Supervisory Boards required by law within the meaning of section 125 of the German Stock Corporation Act (AktG)
b) Membership in comparable Boards of domestic and foreign companies within the meaning of section 125 of the German Stock Corporation Act (AktG)
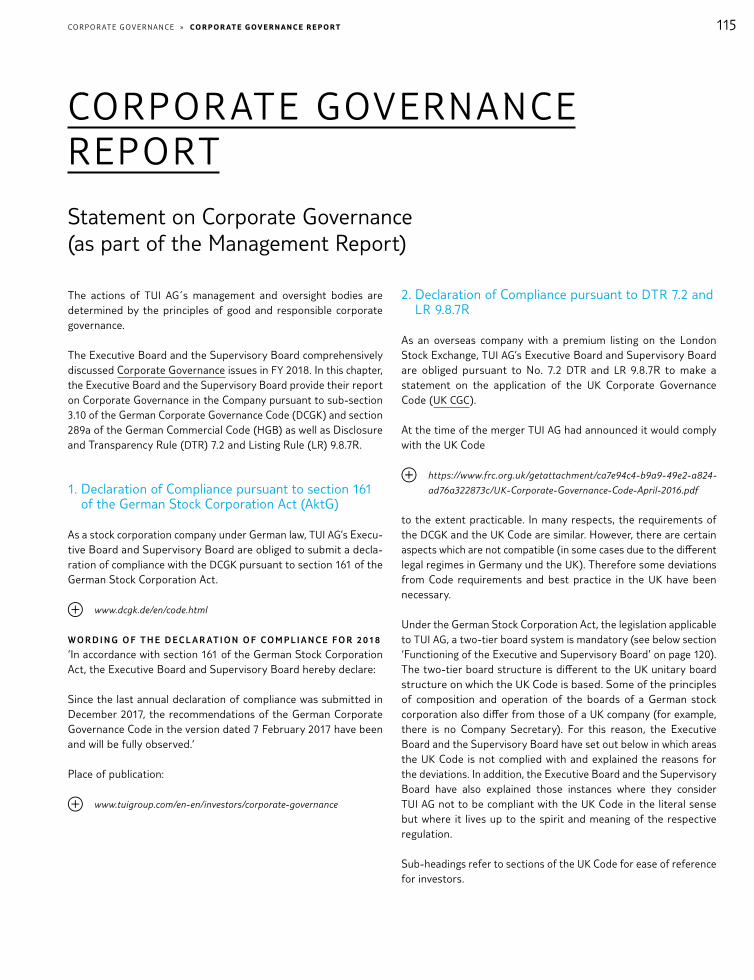
115COR P OR AT E GOV E R N A NC E » Cor p or AT e GoV e r N A NC e r e p orT
CORPOR ATE GOVERNANCE REPORT
Statement on Corporate Governance (as part of the Management Report)
The actions of TUI AG s management and oversight bodies are determined by the principles of good and responsible corporate governance.
The Executive Board and the Supervisory Board comprehensively discussed Corporate Governance issues in FY 2018. In this chapter, the Executive Board and the Supervisory Board provide their report on Corporate Governance in the Company pursuant to sub-section 3.10 of the German Corporate Governance Code (DCGK) and section 289a of the German Commercial Code (HGB) as well as Disclosure and Transparency Rule (DTR) 7.2 and Listing Rule (LR) 9.8.7R.
1. Declaration of Compliance pursuant to section 161 of the German Stock Corporation Act (AktG)
As a stock corporation company under German law, TUI AG’s Execu-tive Board and Supervisory Board are obliged to submit a decla-ration of compliance with the DCGK pursuant to section 161 of the German Stock Corporation Act.
www.dcgk.de/en/code.html
W O R D I N G O F T H E D E C L A R AT I O N O F CO M P L I A N C E F O R 2 0 18
‘In accordance with section 161 of the German Stock Corporation Act, the Executive Board and Supervisory Board hereby declare:
Since the last annual declaration of compliance was submitted in December 2017, the recommendations of the German Corporate Governance Code in the version dated 7 February 2017 have been and will be fully observed.‘
Place of publication:
www.tuigroup.com/en-en/investors/corporate-governance
2. Declaration of Compliance pursuant to DTR 7.2 and LR 9.8.7R
As an overseas company with a premium listing on the London Stock Exchange, TUI AG’s Executive Board and Supervisory Board are obliged pursuant to No. 7.2 DTR and LR 9.8.7R to make a statement on the application of the UK Corporate Governance Code (UK CGC).
At the time of the merger TUI AG had announced it would comply with the UK Code
https://www.frc.org.uk/getattachment/ca7e94c4-b9a9-49e2-a824-
ad76a322873c/UK-Corporate-Governance-Code-April-2016.pdf
to the extent practicable. In many respects, the requirements of the DCGK and the UK Code are similar. However, there are certain aspects which are not compatible (in some cases due to the different legal regimes in Germany und the UK). Therefore some deviations from Code requirements and best practice in the UK have been necessary.
Under the German Stock Corporation Act, the legislation applicable to TUI AG, a two-tier board system is mandatory (see below section ‘Functioning of the Executive and Supervisory Board’ on page 120). The two-tier board structure is different to the UK unitary board structure on which the UK Code is based. Some of the principles of composition and operation of the boards of a German stock corporation also differ from those of a UK company (for example, there is no Company Secretary). For this reason, the Executive Board and the Supervisory Board have set out below in which areas the UK Code is not complied with and explained the reasons for the deviations. In addition, the Executive Board and the Supervisory Board have also explained those instances where they consider TUI AG not to be compliant with the UK Code in the literal sense but where it lives up to the spirit and meaning of the respective regulation.
Sub-headings refer to sections of the UK Code for ease of reference for investors.

COR P OR AT E GOV E R N A NC E » Cor p or AT e GoV e r N A NC e r e p orT 116
W O R D I N G O F T H E U K CO R P O R AT E G OV E R N A N C E
S TAT E M E N T 2 0 18
“Executive Board and Supervisory Board declare pursuant to DTR 7.2 and LR 9.8.7R:
‘Throughout the reporting period, TUI AG has complied with the provisions of the UK Code in the version of April 2016, including its main principles, except as set out and explained below.’
Place of publication:
www.tuigroup.com/en-en/investors/corporate-governance
I D E N T I F I C AT I O N O F S E N I O R I N D E P E N D E N T D I R E C TO R
(A1 . 2 , A 4 .1)
Under German law and the German Code, there is no concept of a ‘Senior Independent Director’. Instead, shareholders may raise any issues at the Annual General Meeting (AGM). In this forum, the Executive Board and the Chairman of the Supervisory Board are available to address any issues and are legally obliged to provide adequate responses.
Outside the AGM, shareholders may approach the Executive Board, in particular the CEO or the CFO, or, for topics relating to Supervisory Board matters, the Chairman of the Supervisory Board or any of his Deputies. Sir Michael Hodgkinson, who was the Deputy Chairman and Senior Independent Director of TUI Travel PLC before the merger, was re-elected as additional Deputy Chair-man of the Supervisory Board of TUI AG in February 2016 along-side Frank Jakobi (First Deputy Chairman who, under the German Co-Determination Act, must be an Employee Representative). After Sir Michael Hodgkinson resigned from the Supervisory Board at the end of the Annual General Meeting on 13 February 2018, the Supervisory Board elected Peter Long to replace him as additional Deputy Chairman at its meeting on 13 February 2018 following the Annual General Meeting.
D I V I S I O N O F R E S P O N S I B I L I T I E S – C H A I R M A N & C H I E F
E X E C U T I V E (A 2 .1)
The separation of the roles of the Chairman of the Supervisory Board (Prof. Klaus Mangold) and the CEO (Friedrich Joussen) is clearly defined under German law as part of the two-tier board structure. Therefore, no further division of responsibilities is required and both the Executive Board and the Supervisory Board consider that TUI AG lives up to the spirit and meaning of the UK Code.
I N D E P E N D E N C E O F S U P E R V I S O RY B OA R D M E M B E R S ( B1 .1)
Under the UK Code, the Board must identify in the annual report each non-executive director it considers to be ‘independent’ for the purposes of the UK Code. Based on the responsibilities as-signed to the Supervisory Board by the German Stock Corporation Act, the members of the Supervisory Board are considered to be
non-executive directors for the purposes of the UK Code. Under the UK Code, persons are ‘independent’ if they are independent in character and judgement and if there are no relationships or circum-stances which are likely to affect, or could appear to affect, their judgement. TUI AG does not, however, extend its independence disclosures to employee representatives on the Supervisory Board (for a detailed explanation of shareholder and employee repre-sentatives and the underlying considerations, please see below).
The Supervisory Board has determined that six of its nine share-holder representatives (the Chairman is not taken into account according to the UK Code) are independent for the purposes of the UK Code. The shareholder representatives considered to be inde-pendent are: Prof. Edgar Ernst, Valerie Gooding, Janis Kong, Coline McConville, Angelika Gifford and Sir Michael Hodgkinson (until 13 February 2018), resp. Dr Dieter Zetsche (since 13 Febru-ary 2018). Additionally, the Chairman was independent on election in 2011 and re-election in February 2016 and is still considered independent (Prof. Klaus Mangold also was independent when he was elected to the Supervisory Board in January 2010).
The members of the Supervisory Board not considered to be inde-pendent for the purposes of the UK Code are Carmen Riu Güell, Alexey Mordashov and Peter Long.
In reaching its determination, the Supervisory Board has consid-ered, in particular, the factors set out below.
S H A R E H O L D E R A N D E M P LOY E E R E P R E S E N TAT I V E S
The Supervisory Board of TUI AG consists of ten members who are elected by shareholders at AGM (the ‘Shareholder Representa-tives’) and ten members who represent the employees of TUI AG (the ‘Employee Representatives’). This differs from UK practice where only those board members representing major sharehold-ers are typically referred to as ‘Shareholder Representatives’ and are not considered independent under the UK Code because of their link to a significant shareholder.
In TUI AG, only the shareholder representatives Carmen Riu Güell (Riu-Hotels, approx. 3.4 % of the voting rights) and Alexey Mordashov (approx. 24,998 % of the voting rights via Unifirm Ltd., majority controlled by himself) are connected to significant share-holders or are shareholders themselves. It should also be noted that joint ventures exist between TUI AG and both Riu Hotels S. A. and TUI Russia & CIS (in which a majority controlling interest is held by Mr Mordashov) (for further details see page 108 of the Annual Report). Until his election to the Supervisory Board in Feb-ruary 2016, Peter Long was Joint-CEO of TUI AG from December 2014 to February 2016. Prior to that, he was a member of the Executive Board of TUI AG from 2007 and CEO of TUI Travel PLC. Therefore, neither Ms Riu Güell nor Mr Mordashov nor Mr Long are considered independent for the purposes of the UK Code.

COR P OR AT E GOV E R N A NC E » Cor p or AT e GoV e r N A NC e r e p orT 117
Seven of the ten employee representatives of the Supervisory Board are elected by the employees of TUI Group entitled to vote. Three employee representatives are nominated by a German trade union (ver.di).
Under the UK Code, directors who are or have been employees of the Group in the last five years or who participate in the Group’s pension arrangements would generally not be considered inde-pendent. In the UK, directors with an employment relationship are normally current or former executives. By contrast, under German law, employee representatives of the Supervisory Board must be employees of the Group, and must be elected by the employees without any involvement of the Executive or Supervisory Boards. Furthermore, the employment contract of employee representa-tives may only be terminated in exceptional cases.
The employee representatives may also participate in Group pension schemes as is normal for employees and in their capacity as employees.
Trade union representatives are nominated, and employed by, the trade union but are still classified as employee representatives. They can only be removed from the Supervisory Board by their respective union and neither the Executive nor the Supervisory Board has any role in their appointment or removal.
H A L F T H E B OA R D S H O U L D B E I N D E P E N D E N T
N O N - E X E C U T I V E D I R E C TO R S ( B1 . 2 )
Since, for the purpose of the UK Code, only the shareholder rep-resentatives on the Supervisory Board are taken into account, with six independent members (excluding the Chairman of the Supervisory Board) more than half of its members are considered independent.
N O M I N AT I O N CO M M I T T E E – CO M P O S I T I O N A N D
R E S P O N S I B I L I T I E S ( B 2 .1)
The role of the Nomination Committee in a typical UK company is fulfilled in TUI AG by two Committees of the Supervisory Board:
Under the Rules of Procedure for the Supervisory Board and its Committees (which are equivalent to the Terms of Reference of a British corporation) the Nomination Committee considers and proposes suitable candidates as shareholder representatives to the Supervisory Board for its election proposals to the AGM. The Presiding Committee determines the requirements and remuner-ation for any new appointments to the Executive Board and rec-ommends suitable candidates to the Supervisory Board. On that basis, the Supervisory Board appoints Executive Board members. This approach is different from the UK where all director appoint-ments are approved by shareholders at the AGM.
However, as is common practice in Germany, at each AGM share-holders are asked to decide whether they approve the actions of the Executive Board and Supervisory Board members during the past financial year. Since the AGM 2015, in the light of UK practice, TUI AG has changed its procedure to allow a separate vote on each
individual Executive Board and Supervisory Board member, as it is customary in the UK.
TUI AG intends to continue this practice. Accordingly, the Super-visory Board considers that TUI AG lives up to the spirit and mean-ing of the UK Code to the extent practicable.
There is no requirement under German law or the German Corpo-rate Governance Code for the majority of the Nomination Com-mittee members to be independent. Of the four members of the Nomination Committee, two are either significant shareholders themselves or associated with significant shareholders (Carmen Riu Güell and Alexey Mordashov) and therefore not independent for the purposes of the UK Code. Until 13 February 2018 the re-maining two members, Sir Michael Hodgkinson and Prof. Klaus Mangold (Chairman) were both independent. Since 13 Febru-ary 2018, Peter Long has replaced Sir Michael Hodgkinson as a member of the Nomination Committee, so that only Prof. Klaus Mangold is independent under the UK Code. Therefore TUI AG is not compliant with the UK Code which requires a majority of the Nomination Committee to be independent. However, TUI AG con-siders that the current membership of the Nomination Committee provides a strong and experienced pre-selection of Supervisory Board shareholder representation members, while keeping the Committee to a manageable size.
A publication of the Rules of Procedure for the Supervisory Board, its committees (including the Audit Committee) and for the Execu-tive Board is not provided for under German law and the German Corporate Governance Code. Therefore TUI AG is not compliant with this provision of the UK Code.
N O M I N AT I O N CO M M I T T E E S E C T I O N I N T H E A N N UA L
R E P O R T & ACCO U N T S ( B 2 . 4 )
For the activities of the Nomination Committee, see page 19 which is part of the Chairman’s letter to shareholders.
Succession planning for management levels below Executive Board is carried out by the Executive Board. The Presiding Committee is responsible for succession planning for the Executive Board.
T E R M S & CO N D I T I O N S O F A P P O I N T M E N T S O F
N O N - E X E C U T I V E D I R E C TO R S ( B 3 . 2 )
The terms and conditions of Supervisory Board members’ ap-pointments follow the provisions of the German Stock Corpora-tion Act and the Articles of Association of TUI AG. The Articles of Association are available on the website at www.tuigroup.com/ en-en/investors/corporate-governance.
A DV I C E A N D S E R V I C E S O F T H E CO M PA N Y S E C R E TA RY ( B5 . 2 )
There is no specific role of Company Secretary in German compa-nies. However, Executive and Supervisory Board members have access to the Board Office of TUI AG if they need any advice or services. The Board Office acts as an interface in corporate matters for the Executive and Supervisory Board members and is respon-sible for ensuring that the requisite processes and procedures are

COR P OR AT E GOV E R N A NC E » Cor p or AT e GoV e r N A NC e r e p orT 118
in place governing all Executive and Supervisory Board meetings (i. e. preparation of agendas, minuting of meetings and ensuring compliance with German and UK law, as appropriate, and with rec-ommendations for corporate governance). The Board Office also supports the Chairman, the CEO, the CFO and the Chairmen of the Audit Committee and the Strategy Committee. Executive and Supervisory Board members also have access to legal advice via the Group Director Legal, Compliance & Board Office and via the Board Office. The Supervisory Board can also approach the Executive Board directly for specific advice on any matters. Accordingly, the Executive Board and the Supervisory Board consider that TUI AG lives up to the spirit and meaning of the UK Code.
B OA R D P E R F O R M A N C E E VA L UAT I O N ( B 6)
The performance of each individual Executive Board member is evaluated annually by the Supervisory Board for the annual per-formance-based remuneration. In this context, the Supervisory Board also reviews the individual member’s overall performance as part of the Executive Board. However, no external performance evaluation is done for the Executive Board.
It is not customary to conduct annual reviews of the Supervisory Board’s efficiency. Each Supervisory Board member can give feed-back to the Chairman, the Deputy Chairmen or the Supervisory Board as a whole as and when appropriate or required.
External evaluation, which includes the work of the Chairman of the Supervisory Board, is performed by means of individual inter-views and anonymous reviews. Executive Board members are in-vited to contribute to the process. Consolidated results are shared with the entire Supervisory Board and appropriate actions are suggested and discussed as appropriate. The last external review of the Supervisory Board was undertaken in 2015 by Board Con-sultants International. Board Consultants International has no other connection with TUI AG. Most recently, the Supervisory Board dealt with an update on the efficiency review and with measures derived from the results of the efficiency review at its meeting on 8 February 2016. An internal efficiency review was con-ducted at the end of 2018. It is planned to conduct an efficiency review with external support in the course of 2019.
A N N UA L R E - E L E C T I O N BY S H A R E H O L D E R S
AT T H E AG M ( B 7.1)
None of the Executive or Supervisory Board members is re-elected annually. However, as noted above, in light of the UK Code and UK best practice, TUI AG voluntarily puts individual resolutions ap-proving the actions of each Executive and Supervisory Board member to the AGM resolving on the annual financial statements for the previous year. TUI AG intends to continue this practice.
The end of appointment periods for Supervisory Board members are disclosed in the table from page 112. Current curricula vitae of all Executive and Supervisory Board members are published at www.tuigroup.com/en-en/investors/corporate-governance.
FA I R , B A L A N C E D A N D U N D E R S TA N DA B L E A N N UA L R E P O R T
A N D ACCO U N T S (C1 .1)
In a German stock corporation the Executive Board is responsible for drafting the Annual Report & Accounts (ARA). According to section 243 (2) of the German Commercial Act (HGB) the ARA must be clearly arranged and should present a realistic picture of the Company’s economic situation. This is equivalent to the UK Code requirement for the ARA to be fair, balanced and under-standable. Although this assessment has not been delegated to the Audit Committee (C3.4), the Executive Board is convinced that this ARA satisfies both requirements.
E S TA B L I S H M E N T A N D O P E R AT I O N O F R E M U N E R AT I O N
CO M M I T T E E ( D 2) , R E M U N E R AT I O N ( D1)
In the German governance structure there is no separate Remu-neration Committee. The remuneration of the Executive Board is under involvement of the employee representatives monitored and agreed by the Supervisory Board based on recommendations from the Presiding Committee, which is governed by the Supervisory Board Rules of Procedure, as referred to above.
Supervisory Board remuneration and the remuneration of Board Committee members is governed by the Articles of Association as resolved on by the shareholders at the AGM.
There are no clawback or malus provisions in the service contracts of Executive Board members. Such provisions are not yet wide-spread in Germany and, depending on their design, are difficult to enforce. However, there are different contractual and statutory provisions that may allow for a reduction or forfeiture of remunera-tion components or allow TUI AG to claim damages from Executive Board members. First, the service contracts of Executive Board members provide for forfeiture of the annual bonus and the LTIP if TUI AG terminates the service contract for cause without notice before the end of the one year performance period in the case of the annual bonus or before the end of the respective performance period of the LTIP. Second, according to section 87 (2) German Stock Corporation Act (AktG) the Supervisory Board may, under certain exceptional circumstances, reduce Executive Board com-pensation in case of a deterioration of the economic situation of TUI AG. Third, Executive Board members may be liable for damages under the German Stock Corporation Act in case of a breach of their duties of care or fiduciary duties.

COR P OR AT E GOV E R N A NC E » Cor p or AT e GoV e r N A NC e r e p orT 119
See the Directors’ Remuneration Report from page 128 for full de-tails on Executive and Supervisory Board member s remuneration.
N O T I C E P E R I O D S F O R E X E C U T I V E D I R E C TO R S ( D1 . 5 )
In accordance with the customary practice in Germany members of the Executive Board are appointed for a term of three to five years. This does not comply with the UK Code recommendation which stipulates that notice or contract periods should be set at one year or less. However, the contracts include maximum limits on the amounts payable on termination.
See Remuneration Report from page 128
D I A L O G U E W I T H S H A R E H O L D E R S ( E1)
It was not common practice in German companies for Supervisory Board members to make themselves available for meetings with major shareholders. However, the German Corporate Governance Code in the version dated 7 February 2017 now stipulates in sec-tion 5.2 that the Chairman of the Supervisory Board should be willing to meet with investors in an appropriate manner to discuss Supervisory Board matters. Shareholders made no use of this option in FY 2018.
The table below provides an overview of all meetings of the Execu-tive Board with shareholders, in some of which also employees of Investor Relations participated.
Dialogue with shareholders
Date Meeting Participants
October 2017 Roadshow Brussels HB
Roadshow Paris HB
November 2017 J.P. Morgan Best of British FTSE 100
Conference HB
December 2017 Roadshow UK FJ, HB
January 2018
Commerzbank German Investment
Seminar HB
Roadshow US HB
UniCredit / Kepler Cheuvreux German
Corporate Conference HB
Roadshow UK HB
Berenberg IR Forum HB
February 2018 Roadshow Tokio HB
Roadshow Dublin HB
March 2018
Barclays Select Leisure & Transport
Corporate Day HB
Barclays Select UK Conference HB
Roadshow US HB
April 2018 Morgan Stanley Roundtable HB
May 2018
Roadshow UK FJ, HB
Roadshow Frankfurt FJ, HB
Roadshow Paris HB
Roadshow Amsterdam HB
Roadshow Zurich HB
Roadshow Copenhagen HB
Roadshow Oslo HB
June 2018
dbAccess German, Swiss and Austrian
Conference HB
Roadshow US HB
Credit Suisse Leisure Sector Conference HB
August 2018 MainFirst Travel and Transport Days HB
Commerzbank Sector Conference HB, BC
September 2018
BAML – Travel & Leisure Field Trip HB
Citi Growth Conference 2018 –
Travel & Leisure Day HB, BC
Berenberg & Goldman Sachs GCC
Conference HB, BC
Bernstein Strategic Decisions Conference FJ, BC
Key: Friedrich Joussen (FJ), Horst Baier (HB), Birgit Conix (BC)
Key topics discussed at meetings between shareholders and Executive Board members included:
• Exogenous impacts on the business model• Growth strategy of the integrated tourism group• Business development in the individual company sectors
The Supervisory Board receives feedback from the Chairman and Deputy Chairman (shareholder representative) and Executive Board members following meetings with major shareholders or investors. Additionally, a monthly Investor Relations Report and event-driven assessments of brokers are forwarded to the Executive
COR P OR AT E GOV E R N A NC E » Cor p or AT e GoV e r N A NC e r e p orT 120
Board and the Supervisory Board. They contain updates on the share price development, analyses of the shareholder structure as well as purchases and sales of shares and feedback and assess-ments from investors.The Executive Board and the Supervisory Board consider that TUI AG lives up to the spirit and meaning of the UK Code.
AG M R E S O L U T I O N O N F I N A N C I A L S TAT E M E N T S A N D
CO N S O L I DAT E D F I N A N C I A L S TAT E M E N T S ( E 2 .1)
It is not common practice in Germany to pass a resolution at the AGM to approve the financial statements and consolidated finan-cial statements. Therefore, this was not done at the AGM in 2018 and it is not intended to do so at the AGM in 2019. However, as required by German law, the first item on the agenda of TUI AG’s AGM is the presentation of the financial statements and consoli-dated financial statements to the AGM. Under this item, the Exec-utive Board will explain the financial statements and consolidated financial statements and the Chairman will explain, in particular, the report of the Supervisory Board (including this UK Corporate Governance Statement). Shareholders will have the opportunity to raise questions. Questions are typically raised, as is normal in the AGMs of German companies, and, as a general rule, answers must be provided under German law.
This is the standard practice for a German company and is in full compliance with the German Code. While the lack of a resolution to approve the Annual Report & Accounts is not in compliance with the UK Code, TUI AG considers that the arrangements afford shareholders with sufficient opportunity to raise any questions or concerns that they may have in relation to the Annual Report & Accounts, and to receive answers, in the AGM. Accordingly, the Executive Board and the Supervisory Board consider that TUI AG lives up to the spirit and meaning of the UK Code to the extent practicable.
C I R C U L AT I O N O F AG M D O C U M E N TAT I O N TO
S H A R E H O L D E R S ( E 2 . 4 )
The 2018 AGM of TUI AG was held on 13 February 2018. As re-quired by German law, the notice convening TUI AG’s 2018 AGM (including the agenda and the voting proposals of the Executive Board and the Supervisory Board) was published in the Federal Gazette in Germany on 4 January 2018. Shareholders then had the right under German law to request additional agenda items at any time up to 30 days before the AGM. In accordance with German practice, once this deadline had expired, the combined invitation and explanatory notes relating to the AGM were sent to shareholders on 18 January 2018, which was less than the 20 working days before the AGM recommended in the UK Code (but more than the 21 days’ notice required by German law). However, in addition to the original publication of the Invitation in the Fed-eral Gazette in Germany, the combined invitation and explanatory notes relating to the AGM was published on TUI AG’s website on 4 January 2018. As no additional agenda items were requested by shareholders, this was in the same form as the final combined in-vitation and explanatory notes relating to the AGM later sent to shareholders. Furthermore, TUI AG s Annual Report and Accounts
for the financial year ending 30 September 2017 was published on 13 December 2017, significantly more than 20 working days before the 2018 AGM. Accordingly, the Executive Board and the Supervi-sory Board consider that TUI AG lives up to the spirit and meaning of the UK Code requirements. A similar timetable will be followed in relation to the 2019 AGM.“
3. Further information on Corporate Governance
F U N C T I O N I N G O F T H E E X E C U T I V E A N D S U P E R V I S O RY
B OA R D S
TUI AG is a company under German law. One of the fundamental principles of German stock corporation law is the dual manage-ment system involving two bodies, the Executive Board in charge of managing the company and the Supervisory Board in charge of monitoring the company. TUI AG’s Executive Board and Supervisory Board cooperate closely and in a spirit of trust in managing and overseeing the Company, with strict separation between the two bodies in terms of their membership and competences. Both bod-ies are obliged to ensure the continued existence of the Company and sustainable creation of added value in harmony with the prin-ciples of the social market economy.
TUI AG’s Executive Board comprised seven members as at the closing date 30 September 2018. The Executive Board is responsi-ble for managing the Company’s business operations in the inter-ests of the Company. The allocation of functions and responsibili-ties to individual Board members is presented in a separate section.
For functions, see tables ‘Supervisory Board and Executive Board’
on page 112 et seq.
In accordance with the law and the Articles of Association, the Supervisory Board had 20 members at the balance sheet date, i. e. 30 September 2018. The Supervisory Board advises and oversees the Executive Board in the management of the Company. It is involved in strategic and planning decisions and all decisions of fundamental importance to the Company. When the Executive Board takes decisions on major transactions, such as the annual budget, major acquisitions or divestments, it is required by its terms of reference to seek the approval of the Supervisory Board. The Chairman of the Supervisory Board coordinates the work in the Supervisory Board, chairs its meetings and represents the concerns of the body externally. The Supervisory Board and the Audit Committee have adopted terms of reference for their own work. In the run-up to the Supervisory Board meetings, the repre-sentatives of shareholders and employees meet separately.
The Executive Board provides the Supervisory Board at regular meetings and in writing with comprehensive, up-to-date informa-tion about the strategy, the budget, business performance and the situation of the Group, including risk management and compliance. The Executive Board works on the basis of terms of reference issued by the Supervisory Board.

COR P OR AT E GOV E R N A NC E » Cor p or AT e GoV e r N A NC e r e p orT 121
TUI AG has taken out a D & O insurance policy with an appropriate deductible for all members of the Executive Board and Supervisory Board. The deductible amounts to 10 % of the loss up to the amount of one and a half times the fixed annual compensation.
CO M P O S I T I O N O F T H E S U P E R V I S O RY B OA R D
As at the balance sheet date, 30 September 2018, the Supervisory Board of TUI AG comprised 20 members. The composition of the Supervisory Board in FY 2018 ensured that its members as a group had the knowledge, ability and expert experience required to properly complete their tasks. The goals set by the Supervisory Board itself for its composition include in particular comprehensive industry knowledge, at least five independent shareholder repre-sentatives, at least five members with international experience, and diversity (see also the diversity concepts for the Supervisory Board and the Executive Board from page 123 of this report).
Twelve members of the Supervisory Board had considerable inter-national experience. Due to the different professional experiences of its members, the composition of the Supervisory Board overall reflects a great diversity of relevant experience, ability and indus-try knowhow. None of the shareholder representatives on the Supervisory Board had any commercial or personal relationship with the Company, its Executive Board or third parties that might cause a material clash of interests. Seven shareholder representa-tives are independent (including the Chairman of the Supervisory Board, who can be included in the count according to the German Corporate Governance Code). The seven independent members were Prof. Edgar Ernst, Ms Angelika Gifford, Ms Valerie Gooding, Sir Michael Hodgkinson (until February 13, 2018), Dr Dieter Zetsche (from February 13, 2018), Ms Janis Kong, Ms Coline McConville and Prof. Klaus Mangold.
In accordance with the recommendations of the German Corpo-rate Governance Code, the original shareholder representatives were individually elected for five-year terms of office during elec-tions to the Supervisory Board at the relevant General Meetings (October 2014, February 2016, February 2018). Only Prof. Klaus Mangold and Sir Michael Hodgkinson were older than 68 years when they were elected as members of the Supervisory Board. In both cases, the Supervisory Board deemed it appropriate to deviate from the regular age limit in order for the Company to benefit from Prof. Klaus Mangold’s and Sir Michael Hodgkinson’s extensive experience in order to complete the integration process and in order to ensure continuity. With Peter Long, a former member of the Executive Board has been a Supervisory Board member since the Annual General Meeting 2016 held on 9 February 2016.
CO M M I T T E E S O F T H E S U P E R V I S O RY B OA R D A N D T H E I R
CO M P O S I T I O N
At 30 September 2018, the balance sheet date, the Supervisory Board had established four committees from among its members to support its work: the Presiding Committee, the Audit Committee, the Nomination Committee and the Strategy Committee. In addition, in accordance with section 27 (3) of the German Co-Determination Act, the Mediation Committee was furthermore established.
The Presiding Committee and Audit Committee have eight mem-bers each, with an equal number of shareholder representatives (including the respective chairpersons of the committees) and employee representatives. The Presiding Committee prepares, in particular, the appointment of Executive Board members, includ-ing the terms and conditions of service contracts and remunera-tion proposals. The Audit Committee’s task is to support the Supervisory Board in exercising its oversight function. The Chair-man of the Audit Committee is an independent financial expert and has particular knowledge and experience in the application of accounting principles and internal control methods from his own professional practice.
The Nomination Committee consists exclusively of shareholder representatives, in keeping with the recommendation in the German Corporate Governance Code. The task of its four members is to suggest suitable candidates for the Supervisory Board to propose to the Annual General Meeting.
The Strategy Committee began its work after the Annual General Meeting 2016. Its task is to comprehensively advise and oversee the Executive Board in developing and implementing the corporate strategy. It prepares the annual strategy offsite meeting for the Supervisory Board, but does not have a mandate to take any decisions on behalf of the Supervisory Board. It comprises five shareholder representatives and one employee representative.
CO N F L I C T S O F I N T E R E S T
Executive and Supervisory Board members have a duty to act in TUI AG’s best interests. In the completed FY 2018, there were no conflicts of interest requiring disclosure to the Supervisory Board. None of the Executive Board or Supervisory Board members has a board role or a consultancy contract with one of TUI’s competitors.
S P E C I F I C AT I O N S P U R S UA N T TO S E C T I O N S 76 (4 ) , 111 ( 5 )
O F T H E G E R M A N S TO C K CO R P O R AT I O N AC T
At least 30 % of the Supervisory Board members were women and at least 30 % were men at the balance sheet date. The Supervisory Board was therefore compliant with section 96 (2) sentence 1 of the German Stock Corporation Act. Neither the shareholder nor the employee representatives on the Supervisory Board objected to overall compliance in accordance with section 96 (2) sentence 2 of the German Stock Corporation Act.
The Supervisory Board resolved, in keeping with section 111 (5) of the German Stock Corporation Act, that until 31 October 2020 one woman is required to be a member of the Executive Board. This
COR P OR AT E GOV E R N A NC E » Cor p or AT e GoV e r N A NC e r e p orT 122
goal was achieved in the reporting period with Dr Elke Eller’s mem-bership in the Executive Board and was exceeded since 15 July 2018 with the appointment of Ms Birgit Conix.
In turn, the Executive Board resolved, in keeping with section 76 (4) of the German Stock Corporation Act, that women should account for 20 % of executives at the level immediately below the Executive Board and 30 % at the level below this. Both targets are to be achieved by 30 September 2020. For this reason, TUI AG has imple-mented various measures over the past years aimed at increasing the proportion of women on a long-term and sustainable basis. This includes, among other things, the promotion of women in tal-ent programmes and specifically addressing them in the recruit-ment process. In addition, at least one woman should always be on the shortlist in the recruitment process for positions in the Senior Leadership Team. As a result of these measures, the proportion of women at TUI AG at the first management level below the Execu-tive Board increased from 18 % to 24 % and thus exceeded the target of 20 %. The proportion of women at TUI AG at the second management level below the Executive Board was kept constant at 24 %. At these levels, however, staff turnover is generally very low. As a result, the proportion of women can only be increased slowly. Despite all the measures taken, the suitability and qualification of candidates for filling vacant positions are still of primary importance.
S H A R E H O L D E R S A N D A N N UA L G E N E R A L M E E T I N G
TUI AG shareholders exercise their co-determination and monitor-ing rights at the Annual General Meeting, which takes place at least once a year. The AGM takes decisions on all statutory matters, and these are binding on all shareholders and the Company. For voting on resolutions, each share confers one vote.
All shareholders registering in due time are entitled to participate in the Annual General Meeting. Shareholders who are not able to attend the AGM in person are entitled to have their voting rights exercised by a bank, a shareholder association, one of the repre-sentatives provided by TUI AG and acting on the shareholders’ be-half in accordance with their instructions, or some other proxy of their own choosing. Shareholders also have the opportunity of authorising the representative provided by TUI AG via the web in the run-up to the AGM. Shareholders can, moreover, register for electronic dispatch of the AGM documents.
The invitation to the AGM and the reports and information required for voting are published in accordance with the provisions of the German Stock Corporation Act and provided in German and English on TUI AG’s website. During the AGM, the presentations by the chairman of the Supervisory Board and the Executive Board members can be followed live over the Internet.
R I S K M A N AG E M E N T
Good corporate governance entails the responsible handling of commercial risks. The Executive Board of TUI AG and the manage-
ment of the TUI Group have comprehensive general and company- specific reporting and monitoring systems available to identify, assess and manage these risks. These systems are continually developed, adjusted to match changes in overall conditions and reviewed by the auditors. The Executive Board regularly informs the Supervisory Board about existing risks and changes to these risks. The Audit Committee deals in particular with monitoring the accounting process, including reporting, the effectiveness of the internal control and risk management systems and the internal auditing system, compliance and audit of the annual financial statements.
More detailed information about risk management in the TUI Group is presented in the Risk Report. It also contains the report on the accounting-related internal control and risk management system required in accordance with the German Commercial Code (sec-tions 289 (5), 315 (2) no. 5 HGB).
Risk Report see page 40
T R A N S PA R E N C Y
TUI provides immediate, regular and up-to-date information about the Group’s economic situation and new developments to capital market participants and the interested public. The Annual Report and the Interim Reports are published within the applicable timeframes. The Company publishes press releases and ad hoc announcements, if required, on topical events and any new devel-opments. Moreover, the company website at www.tuigroup.com provides comprehensive information on TUI Group and the TUI share.
The scheduled dates for the principal regular events and publica-tions – such as the AGM, Annual Report and Interim Reports – are set out in a financial calendar. The calendar is published well in advance and made permanently accessible to the public on TUI AG’s website.
D I R E C TO R S ’ D E A L I N G S
The Company was informed by Alexey Mordashov (via Unifirm Ltd.), Friedrich Joussen and Ortwin Strubelt of notifiable purchase and sale transactions of TUI AG shares or related financial instruments by directors (directors’ dealings or managers’ transactions) concerning FY 2018. Details are provided on the Company’s website.
Purchase and sales transactions by members of the boards are governed by the Group Manual Share Dealings by Restricted Per-sons, approved by the Executive Board and the Supervisory Board, alongside corresponding statutory provisions. The Group Manual Share Dealings by Restricted Persons stipulates above all an obligation to receive a clearance to deal for transactions with TUI AG’s financial instruments.
COR P OR AT E GOV E R N A NC E » Cor p or AT e GoV e r N A NC e r e p orT 123
ACCO U N T I N G A N D AU D I T I N G
TUI AG prepares its consolidated financial statements and consoli-dated interim financial statements in accordance with the provi-sions of the International Financial Reporting Standards (IFRS) as applicable in the European Union. The statutory annual financial statements of TUI AG, which form the basis for the dividend pay-ment, are prepared in accordance with the German Commercial Code (HGB). The consolidated financial statements are prepared by the Executive Board, audited by the auditors and approved by the Supervisory Board. The interim report is discussed between the Audit Committee and the Executive Board prior to publication.The consolidated financial statements and the financial statements of TUI AG were audited by Deloitte GmbH Wirtschaftsprüfungs-gesellschaft, Hannover, the auditors elected by the 2018 Annual General Meeting. The audit was based on German auditing rules, taking account of the generally accepted auditing standards issued by the German Auditors’ Institute as well as the International Standards on Auditing. It also covered the risk detection system. A review pursuant to Listing Rule 9.8.10R was carried out.
See audit opinion by the auditors on page 260
The condensed consolidated interim financial statement and management report as at 31 March 2018 was reviewed by the auditors.
In addition, a contractual agreement was concluded with the audi-tors to the effect that the auditors will immediately inform the Supervisory Board of any grounds for disqualification or partiality as well as of all findings and events of importance arising during the performance of the audit. There were no grounds to provide such information in the framework of the audit of FY 2018.
Diversity concepts for the composition of the Executive Board and Supervisory Boards
D I V E R S I T Y CO N C E P T F O R T H E CO M P O S I T I O N O F T H E
E X E C U T I V E B OA R D
The diversity concept for the composition of the Executive Board takes into account the following diversity aspects:(a) Age As a rule, the employment contracts of members of the Exec-
utive Board end once the standard retirement age for statutory retirement insurance has been reached (currently 67).
(b) Gender The Executive Board should include one woman.(c) Educational / professional background The necessity for a variety of educational and professional
backgrounds already arises from the obligation to manage the company in accordance with the law, the company’s articles of association and its terms of reference. In addition, the Execu-tive Board as a whole, through its individual members, should possess the following essential background qualities:
• management experience, some of which ideally has been acquired abroad, and intercultural competence for successful management and motivation of global teams
• in-depth practical experience in stakeholder dialogue (i. e. with managers and employees, including their representative bodies, with shareholders and the public)
• experience in IT management and an understanding of digitalisation of vertically integrated value chains
• profound experience in value-driven, KPI-based strategy development and implementation and corporate governance
• profound knowledge of the intricacies and requirements of the capital market (shareholder management)
• knowledge of accounting and financial management (con-trolling, financing)
• in-depth understanding of and experience with change management.
G O A L S O F T H E D I V E R S I T Y CO N C E P T F O R T H E CO M P O S I T I O N
O F T H E E X E C U T I V E B O A R D
The standard retirement age on the one hand enables incumbent members of the Executive Board to contribute their professional and life experience for the good of the company for as long a time as possible. On the other hand, adherence to the standard retire-ment age is intended to promote regular rejuvenation of the board.
Inclusion of both genders in Executive Board work is on the one hand an expression of the conviction of the Supervisory Board that mixed-gender teams lead to the same or better outcomes as teams with representation from only one gender. But it is also the logical continuation of the gender diversity measures implement-ed by the Executive Board within the wider company, which aim to increase the proportion of women in leadership roles. These measures are only to be applied and implemented in a credible manner if the Executive Board does not consist solely of male members (‘proof of concept’).
A variety of professional and educational backgrounds is necessary on the one hand to properly address the tasks and obligations of the law, the company’s articles of association and its terms of refer-ence. In addition, it is the view of the Supervisory Board that they are a guarantee of ensuring diverse perspectives on the challenges and associated approaches to overcoming them that are faced in the day-to-day work of the company. International management experience is of particular importance. Without such skill and ex-perience with integrating, leading and motivating global teams, it is impossible to take into consideration the different cultural back-grounds of managerial staff and the workforce as a whole.
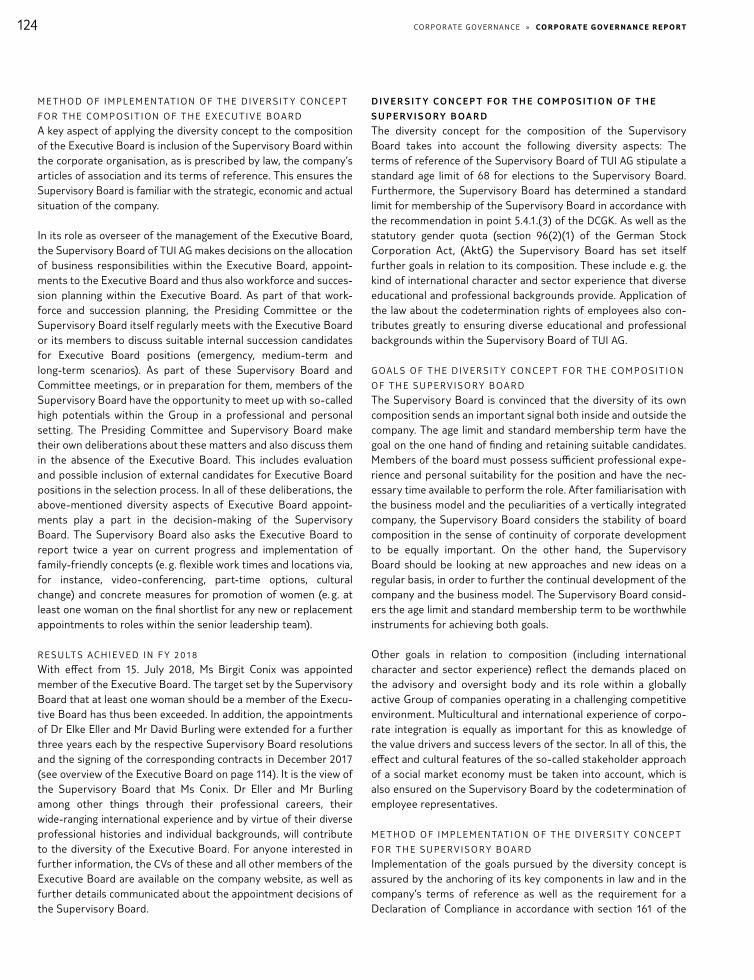
COR P OR AT E GOV E R N A NC E » Cor p or AT e GoV e r N A NC e r e p orT 124
M E T H O D O F I M P L E M E N TAT I O N O F T H E D I V E R S I T Y CO N C E P T
F O R T H E CO M P O S I T I O N O F T H E E X E C U T I V E B O A R D
A key aspect of applying the diversity concept to the composition of the Executive Board is inclusion of the Supervisory Board within the corporate organisation, as is prescribed by law, the company’s articles of association and its terms of reference. This ensures the Supervisory Board is familiar with the strategic, economic and actual situation of the company.
In its role as overseer of the management of the Executive Board, the Supervisory Board of TUI AG makes decisions on the allocation of business responsibilities within the Executive Board, appoint-ments to the Executive Board and thus also workforce and succes-sion planning within the Executive Board. As part of that work-force and succession planning, the Presiding Committee or the Supervisory Board itself regularly meets with the Executive Board or its members to discuss suitable internal succession candidates for Executive Board positions (emergency, medium-term and long-term scenarios). As part of these Supervisory Board and Committee meetings, or in preparation for them, members of the Supervisory Board have the opportunity to meet up with so-called high potentials within the Group in a professional and personal setting. The Presiding Committee and Supervisory Board make their own deliberations about these matters and also discuss them in the absence of the Executive Board. This includes evaluation and possible inclusion of external candidates for Executive Board positions in the selection process. In all of these deliberations, the above-mentioned diversity aspects of Executive Board appoint-ments play a part in the decision-making of the Supervisory Board. The Supervisory Board also asks the Executive Board to report twice a year on current progress and implementation of family-friendly concepts (e. g. flexible work times and locations via, for instance, video-conferencing, part-time options, cultural change) and concrete measures for promotion of women (e. g. at least one woman on the final shortlist for any new or replacement appointments to roles within the senior leadership team).
R E S U LT S AC H I E V E D I N F Y 20 18
With effect from 15. July 2018, Ms Birgit Conix was appointed member of the Executive Board. The target set by the Supervisory Board that at least one woman should be a member of the Execu-tive Board has thus been exceeded. In addition, the appointments of Dr Elke Eller and Mr David Burling were extended for a further three years each by the respective Supervisory Board resolutions and the signing of the corresponding contracts in December 2017 (see overview of the Executive Board on page 114). It is the view of the Supervisory Board that Ms Conix. Dr Eller and Mr Burling among other things through their professional careers, their wide-ranging international experience and by virtue of their diverse professional histories and individual backgrounds, will contribute to the diversity of the Executive Board. For anyone interested in further information, the CVs of these and all other members of the Executive Board are available on the company website, as well as further details communicated about the appointment decisions of the Supervisory Board.
D I V E R S I T Y CO N C E P T F O R T H E CO M P O S I T I O N O F T H E
S U P E R V I S O RY B OA R D
The diversity concept for the composition of the Supervisory Board takes into account the following diversity aspects: The terms of reference of the Supervisory Board of TUI AG stipulate a standard age limit of 68 for elections to the Supervisory Board. Furthermore, the Supervisory Board has determined a standard limit for membership of the Supervisory Board in accordance with the recommendation in point 5.4.1.(3) of the DCGK. As well as the statutory gender quota (section 96(2)(1) of the German Stock Corporation Act, (AktG) the Supervisory Board has set itself further goals in relation to its composition. These include e. g. the kind of international character and sector experience that diverse educational and professional backgrounds provide. Application of the law about the codetermination rights of employees also con-tributes greatly to ensuring diverse educational and professional backgrounds within the Supervisory Board of TUI AG.
G O A L S O F T H E D I V E R S I T Y CO N C E P T F O R T H E CO M P O S I T I O N
O F T H E S U P E R V I S O R Y B O A R D
The Supervisory Board is convinced that the diversity of its own composition sends an important signal both inside and outside the company. The age limit and standard membership term have the goal on the one hand of finding and retaining suitable candidates. Members of the board must possess sufficient professional expe-rience and personal suitability for the position and have the nec-essary time available to perform the role. After familiarisation with the business model and the peculiarities of a vertically integrated company, the Supervisory Board considers the stability of board composition in the sense of continuity of corporate development to be equally important. On the other hand, the Supervisory Board should be looking at new approaches and new ideas on a regular basis, in order to further the continual development of the company and the business model. The Supervisory Board consid-ers the age limit and standard membership term to be worthwhile instruments for achieving both goals.
Other goals in relation to composition (including international character and sector experience) reflect the demands placed on the advisory and oversight body and its role within a globally active Group of companies operating in a challenging competitive environment. Multicultural and international experience of corpo-rate integration is equally as important for this as knowledge of the value drivers and success levers of the sector. In all of this, the effect and cultural features of the so-called stakeholder approach of a social market economy must be taken into account, which is also ensured on the Supervisory Board by the codetermination of employee representatives.
M E T H O D O F I M P L E M E N TAT I O N O F T H E D I V E R S I T Y CO N C E P T
F O R T H E S U P E R V I S O R Y B O A R D
Implementation of the goals pursued by the diversity concept is assured by the anchoring of its key components in law and in the company’s terms of reference as well as the requirement for a Declaration of Compliance in accordance with section 161 of the
COR P OR AT E GOV E R N A NC E » Cor p or AT e GoV e r N A NC e r e p orT 125
German Stock Corporation Act (AktG) on Corporate Governance within the company. As far as the shareholder side of the Supervi-sory Board is concerned, the Nomination Committee ensures that the binding and voluntary targets for the composition of the Super-visory Board are met. As part of regularly conducted efficiency audits, the Supervisory Board also undertakes a self-evaluation process, which includes aspects of its composition.
R E S U LT S AC H I E V E D I N F I N A N C I A L Y E A R 20 18
In the current financial year, no changes have been made to the diversity concept or the composition of the Supervisory Board. In accordance with the recommendation in point 5.4.1 (2) of the Ger-man Corporate Governance Code (version dated 7 February 2017) the Supervisory Board in its resolution of 14 September 2017 issued a competency profile for the composition of the board as a whole.
Since his election to the Supervisory Board at the 2018 Annual General Meeting, Dr Dieter Zetsche has made a very valuable con-tribution to the diversity of the Supervisory Board thanks to his extensive international experience and his extensive experience in the management of a major global corporation. From the point of view of the Supervisory Board, there is currently no further need for action in relation to diversity. On the shareholder side, both genders are equally represented, (50:50), and in terms of the board as whole, the proportion of women of 35 % is in excess of the statutory quota. With six different nationalities represented on
the Supervisory Board, its composition can be described as inter-national. The diversity of professional and educational back-grounds of the individual members of the board is also evident from the yearly updated CVs of Supervisory Board members pub-lished on the corporate website.
Compliance / Anti-corruption and anti-bribery
TUI Group’s Compliance Management System is a fundamental component in our commitment to entrepreneurial, environmental and socially responsible operations and management. It forms an indispensable part of TUI Group’s corporate culture and our corporate governance activities.
The strategic goal of TUI Group’s Compliance Management System is to prevent misconduct and avoid liability risks for the Company, its legal representatives, executives and employees and protect the reputation of the Company.
CO M P L I A N C E M A N AG E M E N T S Y S T E M
TUI Group’s Compliance Management System is based on a risk management approach and is built around three pillars: prevention, discovery and response, which, in turn, comprise a large number of internal measures and processes.
TUI Group’s Compliance Management System focuses on the legal sub-areas anti-corruption, competition and anti-trust law, data protection and export controls. It defines the related pilot and standard operation of the Compliance Management System and the documentation of the roles, responsibilities and processes in these areas.
The Compliance Management System applies to TUI AG and all German and foreign companies in which TUI AG directly or indirectly holds an interest of more than 50 % as well as other stakes directly or indirectly controlled by TUI AG (‘managed Group companies’). Implementation of the Compliance Management System is recom-
mended for investments not controlled by TUI AG (‘non-managed Group companies’). The Compliance Management System has been designed to meet the requirements of Auditing Standard PS 980 of the German Institute of Auditors.
CO M P L I A N C E S T R U C T U R E
TUI Group’s Compliance structure supports those responsible in their task of communicating values and rules and anchoring them in the Group. It ensures that Compliance requirements are imple-mented throughout the Group in different countries and cultures. TUI Group’s decentralised Compliance structure includes Head Compliance Officers, whose role is to implement and support the
P R E V E N T I O N
Compliance Policies and Group Policies
Compliance Training
Compliance Communication
Compliance Information
Compliance Risk Identification and Risk Assessment
E X P O S U R E
Reporting
Leads
Investigations
R E A C T I O N
Implementation of Process Controls
Exchange with Management and local Compliance Officers
Disciplinary Measures
Compliance Management Processes

COR P OR AT E GOV E R N A NC E » Cor p or AT e GoV e r N A NC e r e p orT 126
requirements of Group Legal Compliance. Under the aegis of the Chief Legal Compliance Officer, Group Legal Compliance works with the decentralised Compliance Officers to perform the following tasks at different management levels:
• Raising awareness of Compliance and the technical issues allo-cated to Legal Compliance
• Achieving the goals of the Code of Conduct and the Compliance Rules
• Providing training • Advising managers and employees • Securing the necessary exchange of information • Monitoring plans for national and international legislation • Providing regular quarterly reports to the Board and annual
reports to the Audit Committee of the Supervisory Board
In addition, the Group has a Compliance Committee headed by the CFO and consisting of the HR Director, the Heads of Group External Affairs and Communications, the Chief Legal Compliance Officer, Group Audit and representatives of the Group Works Council and the TUI Europe Forum. The committee meets on a regular basis as well as ad hoc in order to monitor implementation of the Compliance Management System and obtain reports about key indicators in this area.
CO M P L I A N C E C U LT U R E
The Compliance culture forms the basis for an appropriate, effective Compliance Management System. It reflects management’s funda-mental attitude and conduct and the role of the supervisory body. It is expressed in our corporate value ‘Trusted’, appealing to our employees’ personal responsibility and their honesty and sincerity in handling customers, stakeholders and employees.
CO D E O F CO N D U C T / S U P P L I E R S ’ CO D E O F CO N D U C T
The Code of Conduct, drawn up for the entire TUI Group, is a further embodiment of our Compliance culture and enshrines guiding principles for everyone to follow, from the Board members, execu-tives and senior management to every Group employee. It defines minimum standards for our employees to follow in their everyday work and in conflict situations. TUI’s Code of Conduct covers anti- corruption, avoiding conflicts of interest and handling invitations and gifts appropriately.
The Suppliers’ Code of Conduct forms the counterpart to TUI’s Code of Conduct. It details our ethical, social and legal expectations of our business partners.
Moreover, all business partners are required by contract to observe all national and international anti-corruption laws applicable to the supplier relationship. This places our business relationship with our partners on a solid legal and social basis.
CO M P L I A N C E R U L E S
In addition, the principles set out in the Code of Conduct are de-tailed in various policies and rules reflecting the legal requirements. This is supported by our Group-wide policy management, devel-oping the standards for Group-wide policies and coordinating incorporation of the relevant internal stakeholder groups, e. g. other departments and the works council. This approach is designed to provide TUI Group with a set of policies which are as complete and comprehensible as possible without seeking overregulation. TUI Group’s Compliance Rules offer guidance on appropriate conduct regarding gifts and invitations, data protection and compliance with trade sanctions. All groups of employees have thus been ac-quainted with policies of relevance to their everyday work.
CO M P L I A N C E R I S K A N A LY S I S
In the financial year under review, the Compliance Programme focused on various issues including data protection, protecting free and fair competition, anti-corruption measures and the handling of trade sanctions. A software is used, in particular for the above topics, to facilitate risk identification based on self-disclosure by TUI Group companies, with risks evaluated according to likelihood of occurrence and potential damage (including reputational damage). The results of the self-assessment are discussed with the companies affected and are included in a Group-wide risk evaluation process. The results of the compliance risk identification process are used to derive corresponding risk-minimising measures, which are included in the annual plan of Group Legal Compliance and agreed with the relevant bodies. Monitoring of the implementation of the measures is automated.
Risk analysis and prevention also includes the annual survey among 1,189 legal representatives and executives of TUI Group to identify potential conflicts of interest. Through the survey they have to provide information on any interests held in TUI Group competitors or key business partners as well as other issues of relevance to Compliance. The survey carried out in the financial year under review was completed by 100 % of the respondents. No indications were found suggesting that there were any conflicts of interests.
E U G E N E R A L DATA P R O T E C T I O N R E G U L AT I O N (G D P R )
With the EU GDPR taking effect on 25 May 2018, data protection, which was already a key priority for TUI Group, was stepped up in the financial year under review. Many measures were initiated both at Group level and in local companies, e. g. the structured coordination of all specialist data protection functions within the Company and the appointment of Data Protection Officers in nearly all relevant TUI Group companies (data protection governance). One of the key measures was the roll-out of online training on data protection in TUI Group companies from June 2018. By the end of FY 2018, 78 % of the target employees had completed the training. The training is still being carried out in some parts of the organisation.

COR P OR AT E GOV E R N A NC E » Cor p or AT e GoV e r N A NC e r e p orT 127
CO M P L I A N C E T R A I N I N G
Compliance training is a key element of TUI’s Compliance Manage-ment System, with its focus on preventing misconduct, and a crucial component of TUI Group’s Compliance culture. It is carried out according to a graded concept: managers and staff at TUI have all benefited from face-to-face teaching and online programmes. This enables all our executives and employees to acquaint themselves with Compliance and the underlying corporate values, regardless of their position in the company hierarchy and their geographical location. In the completed financial year, the training programme for new employees and risk groups was extended to include new concepts and allow for harmonisation. In addition, TUI companies and sectors offered training schemes with their own specific focus, e. g. anti-corruption, competition law or the appropriate handling of gifts and invitations, to raise awareness of the challenges they might face.
W H I S T L E B L O W E R S Y S T E M
In agreement with various stakeholder groups TUI offers its managers and employees a Group-wide whistleblower system to enable serious infringements of laws or of the corporate values anchored in TUI’s Code of Conduct to be reported anonymously and without reprisals. This whistleblowing system is currently available to staff in 53 countries. All reports are followed up in the interests of all stakeholders and the Company. Our top priority is to ensure confidentiality and handle information discreetly. In FY 2018, a communication campaign was carried out to remind employees of the existing whistleblower system. Any incidents resulting from the use of the whistleblower system are reviewed by Group Legal Compliance in conjunction with Group Audit. Infringe-ments are fully investigated in the interests of all our staff and the Company itself.
In the completed financial year, a total of 70 reports were received through the SpeakUp Line. Apart from the SpeakUp Line, employees also used the opportunity to directly report infringements to their
line managers, the Compliance contact in charge or the Compliance Mailbox. A further 13 reports were received through these channels. They were followed up whenever there were any indications suggest-ing potential infringements of internal policies or the law. Out of the 83 reports submitted in total, 24 cases initially presented prima facie indications of a Compliance infringement, leading to further investigations which in four cases resulted in disciplinary measures, culminating where appropriate in terminations of em-ployment contracts.
In the financial year under review, there were no infringements of a severe nature that would have given rise to a publication.
B U S I N E S S PA R T N E R S C R E E N I N G ( D U E D I L I G E N C E )
The risk analysis carried out by Compliance shows that there is a risk of active and passive corruption because we operate in countries with a high corruption index. Moreover, the risk of TUI business partners being subject to trade sanctions or similar listing cannot be ruled out.
Group Legal Compliance therefore performs software-based screenings of selected business partners at regular intervals. The process involves checking the names of business partners against international sanctions, terrorist and wanted persons lists. In the event of a match, we launch a range of measures, in extreme cases terminating the business relationship.
In FY 2018, we used this process to check 11,286 business partners against Compliance criteria. The screening software initially flagged 9,697 of these business partners as potential ‘hits’ as their names were identical with or similar to names included in sanctions lists. These potential ‘hits’ were then further investigated. In nine cases, the business organisation cooperating with the business partners in question were briefed about the results of the review, enabling them to implement further security measures.

COR P OR AT E GOV E R N A NC E » Cor p or AT e GoV e r N A NC e r e p orT 128
Remuneration Report
A. Introduction
The remuneration report outlines the remuneration of the members of the Executive Board of TUI AG as well as the remuneration of the members of its Supervisory Board in accordance with the articles of association. The remuneration report is based, in particular, on the recommendations of the German Corporate Governance Code (GCGC), the requirements of the German Commercial Code (Handelsgesetzbuch) and the German Stock Corporation Act (Aktiengesetz) and, to the extent practicable, the requirements of the UK Corporate Governance Code (UK CGC).
TUI AG is a German stock corporation that is also listed on the London Stock Exchange (LSE). Where mandatory provisions regard-ing the governance of or legal requirements for a German stock corporation are affected, these are disclosed in this report and placed in context with the UK CGC, as required.
B. Remuneration of the Executive Board
I . S H A R E H O L D E R S ’ A P P R OVA L O F T H E R E M U N E R AT I O N
S Y S T E M
In FY 2018 a new remuneration system for the members of the Executive Board has been established and approved with retroactive effect from the beginning of FY 2018 by the shareholders at the Annual General Meeting on 13 February 2018. With the exception of Mr Baier the new remuneration system is applicable to all members of the Executive Board. Due to Mr Baier’s resignation from the Executive Board of TUI AG, which was originally planned for 8 November 2018 in accordance with the service agreement con-cluded between him and the company and which was brought forward to the end of FY 2018 by mutual agreement, Mr Baier was not migrated to the new remuneration system.
Although the previous remuneration system meets all legal require-ments and results in appropriate remuneration, the Supervisory felt that the time has come to make the next step after the success-ful completion of the integration of former TUI Travel PLC into TUI AG. The new remuneration system contains improvements that follow best practice standards which are relevant to TUI AG as well as the Executive Board’s strategy for sustainable growth. The recommendations of the UK-Code as well as a diverging UK market practice are included respectively in the position described. Considering that and in view of the latest developments of the arrangement of the remuneration in Germany it has been decided to establish a remuneration system that takes into account both perspectives. The defined performance indicators aim to take into account the interests of all stakeholders and to create value for our providers of equity and external funding.
Thereby the new remuneration system completely waives the previous possibility of the Supervisory Board of granting an addi-tional bonus subject to its discretion and not linked to any targets or financial indicators. In fact, the variable remuneration components are subject of specific target sets which are closely oriented towards the forecast for the financial markets, which has been published within the Annual Report and Accounts and is if necessary, updated during the year.
Even though it is common practice in many companies applying the UK-Code, the shareholders of TUI AG do not vote annually on the remuneration system. This corresponds to the practice in most of the German stock companies and is in conformity with the German Stock Corporation Act. Nevertheless the targets to be achieved for FY 2018 are being retroactively clarified in the remuneration report in order to enable stakeholders to gain an understanding of the underlying target achievements in the framework of the new remuneration system.
I I . G E N E R A L P R I N C I P L E S
Following a recommendation from the Presiding Committee, the Supervisory Board determines in accordance with section 87(1) sentence 1 German Stock Corporation Act the remuneration of the individual Executive Board members. It also regularly reviews the remuneration system for the Executive Board.
For further remits of the Presiding Committee, please see the report
of the Supervisory Board page 14
The following principles, in particular, are taken into account in this regard:
• Clarity and transparency• Economic position, performance and sustainable development
of the company• Tying shareholder interest to value increase and distribution
of profits (e. g. total shareholder return indicator) with corre-sponding incentives for Executive Board members
• Ability to be competitive on the market for highly qualified Executive Board members
• Appropriateness and conformity with tasks, responsibilities and success of each individual Executive Board member, including in the relevant environment of comparable international firms, and taking into account standard practice at other major German companies
• Tying a material portion of total remuneration to the achievement of ambitious, long-term performance targets
• Appropriate correlation between the levels of fixed remuneration and performance-based remuneration

COR P OR AT E GOV E R N A NC E » Cor p or AT e GoV e r N A NC e r e p orT 129
• Appropriateness in horizontal and vertical comparison (see page 144)
The remuneration system does not contain malus or clawback clauses. From the perspective of the Supervisory Board malus and clawback clauses which allow for a retroactive correction of variable remuneration are first of all an understandable request of stake-holders. However, in the German jurisdiction such clauses are still widely uncommon. Only for certain financial institutes they have recently become legally binding. It has thus not yet been clarified by the highest court, on which principles (eg. Transparency and appropriateness of malus and clawback) malus and clawback clauses are based in order to be effective and enforceable. Consequently, the Supervisory Board has abstained to include malus and clawback clauses in the service agreements of the members of the Executive Board in the course of the revision of the remuneration system. However, it has to be expressively stressed that the German law, especially the German Stock Corporation Act, does provide sufficient possibilities to enforce compensation claims towards members of the Executive Board who disregard their duties of acting in good faith.
I I I . R E M U N E R AT I O N O F T H E E X E C U T I V E B OA R D I N F Y 2 0 18
In FY 2018, the remuneration for the members of the Executive Board comprises: (1) a fixed remuneration; (2) an annual perfor-mance-based remuneration (Jahreserfolgsvergütung – JEV); (3) virtual shares of TUI AG in accordance with the Long-Term Incentive Plan (LTIP); (4) fringe benefits and (5) pension entitlements.
Details are set out below:
1 . F I X E D R E M U N E R AT I O N
Purpose and link to company strategy
Highly-qualified Executive Board members who are needed to develop and implement company strategy are to be attracted and retained.
The remuneration should be commensurate with the abilities, experience and tasks of the individual Executive Board member.
Procedure
In determining the fixed remuneration the Supervisory Board takes into account, in particular, the relevant and aforementioned general principles.
The fixed remuneration is paid in twelve equal instalments at the end of each month. If the service agreement begins or ends in the course of the financial year relevant for payment of the remuneration, the fixed annual remuneration will be paid pro rata for that year.
The remuneration is generally reviewed when service agreements of Executive Board members are extended, and can be adjusted or revised for the term of the new service agreement. A review of the remuneration can also take place during the term of a service agreement in particular if there is a change with respect to the tasks or responsibility of an Executive Board member.
2 . A N N U A L P E R F O R M A N C E- B A S E D R E M U N E R AT I O N (J E V )
Purpose and link to company strategy
The JEV is intended to motivate Executive Board members to achieve ambitious and challenging financial, operational and strategic targets throughout the financial year. The targets are reflective of the company strategy and aimed at increasing corporate value.
Procedure
The JEV is calculated on the base of three group performance indicators and the individual performance of the member of the Executive Board. The performance period is the financial year of TUI AG.
An individual target amount (Target Amount) is agreed for each Executive Board member in their service agreement. Since 1 Octo-ber 2018 the performance targets are Earnings Before Taxes (EBT) at constant currency, Return on Invested Capital (ROIC) and the Cash flow to the firm (Cash flow). The target values for the one-year performance period for the EBT, ROIC and Cash flow are set by Supervisory Board at the beginning of each financial year for the respective financial year.
The target achievement is calculated as follows:
2 .1 E A R N I N G S B E F O R E TA X E S ( E B T )
The previous group performance indicator Group EBITA was replaced by EBT on a constant currency basis with a weighting of 50 %. This change in group performance indicators permits inclusion of the net financial result in the calculation. The adjustment for currency effects makes it possible to measure the actual management performance without distortion from currency-induced translation effects.
• The EBT component of the JEV must reach a threshold of at least 90 % of the earnings target (on a constant currency basis) (equals target achievement of 50 %), in order to be relevant for bonus purposes.
• The achievement of an earnings target of 100 % equals a target achievement of 100 %.
• Anything in excess of 110 % (on a constant currency basis) of the earnings target (corresponds to a target achievement of 180 %) is not included.

COR P OR AT E GOV E R N A NC E » Cor p or AT e GoV e r N A NC e r e p orT 130
In the event of a quotient between 90 % and 100 %, linear interpolation will be used to determine the target achievement between 50 % and 100%, and in the event of a quotient between 100 % and 110%, linear interpolation will be used to determine the target achievement between 100 % and 180 %. The target achievement will be rounded to two decimal figures, as is customary in commercial practice.
2 . 2 R E T U R N O N I N V E S T E D C A P I TA L ( R O I C ) A S A D D I T I O N A L
G R O U P P E R F O R M A N C E I N D I C ATO R
The newly introduced group performance indicator ROIC will be included in the JEV with a weighting of 25 %. The Group EBITA and the average invested interest-bearing capital for the financial year will be weighed against each other to establish the ROIC of the TUI Group used to calculate the JEV. The average invested interest-bearing capital is calculated as the average value based on the invested capital balance at the beginning and end of the year. The invested capital is calculated as the equity (including non-controlling interests) plus interest-bearing liabilities, minus interest-bearing assets, plus a seasonal adjustment. By applying the average assess-ment previously used in the Annual Report, seasonal fluctu-ations and differences in capital intensity of the business model specific segments of TUI AG can be taken into account and a return on equity target can be included in the annual variable remuneration.
• The ROIC component of the JEV will only be included in the JEV where the return on investment is no more than 3 % points below the defined target (corresponds to a tar-get achievement of 50 %).
• If the return on investment corresponds to the defined target, the target achievement is 100 %.
• In order to reach maximum target achievement of 180 % the target must be exceeded by 3 % points or more.
In the event of a deviation between – 3 % points and 0 % points, linear interpolation will be used to determine the target achievement between 50 % and 100 %, and in the event of a deviation between 0 % points and 3 % points, linear interpola-tion will be used to determine the target achievement between 100 % and 180 %. The target achievement will be rounded to two decimal figures, as is customary in commercial practice.
2 . 3 C A S H F LO W A S A D D I T I O N A L G R O U P P E R F O R M A N C E
I N D I C ATO R
A cash flow component will also be included in the calculation as a third group performance indicator with a weighting of 25 %. For this purpose The cash flow is calculated based on the unadjusted earnings before interest, taxes and amortisation of goodwill reported in the approved and audited consolidated accounts of the TUI Group (EBITA according to the approved and audited consolidated accounts of the TUI Group) on a constant currency basis plus the difference between amorti-sations and write-backs, plus the change to the so-called Working Capital, minus the earnings from companies measured
according to the equity method, plus the dividends received by TUI AG from participating interests and minus net capex and investments. Working Capital includes short-term assets and liabilities that are not cash or cash equivalents (‘cash’), income tax receivables or liabilities or derivative financial instruments. Furthermore, interest- bearing assets and liabilities as well as short-term provisions for pensions are not included.
• The cash flow component of the JEV must reach a threshold of at least 90 % of the liquidity target (adjusted for foreign exchange effects) (corresponds to a target achievement of 50 %), in order to be relevant for bonus purposes.
• The achievement of a liquidity target of 100 % equals a target achievement of 100 %.
• Anything in excess of 110 % of the liquidity target (corre-sponds to a target achievement of 180 %) is not included.
In the event of a quotient between 90 % and 100 %, linear interpolation will be used to determine the target achievement between 50 % and 100 %, and in the event of a quotient between 100 % and 110 %, linear interpolation will be used to determine the target achievement between 100 % and 180 %. The target achievement will be rounded to two decimal figures, as is customary in commercial practice.
As before, the JEV depends on an individual performance factor in addition to the target achievements of the aforementioned group performance indicators. Under the new remuneration system the Supervisory Board shall determine the individual performance factor for the JEV (0.8 to 1.2) for each Executive Board member based on the achievement of three target categories: In addition to individual performance targets, this includes targets for the overall performance of the Executive Board and stakeholder targets. The Supervisory Board will establish the targets from these three categories and their relative weighting for each Executive Board member and financial year.
The value resulting from the multiplication of the target amount by the degree of target achievement for the EBT, the ROIC, the Cash flow and the individual performance factor will be paid out in the month of the approval and audit of the consolidated accounts of the TUI Group for the relevant financial year. If the service agreement begins or ends in the course of the relevant financial year, the claims for payment of the JEV will generally be pro rata.
Cap
The JEV will be capped at 180 % prior to the consideration of the individual performance factor. As a result, there is an annual cap for the JEV and an individual cap for each member of the Executive Board, which is shown in the table on page 136.
COR P OR AT E GOV E R N A NC E » Cor p or AT e GoV e r N A NC e r e p orT 131
In accordance with section 87(1) sentence 3 German Stock Corpo-ration Act, the Supervisory Board is entitled to limit the amount of the JEV to allow for extraordinary circumstances (e. g. takeover of the company, sale of parts of the company, uncovering of hidden reserves, external influences).
3 . A N N U A L P E R F O R M A N C E- B A S E D R E M U N E R AT I O N
ACCO R D I N G TO P R E V I O U S R E M U N E R AT I O N S Y S T E M
(O N LY A P P L I C A B L E TO M R B A I E R )
Due to his retirement from the Executive Board Mr Baier’s re-muneration has not been migrated to the new system in FY 2018. Thus, the provisions for the JEV of the previous remuneration system continue to be applicable for Mr Baier in FY 2018 and are set out as follows:
Procedure
The JEV is calculated on the basis of a group performance indicator and the individual performance of the Executive Board member. The performance reference period is the financial year of TUI AG.
An individual target amount (Target Amount) is agreed for Mr Baier in his service agreement. Since 1 October 2010 the performance target has been the reported earnings before interest, tax and amortisation of goodwill (Group EBITA). The target value for the one-year performance reference period for the group EBITA performance target is set each year by the Supervisory Board.
To measure performance, the target value will be compared with the corresponding actual value of the Group EBITA as reported in the audited consolidated accounts of TUI AG to be prepared in accordance with the accounting rules in force at the time. The degree of target achievement is determined as follows:
• If the actual value of the Group EBITA achieved is below the target value by 50 % or more, this is equivalent to a target achievement of 0 %.
• If the value achieved corresponds to the target value, this is equivalent to a target achievement of 100 %.
• If the value achieved exceeds the target value by 50 % or more, this is equivalent to a target achievement of 187.5 %.
Between 50 % below target value and target value, linear inter-polation between 0 % and 100 % will be used to determine the degree of target achievement. Between target value and 50 % above target value, linear interpolation between 100 % and 187.5 % will be used to determine the degree of target achievement. The degree of target achievement will be rounded to two decimal places, as is customary in commercial practice.
As in the past, the JEV depends on an individual performance factor in addition to the achievement of the above Group key performance indicator. The Supervisory Board now determines this individual
JEV performance factor (0.8 to 1.2) for Mr Baier based on the achievement of three target categories: In addition to individual performance targets, performance targets for the entire Executive Board and the stakeholder targets are also included in the de-termination. The Supervisory Board defined the targets from these three categories and their relative weighting for Mr Baier as well as for the other members of the Executive Board for FY 2018 at the beginning of the financial year.
The amount resulting from the multiplication of the target amount by the degree of target achievement for the Group EBITA and the individual performance factor will be paid out in cash in the month in which the Supervisory Board approves the annual accounts of TUI AG for the respective financial year.
Cap
There is an annual and individual cap for Mr Baier’s JEV, which is shown on page 136.
In accordance with section 87(1) sentence 3 German Stock Corpo-ration Act, the Supervisory Board is entitled to limit the amount of the JEV to allow for extraordinary circumstances (e. g. takeover of the company, sale of parts of the company, uncovering of hidden reserves, external influences).
4 . V I R T U A L S H A R E S ACCO R D I N G TO T H E LO N G -T E R M
I N C E N T I V E P L A N ( LT I P )
4 .1 F U N C T I O N I N G O F T H E N E W LO N G -T E R M I N C E N T I V E
P L A N ( LT I P )
Purpose and link to company strategy
The long-term objective is to increase corporate and shareholder value by defining ambitious goals that are closely linked to the company’s earnings, share price performance and dividends.
Procedure
The LTIP is a performance share plan based on virtual shares and is assessed over a period of four years (Performance Reference Period). Virtual shares are granted in annual tranches.
For Executive Board members, an individual target amount (Target Amount) is agreed in the service agreement. At the beginning of each financial year a provisional number of virtual shares, commen-surate with the target amount, will be set. This will constitute the basis for the determination of the final performance-based payment for the tranche in question at the end of the respective perfor-mance reference period. To set this number, the target amount will be divided by the average Xetra price of TUI AG shares over the 20 trading days prior to the beginning of the performance reference

COR P OR AT E GOV E R N A NC E » Cor p or AT e GoV e r N A NC e r e p orT 132
period (1 October of each year). The claim to a payment only arises upon expiry of the performance reference period and depends on whether or not the respective performance target is achieved.
4 .1 .1 TOTA L S H A R E H O L D E R R E T U R N ( T S R )
The relevant performance target for determining the amount of the payout after the performance reference period is the development of the Total Shareholder Return (TSR) of TUI AG in relation to the development of the TSR of the STOXX Europe 600 Travel & Leisure Index (Index). The relative TSR is being considered with a weighting of 50 %. The degree of target achievement is being determined depending on the TSR-value of TUI AG compared to the TSR-value of the com-panies belonging to the Index over the performance reference period. To determine the relative TSR of TUI AG the respective established TSR-value and those of the comparable companies are sorted in descending order. The relative TSR of TUI AG is expressed as a percentile (percentile rank).
Thereby the TSR is the aggregate of all share price increases plus the gross dividends paid over the performance reference period. The Data for the observation of the development of the TSR-values of TUI AG and the Index is provided by a reputable data provider (eg. Bloomberg, Thomson Reuters). The reference to determine the ranking is the composition of the Index on the last day of the respective performance reference period. The values for companies that were not listed over the entire performance reference period will be factored in on a pro rata basis. The level of target achieve-ment (in percent) for the relative TSR of TUI AG based on the percentile is calculated as follows:
• A percentile below the median corresponds, unlike the remuneration system removed with effect from 1 Octo-ber 2017, to a target achievement of 0 %
• A percentile equivalent to the median corresponds to a target achievement of 100 %.
• A percentile equivalent to the maximum value corresponds to a target achievement of 175 %.
In the event of a percentile between the median and the maximum value, linear interpolation will be used to determine the target achievement between 100 % and 175 %. The target achievement will be rounded to two decimal figures as is customary in commercial practice.
4 .1 . 2 E A R N I N G S P E R S H A R E ( E P S ) A S A D D I T I O N A L G R O U P
P E R F O R M A N C E I N D I C ATO R
Furthermore the average development of the Earnings per Share (EPS) p. a. as additional group performance indicator with a weighting of 50 % is taken into account for the LTIP. The average over the four years performance reference period is based on a pro forma underlying earnings per share from continuing operations as they are being published in the Annual Report and Accounts already.
The target achievement for the average development of the EPS p. a. based on the annual amounts is calculated as follows:
• An average increase p. a. of less than 3 % corresponds to a target achievement of 0 %.
• An average increase p. a. of 3 % corresponds to a target achievement of 25 %.
• An average increase p. a. of 5 % corresponds to a target achievement of 100 %.
• An average increase p. a. of 10 % or more corresponds to a target achievement of 175 %.
In the event of an average increase p. a. between 3 % and 5 % linear interpolation will be used to determine the target achievement between 25 % and 100 % and in the event of an average increase p. a. between 5 % and 10 % or more, linear interpolation will be used to determine the target achievement between 100 % and 175 %. The target achievement will be rounded as well to two decimal figures as is customary in commercial practice.
If the previous year’s EPS is below € 0.50 the Supervisory Board will, for each subsequent financial year, redefine absolute target values for the EPS as well as minimum and maximum values for determining the percentage target achievement.
The degree of target achievement (in percent) is calculated as the average of the respective target achievements for the performance targets relative TSR of TUI AG and EPS. To determine the final number of virtual shares the degree of target achievement at the date of the expiry of the performance reference period is being multiplied with the provisional number of virtual shares. The payout is obtained by the multiplication of the final number of virtual shares with the average XETRA price of TUI AG shares over the last 20 trading days in the respective performance reference period (until 30 September of every year). The amount will be paid out in the month of the approval and audit of the consolidated accounts of the TUI Group. If the service agreement begins or ends during the financial year relevant for the granting of the LTIP the claim to payout of the LTIP is in general calculated on a pro rata basis.
Cap
The maximum LTIP-payout is capped at 240 % of the individual target amount for each performance reference period. As a result, there is an annual cap for the LTIP and an individual cap for each member of the Executive Board, which is shown in the table on page 136.

COR P OR AT E GOV E R N A NC E » Cor p or AT e GoV e r N A NC e r e p orT 133
4 . 2 LO N G T E R M I N C E N T I V E P L A N ACCO R D I N G TO P R E V I O U S
R E M U N E R AT I O N S Y S T E M
For those members of the Executive Board whose service agree-ments already existed prior to FY 2018, the replaced remuneration system will initially continue to apply in part in parallel. This relates only to the LTIP tranches granted before FY 2018 but not yet included in the remuneration paid due to the performance period. In addition, Mr Baier did not migrate to the new remuneration system due to his aforementioned retirement from the Executive Board. Accordingly, the LTIP provisions of the former remuneration system continue to apply to Mr Baier for FY 2018, as described below:
Procedure
The LTIP is a performance share plan based on virtual shares and is assessed over a period of four years (Performance Reference Period). Virtual shares are granted in annual tranches.
For Executive Board members, an individual target amount ( Target Amount) is agreed in the service agreement. At the beginning of each financial year a provisional number of virtual shares, commen-surate with the target amount, will be set. This will constitute the basis for the determination of the final performance-based payment for the tranche in question at the end of the respective performance reference period. To set this number, the target amount will be divided by the average Xetra price of TUI AG shares over the 20 trading days prior to the beginning of the performance reference period (1 October of each year). The claim to a payment only arises upon expiry of the performance reference period and depends on whether or not the respective performance target is achieved.
The performance target for determining the amount of the final payout at the end of the performance reference period is the development of the total shareholder return (TSR) of TUI AG relative to the development of the TSR of the STOXX Europe 600 Travel & Leisure (Index), whereby the ranking of the TUI AG TSR in relation to the index companies will be monitored over the entire perfor-mance reference period. The TSR is the aggregate of all share price increases plus the gross dividends paid over the performance reference period. Data from a reputable data provider (e. g. Bloomberg, Thomson Reuters) will be used for the purpose of establishing the TSR values for TUI AG and the index. The reference for the purpose of determining the rankings is the composition of the index on the last day of the performance reference period. The values for companies that were not listed over the entire perfor-mance reference period will be factored in on a pro rata basis. The level of target achievement is established as follows depending on the ranking of the TSR of TUI AG relative to the TSR values of the index companies over the performance reference period:
• a TSR value of TUI AG equivalent to the bottom and second to bottom value of the index corresponds to a target achievement of 0 %.
• a TSR value of TUI AG equivalent to the third to bottom value of the index corresponds to a target achievement of 25 %.
• a TSR value of TUI AG equivalent to the median of the index corresponds to a target achievement of 100 %.
• a TSR value of TUI AG equivalent to the third to top, second to top or top value of the index corresponds to a target achievement of 175 %.
For performance between the third to bottom and the third to top rank, linear interpolation will be used to determine the level of target achievement at between 25 % and 175 %. The degree of target achievement will be rounded to two decimal places, as is customary in commercial practice.
To determine the final number of virtual shares, the degree of target achievement will be multiplied by the provisional number of virtual shares on the final day of the performance reference period. The payout is determined by multiplying the final number of virtual shares by the average Xetra price of TUI AG shares over the 20 trading days prior to the end of the performance reference period (30 September of each year). The payout which is calculated in this way will be due in the month of the approval of the annual accounts of TUI AG for the fourth financial year of the performance reference period and is paid out in cash. If the service agreement begins or ends in the course of the financial year relevant for the grant of the LTIP, the claims for payment of the same will generally be pro rata.
Cap
The LTIP is capped annually and individually for each member of the Executive Board; for the figures, see the table on page 136.
4 . 3 D E V E LO P M E N T O F A G G R E G AT E V I R T U A L S H A R E S O F
C U R R E N T E X E C U T I V E B O A R D M E M B E R S I N F Y 20 18
Number
Granting in FY 2018
Friedrich Joussen 125,342
Horst Baier 56,507
David Burling 63,014
Birgit Conix 13,303
Sebastian Ebel 54,012
Dr Elke Eller 52,740
Frank Rosenberger 52,397
Decrease in FY 2018*
Friedrich Joussen 129,484
Horst Baier 59,055
David Burling 14,582
Sebastian Ebel 35,186
* Decrease corresponts to amounts paid for LTIP-tranches that ended in FY 2018 (see DCGK-table on remuneration paid).
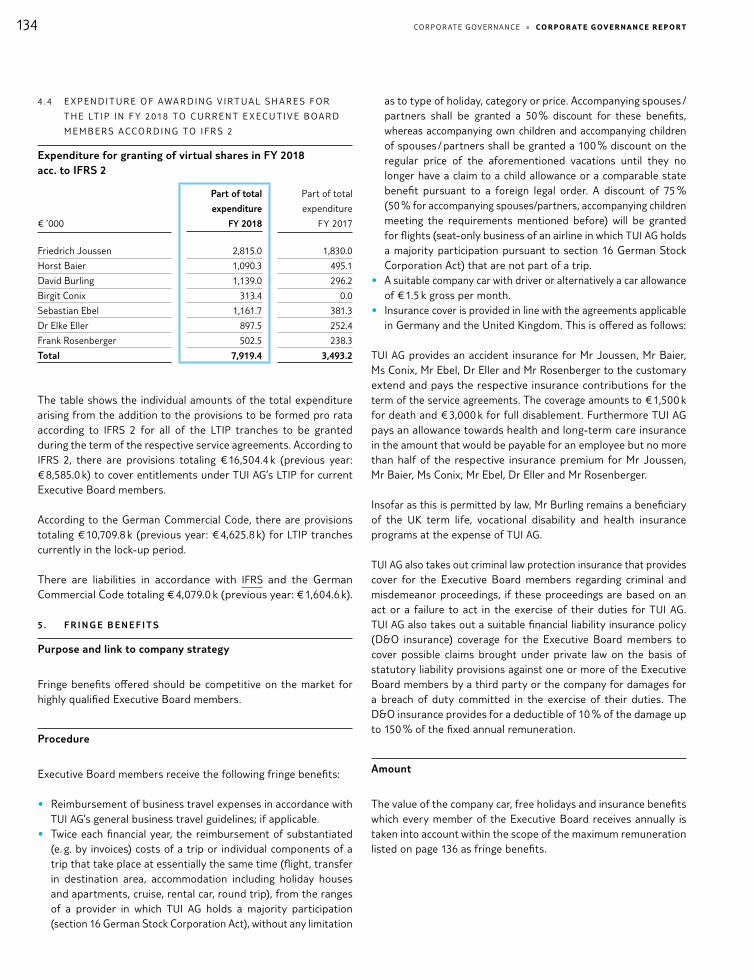
COR P OR AT E GOV E R N A NC E » Cor p or AT e GoV e r N A NC e r e p orT 134
4 . 4 E X P E N D I T U R E O F AWA R D I N G V I R T U A L S H A R E S F O R
T H E LT I P I N F Y 20 18 TO C U R R E N T E X E C U T I V E B O A R D
M E M B E R S ACCO R D I N G TO I F R S 2
Expenditure for granting of virtual shares in FY 2018 acc. to IFRS 2
€ ’000
Part of total
expenditure
FY 2018
Part of total
expenditure
FY 2017
Friedrich Joussen 2,815.0 1,830.0
Horst Baier 1,090.3 495.1
David Burling 1,139.0 296.2
Birgit Conix 313.4 0.0
Sebastian Ebel 1,161.7 381.3
Dr Elke Eller 897.5 252.4
Frank Rosenberger 502.5 238.3
Total 7,919.4 3,493.2
The table shows the individual amounts of the total expenditure arising from the addition to the provisions to be formed pro rata according to IFRS 2 for all of the LTIP tranches to be granted during the term of the respective service agreements. According to IFRS 2, there are provisions totaling € 16,504.4 k (previous year: € 8,585.0 k) to cover entitlements under TUI AG’s LTIP for current Executive Board members.
According to the German Commercial Code, there are provisions totaling € 10,709.8 k (previous year: € 4,625.8 k) for LTIP tranches currently in the lock-up period.
There are liabilities in accordance with IFRS and the German Commercial Code totaling € 4,079.0 k (previous year: € 1,604.6 k).
5 . F R I N G E B E N E F I T S
Purpose and link to company strategy
Fringe benefits offered should be competitive on the market for highly qualified Executive Board members.
Procedure
Executive Board members receive the following fringe benefits:
• Reimbursement of business travel expenses in accordance with TUI AG’s general business travel guidelines; if applicable.
• Twice each financial year, the reimbursement of substantiated (e. g. by invoices) costs of a trip or individual components of a trip that take place at essentially the same time (flight, transfer in destination area, accommodation including holiday houses and apartments, cruise, rental car, round trip), from the ranges of a provider in which TUI AG holds a majority participation (section 16 German Stock Corporation Act), without any limitation
as to type of holiday, category or price. Accompanying spouses / partners shall be granted a 50 % discount for these benefits, whereas accompanying own children and accompanying children of spouses / partners shall be granted a 100 % discount on the regular price of the aforementioned vacations until they no longer have a claim to a child allowance or a comparable state benefit pursuant to a foreign legal order. A discount of 75 % (50 % for accompanying spouses/partners, accompanying children meeting the requirements mentioned before) will be granted for flights (seat-only business of an airline in which TUI AG holds a majority participation pursuant to section 16 German Stock Corporation Act) that are not part of a trip.
• A suitable company car with driver or alternatively a car allowance of € 1.5 k gross per month.
• Insurance cover is provided in line with the agreements applicable in Germany and the United Kingdom. This is offered as follows:
TUI AG provides an accident insurance for Mr Joussen, Mr Baier, Ms Conix, Mr Ebel, Dr Eller and Mr Rosenberger to the customary extend and pays the respective insurance contributions for the term of the service agreements. The coverage amounts to € 1,500 k for death and € 3,000 k for full disablement. Furthermore TUI AG pays an allowance towards health and long-term care insurance in the amount that would be payable for an employee but no more than half of the respective insurance premium for Mr Joussen, Mr Baier, Ms Conix, Mr Ebel, Dr Eller and Mr Rosenberger.
Insofar as this is permitted by law, Mr Burling remains a beneficiary of the UK term life, vocational disability and health insurance programs at the expense of TUI AG.
TUI AG also takes out criminal law protection insurance that provides cover for the Executive Board members regarding criminal and misdemeanor proceedings, if these proceedings are based on an act or a failure to act in the exercise of their duties for TUI AG. TUI AG also takes out a suitable financial liability insurance policy (D&O insurance) coverage for the Executive Board members to cover possible claims brought under private law on the basis of statutory liability provisions against one or more of the Executive Board members by a third party or the company for damages for a breach of duty committed in the exercise of their duties. The D&O insurance provides for a deductible of 10 % of the damage up to 150 % of the fixed annual remuneration.
Amount
The value of the company car, free holidays and insurance benefits which every member of the Executive Board receives annually is taken into account within the scope of the maximum remuneration listed on page 136 as fringe benefits.

COR P OR AT E GOV E R N A NC E » Cor p or AT e GoV e r N A NC e r e p orT 135
6 . P E N S I O N B E N E F I T S
Purpose and link to company strategy
Highly-qualified Executive Board members who are needed to develop and implement company strategy are to be acquired and retained.
The pension benefits should be competitive on the market for highly qualified Executive Board members and should provide them with a corresponding level of benefits in their retirement.
Procedure
Benefits in the form of pensions are paid to former Executive Board members if they reach the predefined age limit or are permanently incapacitated. The Executive Board members are not entitled to receive transition payments upon leaving the Executive Board, with the exception of Mr Ebel who has an acquired right to receive transition payments under a legacy contract.
With regard to pension entitlements, different principles apply to Mr Joussen, Dr Eller, Mr Baier, Mr Ebel and Mr Rosenberger on the one hand and Mrs Conix and Mr Burling on the other hand due to the legacy systems in Germany, Belgium and the UK.
Mr Joussen, Dr Eller, Mr Baier, Mr Ebel and Mr Rosenberger are entitled to pensions according to the pension commitments granted to Executive Board members of TUI AG (TUI AG Pension Scheme). These Executive Board members receive, on an annual basis, a contractually agreed amount that is paid into an existing pension account for the respective Executive Board member. The contribu-tions to the company pension scheme of Mr Joussen, Dr Eller, Mr Baier and Mr Ebel carry an interest rate established in the pension commitment. The interest rate stands at 5 % p. a. The annual interest for Mr Rosenberger’s contributions to the company pension scheme is established by the company at its reasonable discretion in such a way that it does not exceed 5 % p. a. The beneficiary may choose between a one-off payment, payment by instalments or pension payments. The amounts agreed on in the service agreements of the aforementioned Executive Board members are:
• Mr Joussen: € 454.5 k per year. Mr Joussen becomes eligible for payment of the pension upon reaching the age of 62.
• Dr Eller: € 230.0 k per year. Dr Eller becomes eligible for payment of the pension upon reaching the age of 63.
• Mr Baier: € 267.75 k per year. Mr Baier becomes eligible for payment of the pension upon reaching the age of 60.
• Mr Ebel: € 207.0 k per year. Mr Ebel becomes eligible for payment of the pension upon reaching the age of 62.
• Mr Rosenberger: € 230.0 k per year. Mr Rosenberger becomes eligible for payment of the pension upon reaching the age of 63.
Should Mr Joussen, Dr Eller, Mr Baier, Mr Ebel and Mr Rosenberger retire from TUI AG before the normal retirement date due to an ongoing occupational disability, they will receive an occupational disability pension until they are able to work again, but at most until they reach the normal retirement date.
Under certain circumstances, spouses, partners or cohabitants of the Executive Board members will, should the respective Executive Board member die, receive a survivor’s pension worth 60 % of the pension for their lifetime or until remarriage. Children of Executive Board members will, should the respective Executive Board member die, receive an orphan’s pension, paid no longer than until they reach the age of 27 at the latest. Children who have lost one parent will receive 20 % of the pension, and those who have lost both parents will receive 25 %. This claim is subject to the prerequisite that the child meets the requirements set out in section 32(3), (4), sentence 1 nos. 1 to 3 and (5) German Income Tax Act (Einkommen-steuergesetz).
Mr Burling receives a fixed annual amount of € 225.0 k paid out in cash for his pension.
Ms Conix receives a fixed annual amount of € 230.0 k paid out in cash for her pension.
7. P E N S I O N P R OV I S I O N S F O R T H E C U R R E N T
E X E C U T I V E B OA R D M E M B E R S U N D E R T H E T U I AG
P E N S I O N CO M M I T M E N T S
At 30 September 2018, pension obligations for current Executive Board members totaled € 22,061.9 k (previous year balance sheet date: € 19,731.2 k) according to IAS 19. This includes € 4,624.3 k (previous year balance sheet date: € 4,501.3 k) for claims earned by Mr Ebel during the course of his work for the TUI Group up until 31 August 2006. The remaining claims can be broken down as follows:

COR P OR AT E GOV E R N A NC E » Cor p or AT e GoV e r N A NC e r e p orT 136
Pension of current Executive Board members below TUI AG Pension scheme
Addition to / reversal from
pension provision
Net present value
€ ’000 2018 2017 30 Sep 2018 30 Sep 2017
Friedrich Joussen 343.5 200.0 3,550.3 3,206.9
Horst Baier 1,080.9 89.7 10,190.7 9,109.8
Sebastian Ebel 164.3 118.7 1,558.4 1,394.1
Dr Elke Eller 313.5 277.6 1,026.7 713.2
Frank Rosenberger 305.6 805.9 1,111.5 805.9
Total 2,207.8 1,491.9 17,437.6 15,229.9
According to commercial law provisions, the pension obligations for current Executive Board members amounted to € 18,508.4 k (previous year balance sheet date: € 15,738.4 k); this includes € 3,263.2 k (previous year balance sheet date: € 2,925.0 k) for claims earned by Mr Ebel during the course of his work for the TUI Group up until 31 August 2006.
Where the above table shows a corresponding amount, the pension obligations for beneficiaries are funded via the conclusion of pledged reinsurance policies.
8 . R E M U N E R AT I O N C A P S
The following caps apply to the remuneration (remuneration components and total remuneration) payable to Executive Board members for a financial year:
Remuneration caps
€ ’000
Fixed remuneration2 JEV LTIP Maximum total
remuneration3
Friedrich Joussen 1,100.0 2,743.2 4,392.0 7,500.0
Horst Baier 740.0 1,687.5 2,475.0 4,200.0
David Burling 680.0 1,080.0 2,208.0 3,500.0
Birgit Conix1 680.0 1,188.0 2,208.0 3,500.0
Sebastian Ebel1 680.0 1,080.0 2,208.0 3,500.0
Dr Elke Eller 680.0 961.2 1,848.0 3,500.0
Frank Rosenberger 600.0 1,004.4 1,836.0 3,500.0
1 Full-year values (12 months), possibly pro rated caps: see table on page 1382 Fixed amount, no cap applied3 Contractually agreed cap for total remuneration (incl. fixed remuneration, JEV, LTIP, pension, additional remuneration and fringe benefits). In case the cap of total
remuneration is exceeded, the LTIP is reduced accordingly.
9 . PAY M E N T S I N C A S E O F P R E M AT U R E D E PA R T U R E
O F A N E X E C U T I V E B OA R D M E M B E R
The payments to be made to a member of the Executive Board on the premature termination of his or her service agreement without good cause are in principle limited in the service agreements of Mr Joussen und Mr Baier to an amount equal twice their annual remuneration. In the service agreements of Ms Conix and Mr Rosenberger it has been agreed that payments in the event of premature termination without good cause may not – in case of premature termination during the first year after the coming into force of the service agreement – exceed the amount equal twice their annual remuneration and – in case of premature termination after the end of the first year of the service agreement – exceed the amount on an annual remuneration (severance pay cap). In the service agreements of Mr Burling, Mr Ebel and Dr Eller is has
been agreed that payments due to premature termination of the respective service agreement without good cause shall not exceed the amount of an annual remuneration (severance pay cap).
For any member of the Executive Board, payments upon premature termination shall not cover more than the remaining term of the service agreement. The severance payment is calculated based on the target direct remuneration (fixed remuneration, target amount for JEV and target amount for LTIP) of the expired financial year and, if relevant, the expected target remuneration for the current financial year, provided that the application of the GCGC does not result in a lesser sum. If the service agreement is terminated extra-ordinarily without notice no payments will be made to the members of the Executive Board.

COR P OR AT E GOV E R N A NC E » Cor p or AT e GoV e r N A NC e r e p orT 137
In cases of premature termination of the service agreement, the annual performance-based remuneration (JEV) and payments according to the LTIP will be managed as follows:
• JEV • If the company terminates the service agreement without
notice before the end of the one-year performance reference period for good cause attributable to the beneficiary or if the beneficiary terminates the service agreement without good cause, the claim to the JEV for the performance reference period in question will be forfeited and no alternative re-muneration or compensation will be paid.
• In all other cases of premature termination of the service agreement before the end of the one-year performance reference period, the JEV will be paid on a pro rata basis.
• LTIP:• If the company terminates the service agreement without
notice before the end of the respective performance reference period for good cause attributable to the Executive Board member, or if the Executive Board member terminates the service agreement without good cause, all claims under the LTIP will lapse for all tranches not yet paid and no alternative remuneration or compensation will be paid.
• If the service agreement ends before the expiry of the per-formance reference period for other reasons, the claims under the LTIP will be maintained for tranches not yet paid. The tranche of the current financial year will be reduced on a pro rata basis. The payout will be calculated in the same way as in the case of a continuation of the service agreement.
In connection with a termination of an Executive Board Member’s service agreement, in particular subsequent to a termination of the service agreement, regardless of by which party, or the conclusion of a termination agreement, TUI AG shall be entitled to release the respective Executive Board Member in full or in part from his or her obligation to perform work subject to continued payment of the remuneration. Such release shall initially be irrevocable for the period of any still outstanding holiday entitlement, which shall hereby be deemed exhausted. The release shall subsequently be maintained until the service agreement ends. The release shall be revocable in the event that questions exist in connection with the winding-up of the service relationship or temporary work becomes necessary for business reasons. This shall not affect the remainder of the service agreement.
The service agreements of the Executive Board members do not contain change of control clauses.
10 . O T H E R PAY M E N T S / B E N E F I T S F O R E X E C U T I V E B OA R D
M E M B E R S W H O L E F T T H E B OA R D I N F Y 2 0 18
The Chief Financial Officer of TUI AG, Mr Horst Baier, has retired from the Executive Board at the end of FY 2018. The service agree-ment of Mr Baier stipulated an appointment until 8 November 2018. Given Mr Baier’s request to not further extend his appointment in view of his impending retirement and following the succession planning process, on 15 July 2018 a successor, Ms Conix, has been introduced to this position. This way an orderly hand-over process has been ensured whereby the Supervisory Board and Mr Baier could mutually agree on the termination of his activity as of the expiry of 30 September 2018. For the remaining term of his service agreement Mr Baier received – due to the premature termination – a severance payment in the amount of € 234,689.50 (gross). Moreover, Mr Baier will be at the company’s disposal as an advisor for one year wherefore he receives a fixed fee of € 10 k (net) per month. For the time until 8 November 2018 this salary has been deducted from his severance payment. Subjects of counseling as well as place and time are stipulated by contract.
11 . P E N S I O N PAY M E N T S M A D E TO PA S T E X E C U T I V E
B OA R D M E M B E R S
In FY 2018, the pension payments to former Executive Board members and their surviving dependents totaled € 4,963.6 k (previous year: € 13,497.1 k).
Pension provisions for former members of the Executive Board and their dependents amounted as at the balance sheet date to € 63,738.2 k (previous year: € 64,683.5 k) as measured according to IAS 19, not including Mr Ebel’s claims in the amount of € 4,624.3 k (previous year: € 4,501.3 k) which he earned before 31 August 2006 during the course of his work for the TUI Group.
According to commercial law provisions, the pension obligations for former members of the Executive Board and their dependents amounted to € 56,021.4 k (previous year: € 55,074.1 k), not including Mr Ebel’s claims in the amount of € 3,263.2 k (previous year: € 2,925.0 k) which he earned before 31 August 2006 during the course of his work for the TUI Group.

COR P OR AT E GOV E R N A NC E » Cor p or AT e GoV e r N A NC e r e p orT 138
I V. OV E R V I E W: I N D I V I D UA L R E M U N E R AT I O N O F
E X E C U T I V E B OA R D M E M B E R S
1. I N D I V I D UA L R E M U N E R AT I O N O F T H E M E M B E R S O F
T H E E X E C U T I V E B OA R D M E M B E R S F O R F Y 2 0 18 ( P U R -
S UA N T TO S E C T I O N 314 (1) , N O . 6 (A) G E R M A N CO M -
M E R C I A L CO D E )
The amount for the LTIP shown in the following table corresponds to the fair value of the LTIP tranches of the respective member of the Executive Board at the grant date in accordance with the provisions of the German Commercial Code (HGB) covering the entire term of the respective service agreement. The values of the fixed re-muneration and the JEV, on the other hand, reflect the remuneration paid for FY 2018.
Remuneration of individual Executive Board members granted by TUI AG for FY 2018 (acc. to section 314, paragraph 6 lit a of the German Commercial Code)
€ ’000
Fixed remuneration1 JEV Additional
remuneration
LTIP2 Total
2018
Total
2017
Friedrich Joussen 1,191.6 2,078.1 0.0 3,915.7 7,185.4 3,248.3
Horst Baier 795.0 965.3 0.0 935.8 2,696.1 1,746.1
David Burling 688.5 892.5 0.0 3,496.9 5,077.9 1,584.4
Birgt Conix3 143.6 190.0 0.0 2,786.1 3,119.7 0.0
Sebastian Ebel 4 582.9 701.3 0.0 2,887.8 4,172.0 2,899.2
Dr Elke Eller 715.5 794.3 0.0 4,036.1 5,545.9 1,371.6
Frank Rosenberger 619.5 657.1 0.0 2,397.7 3,674.3 2,266.0
Total 4,736.6 6,278.6 0.0 20,456.1 31,471.3
Previous year 4,528.8 3,097.4 2,600.0 2,889.5 13,115.7
1 Incl. fringe benefits (without insurances under Group coverage).2 Based on the price of TUI AG share this corresponds for Mr Joussen to a number of 269,674 virtual shares, for Mr Baier to a number of 64,446 virtual shares, for
Mr Burling to a number of 240,829 virtual shares, for Ms Conix to a number of 191,878 virtual shares, for Mr Ebel to a number of 198,882 virtual shares, for Dr Eller to a number of 240,829 virtual shares and for Mr Rosenberger to a number of 165,131 virtual shares.
3 Pro-rated disclosudre of all remuneration components as of 15 July 2018.4 Reduction due to his sababatical from 26 April 2018 to 15 June 2018.
2 . TA R G E T AC H I E V E M E N T
The multiplication of the target amounts by the weighted degrees of target achievement for EBT, ROIC, Cash flow and the individual
performance factor results in the amount paid to member of the Executive Board as JEV.
TA R G E T
A M O U N T
E B T
5 0 %
R O I C
2 5 %
C A S H F L O W
2 5 %
I N D I V I D U A L
P E R F O R M A N C E
F A C T O R F R O M
I N D I V I D U A L
P E R F O R M A N C E
TA R G E T S
I N D I V I D U A L
P AY M E N T
A M O U N T O F J E V+ + ++ =
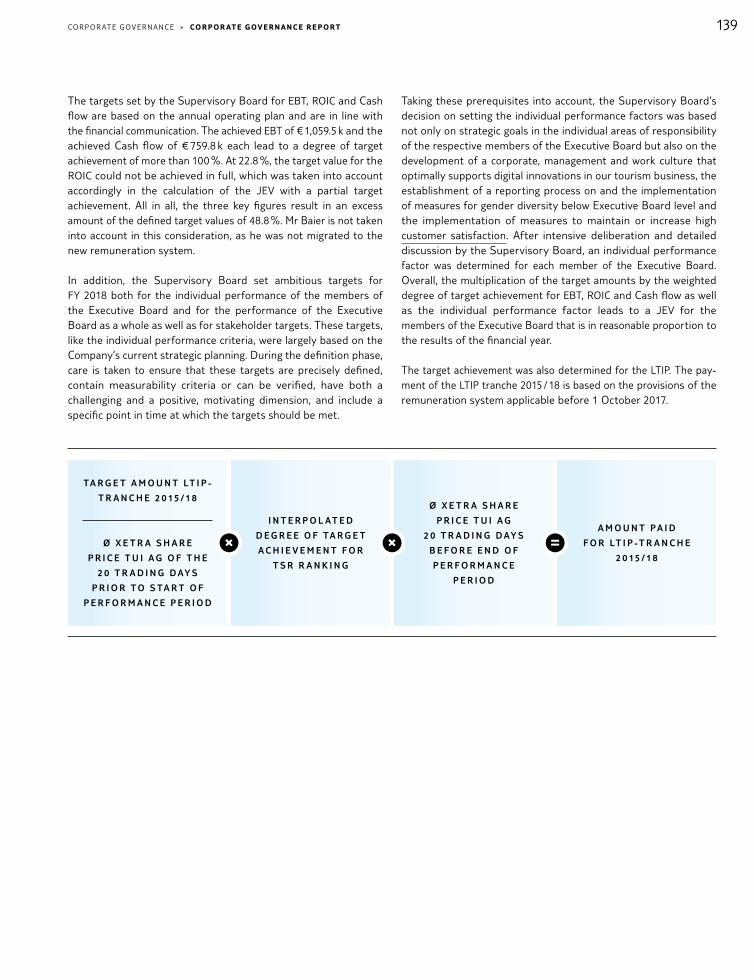
COR P OR AT E GOV E R N A NC E » Cor p or AT e GoV e r N A NC e r e p orT 139
The targets set by the Supervisory Board for EBT, ROIC and Cash flow are based on the annual operating plan and are in line with the financial communication. The achieved EBT of € 1,059.5 k and the achieved Cash flow of € 759.8 k each lead to a degree of target achievement of more than 100 %. At 22.8 %, the target value for the ROIC could not be achieved in full, which was taken into account accordingly in the calculation of the JEV with a partial target achievement. All in all, the three key figures result in an excess amount of the defined target values of 48.8 %. Mr Baier is not taken into account in this consideration, as he was not migrated to the new remuneration system.
In addition, the Supervisory Board set ambitious targets for FY 2018 both for the individual performance of the members of the Executive Board and for the performance of the Executive Board as a whole as well as for stakeholder targets. These targets, like the individual performance criteria, were largely based on the Company’s current strategic planning. During the definition phase, care is taken to ensure that these targets are precisely defined, contain measurability criteria or can be verified, have both a challenging and a positive, motivating dimension, and include a specific point in time at which the targets should be met.
Taking these prerequisites into account, the Supervisory Board’s decision on setting the individual performance factors was based not only on strategic goals in the individual areas of responsibility of the respective members of the Executive Board but also on the development of a corporate, management and work culture that optimally supports digital innovations in our tourism business, the establishment of a reporting process on and the implementation of measures for gender diversity below Executive Board level and the implementation of measures to maintain or increase high customer satisfaction. After intensive deliberation and detailed discussion by the Supervisory Board, an individual performance factor was determined for each member of the Executive Board. Overall, the multiplication of the target amounts by the weighted degree of target achievement for EBT, ROIC and Cash flow as well as the individual performance factor leads to a JEV for the members of the Executive Board that is in reasonable proportion to the results of the financial year.
The target achievement was also determined for the LTIP. The pay-ment of the LTIP tranche 2015 / 18 is based on the provisions of the remuneration system applicable before 1 October 2017.
TA R G E T A M O U N T LT I P -
T R A N C H E 2 0 15 / 1 8
Ø X E T R A S H A R E
P R I C E T U I A G O F T H E
2 0 T R A D I N G D AY S
P R I O R T O S TA R T O F
P E R F O R M A N C E P E R I O D
I N T E R P O L AT E D
D E G R E E O F TA R G E T
A C H I E V E M E N T F O R
T S R R A N K I N G
Ø X E T R A S H A R E
P R I C E T U I A G
2 0 T R A D I N G D AY S
B E F O R E E N D O F
P E R F O R M A N C E
P E R I O D
A M O U N T P A I D
F O R LT I P -T R A N C H E
2 0 15 / 1 8+ + =

COR P OR AT E GOV E R N A NC E » Cor p or AT e GoV e r N A NC e r e p orT 140
The LTIP tranche was granted on the basis of an average stock market price of TUI AG of € 11.43. At the end of the performance period, TUI AG’s average share price was € 15.46. Taking these figures into account, the level of target achievement was determined on the basis of TUI AG|s TSR ranking compared with the TSR values of the STOXX Europe 600 Travel & Leisure companies over the performance period, resulting due to interpolation in a level of target achievement of 110.7 %.
3 . A D D I T I O N A L I N F O R M AT I O N
As in the previous year, no loans or advances were granted to the members of the Executive Board in FY 2018.
For her activities – which were approved by the Supervisory Board of TUI AG – in supervisory boards or comparable domestic and foreign supervisory bodies of companies to be set up in accordance with section 125 of the German Stock Corporation Act (AktG) which are not carried out on the basis of a shareholding of TUI AG in the companies concerned Dr Eller received € 3.1 k from Nord / LB.
Additionally, she acquired a claim of € 3.0 k from Nord / LB, which is due for payment in December 2018. Furthermore, Dr Eller received € 0.8 k from K+S AG and acquired a claim there amounting to € 44.8 k. For his mandate on the Supervisory Board of SIXT SE, Mr Joussen received € 25.2 k in FY 2018 and acquired a claim of € 74.8 k, due for payment after the end of SIXT SE’s financial year. This remuneration was not offset against the Executive Board remuneration paid by TUI AG.
Pursuant to 4.2.5, attachment tables 1 and 2 GCGC, the two tables below (remuneration awarded and remuneration paid) show the benefits granted by TUI AG and the payments received. The table of remuneration awarded’ in accordance with the GCGC shows the amount awarded in each financial year. The table ‘remuneration paid’ for the financial year under review shows the actual cash payment from the LTIP for the performance period ‘LTIP 2015 – 2018’ for Mr Joussen, Mr Baier, Mr Burling and Mr Ebel. The other members of the Executive Board are not entitled to LTIP-payments, yet due to their length of membership in the Executive Board.
4 . R E M U N E R AT I O N AWA R D E D
Remuneration awarded
Friedrich Joussen
CEO,
since 14 February 20131
Horst Baier
CFO,
since 8 November 2007
€ ’000 2017 2018 2018 (min.) 2018 (max.) 2017 2018 2018 (min.) 2018 (max.)
Fixed remuneration 1,100.0 1,100.0 1,100.0 1,100.0 740.0 740.0 740.0 740.0
Fringe benefits 132.3 91.6 91.6 91.6 20.0 55.0 55.0 55.0
Total 1,232.3 1,191.6 1,191.6 1,191.6 760.0 795.0 795.0 795.0
JEV 920.0 1,270.0 – 2,743.2 450.0 750.0 – 1,687.5
Additional remuneration 920.0 – – – 450.0 – – –
LTIP
LTIP (2017 – 2020) 1,494.8 681.8
LTIP (2018 – 2021) 1,729.0 – 4,392.0 644.2 – 2,475.0
Total 4,567.1 4,190.6 1,191.6 8,326.8 2,341.8 2,189.2 795.0 4,957.5
Pension / service costs5 625.7 563.5 563.5 563.5 – – – –
Total remuneration6 5,192.8 4,754.1 1,755.1 7,500.0 2,341.8 2,189.2 795.0 4,200.0

COR P OR AT E GOV E R N A NC E » Cor p or AT e GoV e r N A NC e r e p orT 141
Remuneration awarded
David Burling
Member of the Executive Board,
since 1 June 2015
Birgit Conix
Member of the Executive Board,
since 15 July 2018
€ ’000 2017 2018 2018 (min.) 2018 (max.) 2017 20182 2018 (min.) 2018 (max.)
Fixed remuneration 600.0 680.0 680.0 680.0 – 143.6 143.6 143.6
Fringe benefits 107.9 8.5 8.5 8.5 – – – –
Total 707.9 688.5 688.5 688.5 – 143.6 143.6 143.6
JEV 400.0 500.0 – 1,080.0 – 116.1 – 250.8
Additional remuneration 400.0 – – – – – – –
LTIP
LTIP (2017 – 2020) 505.0 –
LTIP (2018 – 2021) 869.2 – 2,208.0 – 183.3 – 466.1
Total 2,012.9 2,057.7 688.5 3,976.5 – 443.0 143.6 860.5
Pension / service costs5 225.0 225.0 225.0 225.0 – 47.9 47.9 47.9
Total remuneration6 2,237.9 2,282.7 913.5 3,500.0 – 490.9 191.5 738.9
Remuneration awarded
Sebastian Ebel
Member of the Executive Board,
since 12 December 2014
Dr Elke Eller
Member of the Executive Board / Labour Director,
since 15 October 2015
€ ’000 2017 20183 2018 (min.) 2018 (max.) 2017 2018 2018 (min.) 2018 (max.)
Fixed remuneration 680.0 582.9 582.9 582.9 680.0 680.0 680.0 680.0
Fringe benefits 18.0 – – – 34.3 35.5 35.5 35.5
Total 698.0 582.9 582.9 582.9 714.3 715.5 715.5 715.5
JEV 320.0 428.6 – 1,080.0 300.0 445.0 – 961.2
Additional remuneration 320.0 – – – 300.0 – – –
LTIP
LTIP (2017 – 2020) 505.0 424.2
LTIP (2018 – 2021) 745.1 – 2,208.0 727.5 – 1,848.0
Total 1,843.0 1,756.6 582.9 3,870.9 1,738.5 1,888.0 715.5 3,524.7
Pension / service costs5 286.1 259.2 259.2 259.2 345.1 323.7 323.7 323.7
Total remuneration6 2,129.1 2,015.8 842.1 3,500.0 2,083.6 2,211.7 1,039.2 3,500.0

COR P OR AT E GOV E R N A NC E » Cor p or AT e GoV e r N A NC e r e p orT 142
Remuneration awarded
Frank Rosenberger
Member of the Executive Board,
since 1 January 2017
€ ’000 20174 2018 2018 (min.) 2018 (max.)
Fixed remuneration 375.0 600.0 600.0 600.0
Fringe benefits 41.4 19.5 19.5 19.5
Total 416.4 619.5 619.5 619.5
JEV 210.0 465.0 – 1,004.4
Additional remuneration 210.0 – – –
LTIP
LTIP (2017 – 2020) 227.3
LTIP (2018 – 2021) 722.8 – 1,836.0
Total 1,063.7 1,807.3 619.5 3,459.9
Pension / service costs5 382.6 342.1 342.1 342.1
Total remuneration6 1,446.3 2,149.4 961.6 3,500.0
1 Joint-CEO until 09.02.2016; member of the Executive Board since 15 October 2012.2 Pro-rated disclosure of all remuneration components as of 15 July 2018.3 Reduction due to his sabbatical from 26 April 2018 until 15 June 2018.4 Pro-rated disclosure of all remuneration components as of 1 January 2017.5 For Mr Joussen, Mr Baier, Mr Ebel, Dr Eller and Mr Rosenberger service costs aa. to IAS19; for Mr Burling and Ms Conix payments for pension contribution.6 When contractually agreed cap for total remuneration to be paid is exceeded, LTIP is reduced proportionally.
The following overview of the total remuneration awarded to the members of the Executive Board in FY 2018 illustrates the dis-tribution of the individual remuneration components in relation to each other. It has to be emphasized that the share of variable components of the total remuneration awarded is quite consider-able: The LTIP accounts for 35 % of the total remuneration awarded, the JEV accounts for 25 %. It can be stated that variable components account for 60 % of the total remuneration awarded to the members of the Executive Board.
Composition of total remuneration awarded 2018 in %
35LTIP
11Pension / service costs
1Fringe benefits
28Fixed remuneration
25Annual
performance- based
remuneration (JEV)
%

COR P OR AT E GOV E R N A NC E » Cor p or AT e GoV e r N A NC e r e p orT 143
5 . R E M U N E R AT I O N PA I D
Remuneration paid
Friedrich Joussen
CEO,
since 14 February 2013 1
Horst Baier
CFO,
since 8 November 2007
David Burling
Member of the Executive Board,
since 1 June 2015
€ ’000 2017 2018 2017 2018 2017 2018
Fixed remuneration 1,100.0 1,100.0 740.0 740.0 600.0 680.0
Fringe benefits 132.3 91.6 20.0 55.0 107.9 8.5
Total 1,232.3 1,191.6 760.0 795.0 707.9 688.5
JEV 1,096.0 2,078.1 536.1 965.3 476.5 892.5
Additional remuneration 920.0 – 450.0 – 400.0 –
LTIP
LTIP (2014 – 2017) 820.0 784.6
LTIP (2015 – 2018) 2,216.2 1,010.8 249.6
Others – – – – – –
Total 4,068.3 5,485.9 2,530.7 2,771.1 1,584.4 1,830.6
Pension / service costs5 625.7 563.5 – – 225.0 225.0
Total remuneration 4,694.0 6,049.4 2,530.7 2,771.1 1,809.4 2,055.6
Remuneration paid
Birgit Conix
Member of the Executive Board,
since 15 July 2018
Sebastian Ebel
Member of the Executive Board,
since 12 December 2014
Dr Elke Eller
Member of the Executive Board /
Labour Director,
since 15 October 2015
€ ’000 2017 20182 2017 20183 2017 2018
Fixed remuneration – 143.6 680.0 582.9 680.0 680.0
Fringe benefits – – 18.0 – 34.3 35.5
Total – 143.6 698.0 582.9 714.3 715.5
JEV – 190.0 381.2 701.3 357.4 794.3
Additional remuneration – – 320.0 – 300.0 –
LTIP
LTIP (2014 – 2017)
LTIP (2015 – 2018) 602.2
Others – – – – – –
Total – 333.6 1,399.2 1,886.4 1,371.7 1,509.8
Pension / service costs5 – 47.9 286.1 259.2 345.1 323.7
Total remuneration – 381.5 1,685.3 2,145.6 1,716.8 1,833.5

COR P OR AT E GOV E R N A NC E » Cor p or AT e GoV e r N A NC e r e p orT 144
Remuneration paid
Frank Rosenberger
Member of the Executive Board,
since 1 January 2017
€ ’000 20174 2018
Fixed remuneration 375,0 600,0
Fringe benefits 41,4 19,5
Total 416,4 619,5
JEV 250,2 657,1
Additional remuneration 210,0 –
LTIP
LTIP (2014 – 2017)
LTIP (2015 – 2018)
Others – –
Total 876,6 1.276,6
Pension / service costs5 382,6 342,1
Total remuneration 1.259,1 1.618,7
1 Joint-CEO until 9 February 2016; member of the Executive Board since 15 Octo-ber 2012. Mr Joussen received a prepayment for the LTIP-tranche in the amount of € 1,280 k and consequently in FY 2017 only a remaining payment in the amount of € 820 k.
2 Pro-rated disclosure of all remuneration components as of 15 July 2018.3 Reduction due to his sabbatical from 26 April 2018 until 15 June 2018.4 Pro-rated disclosure of all remuneration components as of 1 January 2017.5 For Mr Joussen, Mr Baier, Mr Ebel, Dr Eller and Mr Rosenberger service costs aa.
to IAS19; for Mr Burling and Ms Conix payments for pension contribution.orge.
An examination of the total remuneration paid also clearly shows that the majority of payments made to the members of the Executive Board consist of variable components: The LTIP accounts for 25 % of the total amount paid, while JEV accounts for 39 %. It can be stated that 64 % of the total remuneration paid to the members of the Executive Board consists of variable components.
V. R E V I E W O F A P P R O P R I AT E N E S S O F T H E R E M U N E R AT I O N
A N D P E N S I O N S O F E X E C U T I V E B OA R D M E M B E R S
Following the end of FY 2018, the Supervisory Board carried out the annual review of the remuneration and pensions of Executive Board members for FY 2018. It concluded that these are appropriate in accordance with section 87(1) German Stock Corporation Act.
The Supervisory Board also regularly makes use of external advisors when assessing the appropriateness of the remuneration and pensions of Executive Board members. This involves assessing the level and structure of the remuneration of Executive Board members in relation to the remuneration of senior management and the work-force as a whole (vertical comparison) from an outside perspective. In addition to a status quo review, the vertical comparison also takes into account how this relationship changes over time. Secondly, the remuneration level and structure are assessed based on the position of TUI AG in a peer market consisting of a combination of DAX and MDAX companies that are similar to TUI AG in terms of size and complexity of business (horizontal comparison). In addition to the fixed remuneration, the horizontal comparison also covers the short- and long-term remuneration components as well as the amount of company pension. For FY 2018, the Supervisory Board commissioned the consultancy company hkp Deutschland GmbH to prepare an expert report on the appropriateness of the remu-neration level for Executive Board members. The partner of hkp Deutschland GmbH commissioned by the Supervisory Board and responsible for carrying out the assessment is independent of the Executive Board of TUI AG and the company. The finding of the external advisor supports the judgment of the Supervisory Board that the level of remuneration of Executive Board members complies with section 87(1) German Stock Corporation Act as well as the recommendations of the GCGC.
V I . R E M U N E R AT I O N O F T H E S U P E R V I S O RY B OA R D
The provisions and remuneration of members of the Supervisory Board are derived from section 18 of TUI AG’s Articles of Association, which have been made permanently accessible to the public on the internet. The remuneration of the Supervisory Board is reviewed at appropriate intervals. In this regard the expected time required for the relevant duties and experience in companies of a similar size, industry and complexity are taken into account.
Purpose and link to company strategy
Highly-qualified Supervisory Board members are to be acquired and retained.
Procedure
Besides reimbursement of their expenses, which include the turnover tax due on their emoluments, the members of the Supervisory Board receive a fixed remuneration of € 90.0 k per financial year, payable upon completion of the financial year. The
Composition of total remuneration paid 2018 in %
39Annual
performance- based
remuneration (JEV)
11Pension / service costs
1Fringe
benefits
24Fixed remuneration
25LTIP
%

COR P OR AT E GOV E R N A NC E » Cor p or AT e GoV e r N A NC e r e p orT 145
chairman shall receive three times, and his deputies twice, the fixed remuneration of a Supervisory Board member.
An additional fixed remuneration of € 42.0 k is paid for membership of committees (e. g. the presiding committee, the audit committee and the strategy committee, but not the nomination committee). As a result of the successful completion of the integration of TUI AG and the former TUI Travel PLC, the integration committee was dissolved as planned in December 2016, which has already been described in the Annual Report 2017. The chairman of the audit committee shall receive three times, and the chairman of the strategy committee twice, this remuneration. This remuneration is also paid out at the end of the respective financial year.
The members of the Supervisory Board receive no further re-muneration components and no fringe benefits. In all cases the remuneration relates to a full financial year. For parts of a financial year and for short financial years the remuneration shall be paid on a pro rata basis.
The members of the Supervisory Board and the committees receive an attendance fee of € 1.0 k per meeting, regardless of the form the meeting takes.
Moreover, the members of the Supervisory Board are included in a financial liability insurance policy (D&O insurance) taken out in an appropriate amount by the company in its own interests. The relevant insurance premiums are paid by the company. In line with the recommendation of the GCGC, there is a deductible for which the Supervisory Board members can take out their own private insurance.
Cap
There is no need to set a cap because the remuneration for the Supervisory Board members consists solely of fixed components.
On 9 February 2016 the Annual General Meeting of TUI AG passed a resolution to change the remuneration of the Supervisory Board to fixed remuneration only as well as to adjust the amount of the fixed remuneration components. The new remuneration model applied retroactively as of 1 October 2015, which meant that the variable remuneration granted in accordance with the provisions of the articles of association applicable until 9 February 2016 and based on the long-term success of the company was no longer paid. This variable remuneration was based on the average undiluted earnings per share (EPS) carried in the consolidated financial statements for the respective last three financial years. At the time of redemption, the members of the Supervisory Board were still entitled to the long-term remuneration granted in financial years 2014 and 2015 because of the three-year vesting period. These entitlements were redeemed on the basis of EPS planned values for financial years 2016 and 2017. Reducing the remuneration of the members of the Supervisory Board for past and current financial years is not permitted under stock corporation law. For this reason it needed / needs to be checked, also upon completion of financial years 2016 and 2017, whether this has taken place with the change to the remuneration model by taking the EPS planned value for the relevant financial years as a basis. If using the EPS values actually achieved were to lead to higher long-term incentives than taking into account the planned values, the corresponding difference is to be paid to the relevant members of the Supervisory Board upon the close of the Annual General Meeting that will vote on the ratification of the acts of the Supervisory Board for the respective financial year.
For the variable remuneration component granted in FY 2014, it was found that, upon the close of the Annual General Meeting 2017, the actual EPS value of FY 2016, € 1.78, was above the EPS planned value of € 0.81 taken as a basis for the redemption. The resulting difference was paid to the relevant members of the Supervisory Board accordingly. As a result of an incorrect formula, the gross settlement amount had been included in the credit entry as a net figure. This led to VAT being calculated a second time on the gross settlement amount so that an excessive overall amount had been paid out. A correction was made for simplified processing by offsetting it against the payment of the fixed Supervisory Board remuneration for the 2018 financial year. The correction is shown in the tables below.

COR P OR AT E GOV E R N A NC E » Cor p or AT e GoV e r N A NC e r e p orT 146
Offsetting of too high / too low variable remuneration of the Executive Board for FY 2014 and FY 2015
Invoicing / Payment FY 2017 Correction FY 2018 Set off
Name
Net
VAT 19 %
Gross /
Amount paid
Net
corrected
VAT 19 %
corrected
Gross /
Amount paid
corrected
differential
amount
net
differential
amount
VAT 19 %
differential
amount
gross
Andreas Barczewski 15,390.67 2,924.23 18,314.90 12,933.33 2,457.33 15,390.67 – 2,457.34 – 466.90 – 2,924.23
Peter Bremme 11,514.50 2,187.75 13,702.25 9,676.05 1,838.45 11,514.50 – 1,838.45 – 349.30 – 2,187.75
Prof. Edgar Ernst 15,390.67 2,924.23 18,314.90 12,933.33 2,457.33 15,390.67 – 2,457.34 – 466.90 – 2,924.23
Frank Jakobi 21,482.81 4,081.73 25,564.54 18,052.78 3,430.03 21,482.81 – 3,430.03 – 651.70 – 4,081.73
Prof. Klaus Mangold 46,172.00 8,772.68 54,944.68 38,800.00 7,372.00 46,172.00 – 7,372.00 – 1,400.68 – 8,772.68
Michael Pönipp 15,390.67 2,924.23 18,314.90 12,933.33 2,457.33 15,390.67 – 2,457.34 – 466.90 – 2,924.23
Carola Schwirn 11,101.22 2,109.23 13,210.45 9,328.77 1,772.47 11,101.22 – 1,772.45 – 336.76 – 2,109.23
Anette Strempel 15,390.67 2,924.23 18,314.90 12,933.33 2,457.33 15,390.67 – 2,457.34 – 466.90 – 2,924.23
Ortwin Strubelt 15,390.67 2,924.23 18,314.90 12,933.33 2,457.33 15,390.67 – 2,457.34 – 466.90 – 2,924.23
Total 167,223.88 31,772.54 198,996.42 140,524.25 26,699.60 167,223.88 – 26,699.63 – 5,072.94 – 31,772.54
Offsetting of too high / too low variable remuneration of the Executive Board for FY 2014 and FY 2015
Invoicing / Payment FY 2017 Correction FY 2018 Set off
Name
Gross
30 % withheld
tax
Net /
Amount paid
Gross
30 % withheld
tax
Net /
Amount paid
differential
amount
gross
differnetial
amount 30 %
withheld tax
differential
amount
net
Carmen Riu Güell 8,839.93 – 2,651.98 6,042.09 12,933.33 – 3,880.00 8,839.93 4,093.40 – 1,228.02 2,797.84
Total 8,839.93 – 2,651.98 6,042.09 12,933.33 – 3,880.00 8,839.93 4,093.40 – 1,228.02 2,797.84
The invoices for Mr Shemetov, Mr Strenger and Mr Witt were not subject to an incorrect formula.
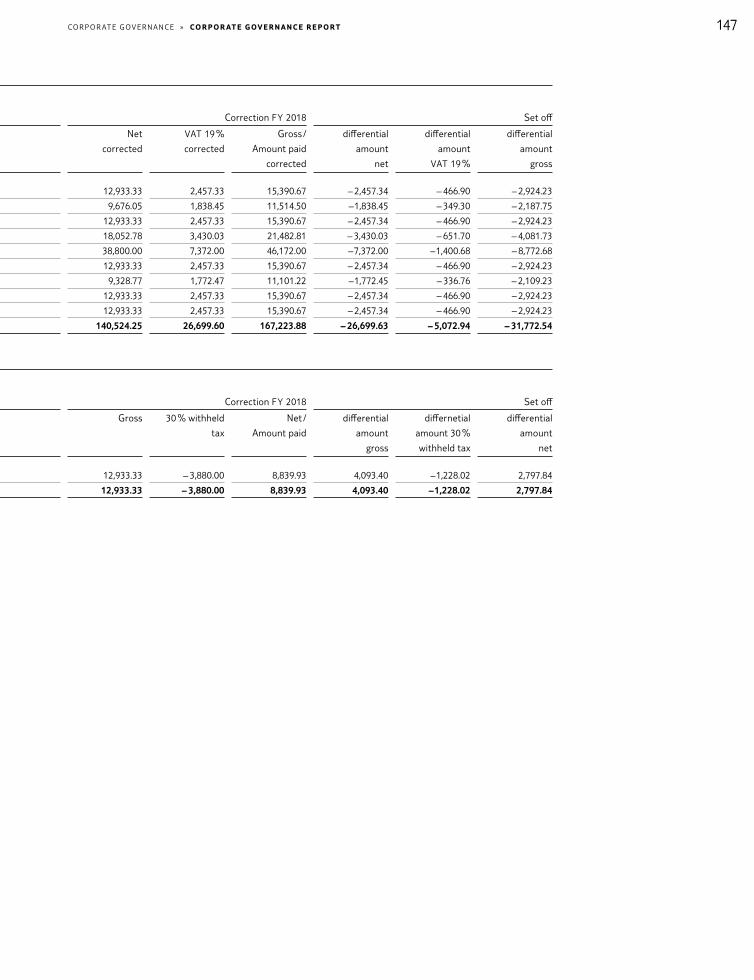
COR P OR AT E GOV E R N A NC E » Cor p or AT e GoV e r N A NC e r e p orT 147
Offsetting of too high / too low variable remuneration of the Executive Board for FY 2014 and FY 2015
Invoicing / Payment FY 2017 Correction FY 2018 Set off
Name
Net
VAT 19 %
Gross /
Amount paid
Net
corrected
VAT 19 %
corrected
Gross /
Amount paid
corrected
differential
amount
net
differential
amount
VAT 19 %
differential
amount
gross
Andreas Barczewski 15,390.67 2,924.23 18,314.90 12,933.33 2,457.33 15,390.67 – 2,457.34 – 466.90 – 2,924.23
Peter Bremme 11,514.50 2,187.75 13,702.25 9,676.05 1,838.45 11,514.50 – 1,838.45 – 349.30 – 2,187.75
Prof. Edgar Ernst 15,390.67 2,924.23 18,314.90 12,933.33 2,457.33 15,390.67 – 2,457.34 – 466.90 – 2,924.23
Frank Jakobi 21,482.81 4,081.73 25,564.54 18,052.78 3,430.03 21,482.81 – 3,430.03 – 651.70 – 4,081.73
Prof. Klaus Mangold 46,172.00 8,772.68 54,944.68 38,800.00 7,372.00 46,172.00 – 7,372.00 – 1,400.68 – 8,772.68
Michael Pönipp 15,390.67 2,924.23 18,314.90 12,933.33 2,457.33 15,390.67 – 2,457.34 – 466.90 – 2,924.23
Carola Schwirn 11,101.22 2,109.23 13,210.45 9,328.77 1,772.47 11,101.22 – 1,772.45 – 336.76 – 2,109.23
Anette Strempel 15,390.67 2,924.23 18,314.90 12,933.33 2,457.33 15,390.67 – 2,457.34 – 466.90 – 2,924.23
Ortwin Strubelt 15,390.67 2,924.23 18,314.90 12,933.33 2,457.33 15,390.67 – 2,457.34 – 466.90 – 2,924.23
Total 167,223.88 31,772.54 198,996.42 140,524.25 26,699.60 167,223.88 – 26,699.63 – 5,072.94 – 31,772.54
Offsetting of too high / too low variable remuneration of the Executive Board for FY 2014 and FY 2015
Invoicing / Payment FY 2017 Correction FY 2018 Set off
Name
Gross
30 % withheld
tax
Net /
Amount paid
Gross
30 % withheld
tax
Net /
Amount paid
differential
amount
gross
differnetial
amount 30 %
withheld tax
differential
amount
net
Carmen Riu Güell 8,839.93 – 2,651.98 6,042.09 12,933.33 – 3,880.00 8,839.93 4,093.40 – 1,228.02 2,797.84
Total 8,839.93 – 2,651.98 6,042.09 12,933.33 – 3,880.00 8,839.93 4,093.40 – 1,228.02 2,797.84
The invoices for Mr Shemetov, Mr Strenger and Mr Witt were not subject to an incorrect formula.

COR P OR AT E GOV E R N A NC E » Cor p or AT e GoV e r N A NC e r e p orT 148
For the remuneration component granted in FY 2015, it was found that, upon the close of the Annual General Meeting 2018, the actual EPS value of FY 2017, € 1.17, was above the planned EPS value of € 0.85 taken as a basis for the redemption. The resulting difference was paid to the relevant members of the Supervisory Board accord-ingly and is shown in the following tables.
In addition, regarding the remuneration granted in FY 2016, it will be reviewed – upon the close of the Annual General Meeting 2019 – whether applying the remuneration model valid until 9 Febru-ary 2016 would have resulted in higher remuneration than applying the new model. If this is the case, the corresponding difference has to be paid to the members of the Supervisory Board upon the close of the Annual General Meeting 2019.
V I I . R E M U N E R AT I O N O F T H E S U P E R V I S O RY B OA R D
A S A W H O L E
Remuneration of the Supervisory Board
€ ’000 2018 2017
Fixed remuneration 2,160.1 2,160.0
Long-term variable remuneration 225.1 176.1*
Remuneration for committee
memberships 1,050.0 1,096.2
Attendance fee 323.0 321.0
Remuneration for TUI AG Supervisory
Board mandate 3,758.2 3,753.3
Remuneration for Supervisory Board
mandates in the Group 35.6 41.4
Total 3,793.8 3,794.7
* The ‘Long-term variable remuneration’ of the Supervisory Board reported in the 2017 Annual Report was subject to a correction in FY 2018, see page 146.
In addition, travel and other expenses totaling € 529.0 k (previous year: € 507.6 k) were reimbursed. Total remuneration of the Super-visory Board members, including reimbursement of travel and other expenses, thus amounted to € 4,321.8 k (previous year: € 4,302.2 k).

COR P OR AT E GOV E R N A NC E » Cor p or AT e GoV e r N A NC e r e p orT 149
V I I I . R E M U N E R AT I O N O F I N D I V I D UA L S U P E R V I S O RY B OA R D M E M B E R S F O R F Y 2 0 18
Individual remuneration of Supervisory Board in FY 2018
€ ’000
Fixed
remuneration
Ex-post
adjustment of
long-term
variable
remuneration
Remuneration
for committee
memberships
Attendance fee
Remuneration
for Supervisory
Board
mandates in
the Group
Total
Prof. Klaus Mangold (Chairman) 270.0 38.4 126.0 33.0 467.4
Frank Jakobi (Deputy Chairman) 180.0 19.2 84.0 22.0 305.2
Sir Michael Hodgkinson1
(Deputy Chairman until 13 Feb 2018) 66.5 17.6 15.5 11.0 110.6
Peter Long 2 (Deputy Chairman) 146.8 110.5 18.0 275.3
Andreas Barczewski 90.0 12.8 42.0 15.0 17.5 177.3
Peter Bremme 90.0 12.8 42.0 16.0 160.8
Prof. Edgar Ernst 90.0 12.8 126.0 15.0 243.8
Wolfgang Flintermann 90.0 0.0 9.0 99.0
Angelika Gifford 90.0 42.0 13.0 145.0
Valerie Gooding 90.0 12.0 42.0 11.0 155.0
Dr Dierk Hirschel 90.0 11.5 42.0 16.0 159.5
Janis Kong 90.0 12.0 42.0 16.0 160.0
Coline McConville 90.0 12.0 42.0 16.0 160.0
Alexey Mordashov 90.0 84.0 13.0 187.0
Michael Pönipp 90.0 12.8 42.0 16.0 18.1 178.9
Carmen Riu Güell 90.0 12.8 42.0 16.0 160.8
Carola Schwirn 90.0 12.8 0.0 9.0 111.8
Anette Strempel 90.0 12.8 42.0 19.0 163.8
Ortwin Strubelt 90.0 12.8 84.0 25.0 211.8
Stefan Weinhofer 90.0 0.0 9.0 99.0
Dr Dieter Zetsche 3 56.8 0.0 5.0 61.8
Total 2,160.1 225.1 1,050.0 323.0 35.6 3,793.8
1 Pro-rated disclosure of all remuneration components until 13 February 2018.2 Pro-rated disclosure of remuneration for committee memberships.3 Pro-rated disclosudre of all remuneration components as of 13 February2018.
Apart from the work performed by the employees’ representatives pursuant to their contracts, none of the members of the Supervisory Board provided any personal services such as consultation or
agency services for TUI AG or its subsidiaries in FY 2018 and thus did not receive any additional remuneration arising out of this.

In the evergreen climes of South East Asia the growing middle classes are increasingly eager for travel
to distant lands. TUI has spotted the potential and will now develop Malaysia not only as a destination, but
also as a source market.
»
READ MORE ABOUT HOW TUI IS POSIT IONED IN AS IA IN OUR MAGAZINE ARTICLE ‘GROWTH DRIVERS ’ .

CONSOLIDATED F INANCIAL STATEMENTS AND NOTES
159 N OT E S
159 Principles and methods underlying the
Consolidated Financial Statements
178 Segment reporting
182 Notes to the consolidated income statement
189 Notes on the consolidated statement of
financial position
241 Notes on the cash flow statement
242 Other notes
259 Responsibility statement by management
260 Independent auditor’s report
268 Forward-looking Statements
152 CO N S O L I DAT E D F I N A N C I A L
S TAT E M E N T S
152 Income statement
152 Earnings per share
153 Statement of comprehensive income
154 Financial position
156 Statement of changes in Group equity
158 Cash flow statement

152 CON S O L IDAT E D F I N A NC I A L S TAT E ME N T S » I NCoMe S TAT e Me N T, e A r NI NG S pe r S H A r e
CONSOLIDATED FINANCIAL STATEMENTSIncome Statement of the TUI Group for the period from 1 Oct 2017 to 30 Sep 2018
€ million Notes 2018 2017
Turnover (1) 19,523.9 18,535.0
Cost of sales (2) 17,542.4 16,535.5
Gross profit 1,981.5 1,999.5
Administrative expenses (2) 1,289.9 1,255.8
Other income (3) 67.4 12.5
Other expenses 3.5 1.9
Financial income (4) 83.8 229.3
Financial expenses (5) 165.5 156.2
Share of result of joint ventures and associates (6) 297.7 252.3
Earnings before income taxes 971.5 1,079.7
Income taxes (7) 191.3 168.8
Result from continuing operations 780.2 910.9
Result from discontinued operations (8) 38.7 – 149.5
Group profit 818.9 761.4
Group profit attributable to shareholders of TUI AG (9) 732.5 644.8
Group profit attributable to non-controlling interest (10) 86.4 116.6
Earnings per share
€ Notes 2018 2017
Basic earnings per share (11) 1.25 1.10
from continuing operations 1.18 1.36
from discontinued operations 0.07 – 0.26
Diluted earnings per share (11) 1.25 1.10
from continuing operations 1.18 1.36
from discontinued operations 0.07 – 0.26

153CON S O L IDAT E D F I N A NC I A L S TAT E ME N T S » S TAT e Me N T of CoMpr e He N S I V e I NCoMe
Statement of comprehensive income of TUI Group for the period from 1 Oct 2017 to 30 Sep 2018
€ million Notes 2018 2017
Group profit 818.9 761.4
Remeasurements of defined benefit obligations and related fund assets 66.0 280.7
Income tax related to items that will not be reclassified (12) – 12.5 – 66.9
Items that will not be reclassified to profit or loss 53.5 213.8
Foreign exchange differences – 15.3 – 17.9
Foreign exchange differences outside profit or loss – 28.1 – 89.3
Reclassification 12.8 71.4
Financial instruments available for sale 0.5 – 31.8
Changes in the fair value 0.5 147.8
Reclassification – – 179.6
Cash flow hedges 429.7 – 263.6
Changes in the fair value 607.3 – 635.4
Reclassification – 177.6 371.8
Other comprehensive income of joint ventures and associates 41.2 19.3
Changes in the measurement outside profit or loss 41.2 28.0
Reclassification – – 8.7
Income tax related to items that may be reclassified (12) – 103.5 46.9
Items that may be reclassified to profit or loss 352.6 – 247.1
Other comprehensive income 406.1 – 33.3
Total comprehensive income 1,225.0 728.1
attributable to shareholders of TUI AG 1,132.7 620.0
attributable to non-controlling interest 92.3 108.1
Allocation of share of shareholders of TUI AG
of total comprehensive income
Continuing operations 1,132.7 705.7
Discontinued operations – – 85.7
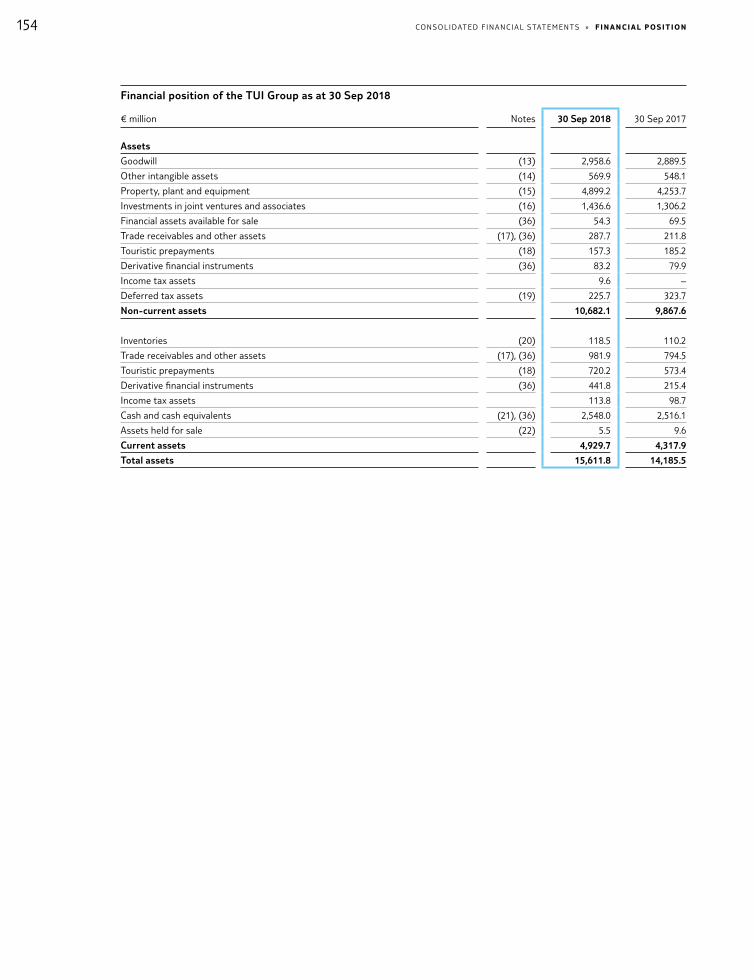
154 CON S O L IDAT E D F I N A NC I A L S TAT E ME N T S » f I N A NC I A l p oS I T IoN
Financial position of the TUI Group as at 30 Sep 2018
€ million Notes 30 Sep 2018 30 Sep 2017
Assets
Goodwill (13) 2,958.6 2,889.5
Other intangible assets (14) 569.9 548.1
Property, plant and equipment (15) 4,899.2 4,253.7
Investments in joint ventures and associates (16) 1,436.6 1,306.2
Financial assets available for sale (36) 54.3 69.5
Trade receivables and other assets (17), (36) 287.7 211.8
Touristic prepayments (18) 157.3 185.2
Derivative financial instruments (36) 83.2 79.9
Income tax assets 9.6 –
Deferred tax assets (19) 225.7 323.7
Non-current assets 10,682.1 9,867.6
Inventories (20) 118.5 110.2
Trade receivables and other assets (17), (36) 981.9 794.5
Touristic prepayments (18) 720.2 573.4
Derivative financial instruments (36) 441.8 215.4
Income tax assets 113.8 98.7
Cash and cash equivalents (21), (36) 2,548.0 2,516.1
Assets held for sale (22) 5.5 9.6
Current assets 4,929.7 4,317.9
Total assets 15,611.8 14,185.5
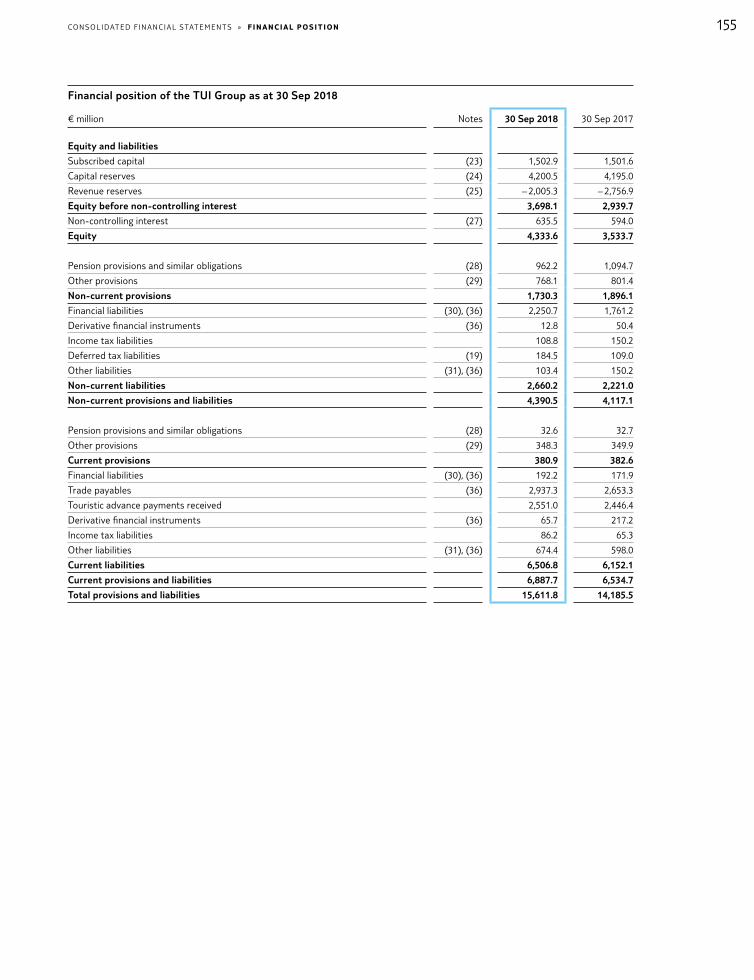
155CON S O L IDAT E D F I N A NC I A L S TAT E ME N T S » f I N A NC I A l p oS I T IoN
Financial position of the TUI Group as at 30 Sep 2018
€ million Notes 30 Sep 2018 30 Sep 2017
Equity and liabilities
Subscribed capital (23) 1,502.9 1,501.6
Capital reserves (24) 4,200.5 4,195.0
Revenue reserves (25) – 2,005.3 – 2,756.9
Equity before non-controlling interest 3,698.1 2,939.7
Non-controlling interest (27) 635.5 594.0
Equity 4,333.6 3,533.7
Pension provisions and similar obligations (28) 962.2 1,094.7
Other provisions (29) 768.1 801.4
Non-current provisions 1,730.3 1,896.1
Financial liabilities (30), (36) 2,250.7 1,761.2
Derivative financial instruments (36) 12.8 50.4
Income tax liabilities 108.8 150.2
Deferred tax liabilities (19) 184.5 109.0
Other liabilities (31), (36) 103.4 150.2
Non-current liabilities 2,660.2 2,221.0
Non-current provisions and liabilities 4,390.5 4,117.1
Pension provisions and similar obligations (28) 32.6 32.7
Other provisions (29) 348.3 349.9
Current provisions 380.9 382.6
Financial liabilities (30), (36) 192.2 171.9
Trade payables (36) 2,937.3 2,653.3
Touristic advance payments received 2,551.0 2,446.4
Derivative financial instruments (36) 65.7 217.2
Income tax liabilities 86.2 65.3
Other liabilities (31), (36) 674.4 598.0
Current liabilities 6,506.8 6,152.1
Current provisions and liabilities 6,887.7 6,534.7
Total provisions and liabilities 15,611.8 14,185.5
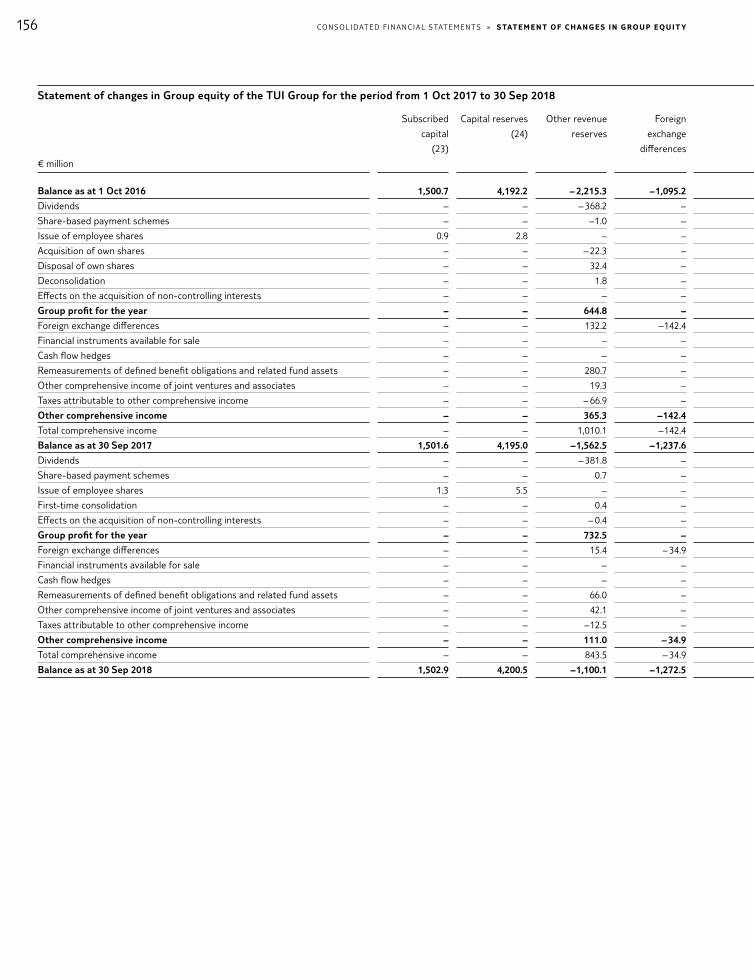
156 CON S O L IDAT E D F I N A NC I A L S TAT E ME N T S » S TAT e Me N T of C H A NG e S I N G roU p e qU I T y
Statement of changes in Group equity of the TUI Group for the period from 1 Oct 2017 to 30 Sep 2018
€ million
Subscribed
capital
(23)
Capital reserves
(24)
Other revenue
reserves
Foreign
exchange
differences
Financial
instruments
available for sale
Cash flow
hedges
Revaluation
reserve
Revenue
reserves
(25)
Equity before
non-controlling
interest
Non-controlling
interest
(27)
Total
Balance as at 1 Oct 2016 1,500.7 4,192.2 – 2,215.3 – 1,095.2 31.8 241.5 19.4 – 3,017.8 2,675.1 573.1 3,248.2
Dividends – – – 368.2 – – – – – 368.2 – 368.2 – 87.2 – 455.4
Share-based payment schemes – – – 1.0 – – – – – 1.0 – 1.0 – – 1.0
Issue of employee shares 0.9 2.8 – – – – – – 3.7 – 3.7
Acquisition of own shares – – – 22.3 – – – – – 22.3 – 22.3 – – 22.3
Disposal of own shares – – 32.4 – – – – 32.4 32.4 – 32.4
Deconsolidation – – 1.8 – – – – 1.8 – – – –
Effects on the acquisition of non-controlling interests – – – – – – – – – – –
Group profit for the year – – 644.8 – – – – 644.8 644.8 116.6 761.4
Foreign exchange differences – – 132.2 – 142.4 – 2.8 – 2.1 – 9.5 – 9.5 – 8.4 – 17.9
Financial instruments available for sale – – – – – 31.8 – – – 31.8 – 31.8 – – 31.8
Cash flow hedges – – – – – – 263.5 – – 263.5 – 263.5 – 0.1 – 263.6
Remeasurements of defined benefit obligations and related fund assets – – 280.7 – – – – 280.7 280.7 – 280.7
Other comprehensive income of joint ventures and associates – – 19.3 – – – – 19.3 19.3 – 19.3
Taxes attributable to other comprehensive income – – – 66.9 – – 46.9 – – 20.0 – 20.0 – – 20.0
Other comprehensive income – – 365.3 – 142.4 – 31.8 – 213.8 – 2.1 – 24.8 – 24.8 – 8.5 – 33.3
Total comprehensive income – – 1,010.1 – 142.4 – 31.8 – 213.8 – 2.1 620.0 620.0 108.1 728.1
Balance as at 30 Sep 2017 1,501.6 4,195.0 – 1,562.5 – 1,237.6 – 27.7 15.5 – 2,756.9 2,939.7 594.0 3,533.7
Dividends – – – 381.8 – – – – – 381.8 – 381.8 – 53.5 – 435.3
Share-based payment schemes – – 0.7 – – – – 0.7 0.7 – 0.7
Issue of employee shares 1.3 5.5 – – – – – – 6.8 – 6.8
First-time consolidation – – 0.4 – – – – 0.4 0.4 3.0 3.4
Effects on the acquisition of non-controlling interests – – – 0.4 – – – – – 0.4 – 0.4 – 0.3 – 0.7
Group profit for the year – – 732.5 – – – – 732.5 732.5 86.4 818.9
Foreign exchange differences – – 15.4 – 34.9 – – 0.2 – 2.6 – 22.3 – 22.3 7.0 – 15.3
Financial instruments available for sale – – – – 0.5 – – 0.5 0.5 – 0.5
Cash flow hedges – – – – – 429.9 – 429.9 429.9 – 0.2 429.7
Remeasurements of defined benefit obligations and related fund assets – – 66.0 – – – – 66.0 66.0 – 66.0
Other comprehensive income of joint ventures and associates – – 42.1 – – – – 42.1 42.1 – 0.9 41.2
Taxes attributable to other comprehensive income – – – 12.5 – – – 103.5 – – 116.0 – 116.0 – – 116.0
Other comprehensive income – – 111.0 – 34.9 0.5 326.2 – 2.6 400.2 400.2 5.9 406.1
Total comprehensive income – – 843.5 – 34.9 0.5 326.2 – 2.6 1,132.7 1,132.7 92.3 1,225.0
Balance as at 30 Sep 2018 1,502.9 4,200.5 – 1,100.1 – 1,272.5 0.5 353.9 12.9 – 2,005.3 3,698.1 635.5 4,333.6

157CON S O L IDAT E D F I N A NC I A L S TAT E ME N T S » S TAT e Me N T of C H A NG e S I N G roU p e qU I T y
Statement of changes in Group equity of the TUI Group for the period from 1 Oct 2017 to 30 Sep 2018
€ million
Subscribed
capital
(23)
Capital reserves
(24)
Other revenue
reserves
Foreign
exchange
differences
Financial
instruments
available for sale
Cash flow
hedges
Revaluation
reserve
Revenue
reserves
(25)
Equity before
non-controlling
interest
Non-controlling
interest
(27)
Total
Balance as at 1 Oct 2016 1,500.7 4,192.2 – 2,215.3 – 1,095.2 31.8 241.5 19.4 – 3,017.8 2,675.1 573.1 3,248.2
Dividends – – – 368.2 – – – – – 368.2 – 368.2 – 87.2 – 455.4
Share-based payment schemes – – – 1.0 – – – – – 1.0 – 1.0 – – 1.0
Issue of employee shares 0.9 2.8 – – – – – – 3.7 – 3.7
Acquisition of own shares – – – 22.3 – – – – – 22.3 – 22.3 – – 22.3
Disposal of own shares – – 32.4 – – – – 32.4 32.4 – 32.4
Deconsolidation – – 1.8 – – – – 1.8 – – – –
Effects on the acquisition of non-controlling interests – – – – – – – – – – –
Group profit for the year – – 644.8 – – – – 644.8 644.8 116.6 761.4
Foreign exchange differences – – 132.2 – 142.4 – 2.8 – 2.1 – 9.5 – 9.5 – 8.4 – 17.9
Financial instruments available for sale – – – – – 31.8 – – – 31.8 – 31.8 – – 31.8
Cash flow hedges – – – – – – 263.5 – – 263.5 – 263.5 – 0.1 – 263.6
Remeasurements of defined benefit obligations and related fund assets – – 280.7 – – – – 280.7 280.7 – 280.7
Other comprehensive income of joint ventures and associates – – 19.3 – – – – 19.3 19.3 – 19.3
Taxes attributable to other comprehensive income – – – 66.9 – – 46.9 – – 20.0 – 20.0 – – 20.0
Other comprehensive income – – 365.3 – 142.4 – 31.8 – 213.8 – 2.1 – 24.8 – 24.8 – 8.5 – 33.3
Total comprehensive income – – 1,010.1 – 142.4 – 31.8 – 213.8 – 2.1 620.0 620.0 108.1 728.1
Balance as at 30 Sep 2017 1,501.6 4,195.0 – 1,562.5 – 1,237.6 – 27.7 15.5 – 2,756.9 2,939.7 594.0 3,533.7
Dividends – – – 381.8 – – – – – 381.8 – 381.8 – 53.5 – 435.3
Share-based payment schemes – – 0.7 – – – – 0.7 0.7 – 0.7
Issue of employee shares 1.3 5.5 – – – – – – 6.8 – 6.8
First-time consolidation – – 0.4 – – – – 0.4 0.4 3.0 3.4
Effects on the acquisition of non-controlling interests – – – 0.4 – – – – – 0.4 – 0.4 – 0.3 – 0.7
Group profit for the year – – 732.5 – – – – 732.5 732.5 86.4 818.9
Foreign exchange differences – – 15.4 – 34.9 – – 0.2 – 2.6 – 22.3 – 22.3 7.0 – 15.3
Financial instruments available for sale – – – – 0.5 – – 0.5 0.5 – 0.5
Cash flow hedges – – – – – 429.9 – 429.9 429.9 – 0.2 429.7
Remeasurements of defined benefit obligations and related fund assets – – 66.0 – – – – 66.0 66.0 – 66.0
Other comprehensive income of joint ventures and associates – – 42.1 – – – – 42.1 42.1 – 0.9 41.2
Taxes attributable to other comprehensive income – – – 12.5 – – – 103.5 – – 116.0 – 116.0 – – 116.0
Other comprehensive income – – 111.0 – 34.9 0.5 326.2 – 2.6 400.2 400.2 5.9 406.1
Total comprehensive income – – 843.5 – 34.9 0.5 326.2 – 2.6 1,132.7 1,132.7 92.3 1,225.0
Balance as at 30 Sep 2018 1,502.9 4,200.5 – 1,100.1 – 1,272.5 0.5 353.9 12.9 – 2,005.3 3,698.1 635.5 4,333.6

158 CON S O L IDAT E D F I N A NC I A L S TAT E ME N T S » C A S H f low S TAT e Me N T
Cash flow statement
€ million Notes 2018 2017 Var.
Group profit 818.9 761.4 57.5
Depreciation, amortisation and impairment (+) / write-backs (–) 438.9 517.8 – 78.9
Other non-cash expenses (+) / income (–) – 272.2 – 239.6 – 32.6
Interest expenses 162.4 141.8 20.6
Dividends from joint ventures and associates 222.7 118.2 104.5
Profit (–) / loss (+) from disposals of non-current assets – 99.0 – 100.7 1.7
Increase (–) / decrease (+) in inventories – 10.0 – 18.5 8.5
Increase (–) / decrease (+) in receivables and other assets – 569.4 169.5 – 738.9
Increase (+) / decrease (–) in provisions – 71.5 – 84.6 13.1
Increase (+) / decrease (–) in liabilities (excl. financial liabilities) 530.1 317.8 212.3
Cash inflow from operating activities (38) 1,150.9 1,583.1 – 432.2
Payments received from disposals of property, plant and equipment
and intangible assets 192.4 79.5 112.9
Payments from disposals of consolidated companies
(less disposals of cash and cash equivalents due to divestments) 88.6 – 14.3 102.9
Payments received from the disposals of other non-current assets 5.5 418.7 – 413.2
Payments made for investments in property, plant and equipment
and intangible assets – 956.2 – 1,049.0 92.8
Payments made for investments in consolidated companies
(less cash and cash equivalents received due to acquisitions) – 135.6 – 66.0 – 69.6
Payments made for investments in other non-current assets – 40.4 – 56.6 16.2
Cash outflow from investing activities (39) – 845.7 – 687.7 – 158.0
Payments made for acquisition of own shares – 1.0 – 22.3 21.3
Payments received from the sale of own shares 32.7 – 32.7
Payments received from the issuance of employee shares 6.8 3.7 3.1
Payments made for interest increase in consolidated companies – 0.8 – – 0.8
Dividend payments
TUI AG – 381.8 – 368.2 – 13.6
subsidiaries to non-controlling interest – 53.5 – 88.6 35.1
Payments received from the issue of bonds and the raising
of financial liabilities 434.2 329.8 104.4
Payments made for redemption of loans and financial liabilities – 162.7 – 513.4 350.7
Interest paid – 110.8 – 74.8 – 36.0
Cash outflow from financing activities (40) – 236.9 – 733.8 496.9
Net change in cash and cash equivalents 68.3 161.6 – 93.3
Development of cash and cash equivalents (41)
Cash and cash equivalents at beginning of period 2,516.1 2,403.6 112.5
Change in cash and cash equivalents due to exchange
rate fluctuations – 36.4 – 49.1 12.7
Net change in cash and cash equivalents 68.3 161.6 – 93.3
Cash and cash equivalents at end of period 2,548.0 2,516.1 31.9
of which included in the balance sheet as assets held for sale – – –

159NOT E S » pr I NC Ipl e S A ND Me T HoDS U NDe r ly I NG T He CoN S ol I DAT e D f I N A NC I A l S TAT e Me N T S
NOTES
Principles and methods underlying the Consolidated Financial Statements
General
The TUI Group with its major subsidiaries and shareholdings operates in tourism.
TUI AG, based in Karl-Wiechert-Allee 4, Hanover is the TUI Group’s parent company and a listed corporation under German law. The Company is registered in the commercial registers of the district courts of Berlin-Charlottenburg (HRB 321) and Hanover (HRB 6580). The shares in the company are traded on the London Stock Exchange and the Hanover and Frankfurt Stock Exchanges.
These consolidated financial statements of TUI AG were prepared for the FY 2018 comprising the period from 1 Octo-ber 2017 to 30 September 2018. Where any of TUI’s subsidiaries have different financial years, financial statements were prepared as at 30 September in order to include these subsidiaries in TUI AG’s consolidated financial statements.
The Executive Board and the Supervisory Board have submitted a Declaration of Compliance with the German Corporate Governance Code required pursuant to section 161 of the German Stock Corporation Act (AktG) and made it permanently available to the general public on the Company’s website (www.tuigroup.com).
The consolidated financial statements are prepared in euros. Unless stated otherwise, all amounts are indicated in million euros (€m). Due to the utilisation of rounded amounts there may be minor rounding differences in total and percentages.
The consolidated financial statements were approved for publication by TUI AG’s Executive Board on 11 December 2018.
Accounting principles
D E C L A R AT I O N O F CO M P L I A N C E
Pursuant to Regulation EEC No. 1606/2002 of the European Parliament and Council, TUI AG’s consolidated financial statements as at 30 September 2018 were prepared in accordance with the International Financial Reporting Standards (IFRS) as applicable in the European Union. Moreover, the commercial-law provisions listed in section 315e (1) of the German Commercial Code (HGB) were also observed in preparing the consolidated financial statements.
The accounting and measurement methods and the explanatory information and Notes to these annual financial statements for FY 2018 are generally consistent with those followed in preparing the previous consolidated financial statements for FY 2017.
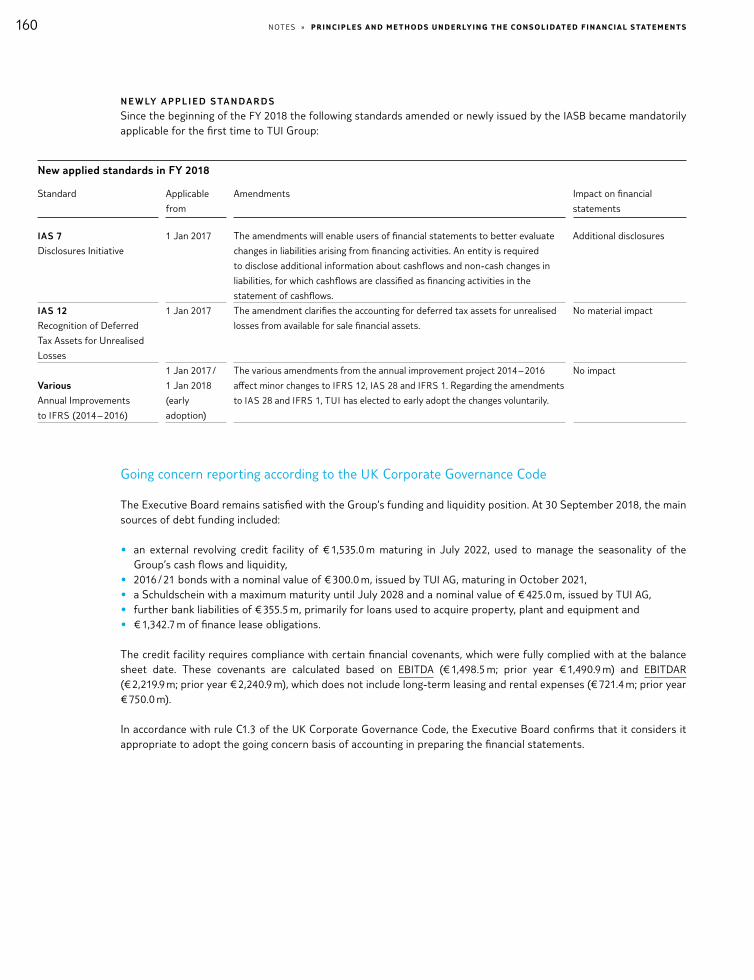
160 NOT E S » pr I NC Ipl e S A ND Me T HoDS U NDe r ly I NG T He CoN S ol I DAT e D f I N A NC I A l S TAT e Me N T S
N E W LY A P P L I E D S TA N DA R D S
Since the beginning of the FY 2018 the following standards amended or newly issued by the IASB became mandatorily applicable for the first time to TUI Group:
New applied standards in FY 2018
Standard Applicable
from
Amendments Impact on financial
statements
IAS 7
Disclosures Initiative
1 Jan 2017
The amendments will enable users of financial statements to better evaluate
changes in liabilities arising from financing activities. An entity is required
to disclose additional information about cashflows and non-cash changes in
liabilities, for which cashflows are classified as financing activities in the
statement of cashflows.
Additional disclosures
IAS 12
Recognition of Deferred
Tax Assets for Unrealised
Losses
1 Jan 2017
The amendment clarifies the accounting for deferred tax assets for unrealised
losses from available for sale financial assets.
No material impact
Various
Annual Improvements
to IFRS (2014 – 2016)
1 Jan 2017 /
1 Jan 2018
(early
adoption)
The various amendments from the annual improvement project 2014 – 2016
affect minor changes to IFRS 12, IAS 28 and IFRS 1. Regarding the amendments
to IAS 28 and IFRS 1, TUI has elected to early adopt the changes voluntarily.
No impact
Going concern reporting according to the UK Corporate Governance Code
The Executive Board remains satisfied with the Group’s funding and liquidity position. At 30 September 2018, the main sources of debt funding included:
• an external revolving credit facility of € 1,535.0 m maturing in July 2022, used to manage the seasonality of the Group’s cash flows and liquidity,
• 2016 / 21 bonds with a nominal value of € 300.0 m, issued by TUI AG, maturing in October 2021,• a Schuldschein with a maximum maturity until July 2028 and a nominal value of € 425.0 m, issued by TUI AG, • further bank liabilities of € 355.5 m, primarily for loans used to acquire property, plant and equipment and• € 1,342.7 m of finance lease obligations.
The credit facility requires compliance with certain financial covenants, which were fully complied with at the balance sheet date. These covenants are calculated based on EBITDA (€ 1,498.5 m; prior year € 1,490.9 m) and EBITDAR (€ 2,219.9 m; prior year € 2,240.9 m), which does not include long-term leasing and rental expenses (€ 721.4 m; prior year € 750.0 m).
In accordance with rule C1.3 of the UK Corporate Governance Code, the Executive Board confirms that it considers it appropriate to adopt the going concern basis of accounting in preparing the financial statements.

161NOT E S » pr I NC Ipl e S A ND Me T HoDS U NDe r ly I NG T He CoN S ol I DAT e D f I N A NC I A l S TAT e Me N T S
Principles and methods of consolidation
P R I N C I P L E S
The consolidated financial statements include all significant subsidiaries directly or indirectly controlled by TUI AG. Control exists where TUI AG has power over the relevant activities, is exposed to variable returns or has rights to the returns, and has the ability to affect those variable returns through its power over the investee.
As a rule, the control is exercised by means of a direct or indirect majority of voting rights. If the TUI Group holds less than the majority of voting rights in a shareholding, it may exercise control due to contractual agreements or similar arrangements, just as in the case of the participation in the RIUSA II Group. Due to the contractual agreements between the shareholders and the framework agreements with TUI Group as well as the considerable importance of tour operation for the economic success of RIUSA II Group, TUI Group is able to exercise a controlling influence on decisions about the most relevant activities and consequently the amount of returns. TUI Group is subject to variable returns from RIUSA II Group, in particular due to dividend payments and fluctuations in the value of the stake itself. RIUSA II Group is therefore consolidated although TUI Group only holds a 50 % equity stake.
In assessing control, the existence and effect of potential voting rights that are currently exercisable or convertible are taken into account. Consolidation of subsidiaries starts from the date TUI gains control. When TUI ceases to control the corresponding companies, they are removed from the group of consolidated companies.
The consolidated financial statements are prepared from the separate or single-entity financial statements of TUI AG and its subsidiaries, drawn up on the basis of uniform accounting, measurement and consolidation methods and usually audited or reviewed by auditors.
Associates for which the TUI Group is able to exert significant influence over the financial and operating policy decisions within these companies are accounted for using the equity method. As a rule, significant influence is assumed if TUI AG directly or indirectly holds voting rights of 20 to less than 50 per cent.
Stakes in joint ventures are also measured using the equity method. A joint venture is a company managed jointly by the TUI Group with one or several partners based on a contractual agreement, in which the parties that jointly exercise control have rights to the company’s net assets. Joint ventures also include companies in which the TUI Group holds a majority or minority of voting rights but in which decisions about the relevant activities may only be taken on an unanimous basis due to contractual agreements.
The dates as of which associates and joint ventures are included in or removed from the group of companies measured at equity are determined in a manner consistent with that applied to subsidiaries. At equity measurement in each case is based on the last annual financial statements available or the interim financial statements as at 30 September if the balance sheet dates differ from TUI AG’s balance sheet date. This affects 35 companies with a financial year from 1 January to 31 December, four companies with a financial year from 1 November to 31 October and two companies with a financial year from 1 April to 31 March of the following year.
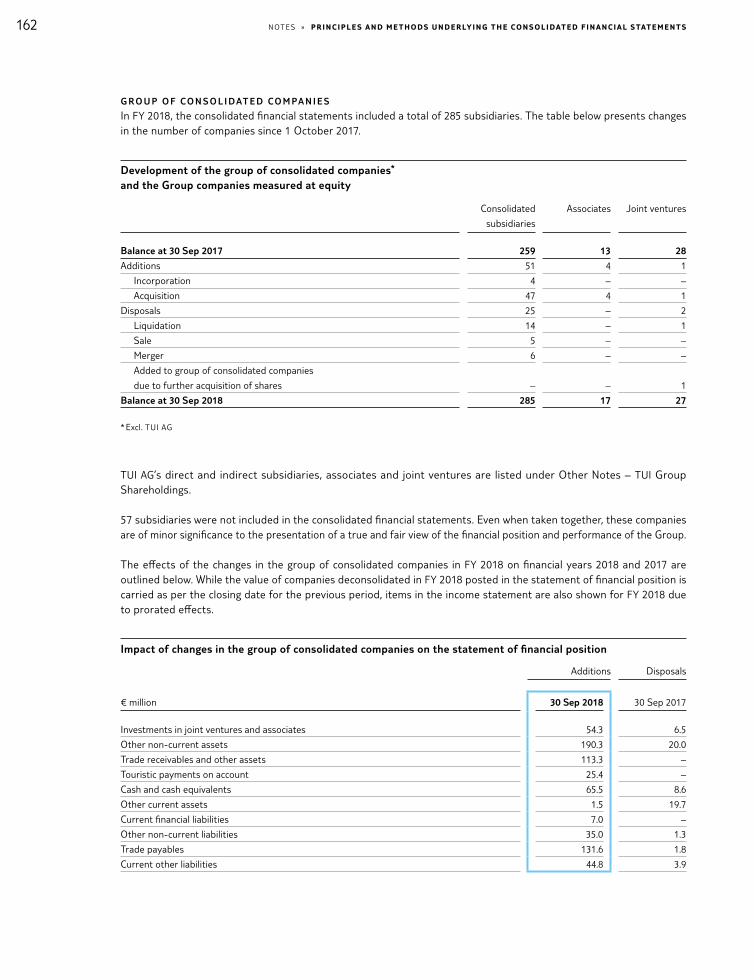
162 NOT E S » pr I NC Ipl e S A ND Me T HoDS U NDe r ly I NG T He CoN S ol I DAT e D f I N A NC I A l S TAT e Me N T S
G R O U P O F CO N S O L I DAT E D CO M PA N I E S
In FY 2018, the consolidated financial statements included a total of 285 subsidiaries. The table below presents changes in the number of companies since 1 October 2017.
Development of the group of consolidated companies* and the Group companies measured at equity
Consolidated
subsidiaries
Associates Joint ventures
Balance at 30 Sep 2017 259 13 28
Additions 51 4 1
Incorporation 4 – –
Acquisition 47 4 1
Disposals 25 – 2
Liquidation 14 – 1
Sale 5 – –
Merger 6 – –
Added to group of consolidated companies
due to further acquisition of shares – – 1
Balance at 30 Sep 2018 285 17 27
* Excl. TUI AG
TUI AG’s direct and indirect subsidiaries, associates and joint ventures are listed under Other Notes – TUI Group Shareholdings.
57 subsidiaries were not included in the consolidated financial statements. Even when taken together, these companies are of minor significance to the presentation of a true and fair view of the financial position and performance of the Group.
The effects of the changes in the group of consolidated companies in FY 2018 on financial years 2018 and 2017 are outlined below. While the value of companies deconsolidated in FY 2018 posted in the statement of financial position is carried as per the closing date for the previous period, items in the income statement are also shown for FY 2018 due to prorated effects.
Impact of changes in the group of consolidated companies on the statement of financial position
Additions Disposals
€ million 30 Sep 2018 30 Sep 2017
Investments in joint ventures and associates 54.3 6.5
Other non-current assets 190.3 20.0
Trade receivables and other assets 113.3 –
Touristic payments on account 25.4 –
Cash and cash equivalents 65.5 8.6
Other current assets 1.5 19.7
Current financial liabilities 7.0 –
Other non-current liabilities 35.0 1.3
Trade payables 131.6 1.8
Current other liabilities 44.8 3.9
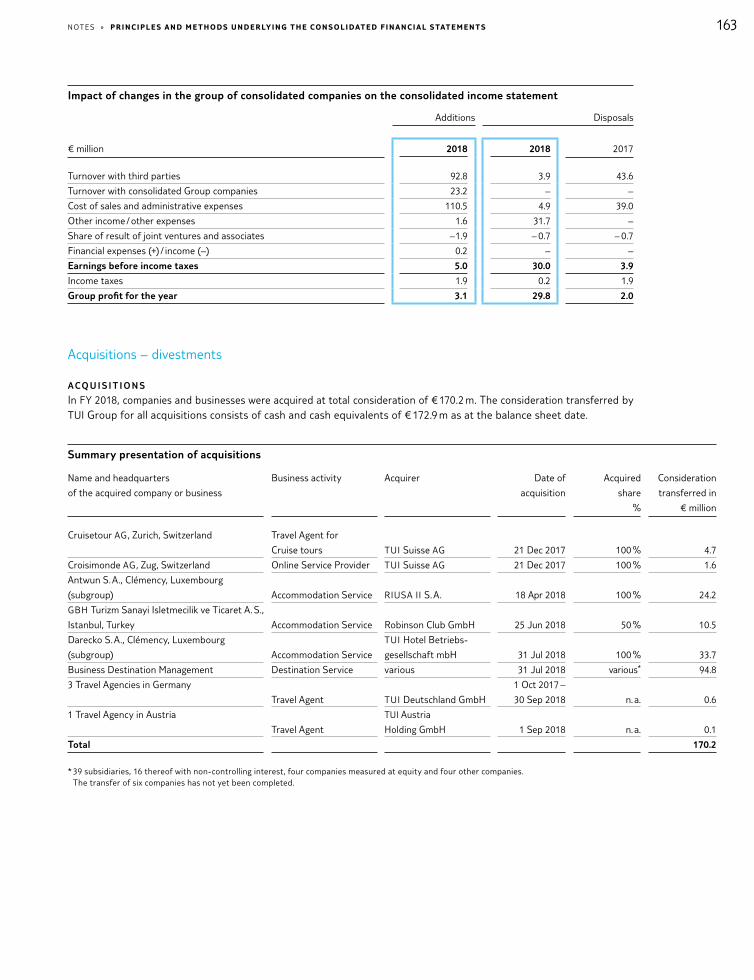
163NOT E S » pr I NC Ipl e S A ND Me T HoDS U NDe r ly I NG T He CoN S ol I DAT e D f I N A NC I A l S TAT e Me N T S
Impact of changes in the group of consolidated companies on the consolidated income statement
Additions Disposals
€ million 2018 2018 2017
Turnover with third parties 92.8 3.9 43.6
Turnover with consolidated Group companies 23.2 – –
Cost of sales and administrative expenses 110.5 4.9 39.0
Other income / other expenses 1.6 31.7 –
Share of result of joint ventures and associates – 1.9 – 0.7 – 0.7
Financial expenses (+) / income (–) 0.2 – –
Earnings before income taxes 5.0 30.0 3.9
Income taxes 1.9 0.2 1.9
Group profit for the year 3.1 29.8 2.0
Acquisitions – divestments
ACQ U I S I T I O N S
In FY 2018, companies and businesses were acquired at total consideration of € 170.2 m. The consideration transferred by TUI Group for all acquisitions consists of cash and cash equivalents of € 172.9 m as at the balance sheet date.
Summary presentation of acquisitions
Name and headquarters
of the acquired company or business
Business activity
Acquirer
Date of
acquisition
Acquired
share
%
Consideration
transferred in
€ million
Cruisetour AG, Zurich, Switzerland Travel Agent for
Cruise tours TUI Suisse AG 21 Dec 2017 100 % 4.7
Croisimonde AG, Zug, Switzerland Online Service Provider TUI Suisse AG 21 Dec 2017 100 % 1.6
Antwun S. A., Clémency, Luxembourg
(subgroup) Accommodation Service RIUSA II S. A. 18 Apr 2018 100 % 24.2
GBH Turizm Sanayi Isletmecilik ve Ticaret A. S.,
Istanbul, Turkey Accommodation Service Robinson Club GmbH 25 Jun 2018 50 % 10.5
Darecko S. A., Clémency, Luxembourg
(subgroup) Accommodation Service
TUI Hotel Betriebs-
gesellschaft mbH 31 Jul 2018 100 % 33.7
Business Destination Management Destination Service various 31 Jul 2018 various* 94.8
3 Travel Agencies in Germany
Travel Agent TUI Deutschland GmbH
1 Oct 2017 –
30 Sep 2018 n. a. 0.6
1 Travel Agency in Austria
Travel Agent
TUI Austria
Holding GmbH 1 Sep 2018 n. a. 0.1
Total 170.2
* 39 subsidiaries, 16 thereof with non-controlling interest, four companies measured at equity and four other companies. The transfer of six companies has not yet been completed.

164 NOT E S » pr I NC Ipl e S A ND Me T HoDS U NDe r ly I NG T He CoN S ol I DAT e D f I N A NC I A l S TAT e Me N T S
The acquisitions of the travel agencies in Germany and Austria in the completed financial year were carried out in the form of asset deals.
TUI Group acquired Cruisetour AG, Zurich, Switzerland, and Croisimonde AG, Zug, Switzerland, in order to expand its footprint in the cruise sector in the Swiss market.
The acquisition of the stake in Antwun S. A., Luxembourg, listed in the table above, also included the takeover of its subsidiary Nungwi Limited, headquartered in Zanzibar, Tanzania. The consideration transferred by TUI Group for the acquisition of the stake comprises the purchase price paid of € 24.2 m. Moreover, receivables from the acquired company held by the former owner were taken over at a purchase price of € 14.5 m. The purpose of the acquisition is to develop Zanzibar as a destination.
In order to develop additional earnings potential, TUI AG has increased its stake in GBH Turizm Ticaret A. S., Istanbul, to 100 %. Fair value measurement of the company, previously measured using the at equity method, of € 7.4 m directly before the acquisition of further stakes resulted in a profit of € 2.1 m, including the reclassification of foreign exchange effects.
The acquisition of the stake in Darecko S. A., Luxembourg, also includes its subsidiary Zanzibar Beach Village Limited, Zanzibar, Tanzania. The consideration transferred includes the purchase price paid of € 35.0 m and debt of € 1.3 m taken over from the previous owner. Just as with the acquisition of Antwun S. A., this acquisition serves to develop Zanzibar as a destination.
Statement of financial position as at the date of first-time cosolidation
€ million
Cruisetour AG and
Croisimonde AG
Antwun S. A.
(subgroup)
GBH Turizm
Sanayi
Isletmecilik ve
Ticaret A. S.
Darecko S. A.
(subgroup)
Other intangible assets 0.1 – – –
Property, plant and equipment – 49.7 18.1 39.8
Fixed assets 0.1 49.7 18.1 39.8
Inventories – 0.1 – 0.3
Trade receivables and other assets 2.9 11.8 0.4 8.1
Cash and cash equivalents 2.5 2.2 0.1 0.4
Deferred tax liabilities – 12.6 3.0 13.6
Other provisions 0.1 0.5 0.6 –
Financial liabilities – 25.1 – –
Trade and other liabilities 4.7 1.4 3.7 7.8
Equity 0.7 24.2 11.3 27.2
The gross amounts of the acquired trade accounts receivable of Antwun S. A. totalled € 0.8 m as at the date of acquisition; for Darecko S. A. they totalled € 8.0 m. No impairment was made. The purchase price allocation of Antwun S. A. is provisional in terms of certain receivables and liabilities.
The difference of € 21.5 m arising between the consideration transferred and the acquired revalued net assets was carried as goodwill for the above-mentioned acquisitions carried out in the financial year. This goodwill primarily relates to the acquisition of stakes in hotel companies (GBH Turizm Ticaret A. S. worth € 9.1 m and Darecko S. A. worth € 6.5 m) and the acquisition of Cruisetour AG and Croisimonde AG worth € 5.6 m. It constitutes a part of the future earning potential. The goodwill capitalised in the completed financial year includes an amount of € 0.5 m which is expected to be tax-deductible.
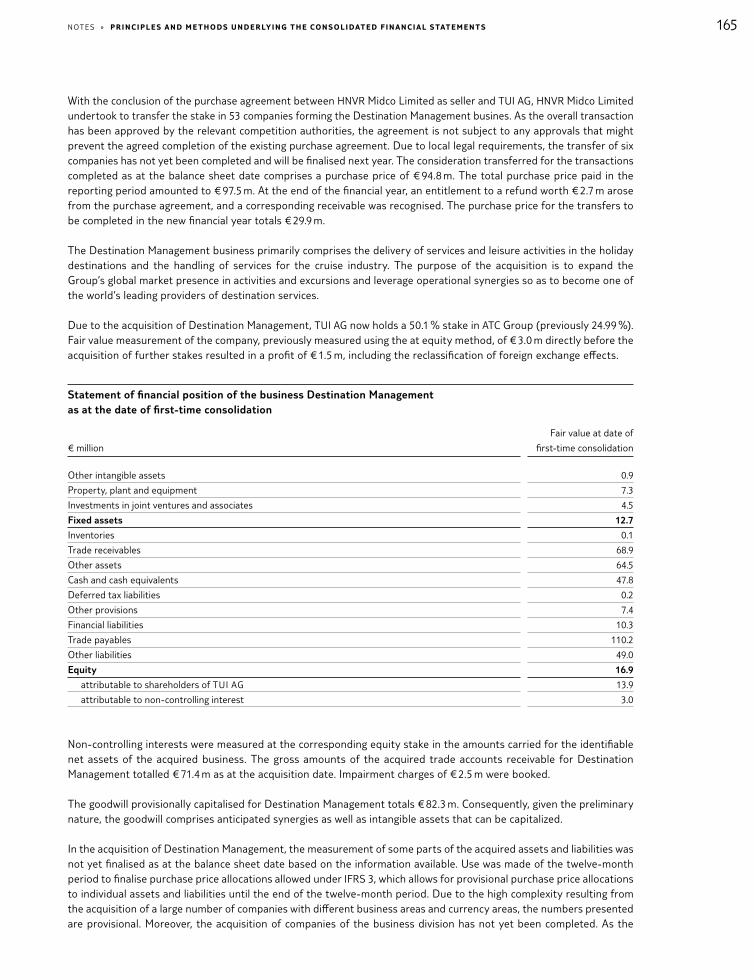
165NOT E S » pr I NC Ipl e S A ND Me T HoDS U NDe r ly I NG T He CoN S ol I DAT e D f I N A NC I A l S TAT e Me N T S
With the conclusion of the purchase agreement between HNVR Midco Limited as seller and TUI AG, HNVR Midco Limited undertook to transfer the stake in 53 companies forming the Destination Management busines. As the overall transaction has been approved by the relevant competition authorities, the agreement is not subject to any approvals that might prevent the agreed completion of the existing purchase agreement. Due to local legal requirements, the transfer of six companies has not yet been completed and will be finalised next year. The consideration transferred for the transactions completed as at the balance sheet date comprises a purchase price of € 94.8 m. The total purchase price paid in the reporting period amounted to € 97.5 m. At the end of the financial year, an entitlement to a refund worth € 2.7 m arose from the purchase agreement, and a corresponding receivable was recognised. The purchase price for the transfers to be completed in the new financial year totals € 29.9 m.
The Destination Management business primarily comprises the delivery of services and leisure activities in the holiday destinations and the handling of services for the cruise industry. The purpose of the acquisition is to expand the Group’s global market presence in activities and excursions and leverage operational synergies so as to become one of the world’s leading providers of destination services.
Due to the acquisition of Destination Management, TUI AG now holds a 50.1 % stake in ATC Group (previously 24.99 %). Fair value measurement of the company, previously measured using the at equity method, of € 3.0 m directly before the acquisition of further stakes resulted in a profit of € 1.5 m, including the reclassification of foreign exchange effects.
Statement of financial position of the business Destination Management as at the date of first-time consolidation
€ million
Fair value at date of
first-time consolidation
Other intangible assets 0.9
Property, plant and equipment 7.3
Investments in joint ventures and associates 4.5
Fixed assets 12.7
Inventories 0.1
Trade receivables 68.9
Other assets 64.5
Cash and cash equivalents 47.8
Deferred tax liabilities 0.2
Other provisions 7.4
Financial liabilities 10.3
Trade payables 110.2
Other liabilities 49.0
Equity 16.9
attributable to shareholders of TUI AG 13.9
attributable to non-controlling interest 3.0
Non-controlling interests were measured at the corresponding equity stake in the amounts carried for the identifiable net assets of the acquired business. The gross amounts of the acquired trade accounts receivable for Destination Management totalled € 71.4 m as at the acquisition date. Impairment charges of € 2.5 m were booked.
The goodwill provisionally capitalised for Destination Management totals € 82.3 m. Consequently, given the preliminary nature, the goodwill comprises anticipated synergies as well as intangible assets that can be capitalized.
In the acquisition of Destination Management, the measurement of some parts of the acquired assets and liabilities was not yet finalised as at the balance sheet date based on the information available. Use was made of the twelve-month period to finalise purchase price allocations allowed under IFRS 3, which allows for provisional purchase price allocations to individual assets and liabilities until the end of the twelve-month period. Due to the high complexity resulting from the acquisition of a large number of companies with different business areas and currency areas, the numbers presented are provisional. Moreover, the acquisition of companies of the business division has not yet been completed. As the
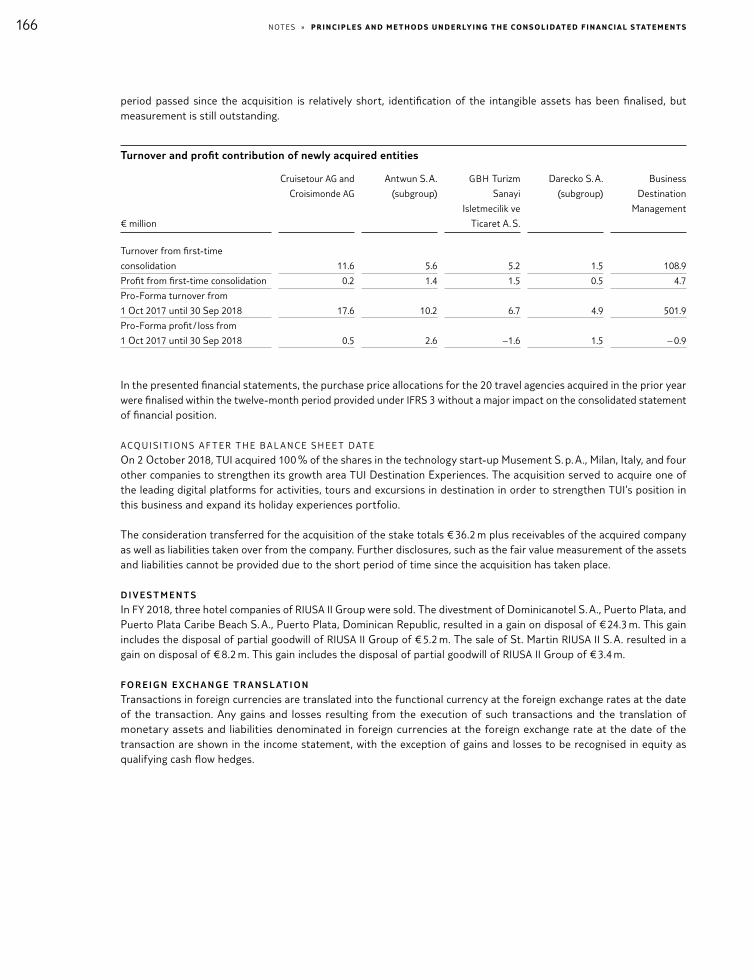
166 NOT E S » pr I NC Ipl e S A ND Me T HoDS U NDe r ly I NG T He CoN S ol I DAT e D f I N A NC I A l S TAT e Me N T S
period passed since the acquisition is relatively short, identification of the intangible assets has been finalised, but measurement is still outstanding.
Turnover and profit contribution of newly acquired entities
€ million
Cruisetour AG and
Croisimonde AG
Antwun S. A.
(subgroup)
GBH Turizm
Sanayi
Isletmecilik ve
Ticaret A. S.
Darecko S. A.
(subgroup)
Business
Destination
Management
Turnover from first-time
consolidation 11.6 5.6 5.2 1.5 108.9
Profit from first-time consolidation 0.2 1.4 1.5 0.5 4.7
Pro-Forma turnover from
1 Oct 2017 until 30 Sep 2018 17.6 10.2 6.7 4.9 501.9
Pro-Forma profit / loss from
1 Oct 2017 until 30 Sep 2018 0.5 2.6 – 1.6 1.5 – 0.9
In the presented financial statements, the purchase price allocations for the 20 travel agencies acquired in the prior year were finalised within the twelve-month period provided under IFRS 3 without a major impact on the consolidated statement of financial position.
ACQ U I S I T I O N S A F T E R T H E B A L A N C E S H E E T DAT E
On 2 October 2018, TUI acquired 100 % of the shares in the technology start-up Musement S. p. A., Milan, Italy, and four other companies to strengthen its growth area TUI Destination Experiences. The acquisition served to acquire one of the leading digital platforms for activities, tours and excursions in destination in order to strengthen TUI’s position in this business and expand its holiday experiences portfolio.
The consideration transferred for the acquisition of the stake totals € 36.2 m plus receivables of the acquired company as well as liabilities taken over from the company. Further disclosures, such as the fair value measurement of the assets and liabilities cannot be provided due to the short period of time since the acquisition has taken place.
D I V E S T M E N T S
In FY 2018, three hotel companies of RIUSA II Group were sold. The divestment of Dominicanotel S. A., Puerto Plata, and Puerto Plata Caribe Beach S. A., Puerto Plata, Dominican Republic, resulted in a gain on disposal of € 24.3 m. This gain includes the disposal of partial goodwill of RIUSA II Group of € 5.2 m. The sale of St. Martin RIUSA II S. A. resulted in a gain on disposal of € 8.2 m. This gain includes the disposal of partial goodwill of RIUSA II Group of € 3.4 m.
F O R E I G N E XC H A N G E T R A N S L AT I O N
Transactions in foreign currencies are translated into the functional currency at the foreign exchange rates at the date of the transaction. Any gains and losses resulting from the execution of such transactions and the translation of monetary assets and liabilities denominated in foreign currencies at the foreign exchange rate at the date of the transaction are shown in the income statement, with the exception of gains and losses to be recognised in equity as qualifying cash flow hedges.

167NOT E S » pr I NC Ipl e S A ND Me T HoDS U NDe r ly I NG T He CoN S ol I DAT e D f I N A NC I A l S TAT e Me N T S
The annual financial statements of companies are prepared in the respective functional currency. The functional currency of a company is the currency of the primary economic environment in which the company operates. With the exception of a small number of companies, the functional currencies of all subsidiaries correspond to the currency of the country of incorporation of the respective subsidiary.
Where subsidiaries prepare their financial statements in functional currencies other than the Euro, being the Group’s reporting currency, the assets and liabilities are translated at the rate of exchange applicable at the balance sheet date (closing rate). Goodwill allocated to these companies and adjustments of the fair value arising on the acquisition of a foreign company are treated as assets and liabilities of the foreign company and also translated at the rate of exchange applicable at the balance sheet date. The items of the income statement and hence the result for the year shown in the income statement are translated at the average rate of the month in which the respective transaction takes place.
Differences arising on the translation of the annual financial statements of foreign subsidiaries are reported outside profit and loss and separately shown as foreign exchange differences in the consolidated statement of changes in equity. When a foreign company or operation is sold, any foreign exchange differences previously included in equity outside profit and loss are recognised as a gain or loss from disposal in the income statement through profit and loss.
Translation differences relating to non-monetary items with changes in their fair values eliminated through profit and loss (e. g. equity instruments measured at their fair value through profit and loss) are included in the income statement. In contrast, translation differences for non-monetary items with changes in their fair values taken to equity (e. g. equity instruments classified as available for sale) are included in revenue reserves.
The TUI Group did not hold any subsidiaries operating in hyperinflationary economies in the completed financial year, nor in the previous year.
The translation of the financial statements of foreign companies measured at equity follows the same principles for adjusting carrying amounts and translating goodwill as those used for consolidated subsidiaries.
N E T I N V E S T M E N T I N A F O R E I G N O P E R AT I O N
Monetary items receivable from or payable to a foreign operation, the settlement of which is neither planned nor likely in the foreseeable future, essentially constitute part of a net investment in this foreign operation. Foreign exchange differences from the translation of these monetary items are recognised in other comprehensive income. TUI Group has granted loans of this type in particular to hotel companies in North Africa.
Exchange rates of currencies of relevance to the TUI Group
Closing rate Annual average rate
1 € equivalent 30 Sep 2018 30 Sep 2017 2018 2017
Sterling 0.89 0.88 0.89 0.87
US dollar 1.16 1.18 1.19 1.07
Swiss franc 1.13 1.15 1.16 1.08
Swedish krona 10.31 9.65 10.13 9.69
CO N S O L I DAT I O N M E T H O D S
The recognition of the net assets of acquired businesses is based on the acquisition method. Accordingly all identifiable assets and all liabilities assumed are measured at fair value as of the acquisition date. Subsequently, the consideration for the stake is measured at fair value and eliminated against the acquiree’s revalued equity attributable to the acquired share. As in the prior year, the option to measure the non-controlling interests at their fair value (full goodwill method) was not used.
168 NOT E S » pr I NC Ipl e S A ND Me T HoDS U NDe r ly I NG T He CoN S ol I DAT e D f I N A NC I A l S TAT e Me N T S
Any excess of acquisition costs over net assets acquired is capitalised as goodwill and recognised as an asset in accordance with the provisions of IFRS 3. Any negative goodwill is recognised immediately in profit and loss and presented as other income.
When additional shares are purchased after obtaining control, the difference between the purchase price and the carrying amount of the stakes acquired is recognised directly in equity. The effects from sales of stakes not entailing a loss of control are also recognised directly in equity. By contrast, when control is obtained or lost, gains or losses are recognised in profit and loss. In the case of business combination achieved in stages (where the acquirer held an equity interest before he obtained control), the equity stake previously held in the acquired company is revalued at the fair value applicable at the acquisition date and the resulting gain or loss is recognised in profit or loss. For transactions involving a loss of control, the profit or loss does not only comprise the difference between the carrying amounts of the disposed stakes and the consideration received but also the result from the revaluation of the remaining shares.
On loss of control of a subsidiary the gain or loss on derecognition will be calculated as the difference of the fair value of the consideration plus the fair value of any investment retained in the former subsidiary less the share of the book value of the net assets of the subsidiary. Any gains or losses previously recognised in other comprehensive income from currency translations or the valuation of financial assets and liabilities will be reclassified to the income statement. When a subsidiary is sold, any goodwill allocated to the respective subsidiary is taken into account in the calculation of the profit or loss of disposal.
The Group’s associates and joint ventures are measured at equity and included at the cost to purchase as at the acquisition date. The Group’s stake in associates and joint ventures includes the goodwill arising from the respective acquisition.
The Group’s share in profits and losses of associates and joint ventures is carried in the income statement from the date of acquisition (Share of result from joint ventures and associates), while the Group’s share in the total other comprehensive income is shown in its revenue reserves. The accumulated changes arising after the acquisition are shown in the carrying amount of the shareholding. When the share in the loss of an associated company or joint venture equals or exceeds the Group’s original stake in this company, including other unsecured receivables, no further losses are recognised. Any losses exceeding that stake are only recognised to the extent that obligations have been assumed or payments have been made for the associated company or joint venture.
Where the accounting and measurement methods applied by associates and joint ventures differ from the uniform accounting rules applied in the Group, the differences are adjusted.
Intercompany receivables and payables or provisions are eliminated, as are intercompany turnover, other income and the corresponding expenses. Intercompany results from intercompany deliveries and services are reversed through profit and loss, taking account of deferred taxes. However, intercompany losses are an indicator that an asset may be impaired. Intercompany profits from non-trading transactions with companies measured at equity are eliminated in relation to the Group’s stake in the company. Intercompany profits from transactions with companies measured at equity are eliminated in relation to the Group’s stake in the companies unless these intercompany profits result from the usual deliveries effected or services rendered between Group companies. Intercompany transactions are provided on an arm’s length basis.

169NOT E S » pr I NC Ipl e S A ND Me T HoDS U NDe r ly I NG T He CoN S ol I DAT e D f I N A NC I A l S TAT e Me N T S
Accounting and measurement methods
The consolidated financial statements were prepared according to the historical cost principle, with the exception of certain financial instruments such as financial assets and derivatives held for trading or available for sale as well as plan assets from externally funded pensions benefit obligations held at fair value at the balance sheet date.
The financial statements of the consolidated subsidiaries are prepared in accordance with uniform accounting and measurement principles. The amounts recognised in the consolidated financial statements are not determined by tax regulations but solely by the commercial presentation of the financial position and performance as set out in the rules of the IASB.
T U R N OV E R R E CO G N I T I O N
Turnover and other income is recognised upon delivery of the service or assets and hence upon transfer of the risk.
The commission fees received by travel agencies for package tours are recognised once the travel agencies have performed their contractual obligations towards the tour operator. As a rule, this condition is met upon payment by the customers or, at the latest, at the date of departure. The services of tour operators mainly consist in organising and coordinating package tours. Turnover from the organisation of tours is therefore recognised in full when the customer departs. Turnover from individual travel modules booked by the customer directly with airlines, hotel companies or incoming agencies is recognised when the customers use the services concerned. Income from non-completed cruises is recognised according to the proportion of contract performance at the balance sheet date. The percentage of completion is determined as the ratio between travel days completed by the balance sheet date and overall travel days.
G O O D W I L L A N D O T H E R I N TA N G I B L E A S S E T S
Acquired intangible assets are carried at cost. Internally generated intangible assets are capitalised at cost where an inflow of future economic benefits for the Group is probable and can be reliably measured. The cost to produce comprises direct costs and directly allocable overheads. Intangible assets with a finite service life are amortised over the expected useful life.
Intangible assets acquired as a result of business combinations, such as customer base or trademark rights, are included at their fair value as at the date of acquisition and are amortised on a straight-line basis.
Useful lives of intangible assets
Useful lives
Brands, licences and other rights 15 to 20 years
Transport and leasing contracts 12 to 20 years
Computer software 3 to 10 years
Customer base as at acquisiton date 7 to 15 years
If there are any events or indications suggesting potential impairment, the amortised carrying amount of the intangible asset is compared with the recoverable amount. Any losses in value going beyond wear-and-tear depreciation are taken into account through the recognition of impairment charges.

170 NOT E S » pr I NC Ipl e S A ND Me T HoDS U NDe r ly I NG T He CoN S ol I DAT e D f I N A NC I A l S TAT e Me N T S
Depending on the functional area of the intangible asset, amortisation and impairment charges are included under cost of sales or administrative expenses. Intangible assets with indefinite useful lives are not amortised but are tested for impairment at least annually. In addition, impairment tests are conducted if there are any events or indications suggesting potential impairment. The TUI Group’s intangible assets with an indefinite useful life consist exclusively of goodwill.
Impairment tests for goodwill are conducted on the basis of cash generating units (CGU) or group of cash generating units.
Impairment charges are recognised where the carrying amount of the tested units plus the allocated goodwill exceeds the recoverable amount. The recoverable amount is the higher of fair value less costs of disposal and the present value of future cash flows based on continued use (value in use). The fair value less costs of disposal corresponds to the amount that could be generated between knowledgeable, willing, independent business partners after deduction of the costs of disposal.
Impairment of goodwill is shown separately in the consolidated income statement.
P R O P E R T Y, P L A N T A N D E Q U I P M E N T
Property, plant and equipment are measured at amortised cost. The costs to purchase include costs to bring the asset to a working condition. The costs to produce are determined on the basis of direct costs and directly attributable indirect costs and depreciation.
Borrowing costs directly associated with the acquisition, construction or production of qualifying assets are included in the costs to acquire or produce these assets until the assets are ready for their intended use.
To the extent that funds are borrowed specifically for the purpose of obtaining a qualifying asset, the underlying capitalisation rate is determined on the basis of the specific borrowing cost; in all other cases the weighted average of the borrowing costs applicable to the borrowings outstanding is applied.
Depreciation of property, plant and equipment is based on the straight-line method, based on the customary useful lives. The useful economic lives are as follows:
Useful lives of property, plant and equipment
Useful lives
Hotel buildings 30 to 40 years
Other buildings 25 to 50 years
Cruise ships 30 to 40 years
Aircraft
Fuselages and engines 22 to 25 years
Engine overhaul depending on intervals, up to 12 years
Major overhaul depending on intervals, up to 12 years
Spare parts up to 12 years
Operating and business equipment 3 to 10 years
Moreover, the level of depreciation is determined by the residual values recoverable at the end of the useful life of an asset. The residual value assumed in first-time recognition for cruise ships and hotel complexes is up to 35 % of the acquisition costs. The determination of the depreciation of aircraft fuselages and aircraft engines in first-time recognition is based on a residual value of a maxium of 5 % of the cost of acquisition. The payments made under a power by the hour arrangement relating to maintenance overhauls are capitalised as PPE under construction up to a maintenance event at which point the cost is transferred to the appropriate PPE category.
Both the useful lives and residual values are reviewed on an annual basis when preparing the Group financial statements. The review of the residual values is based on comparable assets at the end of their useful lives as at the current point in time. Any adjustments required are recognised as a correction of depreciation over the remaining useful life of the asset. The adjustment of depreciation is recognised retrospectively for the entire financial year in which the review has
171NOT E S » pr I NC Ipl e S A ND Me T HoDS U NDe r ly I NG T He CoN S ol I DAT e D f I N A NC I A l S TAT e Me N T S
taken place. Where the review results in an increase in the residual value so that it exceeds the remaining net carrying amount of the asset, depreciation is suspended. In this case, the amounts are not written back.
Any losses in value going beyond wear-and-tear depreciation are taken into account through the recognition of impairment losses. If there are any events or indications suggesting impairment, the required impairment test is performed to compare the carrying amount of an asset with the recoverable amount.
Investment grants received are shown as reductions in the costs to purchase or produce items of property, plant or equipment where these grants are directly allocable to individual items. Where a direct allocation of grants is not possible, the grants and subsidies received are included as deferred income under other liabilities and reversed in accordance with the use of the investment project.
L E A S E S
F I N A N C E L E A S E S
In accordance with IAS 17, leased property, plant and equipment in which the TUI Group assumes substantially all the risks and rewards of ownership is capitalised. Capitalisation is based on the fair value of the asset or the present value of the minimum lease payments, if lower. Depreciation is charged over the useful life or the lease term, if shorter, on the basis of the depreciation method applicable to comparable purchased or manufactured assets. Every lease payment is broken down into an interest portion and a redemption portion so as to produce a constant periodic rate of interest on the remaining balance of the liability. The interest portion is disclosed in the income statement through profit or loss.
F I N A N C I A L I N S T R U M E N T S
Financial instruments are contractual rights or obligations that will lead to an inflow or outflow of financial assets or the issue of equity rights. They also comprise derivative rights or obligations derived from primary assets.
In accordance with IAS 39, financial instruments are broken down into financial assets or liabilities to be measured at fair value through profit and loss, loans and receivables, financial assets available for sale, financial assets held to maturity and other financial liabilities measured at amortised cost using the effective interest method (financial liabilities at amortised cost).
In terms of financial instruments measured at fair value through profit and loss, the TUI Group holds derivative financial instruments mainly to be classified as held for trading as they do not meet the criteria as hedges in the framework of a hedging relationship according to IAS 39. The fair value option is not exercised. In addition, the TUI Group holds financial assets in the loans and receivables and available for sale categories. However, the presented financial statements do not include any financial assets held to maturity.
P R I M A R Y F I N A N C I A L A S S E T S A N D F I N A N C I A L L I A B I L I T I E S
Primary financial assets are recognised at the value as at the trading date on which the TUI Group commits to buy the asset. Primary financial assets are classified as loans and receivables or as financial assets available for sale when recognised for the first time. Loans and receivables as well as financial assets available for sale are initially recognised at fair value plus transaction costs.
172 NOT E S » pr I NC Ipl e S A ND Me T HoDS U NDe r ly I NG T He CoN S ol I DAT e D f I N A NC I A l S TAT e Me N T S
Allowances are recognized for identifiable individual risks. Where objective information indicates that impairment charges are required, e. g. substantial financial difficulties of the counterparty, payment delays or adverse changes in regional industry conditions expected to impact the solvency of the Group’s debtors in the light of past experience, impairment charges are recognised at an amount corresponding to the expected loss of non-recoverable cash flows. Impairment charges and reversals of impairment charges are included under cost of sales, administrative expenses or financial expenses, depending on the nature of the transaction.
Financial assets available for sale are non-derivative financial assets either individually expressly assigned to this category or not allocable to any other category of financial assets. Within the TUI Group, they consist of investments in affiliated, non-consolidated subsidiaries, trade investments and other securities. They are allocated to non-current assets unless management intends to sell them within twelve months of the balance sheet date.
Financial assets available for sale are measured at their fair value upon initial recognition. Changes in the fair value are included directly in equity until the disposal of the assets. Interest payments and dividends on available for sale financial assets are recognized in profit or loss. If there is objective evidence of impairment, an impairment loss is taken through profit and loss. Objective evidence may, in particular, be substantial financial difficulties of the counterparty and significant changes in the technological, market, legal or economic environment.
Moreover, for equity instruments held, a significant or prolonged decline in the fair value below its cost is also objective evidence of impairment. The TUI Group concludes that a significant decline exists if the fair value falls by more than 20 % below cost. A decline is assessed as prolonged if the fair value remains below cost for more than twelve months. In the event of subsequent reversal of the impairment, the impairment included in profit or loss is not reversed for equity instruments but recognised in other comprehensive income. Where a listed market price in an active market is not available for shares held in companies and other methods to determine an objective market value are not applicable, these equity instruments are measured at cost, with potential impairments taken into account.
As a matter of principle, the foreign exchange differences resulting from the translation of trade accounts payable are reported as a correction of the cost of sales. Foreign exchange differences from the translation of liabilities not resulting from normal operating processes are reported under other income / other expenses, financial expenses / income or administrative expenses, depending on the nature of the underlying liability.
A derecognition of assets is primarily recognised as at the date on which the rights for payments from the asset expire or are transferred and therefore as at the date essentially all risks and rewards of ownership are transferred. The rights to an asset expire when the rights to receive the cash flows from the asset have expired. For transfers of financial assets, it is tested whether a write-off has to be recognised in accordance with IAS 39 disposal rules.
Primary financial liabilities are included in the consolidated statement of financial position if an obligation exists to transfer cash and cash equivalents or other financial assets to another party. First-time recognition of a primary liability is recognised at its fair value. For loans taken out, the nominal amount received is reduced by discounts obtained and transaction costs paid. In the framework of follow-up measurement, primary financial liabilities are measured at amortised cost based on the effective interest method.
D E R I VAT I V E F I N A N C I A L I N S T R U M E N T S A N D H E D G I N G
At initial measurement, derivative financial instruments are measured at the fair value attributable to them on the date the contract is entered into. Subsequent re-measurement is also recognised at the fair value applicable at the respective balance sheet date. Where derivative financial instruments are not part in the framework of IAS 39 of a hedge in connection with hedge accounting, they are classified as held for trading.

173NOT E S » pr I NC Ipl e S A ND Me T HoDS U NDe r ly I NG T He CoN S ol I DAT e D f I N A NC I A l S TAT e Me N T S
The method used to recognise profits and losses depends on whether the derivative financial instrument has been classified as a hedge and on the type of underlying hedged item. Changes in the fair values of derivative financial instruments are recognised in profit and loss unless they are classified as a hedge in accordance with IAS 39. If they are classified as an effective hedge in accordance with IAS 39, the transaction is recognised as a hedge.
Upon conclusion of the transaction, the TUI Group documents the hedge relationship between the hedge and the underlying item, the risk management goal and the underlying strategy. In addition, a record is kept of the assessment, both at the beginning of the hedge relationship and on a continual basis, as to whether the derivatives used for the hedge are highly effective in compensating for the changes in the fair values or cash flows of the underlying transactions.
The effective portion of changes in the fair value of derivatives forming cash flow hedges is recognised in equity. Any ineffective portion of such changes in the fair value, by contrast, is recognised immediately in the income statement through profit and loss. Amounts taken to equity are reclassified to the income statement and included as income or expenses in the period in which the hedged item has an effect on results.
If a hedge expires, is sold or no longer meets the criteria of IAS 39 for hedge accounting, the cumulative gain or loss remains in equity and is only recognised in the income statement through profit and loss when the originally hedged future transaction occurs. If the future transaction is no longer expected to take place, the cumulative gains or losses recognised directly in equity are recognised immediately through profit and loss.
I N V E N TO R I E S
The measurement method applied to similar inventory items is the weighted average cost formula.
C A S H A N D C A S H E Q U I VA L E N T S
Cash and cash equivalents comprise cash, call deposits, other current highly liquid financial assets with an original term of a maximum of three months and current accounts. Overdrawn current accounts are shown as liabilities to banks under current financial liabilities.
E Q U I T Y
Ordinary shares are classified as equity. Costs directly allocable to the issue of new shares or conversion options are taken to equity on a net after-tax basis as a deduction from the issuance proceeds.
O W N S H A R E S
The group’s holdings in its own equity instruments are shown as deductions from shareholders’ equity at cost, including directly attributable transaction costs. No gain or loss is recognised in the income statement on the purchase or sale of shares. Any difference between the proceeds from sale and the original cost are taken to reserves.
P E N S I O N P R O V I S I O N S
The pension provision recognised for defined benefit plans corresponds to the net present value of the defined benefit obligations (DBOs) as at the balance sheet date less the fair value of the plan assets. If the value of the plan assets exceeds the value of the DBO, the excess amount is shown within other assets. Measurement of such an asset is limited to the net present value of the value in use in the form of reimbursements from the plan or reductions in future contribution payments. The DBOs are calculated annually by independent actuaries using the projected unit credit method.

174 NOT E S » pr I NC Ipl e S A ND Me T HoDS U NDe r ly I NG T He CoN S ol I DAT e D f I N A NC I A l S TAT e Me N T S
For defined contribution plans, the Group pays contributions to public or private pension insurance plans on the basis of a statutory or contractual obligation or on a voluntary basis. The Group does not have any further payment obligations on top of the payment of the contributions. The contributions are recognised under staff costs when they fall due.
OT H E R P R OV I S I O N S
Other provisions are formed when the Group has a current legal or constructive obligation as a result of a past event, where in addition it is probable that assets will be impacted by the settlement of the obligation and the level of the provision can be reliably determined.
Where a large number of similar obligations exist, the probability of a charge over assets is determined on the basis of this group of obligations. A provision is also recognised if the probability of a charge over assets is low in relation to an individual obligation contained in this group.
Provisions are measured at the present value of the expected expenses, taking account of a pre-tax interest rate, reflecting current market assessments of the time value of money and the risks specific to the liability. Risks already taken into account in estimating future cash flows do not affect the discount rate. Increases in provisions due to accretion of interest are recognised as interest expenses through profit or loss.
D E F E R R E D TA X E S A N D I N CO M E TA X E S
Expected tax savings from the use of tax losses carried forward assessed as recoverable in the future are recognised as deferred tax assets. Regardless of the unlimited ability to carry German tax losses forward which continues to exist, the annual utilisation is limited by the minimum taxation. Foreign tax losses carried forward frequently have to be used within a given country-specific time limit and are subject to restrictions concerning the use of these losses carried forward for profits on ordinary activities, which are taken into account accordingly in the measurement.
Income tax is directly charged or credited to equity if the tax relates to items directly credited or charged to equity in the same period or some other period.
Deferred tax assets are recognised to the extent that it is probable that future taxable profits will be available against which the temporary difference or an unused tax loss can be utilised.
Deferred taxes are measured at the tax rates and tax provisions applicable at the balance sheet date or adopted by law and expected to be applicable at the date of recognition of the deferred tax asset or the payment of the deferred tax liability.
Deferred and current income tax liabilities are offset against the corresponding tax assets if they exist in the same fiscal territory and have the same nature and maturity.
S H A R E- B A S E D PAY M E N T S
Share-based payment schemes in the Group comprise both cash-settled and equity-settled schemes.
For cash-settled transactions, the resulting liability for the Group is charged to expenses at its fair value as at the date of the performance of the service by the beneficiary. Until settlement of the liability, the fair value of the liability is re-measured at every closing date and all changes in the fair value are recognised through profit and loss.
For equity-settled transactions the fair value of the awards granted is recognised under staff costs with a corresponding direct increase in equity. The fair value is determined at the point when the awards are granted and spread over the vesting period during which the employees become entitled to the awards. The method for the calculation of the granted awards is described in Note 35.

175NOT E S » pr I NC Ipl e S A ND Me T HoDS U NDe r ly I NG T He CoN S ol I DAT e D f I N A NC I A l S TAT e Me N T S
S U M M A R Y O F S E L E C T E D ACCO U N T I N G A N D M E A S U R E M E N T M E T H O D S
The table below lists the key accounting and measurement methods used by the TUI Group.
Summary of selected measurement bases
Item in the statement of financial position Measurement base
Assets
Goodwill At cost (subsequent measurement: impairment test)
Other intangible assets with definite useful lives At amortised cost
Property, plant & equipment At amortised cost
Joint ventures and associates At the Group’s share of the net assets of the joint ventures and associates
Financial assets
Loans and receivables At amortised cost
Held for trading / Derivatives At fair value
Available for sale Fair value (with gains or losses recognised within other
comprehensive income) or at cost
Inventory Lower of cost and net realisable value
Trade and other receivables At amortised cost
Cash and cash equivalents At cost
Assets held for sale Lower of cost and fair value less cost of disposal
Liabilities and Provisions
Loans and borrowings At amortised cost
Provision for pensions Projected unit credit method
Other provisions Present value of the settlement amount
Financial liabilities
Non-derivative financial liabilities At amortised cost
Derivative financial liabilities At fair value
Payables, trade and other liabilities At amortised cost
Key judgements, assumptions and estimates
The presentation of the assets, liabilities, provisions and contingent liabilities shown in the consolidated financial statements is based on judgements, estimates and assumptions. Any uncertainties are appropriately taken into account in determining the values.
All estimates and assumptions are based on the conditions and assessments as at the balance sheet date. In evaluating the future development of business, reasonable assumptions are made regarding the expected future economic environment in the business areas and regions in which the Group operates.
Despite careful preparation of the estimates, actual results may differ from the estimate. In such cases, the assumptions and the carrying amounts of the assets and liabilities concerned, if necessary, are adjusted accordingly. As a matter of principle, changes in estimates are taken into account in the financial year in which the changes have occurred and in future periods.

176 NOT E S » pr I NC Ipl e S A ND Me T HoDS U NDe r ly I NG T He CoN S ol I DAT e D f I N A NC I A l S TAT e Me N T S
J U D G E M E N T S
The judgements made by management in applying accounting policies that may have a significant impact on TUI Group’s assets and liabilities mainly relate to the following topics:
• Assessment when the Group has de facto control over an investee and therefore consolidates this investment• Definition whether a Group company acts as an agent or as a principal in a transaction• Determination whether an arrangement contains a lease and classification of the lease
A S S U M P T I O N S A N D E S T I M AT E S
Assumptions and estimates that may have a material impact on the amounts reported as assets and liabilities in the TUI Group are mainly related to the following balance sheet-related facts and circumstances:
• Establishment of assumptions for impairment tests, in particular for goodwill,• Determination of the fair values for acquisitions of companies and determination of the useful lives of acquired
intangible assets,• Determination of useful lives and residual carrying amounts of property, plant and equipment,• Determination of actuarial assumptions to measure pension obligations, • Recognition and measurement of other provisions, • Recoverability of future tax savings from tax losses carried forward and tax-deductible temporary differences• Measurement of tax risks• Recoverable amounts of touristic prepayments.
G O O D W I L L
The goodwill reported as at 30 September 2018 has a carrying amount of € 2,958.6 m (previous year € 2,889.5 m). The determination of the recoverable amount of a Cash Generating Unit (CGU) for the annual impairment test requires estimates and judgement with regard to the methodology used and the assumptions, which may have a considerable effect on the recoverable amount and the level of a potential impairment. They relate, in particular, to the weighted average cost of capital (WACC) after income taxes, used as the discounting basis, the growth rate in perpetuity and the forecasts for future cash flows including the underlying budget assumptions based on corporate planning. Changes in these assumptions may have a substantial impact on the recoverable amount and the level of a potential impairment.
B U S I N E S S ACQ U I S I T I O N S A N D I N TA N G I B L E A S S E T S
In accounting for business combinations, the identifiable assets, liabilities and contingent liabilities acquired have to be measured at their fair values. In this context, cash flow-based methods are regularly used, which may lead to different results depending on the underlying assumptions. In particular, some judgement is required in estimating the economic useful lives of intangible assets and determining the fair values of contingent liabilities.
Detailed information on business acquisitions and useful lives of intangible assets is provided in the section ‘Acquisitions – divestments’ in the note on ‘Principles and methods of consolidation’ and in the section on ‘Goodwill and other intangible assets’ of the note ‘Accounting and measurement methods’.
P R O P E R T Y, P L A N T A N D E Q U I P M E N T
The measurement of wear-and-tear to property, plant and equipment items entails estimates. The carrying amount of property, plant and equipment as at 30 September 2018 totals € 4,899.2 m (previous year € 4,253.7 m). In order to review the amounts carried, an evaluation is carried out on a regular basis to assess whether there are any indications of a potential impairment. These indications relate to a number of areas and factors, e. g. the market-related or technical environment but also physical condition. If any such indication exists, management must estimate the recoverable amount on the basis of expected cash flows and appropriate interest rates. Further, essential estimates and judgements include the definition of economic useful lives and the residual values of items of property, plant and equipment which may be recovered.

177NOT E S » pr I NC Ipl e S A ND Me T HoDS U NDe r ly I NG T He CoN S ol I DAT e D f I N A NC I A l S TAT e Me N T S
More detailed information on the useful lives and residual values of property, plant and equipment items is provided in the section ‘Property, plant and equipment’ in the note ‘Accounting and measurement methods’.
P E N S I O N P R OV I S I O N S
As at 30 September 2018, the carrying amount of provisions for pensions and similar obligations totals € 994.8 m (previous year € 1,127.4 m). For those pension plans where the plan assets exceed the obligation, other assets amounting to € 125.1 m are shown as at 30 September 2018 (prior year € 57.0 m).
In order to determine the obligations under defined benefit pension schemes, actuarial calculations are used which rely on underlying assumptions concerning life expectancy and the discount rate.
At the balance sheet date, the fair value of the plan assets totals € 2,701.1 m (previous year € 2,631.3 m). As assets classified as plan assets are never available for short-term sale, the fair values of these plan assets may change significantly up to the realisation date. Detailed information on actuarial assumptions is provided under Note 28.
O T H E R P R OV I S I O N S
As at 30 September 2018, other provisions of € 1,116.4 m (previous year € 1,151.3 m) are reported. When recognising and measuring provisions, assumptions are required about probability of occurrence, maturity and level of risk.
Determining whether a current obligation exists is usually based on review by internal or external experts. The amount of provision is based on expected expenses, and is either calculated by assessing the specific case in the light of empirical values, outcomes from comparable circumstances, or else estimated by experts. Due to the uncertainties associated with assessment, actual expenses may deviate from estimates so that unexpected charges may result.
More detailed information on other provisions is provided in the notes to the statement of financial position in Note 29.
D E F E R R E D TA X A S S E T S
As at 30 September 2018, deferred tax assets totalling € 225.7 m (previous year € 323.7 m) were recognised. Prior to offsetting against deferred tax liabilities, deferred tax assets total € 519.4 m, included an amount of € 198.3 m (previous year € 198.1 m) for recognised losses carried forward. The assessment of the recoverability of deferred tax assets is based on the ability of the respective Group company to generate sufficient taxable income. TUI therefore assesses at every balance sheet date whether the recoverability of expected future tax savings is sufficiently probable in order to recognise deferred tax assets. The assessment is based on various factors including internal forecasts regarding the future earnings situation of the Group company. If the assessment of the recoverability of future deferred tax assets changes, impairment charges may be recognised, if necessary, on the deferred tax assets.
More detailed information on deferred tax assets is available in the Notes to the statement of financial position in Note 19.
I N CO M E TA X E S
The Group is liable to pay income taxes in various countries. Key estimates are required when determining income tax liabilities, including the probability, the timing and the size of any amounts that may become payable. For certain transactions and calculations the final tax charge cannot be determined during the ordinary course of business. After taking appropriate external advice, the Group makes provisions or discloses contingencies for uncertain tax positions based on the probable or possible level of additional taxes that might be incurred. The level of obligations for expected tax audits is based on an estimation of whether and to what extent additional income taxes will be due. Judgements are corrected, if necessary, in the period in which the final tax charge is determined.

178 NOT E S » pr I NC Ipl e S A ND Me T HoDS UNDe r ly I NG T He CoN S ol IDAT e D f I N A NC I A l S TAT e Me N T S , S e GMe N T r e p orT I NG
R E COV E R A B L E A M O U N T S O F TO U R I S T I C P R E PAY M E N T S
At 30 September 2018, the carrying amount of touristic prepayments totals € 877.5 m (previous year € 758.6 m). The assessment of the recoverable amounts of touristic prepayments made to hoteliers requires judgement about the volume of future trading with hoteliers and the credit worthiness of those hoteliers. To assess the recoverability of touristic prepayments, TUI considers the financial strength of those hoteliers, the quality of the hotels as well as the demand for each hotel and the relevant destination during the past and in coming seasons.
Segment reporting
Notes on the segments
The identification of operating segments is based on the internal organisational and reporting structure primarily built around the different products and services as well as a geographical structure within the TUI Group. Allocation of individual organisational entities to operating segments is exclusively based on economic criteria, irrespective of the participation structure under company law. The segments are independently managed by those in charge, who regularly receive separate financial information for each segment. They regularly report to the Group Executive Committee, which consists of six Executive Board members and six other executives. The legally binding decision regarding the use of resources is taken by the Executive Board. The TUI Group Executive Board has therefore been identified as the Chief Operating Decision Maker (CODM) in accordance with IFRS 8.
The Hotels & Resorts segment comprises all Group-owned hotels and hotel shareholdings of TUI Group.
The Cruises segment consists of Hapag-Lloyd Cruises and the joint venture TUI Cruises as well as the British cruise business Marella Cruises.
Since the first quarter of 2018, the companies providing services in the destinations have been separately reported as the Destination Experiences segment. This segment also contains the newly acquired business unit Destination Management.
The Northern Region segment comprises the tour operators and airlines in the UK, Ireland and the Nordic countries and the stake in the tour operation business of the Canadian company Sunwing as well as the joint venture TUI Russia. This segment also includes the tour operators Crystal Ski and TUI Lakes & Mountains, which play a major role in securing the load factor for our aircraft fleet in the UK, especially in winter.
The Central Region segment comprises the tour operators and airlines in Germany and tour operators in Austria, Poland and Switzerland.
The Western Region segment comprises the tour operators and airlines in Belgium and the Netherlands and tour operators in France.
Apart from the above segments, the recognised items also include All other segments, which comprises the business operations for new markets and in particular the central corporate functions and interim holdings of TUI Group and the Group’s real estate companies. Additionally, the companies previously included in Other Tourism, such as the French scheduled carrier Corsair and central tourism functions such as information technology, are included in All Other Segments since Q1 2018.

179NOT E S » S e GMe N T r e p orT I NG
Notes to the segment data
The selection of segment data presented is based on the regular internal reporting of segmented financial indicators to the Executive Board. Segment reporting discloses in particular the performance indicator underlying EBITA, since this indicator is used for value-oriented corporate management and thus represents the consolidated performance indicator within the meaning of IFRS 8.
The TUI Group defines underlying EBITA as EBITA, adjusted for gains on disposal of financial investments, expenses in connection with restructuring measures according to IAS 37, all effects of purchase price allocations, ancillary acquisition cost and conditional purchase price payments and other expenses for and income from one-off items. The one-off items carried as adjustments are income and expense items impacting or distorting the assessment of the operating profitability of the segments and the Group due to their level and frequency. These one-off items include major restructuring and integration expenses not meeting the criteria of IAS 37, major expenses for litigation, profit and loss from the sale of aircraft and other material business transactions of a one-off nature.
EBITA is defined as earnings before interest, income taxes and goodwill impairment. EBITA includes amortisation of other intangible assets. EBITA does not include measurement effects from interest hedges and in the prior year the measurement effects from container shipping, as the stake in Hapag-Lloyd AG, held until its sale on 10 July 2017, was a financial investment and not an operative stake from TUI AG’s perspective.
Internal and external turnover, depreciation and amortisation, impairment on other intangible assets (excluding goodwill), property, plant and equipment and investments as well as the share of result of joint ventures and associates are likewise shown for each segment, as these amounts are included when measuring EBITA. As a rule, inter-segment business transactions are based on the arm’s length principle, as applied in transactions with third parties. No single external customer accounts for 10 % or more of turnover.
Assets and liabilities per segment are not included in the reporting to the Executive Board and are therefore not shown in segment reporting.
Depreciation, amortisation, impairment and write-backs relate to non-current and current assets that are split geographically and do not include goodwill impairment.
The non-current assets, which are split geographically, contain other intangible assets, property, plant and equipment and other non-current assets that do not meet the definition of financial instruments.
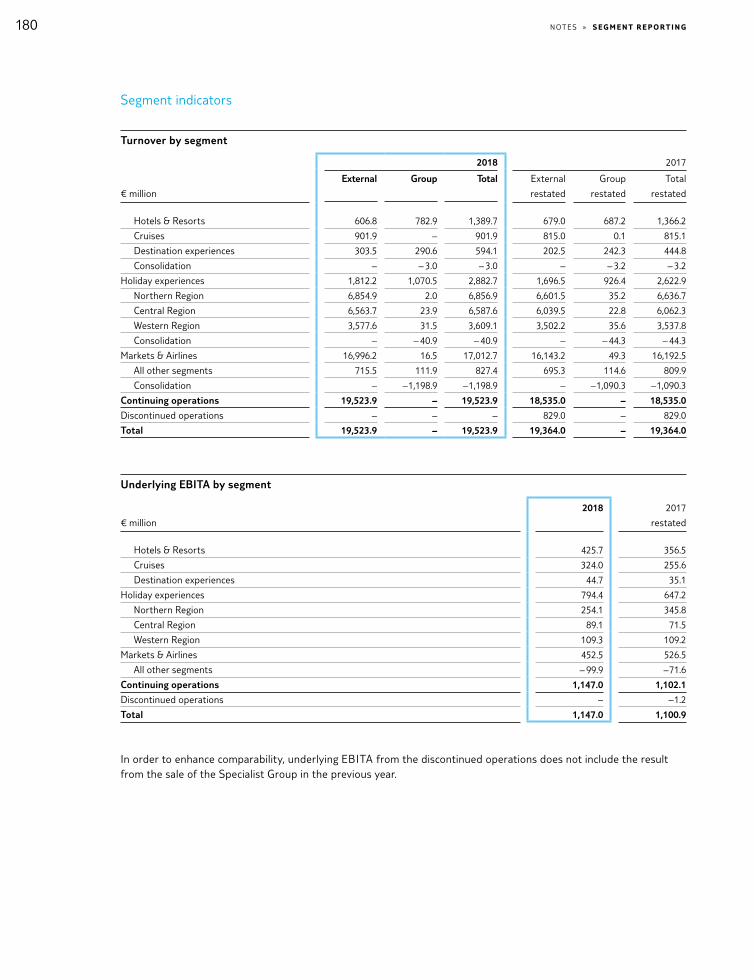
180 NOT E S » S e GMe N T r e p orT I NG
Segment indicators
Turnover by segment
2018 2017
€ million
External Group Total External
restated
Group
restated
Total
restated
Hotels & Resorts 606.8 782.9 1,389.7 679.0 687.2 1,366.2
Cruises 901.9 – 901.9 815.0 0.1 815.1
Destination experiences 303.5 290.6 594.1 202.5 242.3 444.8
Consolidation – – 3.0 – 3.0 – – 3.2 – 3.2
Holiday experiences 1,812.2 1,070.5 2,882.7 1,696.5 926.4 2,622.9
Northern Region 6,854.9 2.0 6,856.9 6,601.5 35.2 6,636.7
Central Region 6,563.7 23.9 6,587.6 6,039.5 22.8 6,062.3
Western Region 3,577.6 31.5 3,609.1 3,502.2 35.6 3,537.8
Consolidation – – 40.9 – 40.9 – – 44.3 – 44.3
Markets & Airlines 16,996.2 16.5 17,012.7 16,143.2 49.3 16,192.5
All other segments 715.5 111.9 827.4 695.3 114.6 809.9
Consolidation – – 1,198.9 – 1,198.9 – – 1,090.3 – 1,090.3
Continuing operations 19,523.9 – 19,523.9 18,535.0 – 18,535.0
Discontinued operations – – – 829.0 – 829.0
Total 19,523.9 – 19,523.9 19,364.0 – 19,364.0
Underlying EBITA by segment
€ million
2018 2017
restated
Hotels & Resorts 425.7 356.5
Cruises 324.0 255.6
Destination experiences 44.7 35.1
Holiday experiences 794.4 647.2
Northern Region 254.1 345.8
Central Region 89.1 71.5
Western Region 109.3 109.2
Markets & Airlines 452.5 526.5
All other segments – 99.9 – 71.6
Continuing operations 1,147.0 1,102.1
Discontinued operations – – 1.2
Total 1,147.0 1,100.9
In order to enhance comparability, underlying EBITA from the discontinued operations does not include the result from the sale of the Specialist Group in the previous year.

181NOT E S » S e GMe N T r e p orT I NG
Reconciliation to earnings before income taxes of the continuing operations of the TUI Group
€ million 2018 2017
Underlying EBITA of continuing operations 1,147.0 1,102.1
Result on disposal* 2.1 2.2
Restructuring expense* – 34.9 – 23.1
Expense from purchase price allocation* – 31.8 – 29.2
Expense from other one-off items* – 22.2 – 25.5
EBITA of continuing operations 1,060.2 1,026.5
Profit on sale of financial investment in Container Shipping – 172.4
Net interest expense – 82.3 – 113.5
Expense from measurement of interest hedges – 6.4 – 5.7
Earnings before income taxes of continuing operations 971.5 1,079.7
* For a description of the adjustments please refer to the management report page 66
Other segmental information
Amortisation (+), deprecia-
tion (+), impairment (+) and
write-backs (–) of other
intangible assets, property,
plant and equipment, invest-
ments and current assets
Thereof impairment of
intangible assets
and property, plant
and equipment
Thereof amortisation /
depreciation of intangible
assets and property,
plant and equipment
Share of result of
joint ventures
and associates
€ million
2018 2017
restated
2018 2017
restated
2018 2017
restated
2018 2017
restated
Hotels & Resorts 98.8 130.8 5.4 36.4 93.9 98.5 92.1 91.2
Cruises 74.3 57.3 – – 74.3 57.3 181.3 135.9
Destination Experiences 9.0 7.8 – – 9.1 7.9 7.8 7.8
Holiday Experiences 182.1 195.9 5.4 36.4 177.3 163.7 281.2 234.9
Northern Region 60.5 69.0 – 11.2 60.5 64.5 14.2 13.2
Central Region 22.7 20.3 0.1 0.3 22.6 21.7 2.0 3.7
Western Region 22.6 22.6 – – 22.6 22.2 0.2 0.4
Markets & Airlines 105.8 111.9 0.1 11.5 105.7 108.4 16.4 17.3
All other segments 150.4 156.6 6.7 25.2 144.1 130.9 0.1 0.1
Continuing operations 438.3 464.4 12.2 73.1 427.1 403.0 297.7 252.3
Discontinued operations – – – – – – – –
Total 438.3 464.4 12.2 73.1 427.1 403.0 297.7 252.3

182 NOT E S » S e G Me N T r e p or T I NG , NoT e S To T H e CoN S ol I DAT e D I NCoMe S TAT e Me N T
Key figures by region
External turnover by
customer location
Thereof external
turnover from
discontinued operations
Non-current assets
€ million 2018 2017 2018 2017 2018 2017
Germany 5,493.3 5,513.8 – 9.0 710.3 720.9
Great Britain 6,085.7 5,983.6 – 316.0 2,729.4 2,340.3
Spain 217.1 147.2 – 0.9 504.1 479.7
Other Europe 7,063.8 6,861.0 – 62.2 538.8 522.4
North and South America 386.5 591.1 – 372.3 507.9 449.9
Rest of the world 277.5 267.3 – 68.6 659.5 490.2
Total 19,523.9 19,364.0 – 829.0 5,650.0 5,003.4
Notes to the consolidated income statement
TUI Group’s operating profit continued its positive development in FY 2018. The growth was primarily driven by the continued sound business performance of Holiday Experiences.
(1) Turnover
Group turnover is mainly generated from tourism services. A breakdown of turnover by segment and region is shown under segment reporting.
(2) Cost of sales and administrative expenses
Cost of sales relates to the expenses incurred in the provision of tourism services. In addition to the expenses for personnel, depreciation, amortisation, rental and leasing, it includes all costs incurred by the Group in connection with the procurement and delivery of airline services, hotel accommodation, cruises and distribution costs.
Administrative expenses comprise all expenses incurred in connection with activities by the administrative functions and break down as follows:
Administrative expenses
€ million 2018 2017
Staff cost 737.4 710.9
Rental and leasing expenses 60.1 62.5
Depreciation, amortisation and impairment 75.8 92.6
Others 416.6 389.8
Total 1,289.9 1,255.8

183NOT E S » NoT e S To T H e CoN S ol I DAT e D I NCoMe S TAT e Me N T
The cost of sales and administrative expenses include the following expenses for personnel, depreciation / amortisation, rent and leasing:
Staff costs
€ million 2018 2017
Wages and salaries 1,982.3 1,896.4
Social security contributions 299.7 293.0
Pension costs 154.3 167.6
Total 2,436.3 2,357.0
Pension costs include service cost for defined benefit obligations and contributions to defined contribution pension schemes.
The year-on-year increase in staff costs in FY 2018 mainly results from a higher number of employees and salary increases.
The average annual headcount (excluding trainees) evolved as follows:
Average annual headcount in the financial year (excl. trainees)
2018 2017
Hotels & Resorts 23,001 21,987
Cruises 310 307
Destination Experiences 5,406 3,927
Holiday Experiences 28,717 26,221
Northern Region 12,900 14,166
Central Region 9,768 9,652
Western Region 6,304 6,119
Markets & Airlines 28,972 29,937
All other segments 3,495 3,533
TUI Group 61,184 59,691
Discontinued operations – 1,741
Total 61,184 61,432
Depreciation / amortisation / impairment
€ million 2018 2017
Depreciation and amortisation of other intangible assets and property, plant and equipment 427.1 403.0
Impairment of other intangible assets and property, plant and equipment 12.2 73.1
Total 439.3 476.1
The increase in depreciation and amortisation is driven by the addition of a cruise ship in the prior year and the completed financial year and the addition of aircraft.
In the prior year, impairment charges on property, plant and equipment related to hotel resorts, in particular due to damages caused by hurricanes in the Caribbean, and impairment of software and other property, plant and equipment.

184 NOT E S » NoT e S To T H e CoN S ol I DAT e D I NCoMe S TAT e Me N T
Rental and leasing
€ million 2018 2017
Rental and leasing expenses 786.3 838.5
Sub-lease income 36.7 34.1
thereof contingent rent 10.7 7.6
Where rental and leasing expenses for operating leases are directly related to revenue-generating activities, these expenses are shown within cost of sales. However, where rental and leasing expenses are incurred in respect of administrative buildings, they are shown under administrative expenses.
Leasing expenses for aircraft declined year-on-year due to foreign currency effects. Leasing expenses for cruise ships also declined year-on-year due to the expiry of a lease agreement at Marella Cruises.
In order to improve the load factor of the aircraft fleet, some planes are also used by other Group companies and leased out to non-Group third parties. These operating leases have terms of 6 months to 12 years and usually expire automatically after the end of the contract term. The income from sub-leases carried in the income statement for the completed financial year is presented in the table above.
(3) Other income
In FY 2018, other income mainly resulted from the disposal of three hotel companies and a hotel. Income was also generated from the sale of aircraft assets.
Other income recognised in the prior year mainly resulted from the sale of two subsidiaries and an investment. Income had also been generated from the sale of commercial real estate owned by TUI Immobilien Services GmbH, Salzgitter, the sale of aircraft spare parts not required, and the sale of vehicles owned by incoming agencies.
(4) Financial income
Financial income
€ million 2018 2017
Bank interest income 24.9 11.0
Other interest and similar income 42.6 8.5
Income from the measurement of hedges 6.3 2.2
Interest income 73.8 21.7
Income from investments 3.7 175.9
Income from the measurement of other financial instruments 0.7 30.6
Foreign exchange gains on financial instruments 5.6 1.1
Total 83.8 229.3
The decrease in financial income by € 145.5 m in FY 2018 results mainly from the gain on disposal of the sale of the stake in Hapag-Lloyd AG worth € 172.4 m included in the prior year. This decline was partially offset by the effects of a change in the cash pooling scheme, resulting in an increase in interest income from bank balances of € 13.9 m.
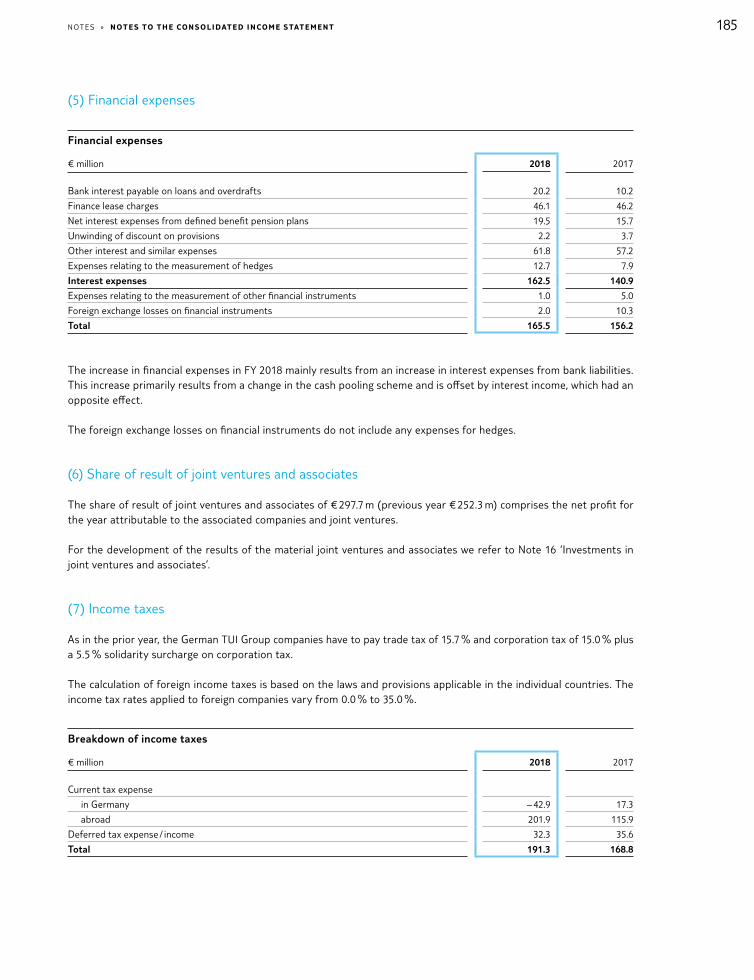
185NOT E S » NoT e S To T H e CoN S ol I DAT e D I NCoMe S TAT e Me N T
(5) Financial expenses
Financial expenses
€ million 2018 2017
Bank interest payable on loans and overdrafts 20.2 10.2
Finance lease charges 46.1 46.2
Net interest expenses from defined benefit pension plans 19.5 15.7
Unwinding of discount on provisions 2.2 3.7
Other interest and similar expenses 61.8 57.2
Expenses relating to the measurement of hedges 12.7 7.9
Interest expenses 162.5 140.9
Expenses relating to the measurement of other financial instruments 1.0 5.0
Foreign exchange losses on financial instruments 2.0 10.3
Total 165.5 156.2
The increase in financial expenses in FY 2018 mainly results from an increase in interest expenses from bank liabilities. This increase primarily results from a change in the cash pooling scheme and is offset by interest income, which had an opposite effect.
The foreign exchange losses on financial instruments do not include any expenses for hedges.
(6) Share of result of joint ventures and associates
The share of result of joint ventures and associates of € 297.7 m (previous year € 252.3 m) comprises the net profit for the year attributable to the associated companies and joint ventures.
For the development of the results of the material joint ventures and associates we refer to Note 16 ‘Investments in joint ventures and associates’.
(7) Income taxes
As in the prior year, the German TUI Group companies have to pay trade tax of 15.7 % and corporation tax of 15.0 % plus a 5.5 % solidarity surcharge on corporation tax.
The calculation of foreign income taxes is based on the laws and provisions applicable in the individual countries. The income tax rates applied to foreign companies vary from 0.0 % to 35.0 %.
Breakdown of income taxes
€ million 2018 2017
Current tax expense
in Germany – 42.9 17.3
abroad 201.9 115.9
Deferred tax expense / income 32.3 35.6
Total 191.3 168.8

186 NOT E S » NoT e S To T H e CoN S ol I DAT e D I NCoMe S TAT e Me N T
In FY 2018, corporate income taxes in Germany include the reassessment of tax risks which results in tax income of € 52.8 m due to the release of provisions attributable to prior periods. Corporate income taxes outside of Germany include a tax expense of € 70.3 m relating to tax liabilities arising in Spain. Corporate tax expense attributable to prior periods amount to € 28.7 m (prior year income of € 4.6 m) in FY 2018.
The deferred tax expense largely arose outside of Germany.
In FY 2018, total income taxes of € 191.3 m (previous year € 168.8 m) are derived as follows from an ‘expected’ income tax expense that would have arisen if the statutory income tax rate of parent company TUI AG (aggregate income tax rate) had been applied to earnings before tax.
Reconciliation of expected to actual income taxes
€ million 2018 2017
Earnings before income taxes 971.5 1,079.7
Expected income tax (current year 31.5 %, previous year 31.5 %) 306.0 340.1
Effect from the difference of the actual tax rates to the expected tax rates – 67.3 – 61.9
Changes in tax rates and tax law 1.6 – 1.5
Income not taxable – 164.1 – 207.5
Expenses not deductible 104.6 102.7
Effects from loss carryforwards – 14.0 – 16.4
Temporary differences for which no deferred taxes were recognised – 5.6 – 4.4
Deferred and current income tax relating to other periods (net) 19.7 20.2
Other differences 10.4 – 2.5
Income taxes 191.3 168.8
In the prior year the non-taxable income was affected by the tax-free disposal of the shares of Hapag-Lloyd AG.
(8) Result from discontinued operation
The result from discontinued operations consists of changes, which are directly related to the disposal of Hotelbeds Group and Specialist Group in prior periods.
On disposal of Hotelbeds Group in 2016 TUI granted to Hotelbeds Group a revenue guarantee and accounted for a respective liability. On acquisition of the business Destination Management this financial year this guarantee was terminated. Prior to the acquisition the revenue generated by the Hotelbeds Group in the liability for the revenue guarantee, was revalued based on the periods since disposal. Accordingly, the liability was reduced by € 41.4 m.
The other results relate to the Specialist Group, sold in 2017.
In the prior year the result from discontinued operations showed the after-tax result of the Specialist Group including the profit on the sale.
(9) Group profit attributable to shareholders of TUI AG
In FY 2018, the share in Group profit attributable to TUI AG shareholders rose from € 644.8 m in the prior year to € 732.5 m. The increase is primarily due to the continuing sound operating performance in Holiday Experiences.
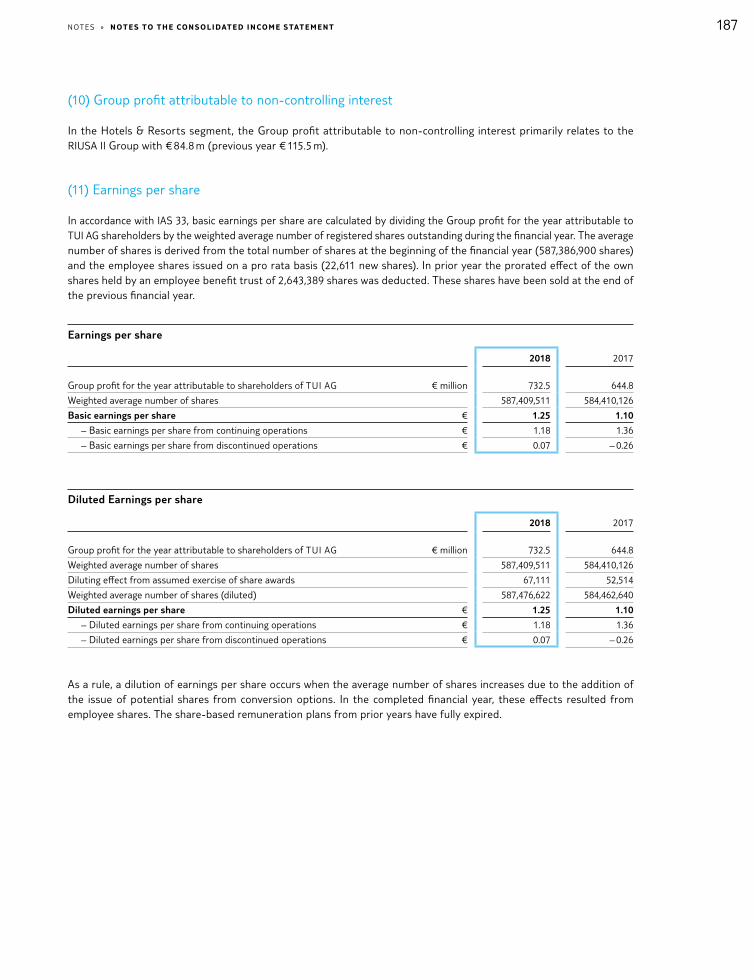
187NOT E S » NoT e S To T H e CoN S ol I DAT e D I NCoMe S TAT e Me N T
(10) Group profit attributable to non-controlling interest
In the Hotels & Resorts segment, the Group profit attributable to non-controlling interest primarily relates to the RIUSA II Group with € 84.8 m (previous year € 115.5 m).
(11) Earnings per share
In accordance with IAS 33, basic earnings per share are calculated by dividing the Group profit for the year attributable to TUI AG shareholders by the weighted average number of registered shares outstanding during the financial year. The average number of shares is derived from the total number of shares at the beginning of the financial year (587,386,900 shares) and the employee shares issued on a pro rata basis (22,611 new shares). In prior year the prorated effect of the own shares held by an employee benefit trust of 2,643,389 shares was deducted. These shares have been sold at the end of the previous financial year.
Earnings per share
2018 2017
Group profit for the year attributable to shareholders of TUI AG € million 732.5 644.8
Weighted average number of shares 587,409,511 584,410,126
Basic earnings per share € 1.25 1.10
– Basic earnings per share from continuing operations € 1.18 1.36
– Basic earnings per share from discontinued operations € 0.07 – 0.26
Diluted Earnings per share
2018 2017
Group profit for the year attributable to shareholders of TUI AG € million 732.5 644.8
Weighted average number of shares 587,409,511 584,410,126
Diluting effect from assumed exercise of share awards 67,111 52,514
Weighted average number of shares (diluted) 587,476,622 584,462,640
Diluted earnings per share € 1.25 1.10
– Diluted earnings per share from continuing operations € 1.18 1.36
– Diluted earnings per share from discontinued operations € 0.07 – 0.26
As a rule, a dilution of earnings per share occurs when the average number of shares increases due to the addition of the issue of potential shares from conversion options. In the completed financial year, these effects resulted from employee shares. The share-based remuneration plans from prior years have fully expired.
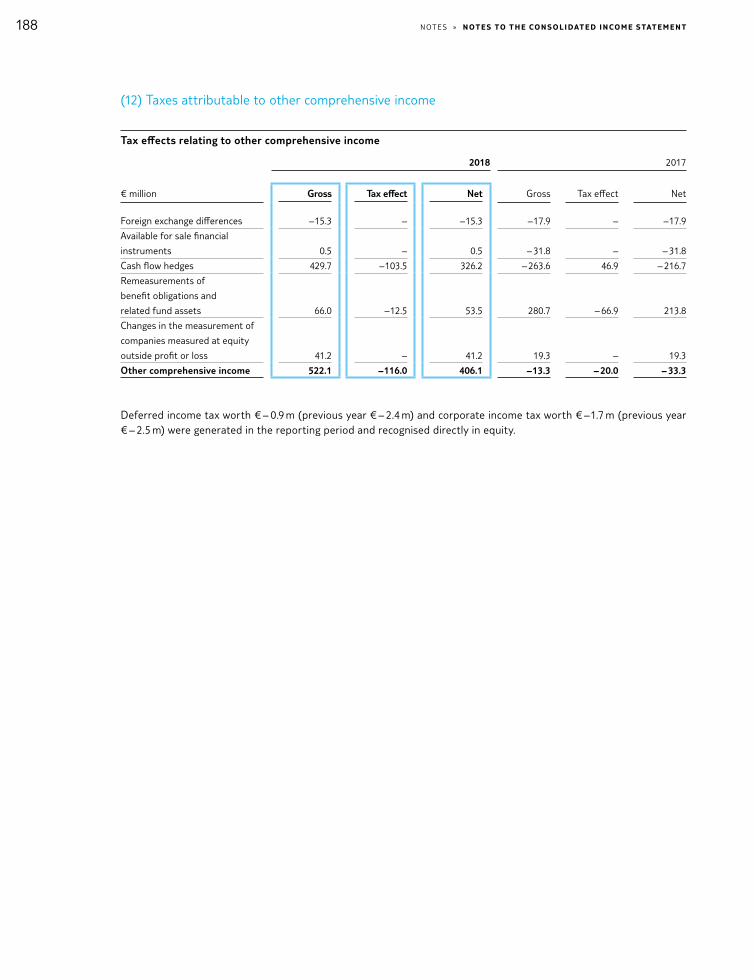
188 NOT E S » NoT e S To T H e CoN S ol I DAT e D I NCoMe S TAT e Me N T
(12) Taxes attributable to other comprehensive income
Tax effects relating to other comprehensive income
2018 2017
€ million Gross Tax effect Net Gross Tax effect Net
Foreign exchange differences – 15.3 – – 15.3 – 17.9 – – 17.9
Available for sale financial
instruments 0.5 – 0.5 – 31.8 – – 31.8
Cash flow hedges 429.7 – 103.5 326.2 – 263.6 46.9 – 216.7
Remeasurements of
benefit obligations and
related fund assets 66.0 – 12.5 53.5 280.7 – 66.9 213.8
Changes in the measurement of
companies measured at equity
outside profit or loss 41.2 – 41.2 19.3 – 19.3
Other comprehensive income 522.1 – 116.0 406.1 – 13.3 – 20.0 – 33.3
Deferred income tax worth € – 0.9 m (previous year € – 2.4 m) and corporate income tax worth € – 1.7 m (previous year € – 2.5 m) were generated in the reporting period and recognised directly in equity.

189NOT E S » NoT e S oN T H e CoN S ol I DAT e D S TAT e Me N T of f I N A NC I A l p oS I T IoN
Notes on the consolidated statement of financial position
(13) Goodwill
Goodwill
€ million 2018 2017
Historical cost
Balance as at 1 Oct 3,319.1 3,286.7
Exchange differences – 27.0 – 42.5
Additions 103.8 74.9
Disposals 8.6 –
Balance as at 30 Sep 3,387.3 3,319.1
Impairment
Balance as at 1 Oct – 429.6 – 433.2
Exchange differences 0.9 3.6
Balance as at 30 Sep – 428.7 – 429.6
Carrying amounts as at 30 Sep 2,958.6 2,889.5
The increase in the carrying amount is mainly attributable to the acquisition of Destination Management worth € 82.3 m in Q4 2018. Moreover, the carrying amount grew due to the acquisition of stakes in hotel companies (GBH Turizm Ticaret A. S. worth € 9.1 m and Darecko S. A. worth € 6.5 m) and the acquisition of Cruisetour AG and Croisimonde AG worth € 5.6 m. In the prior year, the additions mainly arose from the acquisition of Transat France S. A.
The disposal of € 8.6 m results from the sale of three RIUSA II Group hotel companies. More detailed information on the acquisitions and divestments is presented in the section on Principles and methods of consolidation. A reduction was caused by the translation of goodwill not carried in TUI Group’s reporting currency into euros.
In accordance with the rules of IAS 21, goodwill allocated to the individual segments and sectors was recognised in the functional currency of the subsidiaries and subsequently translated when preparing the consolidated financial statements. Similar to the treatment of other differences from the translation of annual financial statements of foreign subsidiaries, differences due to exchange rate fluctuations between the exchange rate at the date of acquisition of the subsidiary and the exchange rate at the balance sheet date are taken directly to equity outside profit and loss and disclosed as a separate item. In FY 2018, a decrease in the carrying amount of goodwill of € 26.1 m (previous year decrease of € 38.9 m) resulted from foreign exchange differences.

190 NOT E S » NoT e S oN T He CoN S ol I DAT e D S TAT e Me N T of f I N A NC I A l p oS I T IoN
The following table presents a breakdown of goodwill by cash generating unit (CGU) at carrying amounts:
Goodwill per cash generating unit
€ million 30 Sep 2018 30 Sep 2017
Northern Region 1,196.2 1,217.0
Central Region 516.4 510.2
Western Region 411.2 411.2
Destination Services 168.3 86.0
Riu 343.1 351.7
Marella Cruises 287.4 289.2
Other 36.0 24.2
Total 2,958.6 2,889.5
In the completed financial year, goodwill was tested for impairment at the level of CGUs as at 30 June 2018.
For all CGUs, the recoverable amount was determined on the basis of fair value less costs of disposal. The fair value was determined by means of discounting the expected cash inflows. This was based on the Q4 forecast for the financial year and on the medium-term plan for the entity under review, prepared as at 30 September 2018, following deduction of income tax payments. Budgeted turnover and EBITA margins are based on empirical values from prior financial years and expectations with regard to the future development of the market.
The discount rates are calculated as the weighted average cost of capital, taking account of country-specific risks of the CGU and based on external capital market information. The cost of equity included in the determination reflects the return expected by investors. The cost of borrowing is derived from the long-term financing terms of comparable companies in the peer group.
The table below provides an overview of the parameters underlying the determination of the fair values per CGU. It shows the timeframe for the cash flow forecast, the growth rates used to extrapolate the cash flow forecast, the discount rates and the relevant valuation hierarchy according to IFRS 13. The table lists the CGUs to which goodwill has been allocated. The below stated EBITA margin p. a. is adjusted for reasonable discounts for centrally incurred cost.

191NOT E S » NoT e S oN T H e CoN S ol I DAT e D S TAT e Me N T of f I N A NC I A l p oS I T IoN
Assumptions for calculation of fair value in FY 2018
Planning
period in
years
Growth rate
revenues
in % p. a.
EBITA-
Margin
in % p. a.
Growth rate
after planning
period in %
WACC
in %
Level
Northern Region 3.25 7.1 3.9 1.0 5.42 3
Central Region 3.25 6.6 1.4 1.0 5.42 3
Western Region 3.25 7.0 2.6 1.0 5.42 3
Destination Services 3.25 3.9 7.1 1.0 5.42 3
Riu 3.25 1.7 34.2 1.0 6.38 3
Marella Cruises 3.25 9.7 15.1 1.0 6.30 3
Other 3.25 18.4 to 77.5 1.5 to 18.1 1.0 6.38 to 7.52 3
Assumptions for calculation of fair value in FY 2017
Planning
period in
years
Growth rate
revenues
in % p. a.
( restated)
EBITA-
Margin
in % p. a.
( restated)
Growth rate
after planning
period in %
WACC
in %
Level
Northern Region 3.25 5.6 3.9 1.0 5.25 3
Central Region 3.25 4.5 1.1 1.0 5.25 3
Western Region 3.25 6.4 3.0 1.0 5.25 3
Destination Services 3.25 5.5 8.8 1.0 5.25 3
Riu 3.25 4.9 33.1 1.0 6.25 3
Marella Cruises 3.25 11.7 17.5 1.0 5.25 3
Other 3.25 17.3 to 79.1 3.7 to 19.7 1.0 6.25 to 7.00 3
Goodwill was tested for impairment as at 30 June 2018. The test did not result in a requirement to recognise any further impairment. Neither an increase in WACC by 50 basis points nor a reduction by 50 basis points in the growth rate after the detailed planning period would have led to an impairment of goodwill. The same applies to a reduction of the discounted free cash flow in perpetuity of 10 %.

192 NOT E S » NoT e S oN T He CoN S ol I DAT e D S TAT e Me N T of f I N A NC I A l p oS I T IoN
(14) Other intangible assets
The development of the line items of other intangible assets in FY 2018 is shown in the following table.
Other intangible assets
Brands,
licenses and
other rights*
Computer software*
Transport
and leasing
contracts
Customer
base
Intangible assets in
the course of
construction and
Payments on
account*
Total
€ million
internally
generated
acquired
Historical cost
Balance as at 1 Oct 2016 686.4 300.2 – 93.0 49.2 2.5 1,131.3
Exchange differences – 2.0 – 6.2 – 6.4 – 1.5 – 0.5 3.0 – 13.6
Additions due to changes in the group
of consolidated companies 8.1 0.2 0.2 – 11.3 0.9 20.7
Additions 1.3 11.0 16.6 – – 100.6 129.5
Disposals – 2.2 – 7.1 – 5.1 – – 1.2 – 9.2 – 24.8
Transfer – 0.1 48.1 20.8 – – – 70.0 – 1.2
Transfer – 309.3 0 247.0 0 0 62.3 0
Balance as at 30 Sep 2017 382.2 346.2 273.1 91.5 58.8 90.1 1,241.9
Exchange differences 0.4 – 4.5 1.2 – 0.4 1.2 – 0.8 – 2.9
Additions due to changes in the group
of consolidated companies 0.1 – 0.7 – 0.2 0.2 1.2
Additions 2.8 13.8 13.0 – – 101.5 131.1
Disposals – 3.8 – 6.6 – 8.4 – – – – 18.8
Transfer – 1.5 66.5 13.8 – – – 78.8 –
Balance as at 30 Sep 2018 380.2 415.4 293.4 91.1 60.2 112.2 1,352.5
Amortisation and impairment
Balance as at 1 Oct 2016 – 390.7 – 121.3 – – 43.3 – 30.2 – – 585.5
Exchange differences – 0.5 1.2 1.8 1.0 0.4 – 0.2 3.7
Amortisation for the current year – 16.0 – 37.8 – 35.0 – 4.5 – 4.8 – – 98.1
Impairment for the current year – – 27.3 – 0.3 – – – 9.0 – 36.6
Disposals 1.2 7.0 4.0 – 1.3 9.2 22.7
Transfer 159.1 – – 159.1 – – – –
Balance as at 30 Sep 2017 – 246.9 – 178.2 – 188.6 – 46.8 – 33.3 – – 693.8
Exchange differences 1.4 2.4 – 1.4 0.3 – – 2.7
Amortisation for the current year – 14.3 – 46.2 – 31.0 – 4.5 – 4.9 – – 100.9
Impairment for the current year – 3.9 – 1.6 – – – 1.3 – – 6.8
Disposals 2.3 6.0 7.9 – – – 16.2
Transfer – – 0.7 0.7 – – – –
Balance as at 30 Sep 2018 – 261.4 – 218.3 – 212.4 – 51.0 – 39.5 – – 782.6
Carrying amounts as at 30 Sep 2017 135.3 168.0 84.5 44.7 25.5 90.1 548.1
Carrying amounts as at 30 Sep 2018 118.8 197.1 81.0 40.1 20.7 112.2 569.9
* The acquired computer software, which was previously reported within brands, licences and other rights, was in the prior year for the first time presented together with the internally generated computer software. In addition the intangible assets under construction have no longer been reported as part of brands, licences and other rights but have been presented for the first time together with the payments on accounts. The opening balances of the prior year have been reclassified accordingly.
193NOT E S » NoT e S oN T H e CoN S ol I DAT e D S TAT e Me N T of f I N A NC I A l p oS I T IoN
Internally generated computer software consists of computer programs for tourism applications exclusively used internally by the Group.
Transport contracts relate to landing rights at airports in the UK purchased and measured during the acquisition of First Choice Holidays Plc in 2007.
The lease contracts relate to intangible assets from the measurement of aircraft leases in connection with the acquisition of First Choice Holidays Plc in 2007. The assets are amortised in line with the length of the lease.
Payments on account made totalled € 4.7 m as at 30 September 2018 (previous year € 1.9 m).
Additions to consolidation mainly relate to the acquisition of Destination Management. For details, please refer to the section on Acquisitions.
The prior year’s impairment charges related to financial software and an Internet platform in the Northern Region segment.
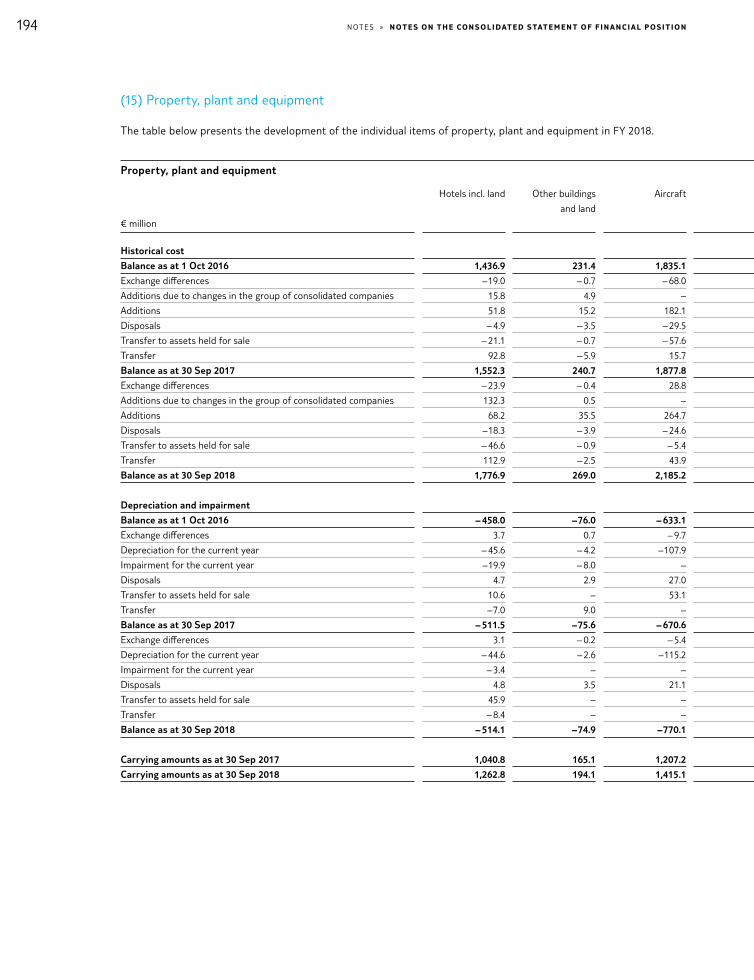
194 NOT E S » NoT e S oN T He CoN S ol I DAT e D S TAT e Me N T of f I N A NC I A l p oS I T IoN
(15) Property, plant and equipment
The table below presents the development of the individual items of property, plant and equipment in FY 2018.
Property, plant and equipment
€ million
Hotels incl. land
Other buildings
and land
Aircraft
Cruise ships
Other plant,
operating and
office equipment
Assets under
construction
Payments
on account
Total
Historical cost
Balance as at 1 Oct 2016 1,436.9 231.4 1,835.1 894.5 1,138.8 158.1 210.1 5,904.9
Exchange differences – 19.0 – 0.7 – 68.0 – 16.6 – 24.1 25.7 – 21.0 – 123.7
Additions due to changes in the group of consolidated companies 15.8 4.9 – – 3.4 – – 24.1
Additions 51.8 15.2 182.1 8.4 101.3 376.8 294.8 1,030.4
Disposals – 4.9 – 3.5 – 29.5 – 4.7 – 56.5 – – 45.5 – 144.6
Transfer to assets held for sale – 21.1 – 0.7 – 57.6 0.2 – 0.5 – – – 79.7
Transfer 92.8 – 5.9 15.7 247.6 32.9 – 366.7 – 13.2 3.2
Balance as at 30 Sep 2017 1,552.3 240.7 1,877.8 1,129.4 1,195.3 193.9 425.2 6,614.6
Exchange differences – 23.9 – 0.4 28.8 – 6.7 – 15.9 – 4.5 9.1 – 13.5
Additions due to changes in the group of consolidated companies 132.3 0.5 – – 11.9 – – 144.7
Additions 68.2 35.5 264.7 8.9 98.6 318.1 220.8 1,014.8
Disposals – 18.3 – 3.9 – 24.6 – 4.9 – 57.0 – 0.5 – 145.4 – 254.6
Transfer to assets held for sale – 46.6 – 0.9 – 5.4 – – 4.9 – 1.9 – – 59.7
Transfer 112.9 – 2.5 43.9 204.8 31.8 – 360.5 – 30.4 –
Balance as at 30 Sep 2018 1,776.9 269.0 2,185.2 1,331.5 1,259.8 144.6 479.3 7,446.3
Depreciation and impairment
Balance as at 1 Oct 2016 – 458.0 – 76.0 – 633.1 – 220.2 – 803.3 0.2 – – 2,190.4
Exchange differences 3.7 0.7 – 9.7 2.7 16.3 – – 13.7
Depreciation for the current year – 45.6 – 4.2 – 107.9 – 56.4 – 90.8 – – – 304.9
Impairment for the current year – 19.9 – 8.0 – – – 8.5 – – – 36.4
Disposals 4.7 2.9 27.0 4.6 54.1 – – 93.3
Transfer to assets held for sale 10.6 – 53.1 – 0.4 – – 64.1
Transfer – 7.0 9.0 – – – 2.3 – – – 0.3
Balance as at 30 Sep 2017 – 511.5 – 75.6 – 670.6 – 269.3 – 834.1 0.2 – – 2,360.9
Exchange differences 3.1 – 0.2 – 5.4 0.9 11.8 – – 10.2
Depreciation for the current year – 44.6 – 2.6 – 115.2 – 72.8 – 91.0 – – – 326.2
Impairment for the current year – 3.4 – – – – 2.1 – – – 5.5
Disposals 4.8 3.5 21.1 4.9 51.4 – – 85.7
Transfer to assets held for sale 45.9 – – – 3.7 – – 49.6
Transfer – 8.4 – – – 8.4 – – –
Balance as at 30 Sep 2018 – 514.1 – 74.9 – 770.1 – 336.3 – 851.9 0.2 – – 2,547.1
Carrying amounts as at 30 Sep 2017 1,040.8 165.1 1,207.2 860.1 361.2 194.1 425.2 4,253.7
Carrying amounts as at 30 Sep 2018 1,262.8 194.1 1,415.1 995.2 407.9 144.8 479.3 4,899.2

195NOT E S » NoT e S oN T H e CoN S ol I DAT e D S TAT e Me N T of f I N A NC I A l p oS I T IoN
(15) Property, plant and equipment
The table below presents the development of the individual items of property, plant and equipment in FY 2018.
Property, plant and equipment
€ million
Hotels incl. land
Other buildings
and land
Aircraft
Cruise ships
Other plant,
operating and
office equipment
Assets under
construction
Payments
on account
Total
Historical cost
Balance as at 1 Oct 2016 1,436.9 231.4 1,835.1 894.5 1,138.8 158.1 210.1 5,904.9
Exchange differences – 19.0 – 0.7 – 68.0 – 16.6 – 24.1 25.7 – 21.0 – 123.7
Additions due to changes in the group of consolidated companies 15.8 4.9 – – 3.4 – – 24.1
Additions 51.8 15.2 182.1 8.4 101.3 376.8 294.8 1,030.4
Disposals – 4.9 – 3.5 – 29.5 – 4.7 – 56.5 – – 45.5 – 144.6
Transfer to assets held for sale – 21.1 – 0.7 – 57.6 0.2 – 0.5 – – – 79.7
Transfer 92.8 – 5.9 15.7 247.6 32.9 – 366.7 – 13.2 3.2
Balance as at 30 Sep 2017 1,552.3 240.7 1,877.8 1,129.4 1,195.3 193.9 425.2 6,614.6
Exchange differences – 23.9 – 0.4 28.8 – 6.7 – 15.9 – 4.5 9.1 – 13.5
Additions due to changes in the group of consolidated companies 132.3 0.5 – – 11.9 – – 144.7
Additions 68.2 35.5 264.7 8.9 98.6 318.1 220.8 1,014.8
Disposals – 18.3 – 3.9 – 24.6 – 4.9 – 57.0 – 0.5 – 145.4 – 254.6
Transfer to assets held for sale – 46.6 – 0.9 – 5.4 – – 4.9 – 1.9 – – 59.7
Transfer 112.9 – 2.5 43.9 204.8 31.8 – 360.5 – 30.4 –
Balance as at 30 Sep 2018 1,776.9 269.0 2,185.2 1,331.5 1,259.8 144.6 479.3 7,446.3
Depreciation and impairment
Balance as at 1 Oct 2016 – 458.0 – 76.0 – 633.1 – 220.2 – 803.3 0.2 – – 2,190.4
Exchange differences 3.7 0.7 – 9.7 2.7 16.3 – – 13.7
Depreciation for the current year – 45.6 – 4.2 – 107.9 – 56.4 – 90.8 – – – 304.9
Impairment for the current year – 19.9 – 8.0 – – – 8.5 – – – 36.4
Disposals 4.7 2.9 27.0 4.6 54.1 – – 93.3
Transfer to assets held for sale 10.6 – 53.1 – 0.4 – – 64.1
Transfer – 7.0 9.0 – – – 2.3 – – – 0.3
Balance as at 30 Sep 2017 – 511.5 – 75.6 – 670.6 – 269.3 – 834.1 0.2 – – 2,360.9
Exchange differences 3.1 – 0.2 – 5.4 0.9 11.8 – – 10.2
Depreciation for the current year – 44.6 – 2.6 – 115.2 – 72.8 – 91.0 – – – 326.2
Impairment for the current year – 3.4 – – – – 2.1 – – – 5.5
Disposals 4.8 3.5 21.1 4.9 51.4 – – 85.7
Transfer to assets held for sale 45.9 – – – 3.7 – – 49.6
Transfer – 8.4 – – – 8.4 – – –
Balance as at 30 Sep 2018 – 514.1 – 74.9 – 770.1 – 336.3 – 851.9 0.2 – – 2,547.1
Carrying amounts as at 30 Sep 2017 1,040.8 165.1 1,207.2 860.1 361.2 194.1 425.2 4,253.7
Carrying amounts as at 30 Sep 2018 1,262.8 194.1 1,415.1 995.2 407.9 144.8 479.3 4,899.2
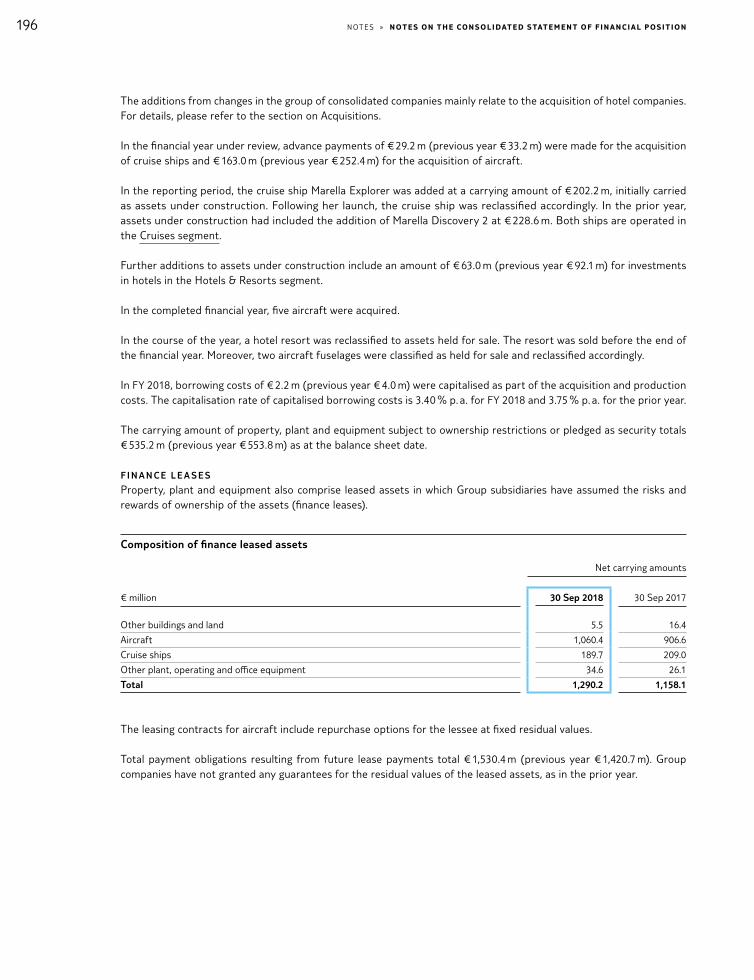
196 NOT E S » NoT e S oN T He CoN S ol I DAT e D S TAT e Me N T of f I N A NC I A l p oS I T IoN
The additions from changes in the group of consolidated companies mainly relate to the acquisition of hotel companies. For details, please refer to the section on Acquisitions.
In the financial year under review, advance payments of € 29.2 m (previous year € 33.2 m) were made for the acquisition of cruise ships and € 163.0 m (previous year € 252.4 m) for the acquisition of aircraft.
In the reporting period, the cruise ship Marella Explorer was added at a carrying amount of € 202.2 m, initially carried as assets under construction. Following her launch, the cruise ship was reclassified accordingly. In the prior year, assets under construction had included the addition of Marella Discovery 2 at € 228.6 m. Both ships are operated in the Cruises segment.
Further additions to assets under construction include an amount of € 63.0 m (previous year € 92.1 m) for investments in hotels in the Hotels & Resorts segment.
In the completed financial year, five aircraft were acquired.
In the course of the year, a hotel resort was reclassified to assets held for sale. The resort was sold before the end of the financial year. Moreover, two aircraft fuselages were classified as held for sale and reclassified accordingly.
In FY 2018, borrowing costs of € 2.2 m (previous year € 4.0 m) were capitalised as part of the acquisition and production costs. The capitalisation rate of capitalised borrowing costs is 3.40 % p. a. for FY 2018 and 3.75 % p. a. for the prior year.
The carrying amount of property, plant and equipment subject to ownership restrictions or pledged as security totals € 535.2 m (previous year € 553.8 m) as at the balance sheet date.
F I N A N C E L E A S E S
Property, plant and equipment also comprise leased assets in which Group subsidiaries have assumed the risks and rewards of ownership of the assets (finance leases).
Composition of finance leased assets
Net carrying amounts
€ million 30 Sep 2018 30 Sep 2017
Other buildings and land 5.5 16.4
Aircraft 1,060.4 906.6
Cruise ships 189.7 209.0
Other plant, operating and office equipment 34.6 26.1
Total 1,290.2 1,158.1
The leasing contracts for aircraft include repurchase options for the lessee at fixed residual values.
Total payment obligations resulting from future lease payments total € 1,530.4 m (previous year € 1,420.7 m). Group companies have not granted any guarantees for the residual values of the leased assets, as in the prior year.

197NOT E S » NoT e S oN T H e CoN S ol I DAT e D S TAT e Me N T of f I N A NC I A l p oS I T IoN
Reconciliation of future lease payments to liabilities from finance leases
30 Sep 2018 30 Sep 2017
Remaining term Remaining term
€ million
up to 1 year 1– 5 years more than
5 years
Total up to 1 year 1– 5 years more than
5 years
Total
Total future lease payments 139.3 588.1 803.0 1,530.4 128.2 513.1 779.4 1,420.7
Interest portion 34.1 105.6 48.0 187.7 32.0 107.8 54.4 194.2
Liabilities from finance
leases 105.2 482.5 755.0 1,342.7 96.2 405.3 725.0 1,226.5
(16) Investments in joint ventures and associates
The table below presents all joint arrangements and associates of relevance to TUI Group. All joint arrangements and associates are listed as TUI Group Shareholdings in Note 47. All joint arrangements are joint ventures. There are no joint operations within the meaning of IFRS 11.
Significant associates and joint ventures
Capital share in % Voting rights share in %
Name and headquarter of company Nature of business 30 Sep 2018 30 Sep 2017 30 Sep 2018 30 Sep 2017
Associates
Sunwing Travel Group Inc.,
Toronto, Canada
Tour operator &
Hotel operator 49.0 49.0 25.0 25.0
Joint ventures
Riu Hotels S. A., Palma de Mallorca, Spain Hotel operator 49.0 49.0 49.0 49.0
TUI Cruises GmbH, Hamburg, Germany Cruise ship operator 50.0 50.0 50.0 50.0
Togebi Holdings Limited, Nicosia, Cyprus Tour operator 25.0 25.0 25.0 25.0
All companies presented above are measured at equity.
The financial year of Sunwing Travel Group Inc., Toronto / Canada (Sunwing) corresponds to TUI Group’s financial year. The financial years of the joint ventures listed above deviate from TUI Group’s financial year, ending on 31 December of any one year. In order to update the at equity measurement as at TUI Group’s balance sheet date, interim financial statements for the period ending 30 September are prepared for these companies.
S I G N I F I C A N T A S S O C I AT E S
In 2009, Sunwing entered into a partnership with TUI Group. Sunwing is a vertically integrated travel company comprising tour operation, an airline and retail shops. Since the transfer of the hotel operation and development company Blue Diamond Hotels & Resorts Inc., St Michael / Barbados, to Sunwing in September 2016, Sunwing has also included the hotel operation business with a chain of luxury beach resorts and hotels in the Caribbean and Mexico. Sunwing’s hotel operation business is carried in the Hotels & Resorts segment, while the tour operation business is carried in the Northern Region segment. The company has different classes of shares. TUI Group holds 25 % of the voting shares.

198 NOT E S » NoT e S oN T He CoN S ol I DAT e D S TAT e Me N T of f I N A NC I A l p oS I T IoN
S I G N I F I C A N T J O I N T V E N T U R E S
Riu Hotels S. A. is a hotel company owning and operating hotels in the 4- to 5-star segments. The hotels of the company established in 1976 are mainly located in Spain and Central America.
TUI Cruises GmbH is a joint venture with the US shipping line Royal Caribbean Cruises Ltd established in 2008. The Hamburg-based company offers German-speaking cruises for the premium market. TUI Cruises GmbH currently operates six cruise ships.
Togebi Holdings Limited (TUI Russia) is a joint venture between TUI and Oscrivia Limited, a subsidiary of Unifirm Limited. Unifirm Limited is a subsidiary of OOO Severgroup, owned by a large shareholder and Supervisory Board member of TUI AG. The business purpose of this joint venture, established in 2009, is to develop the tour operation business, in particular in Russia and Ukraine. The company owns tour operation subsidiaries and retail chains in these countries. The relevant activities of TUI Russia are jointly determined by TUI Group and Oscrivia Limited, so that TUI Russia is classified as a joint venture.
After the balance sheet date TUI Group’s share in TUI Russia decreased to 10 % due to a capital increase in which TUI Group did not participate.
F I N A N C I A L I N F O R M AT I O N O N A S S O C I AT E S A N D J O I N T V E N T U R E S
The tables below present summarised financial information for the significant associates and joint ventures of the TUI Group. The amounts shown reflect the full amounts presented in the consolidated financial statements of the relevant associates and joint ventures (100 %); they do not represent TUI Group’s share of those amounts.
Summarised financial information of material associates
Sunwing Travel Group Inc.,
Toronto, Canada
€ million
30 Sep 2018 /
2018
30 Sep 2017 /
2017
Non-current assets 1,186.3 1,061.9
Current assets 545.9 471.9
Non-current provisions and liabilities 598.5 570.4
Current provisions and liabilities 596.1 511.7
Revenues 1,941.6 2,022.6
Profit / loss* 77.5 67.7
Other comprehensive income 12.5 – 35.8
Total comprehensive income 90.0 31.9
* Solely from continuing operations
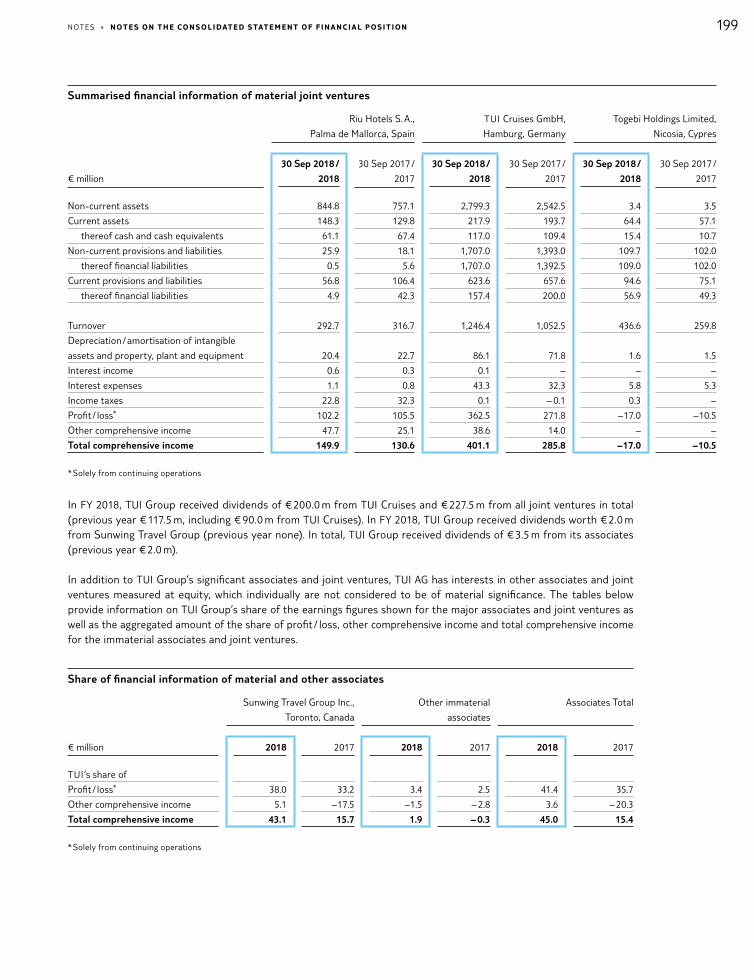
199NOT E S » NoT e S oN T H e CoN S ol I DAT e D S TAT e Me N T of f I N A NC I A l p oS I T IoN
Summarised financial information of material joint ventures
Riu Hotels S. A.,
Palma de Mallorca, Spain
TUI Cruises GmbH,
Hamburg, Germany
Togebi Holdings Limited,
Nicosia, Cypres
€ million
30 Sep 2018 /
2018
30 Sep 2017 /
2017
30 Sep 2018 /
2018
30 Sep 2017 /
2017
30 Sep 2018 /
2018
30 Sep 2017 /
2017
Non-current assets 844.8 757.1 2,799.3 2,542.5 3.4 3.5
Current assets 148.3 129.8 217.9 193.7 64.4 57.1
thereof cash and cash equivalents 61.1 67.4 117.0 109.4 15.4 10.7
Non-current provisions and liabilities 25.9 18.1 1,707.0 1,393.0 109.7 102.0
thereof financial liabilities 0.5 5.6 1,707.0 1,392.5 109.0 102.0
Current provisions and liabilities 56.8 106.4 623.6 657.6 94.6 75.1
thereof financial liabilities 4.9 42.3 157.4 200.0 56.9 49.3
Turnover 292.7 316.7 1,246.4 1,052.5 436.6 259.8
Depreciation / amortisation of intangible
assets and property, plant and equipment 20.4 22.7 86.1 71.8 1.6 1.5
Interest income 0.6 0.3 0.1 – – –
Interest expenses 1.1 0.8 43.3 32.3 5.8 5.3
Income taxes 22.8 32.3 0.1 – 0.1 0.3 –
Profit / loss* 102.2 105.5 362.5 271.8 – 17.0 – 10.5
Other comprehensive income 47.7 25.1 38.6 14.0 – –
Total comprehensive income 149.9 130.6 401.1 285.8 – 17.0 – 10.5
* Solely from continuing operations
In FY 2018, TUI Group received dividends of € 200.0 m from TUI Cruises and € 227.5 m from all joint ventures in total (previous year € 117.5 m, including € 90.0 m from TUI Cruises). In FY 2018, TUI Group received dividends worth € 2.0 m from Sunwing Travel Group (previous year none). In total, TUI Group received dividends of € 3.5 m from its associates (previous year € 2.0 m).
In addition to TUI Group’s significant associates and joint ventures, TUI AG has interests in other associates and joint ventures measured at equity, which individually are not considered to be of material significance. The tables below provide information on TUI Group’s share of the earnings figures shown for the major associates and joint ventures as well as the aggregated amount of the share of profit / loss, other comprehensive income and total comprehensive income for the immaterial associates and joint ventures.
Share of financial information of material and other associates
Sunwing Travel Group Inc.,
Toronto, Canada
Other immaterial
associates
Associates Total
€ million 2018 2017 2018 2017 2018 2017
TUI ’s share of
Profit / loss* 38.0 33.2 3.4 2.5 41.4 35.7
Other comprehensive income 5.1 – 17.5 – 1.5 – 2.8 3.6 – 20.3
Total comprehensive income 43.1 15.7 1.9 – 0.3 45.0 15.4
* Solely from continuing operations

200 NOT E S » NoT e S oN T He CoN S ol I DAT e D S TAT e Me N T of f I N A NC I A l p oS I T IoN
Share of financial information of material and other joint ventures
Riu Hotels S. A.,
Palma de Mallorca, Spain
TUI Cruises GmbH,
Hamburg, Germany
Togebi Holdings Limited,
Nicosia, Cypres
Other immaterial
joint ventures
Joint ventures
Total
€ million 2018 2017 2018 2017 2018 2017 2018 2017 2018 2017
TUI ’s share of
Profit / loss* 50.1 51.7 181.2 135.9 – – 24.4 29.0 255.7 216.6
Other
comprehensive
income 23.4 12.4 19.3 7.0 – – – 3.8 – 45.2 38.9 – 25.8
Total
comprehensive
income 73.5 64.1 200.5 142.9 – – 20.6 – 16.2 294.6 190.8
* Solely from continuing operations
Net assets of the material associates
€ million
Sunwing Travel Group
Inc., Toronto, Canada
Net assets as at 1 Oct 2016 419.8
Profit / loss 67.7
Other comprehensive income – 9.3
Dividends –
Capital increase –
Foreign exchange effects – 26.6
Consolidation effects –
Net assets as at 30 Sep 2017 451.6
Profit / loss 77.5
Other comprehensive income –
Dividends – 4.1
Capital increase –
Foreign exchange effects 12.5
Consolidation effects –
Net assets as at 30 Sep 2018 537.5
Reconciliation to the carrying amount of the associates in the Group balance sheet
€ million
Sunwing Travel Group
Inc., Toronto, Canada
Other immaterial
associates
Associates
Total
Share of TUI AG in % as at 30 Sep 2017 49.0 – –
TUI AG‘s share of the net assets as at 30 Sep 2017 221.3 49.3 270.6
Goodwill as at 30 Sep 2017 51.4 4.0 55.4
Carrying value as at 30 Sep 2017 272.7 53.3 326.0
Share of TUI AG in % as at 30 Sep 2018 49.0 – –
TUI AG‘s share of the net assets as at 30 Sep 2018 263.4 66.5 329.9
Goodwill as at 30 Sep 2018 50.4 7.0 57.4
Carrying value as at 30 Sep 2018 313.8 73.5 387.3
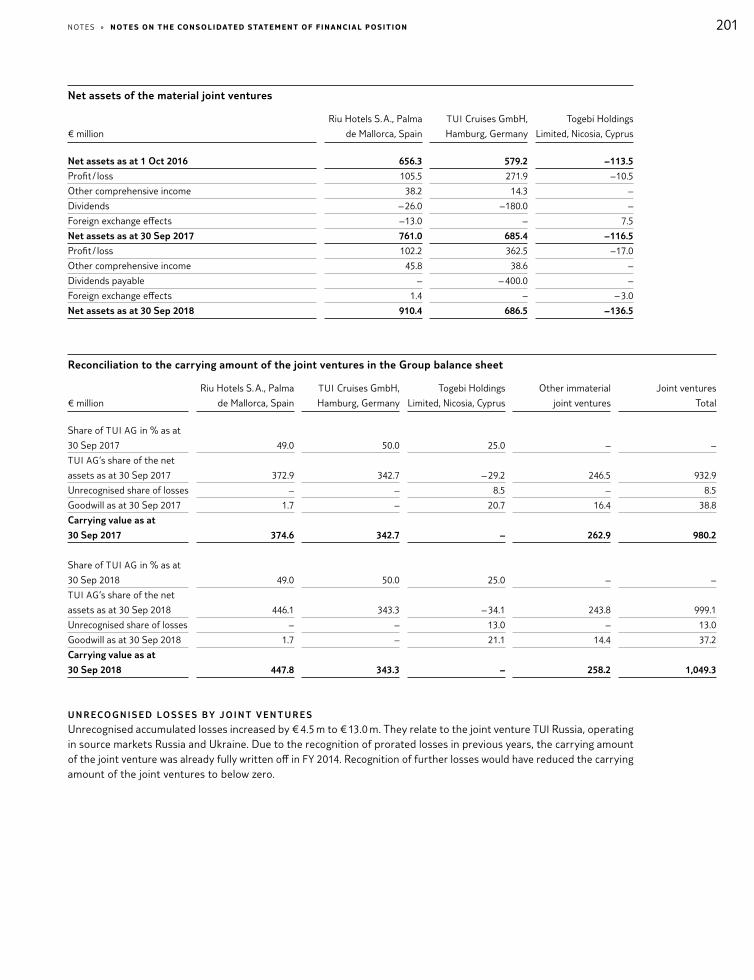
201NOT E S » NoT e S oN T H e CoN S ol I DAT e D S TAT e Me N T of f I N A NC I A l p oS I T IoN
Net assets of the material joint ventures
€ million
Riu Hotels S. A., Palma
de Mallorca, Spain
TUI Cruises GmbH,
Hamburg, Germany
Togebi Holdings
Limited, Nicosia, Cyprus
Net assets as at 1 Oct 2016 656.3 579.2 – 113.5
Profit / loss 105.5 271.9 – 10.5
Other comprehensive income 38.2 14.3 –
Dividends – 26.0 – 180.0 –
Foreign exchange effects – 13.0 – 7.5
Net assets as at 30 Sep 2017 761.0 685.4 – 116.5
Profit / loss 102.2 362.5 – 17.0
Other comprehensive income 45.8 38.6 –
Dividends payable – – 400.0 –
Foreign exchange effects 1.4 – – 3.0
Net assets as at 30 Sep 2018 910.4 686.5 – 136.5
Reconciliation to the carrying amount of the joint ventures in the Group balance sheet
€ million
Riu Hotels S. A., Palma
de Mallorca, Spain
TUI Cruises GmbH,
Hamburg, Germany
Togebi Holdings
Limited, Nicosia, Cyprus
Other immaterial
joint ventures
Joint ventures
Total
Share of TUI AG in % as at
30 Sep 2017 49.0 50.0 25.0 – –
TUI AG’s share of the net
assets as at 30 Sep 2017 372.9 342.7 – 29.2 246.5 932.9
Unrecognised share of losses – – 8.5 – 8.5
Goodwill as at 30 Sep 2017 1.7 – 20.7 16.4 38.8
Carrying value as at
30 Sep 2017 374.6 342.7 – 262.9 980.2
Share of TUI AG in % as at
30 Sep 2018 49.0 50.0 25.0 – –
TUI AG’s share of the net
assets as at 30 Sep 2018 446.1 343.3 – 34.1 243.8 999.1
Unrecognised share of losses – – 13.0 – 13.0
Goodwill as at 30 Sep 2018 1.7 – 21.1 14.4 37.2
Carrying value as at
30 Sep 2018 447.8 343.3 – 258.2 1,049.3
U N R E CO G N I S E D L O S S E S BY J O I N T V E N T U R E S
Unrecognised accumulated losses increased by € 4.5 m to € 13.0 m. They relate to the joint venture TUI Russia, operating in source markets Russia and Ukraine. Due to the recognition of prorated losses in previous years, the carrying amount of the joint venture was already fully written off in FY 2014. Recognition of further losses would have reduced the carrying amount of the joint ventures to below zero.
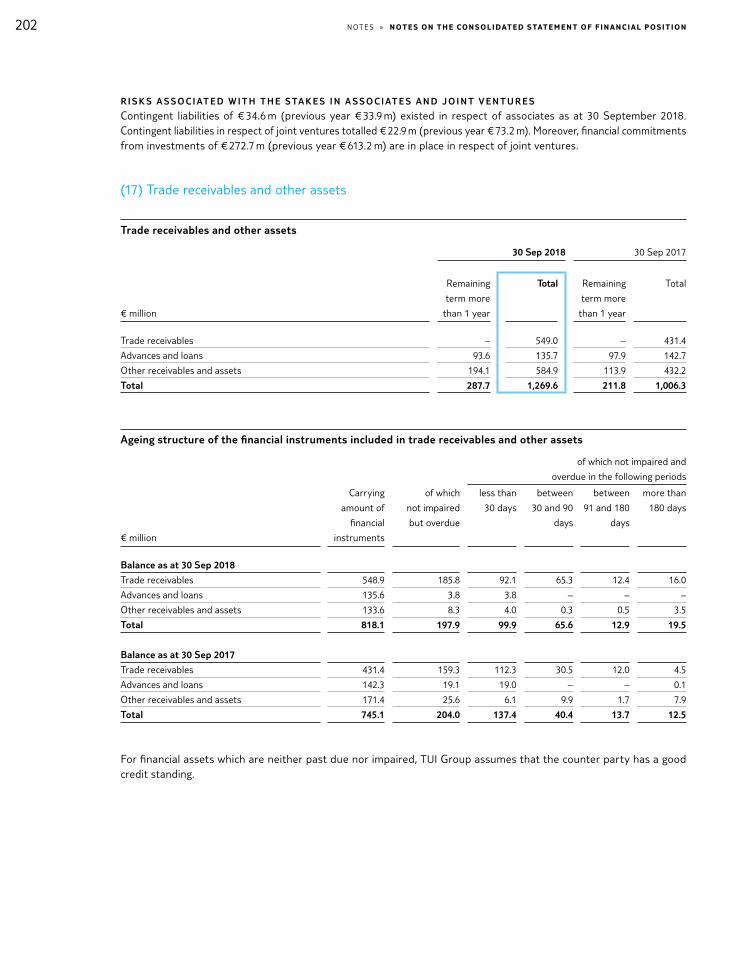
202 NOT E S » NoT e S oN T He CoN S ol I DAT e D S TAT e Me N T of f I N A NC I A l p oS I T IoN
R I S K S A S S O C I AT E D W I T H T H E S TA K E S I N A S S O C I AT E S A N D J O I N T V E N T U R E S
Contingent liabilities of € 34.6 m (previous year € 33.9 m) existed in respect of associates as at 30 September 2018. Contingent liabilities in respect of joint ventures totalled € 22.9 m (previous year € 73.2 m). Moreover, financial commitments from investments of € 272.7 m (previous year € 613.2 m) are in place in respect of joint ventures.
(17) Trade receivables and other assets
Trade receivables and other assets
30 Sep 2018 30 Sep 2017
€ million
Remaining
term more
than 1 year
Total
Remaining
term more
than 1 year
Total
Trade receivables – 549.0 – 431.4
Advances and loans 93.6 135.7 97.9 142.7
Other receivables and assets 194.1 584.9 113.9 432.2
Total 287.7 1,269.6 211.8 1,006.3
Ageing structure of the financial instruments included in trade receivables and other assets
of which not impaired and
overdue in the following periods
€ million
Carrying
amount of
financial
instruments
of which
not impaired
but overdue
less than
30 days
between
30 and 90
days
between
91 and 180
days
more than
180 days
Balance as at 30 Sep 2018
Trade receivables 548.9 185.8 92.1 65.3 12.4 16.0
Advances and loans 135.6 3.8 3.8 – – –
Other receivables and assets 133.6 8.3 4.0 0.3 0.5 3.5
Total 818.1 197.9 99.9 65.6 12.9 19.5
Balance as at 30 Sep 2017
Trade receivables 431.4 159.3 112.3 30.5 12.0 4.5
Advances and loans 142.3 19.1 19.0 – – 0.1
Other receivables and assets 171.4 25.6 6.1 9.9 1.7 7.9
Total 745.1 204.0 137.4 40.4 13.7 12.5
For financial assets which are neither past due nor impaired, TUI Group assumes that the counter party has a good credit standing.

203NOT E S » NoT e S oN T H e CoN S ol I DAT e D S TAT e Me N T of f I N A NC I A l p oS I T IoN
As at 30 September 2018, trade accounts receivable and other receivables worth € 96.6 m (previous year € 76.0 m) were impaired. The table below provides a maturity analysis of impairment.
Ageing structure of impairment of financial instruments included in trade receivables and other assets
30 Sep 2018 30 Sep 2017
€ million Gross value Impairment Net value Gross value Impairment Net value
Trade receivables and other assets
Not overdue 639.8 19.6 620.2 559.4 18.3 541.1
Overdue less than 30 days 102.6 2.7 99.9 151.1 13.7 137.4
Overdue 30 – 90 days 69.7 4.1 65.6 48.5 8.1 40.4
Overdue 91 – 180 days 15.2 2.3 12.9 15.7 2.0 13.7
Overdue more than 180 days 87.4 67.9 19.5 46.4 33.9 12.5
Total 914.7 96.6 818.1 821.1 76.0 745.1
Impairment of trade receivables and other assets developed as follows:
Impairment on assets of the trade receivables and other assets category according to IFRS 7
€ million 2018 2017
Balance at the beginning of period 76.0 62.7
Additions 33.4 26.4
Disposals 13.1 12.4
Other changes 0.3 – 0.7
Balance at the end of period 96.6 76.0
As in the previous year, in FY 2018, no material cash inflow was recorded from impaired interest-bearing trade receivables and other assets.
(18) Touristic payments on account
Touristic payments on account mainly relate to customary advance payments on future tourism services, in particular advance payments made by tour operators for future hotel services.

204 NOT E S » NoT e S oN T He CoN S ol I DAT e D S TAT e Me N T of f I N A NC I A l p oS I T IoN
(19) Deferred tax assets
Individual items of deferred tax assets and liabilities recognised in the financial position
30 Sep 2018 30 Sep 2017
€ million Asset Liability Asset Liability
Finance lease transactions 2.2 – 2.2 –
Recognition and measurement differences for property,
plant and equipment and other non-current assets 40.6 253.2 50.6 210.1
Recognition differences for receivables and other assets 4.4 41.2 60.5 114.8
Measurement of financial instruments 5.6 110.9 22.3 22.5
Measurement of pension provisions 156.7 12.5 183.3 5.6
Recognition and measurement differences for other provisions 68.2 2.2 71.2 17.0
Other transactions 43.4 58.2 58.3 61.8
Capitalised tax savings from recoverable losses carried forward 198.3 – 198.1 –
Netting of deferred tax assets and liabilities – 293.7 – 293.7 – 322.8 – 322.8
Balance sheet amount 225.7 184.5 323.7 109.0
Deferred tax assets include an amount of € 218.8 m (previous year € 311.6 m) expected to be realised after more than twelve months. Deferred tax liabilities include an amount of € 114.8 m (previous year € 57.3 m) expected to be realised after more than twelve months.
No deferred tax assets are recognised for deductible temporary differences of € 191.4 m (previous year € 315.7 m).
No deferred tax liabilities are carried for temporary differences of € 66.7 m (previous year € 58.6 m) between the net assets of subsidiaries and the respective taxable carrying amounts of subsidiaries since these temporary differences are not expected to be reversed in the near future.
Recognised losses carried forward and time limits for non-recognised losses carried forward
€ million 30 Sep 2018 30 Sep 2017
Recognised losses carried forward 1,061.5 998.2
Non-recognised losses carried forward 4,773.0 4,654.5
of which losses carried forward forfeitable within one year 2.3 3.8
of which losses carried forward forfeitable within 2 to 5 years 61.0 89.8
of which losses carried forward forfeitable within more than 5 years
(excluding non-forfeitable loss carryforwards) – –
Non-forfeitable losses carried forward 4,709.7 4,560.9
Total unused losses carried forward 5,834.5 5,652.7
Losses carried forward for German companies comprise the cumulative amount of trade tax and corporation tax as well as interest carried forward in relation to the German interest barrier. Potential tax savings totalling € 925.6 m (previous year € 900.1 m) were not capitalised since the underlying losses carried forward are unlikely to be utilised in the foreseeable future.

205NOT E S » NoT e S oN T H e CoN S ol I DAT e D S TAT e Me N T of f I N A NC I A l p oS I T IoN
In FY 2018, the use of losses carried forward previously assessed as non-recoverable and for which no deferred tax asset had been recognised as at 30 September 2017 led to tax reductions of € 6.4 m (previous year € 0.4 m). As in the prior year, no tax reductions were realised by means of losses carried back.
Development of deferred tax assets from losses carried forward
€ million 2018 2017
Capitalised tax savings at the beginning of the year 198.1 211.5
Use of losses carried forward – 34.7 – 38.7
Capitalisation of tax savings from tax losses carried forward 35.6 27.9
Impairment of capitalised tax savings from tax losses carried forward – 0.3 – 2.9
Reclassification to discontinued operation – –
Exchange adjustments and other items – 0.4 0.3
Capitalised tax savings at financial year-end 198.3 198.1
Capitalised deferred tax assets from temporary differences and losses carried forward that are assessed as recoverable of € 1.7 m (previous year € 4.0 m) are covered by expected future taxable income even for companies that generated losses in the reporting period or the prior year.
(20) Inventories
Inventories
€ million 30 Sep 2018 30 Sep 2017
Airline spares and operating equipment 37.0 32.1
Real estate for sale 33.6 33.4
Consumables used in hotels 15.8 17.2
Other inventories 32.1 27.5
Total 118.5 110.2
In FY 2018, inventories of € 557.8 m (previous year € 541.1 m) were recognised as expense.
(21) Cash and cash equivalents
Cash and cash equivalents
€ million 30 Sep 2018 30 Sep 2017
Bank deposits 2,520.8 2,486.1
Cash in hand and cheques 27.2 30.0
Total 2,548.0 2,516.1
At 30 September 2018, cash and cash equivalents of € 199.2 m were subject to restrictions (previous year € 261.0 m).
206 NOT E S » NoT e S oN T He CoN S ol I DAT e D S TAT e Me N T of f I N A NC I A l p oS I T IoN
On 30 September 2016, TUI AG entered into an agreement to close the gap between the obligations and the fund assets of defined benefit pension plans in the UK in the long run. At the balance sheet date an amount of € 79.0 m is deposited as security within a bank account. TUI Group can only use that cash and cash equivalents if it provides alternative collateral.
Further, an amount of € 116.5 m (previous year € 116.5 m) was deposited with a Belgian subsidiary without acknowl-edgement of debt by the Belgian tax authorities in FY 2013 in respect of long-standing litigation over VAT refunds for the years 2001 to 2011. The purpose was to suspend the accrual of interest for both parties. In order to collateralise a potential repayment, the Belgian government was granted a bank guarantee. Due to the bank guarantee, TUI’s ability to dispose of the cash and cash equivalents has been restricted. The other restrictions relate to cash and cash equivalents to be deposited due to legal or regulatory requirements.
(22) Assets held for sale
At 30 September 2018 two aircraft fuselages are presented as held for sale. In the prior year hotels of € 5.0 m and aircraft assets of € 4.6 m were classified as held for sale.
(23) Subscribed capital
The fully paid subscribed capital of TUI AG consists of no-par value shares, each representing an identical share in the capital stock. The proportionate share in the capital stock per no-par value share is around € 2.56. As the capital stock consists of registered shares, the owners are listed by name in the share register.
The subscribed capital of TUI AG has been registered in the commercial registers of the district courts of Berlin- Charlottenburg and Hanover. In the financial year, it rose by a total of 514,404 employee shares. It thus comprised 587,901,304 shares (previous year 587,386,900 shares) as at the end of the financial year. It rose by € 1.3 m to € 1,502.9 m.
The Annual General Meeting on 13 February 2018 authorised the Executive Board of TUI AG to acquire own shares of up to 5 % of the capital stock. The authorisation will expire on 12 August 2019. The authorisation was used to acquire own shares amounting to € 1.1 m.
CO N D I T I O N A L C A P I TA L
The Annual General Meeting on 9 February 2016 had created conditional capital of € 150.0 m and authorised the Company to issue bonds. The conditional capital authorisation to acquire bonds with conversion or option rights and profit participation (with or without a mixed maturity) is limited to a nominal amount of € 2.0 bn and expires on 8 February 2021.
Overall, TUI AG’s total conditional capital remained flat year-on-year at € 150.0 m as at 30 September 2018.
AU T H O R I S E D C A P I TA L
The Annual General Meeting on 13 February 2018 resolved to create additional authorised capital of € 30.0 m for the issue of employee shares. The Executive Board of TUI AG has been authorised to use this authorised capital in one or several transactions to issue employee shares against cash contribution by 12 February 2023. 514,404 new employee shares were issued in the completed financial year so that authorised capital totals around € 28.7 m at the balance sheet date.
The Annual General Meeting on 9 February 2016 resolved an authorisation to issue new registered shares against cash contribution for up to a maximum of € 150.0 m. This authorisation will expire on 8 February 2021.

207NOT E S » NoT e S oN T H e CoN S ol I DAT e D S TAT e Me N T of f I N A NC I A l p oS I T IoN
The Annual General Meeting on 9 February 2016 also resolved to create authorised capital for the issue of new shares against cash or non-cash contribution for up to € 570.0 m. The issue of new shares against non-cash contribution is limited to a maximum of € 300.0 m. The authorisation for this authorised capital will expire on 8 February 2021.
At the balance sheet date, the accumulated authorised capital that had not yet been taken up amounted to € 748.7 m (previous year € 745.4 m).
(24) Capital reserves
The capital reserves comprise transfers of premiums. They also comprise amounts entitling the holders to acquire shares in TUI AG in the framework of bonds issued for conversion options and warrants. Premiums from the issue of shares due to the exercise of conversion options and warrants were also transferred to the capital reserve.
Capital reserves rose by € 5.5 m (previous year € 2.8 m) due to the issue of employee shares in the completed financial year.
(25) Revenue reserves
In the completed financial year, TUI AG paid a dividend of € 0.65 per no-par value share to its shareholders; the total amount paid was € 381.8 m (previous year € 368.2 m). The share of non-controlling interests declined by € 53.5 m (previous year € 87.2 m) in FY 2018 due to the issue of dividends.
The ongoing recording of existing equity-settled stock option plans resulted in a decrease in equity of € 0.7 m in the reporting period. Disclosures on these long-term incentive programmes are outlined in the section on Share-based payments in accordance with IFRS 2 in Note 35.
In FY 2018, the movement in the first-time consolidation of non-controlling interests was essentially attributable to the non-controlling interests of the acquired companies in Destination Management worth € 3.0 m.
Foreign exchange differences comprise differences from the translation of the financial statements of foreign subsidiaries as well as differences from the translation of goodwill denominated in foreign currencies. They also comprise reclassification amounts from the sale of two RIUSA II Group hotel companies totalling €– 12.8 m to be recognised through profit or loss.
The proportion of gains and losses from hedges used as effective hedges of future cash flows is carried directly in equity at € 429.7 m (pre-tax). A reversal of this provision through profit and loss takes place in the same period in which the hedged item has an effect on profit and loss or is no longer assessed as probable. The significant increase in FY 2018 is primarily attributable to changes in exchange rates and fuel prices.
The revaluation of pension obligations (in particular actuarial gains and losses) is also carried directly in equity.
The revaluation reserve formed in accordance with IAS 27 (old version) in the framework of step acquisitions of companies is retained until the date of deconsolidation of the company concerned.

208 NOT E S » NoT e S oN T He CoN S ol I DAT e D S TAT e Me N T of f I N A NC I A l p oS I T IoN
(26) Use of Group profit available for distribution
In accordance with the German Stock Corporation Act, the Annual General Meeting resolves the use of the profit available for distribution carried in TUI AG’s commercial-law annual financial statements. TUI AG’s profit for the year amounts to € 983.4 m (previous year € 741.7 m). Taking account of profit carried forward of € 814.0 m (previous year € 454.1 m), TUI AG’s profit available for distribution totals € 1,797.4 m (previous year € 1,195.8 m). A proposal will be submitted to the Annual General Meeting to use the profit available for distribution for the financial year under review to pay a dividend of € 0.72 per no-par value share and carry the amount of € 1,374.1 m remaining after deduction of the dividend total of € 423.3 m forward on account. The final dividend total will depend on the number of dividend-bearing no-par value shares at the date on which the resolution regarding the use of Group profit available for distribution is adopted by the Annual General Meeting.
(27) Non-controlling interest
Non-controlling interests mainly relate to RIUSA II S. A. based in Palma de Mallorca, Spain. TUI’s capital share in this hotel operator stands at 50.0 %, as in the prior year.
The financial year of RIUSA II S. A. ends on 31 December and thus deviates from TUI Group’s financial year. This reporting date was fixed when the company was founded. In order to include the RIUSA II Group in TUI Group’s consolidated financial statements as at 30 September, the RIUSA II Group prepares sub-group financial statements as at 30 September, the balance sheet date.
RIUSA II Group, allocated to Hotels & Resorts, operates owned and leased hotels and hotels operated under management contracts in tourism destinations of TUI Group.
The table below provides summarised financial information on RIUSA II S. A., Palma de Mallorca, Spain – the subsidiary for which material non-controlling interests exist. It presents the consolidated financial statements of the sub-group.
Summarised financial information on RIUSA II S. A., Palma de Mallorca, Spain*
€ million
30 Sep 2018 /
2018
30 Sep 2017 /
2017
Current assets 223.9 272.7
Non-current assets 1,569.3 1,400.8
Current liabiities 104.6 110.1
Non-current liabilities 88.8 29.3
Revenues 843.7 852.5
Profit / loss 161.0 231.0
Other comprehensive income 11.0 – 19.8
Cash inflow / outflow from operating activities 228.2 251.7
Cash inflow / outflow from investing activities – 126.1 – 147.5
Cash inflow / outflow from financing activities – 124.4 – 181.7
Accumulated non-controlling interest 628.4 591.2
Profit / loss attributable to non-controlling interest 84.8 115.5
Dividends attributable to non-controlling interest 53.1 87.0
* Consolidated Subgroup

209NOT E S » NoT e S oN T H e CoN S ol I DAT e D S TAT e Me N T of f I N A NC I A l p oS I T IoN
(28) Pension provisions and similar obligations
A number of defined contribution and defined benefit pension plans are operated for Group employees. Pension obligations vary, reflecting the different legal, fiscal and economic conditions in each country of operation, and usually depend on employees’ length of service and pay levels.
All defined contribution plans are funded by the payment of contributions to external insurance companies or funds. German employees enjoy benefits from a statutory defined contribution plan paying pensions as a function of employees’ income and the contributions paid in. Several additional industry pension organisations exist for TUI Group companies. Once the contributions to the state-run pension plans and private pension insurance organisations have been paid, the Company has no further payment obligations. One major private pension fund is Aegon Levensverzekering N. V., operating the defined contribution pension plans for the main Dutch subsidiaries of TUI Group. Contributions paid are expensed for the respective period. In the reporting period, the expenses for all defined contribution plans totalled € 80.3 m (previous year € 85.4 m).
Apart from these defined contribution pension plans, the TUI Group operates defined benefit plans, which usually entail the formation of provisions within the Company or investments in funds outside the Company.
Within this group, MER-Pensionskasse VVaG, a private pension fund in which German companies of the tourism industry are organised, represents a multi-employer plan classified as a defined benefit plan. In accordance with the statues of the plan, the plan participants and the employers pay salary-based contributions into the plan. There are no further obligations pursuant to the statutes of the plan; an additional funding obligation of the participating companies is explicitly excluded. The paid-in contributions are invested in accordance with the policies of the pension plan unless they are used in the short term for benefit payments. As the investments are pooled and are not kept separately for each participating employer, an allocation of plan assets to individual participating employers is not possible. The investment risk and the mortality risk are jointly shared by all plan participants. Moreover, the pension fund does not provide any information to participating companies that would allow the allocation of any over- or underfunding or TUI’s participation in the plan. For this reason, accounting for the plan as defined benefit plan is not possible, and the plan is therefore in accordance with the requirements of IAS 19 shown like a defined contribution plan. In the reporting period, contributions to MER-Pensionskasse VVaG totalled € 5.9 m (previous year € 5.9 m). For the next financial year, contributions are expected to remain at that level.
TUI Group’s major pension plans recognised as defined benefit plans exist in Germany and the UK. By far the largest pension plans are operated by the Group’s tour operators in the UK. They accounted for 71.6 % (previous year 72.6 %) of TUI Group’s total obligations at the balance sheet date. German plans account for a further 23.3 % (previous year 22.5 %).
Material defined benefit plans in Great Britain
Scheme name Status
BAL Scheme closed
TUI UK Scheme closed
TAPS Scheme closed
Almost all defined benefit plans in the UK are funded externally. Under UK law, the employer is obliged to ensure sufficient funding so that plan assets cover the pension payments to be made and the administrative costs of the funds. The pension funds are managed by independent trustees. The trustees comprise independent members but also beneficiaries of the plan and employer representatives. The trustees are responsible for the investment of fund assets, taking account of the interests of plan members, but they also negotiate the level of the contributions to the fund to be paid by the employers, which constitute minimum contributions to the funds. To that end, actuarial valuations are made every three years by actuaries commissioned by the trustees. The annual contributions to be paid to the funds in order to cover any shortfalls were last defined in September 2016.

210 NOT E S » NoT e S oN T He CoN S ol I DAT e D S TAT e Me N T of f I N A NC I A l p oS I T IoN
On 21 September 2018 TUI Group formally announced to members that the main sections of the TUI Group UK Pension Trust will close to future accrual of benefits with effect from 31 October 2018. Beginning 1 November 2018, accrued benefits for current active members will increase in line with deferred revaluation rates rather than members’ pensionable salaries. As a result of this, with an effective date of 21 September 2018, the DBO of the TUI Group UK Pension Trust decreased by € 6.3 m which is reflected in the income statement for the year under review as a past service credit due to plan amendment.
Accordingly, the major future payments into the pension plans in the UK are limited to the annual payments agreed to recover the existing funding shortfall.
By contrast, defined benefit plans in Germany are mainly unfunded and the obligations from these plans are recognised as provisions. The company assumes the obligation for payments of company pensions when the beneficiaries reach the legal retirement age. The amount of the pension paid usually depends on the remuneration received by the staff members at the retirement date. Pension obligations usually include surviving dependants’ benefits and invalidity benefits. Pension payments are partly limited by third party compensations, e. g. from insurances and MER-Pensionskasse.
Material defined benefit plans in Germany
Scheme name Status
Versorgungsordnung TUI AG open
Versorgungsordnung TUIfly GmbH open
Versorgungsordnung TUI Deutschland GmbH closed
Versorgungsordnung TUI Beteiligungs GmbH closed
Versorgungsordnung TUI Immobilien Services GmbH closed
In the reporting period, defined benefit pension obligations created total expenses of € 77.1 m.
Pension costs for defined benefit obligations
€ million 2018 2017
Current service cost for employee service in the period 68.1 76.3
Curtailment gains 4.4 1.8
Net interest on the net defined benefit liability 19.5 15.7
Past service cost – 6.1 – 0.2
Total 77.1 90.0
Provisions for pension obligations are established for benefits payable in the form of retirement, invalidity and surviving dependants’ benefits. Provisions are exclusively formed for defined benefit schemes under which the Company guarantees employees a specific pension level, including arrangements for early retirement and temporary assistance benefits.
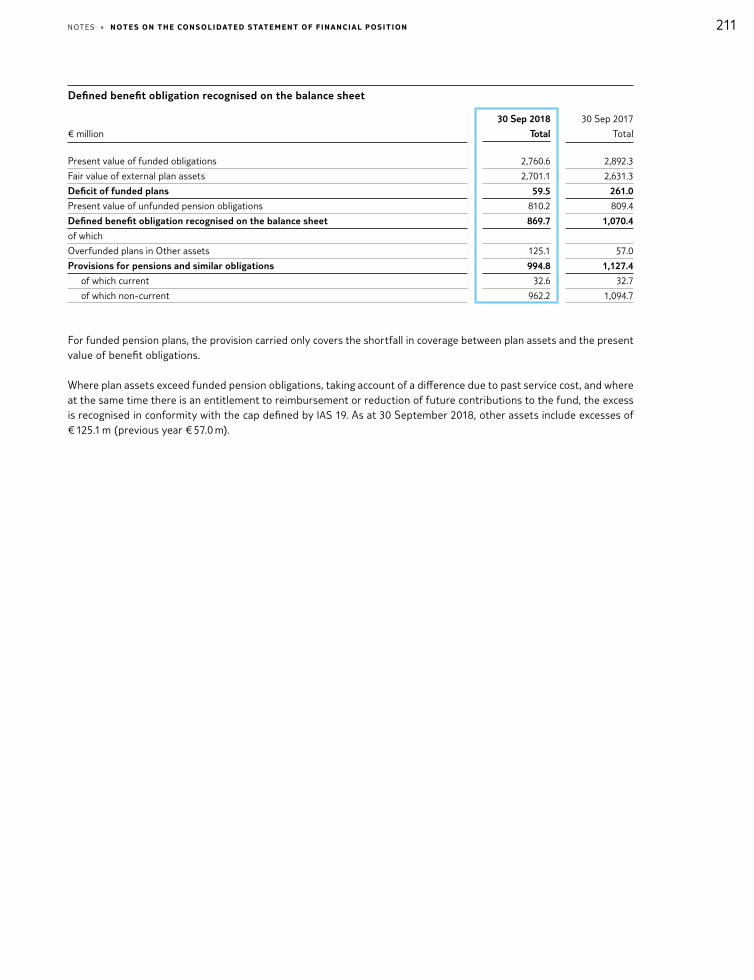
211NOT E S » NoT e S oN T H e CoN S ol I DAT e D S TAT e Me N T of f I N A NC I A l p oS I T IoN
Defined benefit obligation recognised on the balance sheet
€ million
30 Sep 2018
Total
30 Sep 2017
Total
Present value of funded obligations 2,760.6 2,892.3
Fair value of external plan assets 2,701.1 2,631.3
Deficit of funded plans 59.5 261.0
Present value of unfunded pension obligations 810.2 809.4
Defined benefit obligation recognised on the balance sheet 869.7 1,070.4
of which
Overfunded plans in Other assets 125.1 57.0
Provisions for pensions and similar obligations 994.8 1,127.4
of which current 32.6 32.7
of which non-current 962.2 1,094.7
For funded pension plans, the provision carried only covers the shortfall in coverage between plan assets and the present value of benefit obligations.
Where plan assets exceed funded pension obligations, taking account of a difference due to past service cost, and where at the same time there is an entitlement to reimbursement or reduction of future contributions to the fund, the excess is recognised in conformity with the cap defined by IAS 19. As at 30 September 2018, other assets include excesses of € 125.1 m (previous year € 57.0 m).

212 NOT E S » NoT e S oN T He CoN S ol I DAT e D S TAT e Me N T of f I N A NC I A l p oS I T IoN
Development of defined benefit obligations
€ million
Present value
of obligation
Fair value of
plan assets
Total
Balance as at 1 Oct 2017 3,701.7 – 2,631.3 1,070.4
Current service cost 68.1 – 68.1
Past service cost – 6.1 – – 6.1
Curtailments and settlements – 5.5 1.1 – 4.4
Interest expense (+) / interest income (–) 85.3 – 65.8 19.5
Pensions paid – 156.2 125.8 – 30.4
Contributions paid by employer – – 177.1 – 177.1
Contributions paid by employees 2.1 – 2.1 –
Remeasurements – 105.1 39.1 – 66.0
due to changes in financial assumptions – 70.6 – – 70.6
due to changes in demographic assumptions – 38.2 – – 38.2
due to experience adjustments 3.7 – 3.7
due to return on plan assets not included in group profit for the year – 39.1 39.1
Exchange differences – 15.6 9.9 – 5.7
Other changes 2.1 – 0.7 1.4
Balance as at 30 Sep 2018 3,570.8 – 2,701.1 869.7
Development of defined benefit obligations
€ million
Present value
of obligation
Fair value of
plan assets
Total
Balance as at 1 Oct 2016 4,154.7 – 2,740.0 1,414.7
Current service cost 76.3 – 76.3
Past service cost – 0.2 – – 0.2
Curtailments and settlements – 6.3 4.5 – 1.8
Interest expense (+) / interest income (–) 79.0 – 63.3 15.7
Pensions paid – 152.6 118.9 – 33.7
Contributions paid by employer – – 107.6 – 107.6
Contributions paid by employees 1.4 – 1.4 –
Remeasurements – 405.2 124.5 – 280.7
due to changes in financial assumptions – 289.2 – – 289.2
due to changes in demographic assumptions – 1.0 – – 1.0
due to experience adjustments – 115.0 – – 115.0
due to return on plan assets not included in group profit for the year – 124.5 124.5
Exchange differences – 78.3 62.2 – 16.1
Other changes 32.9 – 29.1 3.8
Balance as at 30 Sep 2017 3,701.7 – 2,631.3 1,070.4
In the reporting period, the present value of the pension obligations decreased by € 130.9 m to € 3,570.8 m, mainly due to remeasurements from changes in assumptions especially a slight increase in interest rates in the UK.

213NOT E S » NoT e S oN T H e CoN S ol I DAT e D S TAT e Me N T of f I N A NC I A l p oS I T IoN
The Group’s fund assets increased by € 69.8 m in the same period mainly due to a one-off payment made in September of £ 50.0 m (€ 56.0 m) according to the agreed payment schedule to recover the existing funding shortfall in the UK and is split into asset categories as shown in the table below.
Composition of fund assets at the balance sheet date
30 Sep 2018 30 Sep 2017
Quoted market price
in an active market
Quoted market price
in an active market
€ million yes no yes no
Fair value of fund assets at end of period 1,363.0 1,338.1 1,833.5 797.8
of which equity instruments 167.4 141.5 199.0 147.8
of which government bonds 20.4 – 41.9 –
of which corporate bonds 47.1 – 216.4 –
of which liability driven investments 543.3 – 707.3 –
of absolute return bonds 411.7 – 517.4 –
of which property 169.8 39.7 108.9 14.9
of which growth funds – 252.6 – 143.1
of which insurance policies – 121.5 – 119.7
of which insurance linked securities – 137.4 – 136.0
of which loans – 277.2 – 180.7
of which cash – 362.1 – 30.0
of which other 3.3 6.1 42.6 25.6
At the balance sheet date, as in the prior year, fund assets did not comprise any direct investments in financial instruments issued by TUI AG or its consolidated subsidiaries or any property owned by the Group. For funded plans, investments in passive index tracker funds may entail a proportionate investment in Group-owned financial instruments.
Pension obligations are measured on the basis of actuarial calculations based on country-specific parameters and assumptions. The obligations under defined benefit plans are calculated on the basis of the internationally accepted projected unit credit method, taking account of expected future increases in salaries and pensions.
Actuarial assumptions
30 Sep 2018
Percentage p. a. Germany Great Britain Other countries
Discount rate 1.7 2.8 1.2
Projected future salary increases 2.5 2.8 1.4
Projected future pension increases 1.8 3.4 1.3
30 Sep 2017
Percentage p. a. Germany Great Britain Other countries
Discount rate 1.8 2.6 1.3
Projected future salary increases 2.5 2.8 1.3
Projected future pension increases 1.8 3.4 1.2

214 NOT E S » NoT e S oN T He CoN S ol I DAT e D S TAT e Me N T of f I N A NC I A l p oS I T IoN
The interest rate applicable in discounting the provision for pensions is based on an index for corporate bonds adjusted for securities already downgraded and under observation by rating agencies as well as subordinate bonds in order to meet the criterion for high quality bonds (rated AA or higher) required under IAS 19. In order to cover a correspondingly broad market, an index partly based on shorter-term bonds is used (e. g. iBoxx € Corporates AA 7-10 for the Eurozone). The resulting yield structure is extrapolated on the basis of the yield curves for almost risk-free bonds, taking account of an appropriate risk mark-up reflecting the term of the obligation.
Apart from the parameters described above, a further key assumption relates to life expectancy. In Germany, the Heubeck reference tables 2018 G, as published on 20 July 2018, are used to determine life expectancy. Compared to the Heubeck tables 2005 G used in prior year, the remeasurement amounts to € 11.2 m. In the UK, the S2NxA base tables are used, adjusted to future expected increases on the basis of the Continuous Mortality Investigation (CMI) 2017. Using CMI 2017 adjustments resulted in a decrease in obligations from remeasurements of € 17.1 m compared to CMI 2016 adjustments used in prior year. The pension in payment escalation formulae depend primarily on the pension plan concerned. Apart from fixed rates of increase, there are also a number of inflation-linked pension adjustment mechanisms in different countries.
Based on the currently observable age of retirement of employees of the Group’s German airline, the expected age of retirement used for the calculation of the obligation for these plans was increased in the reported period. Due to this remeasurement the obligation decreased by € 32.9 m compared to the assumption used in prior year.
Changes in the key actuarial assumptions mentioned above would lead to the changes in defined benefit obligations presented below. The methodology used to determine sensitivity corresponds to the method used to calculate the defined benefit obligation. The assumptions were amended in isolation each time; actual interdependencies between the assumptions were not taken into account. The effect of the increase in life expectancy by one year is calculated by means of a reduction in mortality due to the use of the Heubeck tables 2018 G for pension plans in Germany. In the UK, an extra year is added to the life expectancy determined on the basis of the mortality tables.
Sensitivity of the defined benefit obligation due to changed actuarial assumptions
30 Sep 2018 30 Sep 2017
€ million + 50 basis points – 50 Basis points + 50 Basis points – 50 Basis points
Discount rate – 315.1 + 360.3 – 320.8 + 368.2
Salary increase + 17.0 – 15.8 + 26.9 – 25.6
Pension increase + 108.7 – 103.9 + 106.9 – 109.6
+ 1 year + 1 year
Life expectancy + 135.7 – + 142.3 –
The weighted average duration of the defined benefit obligations totalled 19.0 years (previous year 19.5 years) for the overall Group. In the UK, the weighted duration was 19.8 years (previous year 20.7 years), while it stood at 17.4 years (previous year 16.0 years) in Germany.
Fund assets are determined on the basis of the fair values of the funds invested as at 30 September 2018. The interest rate used to determine the interest income from the assets of external funds is identical with the discount rate used for the defined benefit obligation.
For the forthcoming financial year, the companies of TUI Group are expected to contribute around € 113.5 m (previous year € 183.1 m) to pension funds and pay pensions worth € 32.6 m (previous year € 32.7 m) for unfunded plans. The expected employer contribution includes an annual payment of £ 81.0 m agreed with the trustees to reduce the existing coverage shortfall. For funded plans, payments to the recipients are fully made from fund assets so that TUI Group does not record a cash outflow as a result.

215NOT E S » NoT e S oN T H e CoN S ol I DAT e D S TAT e Me N T of f I N A NC I A l p oS I T IoN
TUI Group’s defined benefit plans entail various risks; some of which may have a substantial effect on the Company.
I N V E S T M E N T R I S K
The investment risk plays a major role, in particular for the large funded plans in the UK. Although shares usually outperform bonds in terms of producing higher returns, they also entail stronger volatility of balance sheet items and the risk of short-term shortfalls in coverage. In order to limit this risk, the trustees have built a balanced investment portfolio to limit the concentration of risks.
I N T E R E S T R AT E R I S K
The interest rate influences in particular unfunded schemes in Germany as a decline in interest rates leads to an increase in the defined benefit obligations. Accordingly, an increase in the interest rate leads to a reduction in the defined benefit obligations. Funded plans are less strongly affected by this development as the performance of the interest-bearing assets included in plan assets regularly dampens the effects.
I N F L AT I O N R I S K
An increase in the inflation rate normally increases the obligation in pension schemes linked to the final salary of beneficiaries as inflation causes an increase in the projected salary increases. At the same time, inflation-based pension increases included in the plan also rise. The inflation risk is reduced through the use of caps and collars. Moreover, the large pension funds in the UK hold inflation-linked assets, which also partly reduce the risk from a significant rise in inflation.
L O N G E V I T Y R I S K
An increasing life expectancy increases the expected benefit duration of the pension obligation. This risk is countered by using regularly updated mortality data in calculating the present values of the obligation.
C U R R E N C Y R I S K
For the TUI Group, the pension schemes entail a currency risk as most pension schemes are operated in the UK and therefore denominated in sterling. The risk is limited as the currency effects on the obligation and the assets partly offset each other. The currency risk only relates to any excess of pension obligations over plan assets or vice versa.
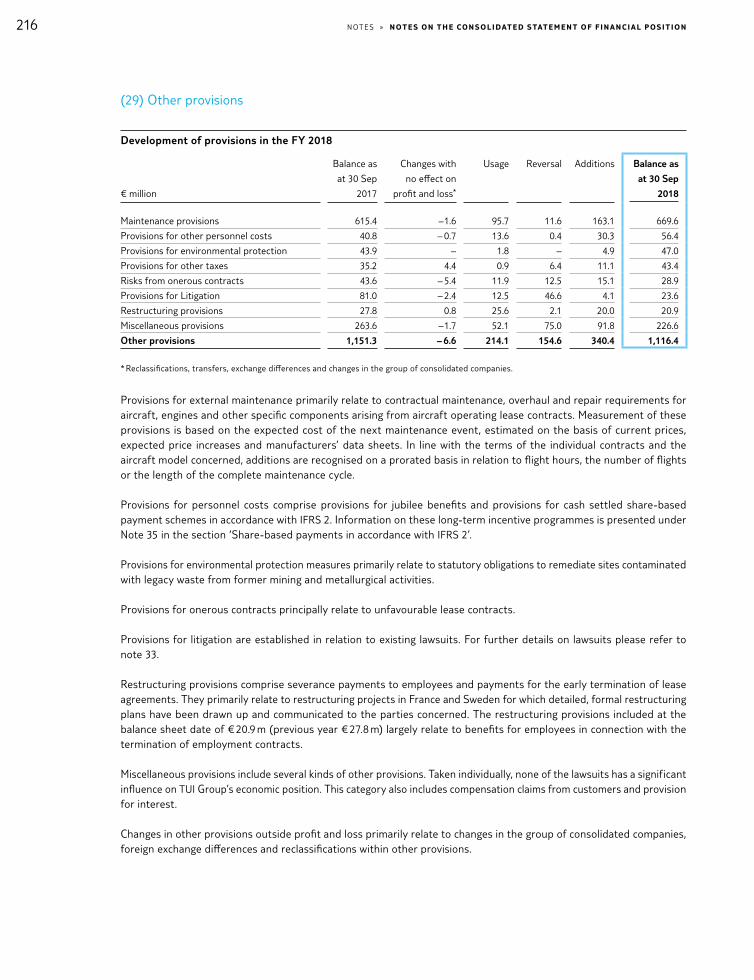
216 NOT E S » NoT e S oN T He CoN S ol I DAT e D S TAT e Me N T of f I N A NC I A l p oS I T IoN
(29) Other provisions
Development of provisions in the FY 2018
€ million
Balance as
at 30 Sep
2017
Changes with
no effect on
profit and loss*
Usage
Reversal
Additions
Balance as
at 30 Sep
2018
Maintenance provisions 615.4 – 1.6 95.7 11.6 163.1 669.6
Provisions for other personnel costs 40.8 – 0.7 13.6 0.4 30.3 56.4
Provisions for environmental protection 43.9 – 1.8 – 4.9 47.0
Provisions for other taxes 35.2 4.4 0.9 6.4 11.1 43.4
Risks from onerous contracts 43.6 – 5.4 11.9 12.5 15.1 28.9
Provisions for Litigation 81.0 – 2.4 12.5 46.6 4.1 23.6
Restructuring provisions 27.8 0.8 25.6 2.1 20.0 20.9
Miscellaneous provisions 263.6 – 1.7 52.1 75.0 91.8 226.6
Other provisions 1,151.3 – 6.6 214.1 154.6 340.4 1,116.4
* Reclassifications, transfers, exchange differences and changes in the group of consolidated companies.
Provisions for external maintenance primarily relate to contractual maintenance, overhaul and repair requirements for aircraft, engines and other specific components arising from aircraft operating lease contracts. Measurement of these provisions is based on the expected cost of the next maintenance event, estimated on the basis of current prices, expected price increases and manufacturers’ data sheets. In line with the terms of the individual contracts and the aircraft model concerned, additions are recognised on a prorated basis in relation to flight hours, the number of flights or the length of the complete maintenance cycle.
Provisions for personnel costs comprise provisions for jubilee benefits and provisions for cash settled share-based payment schemes in accordance with IFRS 2. Information on these long-term incentive programmes is presented under Note 35 in the section ‘Share-based payments in accordance with IFRS 2’.
Provisions for environmental protection measures primarily relate to statutory obligations to remediate sites contaminated with legacy waste from former mining and metallurgical activities.
Provisions for onerous contracts principally relate to unfavourable lease contracts.
Provisions for litigation are established in relation to existing lawsuits. For further details on lawsuits please refer to note 33.
Restructuring provisions comprise severance payments to employees and payments for the early termination of lease agreements. They primarily relate to restructuring projects in France and Sweden for which detailed, formal restructuring plans have been drawn up and communicated to the parties concerned. The restructuring provisions included at the balance sheet date of € 20.9 m (previous year € 27.8 m) largely relate to benefits for employees in connection with the termination of employment contracts.
Miscellaneous provisions include several kinds of other provisions. Taken individually, none of the lawsuits has a significant influence on TUI Group’s economic position. This category also includes compensation claims from customers and provision for interest.
Changes in other provisions outside profit and loss primarily relate to changes in the group of consolidated companies, foreign exchange differences and reclassifications within other provisions.

217NOT E S » NoT e S oN T H e CoN S ol I DAT e D S TAT e Me N T of f I N A NC I A l p oS I T IoN
Where the difference between the present value and the settlement value of a provision is material for the measurement of a non-current provision as at the balance sheet date, the provision is recognised at its present value in accordance with IAS 37. The discount rate to be applied should take account of the specific risks of the liability and of future price increases. This criterion applies to some items contained in TUI Group’s other provisions. Additions to other provisions comprise an interest portion of € 2.2 m (previous year € 3.7 m), recognised as an interest expense.
Terms to maturity of other provisions
30 Sep 2018 30 Sep 2017
€ million
Remaining
term more
than 1 year
Total
Remaining
term more
than 1 year
Total
Maintenance provisions 559.2 669.6 523.5 615.4
Provisions for other personnel costs 38.9 56.4 23.7 40.8
Provisions for environmental protection 43.2 47.0 39.4 43.9
Provisions for other taxes 27.5 43.4 28.6 35.2
Risks from onerous contracts 10.0 28.9 13.4 43.6
Provisions for litigation 5.6 23.6 55.8 81.0
Restructuring provisions 0.2 20.9 0.2 27.8
Miscellaneous provisions 83.5 226.6 116.8 263.6
Other provisions 768.1 1,116.4 801.4 1,151.3
(30) Financial liabilities
Financial liabilities
30 Sep 2018 30 Sep 2017
Remaining term Remaining term
€ millionup to 1 year 1– 5 years more than
5 years
Total up to 1 year 1– 5 years more than
5 years
Total
Bonds – 296.8 – 296.8 – 295.8 – 295.8
Liabilities to banks 64.1 368.6 347.8 780.5 46.2 180.4 154.7 381.3
Liabilities from finance leases 105.2 482.5 755.0 1,342.7 96.2 405.3 725.0 1,226.5
Other financial liabilities 22.9 – – 22.9 29.5 – – 29.5
Total 192.2 1,147.9 1,102.8 2,442.9 171.9 881.5 879.7 1,933.1
Non-current financial liabilities increased year-on-year by € 489.5 m to € 2,250.7 m as at the balance sheet date. This increase was mainly driven by the issuance of a Schuldschein, carried under liabilities to banks. The Schuldschein issued in July 2018 has a value of € 425.0 m, divided into three tranches with tenures of 5 years, 7 years and 10 years. In addition, liabilities from finance leases increased, primarily due to the renewal and modernisation of the aircraft fleet.

218 NOT E S » NoT e S oN T He CoN S ol I DAT e D S TAT e Me N T of f I N A NC I A l p oS I T IoN
Movements financial liabilities
€ million
Bonds
Short-term
liabilities to
banks
Long-term
liabilities to
banks
Finance
Leasing
Other
financial
liabilities
Total
financial
liabilities
Balance as at 1 Oct 2017 295.8 46.2 335.1 1,226.5 29.5 1,933.1
Payment in the period – – 14.1 398.6 – 106.5 – 6.6 271.4
Aquisitions – 8.0 – 1.0 0.7 9.7
Foreign exchange movements – – 2.0 1.9 18.3 0.1 18.3
Other non-cash movement 1.0 26.0 – 19.2 203.3 – 0.7 210.4
Balance as at 30 Sep 2018 296.8 64.1 716.4 1,342.6 23.0 2,442.9
Fair values and carrying amounts of the bonds at 30 Sep 2018
30 Sep 2018 30 Sep 2017
€ million
Issuer
Nominal
value initial
Nominal
value
outstanding
Interest rate
% p. a.
Stock
market
value
Carrying
amount
Stock
market
value
Carrying
amount
2016 / 21
bond TUI AG 300.0 300.0 2.125 311.1 296.8 314.0 295.8
Total 311.1 296.8 314.0 295.8
The fixed-interest bond with a nominal value of € 300.0 m issued in October 2016 has a coupon of 2.125 % p. a. The bond will mature on 26 October 2021. It can be redeemed ahead of its maturity date any time at its value as at the redemption date. In addition, a 100 % redemption option exists on 26 July 2021.

219NOT E S » NoT e S oN T H e CoN S ol I DAT e D S TAT e Me N T of f I N A NC I A l p oS I T IoN
(31) Other liabilities
Other liabilities
30 Sep 2018 30 Sep 2017
Remaining term Remaining term
€ million up to 1 year 1– 5 years Total up to 1 year 1– 5 years Total
Other liabilities relating to employees 255.9 24.2 280.1 238.7 22.8 261.5
Other liabilities relating to social security 51.4 – 51.4 49.4 – 49.4
Other liabilities relating to other taxes 48.0 – 48.0 26.6 – 26.6
Other miscellaneous liabilities 240.3 14.4 254.7 239.4 44.0 283.4
Deferred income 78.8 64.8 143.6 43.9 83.4 127.3
Other liabilities 674.4 103.4 777.8 598.0 150.2 748.2
(32) Contingent liabilities
As at 30 September 2018, contingent liabilities amounted to € 118.7 m (previous year € 156.1 m). Contingent liabilities are reported at an amount representing the best estimate of the potential expenditure that would be required to meet the potential obligation as at the balance sheet date. Contingent liabilities as at 30 September 2018 are mainly attributable to the granting of guarantees for the benefit of hotel activities. The decline of € 37.4 m as against 30 September 2017 mainly results from the return of all guarantees given for the benefit of TUI Cruises GmbH.
(33) Litigation
TUI AG and its subsidiaries are involved in several pending or foreseeable court or arbitration proceedings, which do not have a significant impact on their economic position as at 30 September 2018 or future periods. This also applies to actions claiming warranty, repayment or any other compensation in connection with the divestment of subsidiaries and business units over the past few years. As in previous years, the Group recognised adequate provisions, partly covered by expected insurance benefits, to cover all probable financial charges from court or arbitration proceedings.

220 NOT E S » NoT e S oN T He CoN S ol I DAT e D S TAT e Me N T of f I N A NC I A l p oS I T IoN
(34) Other financial commitments
Financial commitments from operating lease and rental contracts
30 Sep 2018 30 Sep 2017
Remaining term Remaining term
€ million
up to
1 year
1 – 5
years
5 – 10
years
more than
10 years
Total up to
1 year
1 – 5
years
5 – 10
years
more than
10 years
Total
Aircraft 383.4 919.4 228.5 15.8 1,547.1 365.2 866.2 229.7 – 1,461.1
Hotel complexes 229.8 353.0 83.0 9.4 675.2 237.9 413.6 66.9 10.0 728.4
Travel agencies 63.2 120.3 24.0 4.8 212.3 62.8 117.3 28.7 8.3 217.1
Administrative
buildings 40.3 113.9 53.6 36.2 244.0 37.2 102.1 54.2 40.3 233.8
Ships, Yachts and
Motorboats 1.0 – – – 1.0 27.1 2.1 – – 29.2
Other 28.9 43.4 7.3 51.7 131.3 20.3 27.4 8.7 51.4 107.8
Total 746.6 1,550.0 396.4 117.9 2,810.9 750.5 1,528.7 388.2 110.0 2,777.4
The commitments from lease, rental and charter agreements exclusively relate to leases that do not transfer all risks and rewards of ownership of the assets to the TUI Group companies in accordance with IFRS rules (operating leases). The average basic lease term is around 9 years.
The increase in commitments against 30 September 2017 is driven by an increase in lease obligations for aircraft. New aircraft lease commitments and extensions to existing arrangements more than off-set lease payments made in the financial year. Off-setting the increase are lower hotel commitments as a result of fewer extensions. A further decrease was driven by foreign exchange effects for liabilities denominated in Turkish lira.
The expected payments to be received from non-cancellable sublease contracts for aircraft are shown in the following table:
Expected minimum lease payments from operating lease contracts
30 Sep 2018 30 Sep 2017
Remaining term Remaining term
€ million
up to 1 year 1– 5 years more than
5 years
Total up to 1 year 1– 5 years more than
5 years
Total
Aircraft 32.3 56.9 51.5 140.7 28.0 63.6 58.9 150.5
Order commitments in respect of capital expenditure and other financial commitments
30 Sep 2018 30 Sep 2017
Remaining term Remaining term
€ million
up to 1 year 1– 5 years more than
5 years
Total up to 1 year 1– 5 years more than
5 years
Total
Order commitments
in respect of capital
expenditure 1,092.1 2,480.9 310.3 3,883.3 733.0 2,769.4 662.1 4,164.5
Other financial commitments 52.2 18.0 – 70.2 49.6 46.3 – 95.9
Total 1,144.3 2,498.9 310.3 3,953.5 782.6 2,815.7 662.1 4,260.4

221NOT E S » NoT e S oN T H e CoN S ol I DAT e D S TAT e Me N T of f I N A NC I A l p oS I T IoN
Order commitments in respect of capital expenditure relate almost exclusively to tourism and decreased by € 281.2 m year-on-year as at 30 September 2018. This was due to various factors including the delivery of Marella Explorer and additional aircraft. Further declines resulted from additional advance payments for aircraft and aircraft equipment, which were partly offset by new order commitments for cruise ships and new commitments for hotel projects.
(35) Share-based payments in accordance with IFRS 2
As at 30 September 2018, all existing awards except the employee share program oneShare are recognized as cash-settled share-based payment schemes.
The following share-based payment schemes are in effect within TUI Group as at 30 September 2018.
L O N G T E R M I N C E N T I V E P L A N W I T H E A R N I N G S - P E R - S H A R E P E R F O R M A N C E M E A S U R E ( LT I P E P S )
The long-term incentive programme for Board members is based on phantom shares. In each financial year, a new period of performance measurement commences, spanning the current plus the following three financial years. As a result, each performance measurement period has a general term of four years. All Board members have their individual target amount defined in their service contract. At the beginning of each performance measurement period, this target amount is translated into phantom shares based on the average price of TUI AG shares (‘preliminary number of phantom shares’). The average share price is calculated based on the share prices during the 20 trading days prior to the beginning of any financial year. The entitlement under the long-term incentive programme arises upon completion of the four-year performance period.
Upon the completion of the four-year performance period, the preliminary number of phantom shares is multiplied by the degree of target achievement.
50 % of this degree of target achievement is determined by comparing the total shareholder return (TSR) achieved by TUI Group with the TSR of companies listed in the ‘Dow Jones Stoxx 600 Travel & Leisure’ index. If the TUI Group TSR is below the median value, the target achievement is 0 %. If the TUI Group TSR is equal to the median value, target achievement is 100 %. If the TUI Group TSR is the maximum value in the comparison, the target achievement equals 175 %.
The remaining 50 % of the degree of target achievement is based on the average pro forma underlying earning per share (LTIP relevant EPS) growth of TUI Group in the four-year performance period. An average EPS growth of less than 3 % results in a target achievement of 0 %. An average EPS growth of 3 % results in a target achievement of 25 %, an average EPS growth of 5 % in a target achievement of 100 % and an average EPS growth of at least 10 % results in 175 % target achievement. The target achievement percentages between 3 % and 5 % and between 5 % and 10 % are calculated on a straight line basis.
At the end of the four-year performance period, the average degree of target achievement of both performance measures above is calculated and multiplied with the number of preliminary phantom shares. The number of phantom shares determined this way is multiplied by the average price (20 trading days) of TUI AG shares, and the resulting amount is paid out in cash. The maximum amount payable under the long-term incentive programme has been capped for each individual.
If the conditions mentioned above are met, upon expiry of the performance period, the awards are automatically exercised. If the conditions are not met, the awards are forfeited. The service period will be restricted to the end of the employment period if plan participants leave the Company, as long as employment is not terminated due to a significant reason within the sphere of responsibility of the participant or by the participant without cause.
L O N G T E R M I N C E N T I V E P L A N W I T H O U T E A R N I N G S - P E R - S H A R E P E R F O R M A N C E M E A S U R E ( LT I P )
The EPS performance measurement described above was added to the formerly labeled ‘Multi-Annual bonus payment’ LTIP scheme in the FY 2018. Before 2018, and for certain Board members also during 2018, the LTIP without the EPS performance measure was in effect. The phantom shares awarded under the original LTIP scheme remain in effect and will vest according to the original plan conditions. 100 % of the target achievement is therefore determined by the the TUI AG TSR performance measure.
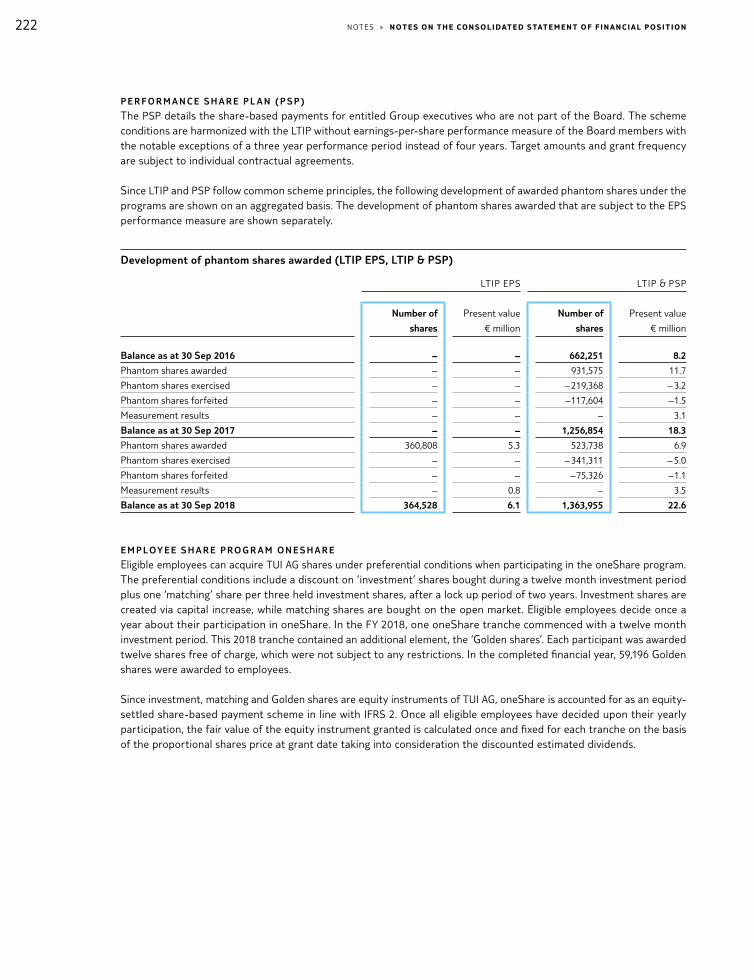
222 NOT E S » NoT e S oN T He CoN S ol I DAT e D S TAT e Me N T of f I N A NC I A l p oS I T IoN
P E R F O R M A N C E S H A R E P L A N ( P S P )
The PSP details the share-based payments for entitled Group executives who are not part of the Board. The scheme conditions are harmonized with the LTIP without earnings-per-share performance measure of the Board members with the notable exceptions of a three year performance period instead of four years. Target amounts and grant frequency are subject to individual contractual agreements.
Since LTIP and PSP follow common scheme principles, the following development of awarded phantom shares under the programs are shown on an aggregated basis. The development of phantom shares awarded that are subject to the EPS performance measure are shown separately.
Development of phantom shares awarded (LTIP EPS, LTIP & PSP)
LTIP EPS LTIP & PSP
Number of
shares
Present value
€ million
Number of
shares
Present value
€ million
Balance as at 30 Sep 2016 – – 662,251 8.2
Phantom shares awarded – – 931,575 11.7
Phantom shares exercised – – – 219,368 – 3.2
Phantom shares forfeited – – – 117,604 – 1.5
Measurement results – – – 3.1
Balance as at 30 Sep 2017 – – 1,256,854 18.3
Phantom shares awarded 360,808 5.3 523,738 6.9
Phantom shares exercised – – – 341,311 – 5.0
Phantom shares forfeited – – – 75,326 – 1.1
Measurement results – 0.8 – 3.5
Balance as at 30 Sep 2018 364,528 6.1 1,363,955 22.6
E M P L OY E E S H A R E P R O G R A M O N E S H A R E
Eligible employees can acquire TUI AG shares under preferential conditions when participating in the oneShare program. The preferential conditions include a discount on ‘investment’ shares bought during a twelve month investment period plus one ‘matching’ share per three held investment shares, after a lock up period of two years. Investment shares are created via capital increase, while matching shares are bought on the open market. Eligible employees decide once a year about their participation in oneShare. In the FY 2018, one oneShare tranche commenced with a twelve month investment period. This 2018 tranche contained an additional element, the ‘Golden shares’. Each participant was awarded twelve shares free of charge, which were not subject to any restrictions. In the completed financial year, 59,196 Golden shares were awarded to employees.
Since investment, matching and Golden shares are equity instruments of TUI AG, oneShare is accounted for as an equity- settled share-based payment scheme in line with IFRS 2. Once all eligible employees have decided upon their yearly participation, the fair value of the equity instrument granted is calculated once and fixed for each tranche on the basis of the proportional shares price at grant date taking into consideration the discounted estimated dividends.
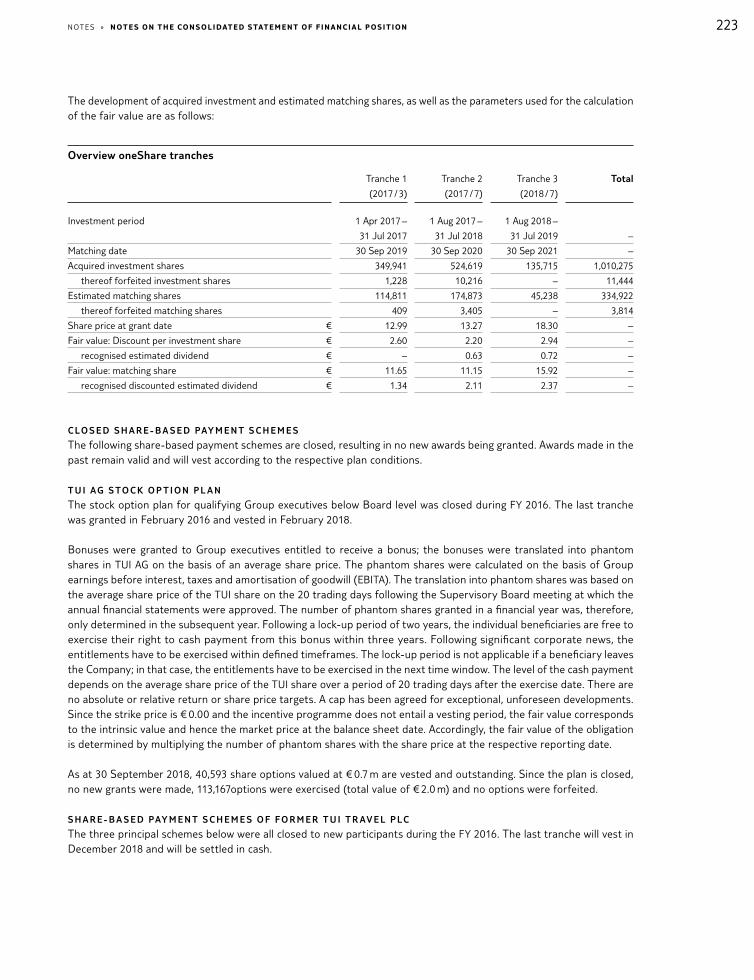
223NOT E S » NoT e S oN T H e CoN S ol I DAT e D S TAT e Me N T of f I N A NC I A l p oS I T IoN
The development of acquired investment and estimated matching shares, as well as the parameters used for the calculation of the fair value are as follows:
Overview oneShare tranches
Tranche 1
(2017 / 3)
Tranche 2
(2017 / 7)
Tranche 3
(2018 / 7)
Total
Investment period 1 Apr 2017 –
31 Jul 2017
1 Aug 2017 –
31 Jul 2018
1 Aug 2018 –
31 Jul 2019 –
Matching date 30 Sep 2019 30 Sep 2020 30 Sep 2021 –
Acquired investment shares 349,941 524,619 135,715 1,010,275
thereof forfeited investment shares 1,228 10,216 – 11,444
Estimated matching shares 114,811 174,873 45,238 334,922
thereof forfeited matching shares 409 3,405 – 3,814
Share price at grant date € 12.99 13.27 18.30 –
Fair value: Discount per investment share € 2.60 2.20 2.94 –
recognised estimated dividend € – 0.63 0.72 –
Fair value: matching share € 11.65 11.15 15.92 –
recognised discounted estimated dividend € 1.34 2.11 2.37 –
C L O S E D S H A R E - B A S E D PAY M E N T S C H E M E S
The following share-based payment schemes are closed, resulting in no new awards being granted. Awards made in the past remain valid and will vest according to the respective plan conditions.
T U I AG S TO C K O P T I O N P L A N
The stock option plan for qualifying Group executives below Board level was closed during FY 2016. The last tranche was granted in February 2016 and vested in February 2018.
Bonuses were granted to Group executives entitled to receive a bonus; the bonuses were translated into phantom shares in TUI AG on the basis of an average share price. The phantom shares were calculated on the basis of Group earnings before interest, taxes and amortisation of goodwill (EBITA). The translation into phantom shares was based on the average share price of the TUI share on the 20 trading days following the Supervisory Board meeting at which the annual financial statements were approved. The number of phantom shares granted in a financial year was, therefore, only determined in the subsequent year. Following a lock-up period of two years, the individual beneficiaries are free to exercise their right to cash payment from this bonus within three years. Following significant corporate news, the entitlements have to be exercised within defined timeframes. The lock-up period is not applicable if a beneficiary leaves the Company; in that case, the entitlements have to be exercised in the next time window. The level of the cash payment depends on the average share price of the TUI share over a period of 20 trading days after the exercise date. There are no absolute or relative return or share price targets. A cap has been agreed for exceptional, unforeseen developments. Since the strike price is € 0.00 and the incentive programme does not entail a vesting period, the fair value corresponds to the intrinsic value and hence the market price at the balance sheet date. Accordingly, the fair value of the obligation is determined by multiplying the number of phantom shares with the share price at the respective reporting date.
As at 30 September 2018, 40,593 share options valued at € 0.7 m are vested and outstanding. Since the plan is closed, no new grants were made, 113,167options were exercised (total value of € 2.0 m) and no options were forfeited.
S H A R E - B A S E D PAY M E N T S C H E M E S O F F O R M E R T U I T R AV E L P L C
The three principal schemes below were all closed to new participants during the FY 2016. The last tranche will vest in December 2018 and will be settled in cash.

224 NOT E S » NoT e S oN T He CoN S ol I DAT e D S TAT e Me N T of f I N A NC I A l p oS I T IoN
The share option awards of these remuneration schemes will only vest if the average annual return on invested capital (ROIC) is at least equal to the average weighted average cost of capital (WACC) over a period of three years. If this condition is fulfilled, the number of vesting awards is determined as a function of the fulfilment of the following performance conditions.
P E R F O R M A N C E S H A R E P L A N ( P S P )
Up to 50 % of these awards granted will vest based on growth in the Group’s reported earnings per share (EPS) relative to the UK Retail Price Index. Up to 25 % of the awards will vest based on the Group’s total shareholder return (TSR) performance relative to an average of the TSR performance of an index of other capital market-orientated travel and tourism companies. Likewise, up to 25 % of the awards vest if the Group’s average return on invested capital (ROIC) meets predefined targets.
D E F E R R E D A N N UA L B O N U S S C H E M E ( DA B S )
The awards granted under this scheme vest upon completion of a three-year period at the earliest. Up to 50 % of the granted awards will vest based on growth in earnings per share (EPS) relative to the UK Retail Price Index (RPI). 25 % of the awards will vest based on total shareholder return (TSR) performance relative to the TSR performance of other capital market-oriented travel and tourism companies. Likewise, up to 25 % of the awards will vest if the average return on invested capital (ROIC) meets certain targets.
D E F E R R E D A N N UA L B O N U S L O N G -T E R M I N C E N T I V E S C H E M E ( DA B L I S )
The Deferred Annual Bonus Long-Term Incentive Scheme (DABLIS), for executive staff (except for the Executive Board) requires a 25 % conversion of any annual variable compensation into share options. Some eligible staff have been awarded further (matching) share option awards as additional bonuses. Matching share options are limited to four times the converted amount. The earliest point for the share options to be eligible for release is at the end of a three-year period. Up to 50 % of the awards will vest based on achievement of certain EBITA targets. Up to 25 % of awards will vest based on the earnings per share (EPS) performance relative to the UK Retail Price Index and up to 25 % based on the total shareholder return (TSR) performance in relation to the TSR performance of other capital market-oriented travel and tourism companies.
The development of awards schemes granted under DABLIS and the closed TUI Travel PLC PSP and the former DABS is as follows:
Development of phantom shares options awarded (DABS, DABLIS & TUI Travel PLC PSP)
Number of shares Present value
€ million
Balance as at 30 Sep 2016 1,739,933 22.2
Phantom share options exercised – 171,351 – 2.2
Phantom share options forfeited – 210,912 – 2.7
Measurement results – 2.2
Balance as at 30 Sep 2017 1,357,670 19.5
Phantom share options exercised – 800,668 – 12.8
Phantom share options forfeited – 174,654 – 2.9
Measurement results – 2.4
Balance as at 30 Sep 2018 382,348 6.2
The weighted average TUI AG share price was € 15.93 at exercise date (previous year € 12.32).

225NOT E S » NoT e S oN T H e CoN S ol I DAT e D S TAT e Me N T of f I N A NC I A l p oS I T IoN
ACCO U N T I N G F O R S H A R E - B A S E D PAY M E N T S C H E M E S
As at 30 September 2018, all existing awards except oneShare are recognized as cash-settled share-based payment schemes and are granted with an exercise price of € 0.00. The personnel expense is recognized upon actual delivery of service according to IFRS 2 and is, therefore, spread over a period of time. According to IFRS 2, all contractually granted entitlements have to be accounted for, irrespective of whether and when they are actually awarded. Accordingly, phantom shares granted in the past are charged on a pro rata basis upon actual delivery of service.
In the FY 2018, personnel expenses due to cash-settled share-based payment schemes of € 18.2 m (previous year € 11.1 m) were recognised through profit and loss.
In the FY 2018, personnel expenses due to equity-settled share-based payment schemes of € 4.3 m (previous year € 1.9 m) were recognised through profit and loss.
As at 30 September 2018, provisions relating to entitlements under these long-term incentive programmes totaled € 34.2 m and further € 4.1 m were included as liabilities (previous year provisions of € 32.9 m and € 1.6 m liabilities).
(36) Financial instruments
R I S K S A N D R I S K M A N AG E M E N T
R I S K M A N AG E M E N T P R I N C I P L E S
Due to the nature of its business operations, the TUI Group is exposed to various financial risks, including market risks (consisting of currency risks, interest rate risks and market price risks), credit risks and liquidity risks.
In accordance with the Group’s financial goals, financial risks have to be mitigated. In order to achieve this, policies and procedures have been developed to manage risk associated with financial transactions undertaken.
The rules, responsibilities and processes as well as limits for transactions and risk positions have been defined in policies. The trading, processing and control have been segregated in functional and organisational terms. Compliance with the policies and limits is continually monitored. All hedges by the TUI Group are consistently based on recognised or forecasted underlying transactions. Standard software is used for assessing, monitoring, reporting, documenting and reviewing the effectiveness of the hedging relationships for the hedges entered into. In this context, the fair values of all derivative financial instruments determined on the basis of the Group’s own systems are regularly compared with the fair value confirmations from the external counterparties. The processes, the methods applied and the organisation of risk management are reviewed for compliance with the relevant regulations on at least an annual basis by the internal audit department and external auditors.
Within the TUI Group, financial risks primarily arise from cash flows in foreign currencies, fuel requirements ( jet fuel and bunker oil) and financing via the money and capital markets. In order to limit the risks from changes in exchange rates, market prices and interest rates for underlying transactions, the TUI Group uses over-the-counter derivative financial instruments. These are primarily fixed-price transactions. In addition, the TUI Group also uses options and structured products. Use of derivative financial instruments is confined to internally fixed limits and other policies. The transactions are concluded on an arm’s length basis with counterparties operating in the financial sector, whose counterparty risk is regularly monitored. Foreign exchange translation risks from the consolidation of Group companies not preparing their accounts in euros are not hedged.
M A R K E T R I S K
Market risks result in fluctuations in earnings, equity and cash flows. Risks arising from input cost volatility are more fully detailed in the risk report section of the management report. In order to limit or eliminate these risks, the TUI Group has developed various hedging strategies, including the use of derivative financial instruments.

226 NOT E S » NoT e S oN T He CoN S ol I DAT e D S TAT e Me N T of f I N A NC I A l p oS I T IoN
IFRS 7 requires the presentation of a sensitivity analysis showing the effects of hypothetical changes in relevant market risk variables on profit or loss and equity. The effects for the period are determined by relating the hypothetical changes in risk variables to the portfolio of primary and derivative financial instruments as at the balance sheet date. It is assured that the portfolio of financial instruments as at the balance sheet date is representative for the entire financial year.
The analyses of the TUI Group’s risk reduction activities outlined below and the amounts determined using sensitivity analyses represent hypothetical and thus uncertain risks. Due to unforeseeable developments in the global financial markets, actual results may deviate substantially from the disclosures provided. The risk analysis methods used must not be considered a projection of future events or losses, since the TUI Group is also exposed to risks of a non-financial or non-quantifiable nature. These risks primarily include sovereign, business and legal risks not covered by the following presentation of risks.
C U R R E N C Y R I S K
The business operations of the TUI Group’s companies generate payments or receipts denominated in foreign currencies, which are not always matched by payments or receipts with equivalent terms in the same currency. Using potential netting effects (netting of payments made and received in the same currency with identical or similar terms), the TUI Group enters into appropriate hedges with external counterparties in order to protect its profit margin from exchange rate-related fluctuations.
Within the TUI Group, risks from exchange rate fluctuations are hedged, with the largest hedging volumes relating to US dollars, euros and pound sterling. The Eurozone limits the currency risk from transactions in the key tourist destinations to Group companies whose functional currency is not the euro. The tourism business operations are mainly affected by changes in the value of the US dollar and the euro, the latter predominantly affecting the TUI tour operators in the UK and the Nordic countries. In tourism operations, payments in US dollars primarily relate to the procurement of services in non-European destinations, purchases of jet and ship fuel and aircraft and cruise ship purchases or charter.
The tourism companies use financial derivatives to hedge their planned foreign exchange requirements. They aim to cover 80 % to 100 % of the planned currency requirements at the beginning of the tourism season. In this regard, account is taken of the different risk profiles of the TUI Group companies. The hedged currency volumes are adjusted in line with changes in planned requirements based on reporting by business units.
Currency risks within the meaning of IFRS 7 arise from primary and derivative monetary financial instruments issued in a currency other than the functional currency of a company. Exchange rate-related differences from the translation of financial statements into the Group’s presentation currency are not taken into account. Taking account of the different functional currencies within the TUI Group, the sensitivity analyses of the currencies identified as relevant risk variables are presented below. A 10 % strengthening or weakening of the respective functional currencies, primarily euro and pound sterling, against the other currencies would cause the following effects on the revaluation reserve and earnings after income tax:

227NOT E S » NoT e S oN T H e CoN S ol I DAT e D S TAT e Me N T of f I N A NC I A l p oS I T IoN
Sensitivity analysis – currency risk
€ million30 Sep 2018 30 Sep 2017
Variable: Foreign exchange rate + 10 % – 10 % + 10 % – 10 %
Exchange rates of key currencies
€ / US dollar
Revaluation reserve – 142.5 + 144.3 – 108.3 + 109.4
Earnings after income taxes – 20.8 + 23.0 – 2.3 + 0.9
Pound sterling / €
Revaluation reserve + 205.3 – 201.8 + 197.4 – 190.9
Earnings after income taxes + 49.6 – 46.7 – 8.9 – 2.2
Pound sterling / US dollar
Revaluation reserve – 20.9 + 17.7 – 138.9 + 133.4
Earnings after income taxes + 17.3 – 14.1 + 18.8 – 13.3
€ / Swedish krona
Revaluation reserve + 30.2 – 30.2 + 31.7 – 31.7
Earnings after income taxes – – – –
I N T E R E S T R AT E R I S K
The TUI Group is exposed to interest rate risks from floating-rate primary and derivative financial instruments. Where interest-driven cash flows of floating-rate primary financial instruments are converted into fixed cash flows using derivative hedges and the critical terms of the hedging transaction are the same as those of the hedged items they are not exposed to an interest rate risk. No interest rate risk exists for fixed-interest financial instruments carried at amortised cost.
Changes in market interest rates mainly impact floating-rate primary financial instruments and derivative financial instruments entered into in order to reduce interest-induced cashflow fluctuations.
The table below presents the equity and earnings effects of an assumed increase or decrease in the market interest rate of 50 base points as at the balance sheet date.
Sensitivity analysis – interest rate risk
€ million30 Sep 2018 30 Sep 2017
Variable: Interest rate level for
floating interest-bearing debt
+ 50 basis
points
– 50 basis
points
+ 50 basis
points
– 50 basis
points
Revaluation reserve + 12.6 – 12.0 + 2.9 – 2.9
Earnings after income taxes + 1.5 – 1.5 + 2.4 – 2.4
F U E L P R I C E R I S K
Due to the nature of its business operations, the TUI Group is exposed to market price risks from the purchase of fuel, both for the aircraft fleet and the cruise ships.
The tourism companies use financial derivatives to hedge their exposure to market price risks for the planned consumption of fuel. At the beginning of the touristic season the target hedging ratio is at least 80 %. The different risk profiles of the Group companies operating in different source markets are taken into account, including the possibility of levying fuel surcharges. The hedging volumes are adjusted for changes in planned consumption as identified by the Group companies.
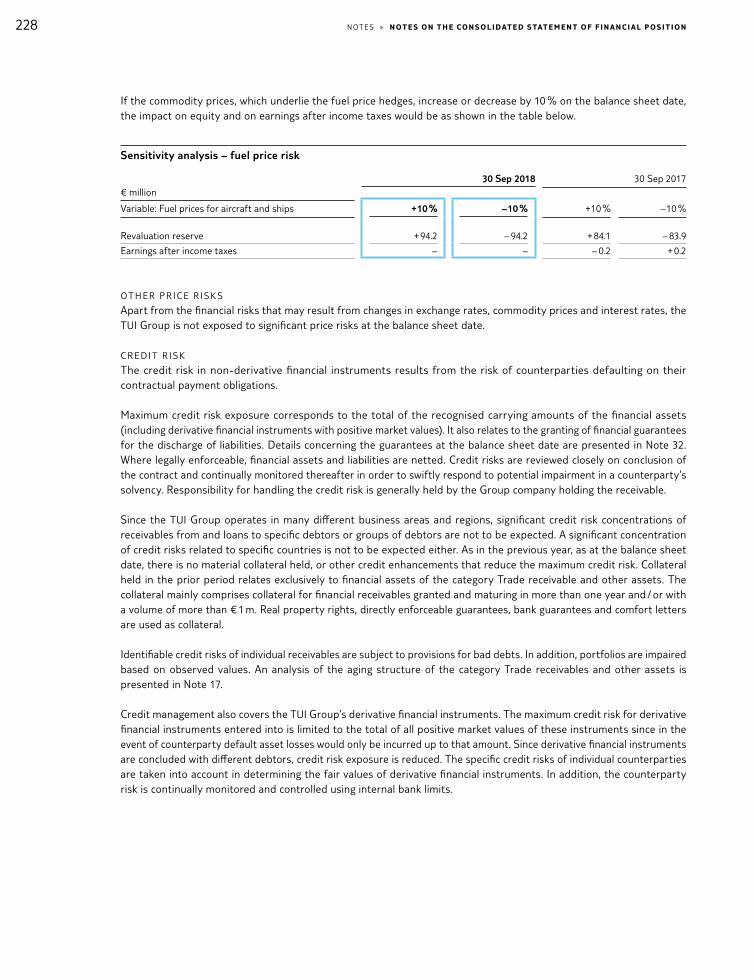
228 NOT E S » NoT e S oN T He CoN S ol I DAT e D S TAT e Me N T of f I N A NC I A l p oS I T IoN
If the commodity prices, which underlie the fuel price hedges, increase or decrease by 10 % on the balance sheet date, the impact on equity and on earnings after income taxes would be as shown in the table below.
Sensitivity analysis – fuel price risk
€ million30 Sep 2018 30 Sep 2017
Variable: Fuel prices for aircraft and ships + 10 % – 10 % + 10 % – 10 %
Revaluation reserve + 94.2 – 94.2 + 84.1 – 83.9
Earnings after income taxes – – – 0.2 + 0.2
OT H E R P R I C E R I S K S
Apart from the financial risks that may result from changes in exchange rates, commodity prices and interest rates, the TUI Group is not exposed to significant price risks at the balance sheet date.
C R E D I T R I S K
The credit risk in non-derivative financial instruments results from the risk of counterparties defaulting on their contractual payment obligations.
Maximum credit risk exposure corresponds to the total of the recognised carrying amounts of the financial assets (including derivative financial instruments with positive market values). It also relates to the granting of financial guarantees for the discharge of liabilities. Details concerning the guarantees at the balance sheet date are presented in Note 32. Where legally enforceable, financial assets and liabilities are netted. Credit risks are reviewed closely on conclusion of the contract and continually monitored thereafter in order to swiftly respond to potential impairment in a counterparty’s solvency. Responsibility for handling the credit risk is generally held by the Group company holding the receivable.
Since the TUI Group operates in many different business areas and regions, significant credit risk concentrations of receivables from and loans to specific debtors or groups of debtors are not to be expected. A significant concentration of credit risks related to specific countries is not to be expected either. As in the previous year, as at the balance sheet date, there is no material collateral held, or other credit enhancements that reduce the maximum credit risk. Collateral held in the prior period relates exclusively to financial assets of the category Trade receivable and other assets. The collateral mainly comprises collateral for financial receivables granted and maturing in more than one year and / or with a volume of more than € 1 m. Real property rights, directly enforceable guarantees, bank guarantees and comfort letters are used as collateral.
Identifiable credit risks of individual receivables are subject to provisions for bad debts. In addition, portfolios are impaired based on observed values. An analysis of the aging structure of the category Trade receivables and other assets is presented in Note 17.
Credit management also covers the TUI Group’s derivative financial instruments. The maximum credit risk for derivative financial instruments entered into is limited to the total of all positive market values of these instruments since in the event of counterparty default asset losses would only be incurred up to that amount. Since derivative financial instruments are concluded with different debtors, credit risk exposure is reduced. The specific credit risks of individual counterparties are taken into account in determining the fair values of derivative financial instruments. In addition, the counterparty risk is continually monitored and controlled using internal bank limits.
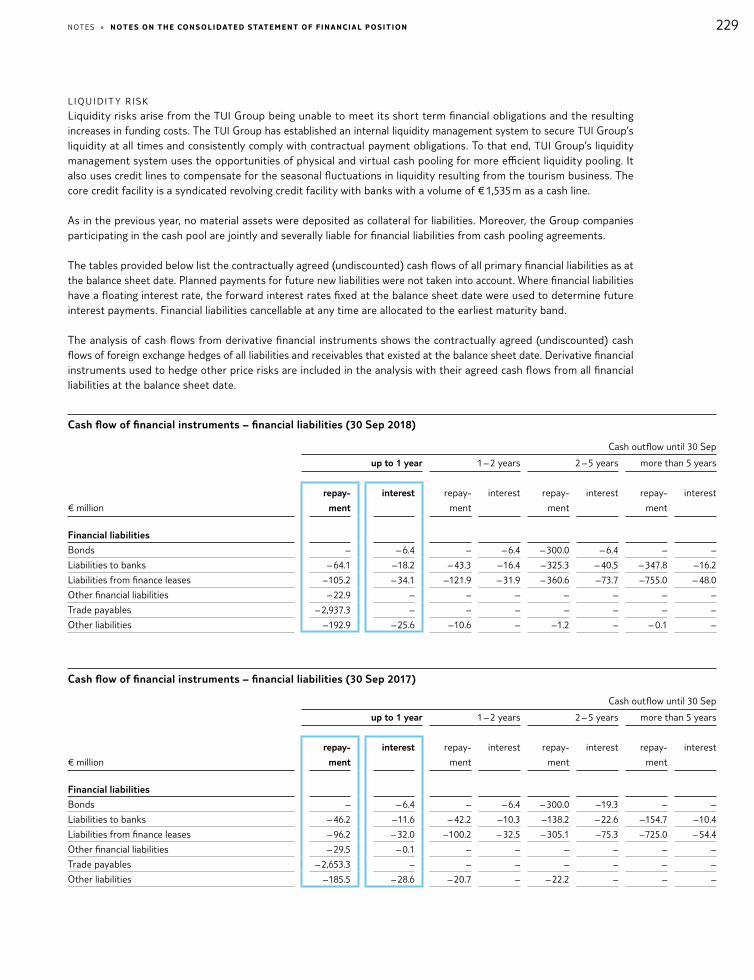
229NOT E S » NoT e S oN T H e CoN S ol I DAT e D S TAT e Me N T of f I N A NC I A l p oS I T IoN
L I Q U I D I T Y R I S K
Liquidity risks arise from the TUI Group being unable to meet its short term financial obligations and the resulting increases in funding costs. The TUI Group has established an internal liquidity management system to secure TUI Group’s liquidity at all times and consistently comply with contractual payment obligations. To that end, TUI Group’s liquidity management system uses the opportunities of physical and virtual cash pooling for more efficient liquidity pooling. It also uses credit lines to compensate for the seasonal fluctuations in liquidity resulting from the tourism business. The core credit facility is a syndicated revolving credit facility with banks with a volume of € 1,535 m as a cash line.
As in the previous year, no material assets were deposited as collateral for liabilities. Moreover, the Group companies participating in the cash pool are jointly and severally liable for financial liabilities from cash pooling agreements.
The tables provided below list the contractually agreed (undiscounted) cash flows of all primary financial liabilities as at the balance sheet date. Planned payments for future new liabilities were not taken into account. Where financial liabilities have a floating interest rate, the forward interest rates fixed at the balance sheet date were used to determine future interest payments. Financial liabilities cancellable at any time are allocated to the earliest maturity band.
The analysis of cash flows from derivative financial instruments shows the contractually agreed (undiscounted) cash flows of foreign exchange hedges of all liabilities and receivables that existed at the balance sheet date. Derivative financial instruments used to hedge other price risks are included in the analysis with their agreed cash flows from all financial liabilities at the balance sheet date.
Cash flow of financial instruments – financial liabilities (30 Sep 2018)
Cash outflow until 30 Sep
up to 1 year 1 – 2 years 2 – 5 years more than 5 years
€ million
repay-
ment
interest repay-
ment
interest repay-
ment
interest repay-
ment
interest
Financial liabilities
Bonds – – 6.4 – – 6.4 – 300.0 – 6.4 – –
Liabilities to banks – 64.1 – 18.2 – 43.3 – 16.4 – 325.3 – 40.5 – 347.8 – 16.2
Liabilities from finance leases – 105.2 – 34.1 – 121.9 – 31.9 – 360.6 – 73.7 – 755.0 – 48.0
Other financial liabilities – 22.9 – – – – – – –
Trade payables – 2,937.3 – – – – – – –
Other liabilities – 192.9 – 25.6 – 10.6 – – 1.2 – – 0.1 –
Cash flow of financial instruments – financial liabilities (30 Sep 2017)
Cash outflow until 30 Sep
up to 1 year 1 – 2 years 2 – 5 years more than 5 years
€ million
repay-
ment
interest repay-
ment
interest repay-
ment
interest repay-
ment
interest
Financial liabilities
Bonds – – 6.4 – – 6.4 – 300.0 – 19.3 – –
Liabilities to banks – 46.2 – 11.6 – 42.2 – 10.3 – 138.2 – 22.6 – 154.7 – 10.4
Liabilities from finance leases – 96.2 – 32.0 – 100.2 – 32.5 – 305.1 – 75.3 – 725.0 – 54.4
Other financial liabilities – 29.5 – 0.1 – – – – – –
Trade payables – 2,653.3 – – – – – – –
Other liabilities – 185.5 – 28.6 – 20.7 – – 22.2 – – –

230 NOT E S » NoT e S oN T He CoN S ol I DAT e D S TAT e Me N T of f I N A NC I A l p oS I T IoN
Cash flow of derivative financial instruments (30 Sep 2018)
Cash in- / outflow until 30 Sep
€ million
up to 1 year 1 – 2 years 2 – 5 years more than
5 years
Derivative financial instruments
Hedging transactions – inflows + 7,889.8 + 1,470.5 + 73.5 + 0.8
Hedging transactions – outflows – 7,709.7 – 1,423.5 – 66.7 – 1.4
Other derivative financial instruments – inflows + 2,274.8 + 90.8 – –
Other derivative financial instruments – outflows – 2,280.9 – 90.4 – –
Cash flow of derivative financial instruments (30 Sep 2017)
Cash in- / outflow until 30 Sep
€ million
up to 1 year 1 – 2 years 2 – 5 years more than
5 years
Derivative financial instruments
Hedging transactions – inflows + 6,449.2 + 1,621.7 + 196.3 –
Hedging transactions – outflows – 6,487.6 – 1,602.5 – 198.8 – 0.7
Other derivative financial instruments – inflows + 1,108.9 + 127.0 + 12.2 –
Other derivative financial instruments – outflows – 1,108.2 – 123.2 – 12.2 –
For further information for hedging strategies and risk management see also the remarks in the Risk Report section of the Management Report.
D E R I VAT I V E F I N A N C I A L I N S T R U M E N T S A N D H E D G E S
S T R AT E G Y A N D G O A L S
In accordance with the TUI Group’s policy, derivatives are allowed to be used if they are based on underlying recognised assets or liabilities, firm commitments or forecast transactions. Hedge accounting based on the rules of IAS 39 is applied to forecasted transactions. In the completed financial year, hedges consisted of cash flow hedges.
Derivative financial instruments in the form of fixed-price transactions and options as well as structured products are used to limit currency, interest rate and fuel risks.
C A S H F LO W H E D G E S
As at 30 September 2018, hedges existed to manage cash flows in foreign currencies with maturities of up to four years (previous year up to four years). The fuel price hedges had terms of up to four years (previous year up to four years). Hedges to protect variable interest payment obligations have terms of up to thirteen years (previous year up to fourteen years). The impact on profit or loss for the period is at the time the expected cash inflow / outflow occurs.
In accounting for cash flow hedges, the effective portion of the cumulative change in market value is carried in the revaluation reserve outside profit and loss until the hedged item occurs. It is recognised in the income statement through profit and loss when the hedged item is executed. In the completed financial year, expenses of € 177.6 m (previous year income of € 371.8 m) for currency hedges and derivative financial instruments used as price hedges were carried in the cost of sales. As in the previous year, there was no result from interest rate hedges. Expenses of € 2.5 m (previous year expenses of € 4.5 m) were recognised for the ineffective portion of the cash flow hedges.

231NOT E S » NoT e S oN T H e CoN S ol I DAT e D S TAT e Me N T of f I N A NC I A l p oS I T IoN
Nominal amounts of derivative financial instruments used
30 Sep 2018 30 Sep 2017
Remaining term Remaining term
€ million
up to
1 year
more than
1 year
Total up to
1 year
more than
1 year
Total
Interest rate hedges
Caps / Floors – 361.6 361.6 150.0 115.6 265.6
Swaps 23.0 787.5 810.5 – 255.4 255.4
Currency hedges
Forwards 13,738.6 2,197.1 15,935.7 7,010.8 1,854.6 8,865.4
Options – – – – – –
Structured instruments – – – 113.5 – 113.5
Commodity hedges
Swaps 853.5 270.8 1,124.3 754.3 407.9 1,162.2
Options – – – 19.9 – 19.9
The nominal amounts correspond to the total of all purchase or sale amounts or the contract values of the transactions.
FA I R VA L U E S O F D E R I VAT I V E F I N A N C I A L I N S T R U M E N T S
The fair values of derivative financial instruments generally correspond to the market value. The market price determined for all derivative financial instruments is the price that would be received to sell an asset or paid to transfer a liability in an orderly transaction between market participants at the measurement date. A description of the determination of the fair values of derivative financial instruments is provided with the classification of financial instruments measured at fair value.
Positive and negative fair values of derivative financial instruments shown as receivables or liabilities
30 Sep 2018 30 Sep 2017
€ million Receivables Liabilities Receivables Liabilities
Cash flow hedges for
currency risks 194.3 52.2 168.6 217.4
other market price risks 288.0 0.2 91.2 11.1
interest rate risks 2.4 3.6 – 0.7
Hedging 484.7 56.0 259.8 229.2
Other derivative financial instruments 40.3 22.5 35.5 38.4
Total 525.0 78.5 295.3 267.6
Financial instruments which are entered into in order to hedge a risk position according to operational criteria but do not meet the criteria of IAS 39 to qualify for hedge accounting are shown as other derivative financial instruments. They include foreign currency transactions entered into in order to hedge against foreign exchange-exposure to changes in the value of balance sheet items and foreign exchange fluctuations from future expenses in Tourism.

232 NOT E S » NoT e S oN T He CoN S ol I DAT e D S TAT e Me N T of f I N A NC I A l p oS I T IoN
F I N A N C I A L I N S T R U M E N T S – A D D I T I O N A L D I S C L O S U R E S
C A R R Y I N G A M O U N T S A N D FA I R VA L U E S
Where financial instruments are listed in an active market, e. g. shares held and bonds issued, the fair value or market value is the respective quotation in this market at the balance sheet date. For over-the-counter bonds, liabilities to banks, promissory notes and other non-current financial liabilities, the fair value is determined as the present value of future cash flows, taking account of yield curves and the respective credit spread, which depends on the credit rating.
Due to the short remaining terms of cash and cash equivalents, current trade receivables and other assets, current trade payables and other payables, the carrying amounts are taken as realistic estimates of the fair value.
The fair values of non-current trade receivables and other assets correspond to the present values of the cash flows associated with the assets, taking account of current interest parameters which reflect market and counter party-related changes in terms and expectations. There are no financial investments held to maturity.
Carrying amounts and fair values according to classes and measurement categories as at 30 Sep 2018
Category under IAS 39
€ million
Carrying
amount
At amortised
cost
At cost
Fair value with
no effect on
profit and loss
Fair value
through profit
and loss
Values
according to
IAS 17
(leases)
Carrying
amount of
financial
instruments
Fair value of
financial
instruments
Assets
Available for sale
financial assets 54.3 – 27.6 26.7 – – 54.3 54.3*
Trade receivables and
other assets 1,269.6 818.1 – – – – 818.1 818.1
Derivative financial
instruments
Hedging 484.7 – – 484.7 – – 484.7 484.7
Other derivative
financial instruments 40.3 – – – 40.3 – 40.3 40.3
Cash and cash
equivalents 2,548.0 2,548.0 – – – – 2,548.0 2,548.0
Liabilities
Financial liabilities 2,442.9 1,100.3 – – – 1,342.6 1,100.3 1,163.6
Trade payables 2,937.3 2,932.6 – – – – 2,932.6 2,932.6
Derivative financial
instruments
Hedging 56.0 – – 56.0 – – 56.0 56.0
Other derivative
financial instruments 22.5 – – – 22.5 – 22.5 22.5
Other liabilities 777.8 33.7 – – – – 33.7 33.7
* Total includes financial instruments measured at cost of € 27.6 m

233NOT E S » NoT e S oN T H e CoN S ol I DAT e D S TAT e Me N T of f I N A NC I A l p oS I T IoN
Carrying amounts and fair values according to classes and measurement categories as at 30 Sep 2017
Category under IAS 39
€ million
Carrying
amount
At amortised
cost
At cost
Fair value with
no effect on
profit and loss
Fair value
through profit
and loss
Values
according to
IAS 17
(leases)
Carrying
amount of
financial
instruments
Fair value of
financial
instruments
Assets
Available for sale financial
assets 69.5 – 43.5 26.0 – – 69.5 69.51
Trade receivables and
other assets 1,006.3 745.1 – – – – 745.1 745.1
Derivative financial
instruments
Hedging 259.8 – – 259.8 – – 259.8 259.8
Other derivative
financial instruments 35.5 – – – 35.5 – 35.5 35.5
Cash and cash equivalents 2,516.1 2,516.1 – – – – 2,516.1 2,516.1
Liabilities
Financial liabilities 1,933.1 706.6 – – – 1,226.5 706.6 766.6
Trade payables 2,653.3 2,652.4 – – – – 2,652.4 2,652.4
Derivative financial
instruments
Hedging 229.2 – – 229.2 – – 229.2 229.2
Other derivative
financial instruments 38.4 – – – 38.4 – 38.4 38.4
Other liabilities2 748.2 49.4 – – 45.8 – 95.2 95.2
1 Total includes financial instruments measured at cost of € 43.5 m2 Adjusted
The financial investments classified as financial assets available for sale include an amount of € 27.6 m (previous year € 43.5 m) for stakes in partnerships and corporations for which an active market does not exist. The fair value of these non-listed stakes is not determined using a measurement model since the future cash flows cannot be reliably determined. The stakes are carried at acquisition cost. In the reporting period and in the previous year, there were no significant disposals of stakes in partnerships and corporations measured at acquisition cost. The TUI Group does not intend to sell or derecognise the stakes in these partnerships and corporations in the near future.
Unlike the previous year, a revenue guarantee to the purchaser of Hotelbeds Group with the fair value was recorded in other liabilities. The prior year presentation has been adjusted.

234 NOT E S » NoT e S oN T He CoN S ol I DAT e D S TAT e Me N T of f I N A NC I A l p oS I T IoN
Aggregation according to measurement categories under IAS 39 as at 30 Sep 2018
Fair value
€ million
At amortised
cost
At cost
with no effect
on profit
and loss
through
profit and
loss
Carrying
amount
Total
Fair value
Loans and receivables 3,366.1 – – – 3,366.1 3,366.1
Financial assets
available for sale – 27.6 26.7 – 54.3 54.3*
held for trading – – – 40.3 40.3 40.3
Financial liabilities
at amortised cost 4,066.6 – – – 4,066.6 4,129.9
held for trading – – – 22.5 22.5 22.5
* Total includes financial instruments measured at cost of € 27.6 m
Aggregation according to measurement categories under IAS 39 as at 30 Sep 2017
Fair value
€ million
At amortised
cost
At cost
with no effect
on profit
and loss
through
profit and
loss
Carrying
amount
Total
Fair value
Loans and receivables 3,261.2 – – – 3,261.2 3,261.2
Financial assets
available for sale – 43.5 26.0 – 69.5 69.51
held for trading – – – 35.5 35.5 35.5
Financial liabilities
at amortised cost 3,408.4 – – – 3,408.4 3,468.4
held for trading2 – – – 84.2 84.2 84.2
1 Total includes financial instruments measured at cost of € 43.5 m2 Adjusted
FA I R VA L U E M E A S U R E M E N T
The table below presents the fair values of recurring, non-recurring and other financial instruments measured at fair value in line with the underlying measurement level. The individual measurement levels have been defined as follows in line with the inputs:
• Level 1: (unadjusted) quoted prices in active markets for identical assets or liabilities. • Level 2: inputs for the measurement other than quoted market prices included within Level 1 that are observable in
the market for the asset or liability, either directly (as quoted prices) or indirectly (derivable from quoted prices).• Level 3: inputs for the measurement of the asset or liability not based on observable market data.
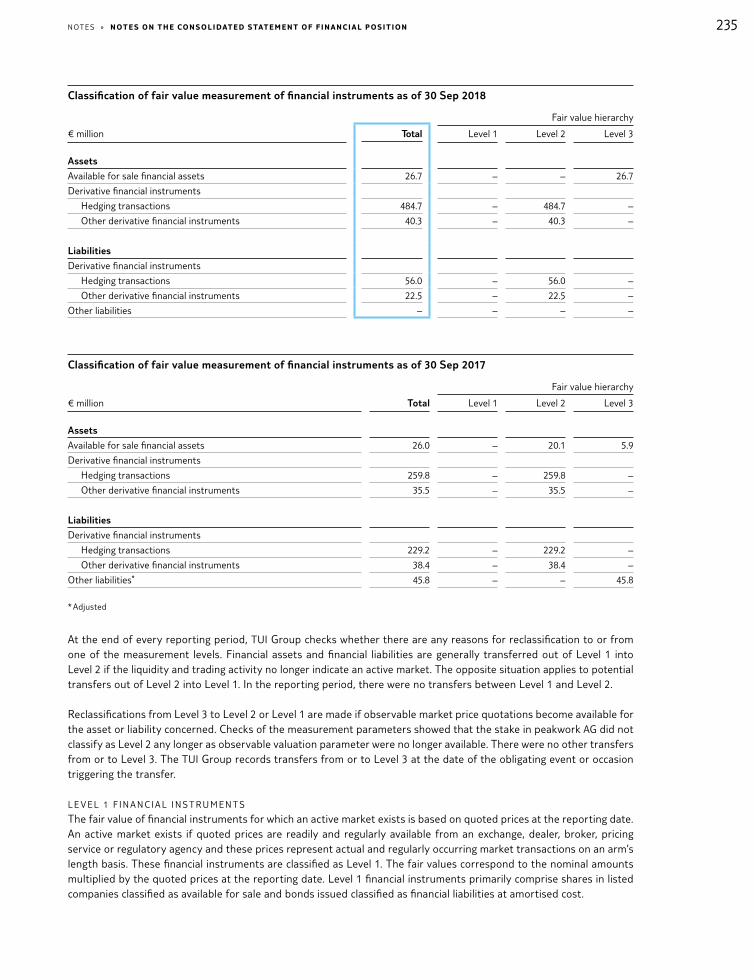
235NOT E S » NoT e S oN T H e CoN S ol I DAT e D S TAT e Me N T of f I N A NC I A l p oS I T IoN
Classification of fair value measurement of financial instruments as of 30 Sep 2018
Fair value hierarchy
€ million Total Level 1 Level 2 Level 3
Assets
Available for sale financial assets 26.7 – – 26.7
Derivative financial instruments
Hedging transactions 484.7 – 484.7 –
Other derivative financial instruments 40.3 – 40.3 –
Liabilities
Derivative financial instruments
Hedging transactions 56.0 – 56.0 –
Other derivative financial instruments 22.5 – 22.5 –
Other liabilities – – – –
Classification of fair value measurement of financial instruments as of 30 Sep 2017
Fair value hierarchy
€ million Total Level 1 Level 2 Level 3
Assets
Available for sale financial assets 26.0 – 20.1 5.9
Derivative financial instruments
Hedging transactions 259.8 – 259.8 –
Other derivative financial instruments 35.5 – 35.5 –
Liabilities
Derivative financial instruments
Hedging transactions 229.2 – 229.2 –
Other derivative financial instruments 38.4 – 38.4 –
Other liabilities* 45.8 – – 45.8
* Adjusted
At the end of every reporting period, TUI Group checks whether there are any reasons for reclassification to or from one of the measurement levels. Financial assets and financial liabilities are generally transferred out of Level 1 into Level 2 if the liquidity and trading activity no longer indicate an active market. The opposite situation applies to potential transfers out of Level 2 into Level 1. In the reporting period, there were no transfers between Level 1 and Level 2.
Reclassifications from Level 3 to Level 2 or Level 1 are made if observable market price quotations become available for the asset or liability concerned. Checks of the measurement parameters showed that the stake in peakwork AG did not classify as Level 2 any longer as observable valuation parameter were no longer available. There were no other transfers from or to Level 3. The TUI Group records transfers from or to Level 3 at the date of the obligating event or occasion triggering the transfer.
L E V E L 1 F I N A N C I A L I N S T R U M E N T S
The fair value of financial instruments for which an active market exists is based on quoted prices at the reporting date. An active market exists if quoted prices are readily and regularly available from an exchange, dealer, broker, pricing service or regulatory agency and these prices represent actual and regularly occurring market transactions on an arm’s length basis. These financial instruments are classified as Level 1. The fair values correspond to the nominal amounts multiplied by the quoted prices at the reporting date. Level 1 financial instruments primarily comprise shares in listed companies classified as available for sale and bonds issued classified as financial liabilities at amortised cost.

236 NOT E S » NoT e S oN T He CoN S ol I DAT e D S TAT e Me N T of f I N A NC I A l p oS I T IoN
L E V E L 2 F I N A N C I A L I N S T R U M E N T S :
The fair values of financial instruments not traded in an active market, e. g. over-the-counter (OTC) derivatives, are determined by means of valuation techniques. These valuation techniques make maximum use of observable market data and minimise the use of Group-specific assumptions. If all essential inputs for the determination of the fair value of an instrument are observable, the instrument is classified as Level 2.
If one or several key inputs are not based on observable market data, the instrument is classified as Level 3.
The following specific valuation techniques are used to measure financial instruments:
• For over-the-counter bonds, liabilities to banks, promissory notes and other non-current financial liabilities, the fair value is determined as the present value of future cash flows, taking account of yield curves and the respective credit spread, which depends on the credit rating
• The fair value of over-the-counter derivatives is determined by means of appropriate calculation methods, e. g. by discounting the expected future cash flows. The forward prices of forward transactions are based on the spot or cash prices, taking account of forward premiums and discounts. The calculation of the fair values of options concluded for currency options is based on the Black & Scholes model and the Turnbull & Wakeman model for optional fuel hedges. The fair values determined on the basis of the Group’s own systems are periodically compared with fair value confirmations of the external counterparties.
• Other valuation techniques, e. g. discounting future cash flows, are used to determine the fair values of other financial instruments.
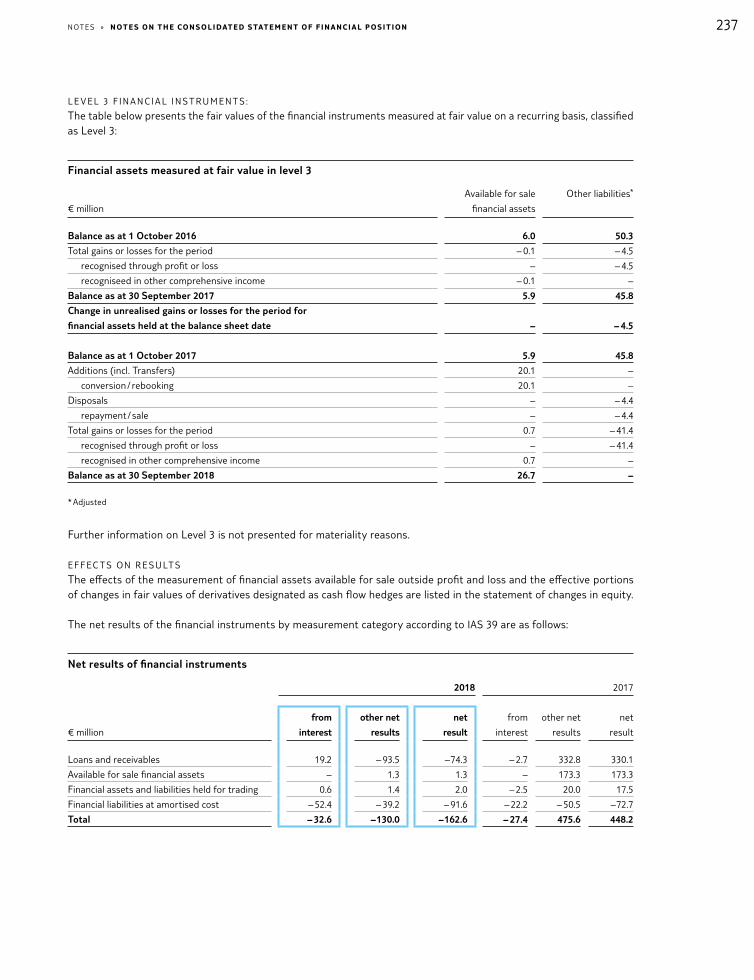
237NOT E S » NoT e S oN T H e CoN S ol I DAT e D S TAT e Me N T of f I N A NC I A l p oS I T IoN
L E V E L 3 F I N A N C I A L I N S T R U M E N T S :
The table below presents the fair values of the financial instruments measured at fair value on a recurring basis, classified as Level 3:
Financial assets measured at fair value in level 3
€ million
Available for sale
financial assets
Other liabilities*
Balance as at 1 October 2016 6.0 50.3
Total gains or losses for the period – 0.1 – 4.5
recognised through profit or loss – – 4.5
recogniseed in other comprehensive income – 0.1 –
Balance as at 30 September 2017 5.9 45.8
Change in unrealised gains or losses for the period for
financial assets held at the balance sheet date – – 4.5
Balance as at 1 October 2017 5.9 45.8
Additions (incl. Transfers) 20.1 –
conversion / rebooking 20.1 –
Disposals – – 4.4
repayment / sale – – 4.4
Total gains or losses for the period 0.7 – 41.4
recognised through profit or loss – – 41.4
recognised in other comprehensive income 0.7 –
Balance as at 30 September 2018 26.7 –
* Adjusted
Further information on Level 3 is not presented for materiality reasons.
E F F E C T S O N R E S U LT S
The effects of the measurement of financial assets available for sale outside profit and loss and the effective portions of changes in fair values of derivatives designated as cash flow hedges are listed in the statement of changes in equity.
The net results of the financial instruments by measurement category according to IAS 39 are as follows:
Net results of financial instruments
2018 2017
€ million
from
interest
other net
results
net
result
from
interest
other net
results
net
result
Loans and receivables 19.2 – 93.5 – 74.3 – 2.7 332.8 330.1
Available for sale financial assets – 1.3 1.3 – 173.3 173.3
Financial assets and liabilities held for trading 0.6 1.4 2.0 – 2.5 20.0 17.5
Financial liabilities at amortised cost – 52.4 – 39.2 – 91.6 – 22.2 – 50.5 – 72.7
Total – 32.6 – 130.0 – 162.6 – 27.4 475.6 448.2
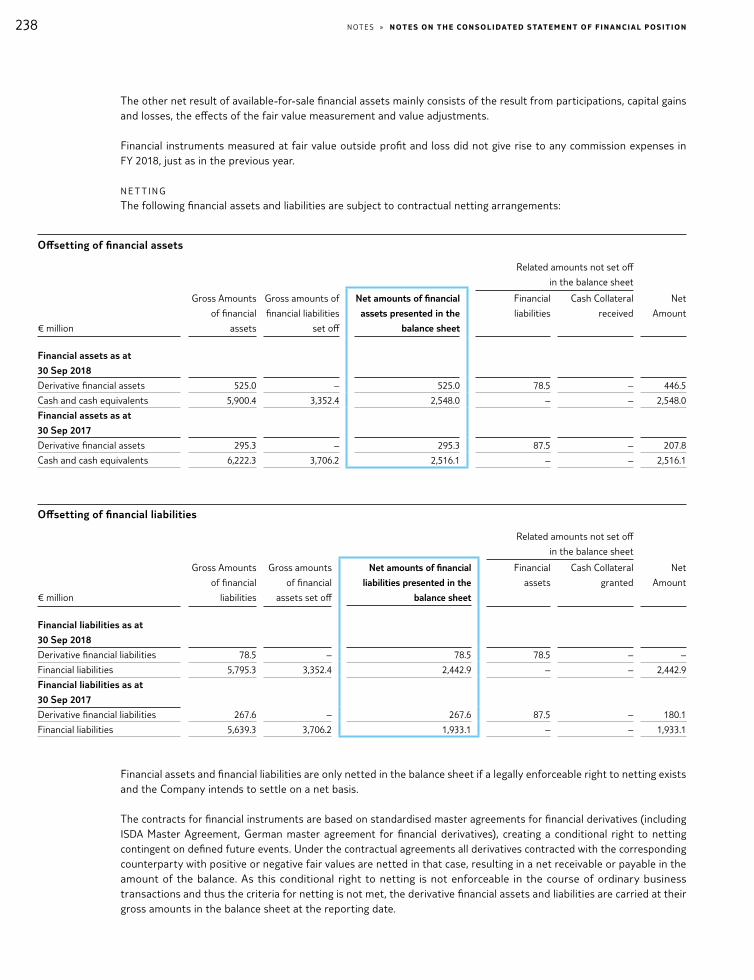
238 NOT E S » NoT e S oN T He CoN S ol I DAT e D S TAT e Me N T of f I N A NC I A l p oS I T IoN
The other net result of available-for-sale financial assets mainly consists of the result from participations, capital gains and losses, the effects of the fair value measurement and value adjustments.
Financial instruments measured at fair value outside profit and loss did not give rise to any commission expenses in FY 2018, just as in the previous year.
N E T T I N G
The following financial assets and liabilities are subject to contractual netting arrangements:
Offsetting of financial assets
Related amounts not set off
in the balance sheet
€ million
Gross Amounts
of financial
assets
Gross amounts of
financial liabilities
set off
Net amounts of financial
assets presented in the
balance sheet
Financial
liabilities
Cash Collateral
received
Net
Amount
Financial assets as at
30 Sep 2018
Derivative financial assets 525.0 – 525.0 78.5 – 446.5
Cash and cash equivalents 5,900.4 3,352.4 2,548.0 – – 2,548.0
Financial assets as at
30 Sep 2017
Derivative financial assets 295.3 – 295.3 87.5 – 207.8
Cash and cash equivalents 6,222.3 3,706.2 2,516.1 – – 2,516.1
Offsetting of financial liabilities
Related amounts not set off
in the balance sheet
€ million
Gross Amounts
of financial
liabilities
Gross amounts
of financial
assets set off
Net amounts of financial
liabilities presented in the
balance sheet
Financial
assets
Cash Collateral
granted
Net
Amount
Financial liabilities as at
30 Sep 2018
Derivative financial liabilities 78.5 – 78.5 78.5 – –
Financial liabilities 5,795.3 3,352.4 2,442.9 – – 2,442.9
Financial liabilities as at
30 Sep 2017
Derivative financial liabilities 267.6 – 267.6 87.5 – 180.1
Financial liabilities 5,639.3 3,706.2 1,933.1 – – 1,933.1
Financial assets and financial liabilities are only netted in the balance sheet if a legally enforceable right to netting exists and the Company intends to settle on a net basis.
The contracts for financial instruments are based on standardised master agreements for financial derivatives (including ISDA Master Agreement, German master agreement for financial derivatives), creating a conditional right to netting contingent on defined future events. Under the contractual agreements all derivatives contracted with the corresponding counterparty with positive or negative fair values are netted in that case, resulting in a net receivable or payable in the amount of the balance. As this conditional right to netting is not enforceable in the course of ordinary business transactions and thus the criteria for netting is not met, the derivative financial assets and liabilities are carried at their gross amounts in the balance sheet at the reporting date.

239NOT E S » NoT e S oN T H e CoN S ol I DAT e D S TAT e Me N T of f I N A NC I A l p oS I T IoN
Financial assets and liabilities in the framework of the cash pooling scheme are shown on a net basis if there is a right to netting in ordinary business transactions and the Group intends to settle on a net basis.
(37) Capital management
TUI Group’s capital management ensures that our goals and strategies can be achieved in the interest of our share- / bond- and credit-holders as well as other stakeholders. The primary objectives of the Group are as follows:
• Ensuring sufficient liquidity for the Group • Profitable growth and a sustainable increase in TUI Group’s value • Strengthening our cash generation allowing to invest, pay dividends and strengthen the balance sheet • Maintaining sufficient debt capacity and an at least stable credit rating
Key management variables used in capital management to measure and control the above goals are Return On Invested Capital (ROIC), the leverage ratio and the coverage ratio, presented in the table below. TUI Group’s financial policy aims for a leverage ratio of 3.00 (x) to 2.25 (x) and a coverage ratio of 5.75 (x) to 6.75 (x).
TUI Group’s financial and liquidity management for all Group subsidiaries is centrally operated by TUI AG, which acts as the Group’s internal bank. Financing and refinancing requirements, derived from the multi-year finance budget, are satisfied by the timely conclusion of appropriate financing instruments. The short-term liquidity reserve is safeguarded by syndicated credit facilities, bilateral bank loans and liquid funds. Moreover, through intra-Group cash pooling the cash surpluses of individual Group companies are used to finance the cash requirements of other Group companies.
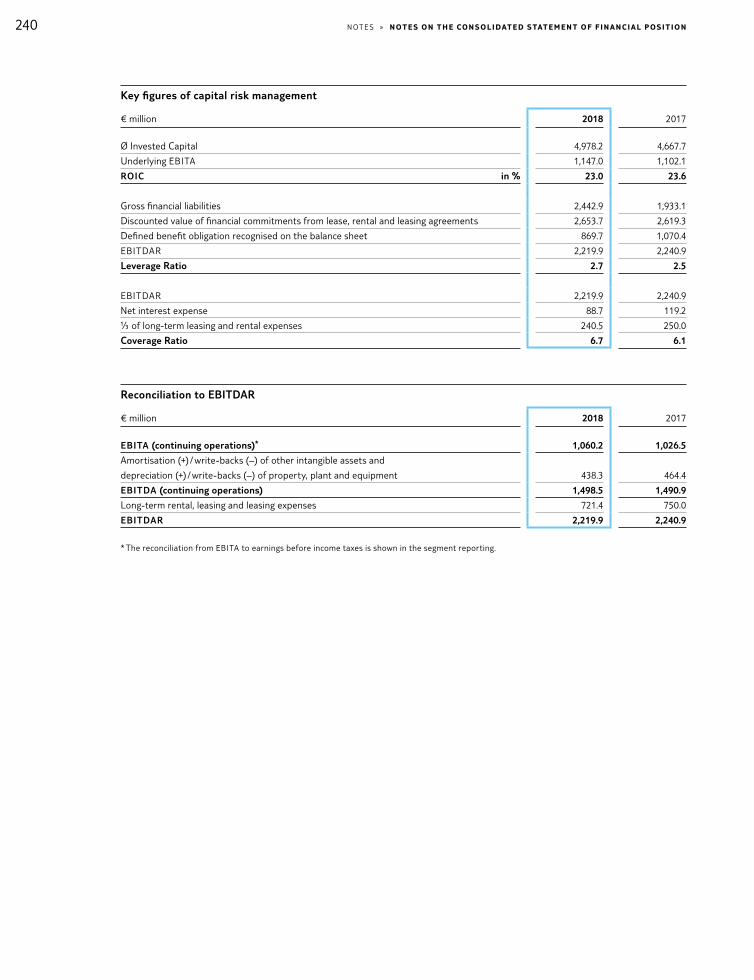
240 NOT E S » NoT e S oN T He CoN S ol I DAT e D S TAT e Me N T of f I N A NC I A l p oS I T IoN
Key figures of capital risk management
€ million 2018 2017
Ø Invested Capital 4,978.2 4,667.7
Underlying EBITA 1,147.0 1,102.1
ROIC in % 23.0 23.6
Gross financial liabilities 2,442.9 1,933.1
Discounted value of financial commitments from lease, rental and leasing agreements 2,653.7 2,619.3
Defined benefit obligation recognised on the balance sheet 869.7 1,070.4
EBITDAR 2,219.9 2,240.9
Leverage Ratio 2.7 2.5
EBITDAR 2,219.9 2,240.9
Net interest expense 88.7 119.2
⅓ of long-term leasing and rental expenses 240.5 250.0
Coverage Ratio 6.7 6.1
Reconciliation to EBITDAR
€ million 2018 2017
EBITA (continuing operations)* 1,060.2 1,026.5
Amortisation (+) / write-backs (–) of other intangible assets and
depreciation (+) / write-backs (–) of property, plant and equipment 438.3 464.4
EBITDA (continuing operations) 1,498.5 1,490.9
Long-term rental, leasing and leasing expenses 721.4 750.0
EBITDAR 2,219.9 2,240.9
* The reconciliation from EBITA to earnings before income taxes is shown in the segment reporting.

241NOT E S » NoT e S oN T He C A S H f low S TAT e Me N T
Notes on the cash flow statement
The cash flow statement shows the flow of cash and cash equivalents on the basis of a separate presentation of cash inflows and outflows from operating, investing and financing activities. The effects of changes in the group of consolidated companies are eliminated. The cash flows are shown for continuing operations and the discontinued operation.
In the period under review, cash and cash equivalents rose by € 31.9 m to € 2,548.0 m.
(38) Cash inflow from operating activities
Based on the Group result after tax, the cash flow from operating activities is derived using the indirect method. In the financial year under review, the cash inflow from operating activities amounted to € 1,150.9 m (previous year € 1,583.1 m).
In the period under review, the cash inflow included interest of € 29.9 m (previous year € 17.7 m) and dividends of € 226.5 m (previous year € 121.7 m). Income tax payments resulted in a cash outflow of € 236.0 m (previous year € 146.1 m).
(39) Cash outflow from investing activities
In FY 2018, the cash outflow from investing activities totalled € 845.7 m (previous year € 687.7 m). The cash flow from investing activities includes a cash outflow for capital expenditure related to property, plant and equipment and intangible assets of € 956.2 m, including € 2.2 m for interest capitalised as borrowing costs (previous year € 4.0 m). The Group also recorded a cash inflow of € 192.4 m from the sale of property, plant and equipment and intangible assets. The item also includes a cash outflow of € 135.6 m in connection with the acquisition of consolidated companies, including € 135.1 m relating to the Destination Experiences and Hotels & Resorts segments. The Group recorded a cash inflow of € 94.1 m from the sale of consolidated companies and an investment. In the period under review, the acquisition of associates and a joint venture as well as the capital increase of an associate, an advance payment for an investment and the investment of cash and cash equivalents in a money market fund resulted in an outflow of cash for other assets of € 40.4 m.
(40) Cash outflow from financing activities
The cash outflow from financing activities totals € 236.9 m (previous year € 733.8 m). TUI AG recorded an inflow of cash of € 422.9 m from the issue of an unsecured Schuldschein after deducting borrowing costs. TUI Group companies took out further financial liabilities worth € 11.3 m. A further cash outflow of € 162.7 m related to the redemption of financial liabilities, including € 106.5 m for finance lease obligations (previous year € 97.8 m). The external revolving credit facility to control the seasonality of the Group’s cash flows and liquidity was not used as at the balance sheet day. An amount of € 110.8 m was used for interest payments, while a cash outflow of € 381.8 m related to dividend payments to TUI AG shareholders and a further outflow of € 53.5 m related to dividend payments to minority shareholders. The sale of shares in TUI AG held by the Employee Benefit Trust of TUI Travel Ltd. in the prior year gave rise to an inflow of € 32.7 m in October 2017. An amount of € 1.0 m was spent to purchase shares issued to employees. The issue of employee shares resulted in a cash inflow of € 6.8 m.

242 NOT E S » NoT e S oN T He C A S H f low S TAT e Me N T, oT He r NoT e S
(41) Development of cash and cash equivalents
Cash and cash equivalents comprise all liquid funds, i. e. cash in hand, bank balances and cheques.
Cash and cash equivalents declined by € 36.4 m (previous year € 49.1 m) due to foreign exchange effects.
Other notes
(42) Services of the auditors of the consolidated financial statements
TUI AG’s consolidated financial statements have been audited by Deloitte GmbH Wirtschaftsprüfungsgesellschaft. Since FY 2017, Dr Hendrik Nardmann has been the auditor in charge. Total expenses for the services provided by the auditors of the consolidated financial statements in FY 2018 break down as follows:
Services of the auditors of the consolidated financial statements
€ million 2018 2017
Audit fees for TUI AG and subsidiaries in Germany 3.4 2.9
Audit fees 3.4 2.9
Review of interim financial statements 1.7 1.1
Other audit related services 0.2 –
Other certification and measurement services 1.9 1.1
Consulting fees 0.1 –
Tax advisor services 0.0 0.1
Other services 0.1 0.1
Total 5.4 4.1
(43) Remuneration of Executive and Supervisory Board members acc. to section 314 HGB
In the completed financial year, the remuneration paid to Executive Board members totalled € 3,792.8 k (previous year € 3,794.7 k).
Pension payments for former Executive Board members or their surviving dependants totalled € 4,963.6 k (previous year € 13,497.1 k) in the completed financial year. Pension obligations for former Executive Board members and their surviving dependants amounted to € 63,738.2 k (previous year € 64,683.5 k) at the balance sheet date.
Disclosures of the relevant amounts for individual Board members and further details on the remuneration system are provided in the Remuneration Report included in the Management Report.

243NOT E S » oT He r NoT e S
(44) Use of exemption provision
The following German subsidiaries fully included in consolidation made use of the exemption provision in accordance with section 264 (3) of the German Commercial Code (HGB):
Use of exemption provisions
Berge & Meer Touristik GmbH, Rengsdorf TUI aqtiv GmbH, Hanover
DEFAG Beteiligungsverwaltungs GmbH I, Hanover TUI Aviation GmbH, Hanover
DEFAG Beteiligungsverwaltungs GmbH III , Hanover TUI Beteiligungs GmbH, Hanover
FOX-TOURS Reisen GmbH, Rengsdorf TUI Business Services GmbH, Hanover
Hapag-Lloyd Executive GmbH, Langenhagen TUI Customer Operations GmbH, Hanover
Hapag-Lloyd Kreuzfahrten GmbH, Hamburg TUI Deutschland GmbH, Hanover
Last-Minute-Restplatzreisen GmbH, Baden-Baden TUI Group Services GmbH, Hanover
Leibniz Service GmbH, Hanover TUI-Hapag Beteiligungs GmbH, Hanover
L’tur tourismus GmbH, Baden-Baden TUI Hotel Betriebsgesellschaft mbH, Hanover
MEDICO Flugreisen GmbH, Baden-Baden TUI Immobilien Services GmbH, Hanover
MSN 1359 GmbH, Hanover TUI InfoTec GmbH, Hanover
Preussag Beteiligungsverwaltungs GmbH IX , Hanover TUI Leisure Travel Service GmbH, Neuss
ProTel Gesellschaft für Kommunikation mbH, Rengsdorf TUI Magic Life GmbH, Hanover
Robinson Club GmbH, Hanover TUIfly GmbH, Langenhagen
TCV Touristik-Computerverwaltungs GmbH, Baden-Baden TUIfly Vermarktungs GmbH, Hanover
TICS GmbH Touristische Internet und Call Center Services,
Baden-Baden Wolters Reisen GmbH, Stuhr
TUI 4 U GmbH, Bremen
(45) Related parties
Apart from the subsidiaries included in the consolidated financial statements, TUI AG, in carrying out its ordinary business activities, maintains indirect or direct relationships with related parties. Related parties controlled by the TUI Group or over which the TUI Group is able to exercise a significant influence are shown in the list of shareholdings published in the Federal Gazette (www.bundesanzeiger.de). Apart from pure equity investments, related parties also include companies that supply goods or provide services for TUI Group companies.
Financial obligations from order commitments vis-à-vis related parties primarily relate to the purchasing of hotel services. TUI Group also has obligations of € 272.7 m (previous year € 613.2 m) from order commitments vis-à-vis the related company TUI Cruises.

244 NOT E S » oT He r NoT e S
Transactions with related parties
€ million 2018 2017
Services provided by the Group
Management and consultancy services 92.8 104.2
Sales of tourism services 104.3 79.2
Other services 1.5 0.7
Total 198.6 184.1
Services received by the Group
In the framework of rental and leasing agreements 47.6 46.6
Purchase of hotel services 352.2 253.1
Distribution services 7.9 8.0
Other services 14.3 11.3
Total 422.0 319.0
Transactions with related parties
€ million 2018 2017
Services provided by the Group to
non-consolidated Group companies 1.0 0.7
joint ventures 95.5 92.0
associates 39.1 28.8
other related parties 63.0 62.6
Total 198.6 184.1
Services received by the Group from
non-consolidated Group companies 6.5 6.6
joint ventures 306.7 264.2
associates 94.4 34.5
other related parties 14.4 13.7
Total 422.0 319.0
Transactions with joint ventures and associates are primarily effected in the Tourism segment. They relate in particular to the tourism services of the hotel companies used by the Group’s tour operators.
All transactions with related parties were executed on an arm’s length basis, applying international comparable uncontrolled price methods in accordance with IAS 24.
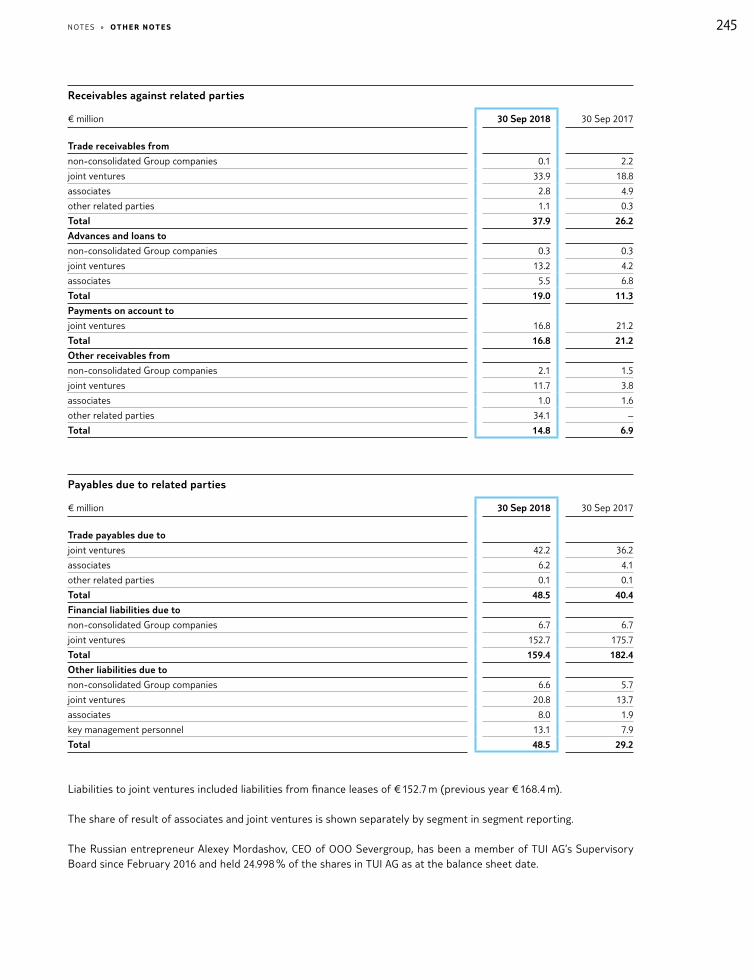
245NOT E S » oT He r NoT e S
Receivables against related parties
€ million 30 Sep 2018 30 Sep 2017
Trade receivables from
non-consolidated Group companies 0.1 2.2
joint ventures 33.9 18.8
associates 2.8 4.9
other related parties 1.1 0.3
Total 37.9 26.2
Advances and loans to
non-consolidated Group companies 0.3 0.3
joint ventures 13.2 4.2
associates 5.5 6.8
Total 19.0 11.3
Payments on account to
joint ventures 16.8 21.2
Total 16.8 21.2
Other receivables from
non-consolidated Group companies 2.1 1.5
joint ventures 11.7 3.8
associates 1.0 1.6
other related parties 34.1 –
Total 14.8 6.9
Payables due to related parties
€ million 30 Sep 2018 30 Sep 2017
Trade payables due to
joint ventures 42.2 36.2
associates 6.2 4.1
other related parties 0.1 0.1
Total 48.5 40.4
Financial liabilities due to
non-consolidated Group companies 6.7 6.7
joint ventures 152.7 175.7
Total 159.4 182.4
Other liabilities due to
non-consolidated Group companies 6.6 5.7
joint ventures 20.8 13.7
associates 8.0 1.9
key management personnel 13.1 7.9
Total 48.5 29.2
Liabilities to joint ventures included liabilities from finance leases of € 152.7 m (previous year € 168.4 m).
The share of result of associates and joint ventures is shown separately by segment in segment reporting.
The Russian entrepreneur Alexey Mordashov, CEO of OOO Severgroup, has been a member of TUI AG’s Supervisory Board since February 2016 and held 24.998 % of the shares in TUI AG as at the balance sheet date.
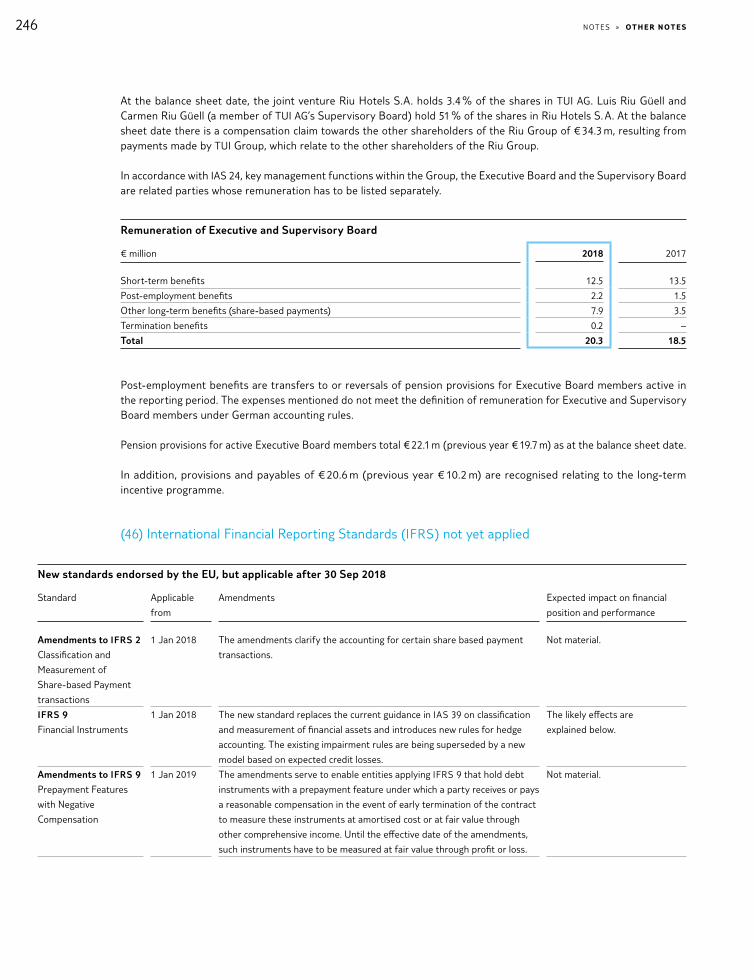
246 NOT E S » oT He r NoT e S
At the balance sheet date, the joint venture Riu Hotels S.A. holds 3.4 % of the shares in TUI AG. Luis Riu Güell and Carmen Riu Güell (a member of TUI AG’s Supervisory Board) hold 51 % of the shares in Riu Hotels S. A. At the balance sheet date there is a compensation claim towards the other shareholders of the Riu Group of € 34.3 m, resulting from payments made by TUI Group, which relate to the other shareholders of the Riu Group.
In accordance with IAS 24, key management functions within the Group, the Executive Board and the Supervisory Board are related parties whose remuneration has to be listed separately.
Remuneration of Executive and Supervisory Board
€ million 2018 2017
Short-term benefits 12.5 13.5
Post-employment benefits 2.2 1.5
Other long-term benefits (share-based payments) 7.9 3.5
Termination benefits 0.2 –
Total 20.3 18.5
Post-employment benefits are transfers to or reversals of pension provisions for Executive Board members active in the reporting period. The expenses mentioned do not meet the definition of remuneration for Executive and Supervisory Board members under German accounting rules.
Pension provisions for active Executive Board members total € 22.1 m (previous year € 19.7 m) as at the balance sheet date.
In addition, provisions and payables of € 20.6 m (previous year € 10.2 m) are recognised relating to the long-term incentive programme.
(46) International Financial Reporting Standards (IFRS) not yet applied
New standards endorsed by the EU, but applicable after 30 Sep 2018
Standard Applicable
from
Amendments Expected impact on financial
position and performance
Amendments to IFRS 2
Classification and
Measurement of
Share-based Payment
transactions
1 Jan 2018
The amendments clarify the accounting for certain share based payment
transactions.
Not material.
IFRS 9
Financial Instruments
1 Jan 2018
The new standard replaces the current guidance in IAS 39 on classification
and measurement of financial assets and introduces new rules for hedge
accounting. The existing impairment rules are being superseded by a new
model based on expected credit losses.
The likely effects are
explained below.
Amendments to IFRS 9
Prepayment Features
with Negative
Compensation
1 Jan 2019
The amendments serve to enable entities applying IFRS 9 that hold debt
instruments with a prepayment feature under which a party receives or pays
a reasonable compensation in the event of early termination of the contract
to measure these instruments at amortised cost or at fair value through
other comprehensive income. Until the effective date of the amendments,
such instruments have to be measured at fair value through profit or loss.
Not material.

247NOT E S » oT He r NoT e S
New standards endorsed by the EU, but applicable after 30 Sep 2018
IFRS 15
Revenue from Contracts
with Customers
1 Jan 2018
IFRS 15 combines and supersedes the guidance on revenue recognition
comprised in various standards and interpretations so far. It establishes a
single, comprehensive framework for revenue recognition, to be applied
across industries and for all categories of revenue transactions, specifying
which amount of revenue and at which point in time or over which time
period revenue is to be recognised. IFRS 15 replaces, amongst others,
IAS 18 and IAS 11.
IFRS 15 and the clarifications
to IFRS 15 will affect the
Group’s financial statements.
The possible effects are
explained below.
Clarifications to
IFRS 15
Revenue from Contracts
with Customers
1 Jan 2018
The amendments comprise clarifications of the guidance on identifying
performance obligations, the principal versus agent assessment (i. e., gross
vs. net revenue presentation) as well as the accounting for revenue from
licences at a ‘point in time’ or ‘over time’. In addition, it introduces practical
expedients to simplify first-time adoption.
Amendments to IAS 40
Transfer of Investment
Property
1 Jan 2018
The amendments set out the conditions, according to which property under
construction or development, which was previously classified as inventory,
could be transferred to investment property in case of an evident change in
use (and reversal).
Not material.
IFRIC 22
Foreign Currency
Transactions and
Advance Consideration
1 Jan 2018
The interpretation clarifies the exchange rate to be used when an entity
has received or paid advance consideration in a foreign currency. The date
of transaction for the purpose of determining the exchange rate to use on
initial recognition of the related asset, expense or income is the date on
which the entity initally recognises the advance consideration.
No impact as the current
accounting is in line with the
new interpretation.
IFRS 16
Leases
1 Jan 2019
IFRS 16 replaces the current IAS 17 and its interpretations. For lessees, there
is no longer the requirement to classify into finance and operating leases. In-
stead all leases are accounted for according to the so-called ‘Rights of Use’
approach. In the statement of financial position a lessee is to recognise an
asset for the right to use the leased item and a liability for the future lease
payments. There are optional exemptions for short-term leases (< 12 months)
and so-called small-ticket leases. For lessors, the accounting stays largely
unchanged. Lessors will continue to classify leases in accordance with the
criteria transfered from IAS 17. In addition, IFRS 16 includes several other new
requirements, in particular a new definition of a lease, on sale and leaseback
transactions and the accounting for subleases.
The new standard will have
significant effects on the Group’s
financial statements. The likely
effects are explained below.
IFRIC 23
Uncertainty over
Income Tax Treatments
1 Jan 2019
The interpretation complements the rules of IAS 12 on the accounting
for actual and deferred taxes to clarify the accounting for uncertainties
over income tax treatments and transactions by taxation authorities or
fiscal courts.
Not material.
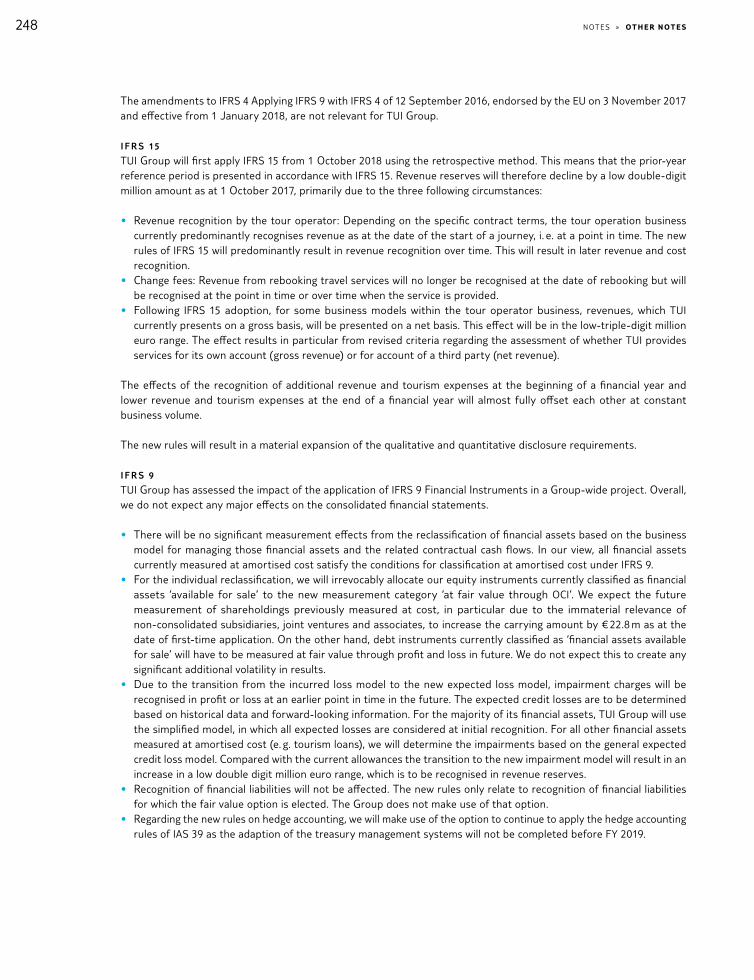
248 NOT E S » oT He r NoT e S
The amendments to IFRS 4 Applying IFRS 9 with IFRS 4 of 12 September 2016, endorsed by the EU on 3 November 2017 and effective from 1 January 2018, are not relevant for TUI Group.
I F R S 15
TUI Group will first apply IFRS 15 from 1 October 2018 using the retrospective method. This means that the prior-year reference period is presented in accordance with IFRS 15. Revenue reserves will therefore decline by a low double-digit million amount as at 1 October 2017, primarily due to the three following circumstances:
• Revenue recognition by the tour operator: Depending on the specific contract terms, the tour operation business currently predominantly recognises revenue as at the date of the start of a journey, i. e. at a point in time. The new rules of IFRS 15 will predominantly result in revenue recognition over time. This will result in later revenue and cost recognition.
• Change fees: Revenue from rebooking travel services will no longer be recognised at the date of rebooking but will be recognised at the point in time or over time when the service is provided.
• Following IFRS 15 adoption, for some business models within the tour operator business, revenues, which TUI currently presents on a gross basis, will be presented on a net basis. This effect will be in the low-triple-digit million euro range. The effect results in particular from revised criteria regarding the assessment of whether TUI provides services for its own account (gross revenue) or for account of a third party (net revenue).
The effects of the recognition of additional revenue and tourism expenses at the beginning of a financial year and lower revenue and tourism expenses at the end of a financial year will almost fully offset each other at constant business volume.
The new rules will result in a material expansion of the qualitative and quantitative disclosure requirements.
I F R S 9
TUI Group has assessed the impact of the application of IFRS 9 Financial Instruments in a Group-wide project. Overall, we do not expect any major effects on the consolidated financial statements.
• There will be no significant measurement effects from the reclassification of financial assets based on the business model for managing those financial assets and the related contractual cash flows. In our view, all financial assets currently measured at amortised cost satisfy the conditions for classification at amortised cost under IFRS 9.
• For the individual reclassification, we will irrevocably allocate our equity instruments currently classified as financial assets ‘available for sale’ to the new measurement category ‘at fair value through OCI’. We expect the future measurement of shareholdings previously measured at cost, in particular due to the immaterial relevance of non-consolidated subsidiaries, joint ventures and associates, to increase the carrying amount by € 22.8 m as at the date of first-time application. On the other hand, debt instruments currently classified as ‘financial assets available for sale’ will have to be measured at fair value through profit and loss in future. We do not expect this to create any significant additional volatility in results.
• Due to the transition from the incurred loss model to the new expected loss model, impairment charges will be recognised in profit or loss at an earlier point in time in the future. The expected credit losses are to be determined based on historical data and forward-looking information. For the majority of its financial assets, TUI Group will use the simplified model, in which all expected losses are considered at initial recognition. For all other financial assets measured at amortised cost (e. g. tourism loans), we will determine the impairments based on the general expected credit loss model. Compared with the current allowances the transition to the new impairment model will result in an increase in a low double digit million euro range, which is to be recognised in revenue reserves.
• Recognition of financial liabilities will not be affected. The new rules only relate to recognition of financial liabilities for which the fair value option is elected. The Group does not make use of that option.
• Regarding the new rules on hedge accounting, we will make use of the option to continue to apply the hedge accounting rules of IAS 39 as the adaption of the treasury management systems will not be completed before FY 2019.

249NOT E S » oT He r NoT e S
The reconciliation of the carrying amounts and loss allowances in transitioning from IAS 39 to IFRS 9 will be presented in a reconciliation table. We will use the option not to restate the prior-year comparatives in the transition.
I F R S 16
The changes in lessee accounting of leases resulting from IFRS 16 will have a significant impact on all parts of the consolidated financial statements and the presentation of the Group’s financial position, net assets and earnings position:
• Statement of financial position: This far, the payments for operating leases had to be disclosed in the Notes only. In future, the rights and obligations arising from all leases must be recognised as rights of use and lease liabilities in the lessee’s statement of financial position. The right-of-use asset is initially recognised at the present value of future lease payments plus initial direct costs and is subsequently depreciated over the lease term. The lease liability is initially measured at the present value of the lease payments made during the term of the lease. Following initial recognition, the carrying amount is increased for the effective interest and reduced by lease payments made. Due to the obligations from operating leases presented in Note 34, TUI Group expects a material increase in lease liabilities and fixed assets as at the date of first-time application. The equity ratio will decline as a result of this balance sheet extension. The material increase in lease liabilities will cause a corresponding increase in net financial liabilities.
• Income statement: In future, a lessee will recognise depreciation on the right-of-use asset and interest expenses from unwinding the discount on lease liabilities instead of lease expenses. This change will result in a significant improvement in EBITDA and EBITA and a moderate improvement in EBIT.
• Cash flow statement: The payments representing a repayment of principal or interest portion of a lease liability will be included in the cash flow from financing activities in future. Only payments that have not been included in the determination of the lease liability and payments from short-term leases and low-value assets for which TUI Group makes use of respective exemptions will be allocated to cash flows from operating activities. This change in presentation in comparison to current recognition of operating lease expenses will result in an increase in cash flows from operating activities and a decrease in cash flows from financing activities.
• Notes: The new requirements will result in a significant expansion of disclosure requirements for lessees and lessors in comparison to IAS 17.
TUI Group has launched a Group-wide project to assess the impact and to implement the new requirements.
Currently, TUI Group has decided to make use of the exemptions for short-term leases and low-value assets. Further, the new rules will not be applied to leases for intangible assets. For car and IT leases, comprising both lease and non-lease components, we will make use of the simplification to avoid accounting for lease components separately from non-lease components. We also intend to present intra-Group leases – in line with internal control – as operating leases in line with IAS 17 in segment reporting in accordance with IFRS 8.
The Group-wide detailed assessment of all external leases included within the implementation project and the assessment of the impact of the new rules on accounting for maintenance provisions for leased aircraft have not yet been fully completed. For that reason and due to the Group’s large number of external and internal leases, a reliable estimate of the quantitative effects is currently not yet possible.
Based on the modified retrospective approach, TUI Group will apply the new rules from 1 October 2019. The Group may use various practical expedients in transitioning to the new rules, and no decisions have yet been taken on how to exercise these options. Upon first-time application, the cumulative effect of the transition will be recognised in equity outside profit and loss. The prior-year comparatives for FY 2019, the year prior to first-time application, will not be restated retrospectively.

250 NOT E S » oT He r NoT e S
The following amendments and new standards have not yet been endorsed by the European Union.
New standards and interpretations not yet endorsed by the EU and applicable after 30 Sep 2018
Standard Applicable
from
Amendments Expected impact on financial
position and performance
Amendments to IAS 28
Long-term Interests in
Associates and Joint
Ventures
1 Jan 2019
The amendments clarify that the impairment rules of IFRS 9 apply to
long-term interests in associates and joint ventures that, in substance,
form part of the net investment in the associate or joint venture to which
the equity method is applied. Nevertheless, (as a second step) these
long-term interests will have to be taken into account when the IAS 28
loss allocations are adjusted to the value of the long-term interests.
Not material.
Various
Improvements to
IFRS (2015 – 2017)
1 Jan 2019
The various amendments from the annual improvement project 2015 – 2017
cycle affect minor changes to IFRS 3, IFRS 13, IAS 12 and IAS 23.
Not material.
Amendments to IAS 19
Plan Amendment,
Curtailment or
Settlement
1 Jan 2019
Where an amendment, curtailment or settlement of a defined benefit
plan occurs, the amendments require a company to use updated actuarial
assumptions to determine its current service cost and net interest for the
period. The effect of the asset ceiling is disregarded when calculating the gain
or loss on any settlement of the plan and is dealt with separately in other
comprehensive income (OCI).
TUI Group does currently not
expect any material impacts.
Framework
Amendments to
References to
Conceptual Framework
in IFRS Standards
1 Jan 2020
The revised Framework includes updated definitions of asset, liabilities as
well as new guidelines around measurement, derecognition, presentation
and disclosures. References from existing standards to the Framework are
being updated. The revised Framework is not subject to the endorsement
process.
No impact.
IFRS 3
Definition of a Business
1 Jan 2020
The amendments provide more guidance on the definition of a ‘business’
and aim at facilitating the assessment whether a transaction results in the
recognition of a group of assets or a business acquisition.
TUI Group will review the
impacts of the interpretation
on the consolidated financial
statements in due time.
We currently do not expect
any material impacts.
IAS 1 & IAS 8
Definition of Material
1 Jan 2020
The concept of materiality is an important concept when preparing accounts
in accordance with IFRS. The amendments clarify the definition of material
and how it should be applied. In addition the amendments ensure that the
definition of material is consistent across all IFRS Standards.
Not material.
IFRS 17 Insurance Contracts, newly published by the IASB on 18 May 2017, is not of relevance to TUI Group.

251NOT E S » oT He r NoT e S
(47) TUI Group Shareholdings
Company Country Capital share in %
Consolidated companies
Tourism
Absolut Holding Limited, Qormi Malta 99.9
Acampora Travel S.r.l., Sorrent Italy 100
Adehy Limited, Dublin1 Ireland 100
Advent Insurance PCC Limited, Qormi Malta 100
Africa Focus Tours Namibia Pty. Ltd., Windhuk1 Namibia 100
Antwun S.A., Clémency Luxembourg 100
Arccac Eurl, Bourg St. Maurice France 100
ATC African Travel Concept Pty. Ltd., Cape Town1 South Africa 50.1
ATC-Meetings and Conferences (Pty) Ltd, Cape Town1 South Africa 100
B2B d.o.o., Dubrovnik1 Croatia 100
Berge & Meer Touristik GmbH, Rengsdorf Germany 100
Blue Travel Partner Services S.A., Santo Domingo1 Dominican Republic 100
Boomerang-Reisen GmbH, Trier Germany 100
Boomerang-Reisen Vermögensverwaltungs GmbH, Trier Germany 87.2
Brunalp SARL, Venosc France 100
BU RIUSA II EOOD, Sofia Bulgaria 100
Cabotel-Hoteleria e Turismo Lda., Santiago Cape Verde 100
Cassata Travel s.r.l., Cefalù (Palermo)1 Italy 66
Citirama Ltd., Quatre Bornes1 Mauritius 100
Club Hotel CV SA , Santa Maria Cape Verde 100
Club Hôtel Management Tunisia SARL, Djerba Tunisia 100
Cruisetour AG, Zurich Switzerland 100
Crystal Holidays, Inc, Wilmington (Delaware) United States 100
Daidalos Hotel- und Touristikunternehmen A.E., Athens Greece 89.8
Darecko S.A., Clémency Luxembourg 100
Destination Services Greece Travel and Tourism SA, Piraeus1 Greece 100
Destination Services Morocco SA1 Morocco 100
Destination Services Singapore Pte Limited, Singapore1 Singapore 100
Destination Services Spain SL , Barcelona1 Spain 100
Egyptian Germany Co. for Hotels (L.T.D), Cairo Egypt 66.6
Elena SL , Palma de Mallorca Spain 100
Entreprises Hotelières et Touristiques PALADIEN Lena Mary A.E., Argolis Greece 100
Europa 2 Ltd, Valletta Malta 100
Explorers Travel Club Limited, Luton United Kingdom 100
First Choice (Turkey) Limited, Luton United Kingdom 100
First Choice Holiday Hypermarkets Limited, Luton United Kingdom 100
First Choice Holidays & Flights Limited, Luton United Kingdom 100
First Choice Land (Ireland) Limited, Dublin Ireland 100
First Choice Travel Shops (SW) Limited, Luton United Kingdom 100
First Choice Travel Shops Limited, Luton United Kingdom 100
Follow Coordinate Hotels Portugal Unipessoal Lda, Albufeira Portugal 100
FOX-TOURS Reisen GmbH, Rengsdorf Germany 100
Fritidsresor Tours & Travels India Pvt Ltd, Bardez, Goa India 100
GBH Turizm Sanayi Isletmecilik ve Ticaret A.S., Istanbul Turkey 100
GEAFOND Número Dos Fuerteventura S.A., Las Palmas, Gran Canaria Spain 100
GEAFOND Número Uno Lanzarote S.A., Las Palmas, Gran Canaria Spain 100
Germantur Turizm Ticaret A.S., Izmir Turkey 100
Groupement Touristique International S.A.S., Lille France 100
Gulliver Travel d.o.o., Dubrovnik1 Croatia 70
1 Destination Management of Hotelbeds
252 NOT E S » oT He r NoT e S
Company Country Capital share in %
Hannibal Tour SA , Tunis Tunisia 100
Hapag-Lloyd (Bahamas) Limited, Nassau Bahamas 100
Hapag-Lloyd Kreuzfahrten GmbH, Hamburg Germany 100
Hellenic EFS Hotel Management E.P.E., Athens Greece 100
Holiday Center S.A., Cala Serena/Cala d'Or Spain 100
Holidays Services S.A., Agadir Morocco 100
Hotelbeds Costa Rica SA , San José1 Costa Rica 100
Iberotel International A.S., Antalya Turkey 100
Iberotel Otelcilik A.S., Istanbul Turkey 100
Imperial Cruising Company SARL, Heliopolis-Cairo Egypt 90
Incorun SAS, Saint Denis1 France 51
Inter Hotel SARL, Tunis Tunisia 100
Intercruises Shoreside & Port Services Canada, Inc., Quebec1 Canada 100
Intercruises Shoreside & Port Services PTY LTD, Sydney1 Australia 100
Intercruises Shoreside & Port Services S.a.r.l., Paris1 France 100
Intercruises Shoreside & Port Services Sam, Monaco1 Monaco 100
Intercruises Shoreside & Port Services, Inc., State of Delaware1 United States 100
Itaria Limited, Nicosia Cyprus 100
Jandia Playa S.A., Morro Jable/Fuerteventura Spain 100
Jetair Real Estate N.V., Brussels Belgium 100
Kras B.V., Ammerzoden Netherlands 100
Kurt Safari (Pty) Ltd, White River – Mpumalanga1 South Africa 51
Label Tour EURL, Levallois Perret France 100
Lapter Eurl, Macot La Plagne France 100
Last-Minute-Restplatzreisen GmbH, Baden-Baden Germany 100
Le Passage to India Tours and Travels Pvt Ltd, New Delhi1 India 91
Lodges & Mountain Hotels SARL, Notre Dame de Bellecombe, Savoie France 100
l'tur GmbH, Baden-Baden Germany 100
L'TUR Suisse AG, Dübendorf/ZH Switzerland 99.5
Lunn Poly Limited, Luton United Kingdom 100
Luso Ds - Agência de Viagens Unipessoal Lda, Faro1 Portugal 100
Lusomice Unipessoal Lda., Lisbon1 Portugal 100
Magic Hotels SA , Tunis Tunisia 100
MAGIC LIFE Assets GmbH, Vienna Austria 100
Magic Life Egypt for Hotels LLC , Sharm el Sheikh Egypt 100
Magic Life Greece Tourist Enterprises E.P.E., Athens Greece 100
Magic Tourism International S.A., Tunis Tunisia 100
Manahe Ltd., Quatre Bornes1 Mauritius 51
Medico Flugreisen GmbH, Baden-Baden Germany 100
Meetings & Events International Limited, Luton1 United Kingdom 100
Meetings & Events Spain S.L.U., Palma de Mallorca1 Spain 100
Meetings & Events UK Limited, Luton1 United Kingdom 100
Morvik EURL, Bourg Saint Maurice France 100
MX RIUSA II S.A. de C.V., Cabo San Lucas Mexico 100
Nazar Nordic AB, Malmö Sweden 100
Nordotel S.A., San Bartolomé de Tirajana Spain 100
Nouvelles Frontières Senegal S.R.L., Dakar Senegal 100
Nungwi Limited, Sansibar Tanzania 100
Ocean College LLC , Sharm el Sheikh Egypt 100
Ocean Ventures for Hotels and Tourism Services SAE, Sharm el Sheikh Egypt 98
Pacific World (Beijing) Travel Agency Co., Ltd., Peking1 China 100
Pacific World (Shanghai) Travel Agency Co. Limited, Shanghai1 China 100
Pacific World Meetings & Events (Thailand) Limited, Bangkok1, 2 Thailand 49
Pacific World Meetings & Events Hellas Travel Limited, Athens1 Greece 100
1 Destination Management of Hotelbeds2 Controlling influence
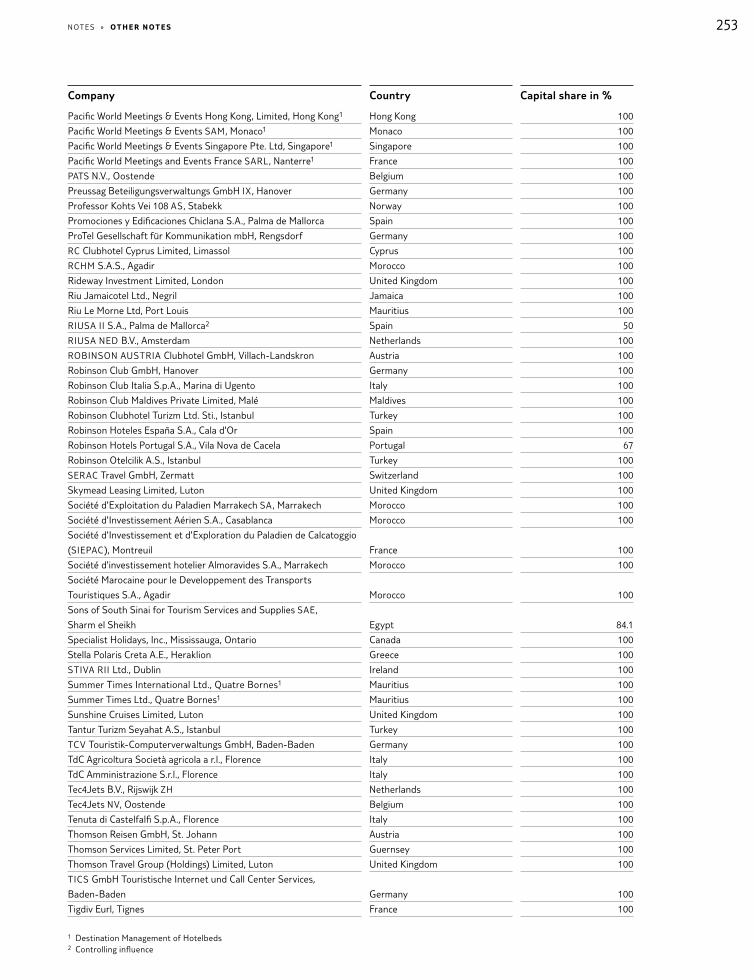
253NOT E S » oT He r NoT e S
Company Country Capital share in %
Pacific World Meetings & Events Hong Kong, Limited, Hong Kong1 Hong Kong 100
Pacific World Meetings & Events SAM, Monaco1 Monaco 100
Pacific World Meetings & Events Singapore Pte. Ltd, Singapore1 Singapore 100
Pacific World Meetings and Events France SARL, Nanterre1 France 100
PATS N.V., Oostende Belgium 100
Preussag Beteiligungsverwaltungs GmbH IX , Hanover Germany 100
Professor Kohts Vei 108 AS, Stabekk Norway 100
Promociones y Edificaciones Chiclana S.A., Palma de Mallorca Spain 100
ProTel Gesellschaft für Kommunikation mbH, Rengsdorf Germany 100
RC Clubhotel Cyprus Limited, Limassol Cyprus 100
RCHM S.A.S., Agadir Morocco 100
Rideway Investment Limited, London United Kingdom 100
Riu Jamaicotel Ltd., Negril Jamaica 100
Riu Le Morne Ltd, Port Louis Mauritius 100
RIUSA II S.A., Palma de Mallorca2 Spain 50
RIUSA NED B.V., Amsterdam Netherlands 100
ROBINSON AUSTRIA Clubhotel GmbH, Villach-Landskron Austria 100
Robinson Club GmbH, Hanover Germany 100
Robinson Club Italia S.p.A., Marina di Ugento Italy 100
Robinson Club Maldives Private Limited, Malé Maldives 100
Robinson Clubhotel Turizm Ltd. Sti., Istanbul Turkey 100
Robinson Hoteles España S.A., Cala d'Or Spain 100
Robinson Hotels Portugal S.A., Vila Nova de Cacela Portugal 67
Robinson Otelcilik A.S., Istanbul Turkey 100
SERAC Travel GmbH, Zermatt Switzerland 100
Skymead Leasing Limited, Luton United Kingdom 100
Société d'Exploitation du Paladien Marrakech SA , Marrakech Morocco 100
Société d'Investissement Aérien S.A., Casablanca Morocco 100
Société d'Investissement et d'Exploration du Paladien de Calcatoggio
(SIEPAC), Montreuil France 100
Société d'investissement hotelier Almoravides S.A., Marrakech Morocco 100
Société Marocaine pour le Developpement des Transports
Touristiques S.A., Agadir Morocco 100
Sons of South Sinai for Tourism Services and Supplies SAE,
Sharm el Sheikh Egypt 84.1
Specialist Holidays, Inc., Mississauga, Ontario Canada 100
Stella Polaris Creta A.E., Heraklion Greece 100
STIVA RII Ltd., Dublin Ireland 100
Summer Times International Ltd., Quatre Bornes1 Mauritius 100
Summer Times Ltd., Quatre Bornes1 Mauritius 100
Sunshine Cruises Limited, Luton United Kingdom 100
Tantur Turizm Seyahat A.S., Istanbul Turkey 100
TCV Touristik-Computerverwaltungs GmbH, Baden-Baden Germany 100
TdC Agricoltura Società agricola a r.l., Florence Italy 100
TdC Amministrazione S.r.l., Florence Italy 100
Tec4Jets B.V., Rijswijk ZH Netherlands 100
Tec4Jets NV, Oostende Belgium 100
Tenuta di Castelfalfi S.p.A., Florence Italy 100
Thomson Reisen GmbH, St. Johann Austria 100
Thomson Services Limited, St. Peter Port Guernsey 100
Thomson Travel Group (Holdings) Limited, Luton United Kingdom 100
TICS GmbH Touristische Internet und Call Center Services,
Baden-Baden Germany 100
Tigdiv Eurl, Tignes France 100
1 Destination Management of Hotelbeds2 Controlling influence

254 NOT E S » oT He r NoT e S
Company Country Capital share in %
TLT Reisebüro GmbH, Hanover Germany 100
Transfar - Agencia de Viagens e Turismo Lda., Faro Portugal 100
Travel Choice Limited, Luton United Kingdom 100
Travel Partner Mexico SA de CV, Mexico City1 Mexico 100
TT Hotels Italia S.R.L., Rome Italy 100
TT Hotels Turkey Otel Hizmetleri Turizm ve ticaret AS, Antalya Turkey 100
TUI (Cyprus) Limited, Nicosia Cyprus 100
TUI (Suisse) AG, Zurich Switzerland 100
TUI 4 U GmbH, Bremen Germany 100
TUI Airlines Belgium N.V., Oostende Belgium 100
TUI Airlines Nederland B.V., Rijswijk Netherlands 100
TUI Airways Limited, Luton United Kingdom 100
TUI aqtiv GmbH, Hanover Germany 100
TUI Austria Holding GmbH, Vienna Austria 100
TUI Belgium NV, Oostende Belgium 100
TUI Belgium Retail N.V., Zaventem Belgium 100
TUI BLUE AT GmbH, Schladming Austria 100
TUI Bulgaria EOOD, Varna Bulgaria 100
TUI Curaçao N.V., Curaçao Country of Curaçao 100
TUI Customer Operations GmbH, Hanover Germany 100
TUI Danmark A/S, Copenhagen Denmark 100
TUI Destination Services Cyprus, Nicosia Cyprus 100
TUI Deutschland GmbH, Hanover Germany 100
TUI Dominicana SAS, Higuey Dominican Republic 100
TUI DS USA , Inc, Wilmington (Delaware) United States 100
TUI España Turismo SL , Palma de Mallorca Spain 100
TUI Finland Oy Ab, Helsinki Finland 100
TUI France SAS, Nanterre France 100
TUI Hellas Travel Tourism and Airline A.E., Athens Greece 100
TUI Holding Spain S.L., Palma de Mallorca Spain 100
TUI Hotel Betriebsgesellschaft mbH, Hanover Germany 100
TUI Ireland Limited, Luton United Kingdom 100
TUI Jamaica Limited, Montego Bay Jamaica 100
TUI Leisure Travel Special Tours GmbH, Hanover Germany 100
TUI Magic Life GmbH, Hanover Germany 100
TUI Malta Limited, Pieta Malta 100
TUI Mexicana SA de CV, Mexico Mexico 100
TUI Nederland Holding N.V., Rijswijk Netherlands 100
TUI Nederland N.V., Rijswijk Netherlands 100
TUI Nordic Holding AB, Stockholm Sweden 100
TUI Norge AS, Stabekk Norway 100
TUI Northern Europe Limited, Luton United Kingdom 100
TUI Norway Holding AS, Stabekk Norway 100
TUI Österreich GmbH, Vienna Austria 100
TUI Pension Scheme (UK) Limited, Luton United Kingdom 100
TUI Poland Dystrybucja Sp. z o.o., Warsaw Poland 100
TUI Poland Sp. z o.o., Warsaw Poland 100
TUI PORTUGAL - Agencia de Viagens e Turismo S.A., Faro Portugal 100
TUI Reisecenter Austria Business Travel GmbH, Vienna Austria 74.9
TUI Service AG, Altendorf Switzerland 100
TUI Suisse Retail AG, Zurich Switzerland 100
TUI Sverige AB, Stockholm Sweden 100
TUI Technology NV, Zaventem Belgium 100
TUI Travel (Ireland) Limited, Dublin Ireland 100
1 Destination Management of Hotelbeds

255NOT E S » oT He r NoT e S
Company Country Capital share in %
TUI Travel Distribution N.V., Oostende Belgium 100
TUI UK Italia Srl, Turin Italy 100
TUI UK Limited, Luton United Kingdom 100
TUI UK Retail Limited, Luton United Kingdom 100
TUI UK Transport Limited, Luton United Kingdom 100
TUIfly GmbH, Langenhagen Germany 100
TUIfly Nordic AB, Stockholm Sweden 100
TUIfly Vermarktungs GmbH, Hanover Germany 100
Tunisie Investment Services Holding S.A., Tunis Tunisia 100
Tunisie Voyages S.A., Tunis Tunisia 100
Tunisotel S.A.R.L., Tunis Tunisia 100
Turcotel Turizm A.S., Istanbul Turkey 100
Turkuaz Insaat Turizm A.S., Ankara Turkey 100
Ultramar Express Transport S.A., Palma de Mallorca Spain 100
Wolters Reisen GmbH, Stuhr Germany 100
WonderCruises AB, Stockholm Sweden 100
WonderHolding AB, Stockholm Sweden 100
WOT Hotels Adriatic Management d.o.o., Zagreb Croatia 51
Zanzibar Beach Village Limited, Sansibar Tanzania 100
All other segments
Absolut Insurance Limited, St. Peter Port Guernsey 100
Asiarooms Pte Ltd, Singapore Singapore 100
B.D.S Destination Services Tours, Cairo Egypt 100
Canadian Pacific (UK) Limited, Luton United Kingdom 100
Cast Agencies Europe Limited, Luton United Kingdom 100
Cheqqer B.V., Rijswijk Netherlands 100
Corsair S.A., Rungis France 100
CP Ships (Bermuda) Ltd., Hamilton Bermuda 100
CP Ships (UK) Limited, Luton United Kingdom 100
CP Ships Ltd., Saint John Canada 100
DEFAG Beteiligungsverwaltungs GmbH I, Hanover Germany 100
DEFAG Beteiligungsverwaltungs GmbH III , Hanover Germany 100
First Choice Holidays Finance Limited, Luton United Kingdom 100
First Choice Holidays Limited, Luton United Kingdom 100
First Choice Olympic Limited, Luton United Kingdom 100
First Choice Overseas Holdings Limited, Luton United Kingdom 100
Hapag-Lloyd Executive GmbH, Langenhagen Germany 100
I Viaggi del Turchese S.r.l., Fidenza Italy 100
Jetset Group Holding (Brazil) Limited, Luton United Kingdom 100
Jetset Group Holding Limited, Luton United Kingdom 100
Leibniz-Service GmbH, Hanover Germany 100
Mala Pronta Viagens e Turismo Ltda., Curitiba Brazil 100
Manufacturer's Serialnumber 852 Limited, Dublin Ireland 100
MSN 1359 GmbH, Hanover Germany 100
Paradise Hotels Management Company LLC, Cairo Egypt 100
PM Peiner Maschinen GmbH, Hanover Germany 100
Sovereign Tour Operations Limited, Luton United Kingdom 100
Thomson Airways Trustee Limited, Luton United Kingdom 100
travel-Ba.Sys GmbH & Co KG, Mülheim an der Ruhr Germany 83.5
TUI Ambassador Tours Unipessoal Lda, Lisbon Portugal 100
TUI Aviation GmbH, Hanover Germany 100
TUI Beteiligungs GmbH, Hanover Germany 100
TUI Brasil Operadora e Agencia de Viagens LTDA , Curitiba Brazil 100
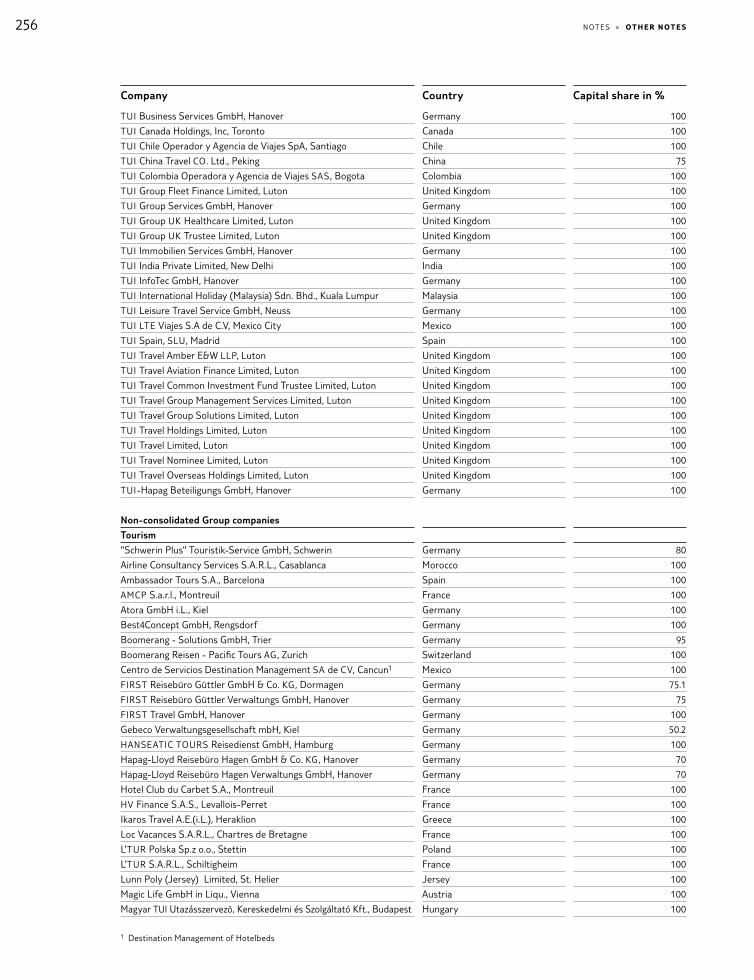
256 NOT E S » oT He r NoT e S
Company Country Capital share in %
TUI Business Services GmbH, Hanover Germany 100
TUI Canada Holdings, Inc, Toronto Canada 100
TUI Chile Operador y Agencia de Viajes SpA, Santiago Chile 100
TUI China Travel CO. Ltd., Peking China 75
TUI Colombia Operadora y Agencia de Viajes SAS, Bogota Colombia 100
TUI Group Fleet Finance Limited, Luton United Kingdom 100
TUI Group Services GmbH, Hanover Germany 100
TUI Group UK Healthcare Limited, Luton United Kingdom 100
TUI Group UK Trustee Limited, Luton United Kingdom 100
TUI Immobilien Services GmbH, Hanover Germany 100
TUI India Private Limited, New Delhi India 100
TUI InfoTec GmbH, Hanover Germany 100
TUI International Holiday (Malaysia) Sdn. Bhd., Kuala Lumpur Malaysia 100
TUI Leisure Travel Service GmbH, Neuss Germany 100
TUI LTE Viajes S.A de C.V, Mexico City Mexico 100
TUI Spain, SLU, Madrid Spain 100
TUI Travel Amber E&W LLP, Luton United Kingdom 100
TUI Travel Aviation Finance Limited, Luton United Kingdom 100
TUI Travel Common Investment Fund Trustee Limited, Luton United Kingdom 100
TUI Travel Group Management Services Limited, Luton United Kingdom 100
TUI Travel Group Solutions Limited, Luton United Kingdom 100
TUI Travel Holdings Limited, Luton United Kingdom 100
TUI Travel Limited, Luton United Kingdom 100
TUI Travel Nominee Limited, Luton United Kingdom 100
TUI Travel Overseas Holdings Limited, Luton United Kingdom 100
TUI-Hapag Beteiligungs GmbH, Hanover Germany 100
Non-consolidated Group companies
Tourism
"Schwerin Plus" Touristik-Service GmbH, Schwerin Germany 80
Airline Consultancy Services S.A.R.L., Casablanca Morocco 100
Ambassador Tours S.A., Barcelona Spain 100
AMCP S.a.r.l., Montreuil France 100
Atora GmbH i.L., Kiel Germany 100
Best4Concept GmbH, Rengsdorf Germany 100
Boomerang - Solutions GmbH, Trier Germany 95
Boomerang Reisen - Pacific Tours AG, Zurich Switzerland 100
Centro de Servicios Destination Management SA de CV, Cancun1 Mexico 100
FIRST Reisebüro Güttler GmbH & Co. KG, Dormagen Germany 75.1
FIRST Reisebüro Güttler Verwaltungs GmbH, Hanover Germany 75
FIRST Travel GmbH, Hanover Germany 100
Gebeco Verwaltungsgesellschaft mbH, Kiel Germany 50.2
HANSEATIC TOURS Reisedienst GmbH, Hamburg Germany 100
Hapag-Lloyd Reisebüro Hagen GmbH & Co. KG, Hanover Germany 70
Hapag-Lloyd Reisebüro Hagen Verwaltungs GmbH, Hanover Germany 70
Hotel Club du Carbet S.A., Montreuil France 100
HV Finance S.A.S., Levallois-Perret France 100
Ikaros Travel A.E.(i.L.), Heraklion Greece 100
Loc Vacances S.A.R.L., Chartres de Bretagne France 100
L'TUR Polska Sp.z o.o., Stettin Poland 100
L'TUR S.A.R.L., Schiltigheim France 100
Lunn Poly (Jersey) Limited, St. Helier Jersey 100
Magic Life GmbH in Liqu., Vienna Austria 100
Magyar TUI Utazásszervezö, Kereskedelmi és Szolgáltató Kft., Budapest Hungary 100
1 Destination Management of Hotelbeds

257NOT E S » oT He r NoT e S
Company Country Capital share in %
N.S.E. Travel and Tourism A.E. (i.L.), Athens Greece 100
NEA Synora Hotels Limited (Hinitsa Beach), Porto Heli Argolide Greece 100
New Eden S.A., Marrakech Morocco 100
NOF Sociedade Imobiliaria, Lda, Lisbon Portugal 100
Nouvelles Frontières Burkina Faso EURL, Ouagadougou Burkina Faso 100
Nouvelles Frontières Tereso EURL, Grand Bassam Ivory Coast 100
Nouvelles Frontières Togo S.R.L.(i.L), Lome Togo 99
Reisefalke GmbH, Vienna Austria 60
Résidence Hôtelière Les Pins SARL (i.L.), Montreuil France 100
RIUSA Brasil Empreendimentos Ltda., Igarassu (Pernambuco) Brazil 99
Societe de Gestion du resort Al Baraka, Marrakech Morocco 100
STAR TOURS Reisedienst GmbH, Hamburg Germany 100
TLT Urlaubsreisen GmbH, Hanover Germany 100
Transat Développement SAS, Ivri-sur-Seine France 100
Trendturc Turizm Otelcilik ve Ticaret A.S., Istanbul Turkey 100
TUI 4 U Poland sp.zo.o., Warsaw Poland 100
TUI d.o.o., Maribor Slovenia 100
TUI Magyarország Utazasi Iroda Kft., Budapest Hungary 100
TUI Reisecenter GmbH, Salzburg Austria 100
TUI ReiseCenter Slovensko s.r.o., Bratislava Slovakia (Slovak Republic) 100
TUI Travel Cyprus Limited, Nicosia Cyprus 100
TUIFly Academy Brussels, Zaventem Belgium 100
V.P.M. SA , Levallois Perret France 100
VPM Antilles S.R.L., Levallois Perret France 100
All other segments
Bergbau Goslar GmbH, Goslar Germany 100
l'tur ultimo minuto S.A., Palma de Mallorca Spain 51
Mango Event Management Limited, London United Kingdom 100
Preussag Beteiligungsverwaltungs GmbH XIV, Hanover Germany 100
Società Consortile a r.l. Tutela dei Viaggiatori i Viaggi del Turchese,
Fidenza (Pr) Italy 100
Sportsworld Holdings Limited, Luton United Kingdom 100
travel-Ba.Sys Beteiligungs GmbH, Mülheim an der Ruhr Germany 83.5
TUI Insurance Services GmbH, Hanover Germany 100
Joint ventures and associates
Tourism
Ahungalla Resorts Limited, Colombo Sri Lanka 40
Aitken Spence Travels (Private) Limited, Colombo Sri Lanka 50
Alpha Tourism and Marketing Services Ltd., Port Louis1 Mauritius 25
Alpha Travel (U.K.) Limited, Harrow1 United Kingdom 25
Atlantica Hellas A.E., Rhodos Greece 50
Atlantica Hotels and Resorts Limited, Lemesos Cyprus 49.9
Bartu Turizm Yatirimlari Anonim Sirketi, Istanbul Turkey 50
Daktari Travel & Tours Ltd., Limassol Cyprus 33.3
DER Reisecenter TUI GmbH, Berlin Germany 50
ENC for touristic Projects Company S.A.E., Sharm el Sheikh Egypt 50
Etapex, S.A., Agadir Morocco 35
Fanara Residence for Hotels S.A.E., Sharm el Sheikh Egypt 50
Gebeco Gesellschaft für internationale Begegnung und
Cooperation mbH & Co. KG, Kiel Germany 50.1
GRUPOTEL DOS S.A., Can Picafort Spain 50
Holiday Travel (Israel) Limited, Airport City Israel 50
1 Destination Management of Hotelbeds
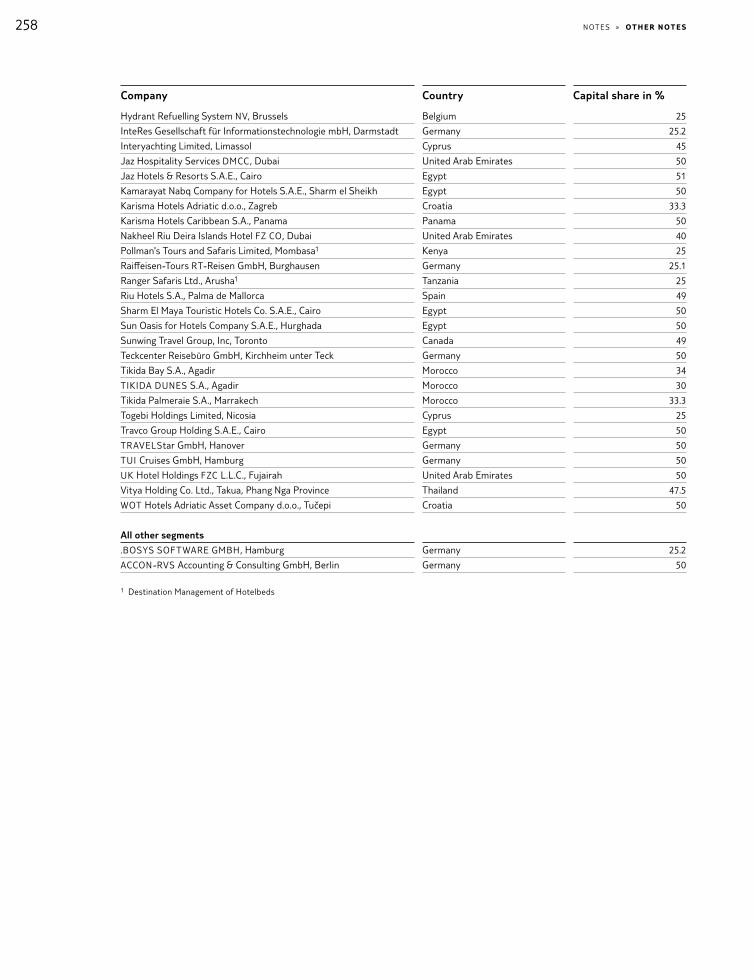
258 NOT E S » oT He r NoT e S
Company Country Capital share in %
Hydrant Refuelling System NV, Brussels Belgium 25
InteRes Gesellschaft für Informationstechnologie mbH, Darmstadt Germany 25.2
Interyachting Limited, Limassol Cyprus 45
Jaz Hospitality Services DMCC, Dubai United Arab Emirates 50
Jaz Hotels & Resorts S.A.E., Cairo Egypt 51
Kamarayat Nabq Company for Hotels S.A.E., Sharm el Sheikh Egypt 50
Karisma Hotels Adriatic d.o.o., Zagreb Croatia 33.3
Karisma Hotels Caribbean S.A., Panama Panama 50
Nakheel Riu Deira Islands Hotel FZ CO, Dubai United Arab Emirates 40
Pollman's Tours and Safaris Limited, Mombasa1 Kenya 25
Raiffeisen-Tours RT-Reisen GmbH, Burghausen Germany 25.1
Ranger Safaris Ltd., Arusha1 Tanzania 25
Riu Hotels S.A., Palma de Mallorca Spain 49
Sharm El Maya Touristic Hotels Co. S.A.E., Cairo Egypt 50
Sun Oasis for Hotels Company S.A.E., Hurghada Egypt 50
Sunwing Travel Group, Inc, Toronto Canada 49
Teckcenter Reisebüro GmbH, Kirchheim unter Teck Germany 50
Tikida Bay S.A., Agadir Morocco 34
TIKIDA DUNES S.A., Agadir Morocco 30
Tikida Palmeraie S.A., Marrakech Morocco 33.3
Togebi Holdings Limited, Nicosia Cyprus 25
Travco Group Holding S.A.E., Cairo Egypt 50
TRAVELStar GmbH, Hanover Germany 50
TUI Cruises GmbH, Hamburg Germany 50
UK Hotel Holdings FZC L.L.C., Fujairah United Arab Emirates 50
Vitya Holding Co. Ltd., Takua, Phang Nga Province Thailand 47.5
WOT Hotels Adriatic Asset Company d.o.o., Tučepi Croatia 50
All other segments
.BOSYS SOFTWARE GMBH, Hamburg Germany 25.2
ACCON-RVS Accounting & Consulting GmbH, Berlin Germany 50
1 Destination Management of Hotelbeds

259R E SP ON S IB IL I T Y S TAT E ME N T BY M A N AGE ME N T
RESPONSIBIL IT Y STATEMENT BY MANAGEMENT
To the best of our knowledge, and in accordance with the applicable reporting principles, the consolidated financial state-ments give a true and fair view of the net assets, financial position and results of operations of the Group, and the Group Management Report includes a fair review of the development and performance of the business and the position of the Group, together with a description of the principal opportunities and risks associated with the expected development of the Group.
Hanover, 11 December 2018
The Executive Board
Friedrich Joussen Horst Baier Birgit Conix
David Burling Sebastian Ebel Dr Elke Eller
Frank Rosenberger
260 I NDE PE NDE N T AU D I TO R ’ S R E P O R T
INDEPENDENT AUDITOR’S REPORT
To TUI AG, Berlin and Hanover / Germany
Report on the audit of the consolidated financial statements and of the combined management report
Audit Opinions
We have audited the consolidated financial statements of TUI AG, Berlin and Hanover / Germany, and its subsidiaries (the Group), which comprise the consolidated statement of financial position as at 30 September 2018, and the income statement, the consolidated statement of comprehensive income, the consolidated statement of changes in equity and the consolidated statement of cash flows for the financial year from 1 October 2017 to 30 September 2018, and the notes to the consolidated financial statements, including a summary of significant accounting policies. In addition, we have audited the group management report of TUI AG, Berlin and Hanover / Germany, for the financial year from 1 October 2017 to 30 September 2018, which was combined with the management report of the Parent. In accordance with the German legal requirements, we have not audited the content of the parts of the combined management report listed in the Appendix to the Independent Auditor’s Report.
In our opinion, on the basis of the knowledge obtained in the audit,
• the accompanying consolidated financial statements comply, in all material respects, with the International Financial Reporting Standards (IFRS) as adopted by the EU, and the additional requirements of German commercial law pursuant to § [Article] 315e Abs. [paragraph] 1 HGB [Handelsgesetzbuch: German Commercial Code] and, in compliance with these requirements, give a true and fair view of the assets, liabilities, and financial position of the Group as at 30 September 2018, and of its financial performance for the financial year from 1 October 2017 to 30 September 2018, and
• the accompanying combined management report as a whole provides an appropriate view of the Group’s position. In all material respects, this combined management report is consistent with the consolidated financial statements, complies with German legal requirements and appropriately presents the opportunities and risks of future development. Our audit opinion on the combined management report does not cover the content of the parts of the combined management report listed in the Appendix to the Independent Auditor’s Report.
Pursuant to § 322 Abs. 3 Satz [Sentence] 1 HGB, we declare that our audit has not led to any reservations relating to the legal compliance of the consolidated financial statements and of the combined management report.
Basis for the Audit Opinions
We conducted our audit of the consolidated financial statements and of the combined management report in accordance with § 317 HGB and the EU Audit Regulation (No. 537 / 2014, referred to subsequently as “EU Audit Regulation”) in compliance with German Generally Accepted Standards for Financial Statement Audits promulgated by the Institut der Wirtschaftsprüfer [Institute of Public Auditors in Germany] (IDW). We performed the audit of the consolidated financial statements in supplementary compliance with the International Standards on Auditing (ISAs). Our responsibilities under those requirements, principles and standards are further described in the “Auditor’s Responsibilities for the Audit of the Consolidated Financial Statements and of the Combined Management Report” section of our auditor’s report. We

261I NDE PE NDE N T AU D I TO R ’ S R E P O R T
are independent of the group entities in accordance with the requirements of European law and German commercial and professional law, and we have fulfilled our other German professional responsibilities in accordance with these requirements. In addition, in accordance with Article 10 (2) Point (f) of the EU Audit Regulation, we declare that we have not provided non-audit services prohibited under Article 5 (1) of the EU Audit Regulation. We believe that the audit evidence we have obtained is sufficient and appropriate to provide a basis for our audit opinions on the consolidated financial statements and on the group management report.
Key Audit Matters in the Audit of the Consolidated Financial Statements
Key audit matters are those matters that, in our professional judgement, were of most significance in our audit of the consolidated financial statements for the financial year from 1 October 2017 to 30 September 2018. These matters were addressed in the context of our audit of the consolidated financial statements as a whole and in forming our audit opinion thereon; we do not provide a separate audit opinion on these matters.
In the following, we present the key audit matters we have determined in the course of our audit:
1 Recoverability of goodwill2 Recoverability of touristic payments on account for hotel services3 Recoverability of deferred tax assets4 Specific provisions5 Presentation of the acquisition of Destination Management
Our presentation of these key audit matters has been structured as follows:
A Description (including reference to corresponding information in the consolidated financial statements)B Auditor’s response
1 Recoverability of goodwill
A In TUI AG’s consolidated financial statements as at 30 September 2018, goodwill totalling mEUR 2,958.6 is reported under the statement of financial position item “Goodwill”. Goodwill is subject to an impairment test at least once a year, namely as of 30 June of the financial year. Measurement is by means of a valuation model based on the Discounted Cash Flow method. The result of this valuation depends to a great extent on the estimate of future cash inflows by the Management Board and also on the discount rate used. Thus, the valuation is subject to a significant uncertainty. Against this background, we believe that this is a key audit matter.
The Company’s disclosures on goodwill are provided in Note (13) of the Notes to the consolidated financial statements.
B We investigated the process for performing the impairment test on goodwill and conducted an audit of the accounting- relevant controls contained therein. Specifically, we convinced ourselves of the appropriateness of the future cash inflows used in the calculation. To do so, among other things we compared these figures with the current budgets contained in the three-year plan adopted by the Management Board and approved by the Supervisory Board, and checked it against general and industry-specific market expectations. Since even relatively small changes in the discount rate can have a material effect on the amount of the business value determined in this way, we also focused on examining the parameters used to determine the discount rate used, including the Weighted Average Cost of Capital, and analysed the calculation algorithm. Owing to the material significance of goodwill and the fact that the valuation also depends on macroeconomic conditions which are beyond the control of the Company, we also assessed the sensitivity analyses prepared by the Company for the cash-generating units with low excess cover (carrying amount compared to present value).
262 I NDE PE NDE N T AU D I TO R ’ S R E P O R T
2 Recoverability of touristic payments on account for hotel services
A Payments on account for hotel services amounting to mEUR 366.1 are recognised under the statement of financial position item “Touristic payments on account” in TUI AG’s consolidated financial statements as at 30 September 2018.
In our opinion, this is a key audit matter, as the measurement of this significant item is based to a large extent on estimates and assumptions made by the Management Board.
The Company’s disclosures on “Touristic payments on account” are provided in Note (18) of the Notes to the consolidated financial statements.
B We investigated the process of evaluating hotel prepayments and carried out an audit of the accounting-relevant controls contained therein. In the knowledge that there is an increased risk of misstatements in financial reporting with estimated values and that the valuation decisions of the Management Board have a direct and significant effect on the consolidated net income, we have assessed the appropriateness of the valuations by comparing these values with historical values and using the contractual bases presented to us. We assessed the recoverability of touristic payments on account in particular against the background of current developments in Turkey and North Africa. For this, we took into account, among other things, the repayment schedules agreed with the hoteliers concerned, the options for offsetting against future overnight accommodation and the framework agreements concluded.
3 Recoverability of deferred tax assets
A TUI AG’s consolidated financial statements as at 30 September 2018 report deferred tax assets totalling mEUR 225.7 under the statement of financial position item “Deferred tax assets”. Recoverability of the deferred tax assets recognised is measured by means of forecasts about the future earnings situation.
In our opinion, this is a key audit matter because it depends to a large extent on estimates and assumptions made by the Management Board and is subject to uncertainties.
The Company’s disclosures on deferred tax assets are provided in the Notes to the consolidated financial statements “Accounting and measurement methods” and under Note (19).
B We involved our own tax specialists in our audit of tax issues. With their support we assessed the internal processes and controls established for recording tax issues. We assessed the recoverability of deferred tax assets on the basis of internal forecasts on the future taxable income situation of TUI AG and its major subsidiaries. In this context, we referred to the planning prepared by the Management Board and assessed the appropriateness of the planning basis used. Among other things, these were examined in the light of general and industry-specific market expectations.

263I NDE PE NDE N T AU D I TO R ’ S R E P O R T
4 Specific provisions
A Provisions for maintenance amounting to mEUR 669.6 and provisions for onerous hotel lease contracts amounting to mEUR 4.4 are disclosed under the statement of financial position item “Other provisions” in TUI AG’s consolidated financial statements as at 30 September 2018. Furthermore, provisions for pensions and similar obligations amounting to mEUR 994.8 were recognized as at 30 September 2018. In our opinion, these are key audit matters, as the recognition and measurement of these significant items are based to a large extent on estimates and assumptions made by the Management Board.
The Company’s disclosures on provisions are provided under the Notes (28) and (29) as well as under the disclosures on accounting and measurement methods in the Notes to the consolidated financial statements.
B We investigated the process of recognising and measuring specific provisions and carried out an audit of the accounting-relevant controls contained therein. In the knowledge that there is an increased risk of misstatements in financial reporting with estimated values and that the valuation decisions of the Management Board have a direct and significant effect on consolidated net income, we assessed the appropriateness of the valuations by comparing these values with historical values and using the contractual bases presented to us.
Among other things we
• assessed the computation of the expected maintenance costs for aircrafts. This was done on the basis of Group-wide maintenance contracts, price increases expected on the basis of external market forecasts and the discount rates applied, supported by our own analyses;
• assessed the appropriateness of the valuation parameters used to calculate the pension provisions. Among other things we did this by comparing them with market data and including the expertise of our internal pension valuation experts.
• assessed the valuation of the provision for onerous hotel leasing contracts, in particular for hotels in Turkey. We did this, among other things, on the basis of the contracts concluded and the Company’s profit planning for the individual hotels.
5 Presentation of the acquisition of Destination Management
A In 2018, TUI has acquired shares of 47 companies of the Destination management line of HNVR Midco Limited for a purchase price of mEUR 94.8. For performing the final purchase price allocation on the acquired assets and liabilities, a period of 12 months as from the date of acquisition, i.e. until end of July 2019 is available. In our opinion, the presentation of the acquisition of the companies of the Destination management line within the statement of financial position is a key audit matter since the identification of the acquired assets and liabilities, their recognition as well as also their valuation are highly dependent on discretionary estimates and assumptions of the Management Board and since the used valuation models are very complex.
The disclosures on the acquisition of the companies of the Destination management line are provided in the section “Acquisitions” of the Notes to the consolidated financial statements.
B We have audited the performed allocation of the purchase price to the acquired assets and liabilities. In doing so, we have included the knowledge of our internal experts for the accounting of business acquisitions and assessed the assumptions made when identifying assets and liabilities.
264 I NDE PE NDE N T AU D I TO R ’ S R E P O R T
Other information
The Management Board is responsible for the other information. The other information comprises:
• the parts of the combined management report whose contents were not audited listed in the Appendix to the Independent Auditor’s Report
• the responsibility statement by management relating to the consolidated financial statements and to the combined management report pursuant to § 297 Abs. 2 Satz 4 and § 315 Abs. 1 Satz 5 HGB respectively, and
• the remaining parts of the Annual Report, with the exception of the audited consolidated financial statements and combined management report and our auditor’s report.
Our audit opinions on the consolidated financial statements and on the combined management report do not cover the other information, and consequently we do not express an audit opinion or any other form of assurance conclusion thereon.
In connection with our group audit, our responsibility is to read the other information and, in doing so, to consider whether the other information
• is materially inconsistent with the consolidated financial statements, with the combined management report or our knowledge obtained in the audit, or
• otherwise appears to be materially misstated.
If, based on the work we have performed, we conclude that there is a material misstatement of this other information, we are required to report that fact. We have nothing to report in this regard.
R E S P O N S I B I L I T I E S O F T H E M A N AG E M E N T B OA R D A N D T H E S U P E R V I S O RY B OA R D F O R T H E
CO N S O L I DAT E D F I N A N C I A L S TAT E M E N T S A N D T H E CO M B I N E D M A N AG E M E N T R E P O R T
The Management Board is responsible for the preparation of the consolidated financial statements that comply, in all material respects, with IFRSs as adopted by the EU and the additional requirements of German commercial law pursuant to § 315e Abs. 1 HGB and that the consolidated financial statements, in compliance with these requirements, give a true and fair view of the assets, liabilities, financial position, and financial performance of the Group. In addition, the Management Board is responsible for such internal control as they have determined necessary to enable the preparation of consolidated financial statements that are free from material misstatement, whether due to fraud or error.
In preparing the consolidated financial statements, the Management Board is responsible for assessing the Group’s ability to continue as a going concern. It also has the responsibility for disclosing, as applicable, matters related to going concern. In addition, it is responsible for financial reporting based on the going concern basis of accounting unless there is an intention to liquidate the Group or to cease operations, or there is no realistic alternative but to do so.
Furthermore, the Management Board is responsible for the preparation of the combined management report that, as a whole, provides an appropriate view of the Group’s position and is, in all material respects, consistent with the consolidated financial statements, complies with German legal requirements, and appropriately presents the opportunities and risks of future development. In addition, the Management Board is responsible for such arrangements and measures (systems) as it has considered necessary to enable the preparation of a combined management report that is in accordance with the applicable German legal requirements, and to be able to provide sufficient appropriate evidence for the assertions in the combined management report.
The Supervisory Board is responsible for overseeing the Group’s financial reporting process for the preparation of the consolidated financial statements and of the combined management report.
265I NDE PE NDE N T AU D I TO R ’ S R E P O R T
AU D I TO R ’ S R E S P O N S I B I L I T I E S F O R T H E AU D I T O F T H E CO N S O L I DAT E D F I N A N C I A L S TAT E M E N T S
A N D O F T H E CO M B I N E D M A N AG E M E N T R E P O R T
Our objectives are to obtain reasonable assurance about whether the consolidated financial statements as a whole are free from material misstatement, whether due to fraud or error, and whether the combined management report as a whole provides an appropriate view of the Group’s position and, in all material respects, is consistent with the consolidated financial statements and the knowledge obtained in the audit, complies with the German legal requirements and appropriately presents the opportunities and risks of future development, as well as to issue an auditor’s report that includes our audit opinions on the consolidated financial statements and on the combined management report.
Reasonable assurance is a high level of assurance, but is not a guarantee that an audit conducted in accordance with § 317 HGB and the EU Audit Regulation and in compliance with German Generally Accepted Standards for Financial Statement Audits promulgated by the Institut der Wirtschaftsprüfer (IDW) and in supplementary compliance with the ISAs will always detect a material misstatement. Misstatements can arise from fraud or error and are considered material if, individually or in the aggregate, they could reasonably be expected to influence the economic decisions of users taken on the basis of these consolidated financial statements and this combined management report.
We exercise professional judgement and maintain professional scepticism throughout the audit. We also
• identify and assess the risks of material misstatement of the consolidated financial statements and of the combined management report, whether due to fraud or error, design and perform audit procedures responsive to those risks, and obtain audit evidence that is sufficient and appropriate to provide a basis for our audit opinions. The risk of not detecting a material misstatement resulting from fraud is higher than for one resulting from error, as fraud may involve collusion, forgery, intentional omissions, misrepresentations, or the override of internal controls.
• obtain an understanding of internal control relevant to the audit of the consolidated financial statements and of arrangements and measures relevant to the audit of the combined management report in order to design audit procedures that are appropriate in the circumstances, but not for the purpose of expressing an audit opinion on the effectiveness of these systems.
• evaluate the appropriateness of accounting policies used by the Management Board and the reasonableness of estimates made by the Management Board and related disclosures.
• conclude on the appropriateness of the Management Board’s use of the going concern basis of accounting and, based on the audit evidence obtained, whether a material uncertainty exists related to events or conditions that may cast significant doubt on the Group’s ability to continue as a going concern. If we conclude that a material uncertainty exists, we are required to draw attention in the auditor’s report to the related disclosures in the consolidated financial statements and in the combined management report or, if such disclosures are inadequate, to modify our respective audit opinions. Our conclusions are based on the audit evidence obtained up to the date of our auditor’s report. However, future events or conditions may cause the Group to cease to be able to continue as a going concern.
• evaluate the overall presentation, structure and content of the consolidated financial statements, including the disclosures, and whether the consolidated financial statements present the underlying transactions and events in a manner that the consolidated financial statements give a true and fair view of the assets, liabilities, financial position and financial performance of the Group in compliance with IFRSs as adopted by the EU and with the additional requirements of German commercial law pursuant to § 315e Abs. 1 HGB.
• obtain sufficient appropriate audit evidence regarding the financial information of the entities or business activities within the Group to express audit opinions on the consolidated financial statements and on the combined management report. We are responsible for the direction, supervision and performance of the group audit. We remain solely responsible for our audit opinions.
• evaluate the consistency of the combined management report with the consolidated financial statements, its conformity with German law, and the view of the Group’s position it provides.
• perform audit procedures on the prospective information presented by the Management Board in the combined management report. On the basis of sufficient appropriate audit evidence we evaluate, in particular, the significant assumptions used by the Management Board as a basis for the prospective information, and evaluate the proper derivation of the prospective information from these assumptions. We do not express a separate audit opinion on the prospective information and on the assumptions used as a basis. There is a substantial unavoidable risk that future events will differ materially from the prospective information.

266 I NDE PE NDE N T AU D I TO R ’ S R E P O R T
We communicate with those charged with governance regarding, among other matters, the planned scope and timing of the audit and significant audit findings, including any significant deficiencies in internal control that we identify during our audit.
We also provide those charged with governance with a statement that we have complied with the relevant independence requirements, and communicate with them all relationships and other matters that may reasonably be thought to bear on our independence, and where applicable, the related safeguards.
From the matters communicated with those charged with governance, we determine those matters that were of most significance in the audit of the consolidated financial statements of the current period and are therefore the key audit matters. We describe these matters in our auditor’s report unless law or regulation precludes public disclosure about the matter.
Other legal an regulatory Requirements
Further Information pursuant to Article 10 of the EU Audit Regulation
We were elected as group auditor by the annual general meeting on 13 February 2018. We were engaged by the Supervisory Board on 26 March / 15 April 2018. We have been the group auditor of TUI AG, Berlin and Hanover / Germany, without interruption since the financial year 2016 / 17.
We declare that the audit opinions expressed in this auditor’s report are consistent with the additional report to the audit committee pursuant to Article 11 of the EU Audit Regulation (long-form audit report).
Limited Review of the Management Board’s declaration of compliance with the UK Corporate Governance Code
Pursuant to Section 9.8.10 (1) and (2) of the Listing Rules in the United Kingdom, we were engaged to review Management’s statement pursuant to Section 9.8.6 R (6) of the Listing Rules in the United Kingdom that relate to provisions C.1.1, C.2.1, C.2.3 and C.3.1 to C.3.8 of the UK Corporate Governance Code and Management Board’s statement pursuant to Section 9.8.6 R (3) of the Listing Rules in the United Kingdom in the financial year 2017 / 18 included in the “Viability statement” of the combined management report and in the section “Going concern reporting according to the UK Corporate Governance Code”. We have nothing to report in this regard.
267I NDE PE NDE N T AU D I TO R ’ S R E P O R T
German Public Auditor responsible for the engagement
The German Public Auditor responsible for the engagement is Dr Hendrik Nardmann.
Appendix to the Independent Auditor’s Report: Parts of the combined management report whose contents are unaudited
We have not audited the content of the following parts of the combined management report:
• the non-financial group statement pursuant to §§ 315b and 315c HGB included in section “Non-financial group statement” of the combined management report and
• the statement on corporate governance pursuant to § 289f and § 315d HGB included in section “Corporate Governance Report / Statement on Corporate Governance” of the combined management report.
Hanover / Germany, 12 December 2018
Deloitte GmbHWirtschaftsprüfungsgesellschaft
Signed: SchenkWirtschaftsprüfer [German Public Auditor]
Signed: Dr NardmannWirtschaftsprüfer[German Public Auditor]
268 FOR WA R D - LO OK I NG S TAT E ME N T S
FORWARD-LOOKING STATEMENTS
The annual report, in particular the report on expected developments included in the management report, includes various forecasts and expectations as well as statements relating to the future development of the TUI Group and TUI AG. These statements are based on assumptions and estimates and may entail known and unknown risks and uncertainties. Actual development and results as well as the financial and asset situation may therefore differ substan-tially from the expectations and assumptions made. This may be due to market fluctuations, the development of world market prices for commodities, of financial markets and exchange rates, amendments to national and international legislation and provision or fundamental changes in the economic and political environment. TUI does not intend to and does not undertake an obligation to update or revise any forward-looking statements to adapt them to events or developments after the publication of this annual report.
269GLOS S A RY
GLOSSARY
A
All other segments – The category ‘All other segments’ includes our business activities for the new markets, the corporate centre functions of TUI AG and the interim holdings, as well as the Group’s real estate companies.
Average daily rates – The average rate for hotels refers to the rate per day and guest. The average rate for cruise ships is calculated as revenue excluding transportation, onboard and other revenue divided by actual passenger days.
Average revenue per bed – Arrangement revenue divided by occupied beds
C
Cash conversion – We define our cash conversion as the Group’s EBITDA less our long-term gross capex target in relation to the Group’s EBITDA.
Central Region segment – The Central Region segment comprises the Sales & Marketing activities and airlines in Germany and the Sales & Marketing activities in Austria, Switzerland and Poland.
Compliance – Compliance is generally a company’s obligation to manage and control internal and external rules as well as voluntary commitments to avoid reputational or financial damages.
Corporate Governance – Corporate governance refers to the long-term, responsible and transparent management and control of a company. In Germany, the German Corporate Governance Code contains the main principles for the management and supervision of listed companies.
Cruises segment – The Cruises segment consists of Hapag-Lloyd Cruises and the joint venture TUI Cruises as well as the British cruise business Marella Cruises.
Customer satisfaction – Customer satisfaction for holiday overall is measured in customer satisfaction questionnaires completed post-holiday, based on a customer rating on a scale of 0 to 10.
D
DTR – Disclosure and Transparency Rules of the UK Listing Authorities
E
EBITA – Our definition of EBITA is earnings before net interest result, income tax and impairment of goodwill and excluding the result from the measurement of interest hedges.
EBITDA – EBITDA is defined as earnings before interest, income taxes, goodwill impairment and amortisation and write-ups of other intangible assets, depreciation and write-ups of property, plant and equipment, investments and current assets. The amounts of amortisation and depreciation represent the net balance including write-backs.
EBITDAR – For the reconciliation from EBITDA to the indicator EBITDAR, long-term leasing and rental expenses are eliminated.
EBT – Earnings before taxes
Economic value added – Economic Value Added is calculated as the product of ROIC less associated capital costs multiplied by interest-bearing invested capital.
EPS – Earnings per share are calculated by dividing the Group profit for the year attributable to TUI AG shareholders by the weighted average number of registered shares outstanding during the financial year.
G
GSTC – Global Sustainable Tourism Council
270 GLOS S A RY
H
HFM – The Oracle Hyperion Financial Management reporting system (HFM) is used as the uniform reporting and consolidation system throughout the Group so that no additional interfaces exist for the preparation of the consolidated financial statements.
Hotels & Resorts segment – The Hotels & Resorts segment comprises TUI Group’s diversified portfolio of Group hotel brands and hotel companies. The segment includes ownership in hotels, joint ventures with local partners, stakes in companies giving TUI a significant influence, and hotels operated under management contracts.
I
IFRS – International Financial Reporting Standards
IMF – International Monetary Fund
Invested Capital – The invested capital is derived from liabilities, comprising equity (including non-controlling interests) and the balance of interest-bearing liabilities and interest-bearing assets. The cumulative amortisations of purchase price allocations are then added to the invested capital.
J
JEV – The annual performance-based remuneration (JEV) is intended to motivate Executive Board members to achieve ambitious and challenging financial, operational and strategic targets throughout the financial year.
LTIP – The LTIP (Long Term Incentive Plan) is a performance share plan based on virtual shares and is assessed over a period of four years (Performance Reference Period). Virtual shares are granted in annual tranches.
N
NPS – Net Promoter Score. NPS is measured in customer satis-faction questionnaires completed post-holiday. It is based on the question ‘On a scale of 0 to 10 where 10 is extremely likely and 0 is not at all likely, how likely is it that you would recommend the brand to a friend, colleague or relative?’ and is calculated by taking the percentage of promoters (9s and 10s) less the percentage of detractors (0s through 6s).
Northern Region segment – The Northern Region segment comprises tour operator activities and airlines in the UK, Ireland and the Nordics. In addition, the Canadian strategic venture Sunwing and the joint venture TUI Russia have been included within this segment.
O
Occupancy rate – The occupancy rate for hotels is calculated as the quotient of occupied beds and capacity. The occupancy rate for cruises is calculated as the quotient of the actual passenger days and the potential passenger days.
P
Passenger days – In the Cruises segment we differentiate between available and achieved passenger days. The number of available passenger days is calculated as the number of beds on the ship at full capacity multiplied by the operating days of the ship. The achieved passenger days show the number at achieved operating days and achieved occupancy.
R
ROIC – ROIC is calculated as the ratio of underlying earnings before interest, taxes and amortisation of goodwill (underlying EBITA) to average invested interest-bearing invested capital (invested capital) for the segment.

271GLOS S A RY
T
TSR – Total Shareholder Return
U
UK CGC – UK Corporate Governance Code
UN Global Compact – In September 2014, TUI signed up to the UN Global Compact, a world-wide United Nations initiative to encourage businesses worldwide to adopt sustainable and socially responsible policies. The TUI Group is comitted to 10 universally accepted principles in the areas of human rights, labour, environment and anticorruption.
Underlying EBITA – Underlying EBITA has been adjusted for gains / losses on disposal of investments, restructuring costs according to IAS 37, ancillary acquisition costs and conditional purchase price payments under purchase price allocations and other expenses for and income from one-off items.
UNWTO – UN World Tourism Organisation
W
WACC – Weighted Average Cost of Capital. The cost of capital is calculated as the weighted average cost of equity and debt capital (WACC)
Western Region segment – The Sales & Marketing activities and airlines in Belgium, the Netherlands and the Sales & Marketing activities in France are included within the segment Western Region.


FINANCIAL CALENDAR
1 3 D E C E M B E R 2 0 1 8Annual Report 2018
1 2 F E B R U A RY 2 0 1 9Annual General Meeting 2019
1 2 F E B R U A RY 2 0 1 9Quarterly Statement Q1 2019
M AY 2 0 1 8Half-Year Financial Report H1 2019
A U G U ST 2 0 1 9Quarterly Statement Q3 2019
S E P T E M B E R 2 0 1 9Trading update
D E C E M B E R 2 0 1 9Annual Report 2019
P U B L I S H E D BYTUI AGKarl-Wiechert-Allee 430625 Hanover, Germany Tel.: + 49 511 566-00Fax: + 49 511 566-1901www.tuigroup.com
CO N C E P T A N D D E S I G N3st kommunikation, Mainz, Germany
P H OTO G R A P H YAlexia van der Meijden (p. 12 – 13); Christian Wyrwa, (p. 15); Michael Neuhaus (cover photo); Hapag-Lloyd Cruises (p. 26 – 27); Paul Vincent Roll, unsplash (p. 150 – 151); plainpicture (p. 110 – 111); Rüdiger Nehmzow (p. 7, p. 12 – 13)
P R I N T E D BYKunst- und Werbedruck, Bad Oeynhausen, Germany
The Annual Report of TUI Group, the Magazine and the fi nancial statements of TUI AG are available in German and in English: annualreport2018.tuigroup.com
This report was published on 13 December 2018.
The German version is legally binding. The Company cannot be held responsible for any misunderstandings or misinterpretation arising from this translation.
carbon neutralnatureOffice.com | DE-149-936095
print production

AN
NU
AL
RE
PO
RT
OF
TH
E T
UI
GR
OU
P 2
01
820
18
TUI AGKarl-Wiechert-Allee 430625 Hanover, Germany