tsx eqb eqb.pr · · 2018-03-011 fourth quarter report tsx eqb eqb.pr.c 2017. q4. canada’s...
TRANSCRIPT

1
FourthQuarterReport
T S X E Q BE Q B . P R . C
2017Q4
Canada’s Challenger Bank. Money Well Banked.For the three and twelve months ended December 31, 2017

2
Forward-Looking Statements
Certain forward-looking statements may be made in this presentation, including statements regarding possible future business, financing and growth objectives. Forward-looking statements include, but are not limited to, statements relating to our financial performance objectives, vision and strategic goals, the economic and market review and outlook, the regulatory environment in which we operate, the outlook and priorities for each of our business lines, the risk environment including our liquidity and funding risk, and statements by our Chief Executive Officer and Chief Financial Officer. The forward-looking information contained herein is presented for the purpose of assisting the holders of our securities and financial analysts in understanding our financial position and results of operations as at and for the periods ended on the dates presented, as well as our financial performance objectives, vision and strategic goals, and may not be appropriate for other purposes. Forward-looking statements are typically identified by words such as “believe”, “expect”, “foresee”, “forecast”, “anticipate”, “intend”, “estimate”, “goal”, “plan” and “project” and similar expressions of future or conditional verbs such as “will”, “may”, “should”, “could” or “would”. Investors are cautioned that such forward-looking statements involve risks and uncertainties detailed from time to time in the Company’s periodic reports filed with Canadian regulatory authorities. Many factors could cause actual results, performance or achievements to be materially different from any future results, performance or achievements that may be expressed or implied by such forward-looking statements. Equitable Group Inc. does not undertake to update any forward-looking statements, oral or written, made by itself or on its behalf except in accordance with applicable securities laws.

3
Demonstrating Success As Canada’s Challenger Bank™
Major 2017 Milestones
Record Annual Earnings of $160.6M
Record Assets Under Management of $24.6B
Record Deposit Principal of $11.0B

4
8.7 9.0 9.29.7 9.9 10.0
10.511.0
Q1 Q2 Q3 Q4 Q1 Q2 Q3 Q42016 2017
Maintaining the Confidence of Our DepositorsDeposit Principal Balances($ billions)
14% Growth Over 2016 With EQ Bank Ahead 53%

5
High Quality And Measured Asset GrowthTotal Originations($ billions)
Mortgages Under Management($ billions)
0.9
1.31.4
1.31.2
1.1
1.5
1.20.7
0.70.7 0.9
0.4 0.5
0.5
0.5
Q1 Q2 Q3 Q4 Q1 Q2 Q3 Q4
Securitization FinancingCore Lending
17.718.7
19.921.0 21.7 22.0 22.8 23.2
Q1 Q2 Q3 Q4 Q1 Q2 Q3 Q42016 20172016 2017
Originations Down Primarily In Lower Margin Securitization
Financing Business
6
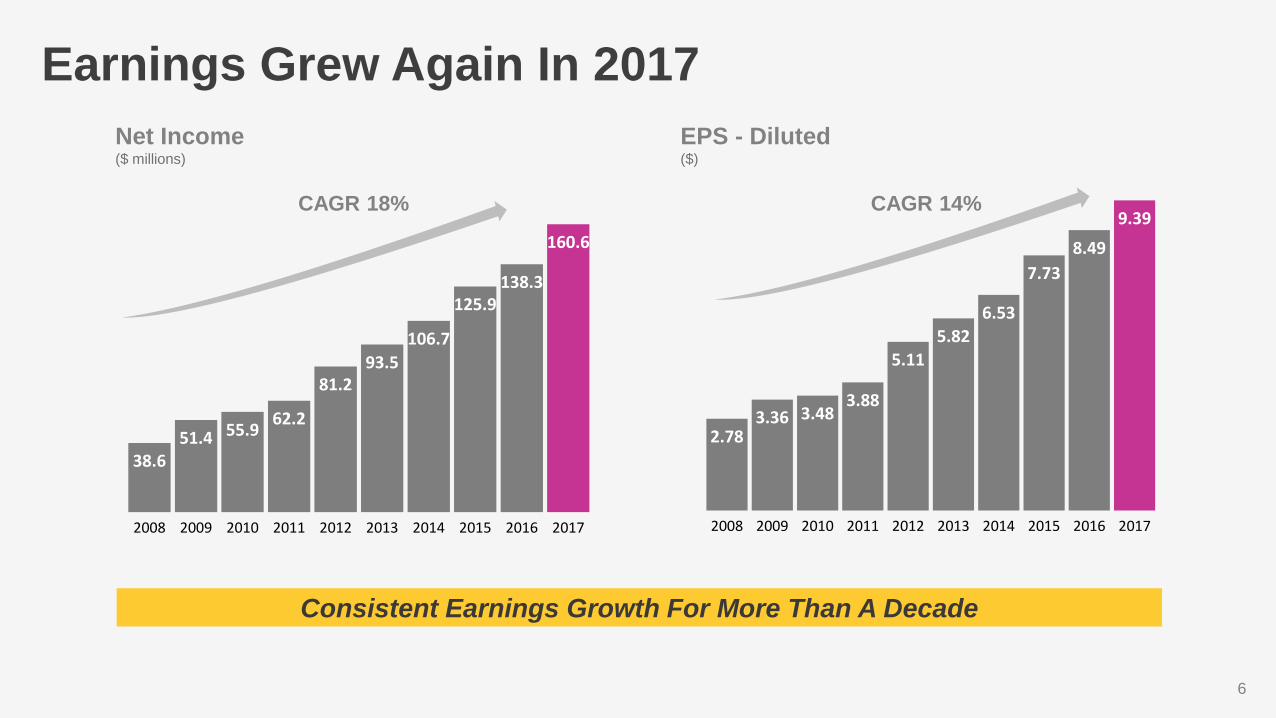
Earnings Grew Again In 2017
Consistent Earnings Growth For More Than A Decade
2.783.36 3.48
3.88
5.115.82
6.53
7.738.49
9.39
2008 2009 2010 2011 2012 2013 2014 2015 2016 2017
38.651.4 55.9 62.2
81.293.5
106.7
125.9138.3
160.6
2008 2009 2010 2011 2012 2013 2014 2015 2016 2017
EPS - Diluted ($)
Net Income($ millions)
CAGR 18% CAGR 14%
7
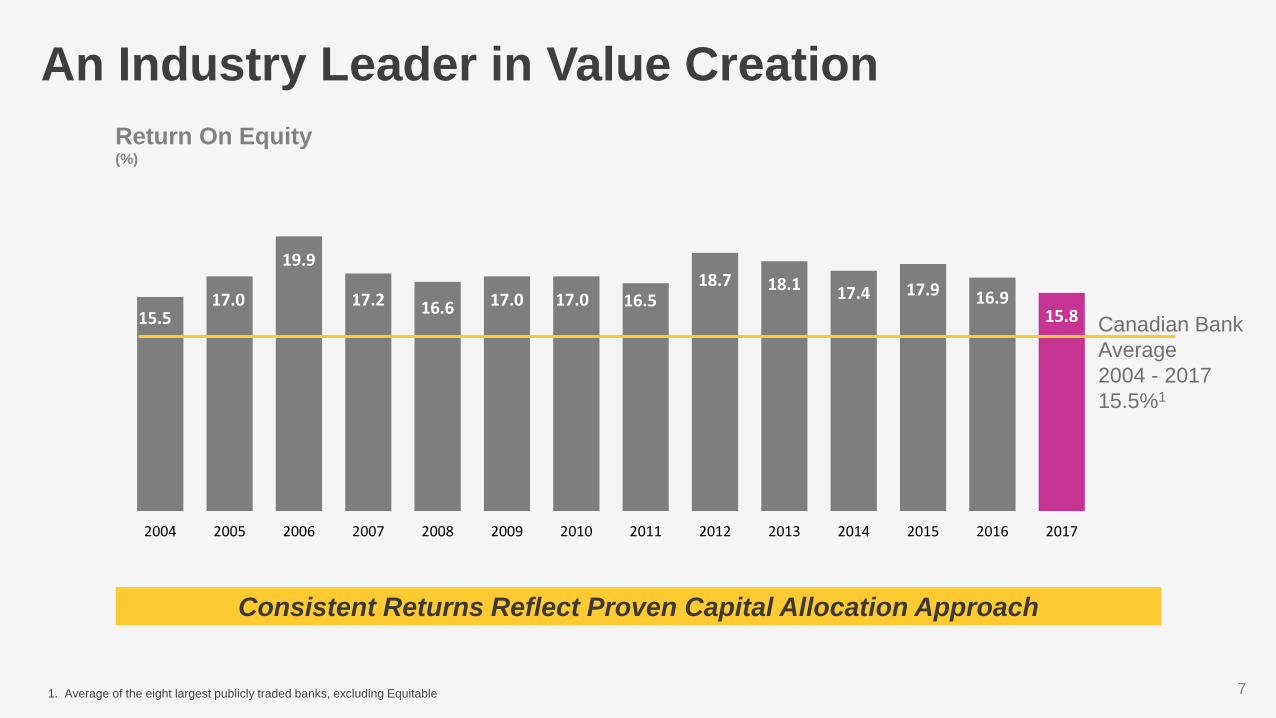
An Industry Leader in Value Creation
Consistent Returns Reflect Proven Capital Allocation Approach
15.517.0
19.9
17.2 16.6 17.0 17.0 16.518.7 18.1 17.4 17.9 16.9
15.8
2004 2005 2006 2007 2008 2009 2010 2011 2012 2013 2014 2015 2016 2017
Canadian Bank Average 2004 - 201715.5%1
Return On Equity(%)
1. Average of the eight largest publicly traded banks, excluding Equitable
8
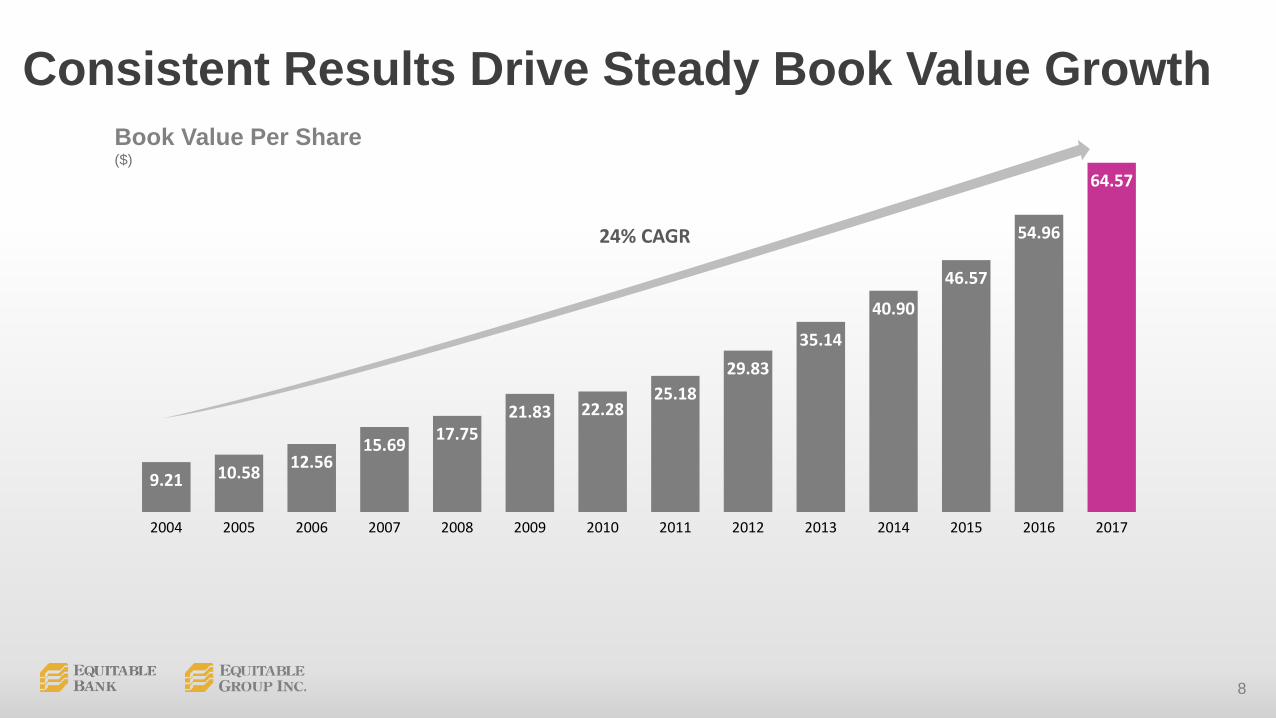
9.21 10.58 12.5615.69 17.75
21.83 22.2825.18
29.8335.14
40.90
46.57
54.96
64.57
2004 2005 2006 2007 2008 2009 2010 2011 2012 2013 2014 2015 2016 2017
24% CAGR
Book Value Per Share ($)
Consistent Results Drive Steady Book Value Growth

9
0.260.25
0.240.23
0.220.21
0.200.19
0.180.17
0.160.15
0.14
0.12
Dividend Grows For The 15th Time In 10 Years
2011 2012 2013 2014 2015 2016 2017 2018
Dividend Per Common Share$
Common Share Dividend Increased 4% Effective With Payment In April 2018

10
35.2
41.7 43.438.9 37.9
40.4
Q3 Q4 Q1 Q2 Q3 Q4
Q4 EPS Includes $0.32 Of Costs Related To Liquidity Protection
Re-Establishing Upward Quarterly Earnings Trend
2.16
2.56 2.542.28 2.21
2.36
Q3 Q4 Q1 Q2 Q3 Q4
Earnings Per Share Diluted($)
Net Income($ millions)
2016 20172016 2017
7% 7%
11
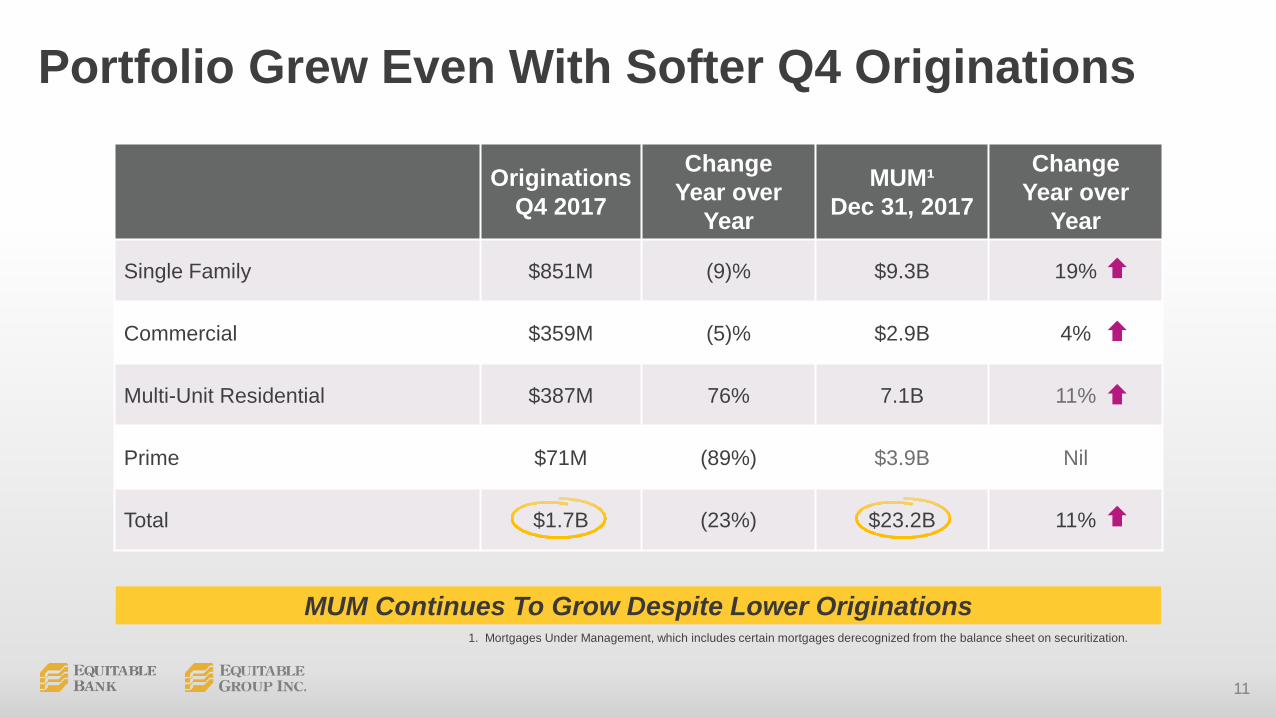
Portfolio Grew Even With Softer Q4 Originations
OriginationsQ4 2017
ChangeYear over
Year
MUM¹Dec 31, 2017
ChangeYear over
Year
Single Family $851M (9)% $9.3B 19%
Commercial $359M (5)% $2.9B 4%
Multi-Unit Residential $387M 76% 7.1B 11%
Prime $71M (89%) $3.9B Nil
Total $1.7B (23%) $23.2B 11%
MUM Continues To Grow Despite Lower Originations1. Mortgages Under Management, which includes certain mortgages derecognized from the balance sheet on securitization.

12
0.8 0.91.1
0.9
3.6 3.7
Q1 Q2 Q3 Q4 2016 2017
Alternative Single Family Lending
4.3 4.6 4.95.4 5.7 5.9 6.2 6.4
6.87.2 7.5
7.9 8.2 8.59.1 9.3
Q1 Q2 Q3 Q4 Q1 Q2 Q3 Q4 Q1 Q2 Q3 Q4 Q1 Q2 Q3 Q42014 2015 2016 2017
Mortgage Principal($ billions)
Mortgage Originations($ billions)
Annual Originations An All-Time Record $3.7B
2017

13
0.4
0.2
0.4 0.4
1.3 1.3
Q1 Q2 Q3 Q4 2016 2017
Commercial Lending
4.3 2.3 2.3 2.3 2.3 2.3 2.2 2.2 2.3 2.42.7 2.8
3.02.8 2.9 2.9
Q1 Q2 Q3 Q4 Q1 Q2 Q3 Q4 Q1 Q2 Q3 Q4 Q1 Q2 Q3 Q4
Mortgage Principal($ billions)
Mortgage Originations($ billions)
Strong and Growing Customer Relationships Creating Opportunity
2014 2015 2016 2017 2017
14
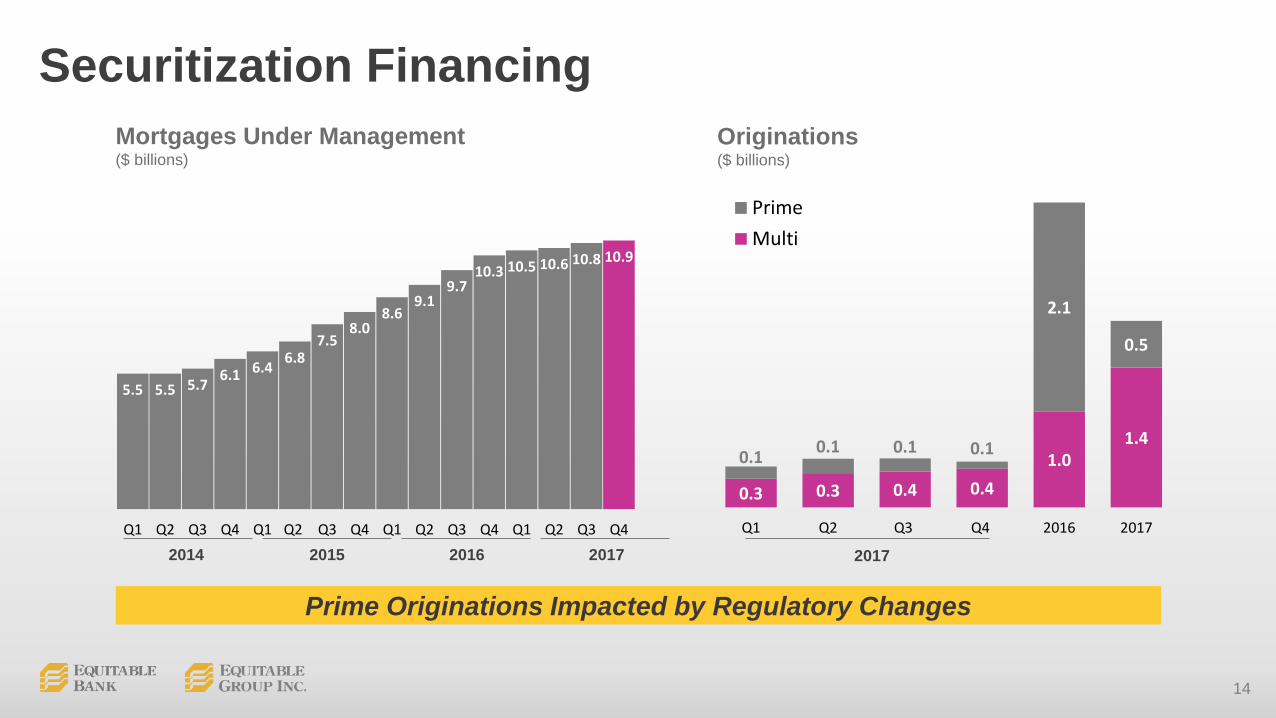
0.3 0.3 0.4 0.41.0
1.40.1 0.1 0.1 0.1
2.1
0.5
Q1 Q2 Q3 Q4 2016 2017
PrimeMulti
Securitization Financing
5.5 5.5 5.7 6.1 6.4 6.87.5
8.08.6
9.19.7
10.3 10.5 10.6 10.8 10.9
Q1 Q2 Q3 Q4 Q1 Q2 Q3 Q4 Q1 Q2 Q3 Q4 Q1 Q2 Q3 Q4
Mortgages Under Management($ billions)
Originations($ billions)
Prime Originations Impacted by Regulatory Changes
2014 2015 2016 2017 2017

15
0.0%
0.1%
0.2%
0.3%
0.4%
0.5%
2007 2008 2009 2010 2011 2012 2013 2014 2015 2016 2017
Best in Class Credit Performance Continues
Well Protected By Allowance for Credit Losses
EQB
Comparator Group1
1. Represents eight largest publicly traded banks
Net Realized Credit Losses as a % of Total Loans
Net impaired mortgage assets $22.5M (down from Q3 2017 and Q4 2016) and now only 0.12% of total mortgage book
Allowance for credit losses to total mortgage assets ratio of 0.17% much higher than Bank’s average loss rate of 0.04% over past decade
PCL of $1.5M (1 basis point of average loan balances) reflects quality of book

16
5.4
14.816.3
Growing While Maintaining Solid Capital Ratios
December 31, 2017 (%)
Basel III minimumTotal Capital level of 10.5%Basel III
minimum CET1 target of 7.0%
Full compliance with new standard
Leverage Ratio CET1 Total Capital

17
The Cost of Adding Downside Protection
Q2 EPS Impact
Q3 EPS Impact
Q4 EPS Impact
Backstop Funding Facility $0.06 $0.24 $0.24
Insurance premium amortization, net of associated funding benefits $0.20 $0.18 $0.08
EQ Bank marketing campaign $0.12 nil nil
Total $0.38 $0.42 $0.32
Impact Expected to Dissipate To ~$5M Per Quarter in 2018

18
2.55 2.62 2.56 2.64 2.50 2.55 2.60 2.64 2.55 2.412.17 2.33
0.29 0.31 0.34 0.22 0.31 0.22 0.19 0.24 0.22 0.30 0.25 0.24
Q1 Q2 Q3 Q4 Q1 Q2 Q3 Q4 Q1 Q2 Q3 Q4
Core Lending Securitization Financing
Margin Trends
Net Interest Margin – TEB
2015 2016 2017
Expect NII To Grow 8-10% in 2018 Due To Asset Growth
TotalNIM 1.74 1.79 1.73 1.69 1.62 1.61 1.64 1.70 1.66 1.63 1.47 1.59
Total NIM 12 basis higher sequentially mainly due to higher Core Lending NIM
Core Lending NIM up due to lower liquidity event costs and mid-2017 pricing changes
Expect slightly lower Total and Core NIMs in 2018
19
2015 2016 2017
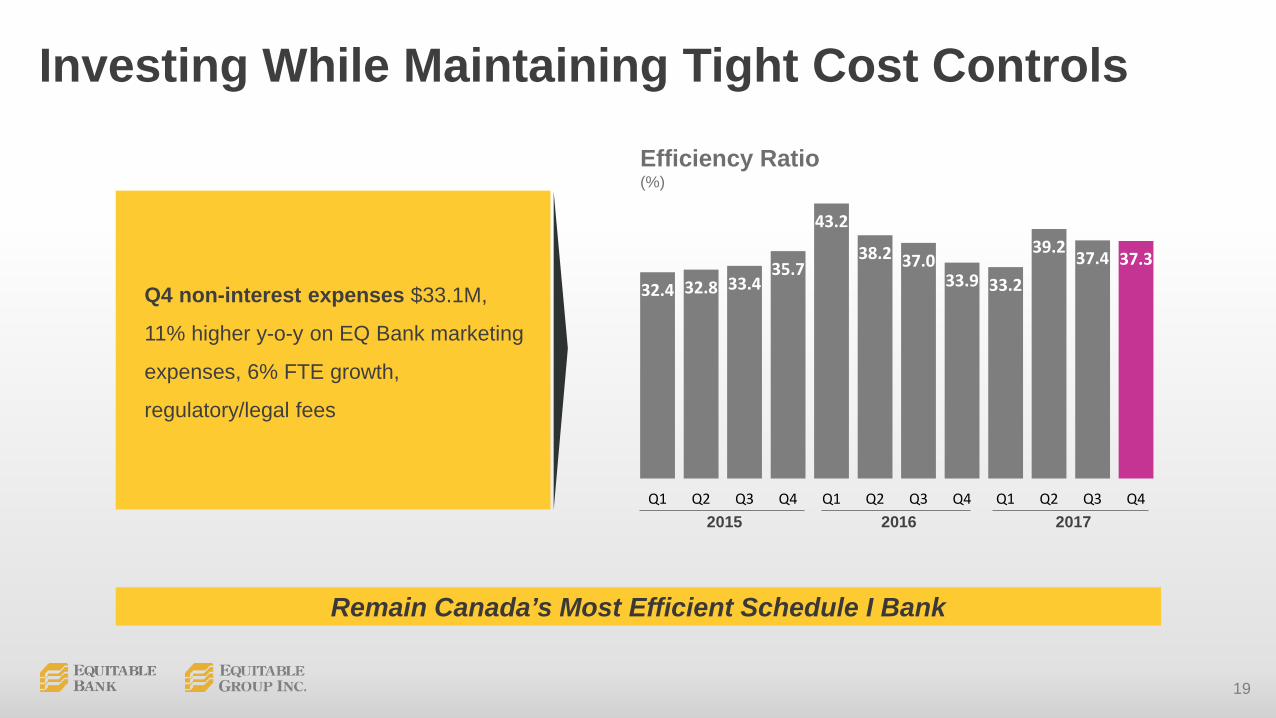
Investing While Maintaining Tight Cost Controls
32.4 32.8 33.435.7
43.2
38.2 37.033.9 33.2
39.2 37.4 37.3
Q1 Q2 Q3 Q4 Q1 Q2 Q3 Q4 Q1 Q2 Q3 Q4
Remain Canada’s Most Efficient Schedule I Bank
Efficiency Ratio(%)
Q4 non-interest expenses $33.1M,
11% higher y-o-y on EQ Bank marketing
expenses, 6% FTE growth,
regulatory/legal fees

20
Strong Challenger Bank Fundamentals
Disciplined Capital Deployment
National Distribution Presence
Responsive Service
EQ BankCanada's Leading Digital Bank

21
Enhancing Single Family Service
New 24/7 Self-Service Technology
Platform

22
Leverage Experience to Safely Grow
Commercial Assets
Capital Deployment in Other Lending Opportunities

23
Equity Release Product Overview
Target Market
Distribution
Brand
Loan Parameters
• Homeowners 55 years and older• Residents of larger urban centers, such as Toronto or Calgary
• Through Canada’s vibrant mortgage broker community
• Maximum LTV at origination of 40%• Term of up to 5 years• Floating interest rate (based off prime)
• PATH Home Plan branding• Delivers message of equity release being a natural part of an overall financial plan

24
Why and Why Now?Attractive Market
Favorable Competitive Landscape
Diversification Platform
Synergies with Existing Business
• Targets the growing demographic of aging Canadians
• Addresses increasing gap between retirement savings and needs
• Provides an option for borrowers if recent regulatory changes reduce availability of traditional mortgage credit
• New asset class but adjacent to existing businesses
• Broader range of products enhances our value proposition to the broker community
• Leverages existing capabilities and financial strength
• Cash flow from current operations can finance reverse mortgage investments
• Systems, corporate centre, and funding channels
• Relationships with brokers
• Robust risk management framework
• Only one incumbent regulated player
• Market size will likely make it appealing to only mid-sized FIs; niche market not addressed by big-6
25
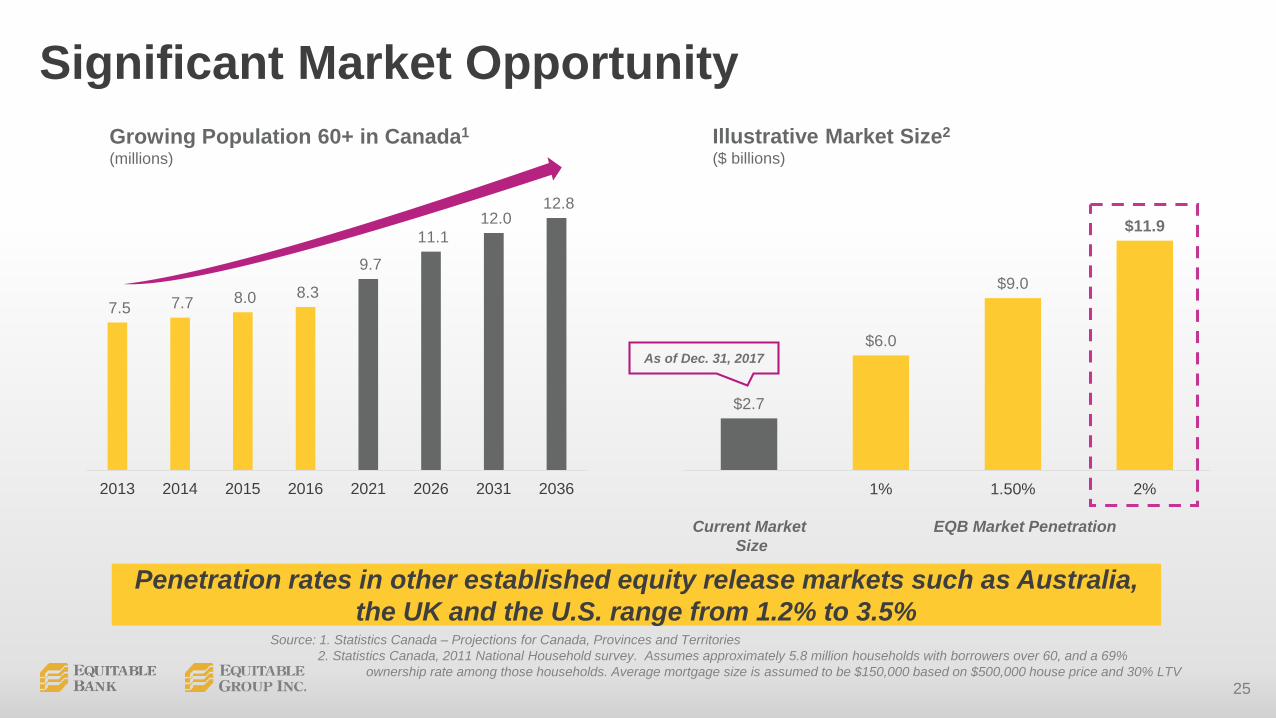
Significant Market Opportunity
Source: 1. Statistics Canada – Projections for Canada, Provinces and Territories2. Statistics Canada, 2011 National Household survey. Assumes approximately 5.8 million households with borrowers over 60, and a 69%
ownership rate among those households. Average mortgage size is assumed to be $150,000 based on $500,000 house price and 30% LTV
Growing Population 60+ in Canada1
(millions)Illustrative Market Size2
($ billions)
Penetration rates in other established equity release markets such as Australia, the UK and the U.S. range from 1.2% to 3.5%
$2.7
$6.0
$9.0
$11.9
1% 1.50% 2%
EQB Market Penetration
7.5 7.7 8.0 8.3
9.7
11.1 12.0
12.8
2013 2014 2015 2016 2021 2026 2031 2036
Current MarketSize
As of Dec. 31, 2017

26
Expanding Our Challenger Bank Vision