tsunami-induced coastal change: scenario studies for ... · tsunami-induced coastal change:...
TRANSCRIPT

Earth Planets Space, 64, 799–816, 2012
Tsunami-induced coastal change: scenario studiesfor Painan, West Sumatra, Indonesia
Linlin Li1, Zhenhua Huang1,2, Qiang Qiu1, Danny H. Natawidjaja3, and Kerry Sieh1
1Earth Observatory of Singapore, Nanyang Technological University, Singapore2School of Civil and Environmental Engineering, Nanyang Technological University, Singapore
3Research Center for Geotechnology, Indonesian Institute of Sciences (LIPI), Bandung, Indonesia
(Received October 31, 2010; Revised May 29, 2011; Accepted August 2, 2011; Online published October 24, 2012)
There exists a high probability of a great earthquake rupture along the subduction megathrust under theMentawai Islands of West Sumatra in the near future. Six rupture models were used to assess the tsunamiinundation and the accompanying sediment movement in Painan, West Sumatra, Indonesia. According to a worstscenario, the potential tsunami might hit the coast of Painan about 26 minutes after the rupture and the entirecity could be inundated with a maximum inundation depth of about 7 m. Severe erosion may also occur in thenear-shore region. Two scenarios, one scenario with a positive leading wave and the other with a negative leadingwave, were selected to simulate the tsunami-induced morphological changes. A positive leading wave wouldcause severe erosion in the shoreline area and a large sandbar in the offshore area adjacent to the shoreline; asmall amount of sediment could be deposited in the city area; a negative leading wave could cause moderateerosion in the further offshore area due to the strong retreating wave front, an offshore sandbar could form in thebay area, while no noticeable large area of sand deposit could be found in the city area. The difference in theerosion and deposition patterns between these two scenarios provides very helpful information in the investigationof historical tsunamis through tsunami deposits.Key words: Coastal erosion, tsunami inundation, shoreline changes, sediment transport, West Sumatra megath-rust.
1. IntroductionThe Sunda megathrust is located at a convergent plate
boundary where it forms the interface between the over-riding Eurasian plate and the subducting Indo-Australianplate. Several large sections of the megathrust have rup-tured sequentially in the past decade, causing a series ofearthquakes along the western coast of Sumatra: the largestof these failures is the giant Aceh-Andaman earthquakeof Mw 9.15 in 2004 caused by a 1600-km long rupturealong the magathrust (Sieh, 2007); the great Nias earth-quake of March 28, 2005 ruptured another segment southto the Aceh earthquake segment. These rapid failures haveraised great concern about the unbroken Mentawai seg-ment(Aydan, 2008; McCloskey et al., 2005; Nalbant et al.,2005; Natawidjaja et al., 2006; Natawidjaja and Triyoso,2007; Sieh, 2007). According to the studies of McCloskeyet al. (2005) and Nalbant et al. (2005), the rupture of ad-joining 1600- and 300-km sections of the Sunda megath-rust in December 2004 and March 2005 has increased thestresses on the megathrust immediately to the south, un-der the Batu and Mentawai islands. The increased stresseshave significantly boosted the possibility of earthquake andtsunami hazard in West Sumatra. Historically, two greatearthquakes of 1797 and 1833 have happened in this 700-
Copyright c© The Society of Geomagnetism and Earth, Planetary and Space Sci-ences (SGEPSS); The Seismological Society of Japan; The Volcanological Societyof Japan; The Geodetic Society of Japan; The Japanese Society for Planetary Sci-ences; TERRAPUB.
doi:10.5047/eps.2011.08.002
kilometer-long unbroken Mentawai segment (Natawidjajaet al., 2006). Geodetic and paleogeodetic measurementshave revealed that the slip deficit accumulated in this areahas already exceeded the slip occurred during the 1797earthquake and is slowly reaching the slip occurred duringthe 1833 earthquake (Chlieh et al., 2008). This informationindicates that the unbroken Mentawai segment may alreadybe advanced in the seismic supercycle, which has a pe-riod about 200 years according to palaeoseismologic studies(Zachariasen et al., 1999; McCloskey et al., 2005; Sieh etal., 2008). The imminent hazard in this area is vindicated bythe megathrust rupture of September 2007. However, onlya small amount of the accumulated potential slip has beenrelieved by the 2007 earthquake and its aftershocks (Aydan,2008; Konca et al., 2008); larger earthquakes approachingthe size of 2004 Aceh-Andaman earthquake might be pos-sible in the near future (Sieh et al., 2008; Natawidjaja et al.,2009).
As the Mentawai section of the Sunda megathrust isvery close to the coast of West Sumatra, potential rupturesand subsequently triggered tsunamis may pose a significantthreat to the people and property in the nearby cities. Sev-eral rupture models for the unbroken Mentawai segmenthave been proposed (Tobita, 2007; Aydan, 2008; Chliehet al., 2008; Natawidjaja et al., 2009) and used by someresearchers (Borrero et al., 2006; McCloskey et al., 2008;Taubenbock et al., 2009; Muhari et al., 2010) in an attemptto assess the tsunami threat to the major cities along the
799

800 L. L. LI et al.: TSUNAMI-INDUCED COASTAL CHANGE
Fig. 1. A Google image of Painan. Red dots are the locations of sand samples taken. The yellow line in the city area indicates the cement road next tothe shoreline with an average distance of 60 m from the shoreline.
coast of western Sumatra, including Padang, Bengkulu andPainan. Tsunami arrival time, tsunami height and inunda-tion map were presented for these proposed scenarios. Theresults of these studies indicate that the maximum tsunamiheight along the coast of Padang and Painan could reach 5–10 m (Borrero et al., 2006; McCloskey et al., 2008; Muhariet al., 2010). We noticed that the tsunami-induced sedi-ment transport was not considered in all these studies. How-ever, tsunami waves with the height of 5–10 m will be in-evitably accompanied by very high flow velocities whenthey penetrate inland (Imamura et al., 2001; Matsutomiet al., 2006; Goto et al., 2007), which will undoubtedlyproduce high bed shear stresses and sediment movementsover large areas, resulting in beach erosion, scouring aroundcoastal structures, and widespread deposition in inland ar-eas (Gelfenbaum and Jaffe, 2003; Srinivasalu et al., 2007;Pari et al., 2008; Meilianda et al., 2010; Paris et al., 2010).Relative to other tsunami behaviors, sediment transport isone of the poorest understood characteristics as it is almostimpossible to conduct detailed real-time measurements dur-ing tsunami events.
Understanding tsunami-induced sediment movement isalso extremely important for tsunami geologists who havemade significant effort to estimate the tsunami heights, flowdepths and velocities by establishing qualitative relation-ships between tsunami deposits and tsunami hydrodynamiccharacteristics (Jaffe and Gelfenbuam, 2007; Moore et al.,2007; Morton et al., 2008; Spiske et al., 2010). The in-formation derived by inverse modeling from paleo-tsunamideposits, can further help us understand tsunami sourcesand attendant tectonic character of a particular region in
some detail (Bourgeois, 2009; Martin et al., 2008; Nelsonet al., 2006). However, the inverse modeling faces greatchallenges since sediment movement is highly depended ontsunami wave form, bathymetry and topography near shore-line and sediment sources. Forward numerical modeling oftsunami-induced sediment transport could provide quanti-tative information in terms of tsunami height, flow velocity,and tsunami deposit characteristics to help understand thecomplex patterns of erosion and sedimentation process inboth onshore and seaward directions (Goto and Imamura,2007).
In this study, we perform a scenario-based study for thecity of Painan, with a focus on the sediment movementand morphological changes in the coastal area of Painan,using potential rupture models proposed for the unbrokenMentawai section. Painan is chosen in this study becauseit lies between two hills (as shown in Fig. 1), which po-tentially can cause flow channelling effect and increase theinundation distance. The main objectives of this study areto assess the tsunami inundation threats to Painan and to un-derstand the changes of beach profile and the characteristicsof sediment deposit for representative fault rupture mod-els. The effects of a shore-parallel road on the beach profilechanges will be discussed as well. The information on theinundation will be useful for the local authorities to designevacuation routes and the information on the sediment ero-sion and deposition will be useful for tsunami geologiststo study paleo-tsunamis in this area. Brief descriptions ofthe hydrodynamic model and the sediment transport modelare given in Section 2. Details of the data preparation forour simulations are described in Section 3. Simulation re-

L. L. LI et al.: TSUNAMI-INDUCED COASTAL CHANGE 801
sults of inundation and sediment transport are discussed inSection 4. Main findings are summarized in Section 5.
2. Numerical ModelsThe software package COMCOT (Cornell Multi-grid
Coupled Tsunami Model) is used to simulate the tsunamigeneration, propagation and inundation. Description andapplications of COMCOT can be found in Liu et al. (1995),Wang and Liu (2005) and Wijettunge et al. (2008), Huang etal. (2009) and Megawati et al. (2009). The software pack-age XBeach, which is a 2DH numerical model for simu-lating the nearshore response to hurricanes and storms, isused to simulate the sediment transport. The model canseamlessly simulate wave propagation, inundation, sedi-ment transport and morphological changes (including duneerosion, overwash and breaching) under various wave andflow conditions. A detailed description of XBeach canbe found in Roelvink et al. (2009). The model has beentested with not only several analytical solutions, large-scalelaboratory experiments, but also several field observations(Roelvink et al., 2009; Deltares, 2010):
i) The ability of the model to predict the runup and run-down processes of non-breaking long waves has beentested against 1D (Carrier and Greenspan, 1958) and2D (Ozkan-Haller and Kirby, 1997) analytical solu-tions.
ii) The model has also been tested by a series of large-scale experiments in which real beach profiles andreal storm conditions were scaled and reproduced ina 233 m long, 7 m deep and 5 m wide wave flume(Deltares, 2010). The sand beaches were exposed tovarious wave conditions, and the dune erosion and re-treat process were measured in the experiments andalso simulated using XBeach. It was concluded thatthe calculated wave heights, flow velocities, sedimentconcentrations as well as sediment transports ratescompared reasonable well with the measurements.
iii) XBeach has also been used to simulate the morphody-namic responses of sandy dunes to an extreme stormat Assateague Island, Maryland, USA (Jimenez et al.,2006). The calculated changes of bed profile werefound to be largely consistent with the measured data.The model has been applied to several case studies in-volving dune erosion and sediment deposition duringHurricanes Ivan and Katrina (Lindemer et al., 2010;McCall et al., 2010). Their numerical results demon-strate reasonable erosion and deposition patterns, indi-cating that the model is capable of handling practicalsituations with large wave heights (larger than 5 m)and long durations (20 hrs or more).
Wind waves are not considered in this study, thus shal-low water equations are adopted to calculate the flow fieldwithout wave radiation stresses. The performance of themodel without considering wind waves has been validatedagainst several laboratory experiments on the transports offine sand on uniform slopes under breaking solitary waves(Kobayashi and Lawrence, 2004; Young et al., 2010). SinceXBeach is a 2DH model, the sediment entrainment by tur-bulent flows and the density stratification in sediment-laden
flows (both are related to the vertical flow structure) cannotbe simulated.2.1 Nonlinear shallow water equations
Both COMCOT and XBeach solve the following depth-averaged nonlinear shallow water equations to obtain thenear-shore velocity field,
∂η
∂t+ ∂hu
∂x+ ∂hv
∂y= 0 (1)
∂u
∂t+ u
∂u
∂x+ v
∂u
∂y+ c f u
√u2 + v2
h= −g
∂η
∂x(2)
∂v
∂t+ u
∂v
∂x+ v
∂v
∂y+ c f v
√u2 + v2
h= −g
∂η
∂y(3)
where η is the surface elevation; h is the total water depth;u, v are the depth-averaged velocities in x- and y- direc-tions, respectively; g is the gravitational acceleration; c f
is an empirical bed friction coefficient. Normally, a largerfriction coefficient should be chosen for city areas wherethe presence of city buildings will increase the resistanceto tsunami flows; according to previous studies (Qiu et al.,2010; Huang et al., 2011), the increased flow resistance in acoastal city may slightly raise the flow depth near the shore-line and reduce the inundation depth in the city area, whichcould also slightly affect the flow field and sediment trans-port. In our simulations, the flow resistance from the citybuildings is not taken into account and c f = 0.003 is sim-ply used (the default value in XBeach). Thus the inundationdepths presented in this paper are considered as the worstcase scenarios.
When running COMCOT to simulate the tsunami wavepropagation in deep oceans, the shallow water equations aresolved in a spherical coordinate system and the effects ofCoriolis force are added to Eqs. (2) and (3). See Liu et al.(1995), Wang and Liu (2005) or Wijettunge et al. (2008)for details. The coupling of COMCOT and XBeach forsimulating tsunami-induced sediment transport and beachprofile changes is described at the end of Subsection 3.2.2.2 Sediment transport model
The sediment transport is modeled by a depth-averagedadvection diffusion equation with a source term basedon the concept of equilibrium sediment concentration(Galappatti and Vreugdenhil, 1985):
∂hC
∂t+ ∂hCu
∂x+ ∂hCv
∂y= hCeq − hC
Ts(4)
where C is the depth-averaged concentration of suspendedsediment. The sediment diffusion is represented by anadaptation time Ts , which is a function of the local waterdepth and the sediment fall velocity ws . Ceq is the equi-librium sediment concentration calculated using a chosensediment transport formula. The formula proposed by vanRijn (1993) is used to calculate the equilibrium sedimentconcentration; The expressions for Ceq and Ts are given inAppendix. Since XBeach is a numerical 2DH model, the ef-fects of density stratification and hindered settling (Apotsoset al., 2011) can only be considered indirectly through theadaptation time Ts and the equilibrium sediment concentra-tion Ceq.

802 L. L. LI et al.: TSUNAMI-INDUCED COASTAL CHANGE
Table 1. Fault parameters of earthquake scenarios used in tsunami simulations.
Scenario Mw No. of Length Width Epi. Epi. Slip Depth Dip
segment (km) (km) Lon. Lat. (m) (km) (degree)
1 220 135 98.2 −1.8 6 5–40 15
SA∗ 8.7 2 70 112 99.0 −2.8 8 5–34 15
3 66 128 99.3 −3.3 6 5–38 15
4 16 155 99.6 −3.6 4 5–45 15
1 30 174 99.0 −2.9 9 5–50 15
SB∗∗ 8.9 2 70 174 99.3 −3.3 11 5–50 15
3 180 124 100.0 −4.2 18 5–37 15
S1 8.8 348 20 20 / / / / 13
S2 8.92 348 20 20 / / / / 13
S3 8.7 1 370 95 98.8 −1.22 10 10 13
S4 8.8 1 450 117 99.01 −1.52 6 10 13∗SA: 1797 tsunami event; ∗∗SB: 1833 tsunami event.
The change of bottom elevation is updated by the follow-ing continuity equation:
∂zb
∂t+ 1
1 − p
(∂qx
∂x+ ∂qy
∂y
)= 0 (5)
where p is the porosity of bed material. qx and qy are givenby:
qx = ∂hCu
∂x(6)
qy = ∂hCv
∂y(7)
which represent the sediment transport rates in x- and y-directions, respectively.
Multiple sand layers, which are composed of multiplesediment classes, can be considered by assigning differentgrain sizes in different areas. These features make it possi-ble for tracking sediment movement and discussing charac-teristics of tsunami deposits such as landward fining.
3. Model Setup3.1 Tsunami sources
Key fault parameters of the six tsunami sources usedin this study are listed in Table 1. The key parametersof two historical great earthquakes (1797 earthquake and1833 earthquake, which are SA and SB in Table 1, respec-tively) were inferred from coral microatolls by Natawidjajaet al. (2006), which were also used by Borrero et al. (2006)to investigate the tsunami inundation map in Padang andBengkulu. Based on the geodetic and paleogeodetic mea-surements of interseismic strain above the Mentawai sectionof the Sunda subduction zone, moment deficit in Mentawaimegathrust was inferred (Natawidjaja et al., 2006; Chliehet al., 2008), and two plausible rupture scenarios with8.8Mw and 8.92Mw were proposed (Natawidjaja et al.,2009). These two scenarios (S1 and S2 in Table 1) havesophisticated inhomogeneous slip distribution informa-tion, and were used by German-Indonesia Tsunami EarlyWarning(GI-TEWS) and the Ministry of Marine Affairs andFisheries, Indonesia for the inundation modelling and haz-ard mapping for Padang (Goseberg and Schlurmann, 2008;Muhari et al., 2010). In these two fault rupture models,
the currently locked zone at Mentawai patch was dividedinto 348 fault subsets with each segment having a size of20 km×20 km (Chlieh et al., 2008). Based on the strain andstress rates of Sumatra Fault calculated from the GPS mea-surements in Indonesia and its close vicinity, Aydan (2008)predicted an earthquake of magnitude 8.7 in the offshorearea of Siberut and Sipora islands, with a rupture lengthof 400–450 km and an epicentre about 260 km away fromthe west coast of Sumatra. Tobita (2007) also predicted aMw 8.4–8.8 earthquake with a rupture length of 370 km inthe study area according to Synthetic Aperture Radar (SAR)interferometry data in West Sumatra. Since no detailed pa-rameters of these two scenarios were given in the originalpapers except the potential magnitudes and fault lengths,we adopted the fault parameters in Muhari et al. (2010) ex-cept that the slips had been changed to satisfy the specifiedmagnitudes, and listed these two models as S3 and S4 inTable 1.
In this study, the seafloor displacement is calculated byusing the rupture model of Okada (1985). Since earth-quake rupture velocities are large with respect to tsunamiphase speeds, we have assumed that the initial surface ele-vation will simply follow the sea floor deformation instan-taneously. The initial sea surface elevations for all sourcemodels are given in Fig. 2.3.2 Offshore boundary condition
The open boundary conditions in XBeach have beenmodified to take as inputs the time series of sea surface el-evation and incident wave velocity, which can be obtainedfrom other large-scale numerical simulations or field surveydata. For this study, the offshore boundary conditions usedfor sediment transport simulations are provided by run-ning the hydrodynamic model COMCOT (Cornell Multi-grid Coupled Tsunami model) (Liu et al., 1995; Wang andLiu, 2005; Wijettunge et al. 2008). Nested grids were usedin COMCOT to improve the computational efficiency andnumerical accuracy (see Fig. 3). The information on thenested grids is summarized in Table 2. On all open bound-aries, radiation boundary conditions are used to minimizethe possible wave reflection from the numerical boundaries.When waves are moving on a beach, a wet-dry algorithm isused to track the moving water line.
XBeach is used to simulate the sediment transport in the

L. L. LI et al.: TSUNAMI-INDUCED COASTAL CHANGE 803
Fig. 2. Initial surface elevation map of the six scenarios.
Painan Bay and the city area which are covered by theinnermost grid (grid C in Fig. 3). To run XBeach, theincoming wave conditions must be specified on the offshoreboundary; to achieve that, we first run COMCOT for eachfault rupture model to get the time series of the surfaceelevation and velocity on this boundary, then interpolate thesurface elevation and velocity from COMCOT simulationusing the time step and spatial spacing required by XBeachsimulations.
Figure 4 shows sample time series of the incident tsunamiwaves at P1 (shown in Fig. 1) for the six scenarios listed inTable 1. For the scenarios SA, SB, S3 and S4, the leadingwaves are negative waves; while for the scenarios S1 and
S2, the leading waves are positive waves, with maximumwave heights of nearly 5 m and 7 m, respectively.
To estimate the significance of possible wave reflectionfrom the Painan beach, we re-run COMCOT with artificialdamping layers introduced in the bay area and the city area(Manning coefficient is gradually increased from the bayarea to the city area), and then compared the surface ele-vations with those in Fig. 4; no significant difference wasfound. We conclude that it is not necessary to pay specialattention to the wave reflection from the Painan beach in thenumerical simulations.
For all sediment transport simulations, the time series ofsurface elevation and water velocity at the offshore bound-

804 L. L. LI et al.: TSUNAMI-INDUCED COASTAL CHANGE
Table 2. Information on the setup of the four grids for COMCOT.
Grid 0 Grid A Grid B Grid C (Painan)
Number of grids 481 × 421 723 × 723 543 × 543 680 × 680
Latitude scope (degree) 95E to 103E 98E to 102E 100E to 101E 100.4E to 100.65E
Longitude scope (degree) 6S to 1N 4S to 0N 1.8S to 0.8S 1.45S to 1.2S
Grid size (m) 1850 616.67 205.56 41.07
Parent grid None Grid 0 Grid A Grid B
Ratio to parent grid None 3 3 5
Time step (sec) 1.2 0.6 0.3 0.15
Coord. system Spherical Spherical Spherical Cartesian
SWE type Linear Linear Linear Nonlinear
Manning roughness 0 0 0 Non-zero
SWE = Shallow Water Equations.
Fig. 3. Nested grids for COMCOT simulation domain.
Fig. 4. The time series of the surface elevation (from COMCOT) at point P1 (shown in Fig. 1) on the open boundary.
ary were also linearly interpolated to a smaller time step of0.1 s. The innermost gird size used in all COMCOT sim-ulations is 41 m in the bay area; the velocity and surfaceelevation provided by COMCOT are interpolated to a finer
grid (5 m) on the offshore boundary for all sediment trans-port simulations. The condition that sediment can freelypass through the offshore boundary is achieved by request-ing that the normal gradient of sediment concentration is

L. L. LI et al.: TSUNAMI-INDUCED COASTAL CHANGE 805
Table 3. Accumulative percentages of grain size for sand samples collected from 5 locations.
Class SP1 SP2 SP3 SP4 SP5Shoreline Mid-tide High tide Inland Breaker line
>2 mm 0.00% 0.00% 0.00% 2.42% 0.53%>1 mm 0.00% 0.03% 0.00% 18.66% 2.44%
>0.5 mm 0.03% 0.43% 0.19% 46.37% 27.18%>0.25 mm 5.86% 2.21% 1.17% 80.55% 89.35%>0.125 mm 94.35% 63.01% 28.65% 98.61% 99.53%>0.063 mm 100.00% 100.00% 100.00% 100.00% 100.00%
d50 (mm) 0.18 0.14 0.10 0.46 0.39
zero at the offshore boundary.3.3 Topography and bathymetry
A relatively high resolution topography data set is neededfor inundation and sediment transport simulations. Thebathymetric and topographic data near-shore and onshoreof Painan are derived from two data sets: (i) the SRTMtopography data1 and (ii) the bathymetry and topographyprovided by USC Tsunami Research Center and GreenInfoNetwork (we shall call it USC-TRC data in this paper).The first set of data has a spatial resolution of 92 m. Thesecond data has a spatial resolution of about 200 m whichcombined 1:250,000 digitized nautical charts (1997–2004)with publicly available deep water bathymetry (SRTM30-Plus). Borrero et al. (2006) used the second data set in theirstudy of tsunami inundation modeling for western Suma-tra. To prepare our bathymetric and topographic data, wefirst interpolated the bathymetric data from USC-TRC ontoa 92.13 m × 92.13 m grid using a bilinear method with-out gap filling; then we combined the SRTM topographydata with the new 92 m-USC-TRC bathymetric data to pro-duce a uniform bathymetric and topographic data set with aspatial resolution of 92.13 m. The digitized shoreline fromnautical charts was adjusted manually for consistency withSRTM-water boundary; data gaps between the bathymetryand topography were interpolated and filled up with nauti-cal charts. Since a finer grid is needed for predicting erosionand deposition maps, we further interpolated the bathymet-ric and topographic data onto a 5 m×5 m grid for sedimenttransport simulations.
To verify the topographic data and collect sand samplesin Painan, we conducted a field survey in Painan and itsneighbouring city Pariaman during August 18–23, 2010.We measured the slope of the shore face (between the waterline and the high tide line) along the coast of Painan. Wefound that the slope of the shore face falls in the range of1:12 and 1:15 and the typical width of the shore face isabout 20 m, giving us an elevation change of about 1.5 mfrom the water line to the high tide line. From the high tideline to the coastal road, the elevation change is about 1 m.We conclude that the elevation change from the water lineto the coastal road is about 2.5 m, which is consistent withthe topographic data we use for inundation simulations (seeFig. 7 and Fig. 8 for two typical beach profiles). Therefore,we believe that the accuracy of the topographic data we useis within 1 m.
1The Shuttle Radar Topography Mission (SRTM) data has a horizontalresolution of 3 seconds or approximately 92 meters. The data is availableat http://srtm.csi.cgiar.org/.
3.4 Size distribution and composition of sandThe Painan beach is about 1300 m long without major
man-made structures, except a 60 m long, 100 m widerubble mound platform in the northern part of the bay anda 110 m by 110 m sized seaport in the southern part ofthe bay. Figure 1 shows the five representative locationschosen for surface sand samplings in Painan; these locationsinclude one point in the breaking zone (SP5), three pointsat the shore-face (mid-tide line) (SP1, SP2, SP3), and onepoint in the inland area (SP4). A grain-size analysis wasconducted on all the collected sand samples according tothe method described in Fork and Ward (1957). The sandsamples from both Painan and Pariaman were analyzed, andthe results for Painan are listed in Table 3: the sand in thebreaker zone belongs to medium-size sand with a mediangrain size of about 0.4 mm, and the sand in the shore facebelongs to fine-size sand with a median grain-size of 0.15–0.2 mm. Our results agree with typical sediment grain-sizedistribution across the beach (Komar, 1976). The grain-sizeanalysis of the sand samples collected at different depthsonshore in Pariaman showed that the top layer was fine sandof d50 = 0.22 mm and the bottom layer was medium sandof d50 = 0.4 mm. The top layer was approximately 0.35 mthick from the mid-tide line to the high-tide line. As nosand samples were taken beneath the surface layer in Painanbeach, it is assumed in the present study that Painan beachhas a vertical sediment structure similar to that of Pariaman.
Based on the surveyed data, a two-layer sand distributionmodel (Fig. 5) was assumed as the initial setting. The ce-ment road near the shoreline is assumed non-erodible andthe area between shoreline and the cement road is assumederodible: the influences of the wooden houses on the sedi-ment transport are ignored as these wooden houses can beeasily smashed and swept by the strong tsunami waves (seeFig. 6 for the typical appearance of these wooden housesand the road). The simulated area is divided into 4 zonesalong the cross-shore direction. The boundary betweenzone-1 and zone-2 is chosen such that the local wave lengthof typical wind waves is about 90% of the deep water wavelength and the bottom sand is not likely to be moved bythe wind waves. The thickness of the top layer is 0.35 mand the thickness of the bottom layer is 4.65 m. Mediumsand (d50 = 0.4 mm) is used in the high wave energy zonefor both the top and bottom layers; the width of this zoneis 20 m. In the region between the offshore boundary andthe high wave energy zone, fine sand (d50 = 0.2 mm) wasused for both the top and bottom layers. In the shore-facezone (width = 20 m), fine sand was used for the top layer

806 L. L. LI et al.: TSUNAMI-INDUCED COASTAL CHANGE
Fig. 5. The initial sand distribution (not drawn to scale).
Fig. 6. Houses and the road near the Painan beach. Left: A cement road about 5 m wide approximately parallel to the shoreline. The distance betweenthe shoreline and the road is about 60 m. Right: Wooden houses with iron roofs just behind the high-tide line.
and medium sand was used for the bottom layer. In the re-gion (width = 40 m) between the shore-face and the cementroad, medium sand was used for both the top and bottomlayers. The city area, seaport and stone platform were allconsidered to be non-erodible.
4. Results and Discussion4.1 Inundation maps
Table 4 summarizes the arrival time of the first wavepeak, tsunami height along the shoreline, and inundationdistance in the city area of all the simulated scenarios. Thedifferences among these 6 scenarios are notable. The cal-culated maximum tsunami heights along the shoreline are2.6 m, 3.5 m, 3.9 m and 3.4 m for SA, SB, S3 and S4, re-spectively. These tsunami heights would cause only moder-ate flooding in the city area with a maximum inundation dis-tance of 570 m for S3. While for other two scenarios S1 andS2, severe flooding would happen in the city area, resultingin maximum inundation distances 1433 m and 1842 m, re-spectively. We remark that for the S2, the whole Painan citywould be submerged. The significant differences among thesimulated scenarios highlight the dramatic effects of slipdistribution and sea floor deformation. For scenarios SA,SB, S3 and S4, the high-slip regions locate in the seawardof Mentawai islands. The displaced seawater would have to
pass through the barrier islands before reaching the Suma-tran mainland; much of the tsunami energy would be dis-sipated during the wave propagation process. On the otherhand, for S1 and S2, a large portion of the high slip re-gion exists in the Mentawai strait, leaving the coastal area ofwest Sumatra exposed directly to the tsunami waves. More-over, the subsidence along the Sumatran mainland wouldallow tsunami waves to penetrate further inland, causingmore damage and flooding than other scenarios. These phe-nomena were also discussed by Borrero et al. (2006) andMcCloskey et al. (2008).
After comparing the simulated tsunami wave heights andinundation distances for all scenarios, we found that sce-nario S2 is the worst case scenario. The inundation map forS2 is shown in Fig. 7, where variations of the inundationdepth along two cross-sections are also shown. Scenario S3represents a typical scenario of negative leading wave. Theinundation map for S3 is shown in Fig. 8, where variationsof the inundation depth along two cross-sections are alsoshown. These two scenarios are chosen to further study thehydrodynamics, sediment transport and shoreline changes.
For S2, the first wave front would reach the coast ofPainan about 26 minutes after the rupture, with an initialset-down of water surface before the peak. The initial set-down of the surface elevation is because of the subsidence

L. L. LI et al.: TSUNAMI-INDUCED COASTAL CHANGE 807
Table 4. The simulated inundation parameters for 6 scenarios in Painan.
Arrival time of Arrival time of Water surface elevation Maximum inundation
Scenario first crest first wave trough along shoreline distance
(min) (min) (m) (m)
SA / 35 2.3–2.6 152
SB / 36 3.3–3.5 508
S1 36 / 4.6–4.9 1433
S2 36 / 6.7–7.0 1842
S3 / 38 3.5–3.9 570
S4 / 37 2.5–3.4 222
Fig. 7. Left: Map of the maximum inundation depth (m) in Painan city for Scenario S2; Right: water surface and topography in section A–A andsection B–B.
in the coastal area (Fig. 4). Figure 7 shows a map of themaximum flow depth during the first three hours of tsunamiwave attack: the entire city would be inundated with a max-imum tsunami inundation depth of about 6.8 m in the cityarea. Within the first three hours, three main peak wavescould reach the Painan bay area: the first peak wave mighthit the shoreline 37 minutes after the rupture, raise the wa-ter surface up to 7 m at the shoreline and penetrate 1884minland within 14 minutes. The average inundation depthis about 3–4 m in the city area and the maximum inunda-tion depth occurs in the northeast part of the city, wherethe elevation is relatively low. According to Shuto (1993),when the inundation depth is larger than 2 m, wooden housewill be completely washed away. Thus the wooden housesnear the high-tide line would be swept away, producing alarge amount of floating debris. The average speed of thewave front could be about 2 m/s, and the inundation flowvelocities may reach about 5 m/s which are large enough toerode a large amount of sediment near the shoreline. Bear-ing in mind that we have not considered the city buildings inthe simulations; if the effects of buildings were considered,the maximum flow speed within constrained streets may be
faster than 5 m/s due to the channelling effects (Borrero,2005).4.2 Sediment transport for scenario S2
4.2.1 Erosion and deposition Nine instants are in-dicated in Fig. 9 at which nine snapshots are taken toshow suspended sediment concentration covering the wa-ter flooding and retreating processes for S2 (Fig. 10(a)–(i)). When the first tsunami wave front approaches theshoreline at 26 minutes after the rupture, the sedimentconcentration increases rapidly near the wave front. Thehighly erosive wave front would suspend a large volumeof sand, resulting in a maximum sediment concentrationmore than 100 kg/m3. These kinds of high concentrationsediment-laden waves have been observed and depicted bymany tsunami witnesses or satellite images (Narayana etal., 2007; Brooks, 2010). The concentration of suspendedsediment could be as large as 100 kg/m3, which is similarto that in the hyper-concentration flows observed in Yel-low River in China (Chien and Wan, 1999). The sedimentconcentration would decrease as the flow velocity decreasesfrom 26 minutes to 40 minutes after the rupture, and a por-tion of the suspended sand would be deposited in the city

808 L. L. LI et al.: TSUNAMI-INDUCED COASTAL CHANGE
Fig. 8. Left: Map of the maximum inundation depth (m) in Painan city for Scenario S3; Right: water surface and topography in section C–C and sectionD–D.
Fig. 9. Time series of velocity magnitude (left) and surface elevation (right) at point G1 (see Fig. 7). The labels (a)–(i) refer to the times at which thesnapshots are taken of the concentration of the suspended sand in the flooding water.
area. About 40 minutes after the rupture, the flooding wa-ter reaches the maximum run-up and the flooding water inthe city area starts retreating. Channeled backwash flows,which tend to follow the coastal morphology since they aremainly driven by gravity, can be more erosive and powerfulthan channeled run-up flows. The strong backwash flowscould transport seaward a large amount of debris erodedfrom shoreward areas. About 1 hour 15 minutes after therupture the concentration of suspended sediment becomesalmost zero in both the city and bay areas.
Significant sediment transport may occur near the shore-line during the water retreating period, resulting in a neterosion of the shore face and severe scour in the region ad-jacent to the seaward side of the road base (see Fig. 11). Themost severe erosion would be found in the southern part ofthe beach where the elevation is relatively low and the chan-
neled retreating flow may form. After three hours, most ofthe eroded sand would be transported off-shore to the activecoastal zone by the backwash flow, resulting in a maximumdeposition depth of 1.0 m in the bay area (see Fig. 11). Thisphenomena is consistent with the bathymetric surveys con-ducted at Kuala Meurisi (a site about 100 km south of BandaAceh) following the 2004 tsunami in which a large offshorebar was observed (Gelfenbaum et al., 2007). Apotsos etal. (2011) attributed the formation of large offshore bars tocollisions of the backwash flows and the up-rushing waves.A thin layer (about 5–30 cm thick) of sediment could bedeposited in the city area, and a maximum scour depth ofnearly 5 m might occur on the seaward side of the road,which is caused by the abrupt change of the erodible andnon-erodible beach materials.

L. L. LI et al.: TSUNAMI-INDUCED COASTAL CHANGE 809
Fig. 10. Snapshots of suspended sediment concentration (kg/m3) during the first 1.5 hours. Concentration greater than 50 kg/m3 are not resolved.

810 L. L. LI et al.: TSUNAMI-INDUCED COASTAL CHANGE
Fig. 11. (a) Map of erosion and deposition areas (color bar indicates the erosion (negative) and deposition (positive) depth (m)); (b) Bed profile changein section 1–1; (c) Bed profile change in section 2–2; (d) Bed profile change in section 3–3.
Fig. 12. Upper: bed elevation change for section E–E; Lower: the fraction of 0.2 mm sand along section E–E for S2. A value of 1 corresponds to 100%of fine sand (0.2 mm), a value of 0.5 corresponds to 50% of fine sand and 50% of medium sand, a value of 0 corresponds to 100% of medium sand(0.4 mm).
4.2.2 Scouring around the road and the seaportScour damage is one of the main factors leading to the de-struction of coastal infrastructure, such as building foun-dations, roadways, jetties and other coastal structures(Maheshwari et al., 2006; Paris et al., 2009). During the1960 Chilean Tsunami, a quay wall in Hachinohe Port anda jetty in Kesen-numa bay were destroyed because the footof the jetty were eroded as deep as 10 m (Takahashi etal., 2000). The scour depth greater than 2 m were also at-
tested by many road failures found in south Lhok Nga, In-donesia (Paris et al., 2009) and Kamala, Phuket, Thailand(Lukkunaprasit and Ruangrassamee, 2008) during the 2004Indian ocean tsunami. In our simulations, a scour trenchwith a maximum depth of nearly 5 m is formed at the toeof the roadway foundation (Fig. 12), which may ultimatelylead to a collapse of the road since the non-erodible depth(road foundation) is normally on the order of 1 m. The col-lapse of the shoreline road would significantly hamper the

L. L. LI et al.: TSUNAMI-INDUCED COASTAL CHANGE 811
Fig. 13. Time series of velocity magnitude (left) and surface elevation (right) at point G2 (see Fig. 8). The labels (a)–(i) refer to the times at which thesnapshots are taken of the concentration of the suspended sand in the flooding water.
post-tsunami relief and rescue work. Our simulations alsoshow that significant scour occurs in the immediate vicinityof the stone platform located in the north side of the baywith the maximum scour depth exceeding 1 m.
It is realized that the scouring induced by tsunamis isdifferent from the present understanding of scour processesin a river or coastal environment around bridge piers (Katoet al., 2000; Nakamura et al., 2008). Tsunami waves arevery long waves and tsunami flows are far from steady anduniform. For tsunami flows, scouring occurs often withinless than 1 hour. Some experimental and numerical studieshave been done to understand the tsunami-induced scoursaround coastal structures (Kato et al., 2001; Tonkin et al.,2003; Nakamura et al., 2008), and it is revealed that mostrapid scour on sand substrate occurred at the tsunami down-rush stage.
4.2.3 Characteristics of tsunami deposits One wayto study the historical tsunami is to examine the character-istics (e.g., grain size distribution) of the tsunami depositsonshore (Shi et al., 1995; Dawson et al., 1996; Gelfenbaumand Jaffe, 2003; Moore et al., 2007; Paris et al., 2007).When analyzing tsunami deposits, it is important to knowthe origin of the sediments in a core sample and to relatethe tsunami deposits to the flooding and retreating processduring a tsunami event. Figure 12 shows the change of bedprofile and the change of sand fraction in the upper layeralong the cross-section E–E in Fig. 11. After the attack ofthe tsunami, due to the severe erosion in the shore-face, thefine sand in the shore-face could be moved, exposing thebottom sand layer to the water above. A large amount offine sand and part of medium sand could be deposited in thebay area, however, no significant change in the sand fractioncan be observed in the bay area. Some of the sand depositedin several places in the city areas may come from the bayand the shore-face areas, and it is possible to examine thesediment cores in these places to investigate the historicaltsunamis from tsunami deposits (Bourgeois, 2009).
4.2.4 Remarks on equilibrium sediment concentra-tion and settling velocity In addition to the van Rijn’sformula, we have also tested the Bagnold’s formula (1966)and Ackers-White’s formula (1973) for the equilibrium sed-
iment concentration (the detailed comparison is not shownhere). The erosion and deposition patterns obtained bythese three formulas are generally similar: the erosion depthpredicted by van Rijn’s formula is between those pre-dicted by Ackers-White’s formula and Bagnold’s formula.Our simulated erosion and deposition depths are quantita-tively reasonable even though the hindered settling effectsare not considered. This could also be evaluated throughthe measured data during the post-tsunami field surveys(Gelfenbaum and Jaffe, 2003; Narayana et al., 2007; Srini-vasalu et al., 2007; Pari et al., 2008). However, the max-imum sediment concentration could reach more than 800kg/m3 in several spots during a short period of time; there isa concern that the high suspended sediment concentrationmay hinder the settling of sediment grains (van Rijn, 2007).We have evaluated the effect of hindered settling by us-ing the modified settling velocity ws = (
1 − ctots /cd
)5ws,0,
where ws,0 is the original settling velocity, ctots is the total
mass concentration of suspended sediment in the water col-umn and cd is a reference density (Richardson and Zaki,1954). We took cd = 1600 kg/m3 in this exercise. For auniform concentration of 50 kg/m3 during the entire inunda-tion period, the hindered settling velocity would be reducedby less than 15% relative to the original settling velocity.For the scenario S2, the concentration of suspended sand isless than 50 kg/m3 most of the time during inundation pe-riod; high concentration region may be found only near theshoreline (see Fig. 10). Our simulation shows that the mod-ified settling velocity does not cause noticeable changes inthe deposit thickness or the scour depth; our results are con-sistent with those of Apotsos et al. (2011), who consideredthe combined effects of hindered settling and stratification.However, for 3D models, Apotsos et al. (2011) found thesignificant influence of hindered settling velocity on the de-posit thickness if the mixing of sediment into water was notreduced by the density stratification due to the high concen-tration of suspended sediment.4.3 Hydrodynamics and sediment transport for sce-
nario S3We examine scenario S3 in Table 4, which has a negative
leading wave. As shown in Fig. 8, this scenario may cause
812 L. L. LI et al.: TSUNAMI-INDUCED COASTAL CHANGE
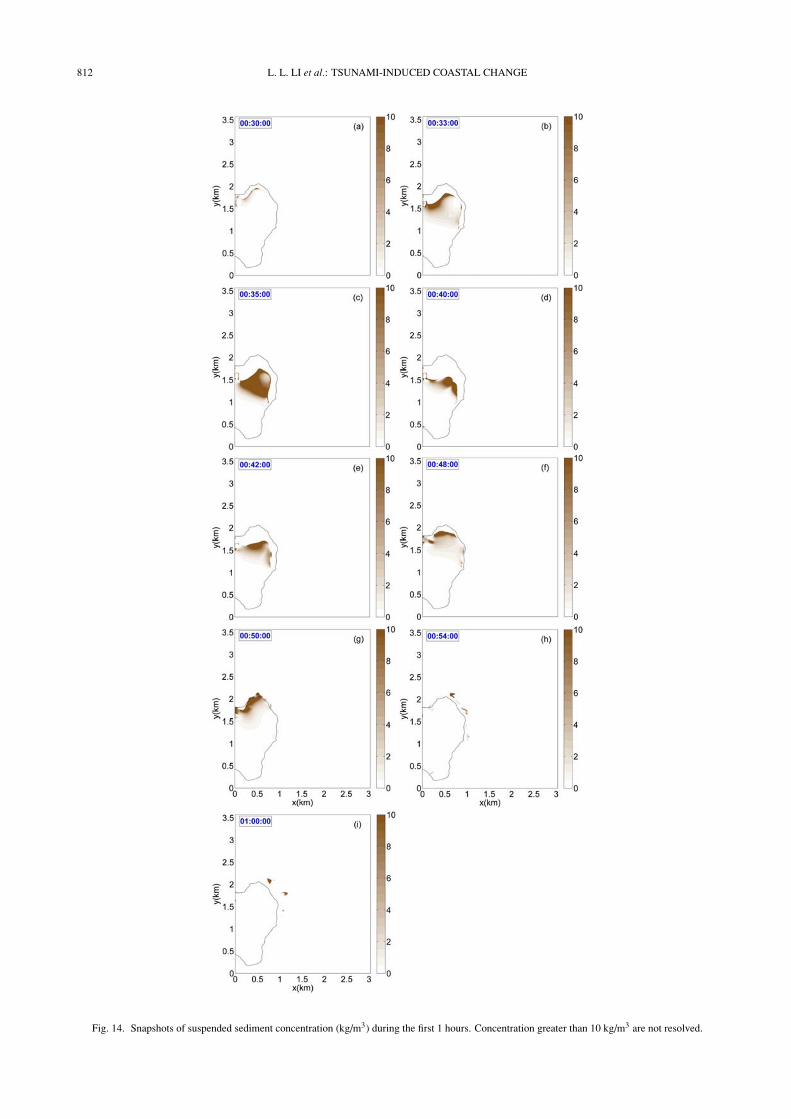
Fig. 14. Snapshots of suspended sediment concentration (kg/m3) during the first 1 hours. Concentration greater than 10 kg/m3 are not resolved.

L. L. LI et al.: TSUNAMI-INDUCED COASTAL CHANGE 813
Fig. 15. Left: erosion and deposition map for S3; Right: bed elevation change for cross-sections I–I, II–II, III–III.
Fig. 16. Upper: bed elevation change for section E–E; Lower: the fraction of 0.2 mm sand along section E–E for S2. A value of 1 corresponds to 100%of fine sand (0.2 mm), a value of 0.5 corresponds to 50% of fine sand and 50% of medium sand, a value of 0 corresponds to 100% of medium sand(0.4 mm).
a moderate inundation in Painan. In scenario S3, a largeamount of seawater in the bay would retreat seaward inthe first 35 minutes, exposing nearly 500 m wide originalseafloor to the air before the arriving of the first positivewave. During the retreating period, a considerable amountof sediment would be suspended and transported seaward.Figure 13 shows the time series of velocity magnitude andsurface elevation at point G2 (see Fig. 8) with nine instantsindicating at which the snapshots of the concentration ofsuspended sediment are taken (Fig. 14). Erosion wouldoccur in the north part of Painan Bay as the bathymetry isshallower in this area. When the first peak wave penetratesin the Bay, it would collide with the first receding wave andsome of the suspended sediment would be deposited locallyas the flow velocity abruptly decreases. The peak wavewould first fill up the northern part of the bay area before
it could inundate inland. Some sediment would be erodedby the passing wave-front while the amount of suspendedsediment is noticeably less in the inland area than in thenorth Bay area. Limited flooding would occur near theshoreline area which causes weak backwash flow and littlescour near the road. Unlike the severe erosion and scouroccurs near the shoreline in scenario S2, the most severeerosion happens in the offshore area with a larger extentdue to the first retreating wave. Moreover, two separatedeposition areas could be observed in the further offshorearea and near the shoreline area. These depositions are allgenerated by the collision of onrush wave and retreatingwave but in different phases (Fig. 15).
According to the change of the bed profile and the changeof the sand fraction along the cross-section I–I (see Fig. 16),the deposition near the shoreline is composed of fine sand.

814 L. L. LI et al.: TSUNAMI-INDUCED COASTAL CHANGE
The sand source should come from the shore-face whichcan be easily inferred from the hydrodynamic process andthe resulting distribution of sand fraction. The fine sand inthe shore-face has been moved to the seaward and mixedwith the medium sand from either the high wave energyarea or the house base area. Very little deposition couldbe observed in the city area except a small patch near thelimit line of runup. Similar to S2, the deposition is mainlymedium sand. The morphological change is moderate com-pared with scenario S2. But it is hard to conclude that theleading depression wave form would cause slighter sed-iment movement than the leading positive one since themagnitude of the hydrodynamic parameters for these twoscenarios are different (e.g. wave heights, wave lengths).Though some investigations (Kobayashi and Lawrence,2004; Apotsos et al., 2011) claimed that the leading depres-sion wave would cause little erosion during retreating stageof first wave. Meanwhile, smaller runup and weaker back-wash flow would cause less sediment movement. The dif-ference of the erosion and deposition pattern between thesetwo scenarios provides very helpful information in the se-lection of drilling sites for core samples in investigation ofhistorical and prehistoric tsunami deposits.
5. SummarySix rupture models with magnitude ranging from Mw =
8.7 to Mw = 8.92 have been considered in this study toassess the tsunami inundation and sediment transport inPainan, West Sumatra, Indonesia. According to the worstscenario, Painan would be hit by the first tsunami waveabout 26 minutes after the rupture, and the tsunami couldcause a maximum inundation depth of about 6.8 m and amaximum inundation distance about 1884 m, with an av-erage inundation depth of about 3–4 m in the city area.Sediment transport caused by the tsunami waves has alsobeen examined for two representative scenarios: one hasa positive leading wave and the other has a negative lead-ing wave. For the case of a positive leading tsunami wave,a large amount of sediment would be suspended near theshoreline during the backwash stage and the suspended sed-iment would be deposited in the offshore area forming alarge sandbar near the shoreline. A considerable amount ofsediment would be suspended by the passing wave front andleaving behind a small amount deposition in the city area.The foundation of a shore-parallel road could be severelyeroded by the backwash flows. For the case of a nega-tive leading tsunami wave, significant sediment movementwould occur during the backwash stage accompanying thenegative peak wave; an offshore sandbar could form in thebay area, while no noticeable large area of sand depositcould be found in the city area. The difference of the ero-sion and deposition patterns between these two scenariosprovides useful information for tsunami geologists to fur-ther study the paleo-tsunami in this area.
Acknowledgments. This work has been supported by the EarthObservatory of Singapore (EOS), Nanyang Technological Univer-sity, Singapore, through the project “Tsunami Hazard Mitigationfor West Sumatra”. The authors would like to thank the followingcolleagues at the Earth Observatory of Singapore: Dr. Kusnowid-jaja Megawati for arranging our survey trips; Dr. Adam D. Switzer
and Miss Lee Yingsin for providing the facilities for the grain-sizeanalysis. We also thank the two anonymous reviewers for theirconstructive comments and suggestions, which have greatly im-proved the quality of the manuscript. This is EOS contributionNo. 17.
Appendix A. Expressions for Adaptation Time Tsand Equilibrium Sediment Concen-tration Ceq
This appendix summarizes the empirical formula for theadaptation time and the equilibrium sediment concentrationused in XBeach. The purpose is to explain how some ofthe important model parameters were chosen in our simu-lations. The adaptation time Ts (unit: s) is determined bythe local water depth h, sediment fall velocity ws , and asediment transport depth factor fTs :
Ts = max
(fTs
h
ws, 0.2
)(A.1)
The formula for sediment fall velocity in XBeach is pro-posed by Ahrens’s (2000)
ws = C1(s − 1)gd250/ν + Ct
√(s − 1)gd50; (A.2)
C1 = 0.055 tanh(12A−0.59 exp(−0.0004A)
) ; (A.3)
Ct = 1.06 tanh(0.016A0.50 exp(−120/A)
)(A.4)
where A = (s − 1)gd350/ν
2, A is Archimedes buoyancyindex, s = ρs/ρ is specific gravity. ν is kinematic vis-cosity coefficient, d50 is the median grain size, d90 is de-fined as the grain diameter at which 90% of the sand sam-ple is finer than. According to Eqs. (8)–(11), small val-ues of Ts correspond to nearly instantaneous sediment re-sponse. This means that coarser sand with larger fall veloc-ity corresponds to quicker sediment response. fTs is a fac-tor between 0.01–1.0. In our simulations, we set fTS = 0.1,which is chosen based on our sensitivity analysis.
The equilibrium sediment concentration Ceq is calculatedby van Rijn’s formula.
Ceq = qs + qb
|u|h (A.5)
where qs and qb are sediment volume fluxes for bed loadand suspended load, respectively; both are all functions ofthe sediment grain size, relative density of the sediment andthe local water depth (van Rijn, 1993). |u| is the magnitudeof the depth-averaged flow velocity. van Rijn (1993) sug-gested the following expressions for the sediment volumefluxes for bed load and suspended load:
qs = 0.012|u| (|u| − ucr)2.4 d50 D−0.6
∗((s − 1)gd50)
1.2 (A.6)
qb = 0.005|u|( |u| − ucr
(s − 1)gd50
)2.4 (d50
h
)1.2
(A.7)
where D∗ = [(s − 1)g/ν2
]1/3d50 is the dimensionless par-
ticle diameter which reflects the influence of gravity, den-sity and viscosity. ucr is critical depth-averaged flow veloc-ity. According to van Rijn (1993),
ucr = 0.19(d50)0.1 log(12h/3d90) (A.8)

L. L. LI et al.: TSUNAMI-INDUCED COASTAL CHANGE 815
when 0.0001 ≤ d50 ≤ 0.0005 and
ucr = 8.50(d50)0.6 log(12h/3d90) (A.9)
when 0.0005 ≤ d50 ≤ 0.002. In the above two equations,the unit of d50 is meter.
ReferencesAckers, P. and W. R. White, Sediment transport: New approach and analy-
sis, J. Hydraul. Div., 99, 2041–2060, 1973.Ahrens, J. P., A fall-velocity equation, J. Waterway Port Coast. Ocean
Eng., 126, 99–102, 2000.Apotsos, A., G. Gelfenbaum, and B. Jaffe, Process-based modeling of
tsunami inundation and sediment transport, J. Geophys. Res., 116, 20,2011.
Aydan, O., Seismic and tsunami hazard potentials in Indonesia with aspecial emphasis on Sumatra Island, Journal of The School of MarineScience and Technology, Tokai University, 6, 19–38, 2008.
Bagnold, R. A., An approach to the sediment transport problem fromgeneral physics, Geological Survey Professional Papers, Washington,USA, 1966.
Borrero, J. C., Field survey of northern Sumatra and Banda Aceh, Indone-sia after the Tsunami and earthquake of 26 December 2004, Seismol.Res. Lett., 76, 312–320, 2005.
Borrero, J. C., K. Sieh, M. Chlieh, and C. E. Synolakis, Tsunami inunda-tion modeling for western Sumatra, Proc. Natl. Acad. Sci. USA, 103,19673–19677, 2006.
Bourgeois, J., Geologic effects and records of tsunamis, in The Sea:Tsunamis, edited by E. N. Bernard and A. R. Robinson, Harvard Uni-versity Press, London, England, 2009.
Brooks, O., Tsunami Alert: Beating Asia’s Next Big One, 215 pp., MarshallCavendish Editions, Singapore, 2010.
Carrier, G. F. and H. P. Greenspan, Water waves of finite amplitude on asloping beach, J. Fluid Mech., 4, 97–109, 1958.
Chien, N. and Z. Wan, Mechanics of Sediment Transport, 913 pp., Ameri-can Society of Civil Engineers, 1999.
Chlieh, M., J. P. Avouac, K. Sieh, D. H. Natawidjaja, and J. Galetzka,Heterogeneous coupling of the Sumatran megathrust constrained bygeodetic and paleogeodetic measurements, J. Geophys. Res. B: SolidEarth, 113, 2008.
Dawson, A. G., S. Shi, S. Dawson, T. Takahashi, and N. Shuto, Coastalsedimentation associated with the June 2nd and 3rd, 1994 Tsunami inRajegwesi, Java, Quat. Sci. Rev., 15, 901–912, 1996.
Deltares, XBeach Testbed Report, Delft, The Netherlands, 2010.Folk, R. L. and W. C. Ward, Brazos River Bar: A study in the significance
of grain size parameters, J. Sediment. Petrol., 27, 3–26, 1957.Galappatti, G. and C. B. Vreugdenhil, A depth-integrated model for sus-
pended sediment transport, J. Hydraul. Res., 23, 359–377, 1985.Gelfenbaum, G. and B. Jaffe, Erosion and sedimentation from the 17 July,
1998 Papua New Guinea tsunami, Pure Appl. Geophys., 160, 1969–1999, 2003.
Gelfenbaum, G., D. Vatvani, B. Jaffe, and F. Dekker, Tsunami inundationand sediment transport in vicinity of coastal mangrove forest, Coast.Sediment., 1–12, 2007.
Goseberg, N. and T. Schlurmann, Relevant factors on the extent of inun-dation based on tsunami scenarios for the city of Padang, West Suma-tra, in Proceedings of the International Conference on Tsunami Warn-ing(ICTW), Bali, Indonesia, 2008.
Goto, K. and F. Imamura, Numerical models for sediment transport bytsunamis, Quatern. Res., 46, 463–475, 2007.
Goto, K., S. A. Chavanich, F. Imamura, P. Kunthasap, T. Matsui, K. Mi-noura, D. Sugawara, and H. Yanagisawa, Distribution, origin and trans-port process of boulders deposited by the 2004 Indian Ocean tsunami atPakarang Cape, Thailand, Sediment. Geol., 202, 821–837, 2007.
Huang, Z. H., T. R. Wu, S. K. Tan, K. Megawati, F. Shaw, X. Z. Liu,and T. C. Pan, Tsunami hazard from the subduction Megathrust of theSouth China Sea: Part II. Hydrodynamic modeling and possible impacton Singapore, J. Asian Earth Sci., 36, 93–97, 2009.
Huang, Z. H., Q. Qiu, K. Sieh, K. Megawati, D. H. Natawidjaja, andX. Wang, Numerical simulations of tsunami inundation for the cityof Painan, Indonesia—Effects of coastal vegetations and man-madestructures, in Tsunami Simulation for Impact Assessment, edited by H.L. Koh, P. L.-F. Liu, and S. Y. Teh, 249 pp., Penerbit Universiti SainsMalaysia, Malaysia, 2011.
Imamura, F., I. Yoshida, and A. Moore, Numerical study of the 1771Meiwa tsunami at Ishigaki island, Okinawa and the movement of thetsunami stones, in Proceedings of Coastal Engineering, Japan Societyof Civil Engineers, 48, 346–350, 2001.
Jaffe, B. E. and G. Gelfenbuam, A simple model for calculating tsunamiflow speed from tsunami deposits, Sediment. Geol., 200, 347–361, 2007.
Jimenez, J. A., A. H. Sallenger, and L. Fauver, Sediment transport andbarrier island changes during massive overwash events, in Proceedingsof the 30th International Conference on Coastal Engineering, ASCE,2870–2879, San Diego, USA, 2006
Kato, F., S. Sato, and Y. E. H. Harry, Large-scale experiment on dynamicresponse of sand bed around a cylinder due to tsunami, in Proceedingsof the 27th International Conference on Coastal Engineering, ASCE,1848-1859, Sydney, Australia, 2000.
Kato, F., S. Tonkin, H. Yeh, S. Sato, and K.-I. Torii, The grain-size effectson scour around a cylinder due to tsunami run-up, in Proceedings of theInternational Tsunami Symposium 2001, 905–917, Seattle, Washington,USA, 2001.
Kobayashi, N. and A. R. Lawrence, Cross-shore sediment transport underbreaking solitary waves, J. Geophys. Res. C: Oceans, 109, 2004.
Komar, P. D., Beach Processes and Sedimentation, 429 pp., Prentice-Hall,Inc., Englewood Cliffs, New Jersey, 1976.
Konca, A. O., J. P. Avouac, A. Sladen, A. J. Meltzner, K. Sieh, P. Fang,Z. Li, J. Galetzka, J. Genrich, M. Chlieh, D. H. Natawidjaja, Y. Bock,E. J. Fielding, C. Ji, and D. V. Helmberger, Partial rupture of a lockedpatch of the Sumatra megathrust during the 2007 earthquake sequence,Nature, 456, 631–635, 2008.
Lindemer, C. A., N. G. Plant, J. A. Puleo, D. M. Thompson, and T. V.Wamsley, Numerical simulation of a low-lying barrier island’s morpho-logical response to Hurricane Katrina, Coast. Eng., 57, 985–995, 2010.
Liu, P. L. F., C. Yong-Sik, M. J. Briggs, U. Kanoglu, and C. E. Synolakis,Runup of solitary waves on a circular island, J. Fluid Mech., 302, 259–285, 1995.
Lukkunaprasit, P. and A. Ruangrassamee, Building damage in Thailand inthe 2004 Indian Ocean tsunami and clues for tsunami-resistant design,The IES Journal Part A: Civil & Structural Engineering, 1, 17–30, 2008.
Maheshwari, B. K., M. L. S. M. EERI, and J. P. Narayan, Geotechnicaland Structural Damage in Tamil Nadu, India, from the December 2004Indian Ocean Tsunami, Earthq. Spectr., 22, 475–493, 2006.
Martin, M. E., R. Weiss, J. Bourgeois, T. K. Pinegina, H. Houston, and V.V. Titov, Combining constraints from tsunami modeling and sedimen-tology to untangle the 1969 Ozernoi and 1971 Kamchatskii tsunamis,Geophys. Res. Lett., 35, L01610, 2008.
Matsutomi, H., T. Sakakiyama, S. Nugroho, and M. Matsuyama, Aspectsof inundated flow due to the 2004 Indian Ocean Tsunami, Coast. Eng.J., 48, 167–195, 2006.
McCall, R. T., J. S. M. Van Thiel de Vries, N. G. Plant, A. R. Van Don-geren, J. A. Roelvink, D. M. Thompson, and A. J. H. M. Reniers, Two-dimensional time dependent hurricane overwash and erosion modelingat Santa Rosa Island, Coast. Eng., 57, 668–683, 2010.
McCloskey, J., S. S. Nalbant, and S. Steacy, Indonesian earthquake: earth-quake risk from co-seismic stress, Nature, 434, 291, 2005.
McCloskey, J., A. Antonioli, A. Piatanesi, K. Sieh, S. Steacy, S. Nalbant,M. Cocco, C. Giunchi, J. Huang, and P. Dunlop, Tsunami threat in theIndian Ocean from a future megathrust earthquake west of Sumatra,Earth Planet. Sci. Lett., 265, 61–81, 2008.
Megawati, K., F. Shaw, K. Sieh, Z. H. Huang, T. R. Wu, Y. Lin, S. K.Tan, and T. C. Pan, Tsunami hazard from the subduction megathrust ofthe South China Sea: Part I. Source characterization and the resultingtsunami, J. Asian Earth Sci., 36, 13–20, 2009.
Meilianda, E., C. M. Dohmen-Janssen, B. H. P. Maathuis, S. J. M. H.Hulscher, and J. P. M. Mulder, Short-term morphological responses anddevelopments of Banda Aceh coast, Sumatra Island, Indonesia after thetsunami on 26 December 2004, Mar. Geol., 275, 96–109, 2010.
Moore, A. L., B. G. McAdoo, and A. Ruffman, Landward fining frommultiple sources in a sand sheet deposited by the 1929 Grand Bankstsunami, Newfoundland, Sediment. Geol., 200, 336–346, 2007.
Morton, R. A., J. R. Goff, and S. L. Nichol, Hydrodynamic implicationsof textural trends in sand deposits of the 2004 tsunami in Sri Lanka,Sediment. Geol., 207, 56–64, 2008.
Muhari, A., F. Imamura, D. H. Natawidjaja, S. Diposaptono, H. Latief,J. Post, and F. A. Ismail, Tsunami mitigation efforts with pTA in westSumatra province, Indonesia, J. Earthq. Tsunami, 4, 341–368, 2010.
Nakamura, T., Y. Kuramitsu, and N. Mizutani, Tsunami scour around asquare structure, Coast. Eng. J., 50, 209–246, 2008.
Nalbant, S. S., S. Steacy, K. Sieh, D. Natawidjaja, and J. McCloskey,

816 L. L. LI et al.: TSUNAMI-INDUCED COASTAL CHANGE
Seismology: Earthquake risk on the Sunda trench, Nature, 435, 756–757, 2005.
Narayana, A. C., R. Tatavarti, N. Shinu, and A. Subeer, Tsunami of De-cember 26, 2004 on the southwest coast of India: Post-tsunami geomor-phic and sediment characteristics, Mar. Geol., 242, 155–168, 2007.
Natawidjaja, D. H. and W. Triyoso, The Sumatran fault zone-from sourceto hazard, J. Earthq. Tsunami, 1, 21–47, 2007.
Natawidjaja, D. H., K. Sieh, M. Chlieh, J. Galetzka, B. W. Suwargadi, H.Cheng, R. L. Edwards, J.-P. Avouac, and S. N. Ward, Source parametersof the great Sumatran megathrust earthquakes of 1797 and 1833 inferredfrom coral microatolls, J. Geophys. Res., 111, B06403, 2006.
Natawidjaja, D., K. Sieh, W. Kongko, A. Muhari, G. S. Prasetya, and I.Meilano, Scenario for future megathrust tsunami event in the Sumatransubduction zone, in Proceedings of the Asian Oceania Geo-sciencesSociety (AOGS) Meeting, Singapore, 2009.
Nelson, A. R., H. M. Kelsey, and R. C. Witter, Great earthquakes ofvariable magnitude at the Cascadia subduction zone, Quatern. Res., 65,354–365, 2006.
Okada, Y., Surface deformation due to shear and tensile faults in a half-space, Bull. Seismol. Soc. Am., 75, 1135–1154, 1985.
Ozkan-Haller, H. T. and J. T. Kirby, A Fourier-Chebyshev collocationmethod for the shallow water equations including shoreline runup, Appl.Ocean Res., 19, 21–34, 1997.
Pari, Y., M. V. Ramana Murthy, S. Jaya kumar, B. R. Subramanian, and S.Ramachandran, Morphological changes at Vellar estuary, India-Impactof the December 2004 tsunami, J. Environ. Manag., 89, 45–57, 2008.
Paris, R., F. Lavigne, P. Wassmer, and J. Sartohadi, Coastal sedimentationassociated with the December 26, 2004 tsunami in Lhok Nga, westBanda Aceh (Sumatra, Indonesia), Mar. Geol., 238, 93–106, 2007.
Paris, R., P. Wassmer, J. Sartohadi, F. Lavigne, B. Barthomeuf, E. Des-gages, D. Grancher, P. Baumert, F. Vautier, D. Brunstein, and C. Gomez,Tsunamis as geomorphic crises: Lessons from the December 26, 2004tsunami in Lhok Nga, West Banda Aceh (Sumatra, Indonesia), Geomor-phology, 104, 59–72, 2009.
Paris, R., J. Fournier, E. Poizot, S. Etienne, J. Morin, F. Lavigne, and P.Wassmer, Boulder and fine sediment transport and deposition by the2004 tsunami in Lhok Nga (western Banda Aceh, Sumatra, Indonesia):A coupled offshore-onshore model, Mar. Geol., 268, 43–54, 2010.
Qiu, Q., Z. H. Huang, K. Megawati, K. Sieh, and D. H. Natawidjaja, A sce-nario study of tsunami-induced inundation for Pariaman, West Sumatra,Indonesia, in Proceedings of 5th Annual International Workshop & Ex-pro on Sumatra Tsunami Disaster & Recovery 2010, Banda Aceh, In-donesia, 2010.
Richardson, J. F. and W. N. Zaki, Sedimentation and fluidization, Trans.Inst. Chem. Eng., 32, 35–50, 1954.
Roelvink, D., A. Reniers, A. van Dongeren, J. van Thiel de Vries, R.McCall, and J. Lescinski, Modelling storm impacts on beaches, dunesand barrier islands, Coast. Eng., 56, 1133–1152, 2009.
Shi, S., A. G. Dawson, and D. E. Smith, Coastal sedimentation associatedwith the December 12th, 1992 tsunami in Flores, Indonesia, Pure Appl.Geophys., 144, 525–536, 1995.
Shuto, N., Tsunami intensity and Disasters, Adv. Nat. Technol. Haz. Res.,1, 197–216, 1993.
Sieh, K., The Sunda magathrust-past, present and future, J. Earthq.Tsunami, 1, 1–19, 2007.
Sieh, K., D. H. Natawidjaja, A. J. Meltzner, C. C. Shen, H. Cheng, K. S.Li, B. W. Suwargadi, J. Galetzka, B. Philibosian, and R. L. Edwards,Earthquake supercycles inferred from sea-level changes recorded in thecorals of west Sumatra, Science, 322, 1674–1678, 2008.
Spiske, M., R. Weiss, H. Bahlburg, J. Roskosch, and H. Amijaya, TheTsuSedMod inversion model applied to the deposits of the 2004 Suma-tra and 2006 Java tsunami and implications for estimating flow parame-ters of palaeo-tsunami, Sediment. Geol., 224, 29–37, 2010.
Srinivasalu, S., N. Thangadurai, A. D. Switzer, V. Ram Mohan, and T.Ayyamperumal, Erosion and sedimentation in Kalpakkam (N TamilNadu, India) from the 26th December 2004 tsunami, Mar. Geol., 240,65–75, 2007.
Takahashi, T., N. Shuto, F. Imamura, and D. Asai, Modeling sedimenttransport due to tsunamis with exchange rate between bed load layerand suspended load layer,in Proceedings of the 27th International Con-ference on Coastal Engineering, ASCE, 1508–1519, Sydney, Australia,2000.
Taubenbock, H., N. Goseberg, N. Setiadi, G. Lammel, F. Moder, M.Oczipka, H. Klupfel, R. Wahl, T. Schlurmann, G. Strunz, J. Birkmann,K. Nagel, F. Siegert, F. Lehmann, S. Dech, A. Gress, and R. Klein,“Last-Mile” preparation for a potential disaster—Interdisciplinary ap-proach towards tsunami early warning and an evacuation informationsystem for the coastal city of Padang, Indonesia, Nat. Haz. Earth Syst.Sci., 9, 1509–1528, 2009.
Tobita, M., Crustal deformation of 2007 Southern Sumatra earthquake ob-served by SAR interferometry, in Proceedings of DPRI(Disaster Pre-vention Research Institute) Kyoto Workshop, Kyoto, Japan, 2007.
Tonkin, S., H. Yeh, F. Kato, and S. Sato, Tsunami scour around a cylinder,J. Fluid Mech., 165–192, 2003.
van Rijn, L. C., Principles of Sediment Transport in Rivers, Estuaries andCoastal Seas, 715 pp., Aqua Publications, The Netherlands, 1993.
van Rijn, L. C., Unified view of sediment transport by currents and waves.II: Suspended transport, J. Hydraul. Eng., 133, 668–689, 2007.
Wang, X. and P. L. F. Liu, A numerical investigation of Boumerdes-Zemmouri (Algeria) earthquake and Tsunami, Comput. Model. Eng.Sci., 10, 171–183, 2005.
Wijettunge, J. J., X. Wang, and P. L. F. Liu, India Ocean Tsunami on 26December 2004: Numerical modeling of inundation in three cities onthe south coast of Sri Lanka, J. Earthq. Tsunami, 2(2), 133–155, 2008.
Young, Y. L., H. Xiao, and T. Maddux, Hydro- and morpho-dynamicmodeling of breaking solitary waves over a fine sand beach. Part I:Experimental study, Mar. Geol., 269, 107–118, 2010.
Zachariasen, J., K. Sieh, F. W. Taylor, R. L. Edwards, and W. S. Hantoro,Submergence and uplift associated with the giant 1833 Sumatran sub-duction earthquake: Evidence from coral microatolls, J. Geophys. Res.,104, 895–919, 1999.
L. L. Li, Z. H. Huang (e-mail: [email protected]), Q. Qiu, D. H.Natawidjaja, and K. Sieh