tsunami generation by submarine mass … · tsunami generation by submarine mass failure ... and...
TRANSCRIPT
TSUNAMI GENERATION BY SUBMARINE MASS FAILURE
PART II: CASE STUDIES
By Philip Watts1, Stéphan T. Grilli2, Member, ASCE, David R. Tappin3, Gerard J. Fryer4,
and Loren W. Kroenke4
1Applied Fluids Engineering, Private Mail Box #237, 5710 E. 7th Street, Long Beach, CA
90803.2Prof., Dept. of Oc. Engrg., Univ. of Rhode Island, Narragansett, RI 02882.3Geologist, British Geological Survey, Keyworth, Nottingham, NG12 5GG, UK4Prof., Hawaii Inst. of Geophys. and Planet., Univ. of Hawaii, Honolulu, HI 96822.
ABSTRACT:
We show that initial acceleration is the primary desriptor of center of mass motion during
tsunami generation. We demonstrate that finite underwater landslide width will reduce
characteristic tsunami amplitude. We solve an apparent paradox in slump center of mass
motion whereby the distance traveled is proportional to the shear strength. We demonstrate
that rundown and runup can be scaled with the characteristic tsunami amplitude. Our case
studies of five potential landslide tsunamis show that our scaling and characteristic analyses
can reproduce known tsunami amplitudes. We anticipate that the characteristic tsunami
amplitude is a reasonable representation of maximum runup in a three-dimensional
geometry. We therefore propose the Correspondence Principle as a logical extension of the
case studies presented here.
INTRODUCTION
We developed theoretical equations in Part I of this work that we apply to actual case
studies here. Before we can do so, we further our approximate and order of magnitude
analyses in order to develop a complete range of analytical tools. With these additional
tools, we aim to demonstrate the utility of our techniques rather than to claim their accuracy.
We expect more accurate versions of our analyses and tools to appear as research
progresses. Nevertheless, when we carry out the case studies, we will describe tsunami
features that seem remarkably accurate in those instances when data are available for
comparison. The choice between frictionless, translational slides and cohesive, rotational
slumps requires a local geological context. Because of the considerable differences in
tsunami features of slides and slumps, regional geology controls tsunami features generated
by submarine mass failures (Watts, 2001). We surmise that tsunami source (or geological
event) characterization is the single most important research activity related to landslide
tsunamis. For example, marine cruises have been essential to identify the source of the
1998 Papua New Guinea tsunami as a slump instead of a slide (Tappin et al., 1999, 2001).
Marine geology research appears to afford important tsunami source information (Watts,
2001).
Underwater Landslide Geology
Tsunamis may be generated by coseismic sea floor displacement, submarine mass failure,
volcanic activity, gas hydrate phase change, and oceanic meteor strikes. Submarine mass
failure generation remains one of the least studied of these five mechanisms, in part because
their occurrence is often concealed from view and in part because of the complicated
dynamics involved in failure, center of mass motion, deformation, and tsunami generation
(see Part I). Submarine mass failures pose difficulties for tsunami warning systems as they
often occur on coastal margins near shorelines, can not be predicted as of yet, and may
strike within minutes following a moderate earthquake. Local tsunami amplitude depends
on at least four nondimensional geometric parameters (length, width, thickness, and
inclination) that cannot be easily detected nor accurately predicted. On the other hand,
tsunamis generated by submarine mass failure often cause limited damage outside of some
local impact radius and one far-field azimuth (Plafker et al., 1969; Iwasaki, 1997; Watts et
al., 2000). Submarine mass failures threaten coastal communities and economic activity
throughout the Pacific Basin.
Submarine mass failure or underwater landslide are broad terms that encompasses reef
failure, submarine rock slides, underwater slides, and underwater slumps (Schwab et al.,
1993). There are no clear definitions of these terms: rock may be significantly weathered,
and sediment may be only partially lithified, sands and silts may possess cohesion, and
cohesive muds may contain some sand and silt. These materials are often found to coexist
in stratified layers of varying strength. The spectrum of mass failure materials yields a
spectrum in modes of failure and subsequent behaviors. Likewise, there are often multiple
failure mechanisms acting at once, such as increased pore water pressures combined with
ground acceleration from a nearby earthquake (Hampton et al., 1996). It may be
fundamentally impossible to attribute submarine mass failure to any single mechanism.
Most important, any submerged geological structure can be expected to undergo some
degree of mass failure due to ground motion from a nearby earthquake (Kramer, 1996). As
such, many forms of submarine mass failure can be present at the same time and may even
trigger one another (Bjerrum, 1971; Tappin et al., 1999, 2001). A reasonably strong
earthquake can trigger thousands of landslides, whether subaerial or submarine (Wilson and
Keefer, 1985; Watts, 2001). Given the ubiquity of submarine mass failure, we are indeed
fortunate that most events are not tsunamigenic on account of either small length scales or
deep submergence (Watts and Borrero, 2002).
Tsunamigenic underwater slides and slumps involve the failure of a mass of sediment that
can range in length over more than six orders of magnitude, with larger events typically
occurring less frequently (Prior and Coleman, 1979; Edgers and Karlsrud, 1982; Schwab et
al., 1993). Damaging tsunamis may result from the failure of sediment along steep fjords
banks, near boundaries of submarine canyon systems, at active river deltas, along volcanic
islands or ridges, or at submerged alluvial plains including continental margins (Hampton et
al., 1996). Terzaghi (1956) showed that underwater slides and slumps can often be related
to excess pore water pressures along (at least) the initial failure plane. Prior and Coleman
(1979) attribute excess pore water pressure to low tides, artesian water sources, recent
external loads, rapid sedimentation, seismic ground motions, construction induced
vibrations, volcanic activity, vaporization of gas hydrates, wave action, or any combination of
these or similar factors. Hampton et al. (1996) separate these factors into those that reduce
effective sediment strength and those that increase sediment stress. Sediment failure may
occur spontaneously such as during extremely low tides; or, sediment failure may be
triggered by a deterministic external agent such as ground motion during an earthquake
(Kramer, 1996). The timing of spontaneous slides and slumps may be fundamentally
unpredictable since failure of metastable sediments may precipitate from localized
inhomogeneities of unknown weaknesses. A majority of tsunamigenic underwater slides
and slumps appear to be triggered by nearby earthquakes.
Slide and Slump Similarities
Underwater slide and slump center of mass motions have similar functional forms s/so =
f(t/to), despite very different dynamics, because both represent accelerating bodies
characterized by one length scale so and one time scale to. Equations of motion that contain
one inertial term, one gravitational forcing term, and one retarding term are guaranteed
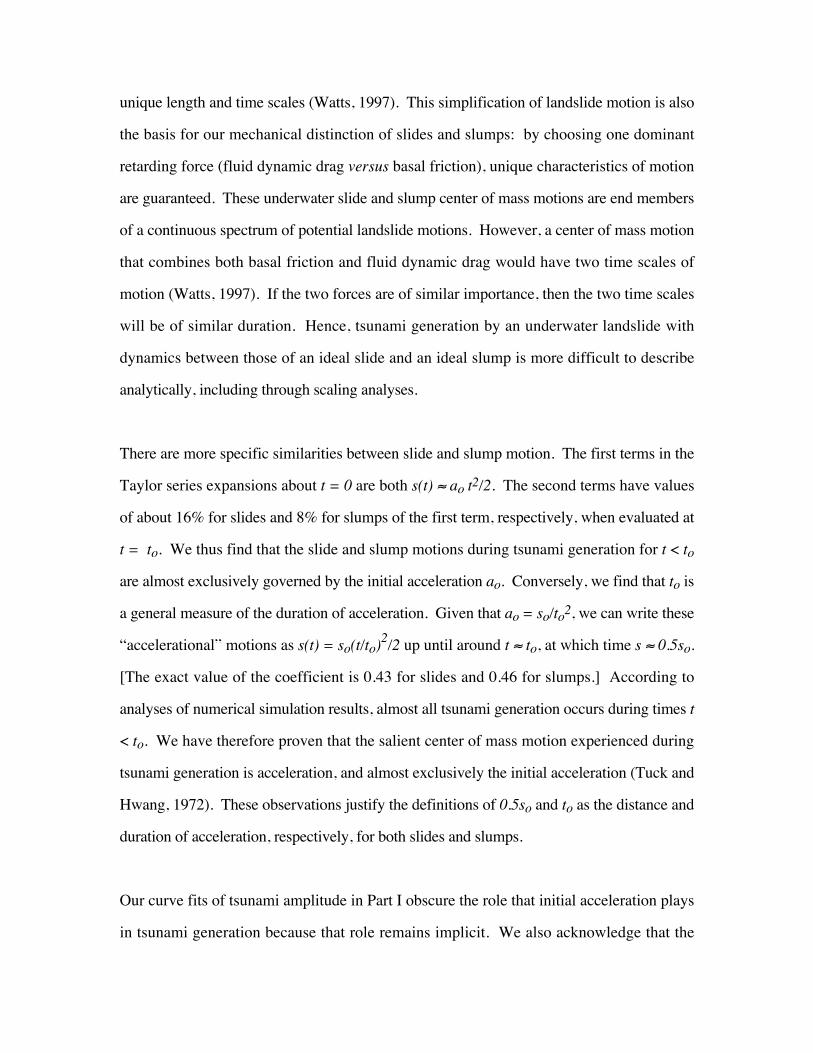
unique length and time scales (Watts, 1997). This simplification of landslide motion is also
the basis for our mechanical distinction of slides and slumps: by choosing one dominant
retarding force (fluid dynamic drag versus basal friction), unique characteristics of motion
are guaranteed. These underwater slide and slump center of mass motions are end members
of a continuous spectrum of potential landslide motions. However, a center of mass motion
that combines both basal friction and fluid dynamic drag would have two time scales of
motion (Watts, 1997). If the two forces are of similar importance, then the two time scales
will be of similar duration. Hence, tsunami generation by an underwater landslide with
dynamics between those of an ideal slide and an ideal slump is more difficult to describe
analytically, including through scaling analyses.
There are more specific similarities between slide and slump motion. The first terms in the
Taylor series expansions about t = 0 are both s(t) ≈ ao t2/2. The second terms have values
of about 16% for slides and 8% for slumps of the first term, respectively, when evaluated at
t = to. We thus find that the slide and slump motions during tsunami generation for t < to
are almost exclusively governed by the initial acceleration ao. Conversely, we find that to is
a general measure of the duration of acceleration. Given that ao = so/to2, we can write these
“accelerational” motions as s(t) = so(t/to)2/2 up until around t ≈ to, at which time s ≈ 0.5so.
[The exact value of the coefficient is 0.43 for slides and 0.46 for slumps.] According to
analyses of numerical simulation results, almost all tsunami generation occurs during times t
< to. We have therefore proven that the salient center of mass motion experienced during
tsunami generation is acceleration, and almost exclusively the initial acceleration (Tuck and
Hwang, 1972). These observations justify the definitions of 0.5so and to as the distance and
duration of acceleration, respectively, for both slides and slumps.
Our curve fits of tsunami amplitude in Part I obscure the role that initial acceleration plays
in tsunami generation because that role remains implicit. We also acknowledge that the
tsunami amplitude curve fits offer a level of detail that may be excessive when an order of
magnitude tsunami amplitude is sought. Therefore, we offer a much simpler alternative to
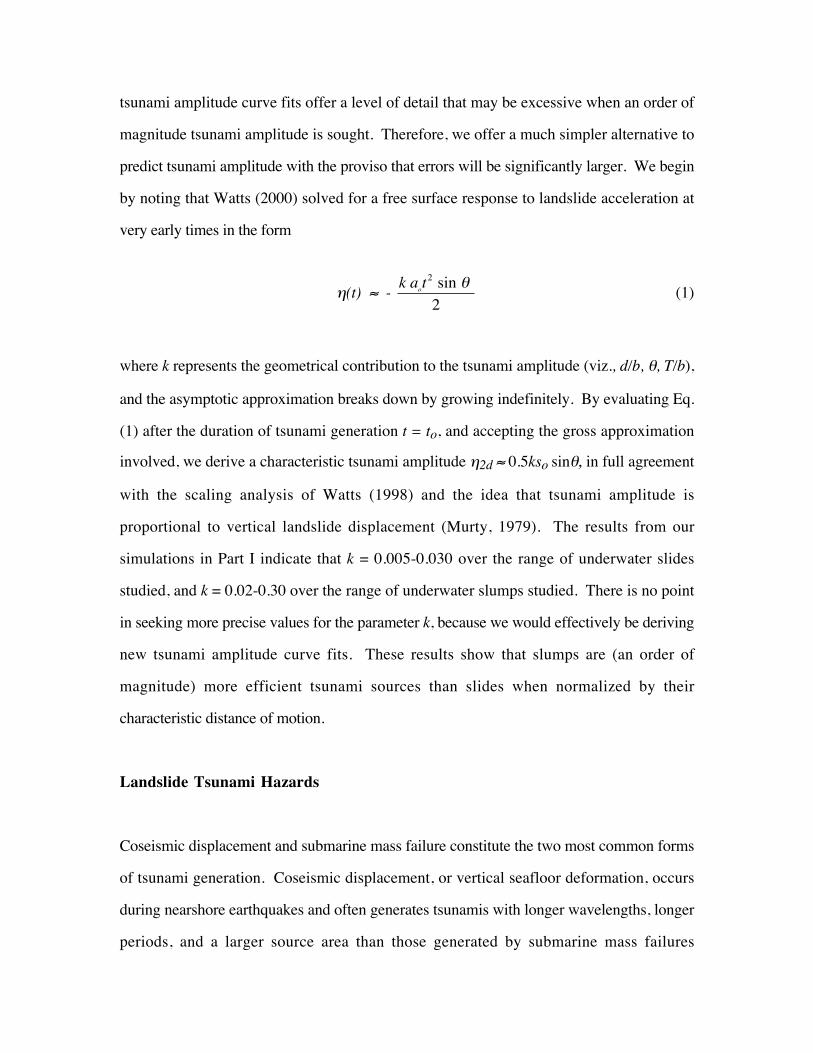
predict tsunami amplitude with the proviso that errors will be significantly larger. We begin
by noting that Watts (2000) solved for a free surface response to landslide acceleration at
very early times in the form
η(t) ≈ - k a t
o sin 2 θ
2(1)
where k represents the geometrical contribution to the tsunami amplitude (viz., d/b, θ, T/b),
and the asymptotic approximation breaks down by growing indefinitely. By evaluating Eq.
(1) after the duration of tsunami generation t = to, and accepting the gross approximation
involved, we derive a characteristic tsunami amplitude η2d ≈ 0.5kso sinθ, in full agreement
with the scaling analysis of Watts (1998) and the idea that tsunami amplitude is
proportional to vertical landslide displacement (Murty, 1979). The results from our
simulations in Part I indicate that k = 0.005-0.030 over the range of underwater slides
studied, and k = 0.02-0.30 over the range of underwater slumps studied. There is no point
in seeking more precise values for the parameter k, because we would effectively be deriving
new tsunami amplitude curve fits. These results show that slumps are (an order of
magnitude) more efficient tsunami sources than slides when normalized by their
characteristic distance of motion.
Landslide Tsunami Hazards
Coseismic displacement and submarine mass failure constitute the two most common forms
of tsunami generation. Coseismic displacement, or vertical seafloor deformation, occurs
during nearshore earthquakes and often generates tsunamis with longer wavelengths, longer
periods, and a larger source area than those generated by submarine mass failures
(Hammack, 1973; Watts, 1998, 2000). Coseismic displacement generates tsunami
amplitudes that correlate with earthquake magnitude (Hammack, 1973; Geist, 1998);
submarine mass failures produce tsunamis with amplitudes limited only by the vertical
extent of center of mass motion (Murty, 1979; Watts, 1998). These differences help
identify the roughly 30% of Pacific Basin tsunamis that involve landslide tsunami
amplitudes greater than the earthquake tsunami amplitude (Watts and Borrero, 2002).
Landslide tsunamis therefore pose one of the greatest tsunami hazards to coastal population
and infrastructure.
PRACTICAL DEVELOPMENTS
In Part I of this work, we developed tsunami amplitude equations that require several
parameters to describe tsunami generation. These parameters are not necessarily commonly
available from current research and they will often not be available prior to or immediately
following an event. We therefore study some of these parameters in more detail with the
hope of finding general scaling relations, or constraints on their expected ranges. During
our analyses, we describe the impact of landslide width on three-dimensional tsunami
generation. We finish this section with an examination of tsunami rundown and runup at
the shoreline immediately behind mass failure.
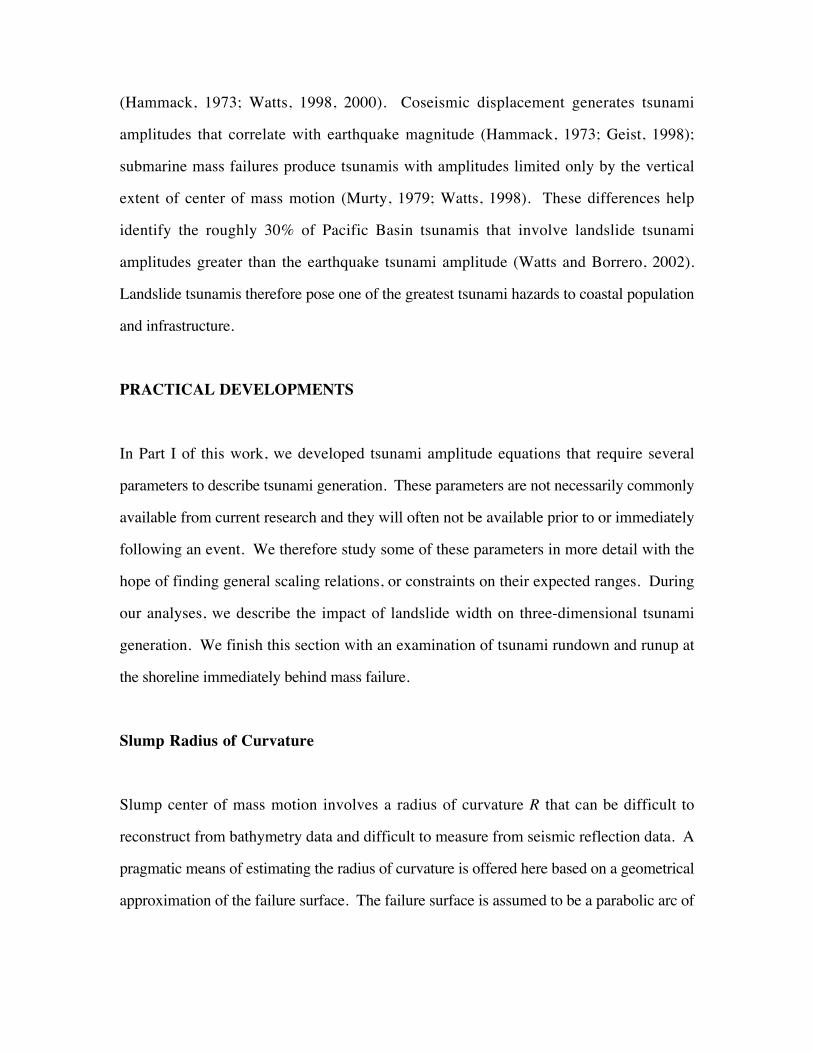
Slump Radius of Curvature
Slump center of mass motion involves a radius of curvature R that can be difficult to
reconstruct from bathymetry data and difficult to measure from seismic reflection data. A
pragmatic means of estimating the radius of curvature is offered here based on a geometrical
approximation of the failure surface. The failure surface is assumed to be a parabolic arc of
linear length b and maximum depth T. Solving analytically for the radius of curvature
yields
R = b2
8 T (2)
where b and T are the same measures of landslide size used to estimate tsunami amplitude.
By using (2), slump geometry is brought one step closer to the simpler geometry of a slide
by writing the radius of curvature R as a function of more basic and observable length
scales.
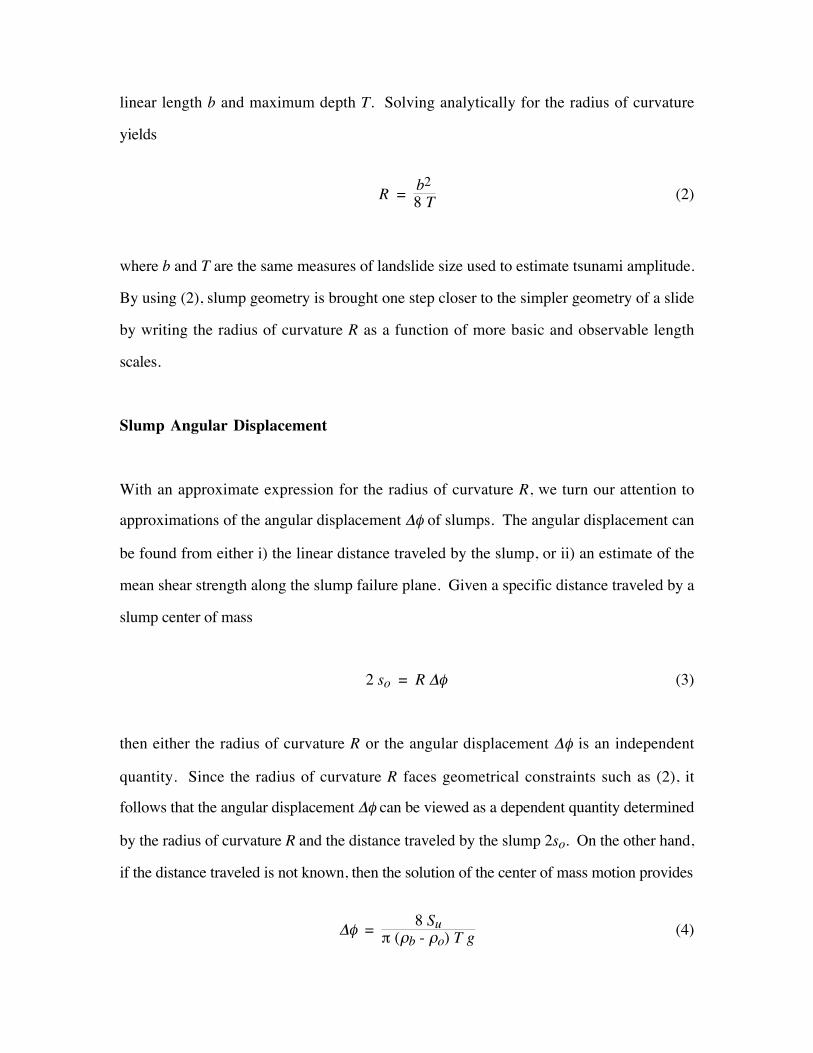
Slump Angular Displacement
With an approximate expression for the radius of curvature R, we turn our attention to
approximations of the angular displacement ∆φ of slumps. The angular displacement can
be found from either i) the linear distance traveled by the slump, or ii) an estimate of the
mean shear strength along the slump failure plane. Given a specific distance traveled by a
slump center of mass
2 so = R ∆φ (3)
then either the radius of curvature R or the angular displacement ∆φ is an independent
quantity. Since the radius of curvature R faces geometrical constraints such as (2), it
follows that the angular displacement ∆φ can be viewed as a dependent quantity determined
by the radius of curvature R and the distance traveled by the slump 2so. On the other hand,
if the distance traveled is not known, then the solution of the center of mass motion provides
∆φ = 8 Su
π (ρb - ρo) T g (4)
which depends on an estimate of the mean shear strength Su. Note that this shear strength
is both a spatial and a temporal average as it covers the entire failure plane during the entire
slump motion. Conversely, if the distance traveled by the center of mass is known, then
Eqs. (3) and (4) can be combined to yield a characteristic shear strength Su along the failure
plane.
It is convenient to seek an approximate shear strength that can be used in conjunction with
Eq. (4). Many normally consolidated marine sediments conform to the shear strength
relation
Su(z) ≈ 0.3 (ρb - ρo) g z (5)
where z is the local depth of the failure plane (Bardet, 1997). Assuming a linearly
increasing shear strength with depth, a parabolic failure plane shape, and a thickness to
length ratio T/b « 1, we find from integration along the arc length that the peak shear
strength is approximately 60% larger than the mean shear strength. Therefore, the mean
shear strength becomes
Su ≈ 0.19 (ρb - ρo) T g (6)
where we have divided Eq. (5) by 1.6 and set z = T to the maximum slump thickness. By
substituting this expression for Su into Eq. (4), the numerator and denominator of (4) both
contain the scale (ρb - ρo) T g. This fact eliminates the paradox mentioned in Part I of this
work that larger shear strengths increase the distance of slump motion as one might
conclude from inspection of only Eq. (4).
When we substitute (6) into (4), we obtain a constant slump angular displacement of ∆φ =
0.48 radians, or about 27˚. Because one can approximate R ≈ b (see below), it then follows
directly from (3) that a typical slump travels roughly 50% of its length. However, Eq. (6)
cannot be used to describe slump motion whenever the slump headwall coincides with a
tectonic control fault. In such cases, failure may be induced by pressurized water within the
fault pushing the sediment apart (Sibson, 1981; Tappin et al., 2001; Martel, 2002). When
this happens, the mean shear strength Su can be expected to be considerably less than the
value indicated by (6) because of the temporary presence of pressurized water along the
failure plane. If (6) were uniformly valid, then all slumps would have the same angular
displacement. Local variations in sediment composition can vary the shear strength
coefficient in (6) by at least a factor of two (Bardet, 1997). However, some underwater
slumps only achieve values around ∆φ = 0.1 radians, or advance 10% of their length (von
Huene et al., 2002). Such motion is unlikely to be explained solely by remolding of
presumably low sensitivity sediment along the failure plane (Bardet, 1997). Other factors,
such as water injection along the failure plane, are assumed to be lowering the apparent
shear strength of the sediment. Therefore, we find that the angular displacement ∆φ is in
fact a measure of the departure of the characteristic shear strength from (6).
Thickness to Length Ratios
Landslide tsunamis can be inferred from nearshore data such as local runup maxima or time
of arrival (Tappin et al., 1999, 2001). Occassionally, underwater cable breaks, hydrophone
records, or eyewitness observations provide direct evidence of mass failure (Bjerrum, 1971;
Murty, 1979; Kulikov, 1996; Caplan-Auerbach, 2001). The tsunami amplitude estimates
developed in Part I require knowledge of landslide dimensions that are not usually available
immediately following an event. A method is required to estimate tsunamigenic potential
before detailed marine surveys can be conducted, and perhaps even to motivate and direct
such surveys. The initial landslide length b and mean depth d are often dictated by
bathymetry and can sometimes be inferred from tsunami period or wavelength information.
We now show that a typical underwater landslide thickness T can be estimated with an
appeal to the geometries of documented underwater slides and slumps. Underwater slides
typically exhibit maximum thickness to initial length ratios T/b of 0.5-2%; in contrast,
underwater slumps often involve deep failure with maximum thickness to initial length ratios
T/b of 5-15% (Prior and Coleman, 1979; Edgers and Karlsrud, 1982; Turner and Schuster,
1996). If a thin slide is a suspected tsunami source, for whatever reason, then a typical
thickness
T ≈ 0.01 b (7)
can be expected. On the other hand, if a cohesive slump is a suspected tsunami source, then
a typical thickness
T ≈ 0.10 b (8)
can be expected. Substituting (8) into (2) yields a typical radius of curvature R ≈ 1.3 b for a
slump. In general, the radius of curvature R can be expected to be 1-2 times the slump
length b. We note that use of either (7) or (8) may introduce errors on the order of 100%
into a tsunami amplitude calculation. At the same time, a choice between (7) or (8) alters the
tsunami amplitude by an order of magnitude, demonstrating significant geometrical
differences between slides and slumps. Schwab et al. (1993) estimate that nearly half of all
mass failures off of the continental United States appear to satisfy translational sliding,
while the other half appear to satisfy rotational slumping. The distinction is best made from
local geological and sedimentary considerations whenever such data is available.
Nevertheless, the observed tsunami features can sometimes provide sufficient distinction to
choose one landslide model over another.
The Effect of Landslide Width
Up until now, tsunami amplitude calculations have been based on the assumption of 2D
mass failures. The 2D criteria may be met by less than half of all tsunamigenic submarine
mass failures and so must be evaluated. For landslides of finite width, tsunami propagation
in the third spatial dimension will reduce the two-dimensional tsunami amplitude. We
follow the analytical developments of Watts et al. (2002a). Let an underwater landslide
have a parabolic transverse profile of width w and maximum thickness T. In the absence of
transverse propagation and with a uniform landslide length, the tsunami width would also be
w and the transverse profile would also be parabolic. The cross-sectional area of displaced
water is readily calculated as 2/3 of the maximum amplitude multiplied by the width.
During the times t < to of wave generation, the tsunami width will increase to approximately
w + λo due to transverse propagation, where λo is the characteristic wavelength. Transverse
propagation will produce a wave form not dissimilar to sech2(3y/(w+λo)) with a maximum
at y = 0 and exponentially decreasing leading edges as y becomes large (Mei, 1983). The
numerical factor of three in the numerator is chosen to reduce the wave amplitude to 1% of
its maximum amplitude at the transverse distance y = w + λo. The reduction in tsunami
amplitude is found from conservation of mass (or cross-sectional area), as in the scaling
work of Hammack (1973) and Watts (1998). We find that the two-dimensional
characteristic tsunami amplitude is reduced by a factor
η3dη2d
= w
(w + λo) (9)
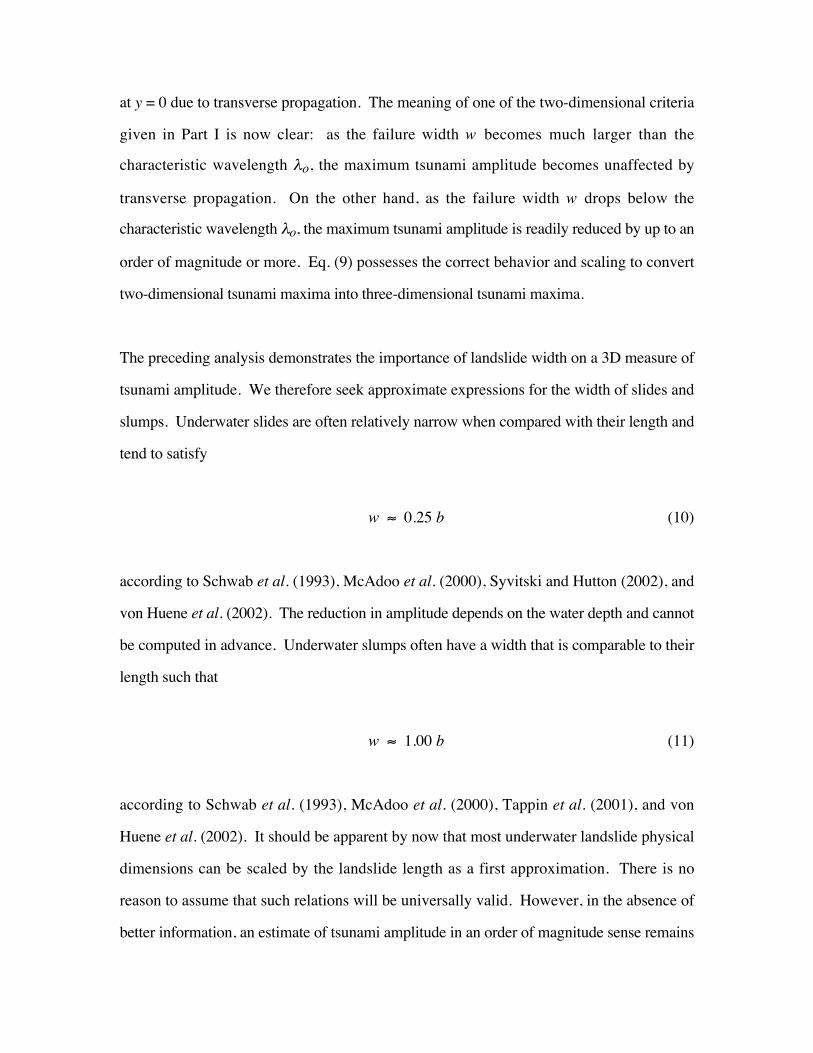
at y = 0 due to transverse propagation. The meaning of one of the two-dimensional criteria
given in Part I is now clear: as the failure width w becomes much larger than the
characteristic wavelength λo, the maximum tsunami amplitude becomes unaffected by
transverse propagation. On the other hand, as the failure width w drops below the
characteristic wavelength λo, the maximum tsunami amplitude is readily reduced by up to an
order of magnitude or more. Eq. (9) possesses the correct behavior and scaling to convert
two-dimensional tsunami maxima into three-dimensional tsunami maxima.
The preceding analysis demonstrates the importance of landslide width on a 3D measure of
tsunami amplitude. We therefore seek approximate expressions for the width of slides and
slumps. Underwater slides are often relatively narrow when compared with their length and
tend to satisfy
w ≈ 0.25 b (10)
according to Schwab et al. (1993), McAdoo et al. (2000), Syvitski and Hutton (2002), and
von Huene et al. (2002). The reduction in amplitude depends on the water depth and cannot
be computed in advance. Underwater slumps often have a width that is comparable to their
length such that
w ≈ 1.00 b (11)
according to Schwab et al. (1993), McAdoo et al. (2000), Tappin et al. (2001), and von
Huene et al. (2002). It should be apparent by now that most underwater landslide physical
dimensions can be scaled by the landslide length as a first approximation. There is no
reason to assume that such relations will be universally valid. However, in the absence of
better information, an estimate of tsunami amplitude in an order of magnitude sense remains
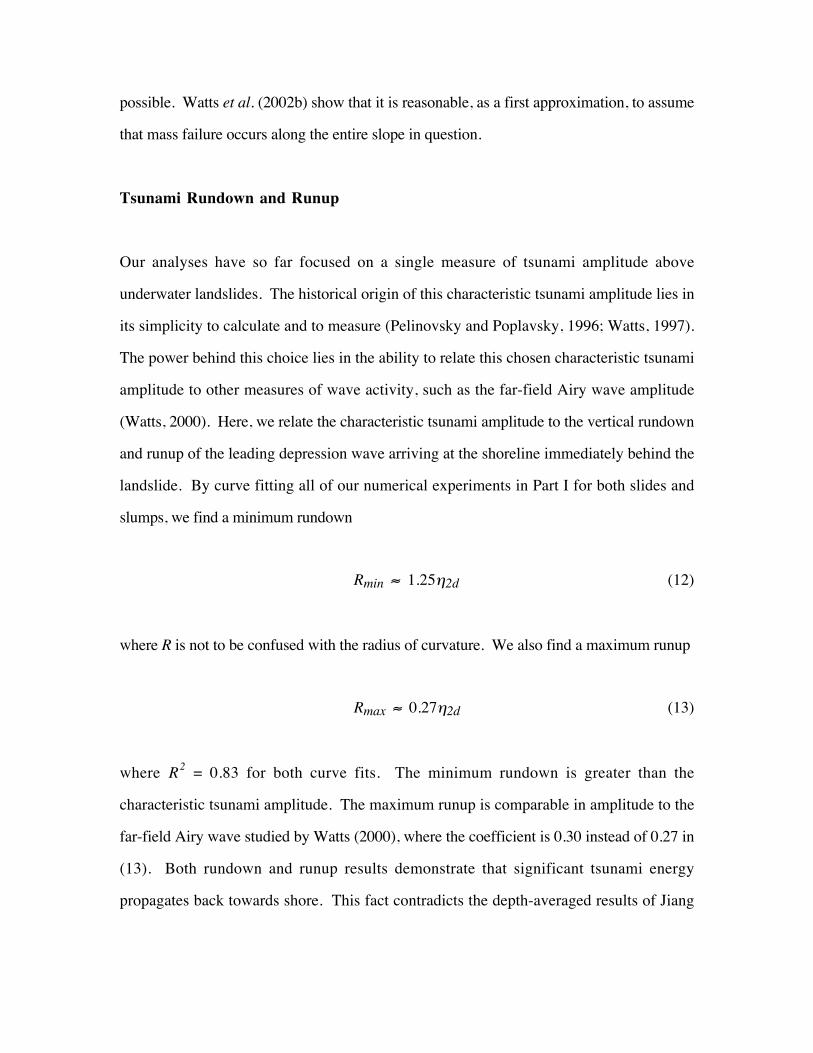
possible. Watts et al. (2002b) show that it is reasonable, as a first approximation, to assume
that mass failure occurs along the entire slope in question.
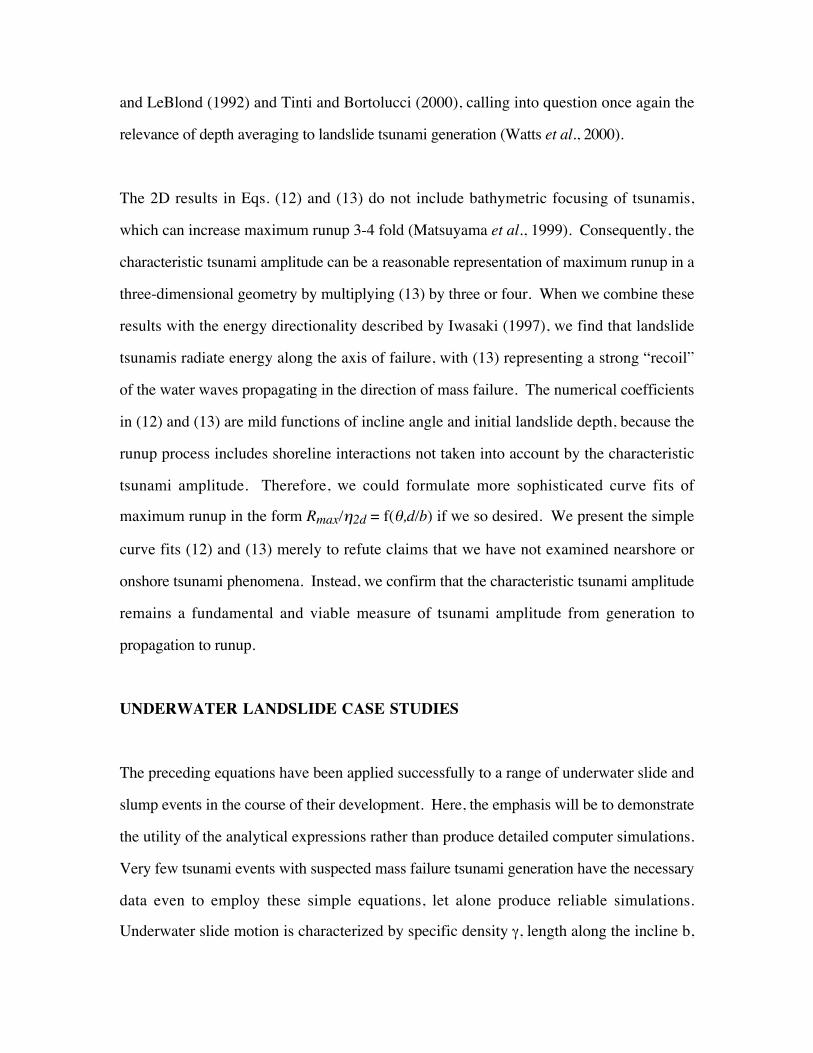
Tsunami Rundown and Runup
Our analyses have so far focused on a single measure of tsunami amplitude above
underwater landslides. The historical origin of this characteristic tsunami amplitude lies in
its simplicity to calculate and to measure (Pelinovsky and Poplavsky, 1996; Watts, 1997).
The power behind this choice lies in the ability to relate this chosen characteristic tsunami
amplitude to other measures of wave activity, such as the far-field Airy wave amplitude
(Watts, 2000). Here, we relate the characteristic tsunami amplitude to the vertical rundown
and runup of the leading depression wave arriving at the shoreline immediately behind the
landslide. By curve fitting all of our numerical experiments in Part I for both slides and
slumps, we find a minimum rundown
Rmin ≈ 1.25η2d (12)
where R is not to be confused with the radius of curvature. We also find a maximum runup
Rmax ≈ 0.27η2d (13)
where R2 = 0.83 for both curve fits. The minimum rundown is greater than the
characteristic tsunami amplitude. The maximum runup is comparable in amplitude to the
far-field Airy wave studied by Watts (2000), where the coefficient is 0.30 instead of 0.27 in
(13). Both rundown and runup results demonstrate that significant tsunami energy
propagates back towards shore. This fact contradicts the depth-averaged results of Jiang
and LeBlond (1992) and Tinti and Bortolucci (2000), calling into question once again the
relevance of depth averaging to landslide tsunami generation (Watts et al., 2000).
The 2D results in Eqs. (12) and (13) do not include bathymetric focusing of tsunamis,
which can increase maximum runup 3-4 fold (Matsuyama et al., 1999). Consequently, the
characteristic tsunami amplitude can be a reasonable representation of maximum runup in a
three-dimensional geometry by multiplying (13) by three or four. When we combine these
results with the energy directionality described by Iwasaki (1997), we find that landslide
tsunamis radiate energy along the axis of failure, with (13) representing a strong “recoil”
of the water waves propagating in the direction of mass failure. The numerical coefficients
in (12) and (13) are mild functions of incline angle and initial landslide depth, because the
runup process includes shoreline interactions not taken into account by the characteristic
tsunami amplitude. Therefore, we could formulate more sophisticated curve fits of
maximum runup in the form Rmax/η2d = f(θ,d/b) if we so desired. We present the simple
curve fits (12) and (13) merely to refute claims that we have not examined nearshore or
onshore tsunami phenomena. Instead, we confirm that the characteristic tsunami amplitude
remains a fundamental and viable measure of tsunami amplitude from generation to
propagation to runup.
UNDERWATER LANDSLIDE CASE STUDIES
The preceding equations have been applied successfully to a range of underwater slide and
slump events in the course of their development. Here, the emphasis will be to demonstrate
the utility of the analytical expressions rather than produce detailed computer simulations.
Very few tsunami events with suspected mass failure tsunami generation have the necessary
data even to employ these simple equations, let alone produce reliable simulations.
Underwater slide motion is characterized by specific density γ, length along the incline b,
and incline angle θ. These quantities can be estimated from bathymetry data acquired
during a marine survey of suspected tsunami sources. Underwater slumps require a radius
of curvature R, slump thickness T, and shear strength Su to describe motion. These
quantities require more sophisticated seismic reflection and core sampling tools. In either
case, marine surveys conducted by experienced geologists are essential for understanding
tsunamis generated by mass failure (e.g., Tappin et al., 1999, 2001). Case studies are
presented more or less in order of increasing uncertainty and speculation.
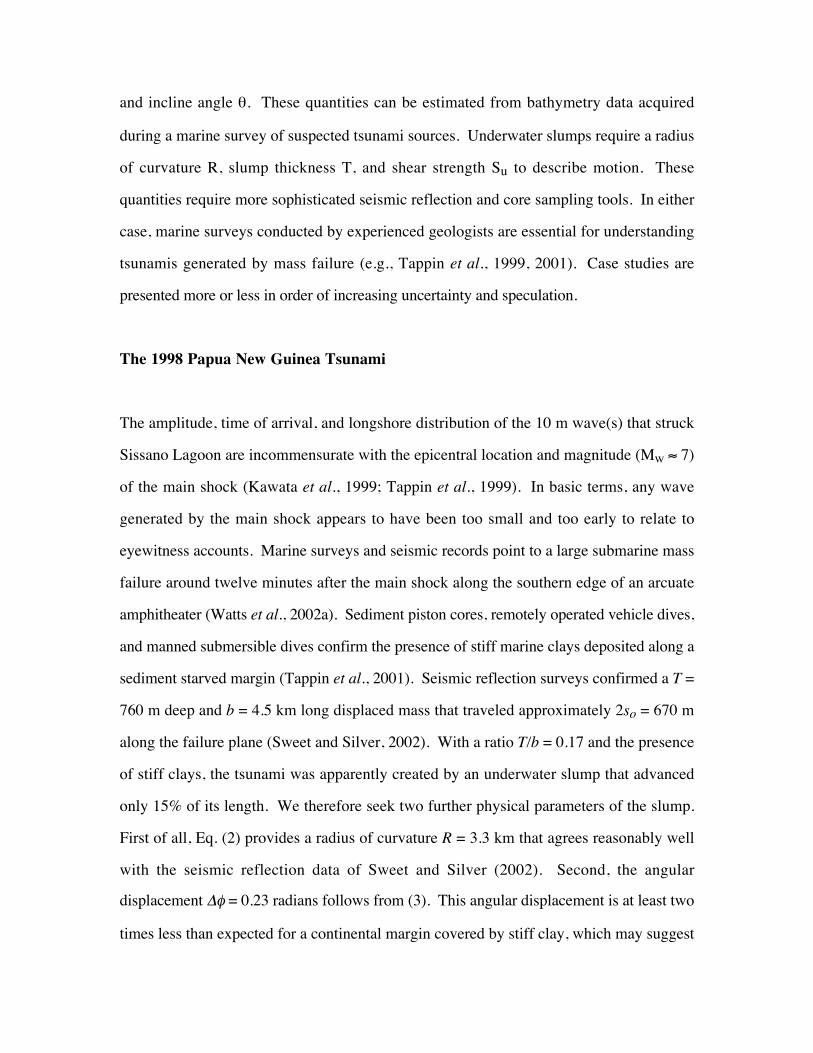
The 1998 Papua New Guinea Tsunami
The amplitude, time of arrival, and longshore distribution of the 10 m wave(s) that struck
Sissano Lagoon are incommensurate with the epicentral location and magnitude (Mw ≈ 7)
of the main shock (Kawata et al., 1999; Tappin et al., 1999). In basic terms, any wave
generated by the main shock appears to have been too small and too early to relate to
eyewitness accounts. Marine surveys and seismic records point to a large submarine mass
failure around twelve minutes after the main shock along the southern edge of an arcuate
amphitheater (Watts et al., 2002a). Sediment piston cores, remotely operated vehicle dives,
and manned submersible dives confirm the presence of stiff marine clays deposited along a
sediment starved margin (Tappin et al., 2001). Seismic reflection surveys confirmed a T =
760 m deep and b = 4.5 km long displaced mass that traveled approximately 2so = 670 m
along the failure plane (Sweet and Silver, 2002). With a ratio T/b = 0.17 and the presence
of stiff clays, the tsunami was apparently created by an underwater slump that advanced
only 15% of its length. We therefore seek two further physical parameters of the slump.
First of all, Eq. (2) provides a radius of curvature R = 3.3 km that agrees reasonably well
with the seismic reflection data of Sweet and Silver (2002). Second, the angular
displacement ∆φ = 0.23 radians follows from (3). This angular displacement is at least two
times less than expected for a continental margin covered by stiff clay, which may suggest
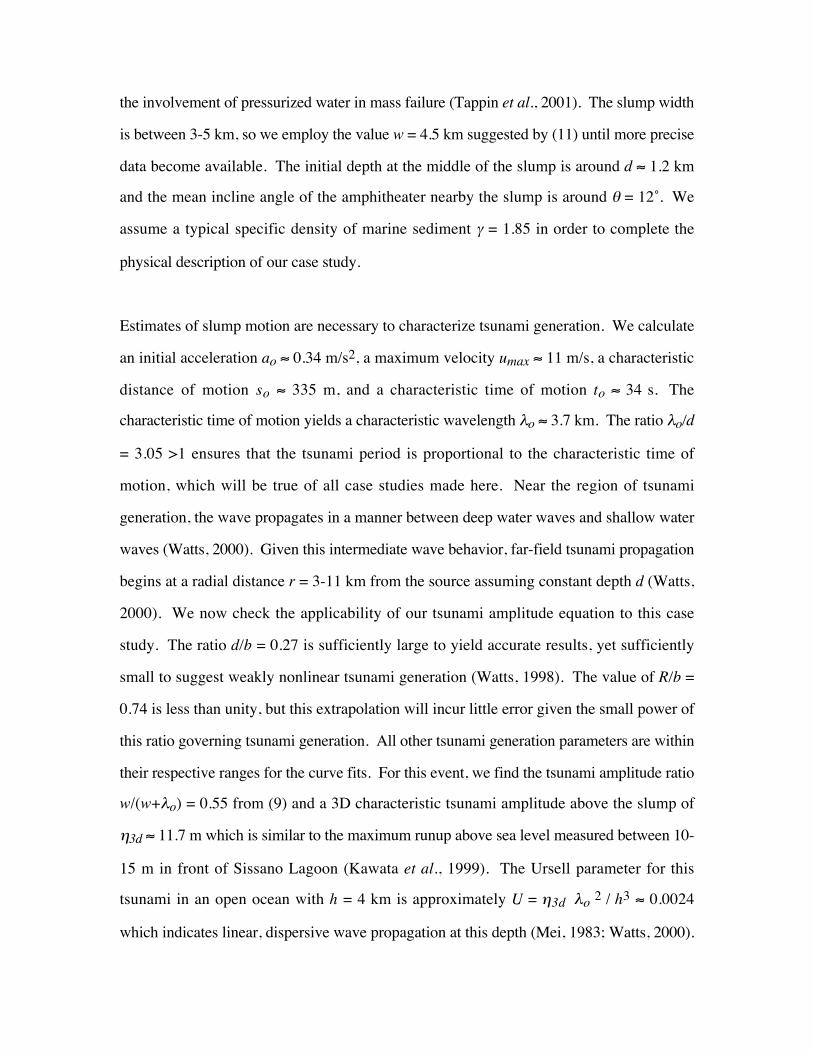
the involvement of pressurized water in mass failure (Tappin et al., 2001). The slump width
is between 3-5 km, so we employ the value w = 4.5 km suggested by (11) until more precise
data become available. The initial depth at the middle of the slump is around d ≈ 1.2 km
and the mean incline angle of the amphitheater nearby the slump is around θ = 12˚. We
assume a typical specific density of marine sediment γ = 1.85 in order to complete the
physical description of our case study.
Estimates of slump motion are necessary to characterize tsunami generation. We calculate
an initial acceleration ao ≈ 0.34 m/s2, a maximum velocity umax ≈ 11 m/s, a characteristic
distance of motion so ≈ 335 m, and a characteristic time of motion to ≈ 34 s. The
characteristic time of motion yields a characteristic wavelength λo ≈ 3.7 km. The ratio λo/d
= 3.05 >1 ensures that the tsunami period is proportional to the characteristic time of
motion, which will be true of all case studies made here. Near the region of tsunami
generation, the wave propagates in a manner between deep water waves and shallow water
waves (Watts, 2000). Given this intermediate wave behavior, far-field tsunami propagation
begins at a radial distance r = 3-11 km from the source assuming constant depth d (Watts,
2000). We now check the applicability of our tsunami amplitude equation to this case
study. The ratio d/b = 0.27 is sufficiently large to yield accurate results, yet sufficiently
small to suggest weakly nonlinear tsunami generation (Watts, 1998). The value of R/b =
0.74 is less than unity, but this extrapolation will incur little error given the small power of
this ratio governing tsunami generation. All other tsunami generation parameters are within
their respective ranges for the curve fits. For this event, we find the tsunami amplitude ratio
w/(w+λo) = 0.55 from (9) and a 3D characteristic tsunami amplitude above the slump of
η3d ≈ 11.7 m which is similar to the maximum runup above sea level measured between 10-
15 m in front of Sissano Lagoon (Kawata et al., 1999). The Ursell parameter for this
tsunami in an open ocean with h = 4 km is approximately U = η3d λo 2 / h3 ≈ 0.0024
which indicates linear, dispersive wave propagation at this depth (Mei, 1983; Watts, 2000).
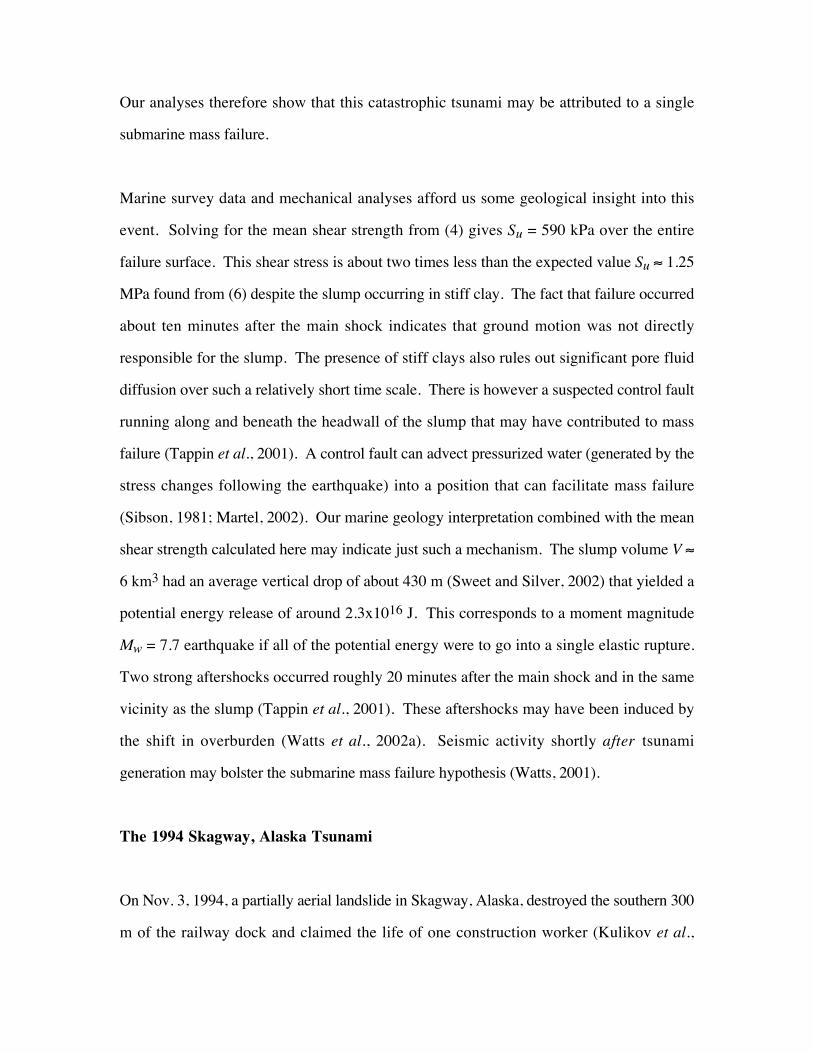
Our analyses therefore show that this catastrophic tsunami may be attributed to a single
submarine mass failure.
Marine survey data and mechanical analyses afford us some geological insight into this
event. Solving for the mean shear strength from (4) gives Su = 590 kPa over the entire
failure surface. This shear stress is about two times less than the expected value Su ≈ 1.25
MPa found from (6) despite the slump occurring in stiff clay. The fact that failure occurred
about ten minutes after the main shock indicates that ground motion was not directly
responsible for the slump. The presence of stiff clays also rules out significant pore fluid
diffusion over such a relatively short time scale. There is however a suspected control fault
running along and beneath the headwall of the slump that may have contributed to mass
failure (Tappin et al., 2001). A control fault can advect pressurized water (generated by the
stress changes following the earthquake) into a position that can facilitate mass failure
(Sibson, 1981; Martel, 2002). Our marine geology interpretation combined with the mean
shear strength calculated here may indicate just such a mechanism. The slump volume V ≈
6 km3 had an average vertical drop of about 430 m (Sweet and Silver, 2002) that yielded a
potential energy release of around 2.3x10¹⁶ J. This corresponds to a moment magnitude
Mw = 7.7 earthquake if all of the potential energy were to go into a single elastic rupture.
Two strong aftershocks occurred roughly 20 minutes after the main shock and in the same
vicinity as the slump (Tappin et al., 2001). These aftershocks may have been induced by
the shift in overburden (Watts et al., 2002a). Seismic activity shortly after tsunami
generation may bolster the submarine mass failure hypothesis (Watts, 2001).
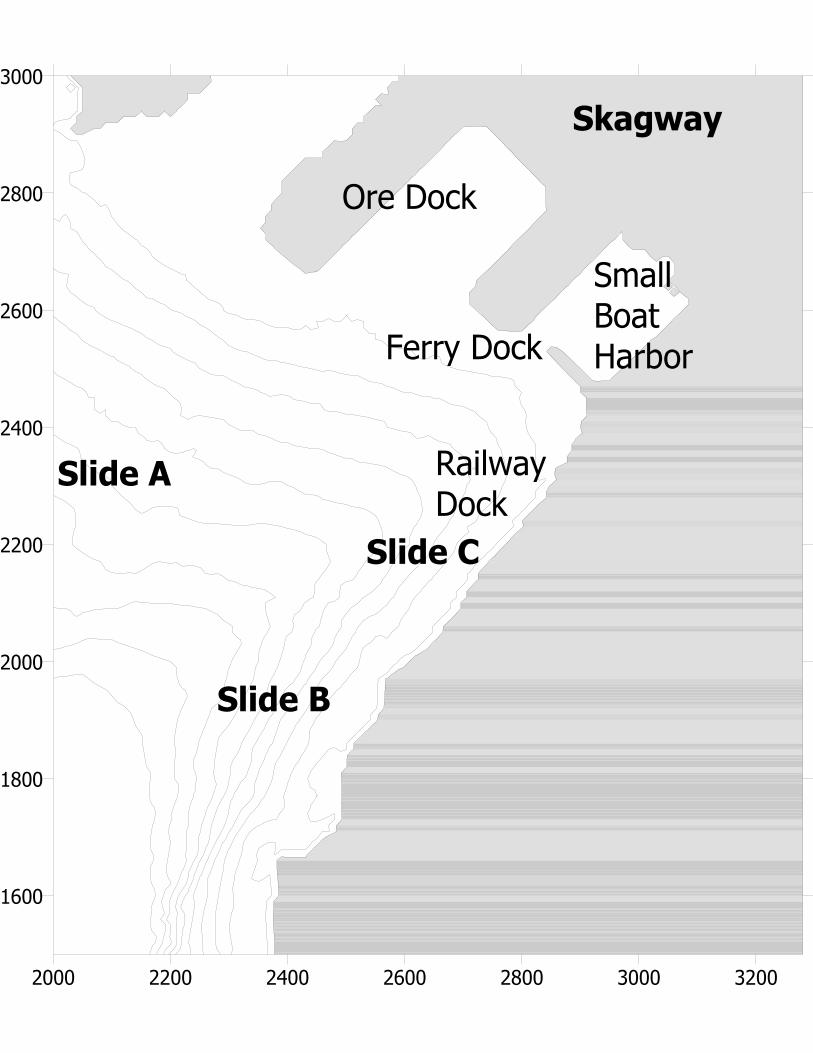
The 1994 Skagway, Alaska Tsunami
On Nov. 3, 1994, a partially aerial landslide in Skagway, Alaska, destroyed the southern 300
m of the railway dock and claimed the life of one construction worker (Kulikov et al.,
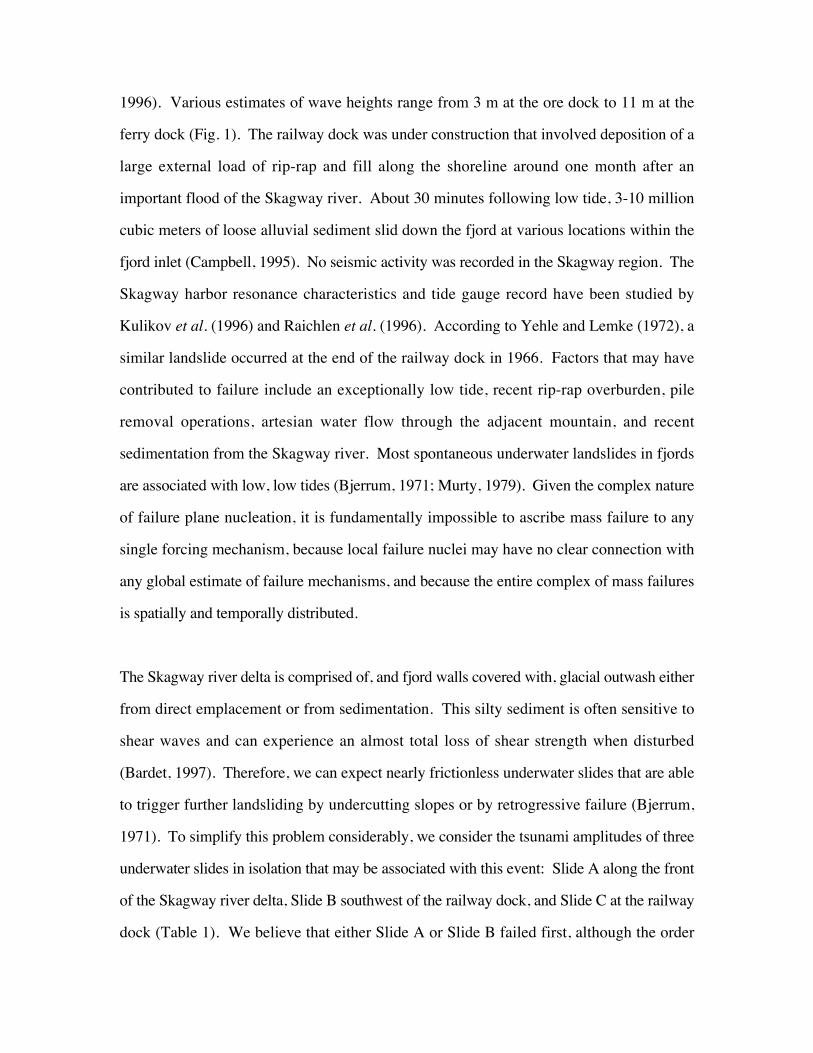
1996). Various estimates of wave heights range from 3 m at the ore dock to 11 m at the
ferry dock (Fig. 1). The railway dock was under construction that involved deposition of a
large external load of rip-rap and fill along the shoreline around one month after an
important flood of the Skagway river. About 30 minutes following low tide, 3-10 million
cubic meters of loose alluvial sediment slid down the fjord at various locations within the
fjord inlet (Campbell, 1995). No seismic activity was recorded in the Skagway region. The
Skagway harbor resonance characteristics and tide gauge record have been studied by
Kulikov et al. (1996) and Raichlen et al. (1996). According to Yehle and Lemke (1972), a
similar landslide occurred at the end of the railway dock in 1966. Factors that may have
contributed to failure include an exceptionally low tide, recent rip-rap overburden, pile
removal operations, artesian water flow through the adjacent mountain, and recent
sedimentation from the Skagway river. Most spontaneous underwater landslides in fjords
are associated with low, low tides (Bjerrum, 1971; Murty, 1979). Given the complex nature
of failure plane nucleation, it is fundamentally impossible to ascribe mass failure to any
single forcing mechanism, because local failure nuclei may have no clear connection with
any global estimate of failure mechanisms, and because the entire complex of mass failures
is spatially and temporally distributed.
The Skagway river delta is comprised of, and fjord walls covered with, glacial outwash either
from direct emplacement or from sedimentation. This silty sediment is often sensitive to
shear waves and can experience an almost total loss of shear strength when disturbed
(Bardet, 1997). Therefore, we can expect nearly frictionless underwater slides that are able
to trigger further landsliding by undercutting slopes or by retrogressive failure (Bjerrum,
1971). To simplify this problem considerably, we consider the tsunami amplitudes of three
underwater slides in isolation that may be associated with this event: Slide A along the front
of the Skagway river delta, Slide B southwest of the railway dock, and Slide C at the railway
dock (Table 1). We believe that either Slide A or Slide B failed first, although the order
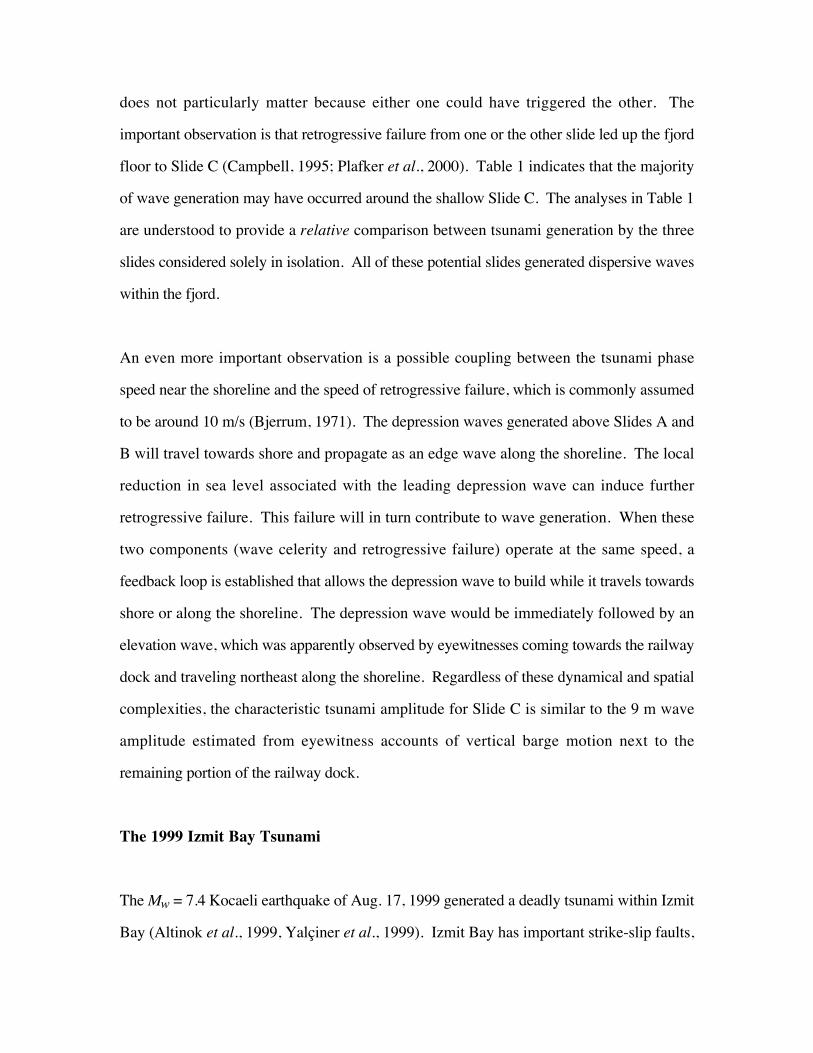
does not particularly matter because either one could have triggered the other. The
important observation is that retrogressive failure from one or the other slide led up the fjord
floor to Slide C (Campbell, 1995; Plafker et al., 2000). Table 1 indicates that the majority
of wave generation may have occurred around the shallow Slide C. The analyses in Table 1
are understood to provide a relative comparison between tsunami generation by the three
slides considered solely in isolation. All of these potential slides generated dispersive waves
within the fjord.
An even more important observation is a possible coupling between the tsunami phase
speed near the shoreline and the speed of retrogressive failure, which is commonly assumed
to be around 10 m/s (Bjerrum, 1971). The depression waves generated above Slides A and
B will travel towards shore and propagate as an edge wave along the shoreline. The local
reduction in sea level associated with the leading depression wave can induce further
retrogressive failure. This failure will in turn contribute to wave generation. When these
two components (wave celerity and retrogressive failure) operate at the same speed, a
feedback loop is established that allows the depression wave to build while it travels towards
shore or along the shoreline. The depression wave would be immediately followed by an
elevation wave, which was apparently observed by eyewitnesses coming towards the railway
dock and traveling northeast along the shoreline. Regardless of these dynamical and spatial
complexities, the characteristic tsunami amplitude for Slide C is similar to the 9 m wave
amplitude estimated from eyewitness accounts of vertical barge motion next to the
remaining portion of the railway dock.
The 1999 Izmit Bay Tsunami
The Mw = 7.4 Kocaeli earthquake of Aug. 17, 1999 generated a deadly tsunami within Izmit
Bay (Altinok et al., 1999, Yalçiner et al., 1999). Izmit Bay has important strike-slip faults,
part of the North Anatolian Fault Zone, more or less parallel to the northern and southern
shorelines (Altinok et al., 1999). Each one of the interconnected basins constituting Izmit
Bay has apparently formed by local subsidence, as could be expected from bathymetry
alone. It is well known that subsidence naturally occurs near the end of strike-slip faults,
and the vertical coseismic displacement can be compounded at step-overs where slip ends
along one fault and resumes along a nearby parallel fault. Localized subsidence at step-
overs can also form secondary normal faults to accommodate vertical displacement near the
deepest part of a basin (e.g., Altinok et al., 1999). We interpret the published seismic lines
traversing Izmit Bay as supporting our description of subsidence (e.g., Yalçiner et al.,
1999). There are therefore several different sources of potential tsunami generation within
Izmit Bay: a subsiding block bounded by normal faults near the middle of a basin, and
strike-slip faults that can serve as control faults for submarine mass failure near the northern
and southern shorelines (Watts, 2001). Given the magnitude of the main shock, we believe
that it is reasonable to expect all of these tsunami generation mechanisms to be present at
the same time. Eyewitness observations of tsunami activity appear to validate this
conjecture.
Yalçiner et al. (1999) report on observed leading depression waves along the northern and
southern shores of Izmit Bay that were experienced almost immediately after the main
shock. According to our geological interpretation, this tsunami activity suggests submarine
mass failure near both shorelines. A second wave of tsunami attack is reported by Yalçiner
et al. (1999) around five minutes after the main shock which we attribute to subsidence at
the presumed step-over. We believe that shoreline subsidence reported at the town of
Degirmendere may in fact be direct evidence of an underwater slump. A strike-slip control
fault runs along the shoreline of the town of Degirmendere (Altinok et al., 1999), where
significant parts of the waterfront subsided up to 20 m and experienced immediate tsunami
attack of at least 2.5 m above sea level (Yalçiner et al., 1999). Our conjecture is supported
by the captain of a fishing vessel who reported his boat being lifted at least 10 m while
riding the crest of the tsunami almost immediately after the main shock (Yalçiner et al.,
1999). Armed with this geological and observational information, we examine the
possibility that the waterfront at Degirmendere experienced an underwater slump that
generated a local tsunami. We adopt a common rule of thumb and assume that slumping
extends from the headwall near the shoreline down to the toe of the slope (Turner and
Schuster, 1996; Bardet, 1997).
From bathymetry data for Izmit Bay, we find a slope length b = 5 km, a mean slope θ = 5˚,
and a mean initial submergence d = 0.5 b sinθ = 218 m off Degirmendere. We now invoke
Eqs. (8) and (11) to estimate a slump thickness T ≈ 500 m and a slump width w ≈ 5 km,
where only part of the assumed slump headwall is exposed along the waterfront. Vertical
subsidence of 20 m suggests a distance of slump motion of approximately 2so ≈ 230 m
from the sine of slope inclination. With a radius of curvature R ≈ 6.3 km estimated from
(2), we calculate a rotational displacement of ∆φ ≈ 0.036 radians from (3). The small
angular displacement may be indicative of strong ground motion near the epicenter of the
earthquake forcing slump motion, rather than weak sediment or pressurized water. We
assume a specific density of γ = 1.85 and obtain an initial acceleration ao ≈ 0.053 m/s2, a
maximum velocity umax ≈ 2.4 m/s, a characteristic distance of motion so ≈ 115 m, and a
characteristic time of motion to ≈ 47 s. This characteristic time of motion corresponds
roughly to the duration of sea withdrawal immediately following the earthquake (Altinok et
al., 1999). The characteristic wavelength is λo ≈ 2.2 km and leads to a 3D amplitude factor
of 0.69. The characteristic tsunami amplitude above the slump is η3d ≈ 8.2 m, where the
ratio d/b = 0.044 < 0.06 demonstrates that the tsunami amplitude calculation requires
extrapolation. We note that there is significant potential error in most of the independent
parameters given here and that this characteristic tsunami amplitude should be interpreted
only in an order of magnitude sense. While much better characterization of any potential
slump is needed to refine the calculations made here, we have shown that the slump
hypothesis is consistent with the available observations.
The 1946 Unimak, Alaska Tsunami
The April 1, 1946 Alaskan tsunami remains an enigma for several important reasons. First,
the earthquake source mechanism has undergone many revisions over time that have tended
to increase the main shock magnitude from around M ≈ 7 to M ≈ 8 (Johnson and Satake,
1997). These revisions may have been made to help explain the devastating transoceanic
tsunami that results from the event, assuming an earthquake source. Second, Mader and
Curtis (1991) needed vertical coseismic displacement of 20 m to explain the large runups in
Hawaii. This magnitude of displacement is difficult to reconcile with current marine
geology interpretations and typical seismological parameters. Third, the earthquake
magnitude versus maximum runup produces the largest disparity of any tsunami during the
20th century, larger than even the 1998 Papua New Guinea catastrophe, which suggests an
underwater landslide source (Fryer et al., 2002). Fourth, despite the large local and
transoceanic tsunami damage, there is a very rapid drop in tsunami amplitude away from a
Great Circle axis connecting Unimak Island to the Marquesas Islands and onward to
Antarctica (Fryer et al., 2002). A large earthquake can produce far-field wave energy
directivity, but only an underwater landslide can produce both near-field and far-field wave
energy directivity (Iwasaki, 1997; Watts, 2001). Fifth, an apparent underwater landslide
scar exists in the suspected region of tsunami generation (Fryer et al., 2002). We show that
many of these tsunami features can be explained by our order of magnitude analyses.
The starting point in our analysis is the measured tsunami period of 15 minutes, which
should be indicative of a massive earthquake in the 6 km deep waters of the Aleutian
Trench. Because the earthquake was in fact relatively weak, we use this tsunami period to
invert for either a slide length b ≈ 40 km (given a mean incline of θ = 4.3˚), or a slump
radius of curvature R ≈ 2347 km, both assuming a specific density of γ = 1.85. Clearly, the
underwater slide hypothesis is the more reasonable of these two end members. This
conjecture agrees with the key geological fact that much of the continental shelf should be
covered by glacial till that fails as long slides along weak layers (Syvitski and Hutton,
2002). We estimate a slide thickness T ≈ 400 m from (7) that is consistent with
bathymetric and backscatter data (Fryer et al., 2002). This same data suggests a slide width
w ≈ 25 km. We calculate an initial acceleration ao ≈ 0.22 m/s2, a terminal velocity ut ≈ 199
m/s, and a characteristic distance of motion so ≈ 179 km. Watts et al. (2002b) showed that
most underwater slides only reach a maximum velocity of 0.43ut at the bottom of a slope,
which yields umax ≈ 86 m/s in this case, well within the range of expected slide velocities
(Kuenen, 1952). Assuming that the headwall intersects the continental shelf at h = 100 m
(Fryer et al., 2002), we find a mean initial depth d = 1.6 km for the slide. The characteristic
wavelength is λo ≈ 113 km and leads to a 3D amplitude factor of 0.18. This tsunami would
propagate as shallow water waves across the Pacific Basin. The characteristic tsunami
amplitude above the slide is η3d ≈ 32 m where the ratio d/b = 0.04 < 0.06 involves some
tsunami amplitude extrapolation. Once again, we find that the characteristic tsunami
amplitude agrees with the necessary runup above sea level to account for lighthouse
destruction at Scotch Cap, which is more or less in line with the axis of failure. The
characteristic tsunami wavelength on the shelf is λo h / d ≈ 28 km which gives rise to an
Ursell parameter U ≈ 25,000 that indicates nonlinear, shallow water waves. We therefore
hypothesize that Scotch Cap lighthouse may have been attacked by a bore traversing the
continental shelf.
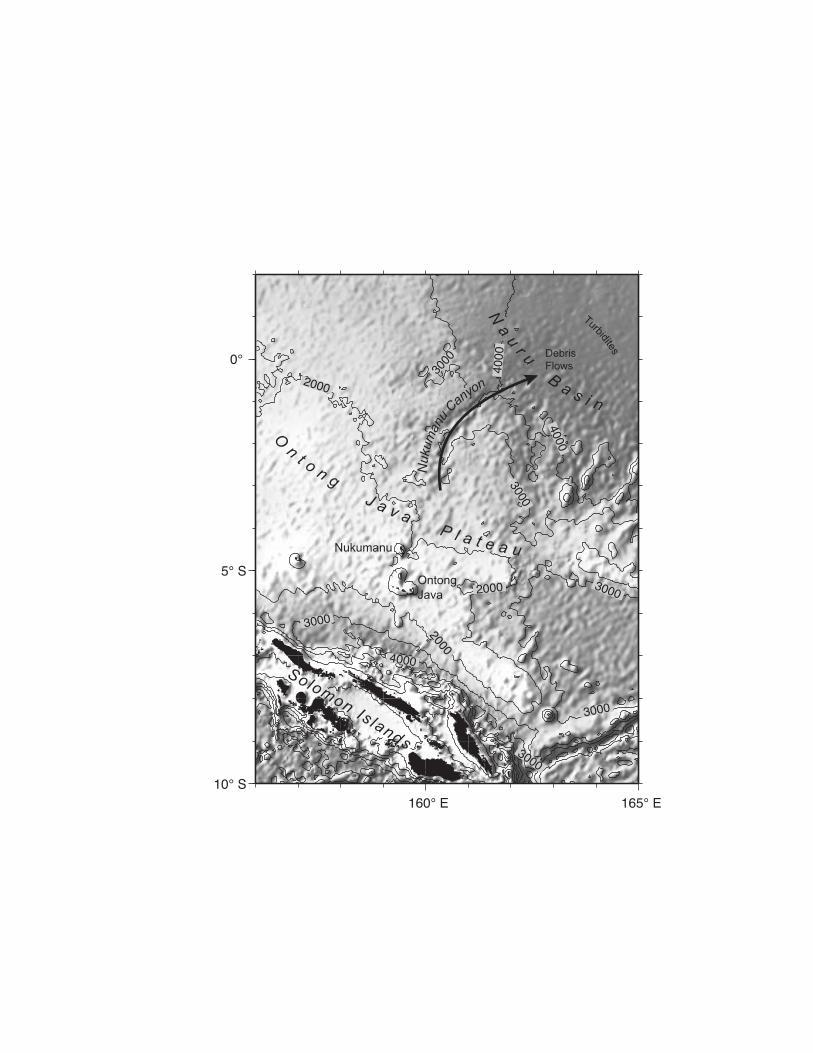
The Ontong Java Plateau Slide
One of the largest mass failures on earth exists on the northeastern margin of the Ontong
Java Plateau. The landslide scar, Nukumanu Canyon, extends from near Nukumanu Island
at the crest of the plateau down into the Nauru Basin, a total vertical drop of 2 km over a
horizontal distance of over 500 km. The canyon is clearly visible on any modern map of the
Pacific Ocean, almost regardless of scale (Fig. 1). The feature was identified as a landslide
by Kroenke (1972). Seismic reflection profiles across the canyon show truncated
sedimentary layers, precipitous channel walls, and isolated buttes within the channel
(Kroenke, 1972; Berger et al., 1977). Profiles along the channel and out into the Nauru
Basin show debris flows and turbidites (Kroenke et al., 1971; Berger et al., 1977). Cores
from the axis of the canyon recovered carbonates well below the carbonate compensation
depth, and contained shallow-water foraminifera, confirming a sudden, catastrophic origin
(Berger and Johnson, 1976). Taken together, the data suggest a single mass failure, though
the age of the event has yet to be determined. We study the Nukumanu Canyon event in
order to illustrate the sometimes surprising consequences of tsunami generation by
underwater landslides. Based on the scar dimensions, we estimate an initial length b = 200
km, an initial thickness T = 1 km, a width w = 100 km, a mean initial depth d = 3.3 km, and
a mean slope of θ = 0.5˚ that are reasonably consistent with Eqs. (7) and (10), and therefore
indicative of an underwater slide. This event could reach a volume of 16,000 km3 if it were
indeed a single mass failure.
We assume a specific density of γ = 1.85 and calculate an initial acceleration ao ≈ 0.026
m/s2, a terminal velocity ut ≈ 152 m/s, a characteristic distance of motion so ≈ 896 km, and a
characteristic time of motion to ≈ 5915 s. We expect a maximum velocity of 0.43ut = 65
m/s for this slide, due largely to the extreme length of this potential event. The characteristic
distance of motion has the same order of magnitude as the observed deposit length. The
characteristic wavelength is λo ≈ 1064 km and leads to a 3D amplitude factor of 0.086. The
characteristic tsunami amplitude above the slide is η3d ≈ 8.2 m although the ratio d/b =
0.0165 < 0.06 raises some doubt as to the accuracy of the extrapolation. Nevertheless, the
tsunami amplitude calculated here should be an upper bound on the potential tsunami
amplitude. The singularity in the tsunami amplitude equation as the initial depth vanishes is
spurious, in part because the near-field wave amplitude will eventually saturate to a
maximum of around 0.86 h (Mei, 1983). The tsunami described here clearly gives rise to
linear, nondispersive, shallow water waves that should traverse the Pacific Basin. However,
the small angle of inclination and large wavelength keep the tsunami amplitude small despite
the massive landslide size. Consequently, we do not expect any discernible paleo-tsunami
deposits for this potential event given a maximum far-field runup approximated by the
characteristic tsunami amplitude.
THE CORRESPONDENCE PRINCIPLE
Our analyses have usually focused on tsunami generation near the source rather than the
propagation and runup of local tsunamis. When first testing the value of analytical
expressions for tsunami generation, we observed a correspondence between the
characteristic tsunami amplitude at the source and the maximum runup above sea level along
the nearest shoreline. The observed correspondence helped justify our choice to study
exclusively tsunami generation. Hence, tsunami generation estimates provided an immediate
payback in the form of maximum runup estimates with a similar degree of approximation.
We therefore propose a Correspondence Principle that states:
A characteristic tsunami amplitude at generation can be found that will approximate the
maximum runup of local tsunamis generated by underwater landslides.
This correspondence arises because wavefront spreading during propagation is
compensated for by shoaling and refractive focusing. The spreading reduces amplitude
whereas the shoaling and focusing rebuild amplitude. The principle is not intended to
replace numerical simulations of tsunami propagation and inundation, especially because the
principle does not indicate where maximum runup will occur. Nevertheless, the
effectiveness of the principle is evident from available case studies and provides an
immediate regional assessment of local tsunami hazard.
CONCLUSIONS
Our results indicate that tsunami source characterization is the single most important
research activity related to landslide tsunamis and that source characterization is intimately
linked to the marine geology setting. We explain the role played by the landslide initial
acceleration in tsunami generation. We show that the initial acceleration is the only center
of mass motion experienced during tsunami generation and demonstrate the connection of
initial acceleration to our scaling analyses. These scaling analyses indicate that most
underwater landslide parameters with dimension of length can be related to the landslide
length. We show that underwater landslide width can have an important impact on the 3D
characteristic tsunami amplitude. We suggest that slumps may be more efficient tsunami
sources than slides. We solve an apparent paradox in slump center of mass motion
whereby the distance traveled is proportional to the shear strength. The distance traveled is
instead expressed by a departure in shear strength from being proportional to the
overburden. We demonstrate that rundown and runup can be scaled with the characteristic
tsunami amplitude, thereby proving the fundamental and global utility of a tsunami
amplitude within the generation region. Our case studies of five potential landslide
tsunamis show that our analyses can describe many tsunami features, in some cases
reproducing important eyewitness accounts. We anticipate that the characteristic tsunami
amplitude would be a reasonable representation of maximum runup in a three-dimensional
geometry. We therefore propose the Correspondence Principle as an extension of the case
studies presented here.
ACKNOWLEDGMENTS
The authors wish to acknowledge Applied Fluids Engineering, Inc. for substantial and
extended support of this research. Partial support for this work was provided by the FEMA
under grant DR-1008-9004 made to Costas Synolakis at USC, and by the NSF under
research grant CMS-0100223 made to STG at URI. Slava Gusiakov and Mike Blackford
provided data regarding the frequency and intensity of tsunamigenic underwater landslides.
The authors benefited from discussions with Jose Borrero, George Plafker, Costas
Synolakis, and Ahmet Yalçiner. DRT publishes by permission of the British Geological
Survey, Natural Environment Research Council, United Kingdom.
APPENDIX I. REFERENCES
Altinok, Y., Alpar, B., Ersoy, S., and Yalçiner, A. C. (1999). "Tsunami generation of the
Kocaeli Earthquake (August 17th 1999) in Izmit Bay; coastal observations, bathymetry and
seismic data." Turkish J. Marine Sciences, 5(3),131-148.
Bardet, J.-P. (1997). Experimental Soil Mechanics. Prentice Hall, Upper Saddle River, New
Jersey.
Berger, W. H., and Johnson, T. C. (1976). "Deep-sea carbonates: Dissolution and mass
wasting on Ontong Java Plateau." Science, 192, 785-787.
Berger, W. H., Johnson, T. C., and Hamilton, E. L. (1977). "Sedimentation on Ontong Java
Plateau: Observations on a classic 'carbonate monitor'." In: E. R. Andersen and A.
Malahoff (Eds.) The fate of fossil fuel CO2 in the oceans, Plenum Press, New York, 543-
567.
Bjerrum, L. (1971). "Subaqueous slope failures in Norwegian fjords." Nor. Geotech. Inst.
Bull., 88, 1-8.
Campbell, B. A. (1995). "Report of a seafloor instability at Skagway, Alaska, November 3,
1994." Campbell and Associates, 14104 Hancock Drive, Anchorage, Alaska, 99515.
Caplan-Auerbach, J., Fox, C. G., and Duennebier, F. K. (2001). "Hydroacoustic detection
of submarine landslides on Kilauea volcano." Geophys. Res. Lett., 28(9), 1811-1813.
Edgers, L., and Karlsrud, K. (1982). "Soil flows generated by submarine slides: Case
studies and consequences." Nor. Geotech. Inst. Bull., 143, 1-11.
Fryer, G. J., Watts, P., and Pratson, L. F. (2002). "Source of the great tsunami of 1 April
1946: A landslide in the upper Aleutian forearc." Marine Geology, submitted.
Geist, E. L. (1998). "Local tsunamis and earthquake source parameters." Adv. in Geophys.,
39, 117-209.
Hammack, J. L. (1973). "A note on tsunamis: Their generation and propagation in an ocean
of uniform depth." J. Fluid Mech., 60, 769-799.
Hampton, M. A., Lee, H. J., and Locat, J. (1996). "Submarine landslides." Rev. Geophys.,
34(1), 33-59.
Iwasaki, S. (1997). "The wave forms and directivity of a tsunami generated by an
earthquake and a landslide." Sci. Tsunami Hazards, 15, 23-40.
Jiang, L., and LeBlond, P. H. (1992). "The coupling of a submarine slide and the surface
waves which it generates." J. Geoph. Res., 97(C8), 12731-12744.
Johnson, J. M., and Satake, K. (1997). "Estimation of seismic moment and slip distribution
of the April 1, 1946, Aleutian tsunami earthquake." J. Geoph. Res., 102, 11765-11774.
Kawata, Y. and International Tsunami Survey Team members. (1999). "Tsunami in Papua
New Guinea was intense as first thought." Eos, Trans. Am. Geophys. Union, 80(9), 101.
Kramer, S. L. (1996). Geotechnical earthquake engineering. Prentice Hall, Upper Saddle
River, NJ.
Kroenke, L., Moberly, R., Winterer, E. L., and Heath, G. R. (1971). "Lithologic
interpretation of continuous reflection profiling, Deep Sea Drilling Project Leg 7." Init.
Repts. Deep Sea Drilling Proj., 7, 1161-1226.
Kroenke, L. W. (1972). "Geology of the Ontong Java Plateau," PhD thesis, University of
Hawaii, Honolulu, HI.
Kuenen, Ph. H. (1952). "Estimated size of the Grand Banks turbidity current." Am. J.
Science, 250, 874-884.
Kulikov, E. A., Rabinovich, A. B., Thomson, R. E., and Bornhold, B. D. (1996). "The
landslide tsunami of November 3, 1994, Skagway harbor, Alaska." J. Geoph. Res., 101(C3),
6609-6615.
Mader, C. L., and Curtis, G. (1991). "Modeling Hilo, Hawaii tsunami inundation." Sci.
Tsunami Hazards, 9, 85-94.
Martel, S. J. (2002). "Submarine landslides as a shear fracture phenomenon." In: P. Watts,
C. E. Synolakis, and J. P. Bardet (eds), Prediction of underwater landslide hazards, Swets &
Zeitlinger, Rotterdam, The Netherlands.
Matsuyama, M., Walsh, J. P., and Yeh, H. (1999). "The effect of bathymetry on tsunami
characteristics at Sissano Lagoon, Papua New Guinea." Geophys. Res. Lett., 26, 3513-3516.
McAdoo, B. G., Pratson, L. F., and Orange, D. L. (2000). "Submarine landslide
geomorphology, US continental slope." Marine Geol., 169, 103-136.
Mei, C. C. (1983). The applied dynamics of ocean surface waves. World Scientific,
Teaneck, N.J.
Murty, T. S. (1979). "Submarine slide-generated water waves in Kitimat Inlet, British
Columbia." J. Geoph. Res., 84(C12), 7777-7779.
Pelinovsky, E., and Poplavsky, A. (1996). "Simplified model of tsunami generation by
submarine landslide." Phys. Chem. Earth, 21(12), 13-17.
Plafker, G., Kachadoorian, R., Eckel, E. B., and Mayo, L. R. (1969). "The Alaska
earthquake March 27, 1964: Various communities." U.S. Geol. Surv. Prof. Paper 542-G,
U.S., Dept. of Interior, Washington, DC.
Plafker, G., Greene, H. G., Maher, N., and Synolakis, C. E. (2000). "Mechanism of the
November 3, 1994 submarine landslide and associated landslide-generated tsunami at
Skagway, Alaska." Eos, Trans. Am. Geophys. Union, 81(48), f759.
Prior, D. B., and Coleman, J. M. (1979). "Submarine landslides: Geometry and
nomenclature." Z. Geomorph. N. F., 23(4), 415-426.
Raichlen, F., Lee, J. J., Petroff, C., and Watts, P. (1996). "The generation of waves by a
landslide: Skagway, Alaska case study." Proc., 25th Int. Conf. Coastal Engrg., Orlando,
FA, ASCE, 1293-1300.
Schwab, W. C., Lee, H. J., Twichell, D. C. (1993). Submarine landslides: Selected studies
in the U.S. exclusive economic zone. Bull. 2002, U.S. Geol. Surv., U.S., Dept. of Interior,
Washington, DC.
Sibson, R. H. (1981). "Controls on low stress hydro-fracture dilatancy in thrust wrench and
normal fault terranes." Nature, 289, 665-667.
Striem, H. L., and Miloh, T. (1976). "Tsunamis induced by submarine slumpings off the
coast of Israel." Int. Hydrographic Review, 2, 41-55.
Sweet, S., and Silver, E. A. (2002). "Seismic reflection images of the source region of the
1998 Papua New Guinea tsunami." In: P. Watts, C. E. Synolakis, and J. P. Bardet (eds),
Prediction of underwater landslide hazards, Swets & Zeitlinger, Rotterdam, The
Netherlands.
Syvitski, J. P. M., and Hutton, E. W. H. (2002). "Failure of marine deposits and their
redistribution by sediment gravity flows." In: P. Watts, C. E. Synolakis, and J. P. Bardet
(eds), Prediction of underwater landslide hazards, Swets & Zeitlinger, Rotterdam, The
Netherlands.
Tappin, D. R., Watts, P., McMurtry, G. M., Lafoy, Y., Matsumoto, T. (2001). The Sissano,
Papua New Guinea Tsunami of July 1998 -- Offshore Evidence on the Source Mechanism.
Marine Geology, 175, 1-23.
Tappin, D. R., and Shipboard Scientists. (1999). "Offshore surveys identify sediment
slump as likely cause of devastating Papua New Guinea tsunami 1998." Eos, Trans. Am.
Geophys. Union, 80(30), July 27, 329.
Terzaghi, K. (1956). "Varieties of submarine slope failures." Proc., 8th Texas Conf. Soil
Mech. Found. Engrg., 1-41.
Tinti, S., and Bortolucci, E. (2000). "Energy of water waves induced by submarine
landslides." Pure Appl. Geophys., 157, 281–318.
Tuck, E. O., and Hwang, L.-S. (1972). "Long wave generation on a sloping beach." J. Fluid
Mech., 51(3), 449-461.
Turner, A. K., and Schuster, R. L. (1996). Landslides: Investigation and mitigation.
Special Report 247, Trans. Res. Board, National Academy Press, Washington, DC.
von Huene, R, Ranero, C. R., and Watts, P. (2002). "Tsunamigenic slope failure along the
Middle America Trench in two tectonic settings." In: P. Watts, C. E. Synolakis, and J. P.
Bardet (eds), Prediction of underwater landslide hazards, Swets & Zeitlinger, Rotterdam,
The Netherlands.
Watts, P. (1997). "Water waves generated by underwater landslides," PhD thesis, California
Inst. of Technol., Pasadena, CA.
Watts, P. (1998). "Wavemaker curves for tsunamis generated by underwater landslides." J.
Wtrwy, Port, Coast, and Oc. Engrg., ASCE, 124(3), 127-137.
Watts, P. (2000). "Tsunami features of solid block underwater landslides." J. Wtrwy, Port,
Coast, and Oc. Engrg., ASCE, 126(3), 144-152.
Watts, P., Imamura, F., and Grilli, S. T. (2000). "Comparing model simulations of three
benchmark tsunami generation cases." Sci. Tsunami Hazards, 18(2), 107-124.
Watts, P. (2001). "Some opportunities of the landslide tsunami hypothesis." Sci. Tsunami
Hazards, 19(3), 126-149.
Watts, P., Borrero, J. C., Tappin, D. R., Bardet, J.-P., Grilli, S. T., Synolakis, C. E. (2002a).
"Novel simulation technique employed on the 1998 Papua New Guinea tsunami." Presented
at the 1999 IUGG General Assembly in Birmingham, UK, and published by the first author
at www.appliedfluids.com/resume.html.
Watts, P., Gardner, J. V., Yalçiner, A. C., Imamura, F., and Synolakis, C. E. (2002b).
"Landslide tsunami scenario off Palos Verdes, California." Natural Hazards, in press.
Watts, P., and Borrero, J. C. (2002). "Probabilistic predictions of underwater landslides and
tsunami amplitudes." In: P. Watts, C. E. Synolakis, and J. P. Bardet (eds), Prediction of
underwater landslide hazards, Swets & Zeitlinger, Rotterdam, The Netherlands.
Wilson, R. C., and Keefer, D. K. (1985). Predicting areal limits of earthquake-induced
landsliding. Prof. Paper 1360, U.S. Geol. Survey, U.S., Dept. of Interior, Washington, DC.
Yalçiner, A. C., Synolakis, C. E., Borrero, J. C., Altinok, Y., Watts, P., Imamura, F., Kuran,
U., Ersoy, S., Kanoglu, U., and Tinti, S. (1999). "Tsunami generation in Izmit Bay by the
1999 Izmit Earthquake." Conference on the 1999 Kocaeli Earthquake, Istanbul Technical
University Press, 217-221.
Yehle, L. A., and Lemke, R. W. (1972). "Reconnaissance engineering geology of the
Skagway area, Alaska, with emphasis on evaluation of earthquake and other geological
hazards." Open File Report, U.S., Geol. Survey.
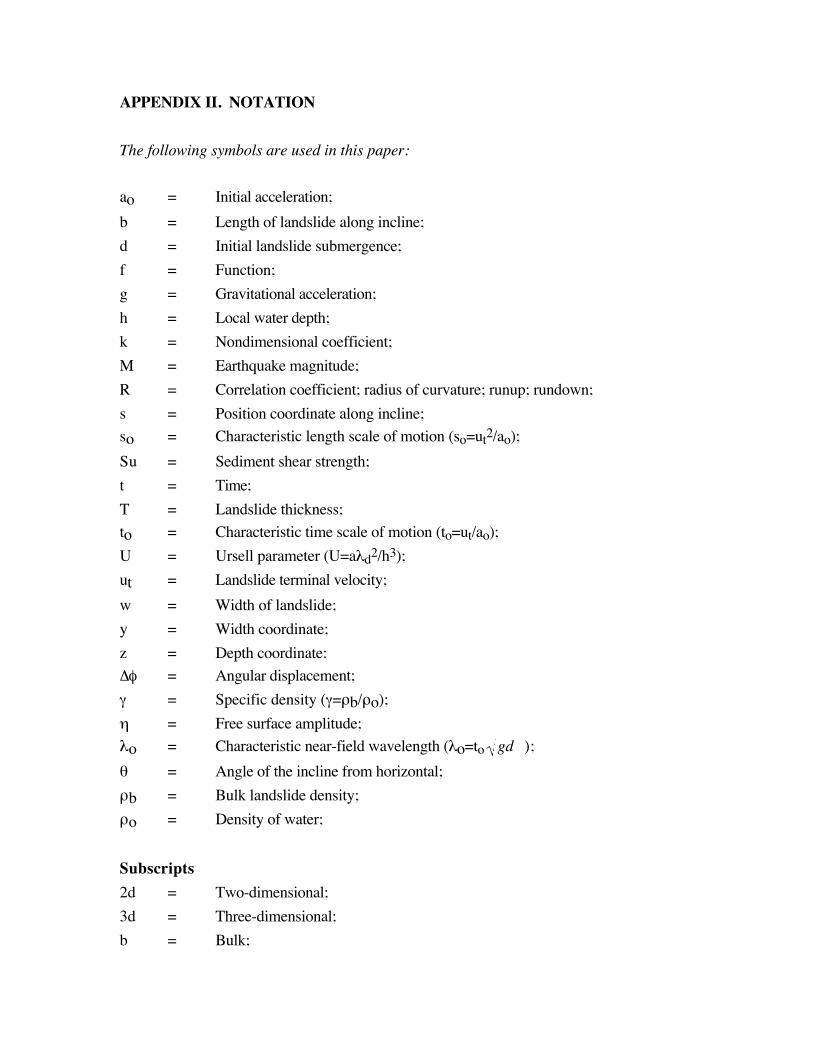
APPENDIX II. NOTATION
The following symbols are used in this paper:
ao = Initial acceleration;
b = Length of landslide along incline;
d = Initial landslide submergence;
f = Function;
g = Gravitational acceleration;
h = Local water depth;
k = Nondimensional coefficient;
M = Earthquake magnitude;
R = Correlation coefficient; radius of curvature; runup; rundown;
s = Position coordinate along incline;
so = Characteristic length scale of motion (so=ut2/ao);
Su = Sediment shear strength;
t = Time;
T = Landslide thickness;
to = Characteristic time scale of motion (to=ut/ao);
U = Ursell parameter (U=aλd2/h3);
ut = Landslide terminal velocity;
w = Width of landslide;
y = Width coordinate;
z = Depth coordinate:
∆φ = Angular displacement;
γ = Specific density (γ=ρb/ρo);
η = Free surface amplitude;
λo = Characteristic near-field wavelength (λo=to gd );
θ = Angle of the incline from horizontal;
ρb = Bulk landslide density;
ρo = Density of water;
Subscripts
2d = Two-dimensional;
3d = Three-dimensional;
b = Bulk;

g = Gravitational;
m = Added mass;
max = Maximum or upper bound;
o = Ambient water; characteristic; initial;
t = Terminal;
w = Moment;
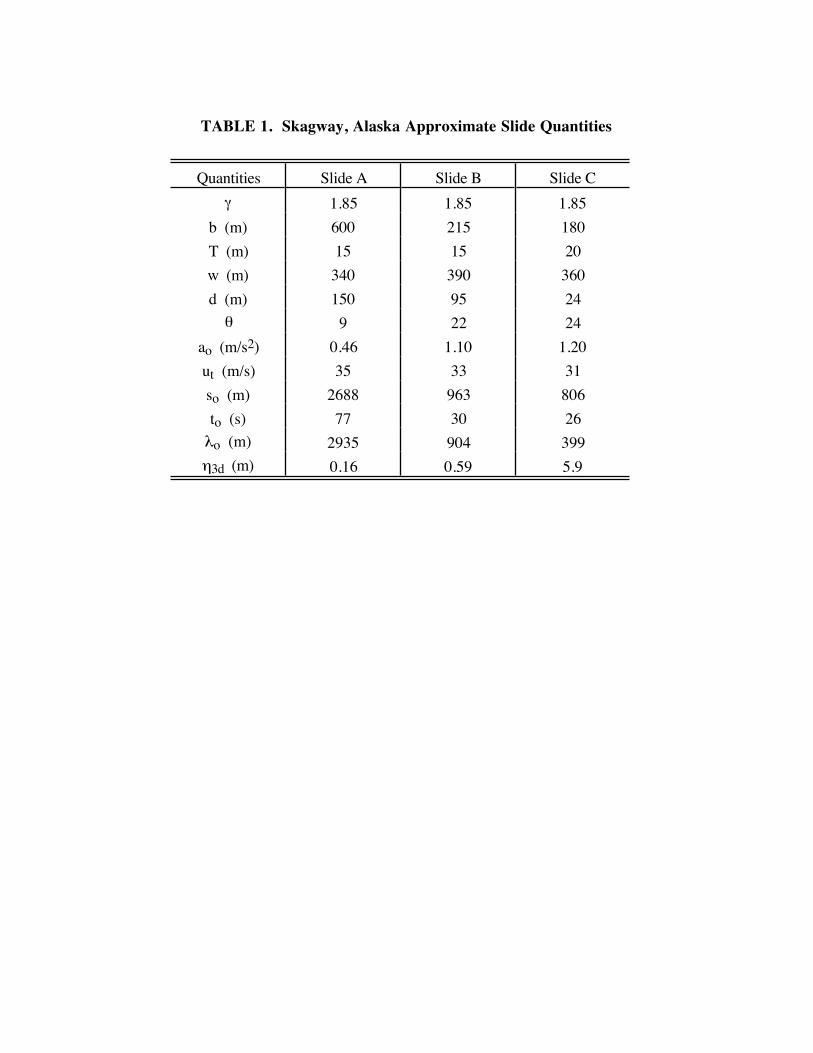
TABLE 1. Skagway, Alaska Approximate Slide Quantities
Quantities Slide A Slide B Slide C
γ 1.85 1.85 1.85
b (m) 600 215 180
T (m) 15 15 20
w (m) 340 390 360
d (m) 150 95 24
θ 9 22 24
ao (m/s2) 0.46 1.10 1.20
ut (m/s) 35 33 31
so (m) 2688 963 806
to (s) 77 30 26
λo (m) 2935 904 399
η3d (m) 0.16 0.59 5.9
Fig. 1: Contour plot of Skagway harbor bathymetry with 50 m contours and approximate
slide and dock locations in meters with arbitrary origin
Fig. 2. Contour plot of sea floor bathymetry along the north face of the Ontong Java
Plateau
2000 2200 2400 2600 2800 3000 3200
1600
1800
2000
2200
2400
2600
2800
3000
Slide A
Slide B
Slide C
Ore Dock
RailwayDock
SmallBoatHarborFerry Dock
Skagway
160° E 165° E 10°�S
5° S
0°
2000
2000
2000
3000
3000
3000
3000
4000
4000
4000
3000
3000
NukumanuC
anyon
Ontong
Java
Nukumanu
Debris
Flows
Turbidites
Naur
u
Ba s i n
O
nt ong
J a v aP l a t e a u
SolomonIs lands