tsmc 2008 business overview€¦ · our vision is to be the most advanced and largest technology...
TRANSCRIPT
TSMC 2008 BUSINESS OVERVIEW
8, Li-Hsin Rd. 6, Hsinchu Science Park, Hsinchu, Taiwan 300-77, R. O. C.Tel: 886-3-5636688 Fax: 886-3-5637000
http://www.tsmc.com
■ TSMC’s shares are listed on the Taiwan Stock Exchange (TWSE) under the code 2330.
■ Depositary receipts of the common shares are listed on New York Stock Exchange (NYSE) under the symbol TSM.
TABLE OF CONTENTS
4
TSMC VISION & CORE VALUES 01
LETTER TO SHAREHOLDERS 02
INTRODUCTION AND MARKET OVERVIEW 04
INVESTING FOR THE FUTURE 07
CORPORATE SOCIAL RESPONSIBILITY 11
CORPORATE GOVERNANCE 14
FINANCIAL STATEMENTS 16
01
TSMC VISION & CORE VALUES
TSMC's Vision
Our vision is to be the most advanced and largest technology and foundry services provider to fabless companies and IDMs,
and in partnership with them, to forge a powerful competitive force in the semiconductor industry.
To realize our vision, we must have a trinity of strengths:
(1) Be a technology leader, competitive with the leading IDMs
(2) Be the manufacturing leader
(3) Be the most reputable, service-oriented and maximum-total-benefits silicon foundry
TSMC Core Values
Integrity - Integrity is our most basic and most important core value. We tell the truth. We believe the record of our
accomplishments is the best proof of our merit. Hence, we do not brag. We do not make commitments lightly. Once we
make a commitment, we devote ourselves completely to meeting that commitment. We compete to our fullest within the
law, but we do not slander our competitors and we respect the intellectual property rights of others. With vendors, we
maintain an objective, consistent, and impartial attitude. We do not tolerate any form of corrupt behavior or politicking.
When selecting new employees, we place emphasis on the candidates' qualifications and character, not connections or
access.
Commitment - TSMC is committed to the welfare of customers, suppliers, employees, shareholders, and society. These
stakeholders all contribute to TSMC's success, and TSMC is dedicated to serving their best interests. In return, TSMC hopes all
these stakeholders will make a mutual commitment to the Company.
Innovation - Innovation is the wellspring of TSMC's growth, and is a part of all aspects of our business, from strategic
planning, marketing and management, to technology and manufacturing. At TSMC, innovation means more than new
ideas, it means putting ideas into practice.
Customer Partnership - At TSMC, customers come first. Their success is our success, and we value their ability to compete
as we value our own. We strive to build deep and enduring relationships with our customers, who trust and rely on us to be
part of their success over the long term.
TSMC 2008 BUSINESS OVERVIEW
02
LETTER TO SHAREHOLDERS
Dear Shareholders,
2008 was a year of rapid change. TSMC’s business remained vibrant in the first three quarters of the year, but saw
demand slowing by the middle of the third quarter. Fourth quarter revenue substantially declined and showed no sign
of recovery by the year-end.
With the sharp decline in the demand for semiconductors in the last quarter of 2008, revenue of the worldwide
semiconductor market for the full year is estimated to have declined by about 3 percent from its 2007 level. Pure-play
foundry segment is estimated to have outperformed the semiconductor industry and registered an annual growth rate
of approximately 2 percent. TSMC outperformed its peers, delivered 7.9 percent revenue growth in US dollars, and
gained market share to reach 51 percent among pure-play foundries during 2008. The outperformance is particularly
pronounced in the advanced process technologies where TSMC successfully ramped its 65-nanometer process
technology from 10 percent of wafer revenue at the beginning of the year to 27 percent by year-end, taking a share of
more than 80 percent for that technology among the logic foundries.
Financial Results
Total consolidated revenue for 2008 was NT$333.16 billion, a 3.3 percent increase compared with NT$322.63 billion in
2007. Mainly due to the implementation of a new accounting rule that requires expensing of employee profit sharing in
the Company’s financial statements starting in 2008, net income decreased 8.5 percent to NT$99.93 billion, compared
with 2007 net income of NT$109.18 billion. Similarly, diluted earnings per share decreased 5.7 percent to NT$3.83,
compared with NT$4.06 a year earlier. Had the accounting rules remained the same and employee profit sharing had
not been expensed, net income in 2008 would have been NT$112.42 billion and EPS NT$4.31. In US dollars, TSMC’s
2008 revenue was US$10.61 billion and net income was US$3.18 billion.
Among other highlights in 2008, TSMC achieved:● Total average capacity utilization of 90 percent;● Average gross profit margin of 42.5 percent; and● Average operating profit margin of 31.4 percent.
During the year, TSMC shipped 8.47 million eight-inch equivalent wafers, representing about 8 percent of global IC
wafer shipments, up from 7.5 percent a year ago.
Technology Innovation
As a technology leader, TSMC is committed to investing in long-term growth by delivering continual innovation. Despite
a challenging economic environment, 2008 was characterized by significant technological progress. TSMC led the
foundry segment with qualification and delivery of 40-nanometer high performance and low-power technologies, using
advanced immersion lithography, performance enhancing silicon strains and extreme low-k inter-metal dielectric
material. TSMC also demonstrated the foundry’s first 32-nanometer technology which supported both analog and
digital functionalities. TSMC is the first foundry to announce the 28-nanometer process as a full node technology that
will include a choice of silicon oxynitride and high-k/metal gate transistor options. Our paper on high-k/metal gate
published in the 2008 International Electron Device Meeting proceedings was featured as a conference highlight.
In order to enable efficient implementation of innovations among the semiconductor design community, and its
ecosystem partners, along with TSMC’s own IP, design services and process technologies, TSMC unveiled its Open
Innovation PlatformTM (OIP) in early 2008. Central to the platform is a set of ecosystem interfaces and collaborative
components initiated and supported by TSMC that can more efficiently empower innovation throughout the supply
chain and yield benefit to all participants.
LETTER TO SHAREHOLDERS
03
Corporate Developments
Early in 2008 TSMC reorganized and established the Advanced Technology Business Organization and the Mainstream
Technology Business Organization by merging operation with technology and service marketing. These two new
organizations will respectively take responsibility for formulation, development, and execution of advanced technology and
mainstream technology business objectives, with dedicated human resources and more flexibility.
In August 2008, Royal Philips Electronics NV completed a four-phased plan and exited from its TSMC shareholding. As part
of the plan, and subsequently for the purpose of partially offsetting the dilution from employee profit sharing, the Company
repurchased, in two separate programs, a total of 495,549 thousand common shares in the open market of the Taiwan
Stock Exchange, accounting for approximately 1.92% of its total outstanding shares, at an average price of NT$61.40 per
share. The repurchased shares were cancelled subsequently.
Honors and Awards
In recognition of his distinguished career and significant contributions to the U.S. semiconductor industry, the
Semiconductor Industry Association (SIA), in November, honored TSMC’s Chairman Dr. Morris Chang as the 2008 recipient
of the Robert N. Noyce Memorial Award, the Association’s highest honor.
TSMC, in 2008, continued to receive recognition and awards from around the world as a corporate role model. TSMC’s
disclosure and transparency and its focus on shareholder value have won top honors from AsiaMoney Magazine, The Asset
Magazine, Corporate Governance Asia, FinanceAsia, and Institutional Investors in the areas of Corporate Governance,
Management, and Investor Relations. IR Magazine announced TSMC as the winner of Grand Prix for Best Overall Investor
Relations 6 years in a row, while CommonWealth Magazine voted TSMC the Most Admired Company in Taiwan for the 12th
consecutive year, and also awarded us with “Excellence in Corporate Social Responsibility”. As a leader in good corporate
citizenship, TSMC was included in the Dow Jones Sustainability Index for the 8th consecutive year, and is the only company
from Taiwan included in the Carbon Disclosure Leadership Index. TSMC has received certificate of National Industrial Safety
and Health Award given by the Taiwan Executive Yuan, and its Fab 14 Phase III has been certified by the US Green Building
Council as a Leader in Energy and Environmental Design (LEED).
Outlook
As we enter 2009, the global economy is in the midst of a deep recession and the timing of a recovery is uncertain. TSMC’s
Management understands that the strong headwinds brought by the global recession will likely result in a long period of
slower business recovery. However, TSMC’s solid balance sheet and strong cash position should enable us to weather the
storm well. We will continue to invest wisely in our future to enhance our technologies and capabilities. TSMC’s trinity of
strengths: technology leadership, manufacturing excellence and customer partnership, will continue to enable us to become
the most advanced, innovative, and largest provider of foundry services.
Historically, TSMC has leveraged periodic challenges to become stronger. The challenges of 2009 are clear, and all TSMC
employees are committed to do our utmost to emerge from this global economic crisis stronger than ever.
Morris Chang Rick TsaiChairman President and CEO
From left to right:F.C. Tseng, Vice Chairman Morris Chang, Chairman Rick Tsai, President and CEO

TSMC 2008 BUSINESS OVERVIEW
0404
INTRODUCTION AND MARKET OVERVIEW
INTRODUCTIONAND MARKET OVERVIEWAn Introduction to TSMC
TSMC is the world’s largest pure-play semiconductor foundry. Founded on February 21, 1987 and headquartered in
Hsinchu, Taiwan, TSMC pioneered the business model of focusing solely on manufacturing customers’ semiconductor
designs. As a pure-play semiconductor foundry, the Company does not design, manufacture, or market semiconductor
products under its own brand name, ensuring that TSMC does not compete directly with its customers.
With a diverse global customer base, TSMC-manufactured microchips are used in a broad variety of applications that cover
various segments of the computer, communications and consumer electronics markets.
Total capacity of the manufacturing facilities managed by TSMC, including subsidiaries and joint ventures, was 9.38 million
8-inch equivalent wafers in 2008. In Taiwan, TSMC operates two advanced 12-inch wafer fabs, four 8-inch wafer fabs, and
one 6-inch wafer fab. TSMC also manages two 8-inch fabs at wholly owned subsidiaries: WaferTech in the United States and
TSMC China Company Limited. In addition, TSMC obtains 8-inch wafer capacity from other companies in which the
Company has an equity interest.
TSMC provides customer service through its account management and engineering services offices in North America,
Europe, Japan, China, South Korea, and India. The Company employed more than 22,000 people worldwide as of the end
of 2008.
TSMC continues to lead the foundry segment of the semiconductor industry in advanced process technologies. Already the
first foundry to provide 65nm production capacity, again, in 2008, TSMC was the first foundry to provide 40nm production.
In addition to general-purpose logic process technology, TSMC supports the wide-ranging needs of its customers with
embedded non-volatile memory, embedded DRAM, mixed signal/RF, high voltage, CMOS image sensor, color filter, MEMS,
and silicon germanium technologies. In September 2008, TSMC announced future plans to deliver its 28nm process as a full
node technology in 2010, offering the option of both high-k metal gate (HKMG) and silicon oxynitride (SiON) material to
support a variety of customer applications.
The Company is listed on the Taiwan Stock Exchange (TWSE) under ticker number 2330, and its American Depositary Shares
trade on the New York Stock Exchange (NYSE) under the symbol “TSM”.
Market and Business Summary
TSMC Achievements
In 2008, TSMC maintained its leading position in the pure-play foundry segment of the global semiconductor industry, with
an estimated market segment share of 51%. TSMC achieved this result amid fierce competition from both established
players and relatively new entrants to the business.
Leadership in advanced process technologies is a key factor in TSMC’s strong market position. In 2008, 64% of TSMC’s
wafer revenue came from manufacturing processes with geometries of 0.13μm and below. A critical milestone was reached
in September 2008, when TSMC shipped its five hundred thousandth 65nm 12-inch wafer. Moreover, TSMC also achieved
volume production of the 45/40nm process as well as development of the leading-edge 32/28nm process, both foundry
firsts. As of the fourth quarter of 2008, 27% of TSMC’s wafer revenue came from 65nm processes and below.
In addition to advanced technologies, TSMC also offers innovative services in line with its unwavering focus on customer
partnership. Among the many innovative services unveiled in 2008 was wafer level chip scale package (WLCSP) which offers
smaller form factor, addressing the trend of mobile devices becoming smaller and thinner while providing richer features.
TSMC also rolled out its Open Innovation PlatformTM initiative in 2008 to promote and facilitate timely innovation among the

05
semiconductor design community, its ecosystem partners and TSMC’s IP, design methodology, design implementation, DFM
capabilities, process technology and backend services.
TSMC continued to advance the semiconductor roadmap in 2008. Examples of technologies the Company developed or
rolled out include:● 32/28nm technology with functional static random access memory (SRAM) ● 45/40nm technology● 55nm general performance technology, a 90% linear shrink from 65nm● 85nm general performance technology● 85nm low power technology● 0.12μm general performance technology● 0.13μm high voltage process for small panel single chip drivers● 0.152μm logic process for low power and radio frequency (RF) applications● 0.18μm low power embedded flash memory● 0.18μm bipolar complementary device (BCD)
Meanwhile, the following technology is also in our development roadmap:● 55nm low power technology
In addition, one major focus of TSMC’s technology development in 2008 was its specialty technology strategy, including
65/90nm embedded flash, 65/90nm CMOS image sensor and 0.13μm analog technologies. In 2008, TSMC offered the
foundry segment’s first CMOS image sensor with innovative back side illumination technology, named 0.11μm BSI. These
specialty technologies are key differentiators from competitors and provide customer more value.
Market OverviewIt is estimated that the semiconductor market in 2008 reached US$249 billion in revenue, a slight decrease of 3% compared
to 2007. According to IC Insights, total foundry, a manufacturing sub-segment of the semiconductor industry, generated
total revenues of US$25.0 billion in 2008, up 2.9% year on year, while revenues from pure-play foundries such as TSMC
reached US$21.0 billion. In 2008, the largest geographic market for pure-play foundry services was North America, which
accounted for 62% of overall pure-play foundry revenue. The second largest geographic market was Asia Pacific (excluding
Japan), which accounted for 24% of total pure-play foundry revenue in 2008. European-based customers accounted for 9%,
and orders from companies based in Japan contributed 5%.
Industry Outlook, Opportunities and Threats
Industry Demand and Supply OutlookThe semiconductor market in 2008 experienced a slight decline of 3%. For 2009, based on the deteriorating global
macroeconomy, the semiconductor market could decline in percentage terms by around 20%, depending on the severity of
the recession. As the inventory level in the supply chain generally appears higher than average at the end of 2008, the decline
of the foundry segment could be deeper than the semiconductor industry by another mid-to-high single digit percent in
2009. Pure-play foundry capacity is estimated to increase by around 5% in 2009, compared with the 12% compound annual
growth rate from 2006 to 2008. This indicates that the foundry players may only invest very limited capacity in response to
the recession in 2009.
Opportunities and Threats in the Foundry Sector of the Semiconductor MarketDespite the fact that the semiconductor market as a whole is maturing and the challenge in 2009, TSMC believes that
foundry services, the sector in which TSMC principally competes, will play an increasingly important role as the
semiconductor industry becomes more reliant on outsourced manufacturing in the long run. With the assumption of
production value being 2.2 times pure-play foundry revenue, it is forecasted that by 2013, 21% of global semiconductor
revenue will come from pure-play foundries, compared with 17% in 2008, according to IC Insights. As the leader in
pure-play foundry services, TSMC is well positioned to capture the growth opportunities of this sector. On the other hand,
threats facing the foundry sector include a continuing decline in wafer prices, due to the fact that the IC industry is prone to
fast-declining end application prices, as well as potential industry overcapacity when the global economic climate
experiences a downturn.
TSMC 2008 BUSINESS OVERVIEW
0606
TSMC Position, Differentiation and Strategy
PositionAs the leader in the pure-play foundry segment of the semiconductor manufacturing industry, TSMC commanded a 51%
share of this segment in 2008, with total consolidated revenue of US$10.6 billion. In terms of geographic distribution of
wafer revenue, 74% came from North America, 13% from the Asia Pacific region excluding Japan, 10% from Europe, and
3% from Japan. In terms of end product application, 33% of total wafer revenue came from the computing sector, 42%
from communications, 19% from consumer products, and 6% from other categories, such as industrial products.
DifferentiationTSMC’s leading industry position is based on a trinity of key differentiating strengths: technology leadership, manufacturing
excellence, and customer partnership. As a technology leader, TSMC has consistently been the first pure-play foundry to
develop the next generation of leading-edge technologies. As a manufacturing leader, TSMC is renowned for its yield
management, and offers best-in-class support services to expedite time-to-market and time-to-volume. And, in customer
partnership, TSMC works closely with its customers on end-to-end collaboration to optimize design and manufacturing
efficiencies. Going forward, TSMC will continue building on this trinity of strengths to provide the best overall value to its
customers.
StrategyTSMC is confident its differentiating strengths will enable it to leverage the attractive growth opportunities in the foundry
sector going forward. TSMC works constantly to ensure that these strengths are maintained and improved. For example,
TSMC is intensively working on the leading-edge 28nm and 22nm process to maintain its technology leadership position,
and is poised to be the first pure-play foundry player to roll out production in these technologies. Numerous efforts are also
underway to ensure manufacturing excellence, such as continuing enhancement of Design-For-Manufacturing (DFM)
support services to increase yield and efficiency. TSMC also introduced its Open Innovation Platform initiative, a set of
ecosystem interfaces and collaborative components initiated and supported by TSMC that efficiently empowers innovation
throughout the supply chain to enhance timely innovation. Finally, TSMC conducts throughout the year customer reviews
and surveys to better understand customer needs and wants, and accordingly may adjust its offerings in response, thereby
strengthening its partnership with customers.
To counter the ongoing challenge of falling wafer prices, TSMC’s plans to continue strengthening its core capabilities and
value propositions, including its ability to deliver customer product to market earlier and with better functionality; to develop
advanced and mainstream technologies with sufficient capacity support and flexible manufacturing, and to continue to
focus on customer service. In addition, TSMC will continue optimizing its service portfolio in order to balance profitability
and growth.
INTRODUCTION AND MARKET OVERVIEW

0707
INVESTING FOR THE FUTURE
In the latter half of 2008, TSMC began to feel the impact of the worst global economic downturn since the end of the
Second World War. Conditions continued to worsen into the first quarter of 2009, when we experienced our most severe
sequential decline in sales since the company was founded. With the concerted efforts of every department to control costs
in all areas, TSMC was nonetheless able to remain profitable in the first three months of 2009. Conditions remain difficult,
and TSMC expects the global economy to contract in 2009, along with a significant decline in global semiconductor industry
revenues. However, signs of stabilization and recovery began to emerge in early 2009, and continue to grow stronger.
At the same time, the cost of developing new semiconductor process technologies and designing products at new process
nodes is becoming higher and higher. For example, the cost of developing 65 nanometer process technology is estimated to
be approximately US$0.9 billion, and the cost of developing a 65 nanometer product is approximately US$48 million. At the
45 nanometer node, the cost of developing process technology rises to US$1.1 billion, and the cost of developing a product
rises to US$70 million. This trend pressured the semiconductor sector’s profit margins even before the global economic
downturn, and continues to increase the difficulty of investing in new technology and new products during this downturn.
TSMC believes that under these conditions, we need to collaborate even more closely with our customers and other partners
to carefully spend our limited resources on investments that create the maximum benefit with minimum redundancy and
overlap.
OEC+IMF Actual IMF Forecast
FIRST NEGATIVE GLOBAL GDP SINCE WWII
Source: OECD Interim Economic Outlook, March 2009
1951 1956 1961 1966 1971 1976 1981 1986 1991 1996 2001 2006 2011
8.0%
7.0%
6.0%
5.0%
4.0%
3.0%
2.0%
1.0%
0.0%
-1.0%

TSMC 2008 BUSINESS OVERVIEW
0808
INVESTING FOR THE FUTURE
R&D INVESTMENT INCREASES
Source: TSMC, IBS
Process Development Cost
0.13µm 90nm 65nm 45nm 32nm
Design Complexity
0.13µm 90nm 65nm 45nm 32nm
COLLABORATION REDUCES WASTE
Profit
TSMCInvestment
CustomerInvestment
PartnerInvestment
Closer collaboration increases profit
TSMC has historically emerged from every downturn stronger than before, and we are determined to make sure that this
time is no exception. Our strong financial base and disciplined spending have given us the resources to not only weather the
downturn, but also to ensure that the upturn will be a profitable one for TSMC as well as our customers. More importantly,
TSMC has the willingness and determination to look beyond the very difficult economic conditions we face in 2009 and
invest for the future.
TSMC began to take action in early 2009, putting our resources into developing advanced technology nodes, a broader
portfolio of applications in mainstream technology nodes, as well as production capacity to support future growth.
To undertake these tasks takes strong R&D and design service teams, and in 2009, TSMC is increasing our R&D team of
approximately 1,200 engineers by 30 percent, and our design service engineers by 15 percent. These new scientists and
engineers will serve at our R&D headquarters in Hsinchu, Taiwan, and also at R&D and design centers in Shanghai, China;
Ottowa, Canda; San Jose and Austin in the United States; and Leuven, Belgium.

0909
ADDING MORE SCIENTISTS AND ENGINEERS IN 2009
Design and Technology Platform 15%+
Research and Development 30%+
Progress in Advanced Technology
As TSMC’s 40 nanometer technology goes into volume production throughout 2009, our next target will be to launch 28nm
technology in 2010. Like all new process technologies, this is a challenging node, particularly the high-K/metal gate
technology used in the high-performance version of our 28nm process. However, TSMC was able to produce a functional 64
megabit high-k/metal gate SRAM device in the first half of 2009, and we are confident that this node will provide sizable
performance gains in both speed and power consumption for our customers.
At the same time, TSMC’s heavy investment in design services lowers barriers for customers, allowing them to reduce
spending on redundancies and focus their design efforts in the areas where they are the most competitive and add the most
value.
TSMC is also investing in wafer-level, chip-scale packaging to give our customers capability to offer system-in-package
products. We are putting R&D effort and organization in place to provide lead-free bumping, copper post, through-silicon
vias (TSVs), so that we will have the technology when customers need them.

TSMC 2008 BUSINESS OVERVIEW
1010
New Mainstream Technology Applications
“Moore’s Law”, which holds that the number of transistors in integrated circuits doubles approximately every 18 months,
has driven then pace of semiconductor development since the inception of the industry. However, semiconductors serve a
wide variety of applications in electronics where performance can not be measured by speed, and we call these applications
“More than Moore”. TSMC is heavily increasing investment in areas with low penetration by foundries, such as radio
frequency, analog, power management, sensors, and micro-electrical mechanical (MEMs) devices to serve a wider customer
base. Collaborating with a close partner, we have been able to bring into production CMOS image sensors with backside
illumination technology, which enables a very high density sensor with a very competitive cost.
Capacity Investment
In addition to R&D, we continue to invest in our capacity. We began moving equipment into our newest 300mm
manufacturing and R&D fab, Fab 12 Phase 4, in mid-2009. Phase 4 connects with Phases 1 and 2 of our Fab 12 Gigafab
through a bridge that integrates the automated materials handling systems of all phases, and is also a full cleanroom – a
semiconductor industry first. Once Phase 4 is brought to full capacity, the Fab 12 Gigafab will cover 300,000 square meters
of floor space, including 45,000 square meters of cleanroom space, equivalent to 8 football fields, for capacity of 1,680,000
300mm wafers per year.
Our Newest R&D and Manufacturing Fab-Fab 12 Phase 4
INVESTING FOR THE FUTURE

11
CORPORATE SOCIAL RESPONSIBILITY
Environmental, Safety and Health (ESH) Management
TSMC believes its environmental, safety and health practices should not only comply with legal requirements, but also
measure up to recognized international practices. The Company aims to prevent pollution, efficiently use all resources,
prevent accidents, improve employee safety and health, protect property, and establish a work environment that promotes
the well-being of our employees and of the communities in which we operate.
Environmental Protection
TSMC acknowledges that all employees should take responsibility for environmental protection. We not only comply with
the environmental regulations of the locations where we operate, but also track new developments in global environmental
issues, and take the lead in adopting new environmentally friendly measures. In addition to protecting the environment of
our manufacturing sites in Taiwan and around the world, we lead our suppliers to establish a green supply chain. TSMC
actively seeks to raise the environmental consciousness of all employees, and through social engagement and dialogue with
semiconductor trade organizations, we encourage the semiconductor industry to contribute to society and the world.
All TSMC manufacturing facilities in Taiwan, China, and United States have received ISO 14001 certification for
environmental management systems, and QC 080000 certification for hazardous substance management systems, and new
facilities will be certified as well.
Climate Change and Greenhouse Gas ReductionGlobal climate change is TSMC’s top environmental concern. TSMC takes active measures to reduce greenhouse gases
emitted in the semiconductor manufacturing process -- perfluorinated compounds (PFCs) such as CF4, C2F6, SF6, NF3, CHF3,
C3F8, and C4F8. TSMC has committed to reducing PFC emissions to 10% below the average emission level of 1997 and 1999
by 2010. This emissions target remains fixed as TSMC continues to grow and construct new fabs. We have achieved
significant results in the past several years and we expect to reduce more than 70% of PFC emissions and reach our target as
scheduled.
Energy and Water ConservationCoal-fired generators are the main source of electricity in Taiwan and emit large amounts of CO2. Reducing energy
consumption is an important part of CO2 emission reduction for industries. TSMC uses energy-conserving designs when
building new fabs, and continues to implement energy-saving measures on production equipment in operation. TSMC
reduced average power consumption per 8-inch wafer out equivalent from 480 KWH in 2003 to 339 KWH in 2008,
extending our gradual reduction in energy usage. In 2008, energy consumption declined by 4.2%.
Taiwan is a highly industrialized and densely populated island with mountainous terrain that does not retain water easily.
TSMC reduces water usage by continuously raising the efficiency of process equipment, and by improving our water
recycling rate. In 2008, TSMC’s average process water recycling rate was 80.4%, exceeding the worldwide semiconductor
industry standard. Recycling rates at some TSMC fabs are higher than 90%, leading the global semiconductor industry. Total
water usage decreased by 1.6% in 2008 and water use per wafer area decreased by 10.16% compared to 2007.
Waste ReductionTSMC treats waste as a resource to be managed and led the Taiwan semiconductor industry in 2001 in establishing a
designated unit responsible for planning and management of waste recycling and disposal. TSMC continued to carry out
waste reduction and recycling programs in 2008, improving its waste recycling rate from 65% in 2001 to 90% in 2008, not
including office general waste.

TSMC 2008 BUSINESS OVERVIEW
1212
CORPORATE SOCIAL RESPONSIBILITY
Green BuildingsTSMC initiated a “green building” program in 2006. The program covers design and construction of new fabs, enhancement
of existing fabs, internal training, and encouraging partners to gain ”green building” certification. We established a Green
Building Task Force to certify new fabs and existing office buildings according to the U.S. Leadership in Energy and
Environmental Design (LEED) standard and Taiwan’s Ecology, Energy Saving, Waste Reduction, Health (EEWH) standard. In
2008, TSMC’s newly-constructed Fab14 phase 3 won EEWH diamond level and LEED gold level certification.
Safety and Health Management
TSMC’s safety and health management is built on the framework of the OHSAS 18001 system, and follows the principle of
“Plan, Do, Check, Act” to prevent accidents and protect employee safety and health as well as Company assets. In 2008,
TSMC was certified for compliance from OHSAS 18001:1999 to OHSAS 18001:2007 in routine annual 3rd party audits.
Besides accident prevention, TSMC has established emergency response procedures to protect the lives of employees and
contractors if disasters should occur, as well as to minimize negative impacts to society and the environment. TSMC
communicates to suppliers to reduce potential risks in the operation of production equipment and follows safety control
procedures when installing production equipment. The Company places stringent controls on high-risk operations and also
evaluates the seismic tolerance of facilities and equipment to reduce the risk of earthquake damage. In health management,
TSMC maintains regular wellness and professional health programs and also establishes Company-level prevention
committees when infectious diseases such as Severe Acute Respiratory Syndrome (SARS) or Avian Influenza pose a potential
risk to the Company.
Environmental, Safety and Health-related Awards in 2008
● Recognized by the Ministry of Economic Affairs Industry Development Bureau for “Excellence in Voluntary Greenhouse Gas Reduction”
● Recognized by the Executive Yuan, Council of Labor Affairs (CLA) for “National Industrial Safety and Health Award”● Member of the Dow Jones Sustainability World Index for an 8th consecutive year, and the only Taiwan member from 2003
to 2007● Selected to the Carbon Disclosure Leadership Index (CDLI) by the Carbon Disclosure Project, and the only Taiwan company
in the index● Fab 14 Phase 3 was only building in Taiwan to be certified “Gold Level” by the U.S. Green Building Council (USGBC) for
“Leadership in Energy and Environmental Design of New Construction (LEED-NC) “● Fab 14 Phase 3 was only factory in Taiwan to be rated “Diamond class” by Taiwan’s “Ecology, Energy Saving, Waste
Reduction, and Health (EEWH)” certification● Fab 14 recognized by the Executive Yuan, Environmental Protection Administration (EPA) for “The Annual Enterprise
Environmental Protection Award”● Fab 12 was recognized by the Science Park Administration (SPA) for “Low Carbon Enterprise Award”
The TSMC Education and Culture Foundation
TSMC established the Education and Culture Foundation in 1998 to coordinate the Company’s sponsorship as part of its
efforts in corporate social responsibility. The Foundation directs resources to support four major areas: education, art and
culture, community building, and the employee volunteer program.
In 2008, the TSMC Foundation also invited leading corporations to form the Taiwan Corporate Sustainability Forum to
support TSMC’s efforts to build a green supply chain in the semiconductor industry, and to help leaders in environmental
protection across different industries learn from each other.
The Taiwan Corporate Sustainability Forum
TSMC believes that environmental protection is a cooperative effort, not a competition, and leading companies have a
responsibility to show the way.

1313
Guided by these concepts, TSMC visited 20 major Taiwan enterprises, and invited them to create the “Taiwan Corporate
Sustainability Forum”, which was founded on October 16, 2008. In the next two years, the forum’s activities will focus on
energy conservation, carbon reduction and community care. Members have committed to hosting experience-sharing
sessions, and as of December 2008, the forum held three experience-sharing sessions, hosted by TSMC, Asustek Computer
Inc, and Acer Inc.
Commitment to Education
Talented people are essential to the development of our economy. As a leader in Taiwan’s knowledge-based economy,
TSMC is committed to help cultivate talented people for society.
The TSMC Education and Culture Foundation tailors various programs to target a whole range of education at different age
levels. At primary schools, our focus is on aesthetic education, with the goal of exposing children to arts as early as possible.
For secondary schools, we concentrate on developing students’ potential in science and humanities, hoping to nurture
talents in both aspects. At the college level, we target global perspectives so that the students can compete in a globalized
economy.
Promotion of Arts and Culture
The TSMC Education and Culture Foundation has been devoted to the promotion of arts and culture for many years. In
addition to bringing prestigious international artists to Taiwan, the foundation is active in supporting prominent Taiwanese
art groups. The Foundation pioneered collaboration between corporations and arts groups in Taiwan by sponsoring the
Cloud Gate Dance Theater. In 2008, a fire destroyed their rehearsal studio, and the foundation joined in the reconstruction
effort. The TSMC Foundation was also presented with the 9th Arts and Business Special Award, Grand Jury Prize, by the
Council for Cultural Affairs in 2008. It is recognition of TSMC’s long-term commitment and achievements in supporting art
and culture activities.
Community Building
As a company based in Hsinchu and Tainan, TSMC is dedicated to building a better environment and a vibrant community in
these areas. In order to contribute to these communities and bring culture to these high-tech cities, the Foundation began
to focus its funding for fine arts on activities in Hsinchu and Tainan from 2003. By organizing exhibits and performances in
these cities and packaging them into the “TSMC Hsin-Chu Arts Festival”, we hope to encourage a greater appreciation of
arts. In addition, the Foundation is supporting various long-term projects to provide assistance to disadvantaged women
and youth in the local community.
The Employee Volunteer Program
The most valuable asset of TSMC is the talent and enthusiasm of its employees. In addition to sponsoring education and arts
programs, the Foundation encourages TSMC employees to devote themselves to society as volunteers. TSMC employees
have served as guides to introduce the electronic industry at the National Science Museums during weekends, and read
books to the elementary students in remote townships on weekdays. In 2008, a new team of Energy-Saving Volunteers was
formed to help the local community in pursuing energy saving measures.
TSMC 2008 BUSINESS OVERVIEW
14
CORPORATE GOVERNANCE

15
CORPORATE GOVERNANCE
TSMC advocates and acts upon the principles of operational transparency and respect for shareholder rights. We believe that
the basis for successful corporate governance is a sound and effective Board of Directors. In line with this principle, TSMC’s
Board of Directors established an Audit Committee in 2002 and a Compensation Committee in 2003.
Board of Directors
TSMC’s Board of Directors consists of eight distinguished members with a great breadth of experience as world-class
business leaders or scholars. In 2008, four of the eight members were independent directors: former British
Telecommunications Chief Executive Officer, Sir Peter Bonfield; Professor Lester Thurow from the Massachusetts Institute of
Technology; former Acer Group Chairman, Mr. Stan Shih; and former Hewlett-Packard Chairman and CEO, Ms. Carleton
(Carly) Fiorina. Under the leadership of Chairman Morris Chang, TSMC’s Board of Directors takes a serious and forthright
approach to its duties and is a serious, competent and independent Board.
In the spirit of Chairman Chang’s approach to corporate governance, a board of directors’ primary duty is to supervise. The
Board should supervise the Company’s compliance with relevant laws and regulations, financial transparency, timely
disclosure of material information, and maintaining the highest integrity within the Company. TSMC’s Board of Directors
strives to perform through the Audit Committee and the Compensation Committee, the hiring of a financial expert for the
Audit Committee, coordination with the Internal Audit department, and through the ombudsman reporting system.
The second duty of the board of directors is to provide guidance to the management team of the Company. TSMC’s
management reports quarterly to the TSMC Board on a variety of subjects. The management also reviews the Company’s
business strategies with the Board. Furthermore, the management often reviews with and updates TSMC’s Board on the
progress of the strategies, obtaining Board guidance as appropriate.
The third duty of the Board of Directors is to evaluate the management’s performance and to dismiss officers of the
Company when necessary. TSMC’s management has maintained a healthy and functional communication with TSMC Board
of Directors, has been devoted in executing guidance of TSMC Board of Directors, and is dedicated in running business
operations, all to achieve the best interests for TSMC shareholders.
Audit Committee and Compensation Committee
The Audit Committee assists the Board in carrying out its financial oversight responsibilities and other duties as set forth in
the Company Act, the Securities and Exchange Act, and other applicable laws and regulations. Matters required to be
reviewed by the Audit Committee include the Company’s: financial reports; auditing and accounting policies and
procedures; internal control systems; material asset or derivatives transactions; offering or issuance of any equity-type
securities; hiring or dismissal of an attesting CPA, or the compensation given thereto; and appointment or discharge of
financial, accounting, or internal auditing officers.TSMC’s Audit Committee is empowered by its Charter to conduct any
study or investigation it deems appropriate to fulfill its responsibilities. It has direct access to TSMC’s internal auditors, the
Company’s independent auditors, and all employees of the Company. The Committee is authorized to retain and oversee
special legal, accounting, or other consultants as it deems appropriate to fulfill its mandate.
As of February 2009, the Audit Committee was comprised of all four independent directors and had engaged a financial
expert consultant. The Audit Committee Charter is available on TSMC’s corporate website.
The Compensation Committee assists the Board in discharging its responsibilities related to TSMC’s compensation and
benefits policies, plans and programs, and in the evaluation and compensation of TSMC’s executives. As of February 2009,
the Compensation Committee was comprised of five members. All four independent directors served as voting members of
the Committee; the Chairman of the Board, Dr. Morris Chang, was a non-voting member. Mr. Stan Shih, Chairman of the
Compensation Committee, convened four regular meetings in 2008. The Compensation Committee Charter is available on
TSMC’s corporate website.
TSMC 2008 BUSINESS OVERVIEW
1616
FINANCIAL STATEMENTS
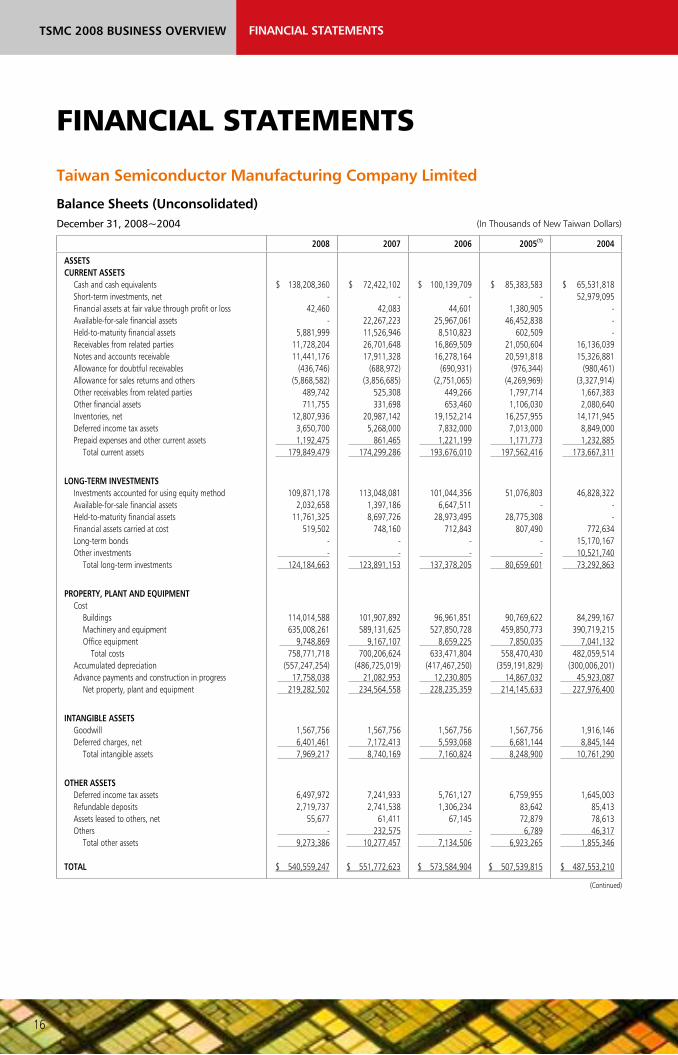
Taiwan Semiconductor Manufacturing Company Limited
Balance Sheets (Unconsolidated) December 31, 2008~2004 (In Thousands of New Taiwan Dollars)
2008 2007 2006 2005(1) 2004
ASSETSCURRENT ASSETS
Cash and cash equivalentsShort-term investments, netFinancial assets at fair value through profit or lossAvailable-for-sale financial assetsHeld-to-maturity financial assetsReceivables from related partiesNotes and accounts receivableAllowance for doubtful receivablesAllowance for sales returns and othersOther receivables from related partiesOther financial assetsInventories, netDeferred income tax assetsPrepaid expenses and other current assets
Total current assets
$ 138,208,360 -
42,460 -
5,881,999 11,728,204 11,441,176
(436,746)(5,868,582)
489,742 711,755
12,807,936 3,650,700
1,192,475 179,849,479
$ 72,422,102 -
42,083 22,267,223 11,526,946 26,701,648 17,911,328
(688,972)(3,856,685)
525,308 331,698
20,987,142 5,268,000
861,465 174,299,286
$ 100,139,709 -
44,601 25,967,061 8,510,823
16,869,509 16,278,164
(690,931)(2,751,065)
449,266 653,460
19,152,214 7,832,000
1,221,199 193,676,010
$ 85,383,583 -
1,380,905 46,452,838
602,509 21,050,604 20,591,818
(976,344)(4,269,969) 1,797,714 1,106,030
16,257,955 7,013,000
1,171,773 197,562,416
$ 65,531,818 52,979,095
- - -
16,136,039 15,326,881
(980,461)(3,327,914) 1,667,383 2,080,640
14,171,945 8,849,000
1,232,885 173,667,311
LONG-TERM INVESTMENTSInvestments accounted for using equity methodAvailable-for-sale financial assetsHeld-to-maturity financial assetsFinancial assets carried at costLong-term bondsOther investments
Total long-term investments
109,871,178 2,032,658
11,761,325 519,502
- - 124,184,663
113,048,081 1,397,186 8,697,726
748,160 -
- 123,891,153
101,044,356 6,647,511
28,973,495 712,843
- - 137,378,205
51,076,803 -
28,775,308 807,490
- - 80,659,601
46,828,322 - -
772,634 15,170,167
10,521,740 73,292,863
PROPERTY, PLANT AND EQUIPMENTCost
BuildingsMachinery and equipmentOffice equipment
Total costsAccumulated depreciationAdvance payments and construction in progress
Net property, plant and equipment
114,014,588 635,008,261
9,748,869 758,771,718
(557,247,254) 17,758,038 219,282,502
101,907,892 589,131,625
9,167,107 700,206,624
(486,725,019) 21,082,953 234,564,558
96,961,851 527,850,728
8,659,225 633,471,804
(417,467,250) 12,230,805 228,235,359
90,769,622 459,850,773
7,850,035 558,470,430
(359,191,829) 14,867,032 214,145,633
84,299,167 390,719,215
7,041,132 482,059,514
(300,006,201) 45,923,087 227,976,400
INTANGIBLE ASSETSGoodwillDeferred charges, net
Total intangible assets
1,567,756 6,401,461 7,969,217
1,567,756 7,172,413 8,740,169
1,567,756 5,593,068 7,160,824
1,567,756 6,681,144 8,248,900
1,916,146 8,845,144 10,761,290
OTHER ASSETSDeferred income tax assetsRefundable depositsAssets leased to others, netOthers
Total other assets
TOTAL
6,497,972 2,719,737
55,677 - 9,273,386
$ 540,559,247
7,241,933 2,741,538
61,411 232,575 10,277,457
$ 551,772,623
5,761,127 1,306,234
67,145 - 7,134,506
$ 573,584,904
6,759,955 83,642 72,879
6,789 6,923,265
$ 507,539,815
1,645,003 85,413 78,613
46,317 1,855,346
$ 487,553,210
(Continued)
FINANCIAL STATEMENTS

1717
2008 2007 2006 2005(1) 2004
LIABILITIES AND SHAREHOLDERS' EQUITYCURRENT LIABILITIES
Financial liabilities at fair value through profit or lossAccounts payablePayables to related partiesIncome tax payableBonuses payable to employees and directorsPayables to contractors and equipment suppliersAccrued expenses and other current liabilitiesCurrent portion of long-term bonds payable
Total current liabilities
$ 83,618 4,314,265 1,202,350 9,222,811
15,148,057 7,574,891 7,553,475
8,000,000 53,099,467
$ 247,646 9,485,818 2,999,630
10,977,963 -
5,389,740 14,700,013
- 43,800,810
$ 10,751 6,143,679 3,326,916 7,850,418
- 10,669,523 7,903,867
7,000,000 42,905,154
$ 234,279 8,052,106 3,242,197 3,815,888
- 8,859,230 7,980,715
- 32,184,415
$ - 6,488,617 3,198,490
379,903 -
31,154,309 8,917,533
10,500,000 60,638,852
LONG-TERM LIABILITIESBonds payableOther long-term payablesOther payables to related parties
Total long-term liabilities
4,500,000 931,252
- 5,431,252
12,500,000 1,501,462
- 14,001,462
12,500,000 1,271,896
403,375 14,175,271
19,500,000 1,511,100
1,100,475 22,111,575
19,500,000 1,934,968
2,317,972 23,752,940
OTHER LIABILITIESAccrued pension costGuarantee depositsDeferred credits
Total other liabilities
Total liabilities
3,710,009 1,479,152
462,256 5,651,417
64,182,136
3,657,679 2,240,677
980,593 6,878,949
64,681,221
3,530,116 3,809,961
1,183,118 8,523,195
65,603,620
3,461,392 2,892,945
1,259,139 7,613,476
61,909,466
3,101,196 412,393
682,530 4,196,119
88,587,911
SHAREHOLDERS' EQUITYCapital stock - $10 par value
Common stockCapital surplusRetained earnings
Appropriated as legal capital reserveAppropriated as special capital reserveUnappropriated earnings
256,254,373 49,875,255
67,324,393 391,857
102,337,417 170,053,667
264,271,037 53,732,682
56,406,684 629,550
161,828,337 218,864,571
258,296,879 54,107,498
43,705,711 640,742
152,778,079 197,124,532
247,300,246 57,117,886
34,348,208 2,226,427
106,196,399 142,771,034
232,519,637 56,537,259
25,528,007 -
88,202,009 113,730,016
OthersCumulative translation adjustmentsUnrealized gain (loss) on financial instrumentsTreasury stock
Total shareholders' equity
481,158 (287,342)
- 193,816 476,377,111
(1,072,853)680,997
(49,385,032) (49,776,888) 487,091,402
(1,191,165)561,615
(918,075) (1,547,625) 507,981,284
(640,742) -
(918,075) (1,558,817) 445,630,349
(2,226,427) -
(1,595,186) (3,821,613) 398,965,299
TOTAL $ 540,559,247 $ 551,772,623 $ 573,584,904 $ 507,539,815 $ 487,553,210
Note 1: Balances for 2005 have been reclassified to conform to 2006 presentation. (Concluded)
TSMC 2008 BUSINESS OVERVIEW
1818
FINANCIAL STATEMENTS
1919
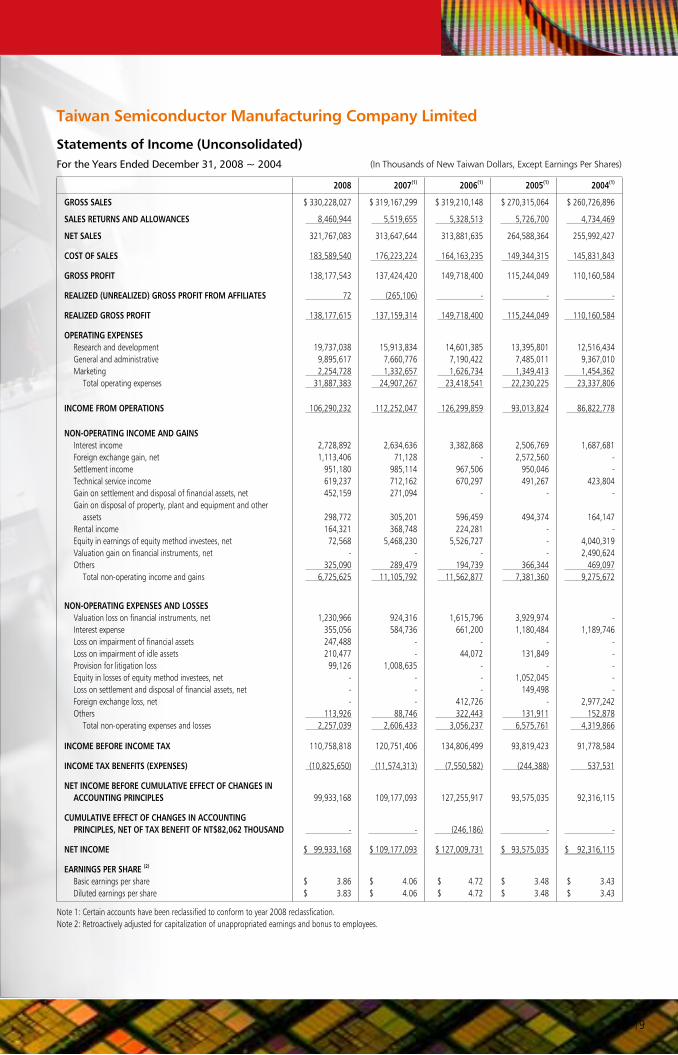
Taiwan Semiconductor Manufacturing Company Limited
Statements of Income (Unconsolidated)For the Years Ended December 31, 2008 ~ 2004 (In Thousands of New Taiwan Dollars, Except Earnings Per Shares)
2008 2007(1) 2006(1) 2005(1) 2004(1)
GROSS SALES $ 330,228,027 $ 319,167,299 $ 319,210,148 $ 270,315,064 $ 260,726,896
SALES RETURNS AND ALLOWANCES 8,460,944 5,519,655 5,328,513 5,726,700 4,734,469
NET SALES 321,767,083 313,647,644 313,881,635 264,588,364 255,992,427
COST OF SALES 183,589,540 176,223,224 164,163,235 149,344,315 145,831,843
GROSS PROFIT 138,177,543 137,424,420 149,718,400 115,244,049 110,160,584
REALIZED (UNREALIZED) GROSS PROFIT FROM AFFILIATES 72 (265,106) - - -
REALIZED GROSS PROFIT 138,177,615 137,159,314 149,718,400 115,244,049 110,160,584
OPERATING EXPENSESResearch and developmentGeneral and administrativeMarketing
Total operating expenses
19,737,038 9,895,617
2,254,728 31,887,383
15,913,834 7,660,776
1,332,657 24,907,267
14,601,385 7,190,422
1,626,734 23,418,541
13,395,801 7,485,011
1,349,413 22,230,225
12,516,434 9,367,010
1,454,362 23,337,806
INCOME FROM OPERATIONS 106,290,232 112,252,047 126,299,859 93,013,824 86,822,778
NON-OPERATING INCOME AND GAINSInterest incomeForeign exchange gain, netSettlement incomeTechnical service incomeGain on settlement and disposal of financial assets, netGain on disposal of property, plant and equipment and other
assetsRental incomeEquity in earnings of equity method investees, netValuation gain on financial instruments, netOthers
Total non-operating income and gains
2,728,892 1,113,406
951,180 619,237 452,159
298,772 164,321
72,568 -
325,090 6,725,625
2,634,636 71,128
985,114 712,162 271,094
305,201 368,748
5,468,230 -
289,479 11,105,792
3,382,868 -
967,506 670,297
-
596,459 224,281
5,526,727 -
194,739 11,562,877
2,506,769 2,572,560
950,046 491,267
-
494,374 - - -
366,344 7,381,360
1,687,681 - -
423,804 -
164,147 -
4,040,319 2,490,624
469,097 9,275,672
NON-OPERATING EXPENSES AND LOSSESValuation loss on financial instruments, netInterest expenseLoss on impairment of financial assetsLoss on impairment of idle assetsProvision for litigation lossEquity in losses of equity method investees, netLoss on settlement and disposal of financial assets, netForeign exchange loss, netOthers
Total non-operating expenses and losses
1,230,966 355,056 247,488 210,477
99,126 - - -
113,926 2,257,039
924,316 584,736
- -
1,008,635 - - -
88,746 2,606,433
1,615,796 661,200
- 44,072
- - -
412,726 322,443 3,056,237
3,929,974 1,180,484
- 131,849
- 1,052,045 149,498
- 131,911 6,575,761
- 1,189,746
- - - - -
2,977,242 152,878 4,319,866
INCOME BEFORE INCOME TAX 110,758,818 120,751,406 134,806,499 93,819,423 91,778,584
INCOME TAX BENEFITS (EXPENSES) (10,825,650) (11,574,313) (7,550,582) (244,388) 537,531
NET INCOME BEFORE CUMULATIVE EFFECT OF CHANGES IN ACCOUNTING PRINCIPLES 99,933,168 109,177,093 127,255,917 93,575,035 92,316,115
CUMULATIVE EFFECT OF CHANGES IN ACCOUNTING PRINCIPLES, NET OF TAX BENEFIT OF NT$82,062 THOUSAND - - (246,186) - -
NET INCOME $ 99,933,168 $ 109,177,093 $ 127,009,731 $ 93,575,035 $ 92,316,115
EARNINGS PER SHARE (2)
Basic earnings per shareDiluted earnings per share
$ 3.86 $ 3.83
$ 4.06 $ 4.06
$ 4.72 $ 4.72
$ 3.48 $ 3.48
$ 3.43 $ 3.43
Note 1: Certain accounts have been reclassified to conform to year 2008 reclassfication.Note 2: Retroactively adjusted for capitalization of unappropriated earnings and bonus to employees.

TSMC 2008 BUSINESS OVERVIEW
2020
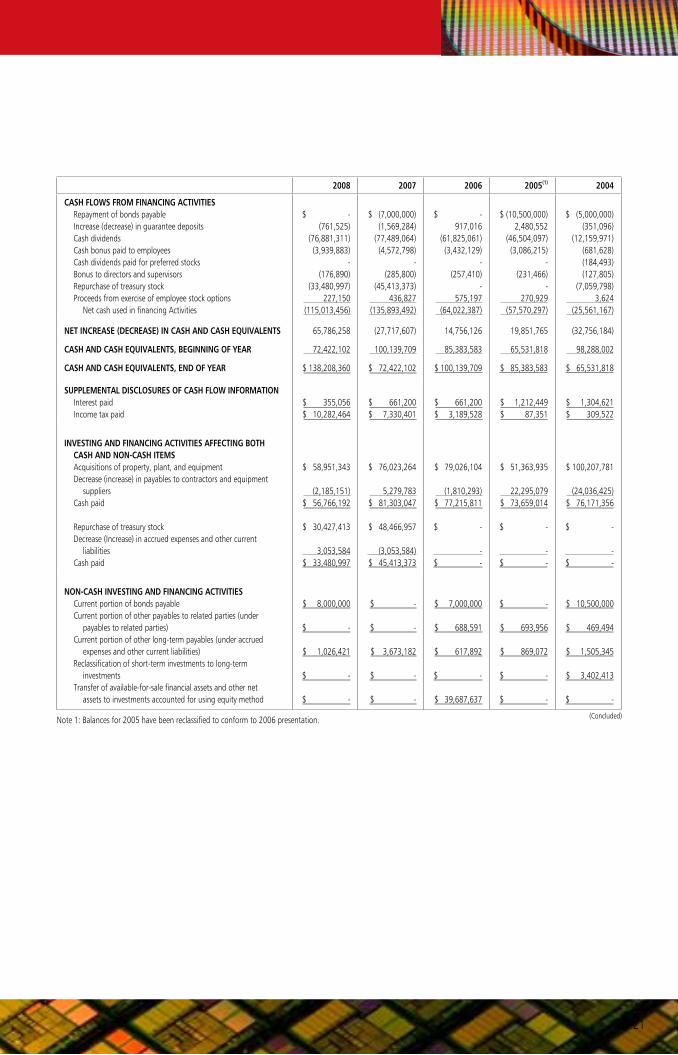
Taiwan Semiconductor Manufacturing Company Limited
Statements of Cash Flows (Unconsolidated)For the Years Ended December 31, 2008 ~ 2004 (In Thousands of New Taiwan Dollars)
2008 2007 2006 2005(1) 2004
CASH FLOWS FROM OPERATING ACTIVITIESNet incomeAdjustments to reconcile net income to net cash provided by
operating activitiesDepreciation and amortizationUnrealized (realized) gross profit from affiliatesAmortization of premium/discount from long-term bond
investments, netAmortization of premium/discount of financial assetsLoss on impairment of financial assets Gain on sales of long-term investments, netLoss (gain) on disposal of available-for-sale financial assets, netGain on disposal of financial assets carried at cost, netGain on disposal of investments accounted for using equity
method investees, netEquity in losses (earnings) of equity method investees, netDividends received from equity method investeesGain on disposal of property, plant and equipment and other
assets, netLoss on impairment of idle assetsDonation of idle assetsDeferred income taxesChanges in operating assets and liabilities:
Decrease (increase) in:Financial assets and liabilities at fair value through profit or lossReceivables from related partiesNotes and accounts receivableAllowance for doubtful receivablesAllowance for sales returns and othersInventories, netPrepaid expenses and other current assets
Increase (decrease) in:Accounts payablePayables to related partiesIncome tax payableBonuses payable to employees and directors Accrued pension costAccrued expenses and other liabilities
Net cash provided by operating activities
$ 99,933,168
74,569,562 (72)
- (97,381) 247,488
- (443,404)
(8,755)
- (72,568)
1,804,351
(298,769) 210,477
- 2,361,261
(164,405)14,973,444
6,470,152 (252,226)2,011,897 8,179,206 (666,886)
(5,171,553)(1,797,280)(1,766,153)15,148,057
52,330 (3,271,994) 211,949,947
$ 109,177,093
72,820,579 265,106
- (117,159)
- -
(271,094) -
- (5,468,230)
677,147
(300,387) - -
1,083,194
239,413 (9,832,139)(1,633,164)
(1,959)1,105,620
(1,834,928)605,454
3,342,139 (327,286)3,127,545
- 127,563
1,332,485 174,116,992
$ 127,009,731
66,699,455 -
- 2,399
36,608 -
485 (212)
(26,031)(5,526,727)
626,367
(355,474) 44,072
- 179,828
1,112,776 4,181,095 4,313,654 (285,413)
(1,518,904)(2,894,259)
836,884
(1,908,427)(612,381)4,034,530
- 68,724
61,517 196,080,297
$ 93,575,035
67,991,423
-
- 120,872
- -
150,081 (2,919)
(583)1,052,045 668,464
(434,382) 131,849
7,207 (3,278,952)
10,739 (4,914,565)(5,264,937)
(4,117)942,055
(2,086,010)(1,263,179)
1,563,489 (1,224,371)
3,435,985 -
360,196 (905,549) 150,629,876
$ 92,316,115
63,072,140 -
28,673 - -
(2,216) - -
- (4,040,319)
-
(56,425) - -
(1,101,407)
- (1,301,979)(1,409,074)
(35,561)1,201,889
(3,264,787)(606,189)
404,741 (1,771,144)
252,800 -
500,945 (507,984) 143,680,218
CASH FLOWS FROM INVESTING ACTIVITIESAcquisitions of :
Property, plant and equipmentAvailable-for-sale financial assetsHeld-to-maturity financial assetsInvestments accounted for using equity methodFinancial assets carried at costLong-term investmentsCash from merger of subsidiaries
Proceeds from disposal or redemption of:Available-for-sale financial assetsHeld-to-maturity financial assetsFinancial assets carried at costInvestments accounted for using equity methodLong-term investmentsProperty, plant and equipment and other assets
Increase in short-term investments, netProceeds from return of capital by investeeIncrease in deferred chargesDecrease (increase) in other assets
Net cash used in investing activities
(56,766,192)(23,697,000)(12,371,965)
(494,765)(20,681)
- 270,650
45,584,934 15,004,000
10,606 - -
2,042,899 -
2,465,293 (3,199,813)
21,801 (31,150,233)
(81,303,047)(9,547,253)
- (7,358,685)
(36,333) - -
18,844,520 17,325,120
- - -
54,509 -
433,551 (2,685,610)
(1,667,879) (65,941,107)
(77,215,811)(98,679,832)(18,554,027)(5,515,466)
(12,940) - -
73,212,019 10,410,000
71,191 37,946
- 1,277,729
- 162,354
(1,272,355) (1,222,592)(117,301,784)
(73,659,014)(99,436,242)(14,199,142)(3,392,619)
(48,536) - -
101,609,384 14,595,394
16,599 65,076
- 2,087,236
- -
(847,721) 1,771 (73,207,814)
(76,171,356) - - - -
(30,290,982) -
- - - -
7,822 1,713,934
(43,822,489) -
(2,404,130) 91,966 (150,875,235)
(Continued)
FINANCIAL STATEMENTS
2121
2008 2007 2006 2005(1) 2004
CASH FLOWS FROM FINANCING ACTIVITIESRepayment of bonds payableIncrease (decrease) in guarantee deposits Cash dividendsCash bonus paid to employeesCash dividends paid for preferred stocksBonus to directors and supervisorsRepurchase of treasury stockProceeds from exercise of employee stock options
Net cash used in financing Activities
$ - (761,525)
(76,881,311)(3,939,883)
- (176,890)
(33,480,997) 227,150
(115,013,456)
$ (7,000,000)(1,569,284)
(77,489,064)(4,572,798)
- (285,800)
(45,413,373) 436,827
(135,893,492)
$ - 917,016
(61,825,061)(3,432,129)
- (257,410)
- 575,197
(64,022,387)
$ (10,500,000)2,480,552
(46,504,097)(3,086,215)
- (231,466)
- 270,929
(57,570,297)
$ (5,000,000)(351,096)
(12,159,971)(681,628)(184,493)(127,805)
(7,059,798) 3,624
(25,561,167)
NET INCREASE (DECREASE) IN CASH AND CASH EQUIVALENTS 65,786,258 (27,717,607) 14,756,126 19,851,765 (32,756,184)
CASH AND CASH EQUIVALENTS, BEGINNING OF YEAR 72,422,102 100,139,709 85,383,583 65,531,818 98,288,002 CASH AND CASH EQUIVALENTS, END OF YEAR $ 138,208,360 $ 72,422,102 $ 100,139,709 $ 85,383,583 $ 65,531,818
SUPPLEMENTAL DISCLOSURES OF CASH FLOW INFORMATIONInterest paid Income tax paid
$ 355,056 $ 10,282,464
$ 661,200 $ 7,330,401
$ 661,200 $ 3,189,528
$ 1,212,449 $ 87,351
$ 1,304,621 $ 309,522
INVESTING AND FINANCING ACTIVITIES AFFECTING BOTH CASH AND NON-CASH ITEMSAcquisitions of property, plant, and equipmentDecrease (increase) in payables to contractors and equipment
suppliersCash paid
Repurchase of treasury stockDecrease (Increase) in accrued expenses and other current
liabilitiesCash paid
$ 58,951,343
(2,185,151)$ 56,766,192
$ 30,427,413
3,053,584 $ 33,480,997
$ 76,023,264
5,279,783 $ 81,303,047
$ 48,466,957
(3,053,584)$ 45,413,373
$ 79,026,104
(1,810,293)$ 77,215,811
$ -
- $ -
$ 51,363,935
22,295,079 $ 73,659,014
$ -
- $ -
$ 100,207,781
(24,036,425)$ 76,171,356
$ -
- $ -
NON-CASH INVESTING AND FINANCING ACTIVITIESCurrent portion of bonds payableCurrent portion of other payables to related parties (under
payables to related parties)Current portion of other long-term payables (under accrued
expenses and other current liabilities)Reclassification of short-term investments to long-term
investmentsTransfer of available-for-sale financial assets and other net
assets to investments accounted for using equity method
$ 8,000,000
$ -
$ 1,026,421
$ -
$ -
$ -
$ -
$ 3,673,182
$ -
$ -
$ 7,000,000
$ 688,591
$ 617,892
$ -
$ 39,687,637
$ -
$ 693,956
$ 869,072
$ -
$ -
$ 10,500,000
$ 469,494
$ 1,505,345
$ 3,402,413
$ -
Note 1: Balances for 2005 have been reclassified to conform to 2006 presentation. (Concluded)
TSMC 2008 BUSINESS OVERVIEW
2222
2008 2007 2006 2005(1) 2004
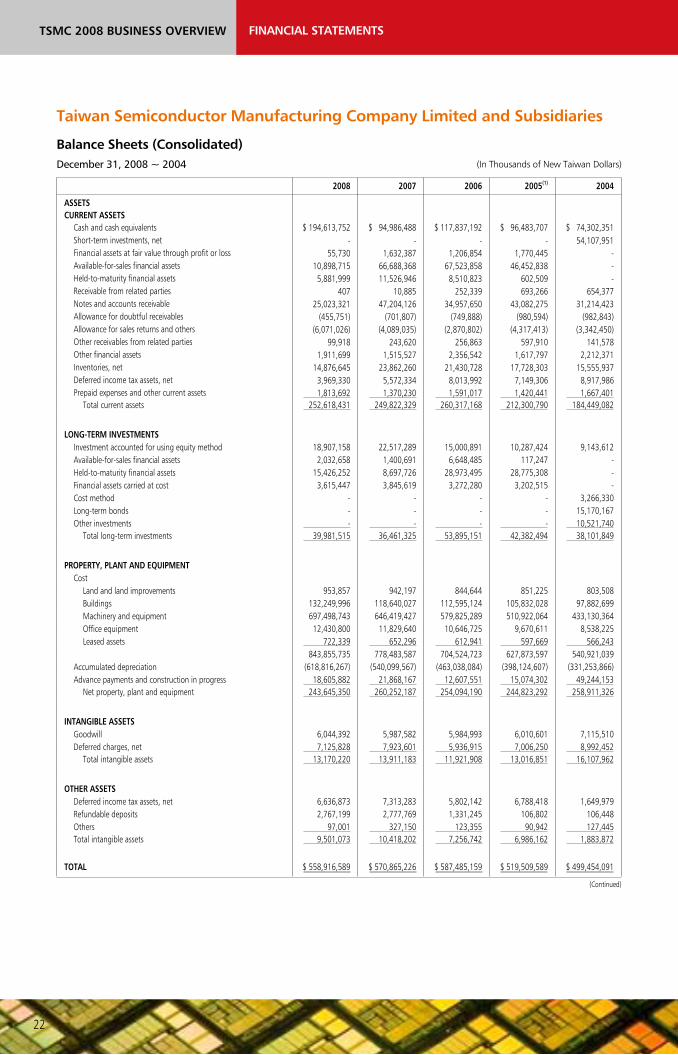
ASSETS CURRENT ASSETS
Cash and cash equivalents $ 194,613,752 $ 94,986,488 $ 117,837,192 $ 96,483,707 $ 74,302,351 Short-term investments, net - - - - 54,107,951 Financial assets at fair value through profit or loss 55,730 1,632,387 1,206,854 1,770,445 - Available-for-sales financial assets 10,898,715 66,688,368 67,523,858 46,452,838 - Held-to-maturity financial assets 5,881,999 11,526,946 8,510,823 602,509 - Receivable from related parties 407 10,885 252,339 693,266 654,377 Notes and accounts receivable 25,023,321 47,204,126 34,957,650 43,082,275 31,214,423 Allowance for doubtful receivables (455,751) (701,807) (749,888) (980,594) (982,843)Allowance for sales returns and others (6,071,026) (4,089,035) (2,870,802) (4,317,413) (3,342,450)Other receivables from related parties 99,918 243,620 256,863 597,910 141,578 Other financial assets 1,911,699 1,515,527 2,356,542 1,617,797 2,212,371 Inventories, net 14,876,645 23,862,260 21,430,728 17,728,303 15,555,937 Deferred income tax assets, net 3,969,330 5,572,334 8,013,992 7,149,306 8,917,986 Prepaid expenses and other current assets 1,813,692 1,370,230 1,591,017 1,420,441 1,667,401
Total current assets 252,618,431 249,822,329 260,317,168 212,300,790 184,449,082
LONG-TERM INVESTMENTS Investment accounted for using equity method 18,907,158 22,517,289 15,000,891 10,287,424 9,143,612 Available-for-sales financial assets 2,032,658 1,400,691 6,648,485 117,247 - Held-to-maturity financial assets 15,426,252 8,697,726 28,973,495 28,775,308 - Financial assets carried at cost 3,615,447 3,845,619 3,272,280 3,202,515 - Cost method - - - - 3,266,330 Long-term bonds - - - - 15,170,167 Other investments - - - - 10,521,740
Total long-term investments 39,981,515 36,461,325 53,895,151 42,382,494 38,101,849
PROPERTY, PLANT AND EQUIPMENT Cost
Land and land improvements 953,857 942,197 844,644 851,225 803,508 Buildings 132,249,996 118,640,027 112,595,124 105,832,028 97,882,699 Machinery and equipment 697,498,743 646,419,427 579,825,289 510,922,064 433,130,364 Office equipment 12,430,800 11,829,640 10,646,725 9,670,611 8,538,225 Leased assets 722,339 652,296 612,941 597,669 566,243
843,855,735 778,483,587 704,524,723 627,873,597 540,921,039 Accumulated depreciation (618,816,267) (540,099,567) (463,038,084) (398,124,607) (331,253,866)Advance payments and construction in progress 18,605,882 21,868,167 12,607,551 15,074,302 49,244,153
Net property, plant and equipment 243,645,350 260,252,187 254,094,190 244,823,292 258,911,326
INTANGIBLE ASSETSGoodwill 6,044,392 5,987,582 5,984,993 6,010,601 7,115,510 Deferred charges, net 7,125,828 7,923,601 5,936,915 7,006,250 8,992,452
Total intangible assets 13,170,220 13,911,183 11,921,908 13,016,851 16,107,962
OTHER ASSETSDeferred income tax assets, net 6,636,873 7,313,283 5,802,142 6,788,418 1,649,979 Refundable deposits 2,767,199 2,777,769 1,331,245 106,802 106,448 Others 97,001 327,150 123,355 90,942 127,445 Total intangible assets 9,501,073 10,418,202 7,256,742 6,986,162 1,883,872
TOTAL $ 558,916,589 $ 570,865,226 $ 587,485,159 $ 519,509,589 $ 499,454,091
FINANCIAL STATEMENTS
Taiwan Semiconductor Manufacturing Company Limited and Subsidiaries
Balance Sheets (Consolidated)December 31, 2008 ~ 2004 (In Thousands of New Taiwan Dollars)
(Continued)

2323
2008 2007 2006 2005(1) 2004
LIABILITIES AND SHAREHOLDERS' EQUITYCURRENT LIABILITIES
Short-term bank loans $ - $ - $ - $ 328,500 $ 383,004 Financial liabilities at fair value through profit or loss 85,187 249,313 10,864 234,279 - Notes and accounts payable 5,553,151 11,574,882 7,934,388 9,421,452 7,264,419 Payable to related parties 489,857 1,503,376 1,867,728 1,743,069 2,217,815 Income tax payable 9,331,825 11,126,128 7,946,473 4,015,451 403,955 Bonuses payable to employees, directors and supervisors 15,369,730 - - - - Payable to contractors and equipment suppliers 7,998,773 6,256,732 10,768,591 9,066,036 33,427,702 Accrued expenses and other current liabilities 9,755,835 17,714,763 11,328,350 10,307,951 9,722,413 Current portion of bonds payable and long-term liabilities 8,222,398 280,813 7,004,137 5,489 10,500,000
Total current liabilities 56,806,756 48,706,007 46,860,531 35,122,227 63,919,308
LONG-TERM LIABILITIES
Bonds payables 4,500,000 12,500,000 12,500,000 19,500,000 19,500,000 Long-term bank loans 1,420,476 1,722,196 653,959 663,140 1,915,020 Other long-term payables 9,548,226 9,409,978 8,703,267 8,548,887 7,964,975 Other payables to related parties - - 403,375 1,100,475 2,317,972 Obligations under capital leases 722,339 652,296 612,941 597,669 566,243
Total long-term liabilities 16,191,041 24,284,470 22,873,542 30,410,171 32,264,210
OTHER LIABILITIES
Accrued pension cost 3,701,584 3,665,522 3,540,060 3,474,384 3,101,707 Guarantee deposits 1,484,495 2,243,009 3,817,132 2,896,430 412,881 Deferred credits 316,537 1,236,873 1,177,138 1,343,959 704,991 Others 43,709 43,774 78,640 23,710 9,958
Total other Liabilities 5,546,325 7,189,178 8,612,970 7,738,483 4,229,537
Total Liabilities 78,544,122 80,179,655 78,347,043 73,270,881 100,413,055
EQUITY ATTRIBUTABLE TO SHAREHOLDERS OF PARENT
Capital stock - $10 par valueCommon stock 256,254,373 264,271,037 258,296,879 247,300,246 232,519,637
Capital surplus 49,875,255 53,732,682 54,107,498 57,117,886 56,537,259 Retained earnings
Appropriated as legal capital reserve 67,324,393 56,406,684 43,705,711 34,348,208 25,528,007 Appropriated as special capital reserve 391,857 629,550 640,742 2,226,427 - Unappropriated earnings 102,337,417 161,828,337 152,778,079 106,196,399 88,202,009
170,053,667 218,864,571 197,124,532 142,771,034 113,730,016 Others
Cumulative translation adjustments 481,158 (1,072,853) (1,191,165) (640,742) (2,226,427)Unrealized gain on financial instruments (287,342) 680,997 561,615 - - Treasury stock - (49,385,032) (918,075) (918,075) (1,595,186)
193,816 (49,776,888) (1,547,625) (1,558,817) (3,821,613)Equity attributable to shareholders of the parent 476,377,111 487,091,402 507,981,284 445,630,349 398,965,299
MINORITY INTERESTS 3,995,356 3,594,169 1,156,832 608,359 75,737
Total shareholders' equity 480,372,467 490,685,571 509,138,116 446,238,708 399,041,036
TOTAL $ 558,916,589 $ 570,865,226 $ 587,485,159 $ 519,509,589 $ 499,454,091
Note 1: Balances for 2005 have been reclassified to conform to 2006 presentation. (Concluded)
TSMC 2008 BUSINESS OVERVIEW
2424
FINANCIAL STATEMENTS

2525
Taiwan Semiconductor Manufacturing Company Limited and Subsidiaries
Statements of Income (Consolidated)For the Years Ended December 31, 2008 ~ 2004 (In Thousands of New Taiwan Dollars, Except for Earnings Per Share)
2008 2007(1) 2006(1) 2005(1) 2004(1)
GROSS SALES $ 341,983,355 $ 328,336,172 $ 322,883,499 $ 271,801,696 $ 261,947,351
SALES RETURNS AND ALLOWANCES 8,825,695 5,705,576 5,476,328 5,236,626 4,734,733
NET SALES 333,157,660 322,630,596 317,407,171 266,565,070 257,212,618
COST OF SALES 191,408,099 180,280,385 161,597,081 148,362,196 141,393,435
GROSS PROFIT 141,749,561 142,350,211 155,810,090 118,202,874 115,819,183
OPERATING EXPENSES
Research and development 21,480,937 17,946,322 16,076,432 14,016,506 12,516,434 General and administrative 11,096,599 8,963,836 8,716,653 9,085,536 11,454,374 Marketing 4,736,657 3,718,146 3,752,311 4,132,273 3,366,701
Total operating expenses 37,314,193 30,628,304 28,545,396 27,234,315 27,337,509
INCOME FROM OPERATIONS 104,435,368 111,721,907 127,264,694 90,968,559 88,481,674
NON-OPERATING INCOME AND GAINS
Interest income 5,373,823 5,651,700 4,542,149 2,806,226 1,783,693 Foreign exchange gain, net 1,227,653 80,922 - 2,609,979 - Technical service income 1,181,966 590,391 571,500 462,624 423,804 Settlement income 951,180 985,114 979,214 964,710 - Gain on settlement and disposal of financial assets, net 721,050 874,670 133,489 - 172,493 Equity in earnings of equity method investees, net 701,533 2,507,869 2,347,153 1,433,226 2,094,137 Rental income 166,317 378,643 224,290 847 - Gain on disposal of property, plant and equipment and other
assets 100,874 91,210 421,051 342,756 242,785 Subsidy income 8,029 364,321 334,478 321,850 - Valuation gain on financial instruments, net - 63,017 - - 3,232,672Others 389,024 345,946 285,757 457,142 556,598
Total non-operating income and gains 10,821,449 11,933,803 9,839,081 9,399,360 8,506,182
NON-OPERATING EXPENSES AND LOSSES
Loss on impairment of financial assets 1,560,055 54,208 279,690 128,900 - Valuation loss on financial instruments, net 1,081,019 - 1,745,036 3,778,073 - Interest expense 614,988 842,242 890,602 1,413,374 1,365,916 Loss on impairment of idle assets 210,477 - 44,072 131,849 - Provision for litigation loss 99,126 1,008,635 - - - Loss on settlement and disposal of financial assets, net - - - 161,886 - Foreign exchange loss, net - - 400,863 - 3,036,326 Loss on disposal of property, plant and equipment 589 6,190 241,397 60,109 131,148 Loss on impairment of long-term investments - - - - 350,608 Others 218,317 102,409 139,907 430,481 138,271
Total non-operating expenses and losses 3,784,571 2,013,684 3,741,567 6,104,672 5,022,269
INCOME BEFORE INCOME TAX 111,472,246 121,642,026 133,362,208 94,263,247 91,965,587
INCOME TAX BENEFIT (EXPENSE) (10,949,009) (11,709,626) (7,773,711) (630,579) 363,426
NET INCOME BEFORE CUMULATIVE EFFECT OF CHANGES IN ACCOUNTING PRINCIPLES 100,523,237 109,932,400 125,588,497 93,632,668 92,329,013
CUMULATIVE EFFECT OF CHANGES IN ACCOUNTING PRINCIPLES, NET OF TAX BENEFIT OF NT$82,062 THOUSAND - - 1,606,749 - -
NET INCOME $ 100,523,237 $ 109,932,400 $ 127,195,246 $ 93,632,668 $ 92,329,013
ATTRIBUTABLE TO:
Shareholders of the parent $ 99,933,168 $ 109,177,093 $ 127,009,731 $ 93,575,035 $ 92,316,115 Minority interest 590,069 755,307 185,515 57,633 12,898
$ 100,523,237 $ 109,932,400 $ 127,195,246 $ 93,632,668 $ 92,329,013
EARNINGS PER SHARE (2)
Basic earnings per share $ 3.86 $ 4.06 $ 4.72 $ 3.48 $ 3.43 Diluted earnings per share $ 3.83 $ 4.06 $ 4.72 $ 3.48 $ 3.43
Note 1: Certain accounts have been reclassified to conform to 2008 classifications.Note 2: Retroactively adjusted for capitalization of unappropriated earnings and bonus to employees.

TSMC 2008 BUSINESS OVERVIEW
2626
2008 2007 2006 2005(1) 2004
CASH FLOWS FROM OPERATING ACTIVITIESNet income attributable to shareholders of the parent $ 99,933,168 $ 109,177,093 $ 127,009,731 $ 93,575,035 $ 92,316,115 Net income attributable to minority interests 590,069 755,307 185,515 57,633 12,898 Adjustments to reconcile net income to net cash provided
by operating activitiesDepreciation and amortization 81,512,191 80,005,395 73,715,242 75,649,429 69,818,457 Amortization of premium/discount of financial assets (93,393) (117,159) 2,399 120,872 - Loss on impairment of financial assets 1,560,055 54,208 279,690 128,900 350,608 Loss (gain) on disposal of available-for-sale financial assets, net (637,219) (610,167) (90,826) 150,081 - Gain on disposal of financial assets carried at cost, net (83,831) (264,503) (16,210) (14,721) - Equity in earnings of equity method investees, net (701,533) (2,507,869) (2,347,153) (1,433,226) (2,094,137)Dividends received from equity method investees 1,661,134 625,130 614,567 668,464 - Gain on disposal of investments accounted for using equity
method - - - (583) - Gain on disposal of property, plant and equipment and other
assets, net (100,285) (85,020) (179,654) (282,647) (111,637)Loss on idle assets 210,477 - 44,072 131,849 - Deferred income taxes 2,279,414 943,797 121,590 (3,353,013) (1,058,393)Donation of idle assets - - - 7,207 - Amortization of premium/discount of long-term bond
investments - - - - 28,673 Gain on sales of long-term investments, net - - - - (85,203)Changes in operating assets and liabilities:
Decrease (increase) in:Financial assets and liabilities at fair value through profit or loss 1,412,531 (187,084) 340,176 72,842 - Receivable from related parties 10,478 629,467 440,927 (101,915) 266,067 Notes and accounts receivable 22,180,805 (12,134,176) 8,124,625 (11,572,809) (2,709,261)Allowance for doubtful receivables (246,056) (48,126) (230,706) (3,145) (37,555)Allowance for sales returns and others 1,981,991 1,205,277 (1,446,611) 974,963 1,206,607 Other receivables from related parties 143,702 13,243 341,047 (87,979) (9,847)Other financial assets (425,937) 842,136 (738,745) (305,881) (777,100)Inventories, net 8,985,615 (2,226,106) (3,702,425) (2,006,165) (3,420,613)Prepaid expenses and other current assets (443,462) 290,434 (170,576) 119,985 (34,493)
Increase (decrease) in:Notes and accounts payables (6,021,731) 3,218,255 (1,487,064) 2,088,582 825,815 Payable to related parties (1,013,519) (375,731) (572,441) (1,629,217) (1,499,968)Income tax payable (1,794,303) 3,179,655 3,931,022 3,611,486 266,526 Bonuses payable to employees, directors and supervisors 15,369,730 - - - - Accrued expenses and other current liabilities (3,954,427) 913,872 862,428 181,748 (602,911)Accrued pension cost 36,062 125,462 65,676 360,128 500,257 Deferred credits (858,161) 343,878 (99,310) 117,335 -
Net Cash Provided by Operating Activities 221,493,565 183,766,668 204,996,986 157,225,238 153,150,905
CASH FLOWS FROM INVESTING ACTIVITIESAcquisitions of :
Property, plant and equipment (59,222,654) (84,000,985) (78,737,265) (79,878,724) (81,094,557)Available-for-sale financial assets (85,273,867) (87,550,197) (119,291,685) (99,436,242) - Held-to-maturity financial assets (16,523,275) - (18,554,027) (14,199,142) - Investments accounted for using equity method (55,871) (5,803,826) (2,613,009) (621,883) - Financial assets carried at cost (463,211) (911,323) (511,632) (456,897) - Long-term investments - - - - (23,054,379)
Proceeds from sales of:Available-for-sale financial assets 138,515,023 94,908,666 91,620,367 102,577,763 - Held-to-maturity financial assets 15,634,620 17,325,120 10,410,000 14,595,394 - Financial assets carried at cost 199,424 410,465 126,465 76,186 - Investments accounted for using equity method - - - 65,076 - Long-term investments - - - - 165,243 Property, plant, and equipment and other assets 194,940 60,535 518,705 480,707 1,812,633
Increase in short-term investments - - - - (43,554,878)Proceeds from return of capital by investees 2,345,867 - - - - Increase in deferred charges (3,395,287) (3,059,155) (1,414,742) (855,967) (2,405,673)
Taiwan Semiconductor Manufacturing Company Limited and Subsidiaries
Statements of Cash Flows (Consolidated)For the Years Ended December 31, 2008 ~ 2004 (In Thousands of New Taiwan Dollars)
FINANCIAL STATEMENTS
(Continued)
2727
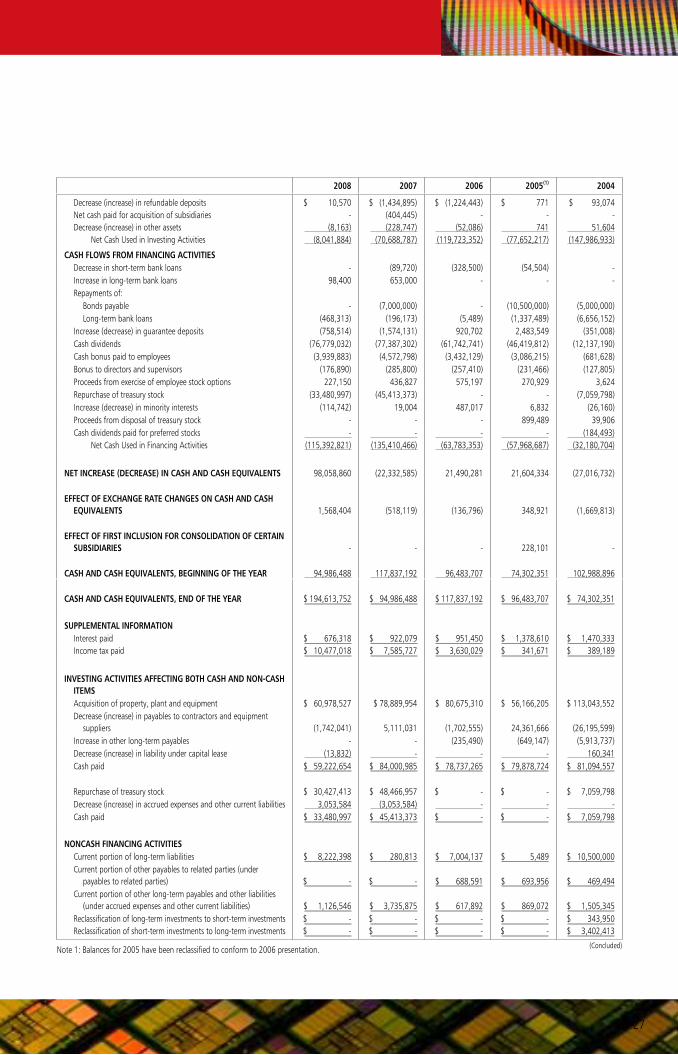
2008 2007 2006 2005(1) 2004
Decrease (increase) in refundable deposits $ 10,570 $ (1,434,895) $ (1,224,443) $ 771 $ 93,074 Net cash paid for acquisition of subsidiaries - (404,445) - - - Decrease (increase) in other assets (8,163) (228,747) (52,086) 741 51,604
Net Cash Used in Investing Activities (8,041,884) (70,688,787) (119,723,352) (77,652,217) (147,986,933)
CASH FLOWS FROM FINANCING ACTIVITIESDecrease in short-term bank loans - (89,720) (328,500) (54,504) - Increase in long-term bank loans 98,400 653,000 - - - Repayments of:
Bonds payable - (7,000,000) - (10,500,000) (5,000,000)Long-term bank loans (468,313) (196,173) (5,489) (1,337,489) (6,656,152)
Increase (decrease) in guarantee deposits (758,514) (1,574,131) 920,702 2,483,549 (351,008)Cash dividends (76,779,032) (77,387,302) (61,742,741) (46,419,812) (12,137,190)Cash bonus paid to employees (3,939,883) (4,572,798) (3,432,129) (3,086,215) (681,628)Bonus to directors and supervisors (176,890) (285,800) (257,410) (231,466) (127,805)Proceeds from exercise of employee stock options 227,150 436,827 575,197 270,929 3,624 Repurchase of treasury stock (33,480,997) (45,413,373) - - (7,059,798)Increase (decrease) in minority interests (114,742) 19,004 487,017 6,832 (26,160)Proceeds from disposal of treasury stock - - - 899,489 39,906 Cash dividends paid for preferred stocks - - - - (184,493)
Net Cash Used in Financing Activities (115,392,821) (135,410,466) (63,783,353) (57,968,687) (32,180,704)
NET INCREASE (DECREASE) IN CASH AND CASH EQUIVALENTS 98,058,860 (22,332,585) 21,490,281 21,604,334 (27,016,732)
EFFECT OF EXCHANGE RATE CHANGES ON CASH AND CASH EQUIVALENTS 1,568,404 (518,119) (136,796) 348,921 (1,669,813)
EFFECT OF FIRST INCLUSION FOR CONSOLIDATION OF CERTAIN SUBSIDIARIES - - - 228,101 -
CASH AND CASH EQUIVALENTS, BEGINNING OF THE YEAR 94,986,488 117,837,192 96,483,707 74,302,351 102,988,896 CASH AND CASH EQUIVALENTS, END OF THE YEAR $ 194,613,752 $ 94,986,488 $ 117,837,192 $ 96,483,707 $ 74,302,351
SUPPLEMENTAL INFORMATIONInterest paid $ 676,318 $ 922,079 $ 951,450 $ 1,378,610 $ 1,470,333 Income tax paid $ 10,477,018 $ 7,585,727 $ 3,630,029 $ 341,671 $ 389,189
INVESTING ACTIVITIES AFFECTING BOTH CASH AND NON-CASH ITEMSAcquisition of property, plant and equipment $ 60,978,527 $ 78,889,954 $ 80,675,310 $ 56,166,205 $ 113,043,552 Decrease (increase) in payables to contractors and equipment
suppliers (1,742,041) 5,111,031 (1,702,555) 24,361,666 (26,195,599)Increase in other long-term payables - - (235,490) (649,147) (5,913,737)Decrease (increase) in liability under capital lease (13,832) - - - 160,341 Cash paid $ 59,222,654 $ 84,000,985 $ 78,737,265 $ 79,878,724 $ 81,094,557
Repurchase of treasury stock $ 30,427,413 $ 48,466,957 $ - $ - $ 7,059,798 Decrease (increase) in accrued expenses and other current liabilities 3,053,584 (3,053,584) - - - Cash paid $ 33,480,997 $ 45,413,373 $ - $ - $ 7,059,798
NONCASH FINANCING ACTIVITIESCurrent portion of long-term liabilities $ 8,222,398 $ 280,813 $ 7,004,137 $ 5,489 $ 10,500,000 Current portion of other payables to related parties (under
payables to related parties) $ - $ - $ 688,591 $ 693,956 $ 469,494 Current portion of other long-term payables and other liabilities
(under accrued expenses and other current liabilities) $ 1,126,546 $ 3,735,875 $ 617,892 $ 869,072 $ 1,505,345 Reclassification of long-term investments to short-term investments $ - $ - $ - $ - $ 343,950 Reclassification of short-term investments to long-term investments $ - $ - $ - $ - $ 3,402,413
Note 1: Balances for 2005 have been reclassified to conform to 2006 presentation. (Concluded)

TSMC 2008 BUSINESS OVERVIEW
2828
Corporate Headquarters & Fab 128, Li-Hsin Rd. 6, Hsinchu Science Park, Hsinchu Taiwan 300-77, R.O.C.Tel: 886-3-5636688 Fax: 886-3-5637000
Fab 2, Fab 5121, Park Ave. 3, Hsinchu Science Park, Hsinchu Taiwan 300-77, R.O.C.Tel: 886-3-5636688 Fax: 886-3-5781546
Fab 39, Creation Rd. 1, Hsinchu Science Park, Hsinchu Taiwan 300-77, R.O.C.Tel: 886-3-5636688 Fax: 886-3-5781548
Fab 61, Nan-Ke North Rd., Tainan Science Park, Tainan Taiwan 741-44, R.O.C.Tel: 886-6-5056688 Fax: 886-6-5052057
Fab 825, Li-Hsin Rd., Hsinchu Science Park, HsinchuTaiwan 300-77, R.O.C.Tel: 886-3-5636688 Fax: 886-3-5662051
Fab 141-1, Nan-Ke North Rd., Tainan Science Park, Tainan Taiwan 741-44, R.O.C.Tel: 886-6-5056688 Fax: 886-6-5051262
TSMC North America2585 Junction Avenue, San Jose, CA 95134, U.S.A.Tel: 408-3828000 Fax: 408-3828008
TSMC Europe B.V.World Trade Center, Zuidplein 60, 1077 XV Amsterdam The NetherlandsTel: 31-20-3059900 Fax: 31-20-3059911
TSMC Japan Limited21F, Queen’s Tower C, 2-3-5, Minatomirai, Nishi-ku Yokohama, Kanagawa 220-6221, JapanTel: 81-45-6820670 Fax: 81-45-6820673
TSMC China Company Limited*4000, Wen Xiang Road, Songjiang, Shanghai, ChinaPostcode: 201616Tel: 86-21-57768000 Fax: 86-21-57762525* TSMC (Shanghai) Company Limited changed its name to
TSMS China Company Limited beginning February 4, 2009.
TSMC Korea Limited15F, AnnJay Tower, 718-2, Yeoksam-dong, Gangnam-gu Seoul135-080, KoreaTel: 82-2-20511688 Fax: 82-2-20511669
TSMC Liaison Office in India1st Floor, Pine Valley, Embassy Golf-Links Business Park Bangalore-560071, IndiaTel: 91-99809-91826 91-80-41768615 Fax: 91-80-41764568
TSMC SpokespersonName: Lora HoTitle: Vice President & CFOTel: 886-3-5664602 Fax: 886-3-5670121Email: [email protected]
TSMC Deputy SpokespersonName: J.H. TzengTitle: Deputy Director, Public RelationsTel: 886-3-5055028 Fax: 886-3-5670121Email: [email protected]
TSMC Investor RelationsName: Elizabeth SunTitle: Director, Investor RelationsTel: 886-3-5682085 Fax: 886-3-5797337Email: [email protected]
AuditorsCompany: Deloitte & ToucheAuditors: Hung-Peng Lin, Shu-Chieh HuangAddress: 12F, 156, Sec. 3, Min-Sheng E. Rd., Taipei Taiwan 105-96, R.O.C.Tel: 886-2-25459988 Fax: 886-2-25459966Website: http://www.deloitte.com.tw
Common Share Transfer Agent and RegistrarCompany: The Transfer Agency Department of Chinatrust Commercial BankAddress: 5F, 83, Sec. 1, Chung-Ching S. Rd., Taipei Taiwan 100-08, R.O.C.Tel: 886-2-21811911 Fax: 886-2-23116723Website: http://www.chinatrust.com.tw
ADR Depositary BankCompany: Citibank, N.A.Depositary Receipts ServicesAddress: 388 Greenwich Street, New York, NY10013, U.S.A.Website: http://www.citi.com/drTel: 1-877-2484237 (toll free)Tel: 1-781-5754555 (out of US)Fax: 1-201-3243284E-mail: [email protected]’s depositary receipts of the common shares are listed on New York Stock Exchange (NYSE) under the symbol TSM. The information relating to TSM is available at http://www.nyse.com and http://newmops.tse.com.tw
CONTACT INFORMATION
Copyright © 2009 by Taiwan Semiconductor Manufacturing Company, Ltd. All rights reserved.
CONTACT INFORMATION

Safe Harbor Notice:
The statements included in this business overview that are not historical in nature are "forward-looking statements" within the meaning of the “safe harbor“ provisions of the Private Securities Litigation Reform Act of 1995. TSMC cautions readers that forward-looking statements are subject to significant risks and uncertainties and are based on TSMC’s current expectations. Actual results may differ materially from those contained in such forward-looking statements for a variety of reasons including, among others, risks associated with cyclicality and market conditions in the semiconductor industry; demand and supply for TSMC’s foundry manufacturing capacity in particular and for foundry manufacturing capacity in general; intense competition; the failure of one or more significant customers to continue to place the same level of orders with us; TSMC’s ability to remain a technological leader in the semiconductor industry; TSMC’s ability to manage its capacity; TSMC’s ability to obtain, preserve and defend its intellectual property rights; natural disasters and other unexpected events which may disrupt production; and exchange rate fluctuations. Additional information as to these and other risk factors that may cause TSMC’s actual results to differ materially from TSMC’s forward-looking statements may be found in TSMC’s Annual Report on Form 20-F, filed with the United States Securities and Exchange Commission (the “SEC”) on April 17, 2009, and such other documents as TSMC may file with, or submit to, the SEC from time to time. Except as required by law, we undertake no obligation to update any forward-looking statement, whether as a result of new information, future events, or otherwise.
TSMC 2008 BUSINESS OVERVIEW
8, Li-Hsin Rd. 6, Hsinchu Science Park, Hsinchu, Taiwan 300-77, R. O. C.Tel: 886-3-5636688 Fax: 886-3-5637000
http://www.tsmc.com