tropospheric no2 and ozone ronald van der a, michel van roozendael, isabelle de smedt, jos de laat,...
TRANSCRIPT

Tropospheric NO2 and ozone
Ronald van der A, Michel Van Roozendael, Isabelle De Smedt, Jos de Laat, Ruud Dirksen,
Folkert Boersma
KNMI and BIRA-IASB
Thessaloniki, May 2008

Tropospheric NO2

Tropospheric NO2 from satellite measurements
• Observed total slant column• Subtract stratospheric part (model)• Convert slant column into vertical column (air mass factor, RT)
Surface
Stratospheric NO2
CloudTropospheric NO2

Retrieval approach
• CTM (TM4) Assimilation fed by satellite measurements (unpolluted pixels only) and ECMWF data gives:
•Estimation of stratospheric column
•A priori NO2 profile AMFtrop
• Surface albedo + cloud info + a priori profile AMFtrop
• Measured column + stratospheric column + AMFtrop
Tropospheric NO2 column
trop
stratobstrop AMF
SSV

1: TM4 forecast
How does it work?
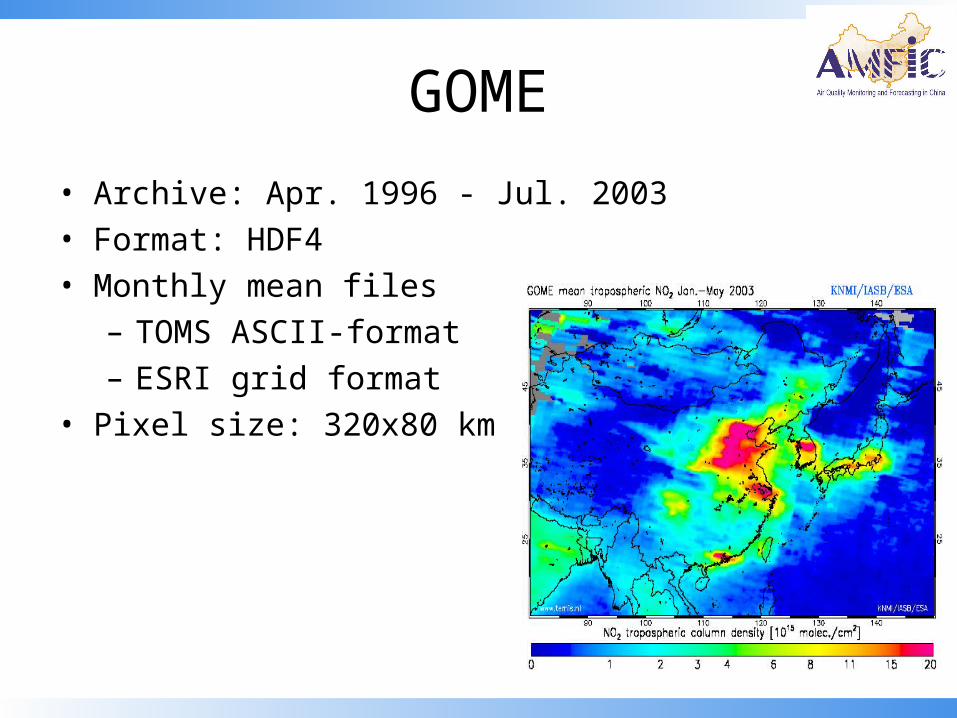
GOME
• Archive: Apr. 1996 - Jul. 2003 • Format: HDF4• Monthly mean files
– TOMS ASCII-format– ESRI grid format
• Pixel size: 320x80 km

SCIAMACHY• version 1.1: July 2002 till today• version 1.1 uses FRESCO+• Format: HDF4• Monthly mean files:
– TOMS ASCII-format– ESRI grid format– Regional images
• Pixel size is 60x30 km

OMI
• L1b reprocessing of entire mission completed• version 1.1: October 2004 till March 2008• NRT processing has to be updated
• Format: HDF5• Monthly mean files
– TOMS ASCII-format– ESRI grid format
• Pixel size: > 24x12 km

GOME-2
• Data available: April 2007 till today• NRT processing is operational
• Format: HDF5• Monthly mean files
– TOMS ASCII-format– ESRI grid format
• Pixel size: 30x60 km

Based on monthly averaged NO2 columns from GOME (1996-2003) and SCIAMACHY (2003-2006) measurements.
Large increase of NO2 over industrial and economical areas of eastern China.
Trend detection of tropospheric NO2 over China
van der A et al., J. Geophys. Res., 111, 2006
Mean NO2
1996
Trend(%/yr)
Error on
trend
Beijing 11.1 11 3
Shanghai 5.2 25 5
Chongqing
3.8 12 3
ShenYang 4.5 16 6
Seoul 10.4 1.3 1

NO2 correlated with vehicles population during 1996~2006 in Beijing (top) and Shanghai (bottom)
0.0
30.0
60.0
90.0
120.0
150.0
180.0
210.0
240.0
270.0
300.0
1996 1997 1998 1999 2000 2001 2002 2003 2004 2005 2006Year
Ca
r a
mo
un
t
(m
illi
on
)
0.0
5.0
10.0
15.0
20.0
25.0
NO 2 v
ertic
al
co
lum
n a
mo
un
t
(×
1015 m
ole
cu
les c
m- 2
)
Car amount
NO2 volumn amount
0.0
30.0
60.0
90.0
120.0
150.0
180.0
210.0
240.0
1996 1997 1998 1999 2000 2001 2002 2003 2004 2005 2006
Year
veh
icle
am
ou
nt
(m
illion
)
0.0
5.0
10.0
15.0
20.0
25.0
30.0
Tro
pospheri
c N
O2 concentr
ation
(101
5 mole
c/c
m2 )
Vehicle amount
Tro NO2

OMI
Concurrent measurements of tropospheric NO2 from OMI and SCIAMACHY
• Retrieved with common, consistent algorithm
• Collocated, cloud-free measurements at common grid (0.5°x0.5°)
• Differences large over source regions, and larger than combined errors
• Differences in spectra (slant columns) and in AMF (profile shape)
10:00 hrs SCIAMACHY
13:40 hrs OMI
August 2006


What does GEOS-Chem simulate?
Relative decrease in NO2 column from 10am to 1:30 pm
Observed GEOS-Chem
US: -16% -28%
EU: -6% -13%
China: -26% -22%

200320052001
20042002
Biomass burning mainly in afternoon
Jun Wang
Relative increase in NO2 column from 10am to 1:30 pm
Observed GEOS-Chem
Africa: +48% +16%
Indon.: +60% +10%
Brazil: +54% +13%

Summary Tropospheric NO2
GOME/SCIAMACHY NO2 data available for 1996-today, allowing trend analysis.
OMI data (based on collection 3) and GOME-2 is also available now.
Monitoring of China with SCIAMACHY/GOME-2 (overpass at 10.00/9.30 AM ) and OMI (overpass at 13.30 PM)
Data for China will soon be presented on the AMFIC web site.

GOME tropospheric O3 columns
J. de Laat, R. van der A, M. van Weele, R. van Oss, O. Tuinder, B. Mijling and
A. Segers.
Royal Dutch Meteorological Institute (KNMI)

Measuring tropospheric O3 column from space
- air pollution/air quality & greenhouse gas
- Stratosphere > 90 % of total O3 column- Troposphere < 10 % of total O3 column
- Tropospheric O3 is highly variable in space and time:
- Global: - in situ production (tropics and extra-tropics)
- complex chemistry
- Extratropics: - Stratosphere-troposphere exchange
- Tropopause height variations
- Clouds, aerosols (interpretation)

Method Satellite Geographical location
Time resolution
Fishman et al. 1996
TOR TOMS/SBUV Tropics Monthly means
Kim et al. 1996 WAVE 1 TOMS Tropics Monthly means
Hudson and Thompson 1998
MRM TOMS Tropics Monthly means (15 –days)
Munro et al. 1998 GOME Global ??
Ziemke et al. 1998
CCD TOMS Tropics Monthly means
Ziemke et al. 1998
TOMS/MLS/HALOE Tropics Monhtly means
Fishman and Balok 1999
TOR TOMS/SBUV TropicsMid-latitudes (- 50°N)
Monthly means
Kim et al. 2001 SCAN-ANGLE TOMS Tropics Monthly means
Newchurch et al. 2001
LTO TOMS Mountains Monthly means
Fishman et al. 2003
TOR TOMS/SBUV TropicsMid-latitudes
Monthly means
Newchurch et al. 2003
CCP TOMS Tropics Monthly means
Liu et al. 2005 Direct GOME Global Daily
Previous work

Limited height information
[Degrees of Freedom for Signal]
About 5 independent pieces of vertical
information Smoothing of actual profile !!
about 1 piece of tropospheric information [cf. Liu et al., JGR, 2005]
separate troposphere – stratosphere !!!
Directly measuring tropospheric O3 from space:
GOME OPERA algorithm (Ozone ProfilE Retrieval Algorithm)
Tuinder, Van der A, van Oss, Mijling [KNMI]
Non-linear Optimal Estimation [Rodgers], iterative, use of a-priori
Courtesy J. Landgraf, SRON

New approach: data assimilation
Determine SOC by assimilating OPERA O3 profiles using CTM (TM5)
Then: TTOC = TOC - SOC
Advantages:
- No gaps in SOC internal consistency- Better solution for “smoothing error”- Internally consistent tropopause- different O3 (profile) measurements can be used and even combined
Best available estimate of SOC

This figure was originally published in Liu et al. [JGR, 2006]. The upper panel shows the tropospheric O3 columns from GOME O3 profiles for a region over Indonesia in 1997 (7S, 110-125E). Added are also results from a chemistry-transport model calculation (GEOS-CHEM) with realistic emissions and nearby O3 sonde measurements. The lower panel is for a region over the central Pacific.
Added are the black lines: the GOME TOC values from the KNMI OPERA algorithm.
Algorithm development and current status• Assimilation system/algorithm development
– Several problems in the system and algorithm – hampering long assimilation runs – were detected
– Slow progress of solving problems due to long duration of assimilation runs to test stability
– In the mean time …• OPERA algorithm was also considerably improved (Tuinder and Mijling)• New linearized strat. O3 chemistry scheme published
• Current status– Stable assimilation algorithm– 6 test runs with different settings performed for year 2000:– 1 run (iterative assimilation, Cariole v2.1) for 1996 to 2001, currently running
year 2001 [1996-2000 are finished]
• Height depend error propagation in the assimilation included