tropospheric aerosol optical properties derived from lidar, sun photometer, and optical particle...
TRANSCRIPT

Tropospheric aerosol optical propertiesderived from lidar, sun photometer, and opticalparticle counter measurements
Tamio Takamura, Yasuhiro Sasano, and Tadahiro Hayasaka
Tropospheric aerosols have been observed for the period from November 1990 to April 1992 with a lidar, asun photometer, and an optical particle counter. Variations of aerosol optical thickness derived from thelidar and the sun photometer data and measurements are presented. The simultaneous measurementsof these instruments also allowed us to estimate the extinction-to-backscatter ratio (S1), which rangedfrom 20 to 70. Comparison of optical thicknesses derived from both instruments clearly shows the effectof Mt. Pinatubo's eruption and the temporal variation of optical thickness in the stratosphere over 12km. The possible range of the complex refractive index for the columnar mean aerosols can be deducedfrom the probable range of Si derived by the use of an S1 diagram as a function of complex refractive index(m). The imaginary part of m can be estimated provided that the real part of m is known.
Key words: Aerosol optical thickness, extinction-to-backscatter ratio, complex refractive index.
1. Introduction
Tropospheric aerosols play an important role in ourclimate because of their attribution to cloud forma-tions and sunlight attenuations. Depending on vari-ous generating sources, tropospheric aerosols mayvary greatly in both time and space. Several modelsfor the study of the optical properties of the loweratmospheric aerosols have been developed.",2However, the optical properties of aerosols, governedby physical parameters such as particle density andsize distribution, have not yet been well character-ized.
Developments in modern lidar technology haveprovided a better understanding of aerosol behaviors.Laser lights are emitted from a lidar into the atmo-sphere for remote sounding of the time-varying three-dimensional distribution of aerosols. The backscat-tered light detected by the lidar is processed andanalyzed to derive relevant optical properties of aero-
T. Takamura is with the Department of Geoscience, The Na-tional Defense Academy, Yokosuka 239, Japan; Y. Sasano is withthe Global Environment Division, National Institute for Environ-mental Studies, Tsukuba 305, Japan; and T. Hayasaka is with theCenter for Atmospheric and Oceanic Studies, Tohoku University,Sendai 980, Japan.
Received 26 October 1993; revised manuscript received 16 May1994.
0003-6935/94/307132-09$06.00/0.a 1994 Optical Society of America.
sols. The useful applications of lidar measurementshave been revealed by the past two large volcaniceruptions of El Chichon, Mexico, in 1982 and Mt.Pinatubo, the Philippines, in 1991. Through lidarmeasurements we obtained useful information thatvolcanic clouds in the stratosphere,3 -7 generated fromthe above eruptions, were widely transported andextended globally.
Because the measurements from the lidar containbackscatter and extinction information simulta-neously, it is difficult to derive optical parameterssuch as extinction coefficient quantitatively from onlylidar measurements. To characterize optical proper-ties of aerosols quantitatively, different ways of mea-surement are required as a supplement to the lidarmeasurements. In our case, sun photometry mea-surements were taken to supplement the lidar mea-surements because sun photometry measurementsprovided columnar aerosol optical thickness as well asindependently measured particle size distribution.In addition to the lidar and sun photometer measure-ments, optical particle counter (OPC) measurementswere also taken. These measurements were made atthe National Institute for Environmental Studies(NIES) in Tsukuba, Japan (36.05 N, 140.08° E),during the periods from January 1990 to March 1992for the lidar and from November 1990 to April 1992for the sun photometer. Moreover, supplementalmeasurements with the sun photometer were alsomade at the National Defense Academy (NDA) in
7132 APPLIED OPTICS / Vol. 33, No. 30 / 20 October 1994

Yokosuka, Japan (35.2° N, 139.8 S), during theperiod from November 1990 to July 1992.
The purpose of this paper is to derive an extinction-to-backscatter ratio and a complex refractive index ofaerosols with the data from the three measurements.Variations of optical thickness before and after theMt. Pinatubo eruption for tropospheric and strato-spheric aerosols are also presented.
The lidar, sun photometer, and OPC measure-ments and related data processings are described inSection 2. In Section 3, using the data from the lidarand the sun photometer measurements, we firstdescribe the trend in aerosol optical thickness fromthe winter of 1990-1991 to the spring of 1992. Wethen present a detailed analysis of the extinction-to-backscatter ratio for the aerosols in the lower atmo-sphere with the data from the simultaneous measure-ments of the lidar and the sun photometer. Thecomplex refractive index of aerosols can be derived ifthe data from the OPC measurements are combinedwith the analysis of the extinction-to-backscatterratios. Various points of discussion are also pre-sented in Section 3. Finally, a short summary ispresented in Section 4.
2. Measurements and Data Processing
Data obtained from a lidar, a sun photometer, and anOPC are analyzed in this paper. Some main charac-teristics of the instruments used in the present studyare summarized in Table 1. All the observationswere performed on cloud-free days or on days witheffectively no clouds at the observation site.
A. Lidar
A lidar at a wavelength of 532 nm was used for themeasurements. The lidar was operating in a rangeheight indicator scanning mode, which permitted thelaser beams to scan the atmosphere vertically andmeasure vertical distributions of the aerosols. Thescanning period, from the horizontal direction to thezenith, was approximately 10 min. Approximately15,000 laser pulses were emitted during each 10-minscanning period. The returned signals were sampledevery 100 ns and digitized with an 8-bit, analog-digital converter. The digitized signals were storedon magnetic tapes and sent to a large computersystem (HITAC-680) for processing and detailed analy-sis. The lidar measurements were conducted for 94days during the period from January 1990 to March1992. All the measurements were made at 1000,1300, and 1600 h and on days with good weather
Table 1. Summary of Instruments Used
Lidar Sun Photometer Particle Counter (OPC)
532 nm (YAG) 500 nm (Filter) 0.12 p1m-over 6.12 pSm(nominal 16 stages)
0-12 km Column Near surface1000 h, 1300 h, Continuous (with Sun Continuous
1600 h follower)Toshiba EKO MS-120 HIAC/ROYCO LAS236
conditions. The sun photometer and the OPC werecontinuously operated from 0900 to 1700 h to moni-tor any changes in the atmospheric conditions.
A scheme based on Fernald's algorithm8 and devel-oped by Sasano and Nakane9 was adopted for our dataanalysis. In this method a vertical distribution ofaerosols down to the lidar level is retrieved forestimation of the extinction coefficient. In our experi-ment the lidar level was set at 34 m above groundlevel. There is a great advantage to using the methodof Sasano and Nakane. The reason is that ground-based, vertically pointed lidar usually cannot coverthe near-range regions because of insufficient over-laps of the laser beams and the fields of view of areceiving telescope.
To adopt the second scheme described by Sasanoand Nakane9 in our analysis, we have made thefollowing assumptions: (1) optical properties of aero-sols are homogeneous in both the horizontal andvertical directions and (2) aerosols are distributedinhomogeneously around a constant value at eachaltitude in the horizontal direction and are inhomoge-neous in the vertical direction.
Fernald's scheme requires that we treat the extinc-tion-to-backscatter ratio (SI) as an external param-eter and a boundary condition. The boundary condi-tion can be inferred if we assume the existence of anaerosol-free layer somewhere in the region of interestand apply the matching method.' 0 We determinedthe aerosol-free layer by searching the level of theminimum extinction coefficient with the iterativeprocess. Therefore the retrieved results depend ononly the value of S,. In the present analysis lidardata were analyzed for nine cases by assigning 10,20,..., 90 as SI." It is noted that the matchingmethod may underestimate the aerosol contribution,especially when aerosol loading in the upper atmo-sphere cannot be negligible, as in such cases as afterthe Mt. Pinatubo eruption.
Signals received from the lidar range of 5 to 12 kmwere analyzed. The selection of 5 km as the limita-tion for the near range was made to avoid currentsaturation in the photomultiplier tube of the lidar.The lidar measurements were made in the daytimewith relatively fast-scanning laser beams (not manylaser pulses were emitted for each direction). Thesetwo factors will result in a very low signal-to-noiseratio for the return signals backscattered from alti-tudes higher than 12 km. For this reason we haveselected 12 km as the limitation for the far range.Aerosol extinction coefficient profiles derived fromour analysis are integrated from ground level to 12km to yield the optical thickness of troposphericaerosols.
B. Sun Photometer
Optical thickness caused by aerosols was also derivedindependently from direct solar radiation measure-ments by the use of a sun photometer. The accuracyof the sun photometer was maintained at a high levelthrough periodical calibrations by comparing the first
20 October 1994 / Vol. 33, No. 30 / APPLIED OPTICS 7133

sun photometer with another well-calibrated sunphotometer or by applying the Langley method.12
Because the wavelength (500 nm) of the sun photom-eter used is slightly different from that of the idar(532 nm), we corrected the optical thickness mea-sured from the sun photometer by multiplying it by0.94, under an assumption that the aerosol opticalthickness is proportional to the inverse of the wave-length. A comparison between the optical thick-nesses from the lidar and the sun photometer makesit possible to estimate a columnar mean value of S,when the contribution of aerosols over 12 km inaltitude is negligible and the aerosol particles areassumed to be homogeneous in space.
The sun photometer measurements were madefrom November 1990 to April 1992 at NIES, Tsukuba,and from November 1990 to July 1992 at NDA,Yokosuka. The data indicating the existence ofclouds were carefully selected or discarded from thepresent analysis.
C. OPC
During the lidar experiments from November 1990 toMarch 1992, aerosol number density and size distribu-tion were also monitored with an OPC. The OPCwas located on the outer deck of the seventh floor of abuilding for the lidar experiments. The OPC per-formed continuous samplings of aerosols from whichthe size distribution during the lidar observation wasextracted and averaged. The OPC uses light-scatter-ing technique to measure the size spectrum of theoptically effective particles, which usually rangesfrom approximately 0. um to several micrometers inradius. Optically measured particle sizes depend onthe complex refractive index of aerosols. Size distri-butions obtained directly with the optical instrumentare equivalent to those calibrated with a knownrefractive index of m = 1.60 and no absorption forpolystyrene latex spheres. Because real aerosols mayhave a refractive index different from that of thecalibration, it is necessary to correct the size distribu-tion with a refractive index for actual aerosols, whichin this case is an unknown parameter.
Assuming that the aerosols are homogeneous,spherical particles, we can use the Mie theory ofscattering to estimate the extinction coefficient andthe extinction-to-backscatter ratio (). For correc-tion of the observed size distribution, we assume thefollowing combinations for the real (mr) and theimaginary (mi) parts of the refractive indices:
mr: 1.35 (0.05) 1.70,
mi: 0.0, -0.005, -0.01, -0.02, -0.03, -0.05,
-0.08, -0.1,
where (1.35, 0.0) was replaced with (1.34, 0.0). Forthe cases of mr = 1.35 and 1.40, no calculation withmi = -0.08 and -0.1 was made.
When the size distribution is bimodal, a particlesource for each mode maybe different. 2 The smallermode (hereafter the small mode) may consist of
particles generated by a gas-to-particle conversionprocess. These particles may contain anthropogenicpollution materials, including elemental carbons.The larger mode (hereafter the large mode) consistsmainly of aerosols from natural sources such as soilparticles and sea salt particles. In this analysis wedefine small-mode aerosols as those obtained fromchannel 5 (0.31 to 0.44 ALm in nominal radius) andbelow. Large-mode aerosols were defined as thosefrom channel 6 (0.44 to 0.59 ALm) and above.
In our derivation for optical information from theobserved size distribution, we used the complex refrac-tive indices listed above for the small mode. For thelarge mode we have assumed in all cases a constantvalue of m = 1.55 - 0.005i for the complex refractiveindices. Our assumption for this case seems to bevalid because the large mode is known to consistmainly of natural particles, and the assumed value ofm referred to is from Deepak and Gerber2 andTakamura et al.'3 The data used for the presentanalysis were all obtained in the daytime in fairweather conditions favorable to lidar measurements.Therefore it is expected that aerosols close to theEarth's surface were well mixed and homogeneouslydistributed in the lower atmosphere.
3. Results and Discussion
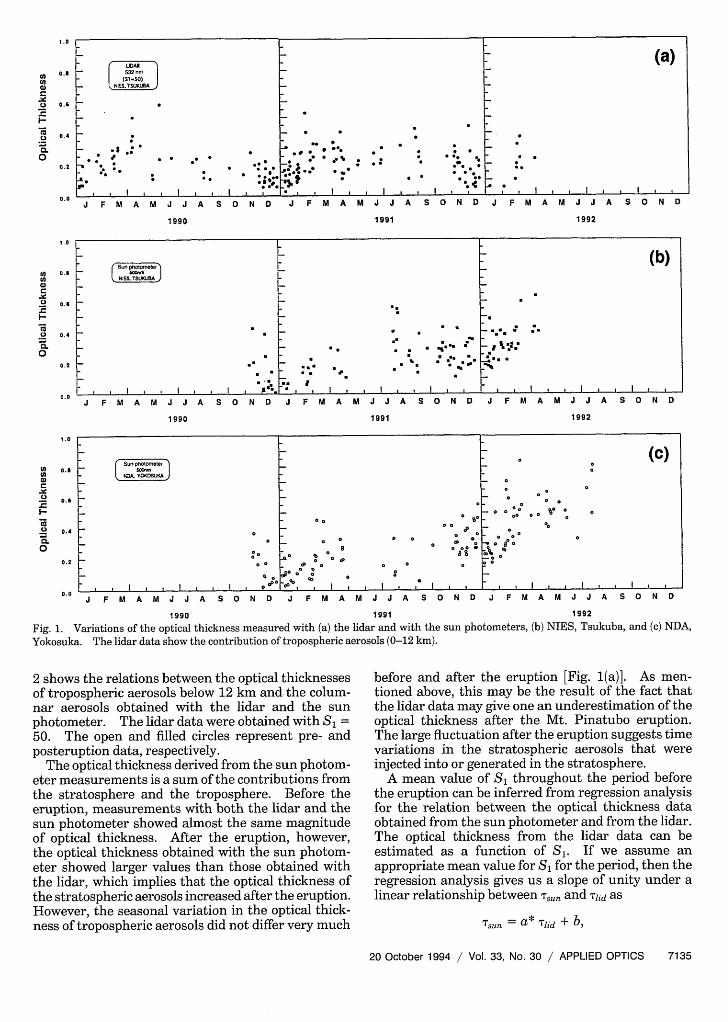
A. Optical Thickness Variations and AverageExtinction-to-Backscatter RatioVariations of aerosol optical thickness derived fromthe lidar and the sun photometer measurements fromlate autumn of 1990 are shown in Fig. 1. The lidardata shown in Fig. 1(a) were analyzed with S, = 50.The aerosol optical depth for the troposphere (0-12km) shows a distinct seasonal variation; i.e., in everywinter optical thickness became smaller comparedwith other seasons. This agrees with the resultsderived from pyrheliometer measurements by Yama-moto et al.'4 and aureolemeter measurements byShiobara et al.'5 The columnar optical thicknessdata from the sun photometer measurements atdifferent sites [Figs. 1(b) and 1(c)] show a similartendency, although NIES [Fig. 1(b)] is located approxi-mately 60 km northeast of Tokyo and NDA [Fig. 1(c)]is located approximately 35 km south of Tokyo. Itshould be noted that the minimum level of columnaroptical thickness during the 1991-1992 winter didnot recover to the same level as during the 1990-1991winter. The reason for this is heavy loading ofaerosols in the stratosphere from Mt. Pinatubo'seruption in June 1991. The NDA sun photometerdata were presented just to demonstrate the similarchanges found at two locations approximately 100 kmapart. The sun photometer data used in the follow-ing analysis were all obtained at NIES.
All the measurement data were categorized intotwo parts, one before and the other after the eruptionof Mt. Pinatubo, because the optical thickness ofaerosols in the stratosphere was almost negligiblebefore the eruption, whereas the stratospheric aero-sols suddenly increased after the eruption.16,17 Figure
7134 APPLIED OPTICS / Vol. 33, No. 30 / 20 October 1994
1.0
0
a
.)
.
0
0.5
0.6
0.4
0.2
0.0
1.0
'IOna)a
.2
0
0.I
0.6
0.4
0.2
0.0
1.0
01
-a0
0
0.S
0.6
0.4
0.2
0.0
UDA.11~~~~~~~~~~~~~~~~~~a
* 0 *~~~s~ t990 0910199
J F MA MJ JA SO0N D J F MA MJ JA SO0N D J F MA MJ JA SN D
1990 1991 1992
Fig. 1. Variations of the optical thickness measured with (a) the lidar and with the sun photometers, (b) NIES, Tsukuba, and (c) NDA,Yokosuka. The lidar data show the contribution of tropospheric aerosols (0-12 kin).
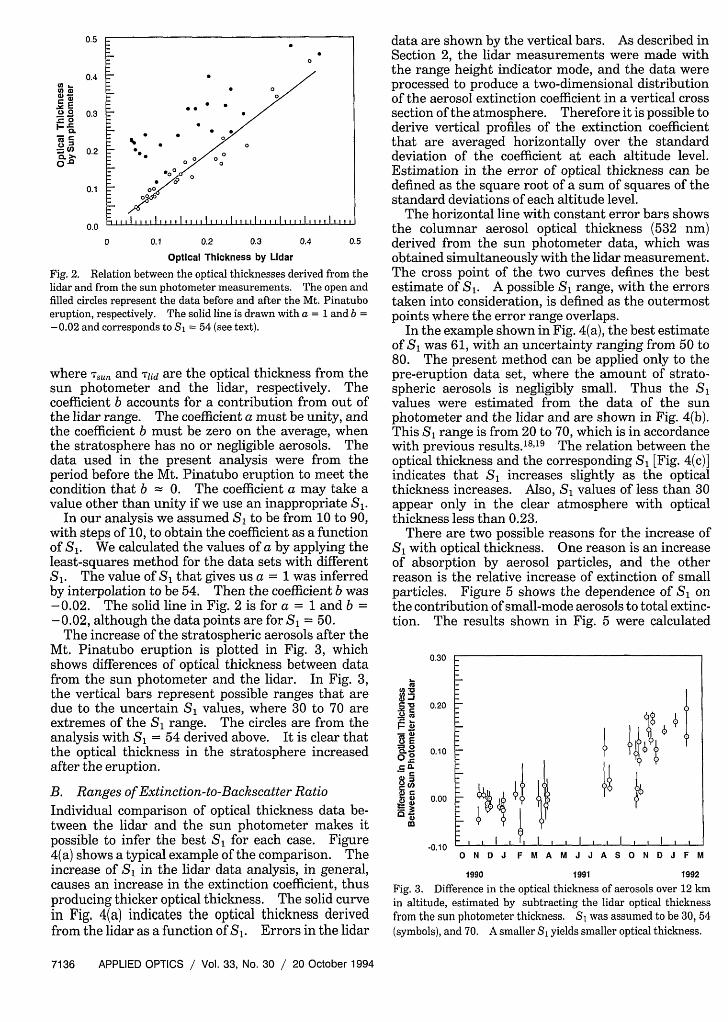
2 shows the relations between the optical thicknessesof tropospheric aerosols below 12 km and the colum-nar aerosols obtained with the lidar and the sunphotometer. The lidar data were obtained with S, =50. The open and filled circles represent pre- andposteruption data, respectively.
The optical thickness derived from the sun photom-eter measurements is a sum of the contributions fromthe stratosphere and the troposphere. Before theeruption, measurements with both the lidar and thesun photometer showed almost the same magnitudeof optical thickness. After the eruption, however,the optical thickness obtained with the sun photom-eter showed larger values than those obtained withthe lidar, which implies that the optical thickness ofthe stratospheric aerosols increased after the eruption.However, the seasonal variation in the optical thick-ness of tropospheric aerosols did not differ very much
before and after the eruption [Fig. 1(a)]. As men-tioned above, this may be the result of the fact thatthe lidar data may give one an underestimation of theoptical thickness after the Mt. Pinatubo eruption.The large fluctuation after the eruption suggests timevariations in the stratospheric aerosols that wereinjected into or generated in the stratosphere.
A mean value of S, throughout the period beforethe eruption can be inferred from regression analysisfor the relation between the optical thickness dataobtained from the sun photometer and from the lidar.The optical thickness from the lidar data can beestimated as a function of S,. If we assume anappropriate mean value for S, for the period, then theregression analysis gives us a slope of unity under alinear relationship between ;,, and Tlid as
Tsun -= a* Tlid ± b,
20 October 1994 / Vol. 33, No. 30 / APPLIED OPTICS 7135
0.5
Oht;01)a) -C .
aA: 2= 0is =
C)
0. 0.0
0.4
0.3
0.2
0.1 000.0 I I0 0.1 0.2 0.3
Optical Thickness by Lidar
Fig. 2. Relation between the optical thicknesses dElidar and from the sun photometer measurements.filled circles represent the data before and after thEeruption, respectively. The solid line is drawn wit]-0.02 and corresponds to S = 54 (see text).
where Tsu, and Tlid are the optical thicknE
sun photometer and the lidar, respectcoefficient b accounts for a contributionthe lidar range. The coefficient a must bthe coefficient b must be zero on the av(the stratosphere has no or negligible aerdata used in the present analysis werperiod before the Mt. Pinatubo eruptioncondition that b = 0. The coefficient avalue other than unity if we use an inapt
In our analysis we assumed S, to be frywith steps of 10, to obtain the coefficient aof S8. We calculated the values of a by least-squares method for the data sets wiS1. The value of S, that gives us a = 1 by interpolation to be 54. Then the coef-0.02. The solid line in Fig. 2 is for a-0.02, although the data points are for S:
The increase of the stratospheric aerosMt. Pinatubo eruption is plotted in Fishows differences of optical thickness b(from the sun photometer and the lidar.the vertical bars represent possible rantdue to the uncertain S, values, where extremes of the S, range. The circles aanalysis with S, = 54 derived above. Itthe optical thickness in the stratospheiafter the eruption.
B. Ranges of Extinction-to-BackscatterIndividual comparison of optical thickntween the lidar and the sun photometpossible to infer the best S, for each cc4(a) shows a typical example of the compaincrease of SI in the lidar data analysis.causes an increase in the extinction coefproducing thicker optical thickness. Thiin Fig. 4(a) indicates the optical thickrfrom the lidar as a function of S1. Error
data are shown by the vertical bars. As described inSection 2, the lidar measurements were made withthe range height indicator mode, and the data wereprocessed to produce a two-dimensional distributionof the aerosol extinction coefficient in a vertical crosssection of the atmosphere. Therefore it is possible toderive vertical profiles of the extinction coefficientthat are averaged horizontally over the standarddeviation of the coefficient at each altitude level.Estimation in the error of optical thickness can bedefined as the square root of a sum of squares of thestandard deviations of each altitude level.
The horizontal line with constant error bars showsthe columnar aerosol optical thickness (532 nm)
0.4 0.5 derived from the sun photometer data, which wasobtained simultaneously with the lidar measurement.
,rived from the The cross point of the two curves defines the bestThe open and estimate of S1. A possible S, range, with the errorsMt. Pinatubo taken into consideration, is defined as the outermosta = 1 and b = points where the error range overlaps.
In the example shown in Fig. 4(a), the best estimateof S, was 61, with an uncertainty ranging from 50 to80. The present method can be applied only to the
ess from the pre-eruption data set, where the amount of strato-tively. The spheric aerosols is negligibly small. Thus the S,from out of values were estimated from the data of the sune unity, and photometer and the lidar and are shown in Fig. 4(b).erage, when This S, range is from 20 to 70, which is in accordance-osols. The with previous results.18 "19 The relation between there from the optical thickness and the corresponding S, [Fig. 4(c)]to meet the indicates that S increases slightly as the opticalmay take a thickness increases. Also, S, values of less than 30
iropriate S1. appear only in the clear atmosphere with optical)m 10 to 90, thickness less than 0.23.Ls a function There are two possible reasons for the increase ofapplying the S, with optical thickness. One reason is an increaseith different of absorption by aerosol particles, and the othervas inferred reason is the relative increase of extinction of smallRcient b was particles. Figure 5 shows the dependence of S on= 1 and b = the contribution of small-mode aerosols to total extinc-L= 50. tion. The results shown in Fig. 5 were calculatedols after theg. 3, whichetween data
In Fig. 3,ges that are30 to 70 arere from theis clear that-e increased
RatioLss data be-er makes itise. Figurerison. The, in general,ficient, thuse solid curveiess deriveds in the lidar
0.30
Xi C
0 ESo
O .°C X
8
cxU"ms
0.20
0.10
0.00
-0.10N D J F M A M J J A S N D J F M
1990 1 991 1992
Fig. 3. Difference in the optical thickness of aerosols over 12 kmin altitude, estimated by subtracting the lidar optical thicknessfrom the sun photometer thickness. S was assumed to be 30, 54(symbols), and 70. A smaller SI yields smaller optical thickness.
7136 APPLIED OPTICS / Vol. 33, No. 30 / 20 October 1994
* S
* * S 0
* 00 0
0 �o �
*oomA0

0.16
0.14
E
Dt-
0.12
0.10
0.08
0.06
100
Co
a)
4I
CuI.,
M
gIn
0)
0C0
C
x2w
80
60
40
20
0
100
80
CO,u3U)(1
60
40
20
0
(a)
13:12:3524 Nov. 1990
NIES, Tsukuba
0 10 20 30 40 50 60 70 80 90 10
ExtInctlon-to-Backscatter Ratio(S1)
(b)
I I e~~~Nov Dec Jan Feb Mar Apr May
1990 1991
(C)
l~~~~~~~ _
g ull 11 1 u lil ,ll ,,1 ,
Fig. 4 (a). Determindata, (b) temporal chCof S1 and the opticaleter.
60
0)
C.,0)
4-IC
UCxwU
50
40
30
20
0.75 0.8 0.85 0.9 0.95 1
Contibutlon of Small Mode to Total Extnction
o0 Fig. 5. Fractional contribution of the small-mode aerosols toS1 . The complex index of refraction is assumed to be m = 1.50 -0.005i for the small mode and m = 1.55 - 0.005i for the largemode.
tion of small-mode aerosols than those of the ruraltype. The urban-type aerosol also tends to havelarger absorption, which favors larger S1.
C. Size Distribution and Complex Refractive IndexA typical example of the volume size distributionmeasured with the OPC is shown in Fig. 6, which iscorrected with a refractive index with m = 1.55 -0.005i. A peak near 0.2 plm in radius exists inalmost all samples. These peaks represent a charac-teristic of an urban polluted atmosphere.20 Thecorrection of the size distribution with the refractiveindices described above will make a slight change inthe distributions around this peak. This volumesize distribution in the range larger than 0.5 plmtends to increase with radius in some cases or remainrelatively flat in the other cases. These results maycorrespond to the large mode with particles fromnatural sources. The observed volume size distribu-
10.10
0.1 0.2 0.3 0.4 0.5 EOptical Thickness by Sun Photometer
ation of S, with the lidar and sun photometer srnge of S1 , (c) relation between the best value Cthickness as measured with the sun photom-
with all the data from the OPC measurements takenin our study. Larger values of S 1 appear when thecontribution of small-mode aerosols is relatively large.In other words the relatively small optical thickness(clean atmosphere) is associated with the smallercontribution of small-mode aerosols. This may sug-gest that there is a difference between an urban typeand a rural type of aerosol. The urban-type aerosolshave a larger optical thickness and a larger contribu-
10.11
10 12
0.1 10
Particle Radius (um)
Fig. 6. Example of typical volume size distribution of aerosolsmeasured with an optical particle counter. The complex index ofrefraction is assumed to be m = 1.55 - 0.005i for all particles.The assumed distribution over 5 ,um is a function described bydV/d In r = cr-0.5.
20 October 1994 / Vol. 33, No. 30 / APPLIED OPTICS 7137
Royco Las 23622Nov1990-31 Mar1992
m -1.5D-.0851 for small mode
m2-1.55-008851 for large mode ak
_ 0 0 ow ° '
a oo a a no °
_ 0_ I l l I~~~~~~~~~~~~~~~~.

tion in this mode agrees well with previous re-sults. 15,2 0 ,21
Particles in the small mode are most effective fordetermining the optical properties of aerosols forvisible lights with a distribution that can be wellapproximated by a zeroth-order log-normal distribu-tion. The mode radius r and the geometric stan-dard deviation o-0 are defined as follows:
10.11e)
EE)
10-12dV_ V0 exp[-(ln r - In ro)2 /(2 n2Oo)]
dr v/ In oro exp(ln2 o-o/2)
where V0 means an aerosol volume per unit atmo-spheric volume. Here the complex refractive indexfor the whole range was assumed to be m = 1.55 -0.005i. The effect of variations of the refractiveindex on the distribution shape is small in the sizerange mentioned above. Thus the statistical resultsare considered to be unchanged.
Figure 7 shows a relatively large variation of Voover the measurement period, with no remarkableseasonal features. The correlation between Vo andro shown in Fig. 8 is positive, and the particle volumeincreases with mode radius. This result suggeststhat the increase in volume is due to particle growthprovided that the particles have the same origin.
On the other hand no distinct features in the largemode were found. In the large mode, measurementaccuracy was low because of a small number ofparticles (Fig. 6) and insufficient isokinetic sampling.22
To avoid truncation errors in estimation of the opticalinformation,23 the size distribution in the range largerthan 5 plm was extrapolated with a function given bydV/d In r = cr-0.5. The magnitude of size distribu-tion at channel 15 was adjusted to a value that was anaverage of the data from channels 13 and 14.
With the size distributions observed with the OPC,it is possible to estimate SI values as a function ofcomplex refractive index (m) with the Mie theory.The aerosols that contributed the most to the opticalthickness must be in the lower atmosphere and well
10.13 10.1 0.15 0.2 0.25
Mode Radius (m)
Fig. 8. Relation between the particle volume V and the moderadius r, assuming a zeroth-order log-normal distribution for thesmall mode.
mixed. In addition, a convective mixed layer willusually develop during the daytime when there is fairweather and light winds.24
The data set obtained on 24 November 1990 isshown as an example. Figure 9 shows a verticalprofile of an extinction coefficient derived from thelidar data. The solid curve with the bars indicates ahorizontally averaged extinction profile that is a sumof aerosol and air molecule extinction coefficients.The horizontal bars indicate the magnitudes of thestandard deviation of the aerosol extinction. Thesmooth curve shows a profile of Rayleigh scatteringby air molecules. As one can see, most of aerosolsexist in the lower atmosphere.
Figure 10 shows an example of SI values as afunction of an imaginary (mi, abscissa) and real part(Mr, ordinate) of m. By combining the estimated SIvalues described in Subsection 3.B with those derivedfrom the OPC as a function of refractive index, we can
12.0
10.11E
I-C)
a
10.12
1U --O N D J F M A M J J A S O N D J F M
1990 1991 1992
Fig. 7. Variation of the volume V of the small-mode aerosolswhen a zroth-order log-normal distribution is fitted to the mea-sured distribution.
10.0
a)
8.0
6.0
4.0
2.0
0.0
10-6 10-5 10.4 10-3
Extinction Coefficient(Im)
Fig. 9. Aerosol extinction profile obtained with lidar measure-ments. The solid curve with bars is a sum of aerosol and airmolecule extinction coefficients. The smooth solid curve is for anair molecule extinction profile. The bars show the standarddeviations of the aerosol extinction coefficient.
7138 APPLIED OPTICS / Vol. 33, No. 30 / 20 October 1994
Zeroth-Order Log-Normal lstrlbutlonm- 1.55-5.951
IROYCa LS 236: ch.l - ch.5l
51*@ * * 4*.** 3.
_~~~~.* *5
l* l l
Zerath-lrder Lag-Normal Dlstrlbutlanm. 1.55-5.9951
[BOYCe IRS 236: ch.I - ch.51
_ ,* S S
_ aP5
- e 0h
5 l l l0
-
I
--. 13

1.35 -
1A -
t 15 -(a
EL155 -
a)X 1A .
1.65 -
1.7
SI8001 LBS 236
131235 24 NOV1990NIES, TSUKUBR
a -0.005 4.01 0.02 4.0.3 -. 05
Imaginary Part (ml)
80
m61
so
-08 -. 1
Fig. 10. Possible range of the complex index of refraction (mr, mi)inferred for the data set shown in Fig. 4(a). The best estimate ofSi is 61, with extremes of 50 and 80.
infer a refractive index for the aerosols. Figure 10corresponds to the case shown in Fig. 4(a), whichindicates that the best estimate of S, is 61, with anuncertainty ranging from 50 to 80. The solid curvein Fig. 10 corresponds to S, = 61. Note that theabscissa has a relative scale. Figure 10 shows thatthe increase of S, is caused either by an increase of mior by a decrease of mr.
Because the roles of m, and mi are complementaryin defining optical properties, one of them should beknown to determine the other. The imaginary partof m is important and has not been fully investigatedfrom the viewpoint of the Earth radiation budget.On the other hand, in usual conditions, the real partof m is known to range from 1.50 to 160.2,13Therefore, assuming that the m, takes a value be-tween 1.50 and 1.60, we can evaluate mi from adiagram, as shown in Fig. 10. The possible range ofmi thus determined for each sample is represented inFig. 11. Figure 11 shows that mi increases when S,increases. The imaginary part mi thus determinedfrom the present data set ranges widely, from 0.00 to0.10. The most plausible values of mi, however, rangefrom 0.03 to 0.06 in the cases with S, larger than 40.
0.1 2
0.10
't
C.0)
0.08
0.06
0.04
0.02
0.00
10 20 30 40 50 60 70 80 90
Best S1 Derived from Lidar and Sun Photometer
Fig. 11. Possible range of the imaginary part of m correspondingto the best Si estimated from the combination of the lidar and thesun photometer measurements. The data indicated by the aster-isks may have a large error.
There were some cases in which the positive valueof mi could not be determined, especially in cases withS < 30. One of the possible reasons is that theactual mr might be more than 1.60. However, inthese cases, mr must be more than 1.70 even withmi = 0.0 (no absorption). This is not realistic foraerosols with usual chemical compositions.
Another reason that mi could not be determinedmay be measurement errors. Although the errorsassociated with the lidar and the sun photometermeasurements were included in the analysis, theerrors in the OPC measurement have not been wellincorporated. Although the reliability of the sizedistributions observed with an OPC, in general,depends on the counts of the number of aerosols, thecontribution of large-mode aerosols to the extinctioncoefficient is 20% at the maximum. The S is,however, much more sensitive to the density fluctua-tion in that mode and an increase (or decrease) of thelarge-mode aerosols results in a decrease (or increase)of S, values. The small S, values could be explainedwith reasonable mi values if the number of thelarge-mode aerosols were actually larger than that ofmeasured aerosols, which in turn may suggest acounting loss in the large mode that is due to insuffi-cient isokinetic samplings. If that had happened inall cases, the upper range of the estimated average formi would have been a little larger than the onesestimated here.
As a final comment, if the size distribution variedgreatly with altitude, it would be very hard to obtain areasonable result for a constant extinction-to-back-scatter ratio and a constant refractive index over thewhole range with the present analysis method. Thedifficulty may be alleviated if the aerosol of interest isdominated by the boundary-layer aerosols.
To see whether that happened, we calculated ascale height from the extinction profile. The scaleheight is defined here as the height where the opticalthickness reaches 80% of the total value estimated for0-12 km. In almost all cases (19 out of 27) for thepre-eruption data, the scale heights were less than3000 m, and there were no distinct aerosol layersfound aloft, which indicates that in those cases mostof the aerosol contribution is from the boundarylayer. There are eight cases in which the scaleheight was larger than 3000 m; three of them arerelated to the cases in which the aerosol layers wereformed continuously from the ground with no dis-tinct layer found aloft. There are four cases inwhich aerosols probably originated in Asian dust,which seems to be separated from the boundaryaerosol layer. However, the contribution of Asiandust to the optical thickness was estimated to be onlyapproximately 20%.
There was just one case in which the aerosol layeraloft contained more than 40% of the optical thick-ness, in which case the derived value of refractiveindex may have a large error. This case is indicatedby asterisks in Fig. 11.
20 October 1994 / Vol. 33, No. 30 / APPLIED OPTICS 7139
g | | | .

4. Summary
Tropospheric aerosols have been observed for theperiod from November 1990 to April 1992 with alidar, a sun photometer, and an OPC. The analyticalresults are summarized as follows:
(a) Variation of optical thickness caused by tropo-spheric aerosols as derived from the sun photometerand the lidar measurements shows that the atmo-spheric loading is lighter in winter than in summer.Comparison of optical thickness data from the twoinstruments clearly shows the effect of Mt. Pinatu-bo's eruption and the temporal variation of opticalthickness in the stratosphere over 12 km.
(b) Simultaneous measurements with the lidarand the sun photometer can allow us to estimate theextinction-to-backscatter ratio (S1), which ranged from20 to 70 in this experiment. The larger S1 corre-sponds to a greater contribution of the small-modeaerosols to the extinction coefficient, which directlycorresponds to the larger optical thickness. In otherwords the decrease of aerosol loading in the atmo-sphere is associated with a relative increase in large-mode particles, suggesting the dominance of back-ground (rural) aerosols.
(c) The possible range of the complex refractiveindex for the columnar mean aerosols can be deducedfrom the probable range of S1 derived in (b) with an Sidiagram as a function of the complex refractive index(m). The imaginary part of m can be estimatedprovided that the real part of m is known. Theestimated imaginary part of m lies in the range from 0to 0.1 and increases with S,, under the assumptionthat the real part lies between 1.5 and 1.6 and all themeasurement errors are taken into consideration.The most possible values of mi are between 0.03 and0.06 for cases with S1 greater than 40.
(d) In some cases with SI less than 30, the imagi-nary part of the refractive index could not be esti-mated; this might be caused by a counting loss oflarge aerosols in the OPC measurements.
We are indebted to Oscar Wang for his carefulreading of this manuscript and appreciate the valu-able comments made by one of the reviewers.
References1. E. P. Shettle and R. W. Fenn, "Models for the aerosols of the
lower atmosphere and the effects of humidity variations ontheir optical properties," AFGL-TR-79-0214, EnvironmentalResearch Papers (U.S. Air Force Geophysics Laboratory,Hanscomb Air Force Base, Mass., 1979), p. 94.
2. A. Deepak and H. E. Gerber, eds., "Report of the experts meetingon aerosols and their climatic effects," Rep. WCP-55 (WorldMeterological Organization, Geneva, Switzerland, 1983), p. 198.
3. S. Hayashida and Y. wasaka, "On the long term variation ofstratospheric aerosol content after the eruption of volcano ElChicon: lidar measurements at Nagoya, Japan," J. Meteorol.Soc. Jpn. 63, 465-473 (1985).
4. B. R. Clemesha and D. M. Simonich, "Comparison between theEl Chichon and Pinatubo aerosol clouds seen at 23° S," inAbstracts ofAGU Chapman Conference on Climate, Volcanismand Global Change (American Geophysical Union, Washing-ton, D.C., 1992), p. 27.
5. H. Jager, "The Pinatubo eruption eruption cloud observed bylidar at Garmish-Partenkirchen," Geophys. Res. Lett. 19,191-194 (1992).
6. S. Hayashida and Y. Sasano, "Stratospheric aerosol change inthe early stage of volcanic disturbance by the Pinatubo erup-tion observed over Tsukuba, Japan," Geophys. Res. Lett. 20,575-578 (1993).
7. 0. Uchino, T. Nagai, T. Fujimoto, M. Fujiwara, H. Akiyoshi, S.Yasumatsu, S. Hayashida, Y. Sasano, H. Nakane, Y. Iwasaka,M. Hase, T. Shibata, T. Itabe, K. Asai, A. Nomura, Y. Saito, T.Kano, Y. Sai, K. Tamaki, R. Nomura, T. Sunagawa, C.Nagasawa, M. Abo, Y. Idesako, and K. Kai, "Observation of thePinatubo volcanic cloud by lidar network in Japan," J. Meteor-ol. Soc. Jpn. 71, 285-296 (1993).
8. F. G. Fernald, "Analysis of atmospheric lidar observations:some comments," Appl. Opt. 23, 652-653 (1984).
9. Y. Sasano and H. Nakane, "Quantitative analysis of RHI lidardata by an iterative adjustment of the boundary conditionterm in the lidar solution," Appl. Opt. 26, 615-616 (1987).
10. P. B. Russell, T. J. Swissler, and M. P. McCormick, "Methodol-ogy for error analysis and simulation of lidar aerosol measure-ments," Appl. Opt. 18, 3783-3793 (1979).
11. T. Takamura and Y. Sasano, "Aerosol optical propertiesinferred from simultaneous lidar, aerosol-counter, and sunpho-tometer measurements," J. Meteorol. Soc. Jpn. 68, 729-739(1990).
12. G. E. Shaw, "Sun photometry," Bull. Am. Meteorol. Soc. 64,4-10(1983).
13. T. Takamura, M. Tanaka, and T. Nakajima, "Effects ofatmospheric humidity on the refractive index and the sizedistribution of aerosols as estimated from light scatteringmeasurements," J. Meteorol. Soc. Jpn. 62, 573-582 (1984).
14. G. Yamamoto, M. Tanaka, and K. Arao, "Secular variation ofatmospheric turbidity over Japan," J. Meteorol. Soc. Jpn. 49,859-865 (1971).
15. M. Shiobara, T. Hayasaka, and M. Tanaka, "Aerosol monitor-ing using a scanning spectral radiometer in Sendai, Japan," J.Meteorol. Jpn. 69, 57-70 (1991).
16. H. Jager, "The Pinatubo eruption cloud observed by lidar atGarmish-Partenkirchen," Geophys. Res. Lett. 19, 191-194(1992).
17. M. P. McCormick and R. E. Veiga, "SAGE II measurements ofearly Pinatubo aerosols," Geophys. Res. Lett. 19, 155-158(1992).
18. T. Takamura and Y. Sasano, "Ratio of aerosol backscatter toextinction coefficients as determined from angular scatteringmeasruements for use in atmospheric lidar applications," Opt.Quantum Electron. 19, 293-302 (1987).
19. C. H. Whitlock, J. T. Suttles, and S. R. LeCroy, "Phasefunction, backscatter, extinction, and absorption for standardradiation atmosphere and El Chichon aerosol models at visibleand near-infrared wavelengths," NASA Tech. Memo. 86379(National Aeronautics and Space Administration, Washington,D.C., 1985), pp. 1-7.
20. E. M. Patterson and D. A. Gillette, "Commonalities in mea-sured size distributions for aerosols having a solid-derivedcomponent," J. Geophys. Res. 82, 2074-2082 (1977).
21. K. T. Whitby, "The physical characteristics of sulfur aero-sols," Atmos. Environ. 12, 135-159 (1978).
22. D. T. Shaw, ed., Recent Developments in Aerosol Science(Wiley, New York, 1978).
23. T. Takamura and M. Tanaka, "Some uncertainties in opticalproperties of aerosols estimated from light scattering measure-ments," J. Meteorol. Soc. Jpn. 63, 969-974 (1985).
24. M. Tanaka, T. Hayasaka, and T. Nakajima, "Airborne measure-ments of optical properties of tropospheric aerosols over anurban area," J. Meteorol. Soc. Jpn. 68, 335-345 (1990).
7140 APPLIED OPTICS / Vol. 33, No. 30 / 20 October 1994