trophic positioning of meiofauna revealed by stable isotopes and
TRANSCRIPT
Acc
epte
d A
rtic
le
This article has been accepted for publication and undergone full peer review but has not been
through the copyediting, typesetting, pagination and proofreading process, which may lead to
differences between this version and the Version of Record. Please cite this article as doi:
10.1002/ecy.1553
This article is protected by copyright. All rights reserved.
Received Date : 04-Feb-2016
Revised Date : 03-Jun-2016
Accepted Date : 12-Jul-2016
Article type : Articles
TROPHIC POSITIONING OF MEIOFAUNA REVEALED BY STABLE ISOTOPES AND FOOD-WEB
ANALYSES.
JENNY M. SCHMID-ARAYA1,3, PETER E. SCHMID
1,2, STEVEN P. TOD1, AND GENOVEVA F. ESTEBAN
3
Affiliations:
1 School of Biological and Chemical Sciences, Queen Mary University London, Mile End Road, London
E1 4NS, UK.
2 Department of Freshwater Ecology, University of Vienna, Althanstr. 14, A-1090 Vienna, Austria
3 Bournemouth University, Faculty of Science and Technology, Department of Life and Environmental
Sciences, Poole, Dorset BH12 5BB, UK.
Acc
epte
d A
rtic
le
This article is protected by copyright. All rights reserved.
3 Present address: Bournemouth University, Faculty of Science and Technology, Department of Life
and Environmental Sciences, Poole, Dorset BH12 5BB, UK.
Email [email protected]
Running head: TROPHIC POSITIONING OF MEIOFAUNA
ABSTRACT
Despite important advances in the ecology of river food-webs, the strength and nature of the
connection between the meio- and macrofaunal components of the web are still debated. Some
unresolved issues are the effects of the inclusion of meiofaunal links and their temporal variations
on the overall river food web properties, and the significance of autochtonous and allochtonous
material for these components. In the present study we conducted gut content of macro- and
meiofauna, and stable isotope analyses of meiofauna to examine seasonal food webs of a chalk
stream. The results of the gut content analyses, confirmed by the δ13C signatures, revealed a
seasonal shift from a dependence on autochthonous (biofilm) to allochthonous food sources. Here,
we demonstrate that aggregating basal or meiofaunal species into single categories affects key web
properties such as web size, links, linkage density, and predator-prey ratios. More importantly,
seasonal variation in attributes characterized the entire web and these changes persist regardless of
taxonomic resolution. Furthermore, our analyses evidenced discrete variations in δ15N across the
meiofauna community with a trophic structure that confirms gut content analyses, placing the
meiofauna high in the food web. We, therefore, conclude that small body-sized taxa can occur high
in dynamic river food webs, questioning assumptions that trophic position increases with body size
and that webs are static.
Acc
epte
d A
rtic
le
This article is protected by copyright. All rights reserved.
Key words: taxonomic resolution, benthic algae, macrofauna, feeding plasticity.
INTRODUCTION
Ecologists have traditionally used the food-web approach to understand the functional
complexity of energy flow, stability, and other properties of communities (Thompson et al. 2012). In
streams, empirical results based either on stable isotope or gut-content analyses of macrofauna
(body size > 500 µm) have demonstrated the high levels of autochthony in tropical (Dudgeon et al.
2010) and temperate habitats (Schmid-Araya et al. 2012). These studies contradict the long-held
view of heterotrophy and dependency solely on allochthonous detritus proposed by the River
Continuum Concept (RCC; Vannote et al. 1980), and agree with aspects of the Riverine Productivity
Model (RPM; Thorp and Delong 2002) that established the significance of the autotrophic
component in larger rivers (≥4th order).
Because of logistic constraints and biases in taxonomic expertise, a trophic species assemblage
hardly considered in food web analyses is the freshwater meiofauna (taxa defined in the body-length
range: ≥ 50 µm and ≤ 500µm). This group exhibits high species diversity and displays substantial
production rates (freshwater systems: from 0.8 to 10.0 g C m-2 yr-1 [Reiss and Schmid-Araya 2010];
marine systems: from 0.003 to 38.8 g C m-2 yr-1 [Burd et al. 2012 and references therein]). Built upon
previous studies that features the functional role of this group (Schmid-Araya et al. 2002, Stead et al.
2005, Reiss and Schmid-Araya 2011), we examine here their trophic interactions and position in a
chalk stream food web.
Stable Isotope Analysis (SIA) is a widely used technique for determining feeding links of an
organism as it reflects and integrates its assimilated diet (Davis et al. 2012). In contrast, gut content
analysis (GCA) can be interpreted as a dietary ‘snapshot’ contributing with information on the
diversity of the taxonomic and size composition of diets that might be difficult to assess from SIA
Acc
epte
d A
rtic
le
This article is protected by copyright. All rights reserved.
alone (Davis et al. 2012). Detritivory, omnivory and diet variability in some consumers complicates
the analysis of benthic food webs based on GCA, thus, SIA can enhance the interpretation of food
web structure.
Using stable isotopes, marine meiofaunal studies based on species/genus have reported a wide
variety of food sources and positioned the group either as primary consumers and/or as predatory
(Moens et al. 2005, Vafeiadou et al. 2014). Similarly, the few freshwater studies that applied SIA,
although not in combination with CGA, have shown the meiofauna as primary consumers of epilithic
biofilms (Majdi et al. 2012, Peters et al. 2012). In freshwaters, the traditional perception is that
species with small body mass occur low in the food web, and, thus, meiofauna would seem to
occupy an intermediate position (feeding on basal resources and being fed upon). In contrast,
recent marine research has shown that several meiofaunal species are placed at the same trophic
level or even higher than their macrofaunal counterparts (Evrard et al. 2010).
On the other hand, food web connectivity displays the trophic interactions within a community
based on either assumptions of feeding or GCA. The methodology of defining a link and the level of
taxonomic resolution widely varies among the published literature (Thompson and Townsend 2000).
As the effort required to highly resolve all taxonomic groups is considered substantial, a great
number of these studies have variably resolved trophic links in their webs. To date, there is
conflicting evidence if only few food web parameters such as connectance (proportion of links),
linkage density (number of links per species) and predator/prey ratios are strongly affected by the
inconsistency in the level of resolution used (but see Martinez 1991, Thompson and Townsend
2000). As far as we are aware, no study has yet examined whether changes of food web properties
are affected by the inclusion of meiofauna.
In this study, we conducted GCA of macro- and meiofauna, and SIA of meiofauna from a lowland
chalk stream in England, UK. Using a highly resolved river food web, we evaluated the effects of
resolution (on basal, intermediate or meiofaunal species) and seasonal variations on food-web
Acc
epte
d A
rtic
le
This article is protected by copyright. All rights reserved.
properties. Furthermore, we assessed seasonal and taxa changes of major meiofaunal energy
sources based on δ13C and meiofaunal trophic position based on δ15N signatures.
METHODS
Study site
The River Lambourn (51°25’29”N, 1°21’08”E) is a circumneutral (pH 7-8) lowland Cretaceous
chalk stream draining a rural catchment (234 km2) of southern England (UK). The Lambourn is fed by
a chalk aquifer and, thus, exhibits many characteristics of chalk groundwater-dominated river
systems (Pretty et al. 2006). The chalk is a fine-grained, pure (c. 98% CaCO3), soft, white limestone
containing thin marl beds and flints (Weather et al. 2007). The study site was an 80m stream reach
with a mean channel width of 4.5 m, and a maximum water depth of 0.4 m. Mean surface water
temperature ranged between 8.4 and 15.4°C, while water conductivity varied between 470 to 540 µS
cm-1 (Tod and Schmid-Araya 2009). The Lambourn is hypernutrified (surface and subsurface 400–
500 µmol NO3- L-1, but the streambed is aerobic not serving as a nitrate sink (Pretty et al. 2006)). The
riparian vegetation consisted of a wetland and a Salix spp- dominated woodland, respectively on the
north east and south west riverbank. There were patches of mixed stands of macrophytes, mainly
Ranunculus spp. and Berula erecta (Hudson) Coville.
Sampling for invertebrate densities and gut content analysis (GCA)
Quantitative sampling of the streambed was carried out with a modified Hess sampler (surface
area: 0.03 m2; mesh size 42 μm) between April 2004 and March 2005. Twelve samples were taken at
random each month, from within twelve separate 2 m x 6 m cross-sectional grids (strata) that
covered the whole width of the stream and were spaced evenly across riffle and pool zones. In our
Acc
epte
d A
rtic
le
This article is protected by copyright. All rights reserved.
analyses, we included not only invertebrates but also all fish caught during sampling. Very low trout
densities were recorded in the Lambourn with up to 0.05 ind. m-2 (Giles et al. 2004) but were absent
from our study area. In contrast, bullhead has been recorded with densities up to 8 Ind. m-2 (Mills
and Mann 1983).
Samples were kept cool (~5° C) during transport to the lab where they were sieved into size
fractions of meiofauna (≥ 50µm ≤ 500µm) and macrofauna (>500µm). Carbonated water was added
before fixing as it prevents regurgitation (Schmid unpublished). The macroinvertebrates were then
immediately preserved in 75% ethanol for later identification and counting, whereas meiofauna
fractions were kept cool, and identified and counted within one to four days following Stead et al.
(2005).
GCA of macro- and meiofaunal species
All invertebrates and fish were enumerated and identified to the lowest possible taxonomic
resolution. Feeding interactions were identified by GCA of all invertebrate and vertebrate specimens
caught in quantitative samples. Fish, macrofaunal taxa such as Ephemeroptera, Simuliidae, and late
instar chironomids were decapitated, dissected, and their gut contents fixed with Euparal
microscope slides, while smaller meiofaunal taxa were mounted whole. Slides were then examined
under an Olympus BX50 (Olympus Optical, Tokyo, Japan) microscope at 1000x magnification with oil
immersion following Schmid and Schmid-Araya (1997). Whole mount reference slides and various
taxonomic keys were used to identify gut contents. We assessed the gut content of 63% of the
species found in the Lambourn because the contribution to relative densities of each of the
remaining species was < 2% (Tod and Schmid-Araya 2009) and, therefore, too low to carry out
meaningful GCA, SIA and statistical analyses. The total number of individual invertebrates used for
Acc
epte
d A
rtic
le
This article is protected by copyright. All rights reserved.
gut examination for each season equalled 356 (139 meiofauna) in spring, 562 (236 meiofauna) in
summer, 284 (110 meiofauna) in fall, and 182 (66 meiofauna) in winter.
Manipulation of food webs
Four seasonal food web matrices and a summary web were constructed from the data based on
GCA. To determine how food-web properties were affected by decreasing taxonomic resolution, six
further matrices were constructed using the summer web (species richest) and the winter web
(species poorest). Taxonomic resolution was manipulated by creating three non-replicated levels of
resolution by aggregating: (a) into categories ‘algae’ and ‘detritus’ (hereafter referred to as the Basal
web), (b) into categories ‘insects’ and ‘non-insects’ (referred to as the Inter web) and (c) meiofaunal
species (≤ 500 µm) as absent (referred to as the Meio web).
Web properties based on GCA
For each food web, we assessed the number of meiofaunal species and 16 web properties. Four
standard estimates of food web complexity (sensu Martinez 1991, Dunne et al. 2004) were used: (i)
species richness [S], (ii) number of links between the species [L], (iii) links per species [L/S] referred
as link density and (iv) connectance C as [C = L/S2] or the proportion of all possible links that are
realised, referred as directed connectance. Five proportions indicate the types of species in a food
web: (a) top (T) species that lack any predators, (b) intermediate (I), (c) basal (B) species that lack
prey items (Martinez 1991), (d) herbivores-detritivores (species feeding on algae, and detritus), and
(e) omnivores (species feeding at multiple trophic levels). Four further proportions reveal the type
of links between the species: top to basal (T-B), top to intermediate (T-I), intermediate to
intermediate (I-I), intermediate to top (I-T) and intermediate to basal (T-B). Finally we calculated (a)
predator/prey ratio, considered cannibalism and any other form of consumption of one organism by
Acc
epte
d A
rtic
le
This article is protected by copyright. All rights reserved.
another (Dunne et al. 2004), (b) mean trophic level of all taxa in a web (± SD = standard deviation of
trophic level) and (c) average chain length (± SD = standard deviation of chain length). The latter was
defined as the total number of different chains in a web divided by the sum of all chain lengths
(Dunne et al. 2004). A chain is the sequence of links that starts at a basal species and ends with a
consumer species. Chain length was also assessed by SIA.
The trophic similarity of seasonal food web matrices was analysed using an agglomerative
cluster-analysis (see Statistical analyses).
Samples for stable isotope analysis
Twelve additional quantitative Hess samples (six from each of the macrophyte-stands and gravel
beds) were taken randomly for isotope analysis of meiofauna in each season. Fine particulate
organic matter (FPOM) for isotopic source-analyses was obtained from the same samples used to
collect meiofauna from the streambed. Ceramic tiles (non-glazed) were placed within macrophyte
stands at random one month prior sampling to allow biofilm colonization (following Bradley et al.
2002). Three replicate samples of biofilm were collected at each sampling occasion. Tiles were
scraped with a plastic brush, washed with deionised water, and any invertebrates removed from the
resulting slurry. The slurry was then filtered onto pre-combusted and pre-weighed GF/C filters
(diameter 25 mm, Whatman), each stored in a separate small airtight plastic bag. Cuttings of the
dominant macrophytes, Ranunculus spp. and Berula erecta were taken at each sampling occasion
and stored separately in a small plastic bag. All samples of isotopic source material were kept cool
during transport to the lab where they were frozen for later SIA preparation.
Acc
epte
d A
rtic
le
This article is protected by copyright. All rights reserved.
Meiofauna are capable of extremely high biomass turnover times with up to 1.08 (days) (i.e.
Stead et al. 2005), thus, to ensure better stable isotope signatures of meiofauna we processed the
samples as fast as possible. The reduced column technique for SIA and the preparation procedures
are described and discussed in the Appendix and Fig. S1.
Statistical analyses
To analyse the trophic similarity of 177 species among seasons, we conducted an agglomerative
cluster-analysis based on the average group method using as similarity measure the Euclidean
distance metric. To test the differences between clusters we used a SIMPROF approach (Clarke et al.
2008) by testing the similarity of (a) all observed and (b) seasonal combinations of clusters with
clusters based on randomly permuted data sets. The test is based on a Pi statistics defined as the
absolute deviation of the real similarity profile from the mean of ‘expected’, permuted profiles,
which is compared to the null distribution of ‘simulated’, permuted profiles (Clarke et al. 2008). The
algorithm for this SIMPROF test was programmed in Delphi® 2010 (Embarcadero Technologies, USA).
All test results are based on 5000 ‘expected’ and 4999 ‘simulated’ random permutations.
A resemblance matrix with key food web variables was created in which between sample
distances (factors: seasons and level of taxonomic resolution) were based on Euclidean distance
metric calculated on normalized variables. To explore the effects of season and resolution on food
web properties we used multivariate analyses. To detect differences between taxonomic
resolutions and between seasons we used permutational ANOVA (PERMANOVA) as this approach is
more powerful than other methods to test resemblance matrices (Anderson and Walsh 2013). To
test if the variances (distances) of the two seasonal (winter-summer) and two web resolutions
(aggregated-non aggregated) groups are different, the distances of the group members to their
respective group median were subject to ANOVA using the PERMDISP approach (Anderson 2006).
Acc
epte
d A
rtic
le
This article is protected by copyright. All rights reserved.
Following Warton et al. (2012), we also considered if the data displayed differences in ‘location’
and/or ‘dispersion’ effects. ‘Location’ effects indicate a difference on the mean, while ‘dispersion’
effects indicate a difference in variation of the web properties. Here, we used an approach where
model residuals are permuted to generate 4999 permutation distributions of F-values under the null
hypothesis of equality of variances between groups. The results of different groups were visualized
using non-metric multidimensional scaling (NMDS).
Prior testing isotope signatures for statistically significant differences between seasons and
taxa/food-sources, we tested the data for (a) normality using the Andersen-Darling A2 test statistics,
(b) outliers using the generalized ESD test and (c) homogeneity of variances using Cochran’s C
statistic. While taxa such as non-predatory chironomids, harpacticoid copepods and food sources
such as FPOM departed significantly from normality (Appendix: Table S1; P < 0.05) due to the
presence of signature outliers (ESD test; P < 0.05), all signature values displayed equality of variances
within each tested group (Table S2; P > 0.1). The distribution of non-normal isotope signatures of
taxa and food-sources fit best to a Gaussian Mixture distribution (A2 tests: P > 0.1). Consequently,
we tested seasonal as well as food-source and taxa specific differences in δ13C and δ15N isotope
signatures using unbalanced (unequal number of replicated signature measurements), one-way
factorial permutation ANOVAs (pmANOVA) considering all possible permutations (exact permutation
test) per data set. This permutation test procedure is particularly adequate for (1) normal and non-
normal distributed data, (2) low degree of freedom of errors, and (3) data sets containing outliers.
We used R language for statistical computing (R Development Core Team 2008) and the R packages
vegan 2.2 (Oksanen et al. 2010) and lmPerm (Wheeler 2010).
Acc
epte
d A
rtic
le
This article is protected by copyright. All rights reserved.
RESULTS
Food web properties based on GCA
In total 177 different consumers and food resources were identified in the River Lambourn
including 49 different diatom species, 12 other basal resources such as fine particulate organic
matter, and leaf material, 3 types of invertebrate eggs, 112 invertebrate and 1 fish species (Table
S3). Testing for seasonal structure of trophic similarities among all species demonstrated that the
observed similarity profiles of all seasonal clusters (Figs. S2a-c), and selected cluster combinations
significantly departed from random expectations (P < 0.01), implying distinct seasonal differences in
trophic similarity (Table S4).
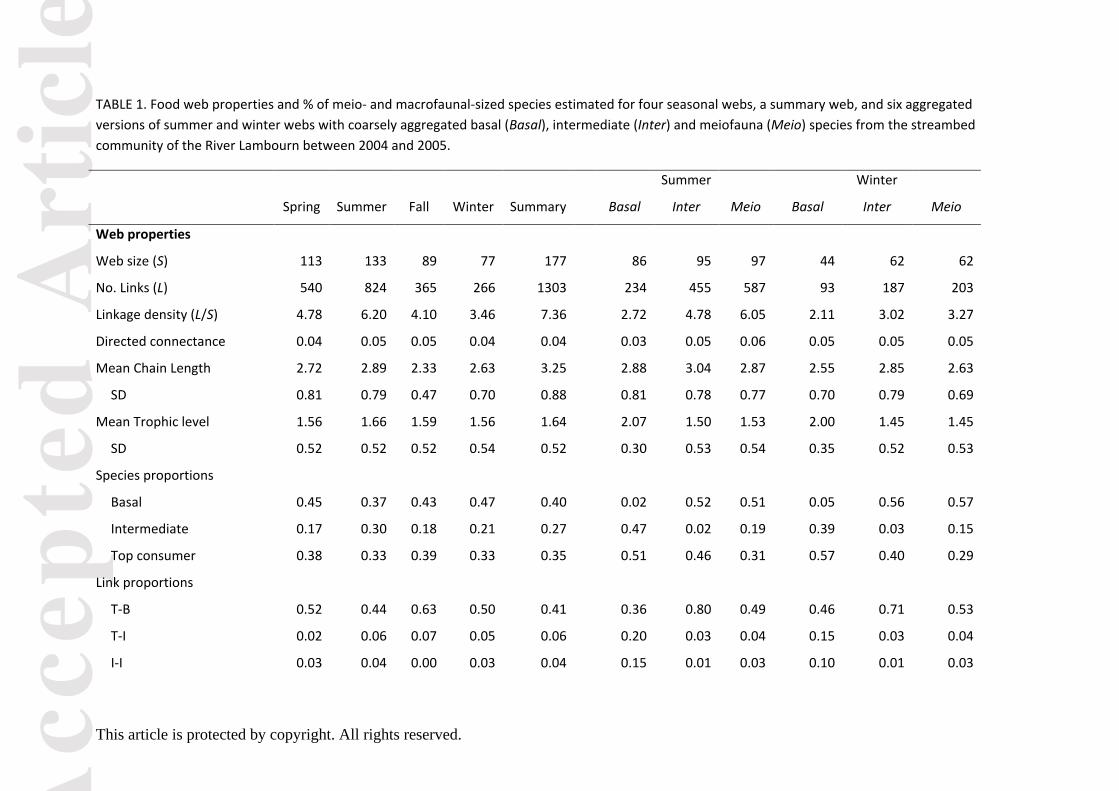
Web size nearly doubled from the winter with 77 species to 133 species in summer, the number
of links and linkage density being directly proportional to web size (Table 1). Directed connectance
was low and constant across all seasons ranging between 0.04 and 0.05.
Except for the summer season when all proportions of species were equally represented, more
basal (range: 0.37 and 0.47) and top consumers (range: 0.33 and 0.39) inhabited the streambed
habitats than intermediate species (Table 1). With the exception of summer when an even
distribution of links between top-basal and intermediate-basal species occurred (Table 1, Fig. 1), a
notably common feature among all the top consumers was that they fed mainly on basal resources
(detritus and diatoms) (range: 0.50 – 0.63, Table 1). Furthermore, there was a lack of links between
intermediate-to-intermediate species in the fall (Table 1). Linkage density, mean chain length and
mean trophic level were highest during the summer coinciding with a higher number of species.
Generally, most species were herbivores-detritivores while omnivores (feeding on more than one
trophic level) and carnivores were rare in that stream.
Acc
epte
d A
rtic
le
This article is protected by copyright. All rights reserved.
In these webs, more than a third of all invertebrate species belonged to the category meiofauna
(% range: 35.7 to 41.7; Table 1) and they were more abundant than the macrofauna in each season
(Fig. S4). Moreover, the percentage of meiofaunal species within the top consumers was between
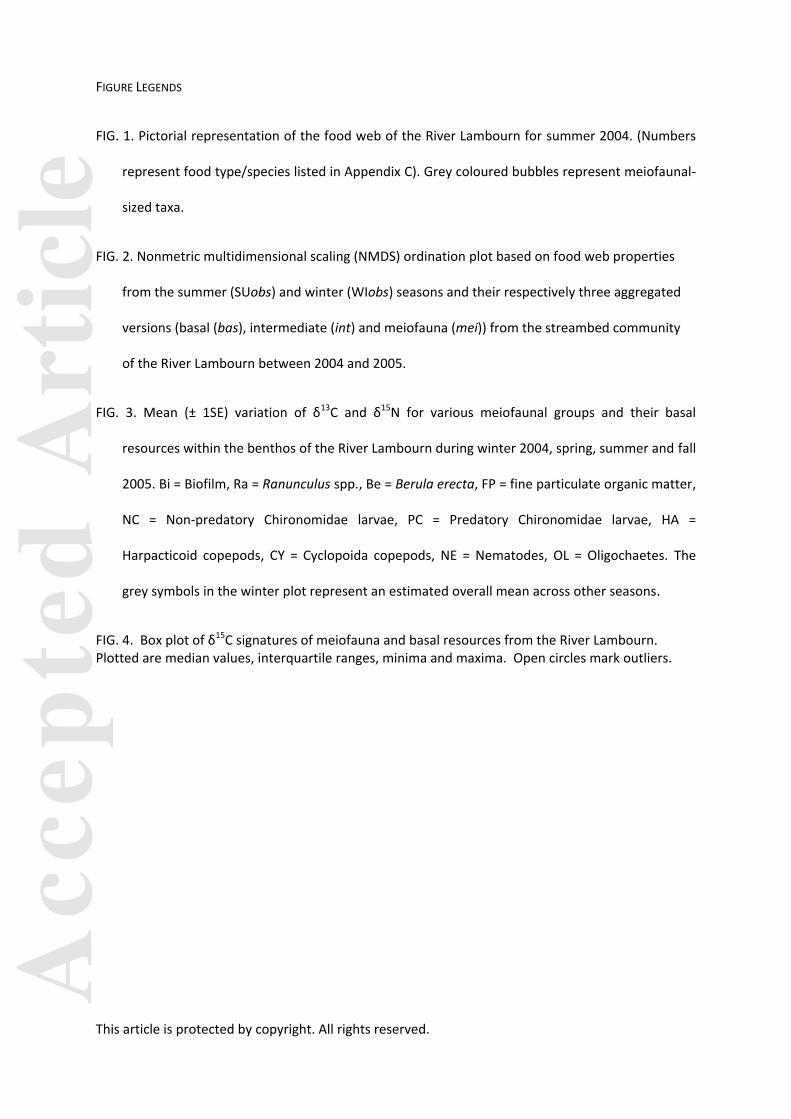
28% and 44% (Table 1). The summer web was the species richest (Table 1, Fig. 1) exhibiting a trophic
structure with a high number of basal species and with top consumer species (mostly of the
herbivore-detritivore category) not being preyed upon by predatory (carnivore) taxa. The web also
highlights that meiofaunal-sized species are not only intermediate but also positioned as top
consumers (Fig. 1). A low number of trophic levels was reflected in a low mean chain length (Table
1), and a rather simple web architecture (Fig. 1).
Effects of resolution on the summer and winter web
Poorly-resolved basal, intermediate or meiofaunal food webs showed a reduced web size, as
well as changes in the number of links (Table 1). Half the number of links was lost when 42 diatom
species were excluded (Basal web) for summer and winter seasons (Table 1). In addition, all
aggregation protocols produced either an over – or underestimation of linkage density (Table 1).
Eliminating basal and meiofaunal species resulted in an overestimation of predator/prey ratios
independent of season, although the effect was more pronounced in winter. As these properties
(web size, links, linkage density and predator-prey ratio) displayed more distinct variations among
levels of resolution compared to others, we used these key properties for further analyses.
PERMANOVA distinguished significant differences in web resolution and seasons (Table S5), but not
in the interaction between the two factors (Table S5). PERMDISP results highlighted the equality of
distances between seasons and between levels of resolution (Table S6), implying an effect on the
mean of the web properties (‘location’) different from a ‘dispersion’ effect. This is shown in Figure 2
where season is the predominant effect overlying levels of resolution. Distances between levels of
Acc
epte
d A
rtic
le
This article is protected by copyright. All rights reserved.
resolution to the observed web are similar among seasons with a distinct separation of SUbas or WIbas
from the other two aggregated webs (Fig. 2).
Meiofauna isotope analysis
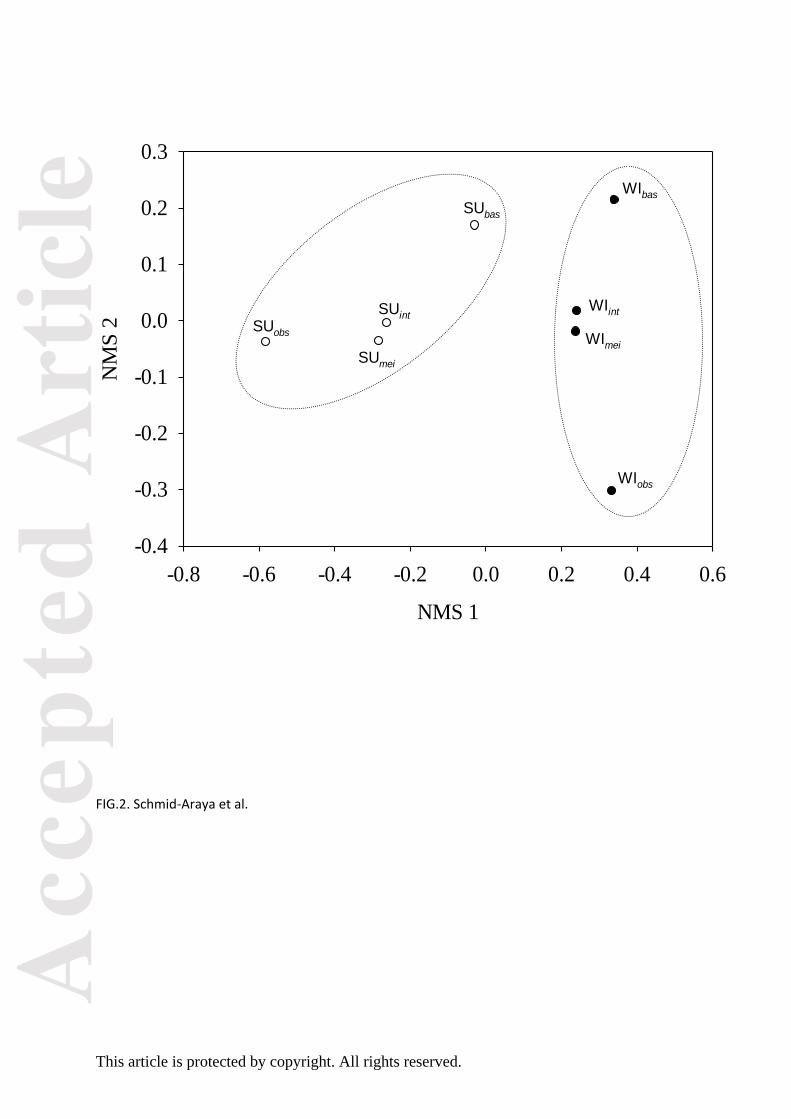
Over the four seasons, allochthonous carbon sources with a δ13C ranging from -32.90 to -29.99 ‰
were on average less depleted than the autochthonous sources, which varied between -38.74 and -
34.29 ‰ (Fig. 3). Ranunculus spp. showed a depleted δ13C signature throughout spring to fall while
Berula erecta maintained a consistently lighter δ15N signature than biofilm and Ranunculus ssp. in
each season (Fig. 3). However, among the isotopic sources only fine particulate organic matter
(FPOM) displayed significant seasonal changes in δ13C (pmANOVA P = 0.003, Table S7), but not in
δ15N (pmANOVA P = 0.708, Table S7).
The base line isotopic source data covered the range of meiofauna isotopic signatures in each
season well. The mean dry mass per tin cup across all meiofauna samples was 2.26 µg (± 0.17 SE.)
for N, and 5.64 µg (± 0.44 SE) for C, both well above the lower limits required for accuracy in
determining isotopic signatures outlined in our method (see Appendix).
Error bars indicated noticeable variation in δ13C for each meiofauna group within seasons (Fig. 3),
and differences in δ13C signatures between meiofaunal taxa were marginally significant in the spring
season (pmANOVA P = 0.096, Table S8). Seasonally, variation in δ13C signatures was significant only
in harpacticoids (pmANOVA P = 0.005, Table S7) but not for other meiofaunal taxa (pmANOVA P >
0.1, Table S7). Cyclopoid copepods could not be tested as the number of replicates was too small.
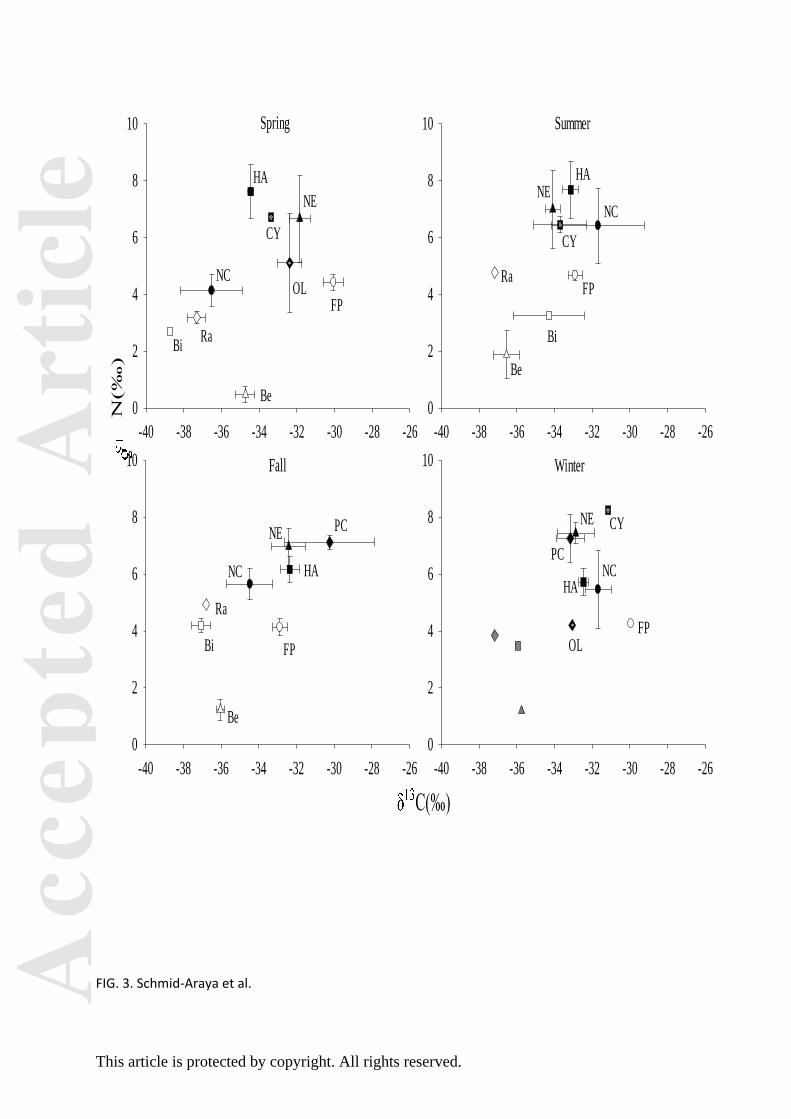
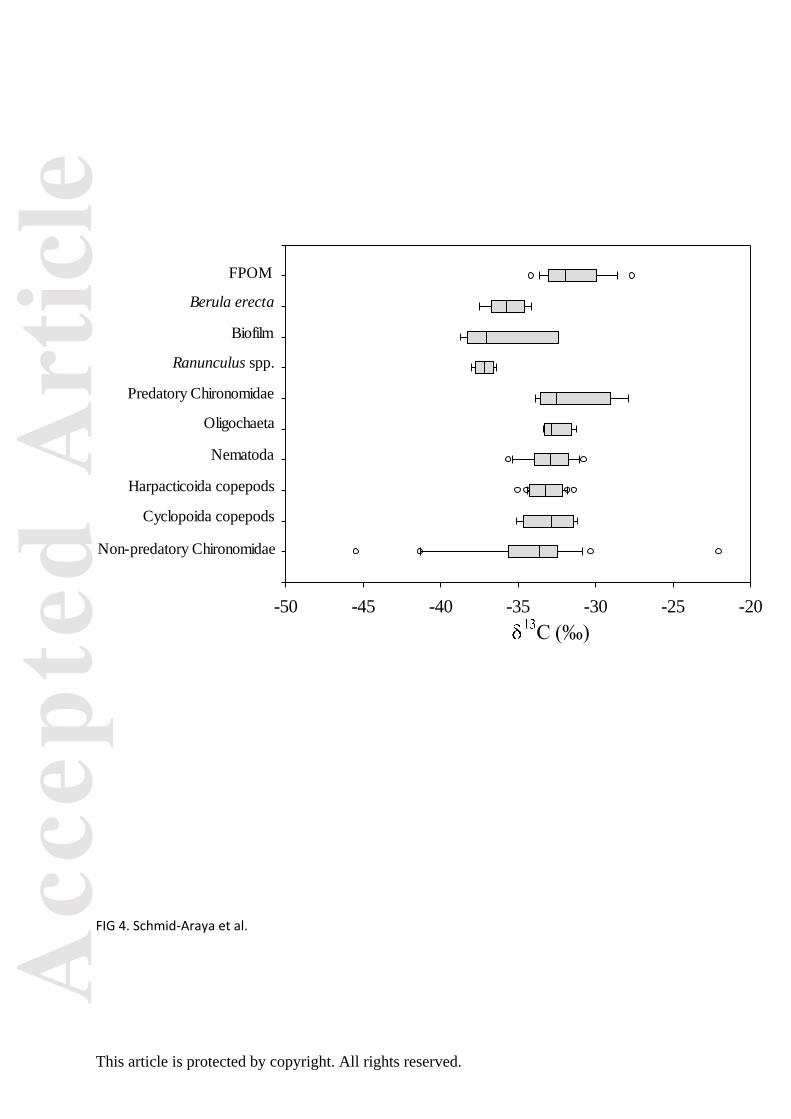
The seasonal average of δ13C signatures in Fig 4 shows ranges for non-predatory chironomids
between -36.52‰ and -31.69‰ and those of predatory chironomids between -33.16‰ and -
30.24‰.
Acc
epte
d A
rtic
le
This article is protected by copyright. All rights reserved.
Overall, the position of most meiofaunal taxa in terms of δ13C suggests a mixed energy source
with a shift from a clear dependence on autochthonous (biofilm) food sources in the summer to an
allochthonous food source during the fall (Fig. 3).
Non-significant seasonal differences were found in the δ15N signatures of all meiofaunal taxa
(pmANOVA P > 0.1, Table S7). Nitrogen isotope values overlapped among the meiofauna in summer,
while in spring, non-predatory chironomids and oligochaetes (primary consumers) were positioned
lower than the rest of the meiofauna (Fig. 3). A stepwise increase in δ15N nitrogen was observed in
fall with non-predatory chironomids as primary consumers and predatory chironomids as top
consumers (Fig. 3). During winter, oligochaetes were positioned lower than harpacticoids and non-
predatory chironomids and these in turn were lower than cyclopoids, nematodes and predatory
chironomids. Applying the standard estimate of 3.4‰ fractionation of δ15N among trophic levels
(Post 2002), we estimated a maximum number of trophic levels between 1.75 and 2.33 in this chalk
stream. However, an alternative scenario using the 2.3 ‰ fractionation of δ15N of Mc Cutchan et al.
(2003) estimated maximum trophic levels between 1.09 and 3.76.
DISCUSSION
This study stresses the importance of temporal variations in food - and consumer species-
composition for a comprehensive understanding of food web structure, asserted by similar changes
in trophic structure depicted by CGA and SIA. Although, the binary web had a low number of
intermediate species, the meiofauna contributed with more than a third of all species to the web.
Interestingly, meiofaunal species belonged also to the category of top consumers in this system. The
effects of resolution on web properties examined by aggregating either basal, intermediates and/or
meiofaunal species into coarser taxonomic classes resulted in marked effects upon web size, number
of links, linkage density and predator/prey ratios. However, web connectance was insensitive to our
Acc
epte
d A
rtic
le
This article is protected by copyright. All rights reserved.
aggregation procedure. Seasonal differences in these key web properties together with those for
trophic similarity as revealed by PERMANOVA and cluster analysis, respectively, had a pronounced
effect on food web structure. PERMANOVA results also highlighted that reductions in taxonomic
resolution significantly alter web properties. Key web characteristics are not static properties,
having a potentially profound influence on the functional understanding of ecosystems.
CGA results were confirmed by δ13C signatures suggesting a mixed energy source with a shift
from a clear dependence on autochthonous (summer) to allochthonous food sources (fall). The
results from the δ15N signatures reiterated the type of trophic structure, and high positioning of the
meiofauna in the food web.
Web properties based on binary approach from GCA
Previous studies have reported food web-sizes lower than those found in the current study (see
Dunne et al. 2004), and none used such high taxonomic resolution including both basal and
meiofaunal species. Highly-resolved and complex webs are often dominated in species number by
intermediate taxa mostly belonging to the meiofauna (Schmid-Araya et al. 2002, Hillebrand and
Shurin 2005), that translates into greater number of links between intermediate species (I-I) in webs
of previous studies (Martinez 1991, Schmid-Araya et al. 2002). In contrast, the Lambourn had
greater proportions of top and basal species most of the year while even proportions occurred only
in the summer. Another distinction from previous food webs was that more than a quarter of
invertebrate species, categorized as top consumers, were of meiofaunal size, which is a direct
consequence of the high resolution level employed.
The number of predatory species was low in the Lambourn but comparable to those of the Duffin
Creek (Tavares-Cromar and Williams 1996), implying that some systems are characterised by low
predator-prey ratios. Recent findings draw attention to that predator-prey biomass ratios decline
Acc
epte
d A
rtic
le
This article is protected by copyright. All rights reserved.
when ecosystems are bottom-heavy (Hatton et al. 2015). The assumption that macrofauna and fish
can solely describe a food web and its properties may greatly overestimate the true impact of
predation. Trout, which is known to feed mostly on drifting terrestrial organisms (Dahl 1998), was
absent from our study area, while bullhead, a benthic feeder, consumes on average 2.7 prey items
day-1 (Adamicka 1991) which compares well with our data from the Lambourn with a daily
consumption of 3.1 items (Schmid-Araya personal observation). Comparatively, the likely impact of
meiobenthic tanypods is much larger considering that a single individual of a species consumes daily
on average 2.6 (SE ± 0.3) prey items (Schmid and Schmid-Araya 1997), which would be equivalent to
a mean daily consumption rate of 180.0 prey items m-2 in the Lambourn. As the top consumer
position of meiofauna species demonstrates, it is apparent that their high abundance and species
richness reduces the potential impact of the macrofauna and fish predation on the food-web in the
Lambourn. Finding the meiofauna high in the food web challenges the assumption that ‘small body
mass’ taxa occur low in the food web or as an intermediate component and question the simple
notion that trophic position increases with body size. In sandy sediments, similar ranges of stable
isotopes signatures among macro- and meiofauna indicate that the latter can be placed at the same
trophic height as the former (Evrard et al. 2010). If the meiofauna generally plays a major role in
energy transfers by being higher up in the food web, will remain elusive as long as food web
ecologists do not integrate small-sized organisms in web analyses.
Using the binary approach evidenced a low percentage of omnivores in the Lambourn similar to
tropical streams in Hong Kong (Dudgeon et al. 2010) and it might confirm that omnivory is much less
common in streams than in lakes (Thompson et al. 2007). Detritivory and omnivory are feeding
modes that are difficult to quantify with CGA (see Caveats), resulting in an inadequate
representation of their importance in food webs (Jepsen and Winemiller 2002).
Acc
epte
d A
rtic
le
This article is protected by copyright. All rights reserved.
Taxonomic resolution
In the Lambourn, several key food web properties were sensitive to changes in taxonomic
resolution whether the manipulation reduced the number of basal, intermediate or meiofaunal
species. A decrease in resolution (in whatever form) creates an evident reduction of the number of
species involved in a food web (Thompson and Townsend 2000), with a concomitant decrease in
web size, number of links and links per species. Our results agree with previous findings (Martinez
1991; Thompson and Townsend 2000) that a reduction of resolution affected properties such as
linkage density and predator/prey ratios. However, contrasting results were found for connectance,
where similar to our results, Martinez (1991) depicted it as a robust parameter while Thompson and
Townsend (2000) found the opposite.
An important problem in describing food webs is deciding how many and which groups of
organisms should be included for a web to represent a meaningful trophic structure (Martinez
1991). Our results are the first to consider the effects of resolution of basal, and particularly
intermediate and meiofaunal species and, thus, await results in other systems. We demonstrate that
aggregating basal, intermediate and meiofaunal species constitute a challenge in the standardization
when documenting a web. To skip basal and meiofauna species leads to a crude underestimation of
proportions of species, types of links and, thus, bias the interpretation of food web patterns and
system’s complexity, considering that their contribution to species richness and biomass production
is substantial (i.e., Schmid-Araya et al. 2002). However, few studies have examined this aspect.
More compelling is that our results are in contrast to previous taxonomic resolution analyses, as we
detected significant seasonal variations in key web characteristics emphasizing the dynamics of food
webs and, therefore, temporal dynamics ought to be considered prior generalising any food web
patterns (see McMeans et al. 2015).
Acc
epte
d A
rtic
le
This article is protected by copyright. All rights reserved.
Staple Isotopes Analysis (SIA)
The general SIA results showed that meiofauna did not exclusively derive carbon from either
allochthonous or autochthonous food sources. Grazing of bacteria, algae, detritus, diatoms, and
protozoa by lotic meiofauna (Finlay et al. 1993, Hall and Meyer 1998), as well as preying on other
meiofauna (Schmid & Schmid-Araya 1997) is well documented. The δ13C signatures of meiofaunal
taxa and food sources fall well within the ranges reported by Trimmer et al. (2009) for the
macrofauna (i.e. Gammarus pulex, Simulium) and their putative resources in the same river. Non-
predatory chironomids and harpacticoids showed somewhat depleted δ13C signatures towards the
spring, but were only significant for the latter group. Both seemed reliant on biofilm and Ranunculus
spp., but their δ13C signature values were not as low as the ones reported by Trimmer et al. (2009)
for cased-caddies feeding on methane-oxidising bacteria. We expected that the meiofauna
(harpacticoids, oligochaetes, and non-predatory chironomids) could ingest this type of bacteria
because of their detritivorous mode of feeding. They inevitably ingest parts of the microbial biofilm
that coats diverse detrital surfaces. At a finer scale of genus/species level, major shifts in the δ13C
content indicated seasonal shifts in the food sources (from algae to Spartina detritus) of coastal
meiofaunal consumers (Carman and Fry 2002, Moens et al. 2002). Moreover, meiobenthos’
resources were different in an estuarine food web in and adjacent to seagrass Zostera noltii
(Vafeiadou et al. 2014). Thus, meiofaunal trophic plasticity is well known, and in freshwaters, many
protozoa (here testate amoebae), and meiofaunal species feed opportunistically and randomly on a
wide range of abundant food items (Finlay et al. 1993, Schmid and Schmid-Araya 1997).
The hypernutrified condition of the Lambourn (Pretty et al. 2006) reflected on the δ15N signatures
of the basal resources as these fell well within the ranges from rivers draining agricultural land
reported by Peipoch et al. (2012). In the Lambourn, the variation in δ15N between 4 and 8‰ across
the meiofauna community was nearly identical to variations (4‰ to 9‰) observed for its
Acc
epte
d A
rtic
le
This article is protected by copyright. All rights reserved.
macroinvertebrates (Pretty, pers. comm.). These δ15N signatures are also consistent with values for
marsh meiofauna (Carman and Fry 2002).
Despite our coarse taxa approach using SIA, there was a clear difference in δ15N among the
meiofauna with oligochaetes and non-predatory chironomids as primary consumers while
nematodes and predatory chironomids were higher in the food chain. Freshwater nematodes feed
on a wide range of food items (i.e., bacteria, algae, ciliates, rotifers, nematodes, Naididae
oligochaetes, Schmid-Araya pers. observation) similar to their marine counterparts (Moens et al.
2005). Their high trophic position, based on δ15N ranged seasonally on average between 6.7 and
7.4‰, suggests that most nematodes in the Lambourn were omnivores/predators. Strikingly the
range of δ15N values of predatory chironomids of the genus Conchapelopia was also narrow, (7.1 to
7.3‰ seasonal averages) indicating one high trophic level (predatory/omnivore). We were able to
discern with the GCA a wide variety of prey items including testate species (Protozoa). In contrast,
two detritivores (harpacticoids, non-predatory chironomids) and the predatory/omnivore cyclopoids
showed wider ranges in δ15N values suggesting more than one trophic level. Cyclopoid copepods are
known to feed on members of the microbial loop (Reiss and Schmid-Araya 2011), while non-
predatory chironomids mostly of the genus Corynoneura were bacterivorous (Schmid and Schmid-
Araya 1997).
Our mean δ15N enrichment value was 1.896 ‰ (± 0.157) contrasting with the standard 3.4‰
fractionation of δ15N (Post 2002) and being much closer to 2.3‰ of Mc Cutchan et al. (2003).
Estimates of trophic levels depended on which fractionation standard was used, ranging between
1.75 and 2.33 (using 3.4‰) and between 1.02 and 3.76 (using 2.3‰). These values are consistent
with our estimates of average chain length, but not with trophic levels based on GCA. Although
trophic enrichment is crucial to estimate consumer trophic level, there is no consensus which of the
many factors (i.e. developmental stage, taxon, feeding habits, seasons) affects δ15N fractionation
(Perkins et al. 2014).
Acc
epte
d A
rtic
le
This article is protected by copyright. All rights reserved.
Although we depicted interspecies variability in terms of the extent of δ15N and δ13C signature
ranges, a drawback of our coarser taxonomic SIA results that resource use may be highly species
specific (Vafeiadou et al. 2014). As we might have lumped species of nematodes possibly belonging
to different trophic levels, the SIA may slightly underestimate chain length.
Caveats
Our data confirms recent findings such as Majdi et al. (2012) that streams have complex feeding
interactions not solely depending on allochthonous organic matter but also on autochthonous
resources. Our results from GCA of macro- and meiofaunal species demonstrate a strong
dependence on allochthonous and autochthonous carbon sources. The SIA confirmed the latter
result and placed meiofauna taxa into several trophic levels, but clearly delimiting a high trophic
level for predatory chironomids.
However, some differences arose because some taxa (i.e. nematodes) were lumped for the SIA.
It is well established that predatory marine nematodes can obtain their carbon through
heterotrophic protists or other small prey, which in turn depend on various food sources (Moens et
al. 2002). In the Lambourn, no study has assessed the abundances of ciliates, flagellates and
amoeba but we speculate that they will be high (Schmid-Araya unpublished). Our results of gut
content data revealed a high incidence of basal resources in the guts of predatory taxa, which would
reduce δ15N enrichment of predators relative to their prey, therefore, confounding isotopic analysis
of trophic structure.
Obviously, feeding interactions cannot be established in GCA in piercers and suckers (i.e.
nematodes, tardigrades) or those species feeding on soft-bodied taxa (i.e. gastrotrichs,
microturbellarians) and most members of the microbial loop. This contrasts to benthic rotifers and
testates which are easily identifiable (Schmid and Schmid-Araya 1997).
Acc
epte
d A
rtic
le
This article is protected by copyright. All rights reserved.
Studies on biodiversity, food web topology and conceptual ecological models should be further
refined to include meiofauna species assemblages in order to enhance their realism, and
consequently, predictive capabilities and rigour.
ACKNOWLEDGEMENTS
This research was supported by a Natural Environmental Research Council Tied Studentship
NER/S/S/2003/11718 within the LOwland CAtchment Research (LOCAR) thematic program. We
thank the Parasampia Golf and Country Club for access to field sites. We are grateful to Peter Tod
and others for assistance with fieldwork. We thank the subject editor and two anonymous referees
whose comments and suggestions greatly improved an earlier version of the manuscript.
LITERATURE CITED
Adamicka, P.S. 1991. A food schedule for Cottus gobio L. (Pisces) in Oberer Seebach, Ritrodat-Lunz
study area, Austria. Verhandlungen Internationalen Verein Limnologie 24: 1941-1943.
Anderson, M. J. 2006. Distance-based tests for homogeneity of multivariate dispersions. Biometrics
62: 245-253.
Anderson, M. J., and D.C.I. Walsh. 2013. PERMANOVA, ANOSIM, and the Mantel test in the face of
heterogeneous dispersions: What null hypothesis are you testing? Ecological Monographs 83:
557-574.
Bradley, J., J. Cardinale, M.A. Palmer, C.M. Swan, S. Brooks, and N. LR. Poff. 2002. The influence of
substrate heterogeneity on biofilm metabolism in a stream ecosystem. Ecology 83: 412-422.
Acc
epte
d A
rtic
le
This article is protected by copyright. All rights reserved.
Burd, B.J., T.A. Macdonald, and A. van Roodselaar. 2012. Towards predicting basin-wide invertebrate
organic biomass and production in marine sediments from a coastal sea. PLoS ONE 7(7): e40295.
doi:10.1371/journal.pone.0040295.
Carman, K. R., and B. Fry 2002. Small-sample methods for δ13C and δ15N analysis of the diets of
marsh meiofaunal species using natural-abundance and tracer-addition isotope techniques.
Marine Ecology Progress Series 240: 85-92.
Clarke, K.R., P.J., Somerfield, and R.N. Gorley. 2008. Testing of null hypotheses in exploratory
community analyses: similarity profiles and biota-environment linkage. Journal of Experimental
Marine Biology 336: 56-69.
Dahl, J. 1998. Effects of a benthivorous and drift-feeding fish on a benthic stream assemblage.
Oecologia 116: 426-432.
Davis, A.M., M.L. Blanchete, B.J. Pusey, T.D. Jardine, and R.G. Pearson. 2012. Gut content and stable
isotope analyses provide complementary understanding of ontogenetic dietary shifts and trophic
relationships among fishes in a tropical river. Freshwater Biology 57: 2156-2172.
Dudgeon, D., F.K.W. Cheung, and S.K. Mantel. 2010. Food web structure in small streams: do we
need different models for the tropics? Journal of the North American Benthological Society 29:
395–412.
Dunne, J. A., R. J. Williams, and N.D. Martinez. 2004. Network structure and robustness of marine
food webs. Marine Ecology Progress Series Mar. Ecol. Progr. 273: 291–302.
Evrard, V., K. Soetaert, C.H.R. Heip, M. Huettel, M.A. Xenopoulos, and J.J. Middelburg. 2010. Carbon
and nitrogen flows through the benthic food web of a photic subtidal sandy sediment. Marine
Ecology Progress Series 416: 1-16.
Acc
epte
d A
rtic
le
This article is protected by copyright. All rights reserved.
Finlay, B.J., C. Téllez and G. Esteban. 1993. Diversity of free-living ciliates in the sandy sediment of a
Spanish stream in winter. Journal of General Microbiology 139: 2855-2863.
Giles, N., J. Westgarth, and N. Hewlett. 2004. Management advice for trout, grayling and Artic char
fisheries. Fisheries Technical Manual 7. Environment Agency. 282pp.
Hall, R. O., and J.L. Meyer. 1998. The trophic significance of bacteria in a detritus-based stream food
web. Ecology 79: 1995-2012.
Hatton, I.A., K.S. McCann, J.M. Fryxell, T.J. Davies, M.Smerlak, A.R. Sinclair, and M. Loreau. 2015. The
predator-prey power law: Biomass scaling across terrestrial and aquatic biomes. Science 349:
1071- 1083.
Hillebrand, H., and J.B. Shurin. 2005. Biodiversity and aquatic food webs. Pages 184-197 in A.
Belgrano, U.M. Scharler, J. Dunne and R. E. Ulanowicz editors. Aquatic food webs. An ecosystem
approach. Oxford University Press, Oxford, UK.
Jepsen, D. B. and K. O. Winemiller. 2002. Structure of tropical river food webs revealed by stable
isotope ratios. Oikos 96: 46-55.
Majdi, N., M. Tackx, and E. Buffan-Dubau. 2012. Trophic positioning and microphytobenthos carbon
uptake of biofilm-dwelling meiofauna in a temperate river. Freshwater Biology 57: 1180-1190.
Martinez, N. D. 1991. Artifacts or attributes? Effects of resolution on the Little Rock lake food web.
Ecological Monographs 61: 367-392.
McCutchan, J. H., W. M. Lewis, C. Kendal, and C. C.McGrath. 2003. Variation in trophic shift for stable
isotope ratios of carbon, nitrogen, and sulfur. Oikos 102:378–390.
McMeans, B. C., K.S. McCann, M. Humphries, N. Rooney, and A. T. Fisk. 2015. Food web structure in
temporally-forced ecosystems. Trends in Ecology & Evolution 30: 662-672.
Acc
epte
d A
rtic
le
This article is protected by copyright. All rights reserved.
Mills, C.A. and R.H.K. Mann. 1983. The bullhead Cottus gobio, a versatile and successful fish. Annual
Reports of the Freshwater Biological Association 51:76-88.
Moens, T., C. Luyten, J.J. Middelburg, P.M. Herman, and M. Vincx. 2002. Tracing organic matter
sources of estuarine tidal flat nematodes with stable carbon isotopes. Marine Ecology Progress
Series 234: 127-137.
Moens, T., S. Bouillon, and F. Gallucci. 2005. Dual stable isotope abundances unravel trophic position
of estuarine nematodes. Journal of the Marine Biological Association of the United Kingdom 85:
1401-1407.
Oksanen, J., F. G. Blanchet, R. Kindt, P. Legendre, R. B. O'Hara, G. L. Simpson, P. Solymos, M. H. H.
Stevens, and H. Wagner. 2010. vegan: community ecology package version 2.2.
Peipoch, M., E. Martí, and E. Gacia. 2012. Variability in d15 N natural abundance of basal resources
in fluvial ecosystems: a meta-analysis. Freshwater Science 31: 1003-1015.
Perkins, M.J., R.A. McDonald, F.J.F. Van Veen, S.D. Kelly, G. Rees, and S. Bearhop. 2014. Application
of nitrogen and carbon stable isotopes (δ15N and δ13C) to quantify food chain length and trophic
structure. PLoS ONE 9(3): e93281. doi:10.1371/journal.pone.0093281.
Peters, L., C. Faust, and W. Traunspurger. 2012. Changes in community composition, carbon and
nitrogen stable isotope signatures and feeding strategy in epilithic aquatic nematodes along a
depth gradient. Aquatic Ecology 46: 371-384.
Post, D.M. 2002. Using stable isotopes to estimate trophic position: models, methods, and
assumptions. Ecology 83: 703-718.
Pretty, J. L., A. G. Hildrew, and M. Trimmer. 2006. Nutrient dynamics in relation to surface-
subsurface hydrological exchange in a groundwater fed chalk stream. Journal of Hydrology 330:
84-100.
Acc
epte
d A
rtic
le
This article is protected by copyright. All rights reserved.
R Development Core Team. 2008. R: a language and environment for statistical computing. R
Foundation for Statistical Computing, Vienna, Austria.
Reiss, J., and J.M. Schmid-Araya. 2010. Life history allometries and production of small fauna.
Ecology 91: 497-507.
Reiss, J., and J.M. Schmid-Araya. 2011. Feeding response of a benthic copepod to ciliate prey type,
prey concentration and habitat complexity. Freshwater Biology 56: 1519-1530.
Schmid, P.E. and J.M. Schmid-Araya. 1997. Predation on meiobenthic assemblages: resource use of a
tanypod guild (Chironomidae, Diptera) in a gravel stream. Freshwater Biology 38: 67-91.
Schmid-Araya, J. M., A.G. Hildrew, A. Robertson, P.E. Schmid, and J. Winterbottom. 2002. The
importance of meiofauna in food webs: evidence from an acid stream. Ecology 83: 1271-1285.
Schmid-Araya, J. M., D. Figueroa Hernandez, P. Schmid, and C. Druout. 2012. Algivory in food webs
of three temperate Andean rivers. Austral Ecology 37: 440-451.
Stead, T.K., J.M. Schmid-Araya, and A.G. Hildrew. 2005. Secondary production of a stream metazoan
community: Does the meiofauna make a difference? Limnology and Oceanography 50: 398-403.
Tavares-Cromar, A., and D.D. Williams. 1996. The importance of temporal resolution in food web
analysis: Evidence from a detritus-based streams. Ecological Monographs 66: 91-113.
Thompson, R.M., and C. R. Townsend. 2000. Is resolution the solution? The effect of taxonomic
resolution on the calculated properties of three stream food webs. Freshwater Biology 44: 413-
422.
Thompson, R.M., M. Hemberg, B.M. Starzomski, and J.B. Shurin. 2007. Trophic levels and trophic
tangles: the prevalence of omnivory in real food webs. Ecology 88: 612-617.
Acc
epte
d A
rtic
le
This article is protected by copyright. All rights reserved.
Thompson, R.M., J.A. Dunne, and G. Woodward. 2012. Freshwater food webs: towards a more
fundamental understanding of biodiversity and community dynamics. Freshwater Biology 57:
1329-1341.
Thorp, J. H., and M.D. Delong. 2002. Dominance of autochthonous autotrophic carbon in food webs
of heterotrophic rivers. Oikos 96: 543-550.
Tod, S.P., and J.M. Schmid-Araya. 2009. Meiofauna versus macrofauna: Secondary production of
invertebrates in a lowland chalk stream. Limnology and Oceanography 54: 450–456.
Trimmer, M., A. G. Hildrew, M. C. Jackson, J. L. Pretty and J. Grey. 2009. Evidence for the role of
methane-derived carbon in a free-flowing, lowland river food web. Limnology and Oceanography
54: 1541–1547.
Vafeiadou, A.-M., P. Materatski, H. Adão, M. De Troch, and T. Moens. 2014. Resource utilization and
trophic position of nematodes and harpacticoid copepods in and adjacent to Zostera noltii beds.
Biogeosciences 11: 4001-4014.
Vannote, R. L., G.W. Minshall, K.W. Cummins, J.R. Sedell, and C.E. Cushing. 1980. The River
Continuum Concept. Canadian Journal of Fisheries and Aquatic Sciences 37: 130-137.
Warton, D.I., S.T. Wright, and Y. Wang. 2012. Distance-based multivariate analyses confound
location and dispersion effects. Methods in Ecology and Evolution 3: 89-101.
Weather, H.S., D. Peach and A. Binley. 2007. Characterising groundwater-dominated lowland
catchments: the UK Lowland Catchment Research Programme (LOCAR). Hydrology and Earth
System Sciences 11: 108-124.
Wheeler, R.E. 2010. lmPerm: permutation tests for linear models. R package version 1.1-2.
Acc
epte
d A
rtic
le
This article is protected by copyright. All rights reserved.
TABLE 1. Food web properties and % of meio- and macrofaunal-sized species estimated for four seasonal webs, a summary web, and six aggregated
versions of summer and winter webs with coarsely aggregated basal (Basal), intermediate (Inter) and meiofauna (Meio) species from the streambed
community of the River Lambourn between 2004 and 2005.
Summer Winter
Spring Summer Fall Winter Summary Basal Inter Meio Basal Inter Meio
Web properties
Web size (S) 113 133 89 77 177 86 95 97 44 62 62
No. Links (L) 540 824 365 266 1303 234 455 587 93 187 203
Linkage density (L/S) 4.78 6.20 4.10 3.46 7.36 2.72 4.78 6.05 2.11 3.02 3.27
Directed connectance 0.04 0.05 0.05 0.04 0.04 0.03 0.05 0.06 0.05 0.05 0.05
Mean Chain Length 2.72 2.89 2.33 2.63 3.25 2.88 3.04 2.87 2.55 2.85 2.63
SD 0.81 0.79 0.47 0.70 0.88 0.81 0.78 0.77 0.70 0.79 0.69
Mean Trophic level 1.56 1.66 1.59 1.56 1.64 2.07 1.50 1.53 2.00 1.45 1.45
SD 0.52 0.52 0.52 0.54 0.52 0.30 0.53 0.54 0.35 0.52 0.53
Species proportions
Basal 0.45 0.37 0.43 0.47 0.40 0.02 0.52 0.51 0.05 0.56 0.57
Intermediate 0.17 0.30 0.18 0.21 0.27 0.47 0.02 0.19 0.39 0.03 0.15
Top consumer 0.38 0.33 0.39 0.33 0.35 0.51 0.46 0.31 0.57 0.40 0.29
Link proportions
T-B 0.52 0.44 0.63 0.50 0.41 0.36 0.80 0.49 0.46 0.71 0.53
T-I 0.02 0.06 0.07 0.05 0.06 0.20 0.03 0.04 0.15 0.03 0.04
I-I 0.03 0.04 0.00 0.03 0.04 0.15 0.01 0.03 0.10 0.01 0.03
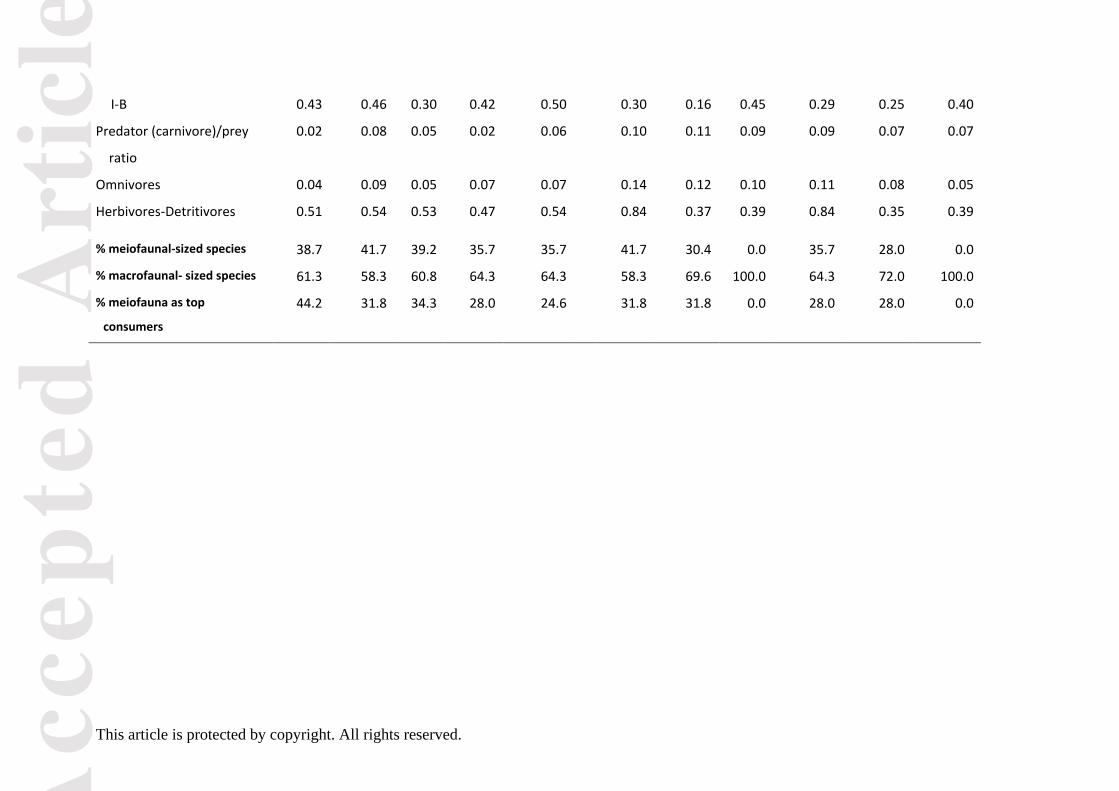
Acc
epte
d A
rtic
le
This article is protected by copyright. All rights reserved.
I-B 0.43 0.46 0.30 0.42 0.50 0.30 0.16 0.45 0.29 0.25 0.40
Predator (carnivore)/prey 0.02 0.08 0.05 0.02 0.06 0.10 0.11 0.09 0.09 0.07 0.07
ratio
Omnivores 0.04 0.09 0.05 0.07 0.07 0.14 0.12 0.10 0.11 0.08 0.05
Herbivores-Detritivores 0.51 0.54 0.53 0.47 0.54 0.84 0.37 0.39 0.84 0.35 0.39
% meiofaunal-sized species 38.7 41.7 39.2 35.7 35.7 41.7 30.4 0.0 35.7 28.0 0.0
% macrofaunal- sized species 61.3 58.3 60.8 64.3 64.3 58.3 69.6 100.0 64.3 72.0 100.0
% meiofauna as top
consumers
44.2 31.8 34.3 28.0 24.6 31.8 31.8 0.0 28.0 28.0 0.0
Acc
epte
d A
rtic
le
This article is protected by copyright. All rights reserved.
FIGURE LEGENDS
FIG. 1. Pictorial representation of the food web of the River Lambourn for summer 2004. (Numbers
represent food type/species listed in Appendix C). Grey coloured bubbles represent meiofaunal-
sized taxa.
FIG. 2. Nonmetric multidimensional scaling (NMDS) ordination plot based on food web properties
from the summer (SUobs) and winter (WIobs) seasons and their respectively three aggregated
versions (basal (bas), intermediate (int) and meiofauna (mei)) from the streambed community
of the River Lambourn between 2004 and 2005.
FIG. 3. Mean (± 1SE) variation of δ13C and δ15N for various meiofaunal groups and their basal
resources within the benthos of the River Lambourn during winter 2004, spring, summer and fall
2005. Bi = Biofilm, Ra = Ranunculus spp., Be = Berula erecta, FP = fine particulate organic matter,
NC = Non-predatory Chironomidae larvae, PC = Predatory Chironomidae larvae, HA =
Harpacticoid copepods, CY = Cyclopoida copepods, NE = Nematodes, OL = Oligochaetes. The
grey symbols in the winter plot represent an estimated overall mean across other seasons.
FIG. 4. Box plot of δ15C signatures of meiofauna and basal resources from the River Lambourn. Plotted are median values, interquartile ranges, minima and maxima. Open circles mark outliers.
Acc
epte
d A
rtic
le
This article is protected by copyright. All rights reserved.
Acc
epte
d A
rtic
le
This article is protected by copyright. All rights reserved.
NMS 1
-0.8 -0.6 -0.4 -0.2 0.0 0.2 0.4 0.6
NM
S 2
-0.4
-0.3
-0.2
-0.1
0.0
0.1
0.2
0.3
SUobs
SUmei
SUbas
SUint
WIobs
WImei
WIbas
WIint
FIG.2. Schmid-Araya et al.
Acc
epte
d A
rtic
le
This article is protected by copyright. All rights reserved.
FIG. 3. Schmid-Araya et al.
Summer
-40 -38 -36 -34 -32 -30 -28 -26
0
2
4
6
8
10
HANE
CY
NC
Ra
Bi
Be
Spring
-40 -38 -36 -34 -32 -30 -28 -26
0
2
4
6
8
10
HA
NE
CY
NC
FP
RaBi
Be
OL
N(‰
)
C(‰)
Fall
-40 -38 -36 -34 -32 -30 -28 -26
0
2
4
6
8
10
HA
NE PC
NC
Ra
Bi
Be
Winter
-40 -38 -36 -34 -32 -30 -28 -26
0
2
4
6
8
10
HA
NE
PCNC
CY
OL
FP
FP
FP
Acc
epte
d A
rtic
le
This article is protected by copyright. All rights reserved.
-50 -45 -40 -35 -30 -25 -20
Non-predatory Chironomidae
Cyclopoida copepods
Harpacticoida copepods
Nematoda
Oligochaeta
Predatory Chironomidae
Ranunculus spp.
Biofilm
Berula erecta
FPOM
C (‰)
FIG 4. Schmid-Araya et al.