trnsys modeling of a 100 mw combined cycle … · we present further work on our trnsys modeling of...
TRANSCRIPT
Trnsys Modeling of a 100 MW CombinedCycle Concentrated Solar Power Plant
Paul Julian Harper
December 1, 2009
Abstract
We present further work on our Trnsys modeling of a combined cycleConcentrated Solar Thermal power plant. The model presented in the firstreport produced average daylight power of around 5 MW .
We have now run the model for a full year, and adjusted control strate-gies and thermal storage based on the winter months of weakest sunshine.We also adjusted the control strategy so that the gas cycle and combustionchamber ran for a constant time period each day, rather than switching onand off triggered by solar flux levels in the morning and evening.
We also did careful checking of both the gas and steam cycles to ensurethat the model parameters and generated power were in sensible ranges,and that they matched other third party model parameters for similar steamand gas turbine power cycles.
Finally we scaled all parameters up by a factor of 20x to model a plantthat had an average year round capacity of 81 MW Electric and a peak ca-pacity of 158 MW. We also added a blower to the concrete thermal storageto account for the parasitic losses incurred when the thermal storage wasbeing discharged.
1 The model
This plant model is based on the SUNSPOT concept proposed by Prof D Kröger.[Krö08]. It is modeled in TRNSYS [Kea05], a modeling system designed forthermal modeling of buildings, but now also widely used in the CSP industry[BMC08], [QZY08]. The initial model on Figure 1 on page 2 consists of a field of 200 he-liostats of size 100 m2each. These focus onto an air receiver. Air is compressedto 15 bar and fed through the receiver at 75 tons/hr when the solar flux ontothe receiver reaches 1x10⁷ kJ/hr or roughly 3 MW thermal. After the receiverthere is a combustion chamber that raises the air temperature to 1100 C. This
1

Figure 1: Plant Schematic
hot air is then fed through a turbine and exhausts from the turbine at roughly500 C. This exhaust air is then split (depending on steam demand) between aHeat Recovery Steam Generator (HRSG) and a thermal storage consisting of1000 tons of thermal concrete with pipes running down its length. We initiallytried to use the thermal store composed of a rock bed, but problems with thismodel led us to use the concrete heat store. Substantial work has been doneat Stellenbosch on modeling a rock bed storage [AKF09] , and it would be auseful piece of future work to incorporate a rock bed storage into the model
During the day (when we have the compressor running) the raw gas tur-bine power was roughly 10 MW and the turbine electrical output about 4MW.The other 6MW was used to drive the compressor, and was lost in electricalinefficiency in the generator. The dip in the electrical power output is presum-ably due to the slightly different thermodynamic properties of the gas (pure airat noon, more combustion products in the morning and evening).
The HRSG and thermal store is controlled by a steam demand pattern whichwe set empirically. We requested 20 tons/hr of hot air into the HRSG through-out the day, with a ramp up to 75 tons/hr during Eskom’s peak load period.The ramp up from 20 to 75 tons/hr occurred over the hour from 15h00 to16h00, and the ramp down back to 20 ton/hr occurred between 20h00 and21h00. This pattern is easily configurable for any demand pattern or pric-ing model that a grid operator might demand. When there is hot gas flow-
2

ing from the turbine exhaust, the thermal control decides whether to chargethe thermal store or provide gas directly to the HRSG based on the steam de-mand. The thermal store can either be in charge mode or discharge mode,it cannot do both simultaneously. This model includes a water condenser,mainly because there was not an air condenser component in the STEC li-braries. This might be a useful addition to the libraries to write such a com-ponent. Based on South African conditions, we would probably want to moveto an air condenser[Krö03], which would save water, but at a slight decrease inefficiency.
2 Results for a full year
2.1 Air Compressor controlled by solar flux
We ran the initial 5 MW model for a full year. Initially we started the aircompressor when the solar flux reached a threshold level (1x10⁷ kJ/hr), andswitched it off again in the evening when it fell below the threshold again.Firstly we examine performance after the system has charged up the thermalstorage (1000 tons of thermal concrete) for 20 days, and examine the temper-atures and flow rates of the steam cycle at dates around 20 and 21 January.In Figure 2 on page 4 and Figure 3 on page 4 we see the storage charge anddischarge during summer. We see that the steam generator hot gas flow con-tinues throughout the night, and the temperature of the hot end of the storageas shown in Figure 4 on page 5 never drops below the cut off value (whichwe set at 350 C). The temperature of the cold end of the thermal store is alsoplotted and appears at the bottom of the graph. We also note that the air cycleand combustion chamber run for about 10 hours per day (dotted line in Figure2 on page 4).
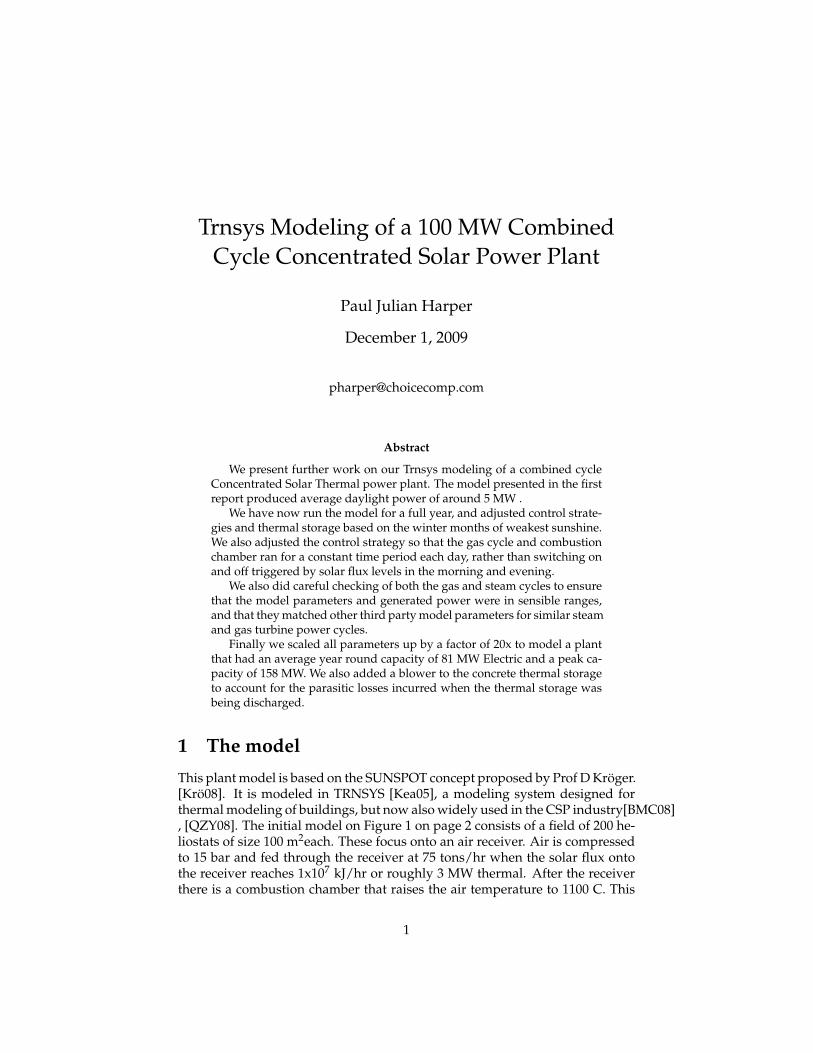
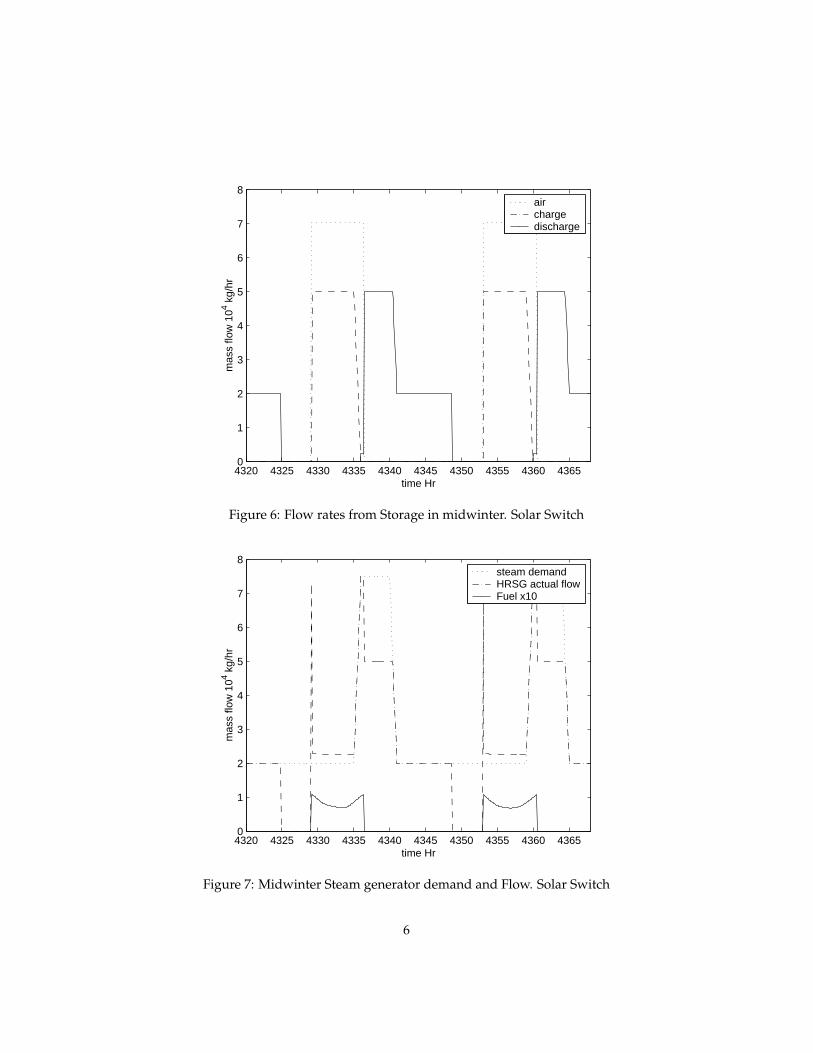
In Figure 6 on page 6 to Figure 9 on page 7 we see the same graphs fortwo days in mid winter. Firstly we note that the air cycle only runs for aboutjust under eight hours. The storage gets completely depleted and the steamgenerator “runs out of steam” during the early morning hours. We could tryincreasing the size of the storage, but there is just not enough heat input intothe system to drive the steam generation during the long winter nights.
The corresponding power graphs for summer are shown in Figure 10 onpage 8 and for mid winter are shown in Figure 11 on page 8. In these graphsthe dotted line is the the gas turbine gross output power (before powering thecompressor). The dashed line the is gas turbine electric output power and thesolid line is the combined gas and steam electric output power. Note that evenat the peak of power production, the electric power from the steam cycle isless than half the power from the gas turbine. In these graphs we also note thefall off in electric power around hour 4348 (a mid winter night).
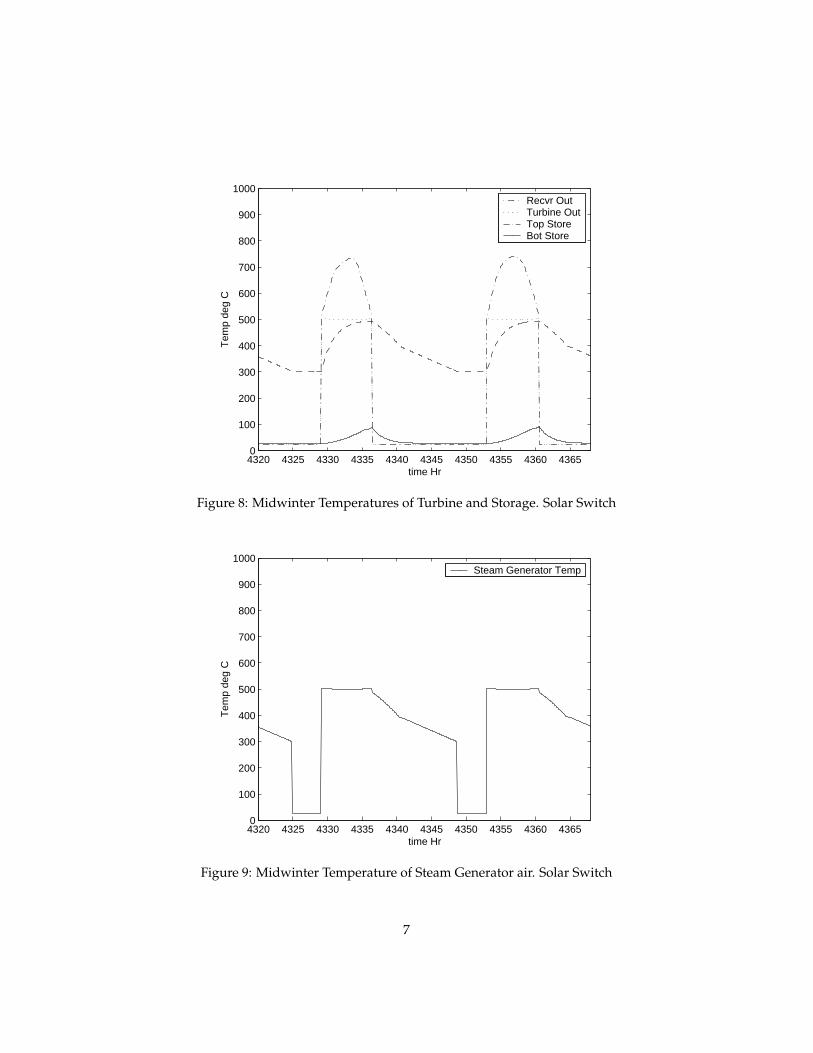
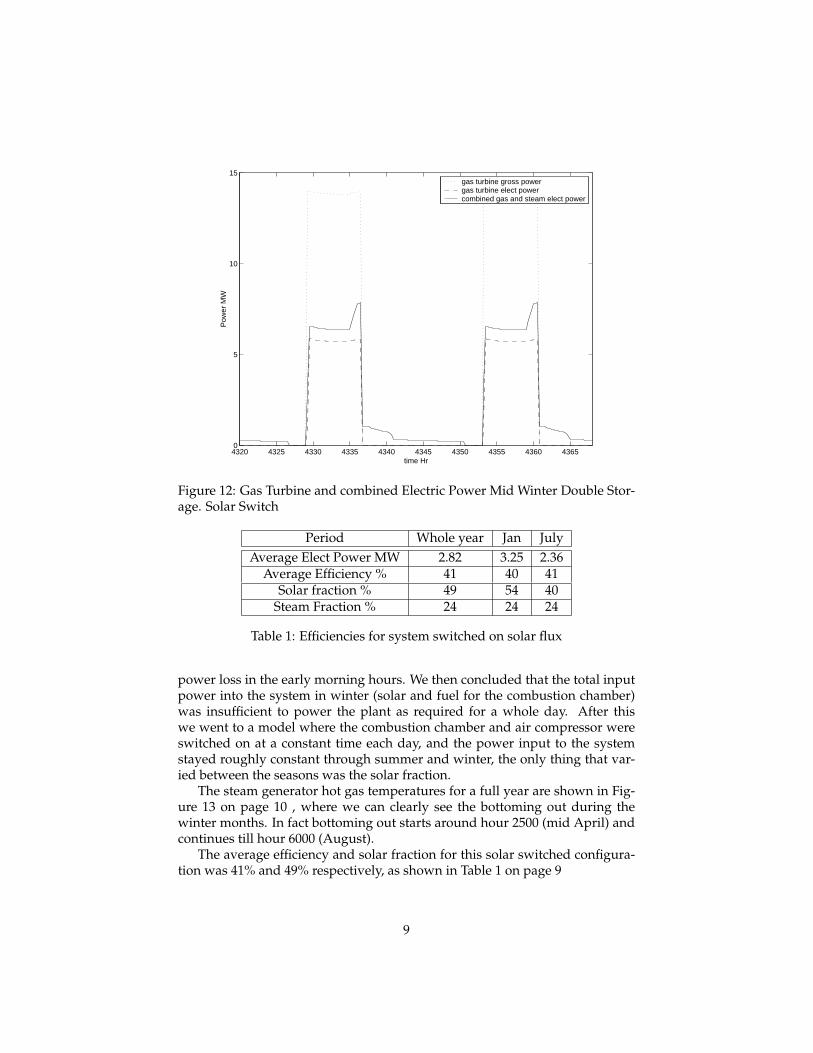
We did attempt to double the size of the thermal store to avoid this powerfall off, and this did give us an extra three hours of running in the mid winternights, as seen in Figure 12 on page 9 but it was still not enough to prevent
3

435 440 445 450 455 460 465 470 475 4800
1
2
3
4
5
6
7
8
time Hr
mas
s flo
w 1
04 kg/
hr
airchargedischarge
Figure 2: Jan Air flow rates after 20 days. Solar Switch
435 440 445 450 455 460 465 470 475 4800
1
2
3
4
5
6
7
8
time Hr
mas
s flo
w 1
04 kg/
hr
steam demandHRSG actual flowFuel x10
Figure 3: Jan Steam generator demand and flow. Solar Switch
4

435 440 445 450 455 460 465 470 475 4800
100
200
300
400
500
600
700
800
900
1000
time Hr
Tem
p de
g C
Recvr OutTurbine OutTop StoreBot Store
Figure 4: Jan Temperatures of Turbine and Storage. Solar Switch
435 440 445 450 455 460 465 470 475 4800
100
200
300
400
500
600
700
800
900
1000
time Hr
Tem
p de
g C
Steam Generator Temp
Figure 5: Jan Temperature of Steam Generator air. Solar Switch
5
4320 4325 4330 4335 4340 4345 4350 4355 4360 43650
1
2
3
4
5
6
7
8
time Hr
mas
s flo
w 1
04 kg/
hr
airchargedischarge
Figure 6: Flow rates from Storage in midwinter. Solar Switch
4320 4325 4330 4335 4340 4345 4350 4355 4360 43650
1
2
3
4
5
6
7
8
time Hr
mas
s flo
w 1
04 kg/
hr
steam demandHRSG actual flowFuel x10
Figure 7: Midwinter Steam generator demand and Flow. Solar Switch
6
4320 4325 4330 4335 4340 4345 4350 4355 4360 43650
100
200
300
400
500
600
700
800
900
1000
time Hr
Tem
p de
g C
Recvr OutTurbine OutTop StoreBot Store
Figure 8: Midwinter Temperatures of Turbine and Storage. Solar Switch
4320 4325 4330 4335 4340 4345 4350 4355 4360 43650
100
200
300
400
500
600
700
800
900
1000
time Hr
Tem
p de
g C
Steam Generator Temp
Figure 9: Midwinter Temperature of Steam Generator air. Solar Switch
7

435 440 445 450 455 460 465 470 475 4800
5
10
15
time Hr
Pow
er M
W
gas turbine gross powergas turbine elect powercombined gas and steam elect power
Figure 10: Gas Turbine and combined Electric Power Mid Summer. SolarSwitch
4320 4325 4330 4335 4340 4345 4350 4355 4360 43650
5
10
15
time Hr
Pow
er M
W
gas turbine gross powergas turbine elect powercombined gas and steam elect power
Figure 11: Gas Turbine and combined Electric Power Mid Winter. Solar Switch
8
4320 4325 4330 4335 4340 4345 4350 4355 4360 43650
5
10
15
time Hr
Pow
er M
W
gas turbine gross powergas turbine elect powercombined gas and steam elect power
Figure 12: Gas Turbine and combined Electric Power Mid Winter Double Stor-age. Solar Switch
Period Whole year Jan JulyAverage Elect Power MW 2.82 3.25 2.36
Average Efficiency % 41 40 41Solar fraction % 49 54 40
Steam Fraction % 24 24 24
Table 1: Efficiencies for system switched on solar flux
power loss in the early morning hours. We then concluded that the total inputpower into the system in winter (solar and fuel for the combustion chamber)was insufficient to power the plant as required for a whole day. After thiswe went to a model where the combustion chamber and air compressor wereswitched on at a constant time each day, and the power input to the systemstayed roughly constant through summer and winter, the only thing that var-ied between the seasons was the solar fraction.
The steam generator hot gas temperatures for a full year are shown in Fig-ure 13 on page 10 , where we can clearly see the bottoming out during thewinter months. In fact bottoming out starts around hour 2500 (mid April) andcontinues till hour 6000 (August).
The average efficiency and solar fraction for this solar switched configura-tion was 41% and 49% respectively, as shown in Table 1 on page 9
9

0 1000 2000 3000 4000 5000 6000 7000 80000
100
200
300
400
500
600
700
800
900
1000
time Hr
Tem
p de
g C
Steam Generator Temp
Figure 13: Steam generator Hot Gas Temperatures Whole Year. Solar Switch
2.2 Air Compressor controlled by time switch
In this configuration, the air compressor and combustion chamber were switchedon at the same time each day, summer and winter. This enables other compo-nents in the plant to be correctly sized, as the total energy into the system dayby day remains the same throughout the year. The air flow ramps up during5h45 to 6h00 from 0 to 75 tons/hr, and ramps down again from 18h45 to 19h00.The initial charging of the thermal storage in shown in Figure 14 on page 11and Figure 15 on page 11. From this graph we can see that when charging acompletely cold thermal store, only on the first night do we loose steam capa-bility, and steady state is reached after roughly 5 days.
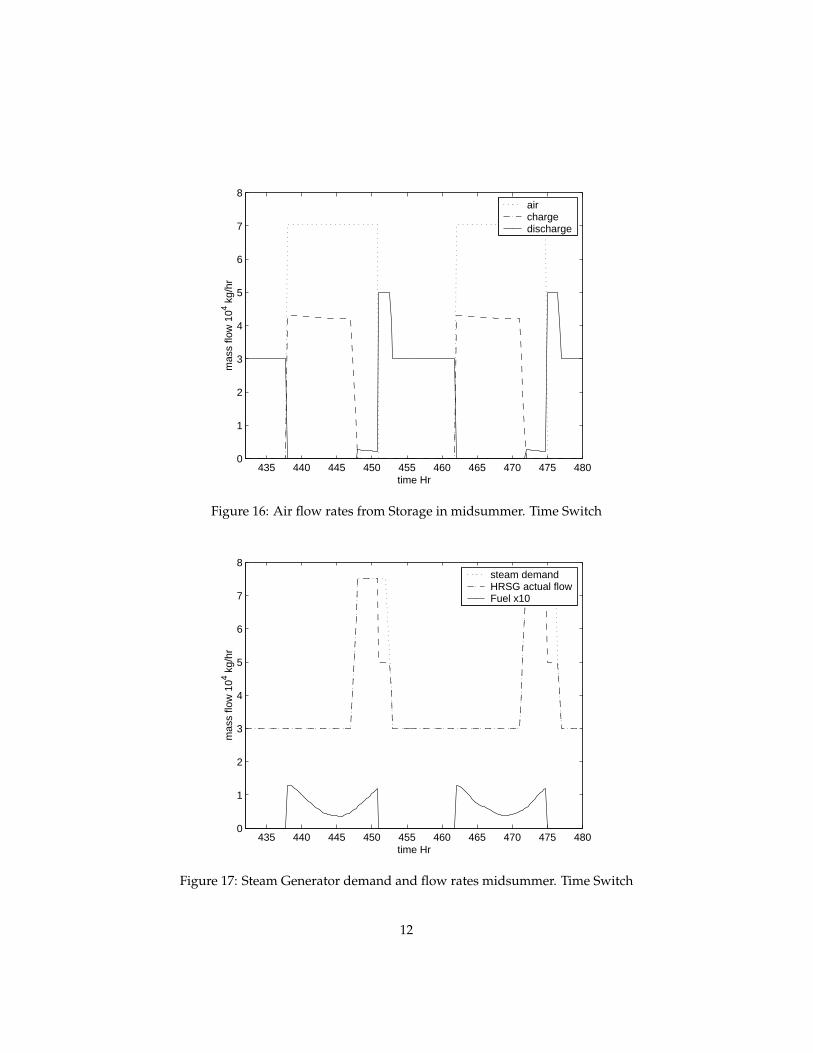
Graphs of the flow rates for this constant time system in midsummer andmidwinter are shown in Figure 16 on page 12 to Figure 23 on page 15 respec-tively. These should be compared to Figure 2 on page 4 and Figure 6 on page6which show the same variables, but the system switched on and off by solarflux.
With this extra energy input, we noticed that the thermal storage was notgetting depleted during the evenings, and increased the off peak steam de-mand, first to 30 tons/hr, then to 40 tons/hour to try to extract maximum elec-trical energy from the system. These efficiencies are shown in Table 2 on page17. Although there was a marginal increase in power for an off peak steamdemand of 40 ton/hr, we noticed that at this demand, the thermal storage wasdepleted each night, so we again ran out of steam during the night. Thus it
10

0 50 100 150 2000
1
2
3
4
5
6
7
8
time Hr
mas
s flo
w 1
04 kg/
hr
steam demandHRSG actual flowFuel x10
Figure 14: Initial Charging of Thermal storage. Steam Flow. Time Switch
0 50 100 150 2000
100
200
300
400
500
600
700
800
900
1000
time Hr
Tem
p de
g C
Recvr OutTurbine OutTop StoreBot Store
Figure 15: Initial Charging of Termal Storage. Temperatures. Time Switch
11
435 440 445 450 455 460 465 470 475 4800
1
2
3
4
5
6
7
8
time Hr
mas
s flo
w 1
04 kg/
hr
airchargedischarge
Figure 16: Air flow rates from Storage in midsummer. Time Switch
435 440 445 450 455 460 465 470 475 4800
1
2
3
4
5
6
7
8
time Hr
mas
s flo
w 1
04 kg/
hr
steam demandHRSG actual flowFuel x10
Figure 17: Steam Generator demand and flow rates midsummer. Time Switch
12

435 440 445 450 455 460 465 470 475 4800
100
200
300
400
500
600
700
800
900
1000
time Hr
Tem
p de
g C
Recvr OutTurbine OutTop StoreBot Store
Figure 18: Temperature of turbine and storage midsummer. Time Switch
435 440 445 450 455 460 465 470 475 4800
100
200
300
400
500
600
700
800
900
1000
time Hr
Tem
p de
g C
Steam Generator Temp
Figure 19: Steam Generator Temp midsummer. Time Switch
13

4320 4325 4330 4335 4340 4345 4350 4355 4360 43650
1
2
3
4
5
6
7
8
time Hr
mas
s flo
w 1
04 kg/
hr
airchargedischarge
Figure 20: Air flow rates from Storage in midwinter. Time Switch
4320 4325 4330 4335 4340 4345 4350 4355 4360 43650
1
2
3
4
5
6
7
8
time Hr
mas
s flo
w 1
04 kg/
hr
steam demandHRSG actual flowFuel x10
Figure 21: Steam demand and flow midwinter. Time Switch
14

4320 4325 4330 4335 4340 4345 4350 4355 4360 43650
100
200
300
400
500
600
700
800
900
1000
time Hr
Tem
p de
g C
Recvr OutTurbine OutTop StoreBot Store
Figure 22: Temperature of turbine and storage midwinter. Time Switch
4320 4325 4330 4335 4340 4345 4350 4355 4360 43650
100
200
300
400
500
600
700
800
900
1000
time Hr
Tem
p de
g C
Steam Generator Temp
Figure 23: Steam Generator Temp midwinter. Time Switch
15

4320 4325 4330 4335 4340 4345 4350 4355 4360 43650
5
10
15
time Hr
Pow
er M
W
gas turbine gross powergas turbine elect powercombined gas and steam elect power
Figure 24: Gas Turbine and combined Electric Power Mid Winter.Time Switch
seems that an off peak steam demand of 30 ton/hr is roughly optimum for thisplant size and control strategy. The remainder of this discussion and modelingwas done with an off peak steam demand of 30 ton/hr.
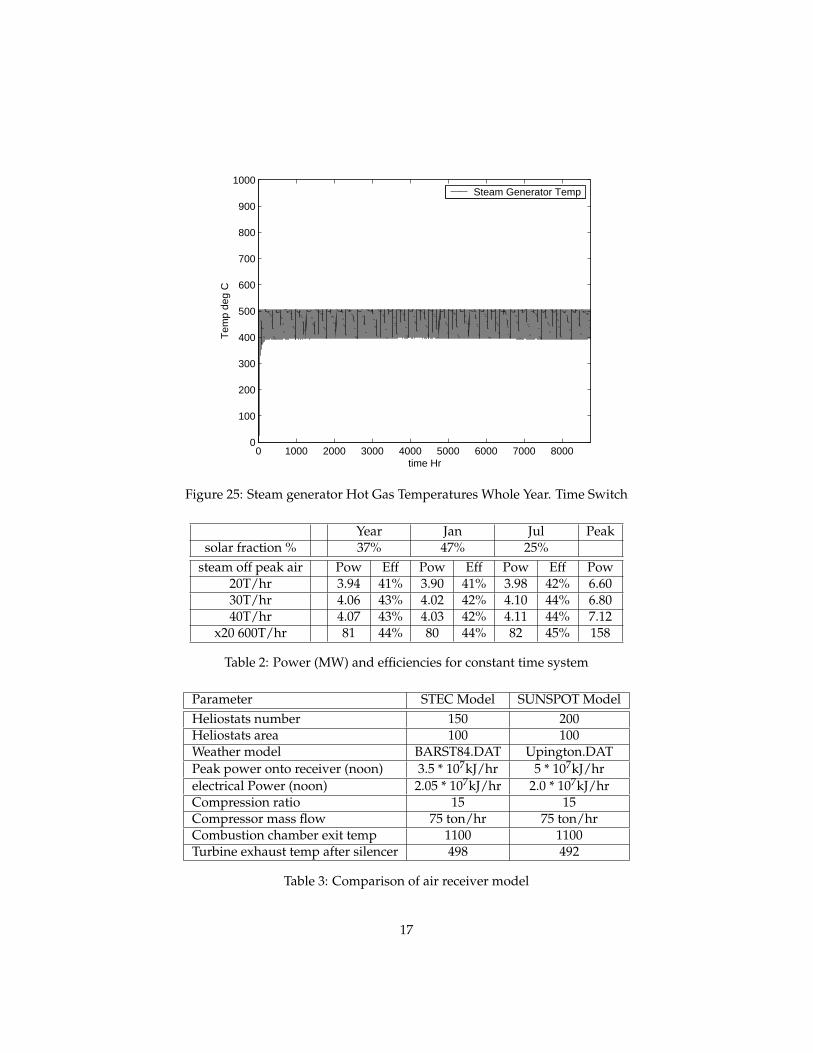
The power graphs for this constant time case for midwinter are shown inFigure 24 on page 16. The graph for midsummer is very nearly identical. Thissimilarity between summer and winter is clearly seen in the whole year plot ofFigure 25 on page 17 , especially when it is compared to Figure 13 on page 10(switched on solar flux).
The steam fraction (percentage of output power generated by the steamplant) was constant throughout the year and varied from 22% for the 20 Ton/Hrcase to 24% for the 40 ton/hr case.
3 Checking of model against known 3rd party mod-els
3.1 Heliostat - air receiver and turbine
We initially checked this against the individual STEC models for a heliostatfield with an air receiver with a gas turbine, and the separate STEC model fora steam cycle.
16
0 1000 2000 3000 4000 5000 6000 7000 80000
100
200
300
400
500
600
700
800
900
1000
time Hr
Tem
p de
g C
Steam Generator Temp
Figure 25: Steam generator Hot Gas Temperatures Whole Year. Time Switch
Year Jan Jul Peaksolar fraction % 37% 47% 25%
steam off peak air Pow Eff Pow Eff Pow Eff Pow20T/hr 3.94 41% 3.90 41% 3.98 42% 6.6030T/hr 4.06 43% 4.02 42% 4.10 44% 6.8040T/hr 4.07 43% 4.03 42% 4.11 44% 7.12
x20 600T/hr 81 44% 80 44% 82 45% 158
Table 2: Power (MW) and efficiencies for constant time system
Parameter STEC Model SUNSPOT ModelHeliostats number 150 200Heliostats area 100 100Weather model BARST84.DAT Upington.DATPeak power onto receiver (noon) 3.5 * 107kJ/hr 5 * 107kJ/hrelectrical Power (noon) 2.05 * 107kJ/hr 2.0 * 107kJ/hrCompression ratio 15 15Compressor mass flow 75 ton/hr 75 ton/hrCombustion chamber exit temp 1100 1100Turbine exhaust temp after silencer 498 492
Table 3: Comparison of air receiver model
17

3.1.1 Conclusion
The air receiver match was a good one as shown in Table 3 on page 17, themain difference being that there was more incident solar power available inUpington, and so less fuel was burnt in the combustion chamber.
3.2 Steam Cycle
The original STEC model for steam generation had different input parametersas shown in Table 4 on page 19 to those available from the gas turbine exhaustin our model, so we iteratively adjusted parameters till we had a good workingset. Initially we just added the existing exhaust gas from our air turbine modelto the existing STEC steam turbine model. This model was designed for ahigher hot air flow rate. (Compare column 2 and Column 3 in Table 4 on page19 .) This had the effect of producing a reasonable output power, but withsteam pressure only half of what was expected.
These combined cycle plants often run at a steam pressure of 100 bar [KRHS09], and this initial model only produced a steam pressure of 47 bar. This wascaused by the turbines being too large for the heat input, so steam pressurecould never build up properly. Another factor indicated a mismatched HRSGwas the fact that the pinch point was nearly zero. Pinch point is defined as thehot gas exhaust temperature leaving the evaporator, and the steam tempera-ture leaving the evaporator. For most steam plants this is between 8 and 15C.
In column 4 of the table we halved the steam flow rates through the turbinesand halved the heat heat transfer capacity of the heat exchangers and this hadthe effect of bringing the steam pressure up to expected levels, although with aslight decrease in power output. (Buying a turbine of twice the needed capacityis probably not the most economical way to increase power output). The pinchpoint here was 6.5 C which is more reasonable.
3.2.1 Conclusion
After adjusting the model to the maximum available heat flow, we got goodagreement, and power output in the expected range. We also checked thesteam cycle against a model in a combined cycle book,[KRHS09] and it waswithin expected ranges.
4 Scale up to 100 MW Plant size
Next we scaled all flow rates in the plant up by a factor of 20 to get a plant inthe 100 MW range. At this stage we also added a blower to model the parasiticlosses caused by the discharge of the thermal store. The results of this run arealso summarized in Table 2 on page 17 . The mean power over the whole year
18

Parameter STEC Model(steady state)
Sunspot model(4pm peak)
identical params toSTEC model
Sunspot model(4pm peak) steamflow rates halved
Hot side input flow 130 ton/hr 75 ton/hr 75 ton/hr
Hot side input temp 574 497 497
Condensing Temp 35 35 35
T De-aerator water out 151 126 147
T preheat cold side out 207 178 204
T econ cold side out 306 261.3 304
T evap cold side out 311 261.2 303.6
T evap hot side out 316 261.6 310.2
Pinch Point 5 0.4 (no pinch point) 6.5
T superh cold side out 500 437 438
Steam Press superh bar 100 47 90
Total steam power out106kJ/hr/MW
17.03 / 4.73 7.90 / 2.19 7.17 / 1.99(pressure better but
power worse)
economizer HTC(kJ/hr.K) *1000
390 390 195
evaporator HTC(kJ/hr.K) *1000
495 495 248
Table 4: Steam model comparison
19

Number heliostats 4000Heliostat area each 100 m2
Combustion chamber exit temp 1100Combustion chamber air flow 1500 ton/hr
compressor pressure 15 barPeak power electric 117 MW
Peak turbine shaft power 280 MW
Table 5: Solar Field and gas turbine Plant Parameters for 100 MW Plant
Mass thermal concrete 20,000 tonLength 100 m
Total cross section area pipes 20 m2
Table 6: Thermal Storage Plant Parameters for 100 MW Plant
was 81 MW, and the peak power 158 MW. Average efficiency (output power di-vided by combined solar and fuel input) during the whole year was 44%. For adedicated combined cycle plant, efficiencies are of the order of 57% [KRHS09].The difference between our Sunspot model and a dedicated plant can be ex-plained by the fact that our steam cycle is running at a sub-optimum (keepalive) mode for much of the day, and is only running at full design capacityduring peak hours. (16h00 to 20h00). On the other hand we are consumingno fuel at all during the night time hours. Our efficiency on just the fossil fuelburned is 70%, so the solar input allows us to exceed the efficiency of any purefossil fuel plant.
The control and design strategy that will result in the most economical lev-elised cost of electricity will depend on the ratios of capital cost for equipment,interest rates, expected plant lifetimes and fuel costs.
The average power used by the storage blower over the whole year was 0.6MW and the peak blower power consumption was 1.9 MW
5 Plant Parameters
The parameters for the 100 MW nominal plant are shown in Table 5 on page20, Table 6 on page 20 and Table 7 on page 21. The number of receivers (4000)might be too large for a single tower, and a distributed tower system mightbe needed. There are other approaches[Fre09] , notably the Google fundedcompany eSolar, which use smaller (1m2) mirrors and multiple towers whichmight lead to lower capital cost.
20

Hot side flow rate 1500 ton/hr (peak 16h to 20h) 600 ton/hr (other)Steam/water flow rate (peak) 180 ton/hr
Preheater (heated with steam) HTC 1860 MJ/hr.KEconomizer HTC 4000 MJ/hr.KEvaporator HTC 5000 MJ/hr.K
Super heater HTC 1860 MJ/hr.KSteam turbine 1 Pressure drop 100 bar-20 bar peak Elect 15.4 MWSteam turbine 2 Pressure drop 20 bar-5 bar peak Elect 9.5 MWSteam turbine 3 Pressure drop 5 bar-0.05 bar peak Elect 15.8 MW
Condenser cool water inlet 20 ton/hr
Table 7: Heat recovery steam generator and steam turbines for 100 MW Plant
6 Problems
We tried several times to generate a steam model from scratch, but abandoneddue to the time taken, and many small undocumented gotchas in the modelcomponents. For example the steam bypass indicator on the turbines must beinitially set to 1 (not its default setting) for the turbines to generate steam pres-sure and output power. Another anomaly we found was the variable used toindicate the dryness of the steam. We expected this to vary between 0 (sat-urated or wet steam) and 1 (fully superheated steam). However unless thisvariable is set to 2 for fully superheated steam, the turbines do not generatepower as expected.
7 Conclusions and Suggestions for Further Work
We have constructed a usable model in TRNSYS of a combined cycle solarpower plant with a central receiver. We have tested it with different controlstrategies over a whole year. We concluded that it was necessary to run theauxiliary combustion chamber for a constant time each day throughout theyear to enable us to properly size the thermal storage and steam cycle.
It would be useful to have more work done on two components in themodel, and one additional control strategy:
• Rock bed storage component
• Air Condenser component
• An additional control strategy that could be tried is to just run the steamcycle at night (ramping it up as the air cycle ramps down), instead ofswitching it on at 16h00, and getting the peak steam sitting on top of thepeak air cycle power (see for example Figure 24 on page 16 )
21

References
[AKF09] K.G. Allen, D.G. Kröger, and T.P. Fluri. Thermal Energy Storagein a Rock Bed. In Proceedings of the ISES Solar World Congress 2009,pages 864–875. International Solar Energy Society, Freiburg, Ger-many, 2009.
[BMC08] N. Blair, M. Mehos, and C. Christensen. Sensitivity of ConcentratingSolar Power trough performance, cost, and financing with the SolarAdvisor Model. 2008.
[Fre09] S. Fredman. Concentrating Solar Power Baseload renewable Power:The Convenient Truth. In Proceedings of the ISES Solar World Congress2009, pages 1232–1234. International Solar Energy Society, Freiburg,Germany, 2009.
[Kea05] S.A. Klein and et al. TRNSYS A Transient System Simulation ProgramUser Manual. Solar Energy Laboratory, Univ. of Wisconsin-Madison,2005.
[Krö03] D.G. Kröger. Air-cooled heat exchangers and cooling towers. PennwellCorp, 2003.
[Krö08] D.G. Kröger. Personal Communication, 2008.
[KRHS09] R. Kehlhofer, B. Rukes, F. Hannemann, and F. Stirnimann.Combined-cycle gas & steam turbine power plants. Pennwell Books,2009.
[QZY08] H. Qu, J. Zhao, and X. Yu. Simulation of Parabolic Trough. SolarPower Generating System for Typical Chinese Sites. In ZhongguoDianji Gongcheng Xuebao(Proceedings of the Chinese Society of ElectricalEngineering), volume 28, pages 87–93. Electric Power Research In-stitute(China), Qinghe Xiaoying Donglu 15, Beijing, 100085, China„2008.
22