tritium partitioning in the biosphere - doe fellows...student summer internship technical report...
TRANSCRIPT

STUDENT SUMMER INTERNSHIP TECHNICAL REPORT
Tritium Partitioning in the Biosphere
DOE-FIU SCIENCE & TECHNOLOGY WORKFORCE DEVELOPMENT PROGRAM
Date submitted: October 31, 2016
Principal Investigators:
Awmna Kalsoom Rana (DOE Fellow Student) Florida International University
Dr. John Seaman, Mentor
Savannah River Ecology Laboratory
Acknowledgements: Dr. Gary L. Mills, Dr. Fanny Coutelot Savannah River Ecology Laboratory
Florida International University Program Director:
Leonel Lagos Ph.D., PMP®
Submitted to:
U.S. Department of Energy Office of Environmental Management
Under Cooperative Agreement # DE-EM0000598
DISCLAIMER This report was prepared as an account of work sponsored by an agency of the United States government. Neither the United States government nor any agency thereof, nor any of their employees, nor any of its contractors, subcontractors, nor their employees makes any warranty, express or implied, or assumes any legal liability or responsibility for the accuracy, completeness, or usefulness of any information, apparatus, product, or process disclosed, or represents that its use would not infringe upon privately owned rights. Reference herein to any specific commercial product, process, or service by trade name, trademark, manufacturer, or otherwise does not necessarily constitute or imply its endorsement, recommendation, or favoring by the United States government or any other agency thereof. The views and opinions of authors expressed herein do not necessarily state or reflect those of the United States government or any agency thereof.

FIU-ARC-2016-800006473-04c-245 Tritium Partitioning in the Biosphere
iii
ABSTRACT
A major mission of the Department of Energy’s Savannah River Site (SRS), near Aiken, SC, has been the production of tritium (T or ³H) for thermonuclear weapons. Today, tritium processing still continues at SRS at the National Nuclear Security Administration (NNSA) Tritium Facility, which discharges significant levels of 3H each year. Additionally, ³H ranks second to carbon-14 in terms of radioactive materials discharged into the environment. At the SRS Mixed Waste Management Facility (MWMF), a groundwater plume containing ³H is used to irrigate a small watershed in a manner that maximizes evapotranspiration and reduces discharge to the Fourmile Branch stream, a tributary of the Savannah River. Tritiated water (T₂O) displays essentially the same chemical properties as non-labeled water (H2O), and can be incorporated into tissues by photosynthesis, yielding organically-bound tritium (OBT) that may persist within the receptor for longer than T₂O tissue water (TWT). The aim of this study, therefore, was to investigate ³H uptake and compartmentalization to either TWT or OBT at the MWMF and a nearby control site.

FIU-ARC-2016-800006473-04c-245 Tritium Partitioning in the Biosphere
iv
TABLE OF CONTENTS
ABSTRACT ....................................................................................................................... iii
TABLE OF CONTENTS ................................................................................................... iv
LIST OF FIGURES ............................................................................................................ v
LIST OF TABLES ............................................................................................................. vi
1. INTRODUCTION .......................................................................................................... 1
2. EXECUTIVE SUMMARY ............................................................................................ 6
3. RESEARCH DESCRIPTION ......................................................................................... 7
4. RESULTS AND ANALYSIS ....................................................................................... 13
5. CONCLUSION ............................................................................................................. 15
6. REFERENCES ............................................................................................................. 16

FIU-ARC-2016-800006473-04c-245 Tritium Partitioning in the Biosphere
v
LIST OF FIGURES
Figure 1. The location of SRS in Aiken, SC (left) and a photo of the study domain (right). ......... 1 Figure 2. The isotopes of hydrogen. ............................................................................................... 1 Figure 3. A non-labeled water molecule and a radioactive tritium-labeled water molecule. ......... 2 Figure 4. Mixed contaminant plumes containing tritium along Fourmile Branch, SRS. ............... 2 Figure 5. Schematic representation of watershed irrigated irrigation using tritium tritium-ladbeled water from groundwater plumes at the MWMF TPS. ...................................................... 3 Figure 6. Schematic representation of tritium fate and uptake as both reactant and product of photosynthesis. ................................................................................................................................ 3 Figure 7. Field work, collecting samples. ....................................................................................... 4 Figure 8. Samples collected from the irrigated watershed, TPS. .................................................... 5 Figure 9. Liquid nitrogen trap used for experiment. ....................................................................... 7 Figure 10. Extracted TWT sample vials loaded onto the Scintillation Counter. ............................ 7 Figure 11. Carbolite MTT Combustion Tube Furnace used in experiment. ................................... 8 Figure 12. 2132 Temperature Controller. ....................................................................................... 9 Figure 13. 3508 Temperature Controller. ..................................................................................... 10 Figure 14.Diagram of the combustion procedure which simulates the process of cellular respiration. .................................................................................................................................... 11 Figure 15.LS 6500 Multi-Purpose Scintillation Counter used in experiment. ............................. 12 Figure 16. Samples from irrigated plots and reference site measured for TWT. .......................... 13

FIU-ARC-2016-800006473-04c-245 Tritium Partitioning in the Biosphere
vi
LIST OF TABLES
Table 1.TWT and OBT Values Measured by Calculated Decay in pCi/mL in Samples from Exposed Plots, the Control Site and Lyophilized Fish Samples ................................................... 14
FIU-ARC-2016-800006473-04c-245 Tritium Partitioning in the Biosphere
1
1. INTRODUCTION
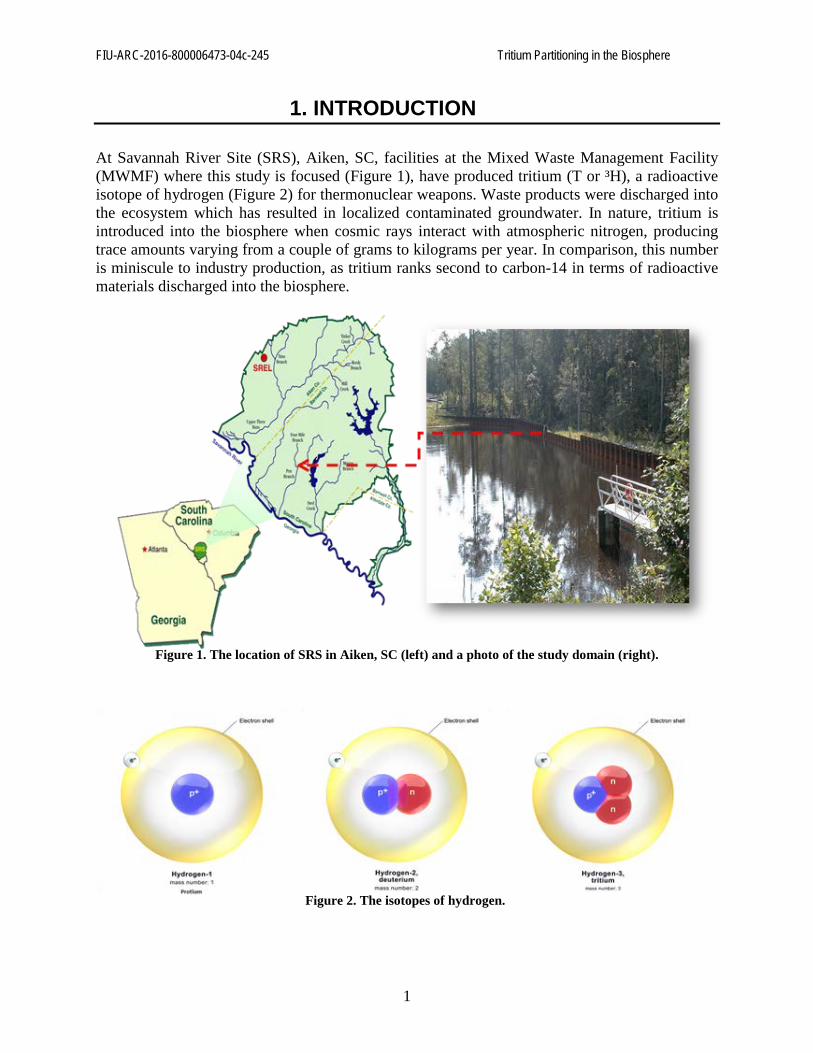
At Savannah River Site (SRS), Aiken, SC, facilities at the Mixed Waste Management Facility (MWMF) where this study is focused (Figure 1), have produced tritium (T or ³H), a radioactive isotope of hydrogen (Figure 2) for thermonuclear weapons. Waste products were discharged into the ecosystem which has resulted in localized contaminated groundwater. In nature, tritium is introduced into the biosphere when cosmic rays interact with atmospheric nitrogen, producing trace amounts varying from a couple of grams to kilograms per year. In comparison, this number is miniscule to industry production, as tritium ranks second to carbon-14 in terms of radioactive materials discharged into the biosphere.
Figure 1. The location of SRS in Aiken, SC (left) and a photo of the study domain (right).
Figure 2. The isotopes of hydrogen.

FIU-ARC-2016-800006473-04c-245 Tritium Partitioning in the Biosphere
2
In the environment, ³H rapidly oxidizes to form tritiated water, T₂O (Figure 3), making it extremely mobile and able to integrate into numerous cycles of the biosphere. Tritium1/2 ≈ 12.32 years, which makes it a low energy beta emitter (≈ β- 5.7 keV) that ranks second only to carbon-14 as the largest radioactive by-product of nuclear activities. Tritium decays to Helium-3, which is sought after for use in nuclear fusion research and used in sensors and scanners to detect plutonium. The NNSA Tritium Facility at SRS has released significant amounts of tritium into the biosphere (e.g., ≈ 24,000 Ci in 2014) and continues to discharge ³H during processing to refuel the nuclear stockpile. Therefore, SRS provides an ideal platform for evaluating the fate and transport of tritium in the biosphere.
Figure 3. A non-labeled water molecule and a radioactive tritium-labeled water molecule.
Figure 4. Mixed contaminant plumes containing tritium along Fourmile Branch, SRS.
At the SRS Mixed Waste Management Facility (MWMF), groundwater plumes containing T₂O (Figure 4) are intercepted at the Tritium Phytoremediation Site (TPS) located in the Southwest

FIU-ARC-2016-800006473-04c-245 Tritium Partitioning in the Biosphere
3
Plume of the MWMF before T₂O can be discharged further downstream into Fourmile Branch. The TPS uses the T₂O to irrigate a forested watershed designed to maximize evapotranspiration to reduce tritium levels in the biosphere (Figure 5).
Figure 5. Schematic representation of watershed irrigated irrigation using tritium tritium-ladle water from
groundwater plumes at the MWMF TPS.
When plants uptake T₂O, it may compartmentalize as tissue water tritium (TWT), or become organically bound tritium (OBT) which is sequestered into biological tissue through photosynthesis (Figure 6).
Figure 6. Schematic representation of tritium fate and uptake as both reactant and product of photosynthesis. While TWT is rapidly evapotranspired, OBT’s half-life is unknown and may remain within the food chain, providing a long-term potential source for exposure. Thus, the objective of this study

FIU-ARC-2016-800006473-04c-245 Tritium Partitioning in the Biosphere
4
was to further investigate ³H uptake and partitioning to TWT and OBT at the MWMF and a nearby control site. Field work was conducted (Figure 7) to collect a variety of samples (i.e., irrigation water, soil, plant tissue, and litter, Figure 8) from which T₂O was extracted using protocols that differentiate TWT (i.e., sublimation and lyophilization) from OBT (i.e., oxidative combustion of organic matter to form CO₂ and T₂O). The TWT was extracted using a liquid-nitrogen cold trap. The TWT samples were collected and run through a scintillation counter to detect radioactive decay. After being extracted for TWT, the same samples underwent oxidative combustion in a tritium analyzer furnace to trap chief combustion products that were collected and also run through a scintillation counter.
Figure 7. Field work, collecting samples.

FIU-ARC-2016-800006473-04c-245 Tritium Partitioning in the Biosphere
5
Figure 8. Samples collected from the irrigated watershed, TPS.
Results showed that TWT levels at the TPS were generally lower than the irrigation source, displaying dilution trends associated with precipitation. Plant TWT generally reflected levels present in the soil, while displaying a positive correlation with amount of irrigation received and level of T₂O measured from biological tissues. Samples from the control site displayed background levels of both TWT and OBT despite the close proximity to the NNSA Tritium Facility, highlighting the success of the TPS in reducing potential for tritium buildup associated with atmospheric releases. Plant OBT levels indicated partitioning to the organic fraction that suggests further research is necessary regarding measuring standards for control releases or prescribed burning as OBT’s biological half-life is unknown.

FIU-ARC-2016-800006473-04c-245 Tritium Partitioning in the Biosphere
6
2. EXECUTIVE SUMMARY
This research work has been supported by the DOE-FIU Science & Technology Workforce Initiative, an innovative program developed by the US Department of Energy’s Environmental Management (DOE-EM) and Florida International University’s Applied Research Center (FIU-ARC). During the summer of 2016, a DOE Fellow intern, Awmna Rana, spent 10 weeks doing a summer internship at the University of Georgia’s Savannah River Ecology Lab on the Savannah River Site under the supervision and guidance of Geochemist, Dr. John Seaman. The intern’s project was initiated on May 23, 2016, and continued through July 29, 2016 with the objective of developing appropriate methodologies to assess tritium partitioning to the tissue water tritium and organically bound tritium fractions in various ecological receptors at a site with a known history of tritium exposure.

FIU-ARC-2016-800006473-04c-245 Tritium Partitioning in the Biosphere
7
3. RESEARCH DESCRIPTION
Part 1: Extracting Tissue Water Tritium (TWT) In this study, the aim is to compare TWT and OBT concentrations in the tissue of organisms exposed to T₂O at the SRS via transfer through different trophic levels of the food chain. The first step in the experimental process was to obtain the environmental samples (i.e. soil, pine needles, limbs, detritus, and pond water) from the TPS study domain. Two MWMF irrigation plots of the TPS were chosen based on higher exposure rates to increase the likelihood of elevated levels of tritium. Once the samples were collected, they were processed and immediately refrigerated to avoid moisture loss. Samples of equivalent nature were collected from a reference site located ≈ 5 miles from the study domain behind the Savannah River Ecology Laboratory. Tritium levels were measured in pond water from the MWMF irrigation source. Each sample was extracted for TWT by a thermodynamic process of vacuum sublimation and subsequent deposition using a liquid nitrogen trap (Figure 9). After running the vacuum overnight, the instrument was turned off and the TWT samples that were extracted were thawed and each respectively collected in individually labeled vials (Figure 10) to be further analyzed via a scintillation assay.
Figure 9. Liquid nitrogen trap used for experiment.
Figure 10. Extracted TWT sample vials loaded onto the Scintillation Counter.

FIU-ARC-2016-800006473-04c-245 Tritium Partitioning in the Biosphere
8
Part 2: Combustion- Collecting Organically Bound Tritium Part 2A: Operating & Maintenance Instructions for Tube Furnace The second step in the experimental process was to combust the TWT sample previously extracted in Part 1. This was done using the Carbolite MTT Tritium Analyzer Combustion Tube Furnace, seen in Figure 11. This apparatus uses catalyst-assisted combustion techniques to give a clean and precise approach to extracting organically bound tritium. A catalyst is used to ensure complete combustion of all thermal decomposition products. These are captured for liquid scintillation assay. This technique gives greater confidence of complete combustion than ‘wet oxidation’ techniques and avoids colored contamination of scintillation media by botanical samples. The chief combustion products were of primary interest, and were collected in the gas bubblers seen on the left of the furnace.
Figure 11. Carbolite MTT Combustion Tube Furnace used in experiment.
The Combustion Tube’s operating and maintenance instructions were studied from the manual prior to operating the analytical instrument. This included but was not limited to:
I. Symbols and Warnings II. Installation, Operation
III. Temperature Controls* IV. Maintenance V. Repairs and Replacements
VI. Fault Analysis VII. Circuit Diagrams
VIII. Fuses & Power Settings IX. Specifications * See Part 2B/2C
FIU-ARC-2016-800006473-04c-245 Tritium Partitioning in the Biosphere
9
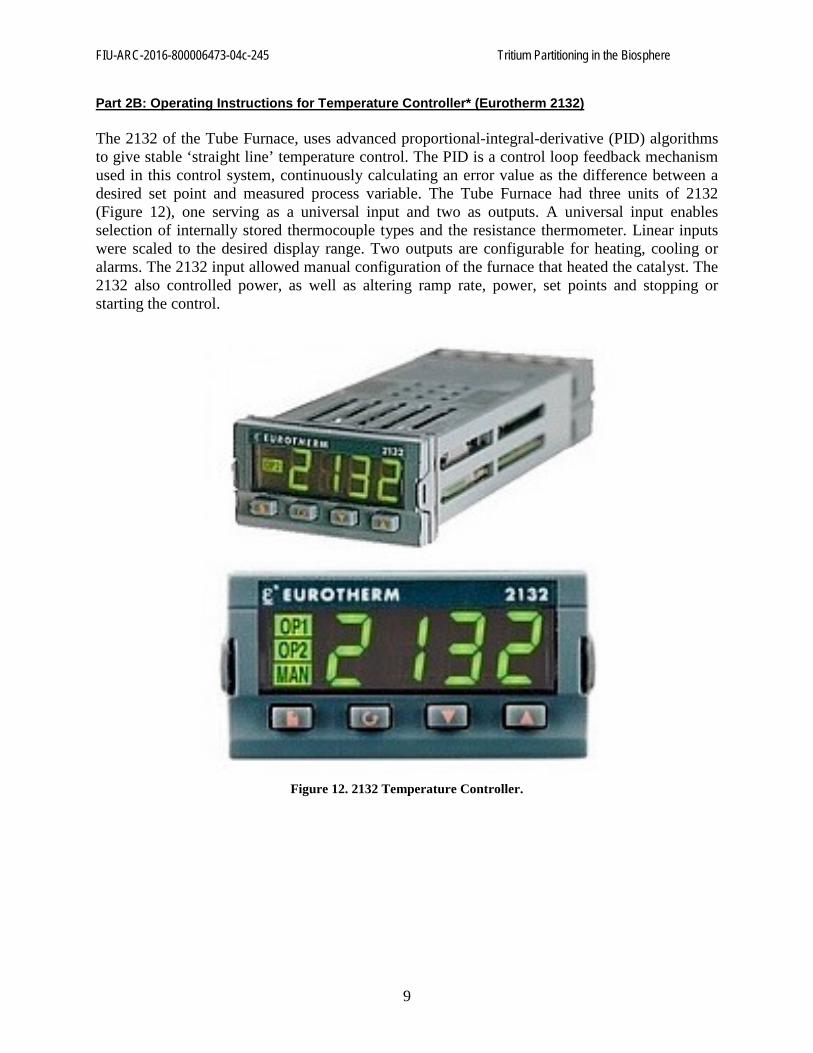
Part 2B: Operating Instructions for Temperature Controller* (Eurotherm 2132) The 2132 of the Tube Furnace, uses advanced proportional-integral-derivative (PID) algorithms to give stable ‘straight line’ temperature control. The PID is a control loop feedback mechanism used in this control system, continuously calculating an error value as the difference between a desired set point and measured process variable. The Tube Furnace had three units of 2132 (Figure 12), one serving as a universal input and two as outputs. A universal input enables selection of internally stored thermocouple types and the resistance thermometer. Linear inputs were scaled to the desired display range. Two outputs are configurable for heating, cooling or alarms. The 2132 input allowed manual configuration of the furnace that heated the catalyst. The 2132 also controlled power, as well as altering ramp rate, power, set points and stopping or starting the control.
Figure 12. 2132 Temperature Controller.

FIU-ARC-2016-800006473-04c-245 Tritium Partitioning in the Biosphere
10
Part 2C: Operating Instructions for Process Controller (Eurotherm 3508) The 3508 (Figure 13) is a controller of temperature and process variables with an abundance of advanced options. The programmer switches on the program loaded into the 2132 parameters with the ‘Run/Hold’ option. It also controls the set points, ramp rate, and duration of program, program cycles, temperature dwelling, temperature switch off and reset. These are all necessary parameters to ensure efficient results during the combustion process.
Figure 13. 3508 Temperature Controller.
FIU-ARC-2016-800006473-04c-245 Tritium Partitioning in the Biosphere
11
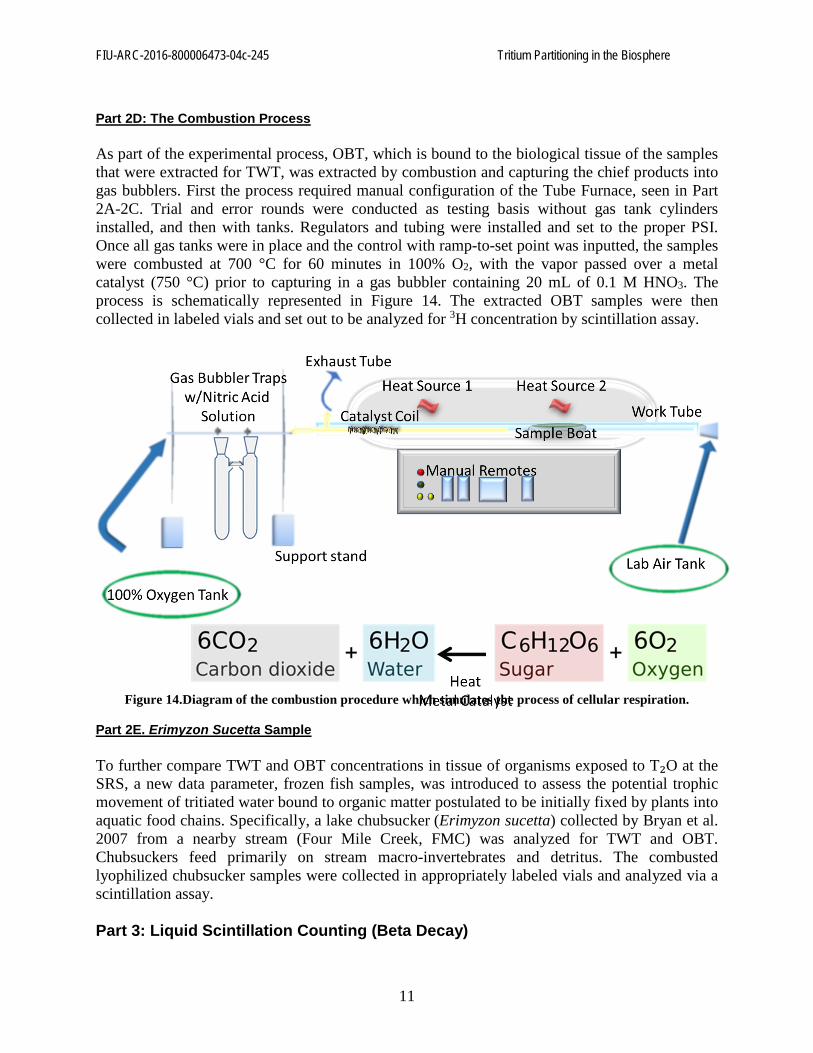
Part 2D: The Combustion Process As part of the experimental process, OBT, which is bound to the biological tissue of the samples that were extracted for TWT, was extracted by combustion and capturing the chief products into gas bubblers. First the process required manual configuration of the Tube Furnace, seen in Part 2A-2C. Trial and error rounds were conducted as testing basis without gas tank cylinders installed, and then with tanks. Regulators and tubing were installed and set to the proper PSI. Once all gas tanks were in place and the control with ramp-to-set point was inputted, the samples were combusted at 700 °C for 60 minutes in 100% O2, with the vapor passed over a metal catalyst (750 °C) prior to capturing in a gas bubbler containing 20 mL of 0.1 M HNO3. The process is schematically represented in Figure 14. The extracted OBT samples were then collected in labeled vials and set out to be analyzed for 3H concentration by scintillation assay.
Figure 14.Diagram of the combustion procedure which simulates the process of cellular respiration.
Part 2E. Erimyzon Sucetta Sample To further compare TWT and OBT concentrations in tissue of organisms exposed to T₂O at the SRS, a new data parameter, frozen fish samples, was introduced to assess the potential trophic movement of tritiated water bound to organic matter postulated to be initially fixed by plants into aquatic food chains. Specifically, a lake chubsucker (Erimyzon sucetta) collected by Bryan et al. 2007 from a nearby stream (Four Mile Creek, FMC) was analyzed for TWT and OBT. Chubsuckers feed primarily on stream macro-invertebrates and detritus. The combusted lyophilized chubsucker samples were collected in appropriately labeled vials and analyzed via a scintillation assay. Part 3: Liquid Scintillation Counting (Beta Decay)
FIU-ARC-2016-800006473-04c-245 Tritium Partitioning in the Biosphere
12
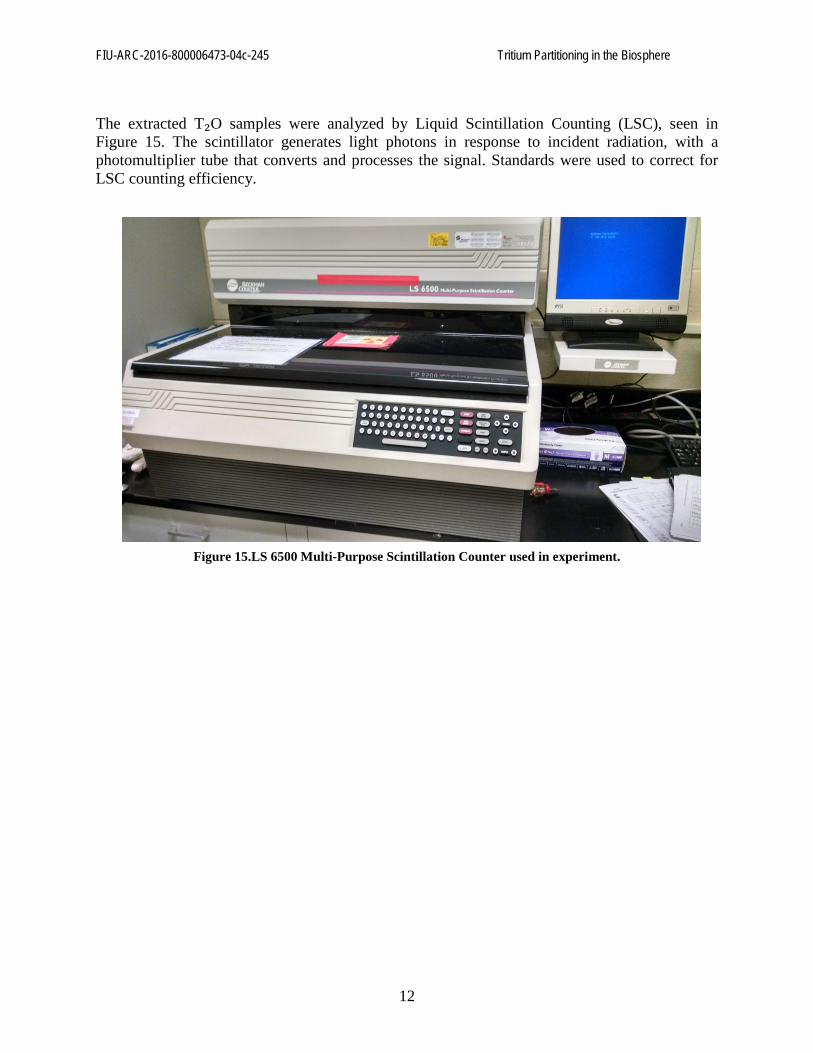
The extracted T₂O samples were analyzed by Liquid Scintillation Counting (LSC), seen in Figure 15. The scintillator generates light photons in response to incident radiation, with a photomultiplier tube that converts and processes the signal. Standards were used to correct for LSC counting efficiency.
Figure 15.LS 6500 Multi-Purpose Scintillation Counter used in experiment.

FIU-ARC-2016-800006473-04c-245 Tritium Partitioning in the Biosphere
13
4. RESULTS AND ANALYSIS
The results from the experiment, as shown in Figure 16, were plotted on a logarithmic scale due to the drastic variance of pCi between samples. The TWT measured in pCi/mL of the older plot, #32, which had a longer exposure to the irrigated tritium labeled water, displayed soil and litter in close range to one another around 1,055 pCi/mL and 1158 pCi/mL. The pine needles of the tree measured 972 pCi/mL, while the limbs had the lowest reading of 103 pCi/mL. The younger plot had significantly lower numbers in the tens and hundreds range, but a similar trend of soil and litter ranging closer together and highest, with limbs the lowest. Samples from the control site located 5 miles away from the study domain at the back of SREL, measured very low, miniscule background levels of tritium.
Figure 16. Samples from irrigated plots and reference site measured for TWT.
TWT levels in soil and plants tissues were lower than tritium source water as a result of dilution from precipitation; this means that as the irrigated tritium-labeled water was sprayed over the plants via a sprinkler, the heaviest would be in soil and litter. The soil and litter will transpire up the roots into the limbs and leaves. The plant TWT levels generally reflect soil levels, which vary with recent T2O exposure based on timing and duration of irrigation events. A significant fraction of the tritiated water exposure dose is incorporated into biogenic organic compounds within the plant tissue and represents a long-term storage reservoir for 3H released to the environment.

FIU-ARC-2016-800006473-04c-245 Tritium Partitioning in the Biosphere
14
Table 1.TWT and OBT Values Measured by Calculated Decay in pCi/mL in Samples from Exposed Plots, the Control Site and Lyophilized Fish Samples
Sample Type TWT pCi/mL OBT pCi/mL
Pine Tree Needles
Plot: # 39 (Young)
38 72
Pine Tree Needles Control (SREL)
1 12
Fish – First Test
(Fourmile, Bryan et al.
2007)
15 84
As seen in Table 1, significantly higher levels of OBT were found in plant and fish tissues compared to respective TWT concentrations. This could be because TWT concentrations reflect recent tritiated water exposure levels, while OBT concentrations provide an integrated assessment of long-term exposure of varying dose levels. However, since the OBT concentrations in fish from FMC were similar to concentrations observed in pine needles from the MWMF site, data suggests incorporation of tritium into the aquatic food web via detritus (C) derived from decaying vegetation contaminated with OBT. OBT transfer to fish may be through direct ingestion of organic detritus or by preying on macro invertebrates that feed on stream detritus containing OBT. OBT levels in 2007 fish samples illustrate source persistence. Since the fish were no longer respiring, the tritium bound organically remained in the cells. Both TWT and OBT levels in samples from the reference site were << 0.5% of the values found at the MWMF site.

FIU-ARC-2016-800006473-04c-245 Tritium Partitioning in the Biosphere
15
5. CONCLUSION
Results showed that TWT levels at the TPS were generally lower than the irrigation source, displaying dilution trends associated with precipitation. Plant TWT generally reflected levels present in the soil, while displaying a positive correlation with amount of irrigation received and level of T₂O measured from biological tissues. Samples from the control site displayed background levels of both TWT and OBT, despite the close proximity to the NNSA Tritium Facility, highlighting the success of the TPS in reducing the potential for tritium buildup associated with atmospheric releases. Plant OBT levels indicated partitioning to the organic fraction that suggest further research is necessary regarding measuring standards for control releases as OBT biological half-life is unknown. Continued optimization of the Combustion Furnace is required to be able to run more samples for optimal data output. Future work can include collecting additional tissue samples from multiple site locations. Since OBT was persistent in chub sucker cells, a review of the historical archive of frozen tissue samples stored for future analysis can be performed to obtain more data. A trophic study can also be done by collecting and analyzing macroinvertebrates and organic detritus from FMC. This will entail future multi-lab collaboration to more effectively organize and refine data for this study.

FIU-ARC-2016-800006473-04c-245 Tritium Partitioning in the Biosphere
16
6. REFERENCES
Carlton, W.H., Murphy Jr., C. E., and Bauer, L.R. (1993). "Assessment of tritium in the Savannah River Site environment," Rep. No. WSRC-TR--93-214. Eaton, D., and Murphy Jr., C.E. (1992). "Tritium uptake by fish in a small stream. Revision 1," Rep. No. WSRC-TR--92-193-Rev.1. Murphy Jr., C.E. (1990). "Estimating the dose from atmospheric releases of HT," Rep. No. WSRC-TR-90-538. Murphy Jr., C.E. (1991a). "An analysis of the tritium content in fish from Upper Three Runs Creek," Rep. No. WSRC-MS-91-190. Murphy Jr., C.E. (1991b). "Workshop on tritium safety and environmental effects, October 15-17, 1990, Aiken, SC: Session summaries." Murphy Jr., C.E., Bauer, L. R., and Hoel, D. (1990a). "Tritium atmospheric transport and deposition following acute releases: Comparisons with a simple transport model." Murphy Jr., C.E., Bauer, L. R., and Zeigler, C.C. (1990b). "Tritium distribution in the environment in the vicinity of a chronic atmospheric source-assessment of the steady state hypothesis." Murphy Jr., C.E., and Loehle, C. (1991). "Levels of radioactivity in fish from streams near F-Area and H-Area seepage basins," Rep. No. WSRC-RP-91-242. Murphy Jr., C.E., and Wortham, G.R. (1991). "An atmospheric tritium release database for model comparisons," Rep. No. WSRC-TR--91-671. Murphy Jr., C.E. (1990). "The transport, dispersion, and cycling of tritium in the environment," Rep. No. WSRC-RP-90-462. Murphy Jr., C.E. (1993). Tritium transport and cycling in the environment. Health Phys. 65, 683-698. Murphy Jr., C.E., et al. (1993). "Assessment of tritium in the Savannah River Site Environment (U)," WSRC Rep. No. DE-AC09-89SR18035.