triangulating principal effectiveness - stanford universityweb.stanford.edu/~sloeb/papers/principal...
TRANSCRIPT

Institute for Research on Education Policy & Practice
Institute for Research on Education Policy & Practice • Stanford University
School Leadership Research Report No. 09-1
November 2009
Triangulating Principal Effectiveness:
How Perspectives of Parents, Teachers, and Assistant Principals Identify the Central Importance of Managerial Skills
Jason A. Grissom, University of MissouriSusanna Loeb, Stanford University

© 2009 Institute for Research on Education Policy & Practice. All rights reserved.
Citation: Grissom, J. A. & Loeb, S. (2009). Triangulating principal effectiveness: How perspectives of parents, teachers, and assistant principals identify the central importance of managerial skills. (School Leader-ship Research Report No. 09-1). Stanford, CA: Stanford University, Institute for Research on Education Policy & Practice
This report can be downloaded from www.schoolleadershipresearch.org.
Institute for Research on Education Policy & Practice supports high quality, multi-disciplinary empirical research that is informed by collaboration with stakeholdersand practitioners and that, in turn, informs the improvement of education policy and practice.
520 Galvez Mall CERAS Building, 5th FloorStanford UniversityStanford, CA 94305-3084 [email protected]
Institute for Research on Education Policy & Practice

Table of Contents
Introduction ......................... ...................................................................................................... 1
Prior Research on Principal Effectiveness ..................................................................................... 3
Data and Methods ...................................................................................................................... 5
Dimensions of Principal Task Effectiveness .................................................................................. 9
Differences in Task Effectiveness Across Schools and Principals ................................................... 13
Principal Task Effectiveness and Measures of School Performance ............................................... 15
Further Evidence on Principal Task Effectiveness from Assistant Principal Assessments ............... 20
Discussion and Conclusions ........................................................................................................ 23
References ................................................ .................................................................................. 26
Appendix 1: Factor Loadings Matrix for Principal Effectiveness Factors ...................................... 28
Appendix 2: Factor Loadings Matrix for Assistant Principal Effectiveness Factors ........................ 29
AcknowledgementsWe are grateful to the Miami-Dade County Public Schools for the data employed in this paper. We ap-preciate financial support from the Joyce Foundation, the Spencer Foundation and the Stanford Univer-sity K-12 Initiative. The views expressed in the paper are solely those of the authors and may not reflect those of the funders. Any errors are attributable to the authors.
AbstractWhile the importance of effective principals is undisputed, few studies have addressed what specific skills principals need to promote school success. This study draws on unique data combining survey responses from principals, assistant principals, teachers and parents with rich administrative data to identify which principal skills matter most for school outcomes. Factor analysis of a 42-item task inventory distinguishes five skill categories, yet only one of them, the principals’ organization management skills, consistently predicts student achievement growth and other success measures. Analysis of evaluations of principals by assistant principals confirms this central result. Our analysis argues for a broad view of instructional leadership that includes general organizational management skills as a key complement to the work of supporting curriculum and instruction.
Tr iangulat ing Pr inc ipal Effect iveness 1
Introductionhere is little doubt that school leaders matter for school success. A large number of studies spanning the last three decades link high quality leadership with positive school outcomes, including student achievement (Hallinger & Heck 1998; Waters, Marzano, & McNulty, 2003; Andrews & Soder, 1987; Cheng, 1991; Brewer, 1993; Leithwood, Jantzi, Silins, & Dart, 1993;
Leithwood, 1994; Goldring & Pasternak, 1994). This recognition of the importance of principals has led to increased policy attention on attracting and preparing school leaders (Davis, Darling-Hammond, LaPointe, & Meyerson, 2005; Hale & Moorman, 2003). Unfortunately, existing research does not tell us enough about the policies state and district leaders can adopt to recruit and prepare effective principals. This study is a step in that direction, articulating the range of skills needed for principals to perform their job effectively. The paper also describes differences across principals and schools in principal efficacy in these domains. Furthermore, the paper provides systematic evidence of the linkages between school leader efficacy and school outcomes, including student achievement gains and teacher satisfaction.
There have been two major obstacles to research identifying important skills for principals: data availability and the complexity of principals’ work. Data suitable for doing rigorous empirical work in this area are scarce. Without long-run longitudinal data it is difficult statistically to separate the effect of a principal from the effect of the school as a whole. This difficulty is important if we want to attribute a change in school outcomes to a spe-cific principal, versus a previous principal or other aspects of the school such as student-body com-position. The problem is complicated by the fact that school principals influence student outcomes indirectly through, for example, decisions they make in teacher hiring or through policies making schools safe and orderly (Hallinger & Heck, 1998; Witziers, Bosker, & Krüger, 2003). Without ac-cess to detailed data on behaviors and outcomes along these pathways, it is difficult to distinguish the principal’s effect (Hallinger, Bickman, & Davis, 1996). Even when a statistical link between par-ticular principals and student outcomes can be identified, an inability to find principal practices or intermediate outcomes that would illuminate the pathway by which the principals affected school outcomes limits the relevance of the result.
The other obstacle to developing a body of useful empirical work on principal effectiveness is the wide range of possible dimensions over which to
T
describe principals and what they do. Much of the research on principal effectiveness focuses on measures of principals’ dispositions and feelings of overall effectiveness. As one example, in a study of 96 principals, Leithwood and Jantzi (2008) find that the school leadership’s sense of collective self-efficacy positively predicts the schools’ achievement levels. Other studies emphasize leadership styles or orien-tations, as with the large body of work on instruc-tional leadership and transformational leadership, for example (e.g., Marks & Printy, 2003).
In contrast, this paper focuses on the identification of specific sets of principal skills that are associated with positive school outcomes, where outcomes are measured in multiple ways from multiple perspec-tives. Drawing on comprehensive survey and admin-istrative data from one large urban district, we use a newly developed task index for principals and their own self-assessments of their effectiveness in each of these tasks to define areas of relative strengths, describe how those strengths vary by principal and school contexts, and test the degree to which prin-cipals’ relative competencies in these areas predict school outcomes. In so doing, we seek both to expand the study of school administration in new directions and to contribute to the base of empirical research in this area, a need prominent scholars in the field recently have highlighted (e.g., Hallinger & Heck, 2005).
Sc hool Leadersh ip Researc h2
The study addresses five main research questions. First, we ask how principal task efficacy varies across tasks. That is, are there particular tasks for which principals feel especially equipped or ill-equipped? Second, we ask the extent to which effi-cacy on individual tasks can be grouped into larger dimensions of self-assessed effectiveness. Next, we ask whether task efficacy varies systematically across principal and school characteristics. Fourth,
This paper proceeds as follows. Sections II and III describe the prior research on principal effectiveness and the data and methods used in this study. The remainder of the paper addresses each of our research questions: describing principals’ assessments of their effectiveness across tasks; identifying dimensions of principal task effectiveness; analyzing differences by school and principal characteristics; and linking task-efficacy to school outcomes. The penultimate section reexamines principal task effectiveness using ratings of the principals’ skills provided by assistant principals in the same schools. The paper concludes with a discussion of the implications of the results, limitations of our approach, and directions for future work in this area.
we ask how principal task efficacy predicts key school outcomes, including student achievement gains, teacher satisfaction, and parents’ assessments of school performance. Finally, as a check on the validity of the results, we ask how assistant princi-pals’ assessments of their principals’ task effective-ness compare to the principals’ self-assessments and, furthermore, whether the assistant principals’ assessments similarly predict school outcomes.

Tr iangulat ing Pr inc ipal Effect iveness 3
Prior Research on Principal Effectivenessur study extends a long literature on the role of the principal in influencing school performance. Prior research suggests this influence can be substantial. In a meta-analysis of 70 empirical stud-ies from this body of work, Waters, Marzano, and McNulty (2003) find the average effect size of school leadership, broadly defined, on student achievement to be approximately 0.25. The ef-
fects in the studies they reviewed operated via a variety of mechanisms, including building a sense of com-munity, establishing school routines, providing teachers with necessary resources, and advocating for the school to stakeholders. Leithwood, Seashore Louis, Anderson & Wahlstrom (2004) and Hallinger (2005) similarly conduct reviews of the literature on how school leadership impacts student achievement and con-clude that leaders tend to impact student learning through their influence on school staff and structures.
OThe questions of what makes principals effective and which principal behaviors are most consistent with school improvement have sparked substantial scholarly inquiry in recent decades, with two ap-proaches to principal leadership emerging as most dominant in the literature: instructional leader-ship and transformational leadership. Instructional leadership theory tends to focus on the principal’s role in framing the school’s mission, coordinating and monitoring the school’s instructional program, and developing a positive learning culture (Hal-linger & Murphy, 1985). In contrast, transforma-tional leadership theory (Bass, 1998; Burns, 1978) emphasizes collaboration with other stakeholders, particularly the role of the principal in inspiring and motivating the staff, developing a commit-ment to a common vision, building the staff’s capacity to work collaboratively, and shaping the organizational culture. In a recent meta-analysis, Robinson, Lloyd, and Rowe (2008) use the results of 22 studies of these two approaches to compare the effects of instructional and transformational leadership on student outcomes. They estimate that the average effect of instructional leadership on student outcomes is three to four times greater than the effect of transformational leadership. In a second analysis, the authors analyze survey items from 12 of the studies and inductively identify five leadership dimensions: (1) establishing goals and expectations; (2) resourcing strategically; (3) plan-ning, coordinating, and evaluating teaching and the curriculum; (4) promoting and participating in teacher learning and development; and (5) ensur-
ing an orderly and supportive environment. They find the strongest effects on student outcomes from dimension (4), followed by dimensions (1) and (3). Combining the findings from the two analyses, the study concludes that “the more leaders focus their relationships, their work, and their learning on the core business of teaching and learning, the greater their influence on student outcomes” (636).
This emphasis on the teaching and learning as-pects of school leadership is characteristic of the instructional leadership literature. This research generally concludes that a strong, directive prin-cipal, focused on curriculum and instruction, is essential for effective schools (e.g., Blase & Blase, 1992; Heck, 1992; Leithwood, 1994; Southworth, 2002). Strong instructional leaders are described as hands-on with curriculum and instruction issues, unafraid to work directly with teachers, and present often in classrooms. While the focus on instructional leadership waned somewhat in the 1990s as transformational leadership received greater research attention, interest in instructional leadership in the literature has been invigorated by the accountability and school improvement move-ments, which have re-emphasized the role of the principal in facilitating instructional quality (Hal-linger, 2005). Scholars also have argued for other approaches, such as Marks and Printy’s (2003) “integrated leadership” approach, which combines instructional and transformational leadership. This research concludes that the most effective schools are the ones in which the two models coexist.
Sc hool Leadersh ip Researc h4
The present study departs from this emphasis on leadership orientations and beliefs to focus on principals’ actions and behaviors. A comparison of items typically used to measure instructional and transformational leadership, taken from Marks and Printy (2003), to our items illustrates this differ-ence. For example, Marks and Printy’s measures of instructional leadership include ratings of the degree to which teachers influence curriculum choices and principals influence instruction, while their measures of transformational leadership in-clude survey responses to such statements as “The principal shares power with teachers,” and “The school administration’s behavior toward the staff is supportive and encouraging.” In contrast, we evaluate task efficacy, asking principals and assis-tant principals to evaluate principal effectiveness in such task areas as “planning professional develop-ment for teachers,” “communicating with parents,” and “managing school schedules.”
Our study draws on substantial prior research on the impact of leader traits or skills on organization-al outcomes, both inside and outside the education literature. For example, Marcoulides, Larsen, and Heck (1995) test a structural model of instruc-tional leadership using data on 21 tasks from 140 principals in Texas with the goal of developing an instrument for evaluating principal performance, though they do not test whether their model predicts external outcomes. Heck (1992) links data from principals and teachers to school perfor-mance using ratings of principals’ performance in three domains: governance, developing the school climate, and organizing the school’s instructional program. He finds that some principal behaviors, such as making frequent classroom visits, are more predictive of school achievement than others. In the higher education context, Heck, Johnsrud, and Rosser (2000) gather assessments from faculty and staff to evaluate the performance of six college deans and directors, but their focus is on improv-ing measurement rather than on tying assessments to outputs. In another study, the authors expand their analysis to 22 deans and estimate a structural
model that links instrument-based effectiveness rat-ings to personal and organizational characteristics, such as the dean’s gender or the size of the college the dean supervises (Rosser, Johnsrud, & Heck, 2003).
Using an approach most similar to the one em-ployed in this study, Porter, Goldring, Murphy, Elliott, and Cravens (2006) develop the Vanderbilt Assessment of Leadership in Education (VAL-ED) to assess the effectiveness of specific educational leadership behaviors, using self-ratings by princi-pals as well as ratings by supervisors and teachers in their schools. The leadership behaviors assessed in their instrument lie at the intersection of core components of school performance (i.e., what leadership must do to improve school outcomes) and key processes of leadership (i.e., how leadership develops these core components). While these re-searchers identified behaviors from prior studies of effective principals, they have yet to explicitly link results from the VAL-ED assessment to increased school performance.
Recent studies in the private sector make use of a similar assessment strategy to examine the impact of organizational leaders on outcomes. For example, Bloom and Van Reenen (2007) use cross-national interview and survey data to mea-sure management practices of plant managers in a variety of firms. They find that more highly-rated organizational management practices are associated with long-run firm sales and profitability. Kaplan, Klebanov and Sorensen (2008) use detailed data from tests given to candidates for top CEO posi-tions in private equity investment firms by an out-side assessment firm to link job skills to hiring and firm performance. In results congruent with the ones we present below, they find that CEO success is linked more closely to what they label “execution capabilities” than capabilities related to team-build-ing and interacting with others. Building upon this previous research, the next section describes how we examine the associations among specific leader-ship skills and school outcomes.

Tr iangulat ing Pr inc ipal Effect iveness 5
DData and Methods
ata for this study come primarily from Miami-Dade County Public Schools (M-DCPS). With approximately 350,000 students, M-DCPS is the fourth-largest school district in the United States. It is also a diverse district, with approximately nine percent white students, 26 percent black students, and 63 percent Hispanic students. More than 60 percent of
students are eligible for the Free or Reduced Price Lunch program and 15 percent are classified as Eng-lish language learners. The district is organized more hierarchically than the typical district; leadership is divided into three tiers across nearly 400 schools, six regional centers that oversee such areas as cur-riculum and professional development,1 and a central district office. The data we collected focus on the school level and include one-time surveys of principals, assistant principals and teachers. To these survey data we link district administrative data on schools, staff, and students, as well as data from school district climate surveys and state data on school performance. We use these data to create measures of:
•Principals’self-assessedeffectivenessatjobtasks•Assistantprincipals’assessmentoftheirprincipal’seffectivenessatjobtasks•Teachers’satisfactionlevels•Parents’assessmentoftheschools’effectiveness•Studentachievementlevelsandgainsovertime•Characteristicsofprincipals,assistantprincipals,teachers,andschools
Survey Data
Our measures of principal self-assessment come from an online survey of principals given to 314 M-DCPS principals in the district in the spring of 2008. The survey yielded a response rate of 89 percent. As part of the survey, principals were presented with 42 job tasks common to the prin-cipalship and asked to rate how effective they felt they were at conducting each task in their current school. To develop this list of tasks, we began with the broad categories of principal duties described by Spillane, Camburn, and Pareja (2007) but added substantially more specificity to the task list. We developed this specificity through consultation with principals in multiple states and through dis-cussions with participating district leadership. Our expanded list was subsequently refined through pilot shadowing of principals in local schools. A four-point response scale was used (ineffective, a little effective, effective, and very effective).
We administered a similar survey to assistant prin-cipals in the district at the same time as the prin-
cipal survey (n = 585). The response rate was 85 percent. The assistant principal survey included the same 42-item task inventory and asked the respon-dent to assess how effective his or her principal was at completing each of the tasks.
In conjunction with the surveys of principals and assistant principals, we conducted a survey of all 15,842 teachers in the district that yielded re-sponses from 83 percent. In this paper, we use the responses of the teachers to the following question: “To what extent are you generally satisfied with be-ing a teacher in this school?” The possible answers were dissatisfied, somewhat dissatisfied, somewhat satisfied, and very satisfied.
Unfortunately, we were not able to conduct a sur-vey of parents as part of this study. However, the district provided us with access to data from a par-ent climate survey that the district conducts each year. On this survey the parents respond to the fol-lowing question: “Students get grades A, B, C, D, and F for the quality of their school work. What overall grade would you give your child’s school?” We used the average grade that parents report as a
Sc hool Leadersh ip Researc h6
measure of their assessment of the school.Administrative Data
We merge our survey data with administrative data provided by the district. This data include school performance data based on Florida’s A+ account-ability system. Florida grades each school on a five point scale (A, B, C, D, F) that is meant to capture aggregated performance of the organiza-tion across grades and schools in a succinct fashion that is consistent across levels of schooling and easily understood by parents and policymakers. Grades are based on a scoring system that assigns points to schools for their percentages of students who achieve the highest achievement levels in reading, math, science, and writing on Florida’s standardized tests in grades 3 through 10, or who make gains in achievement level. Grades also take into account the percentage of eligible students who are tested and the math and reading gains of the lowest-performing students. A more extensive description is available in Figlio and Lucas (2004). We use the data for the 2007-08 year, which is the year of our surveys. We also use school grades for previous years as controls and to capture changes in school performance over time.
A+ grades admittedly are an imprecise measure of school performance. Nonetheless, they have been utilized in a variety of studies of Florida’s public schools. These studies have examined the relation-ships between school grades and such variables as school instructional focus (Goldhaber & Han-naway, 2004), school policies (Rouse, Hannaway, Goldhaber, & Figlio, 2007), and housing prices (Figlio & Lucas, 2004). Because of the imprecision in a school’s accountability grade, it is important that grades are but one outcome measure exam-ined.
The administrative data also provide information that allows us to account for factors that might af-fect principals’ assessment of themselves or assistant principals’ assessments of their principal, or that
might be correlated with teacher satisfaction, par-ents’ ratings of the school, or school grades. This information includes school characteristics such as grade level, poverty concentration of students and racial concentration of students. For teachers, assistant principals and principals we also utilize measures of experience, gender, race and ethnicity, age, and whether they hold a Master’s or higher degree.
Descriptive Statistics
Table 1 gives the means and standard deviations of all variables used in the analyses, with the excep-tion of principal and assistant principal ratings, which we describe in more detail below. The 244 schools in our sample on average serve 33 percent black students and 68 percent students eligible for subsidized lunch. Approximately 60 percent of schools are elementary schools, with another 20 percent middle schools and 15 percent high schools. Sixty-nine percent of the principals in the sample are female; 33 percent, black; and 61 per-cent, Hispanic. Principals, who, on average, are 50 years old, have only been in their current school for an average of about three years. Assistant principals (not shown in the table) look similar by race, gen-der, and years in their current position to principals but are a bit younger, at 44 years. Teachers in the sample are 78 percent female, 25 percent black and 54 percent Hispanic, having served just over five years in their current job, on average.
Table 1 also describes our three outcome variables: school accountability grades, teacher satisfaction, and parental assessment of the school. School grades range from one (F) to five (A) and average almost a four (B). Teacher satisfaction ranges from one to four with a high average of 3.3. School grades from parents are on a one to eight scale (C-, C, C+, B-, B, B+, A-, A); though grades of F, D-, D, D+, and A+ were also options, none of the schools received these as their mean parent ratings. On average, parents graded schools at 5.6, approxi-mately a B+.

Tr iangulat ing Pr inc ipal Effect iveness 7
Table 1: Descriptive Statistics
Variable N Mean SD Min Max
School Characteristics Percent black students 244 32.87 34.01 0 96.91
Percent free/reduced lunch students 244 67.99 21.98 9.61 98.3
School size (in 100s) 244 11.92 8.75 0.7 45.09
Elementary school 244 0.60 0.49 0 1
Middle school 244 0.20 0.4 0 1
Combination (K-12) school 244 0.15 0.36 0 1
High school 244 0.05 0.23 0 1
School accountability grade (2007-08) 244 3.92 1.19 1 5
Parent survey school grade (2007-08) 248 5.62 1.57 1 8
Principal Characteristics Female 249 0.69 0 1
Black 249 0.33 0 1
Hispanic 249 0.61 0 1
Number of years in current job 249 3.08 3.46 0 17
Age 249 50.08 8.32 32 67
Holds Master’s degree or higher 249 0.49 0 1
Teacher Characteristics Female 9651 0.78 0.41 0 1
Black 9651 0.25 0.44 0 1
Hispanic 9651 0.54 0.5 0 1
Number of years in current job 9651 5.41 5.93 0 48
Age 9651 43 11.75 18 79
Holds Master’s degree or higher 9651 0.36 0.48 0 1
Teacher satisfaction 9651 3.43 0.80 1 4
Sc hool Leadersh ip Researc h8
Methods
This paper asks five questions. The first three (How does principal task efficacy vary across tasks? What are the dimensions of principal task efficacy? How does principal task efficacy systematically vary across principals and schools?) are descriptive. To begin, we simply describe the means and standard devia-tions of principals’ assessment of their own effec-tiveness on each of the 42 tasks. We then employ exploratory factor analysis with varimax rotation on these assessments to identify our task effective-ness dimensions. We compare the self-assessed task effectiveness across principals with different characteristics and across schools with different characteristics using simple t-tests.
The remaining research questions (How does princi-pal task efficacy predict other school outcomes includ-ing student performance, teacher satisfaction, and parental assessment of the school? How do assistant principals’ assessment of principals’ task effective-ness compare with principals’ assessments and school outcomes?) require more sophisticated analyses. We estimate each school outcome as a function of principal effectiveness along each of the five tasks dimensions that we identify in the factor analysis. Using standard ordinary least squares regression, we control for other school characteristics, includ-
ing student poverty and race composition and school level. We run specifications including and excluding school performance grades (prior grades when current grades are the outcome and current grades for teacher satisfaction and parental assess-ment of the school). The models for school grades and parental satisfaction are at the school level. For the models in which teacher satisfaction is the outcome variable, we run teacher-level analyses, controlling for teacher characteristics and account-ing for the grouping of teachers within schools by clustering standard errors at the school level.
The final analysis uses data from the surveys of assistant principals, which include assessments of the principal on each of the same 42 dimensions. Because assistant principals do not necessarily observe the principal on all the tasks, we allow the data to identify new dimensions of assistant principal-assessed principal effectiveness using fac-tor analysis. We then use regression analysis similar to that described above to assess the relationship between these task-effectiveness dimensions and student performance, teacher satisfaction, and par-ent assessment of the school.
An important contribution of this study is the delineation of five skill areas that categorize princi-pals’ task effectiveness. The next section details the analysis that leads to the identification of these five areas.

Tr iangulat ing Pr inc ipal Effect iveness 9
TDimensions of Principal Task Effectiveness
o better understand the job of the principal, we developed a list of common tasks that principals are likely to encounter regularly as part of their job duties. As described above, this task list drew from the research literature, discussions with principals, and observations in pilot schools. We then con-verted this list into an inventory of 42 task items and asked principals to rate their own effectiveness
at each one on a four-point scale. Example items included “Hiring personnel,” “Maintaining campus facili-ties,” “Evaluating curriculum,” and “Communicating with parents.” Figure 1 shows the items.
Figure 1: Principals’ Ratings of Own Task Effectiveness Grouped by Factors
2 2.2 2.4 2.6 2.8 3 3.2 3.4 3.6 3.8 4
Using data to inform instructionDeveloping a coherent educational program across the school
Using assessment results for program evaluationFormally evaluating teachers & providing instructional feedback
Classroom observationsUtilizing school meetings to enhance school goalsPlanning professional development for teachers
Implementing professional developmentEvaluating curriculum
Informally coaching teachersDirecting supplementary, after-school or summer instruction
Releasing/counseling out teachersPlanning professional development for prospective principals
Developing relationships with studentsCommunicating with parents
Attending school activities (e.g. sports events)Counseling students or parents
Counseling staff about conflicts with other staff membersInformally talking to teachers about students
Interacting socially with staff
Developing a safe school environmentDealing with concerns from staffManaging budgets & resources
Hiring personnelManaging personal, school-related schedule
Maintaining campus facilitiesManaging non-instructional staff
Interacting/networking with other principals
Managing school schedulesManaging student discipline
Fulfilling compliance requirements & paperworkImplementing standardized tests
Managing student services (e.g. records, reporting)Supervising students (e.g. lunch duty)
Managing student attendance-related activitiesFulfilling special education requirements
Communicating with the district to obtain resourcesWorking with local community members/organizations
Utilizing district office communications to enhance goalsFundraising
Instruction Management
Internal Relations
Organization Management
Administration
External Relations

Sc hool Leadersh ip Researc h10
An exploratory factor analysis of principals’ re-sponses identified patterns in the effectiveness ratings.2 Bartlett’s sphericity test (p < 0.001) and the Kaiser-Meyer-Olkin statistic (0.921) both con-firmed the adequacy of the data for factoring. With the standard criterion of accepting factors with eigenvalues greater than 1.0, five underlying factors emerged from the data. To aid in the identifica-tion of patterns of loadings across factors, we used varimax rotation. One consequence of this rotation is that the rotated factors are uncorrelated with one another by construction, a fact that affects how we interpret the results later on. At this stage, two of the 42 items were dropped because the loadings were very low across all five factors. Among the remaining 40 items, we identified and labeled five distinct dimensions along which principals judge their own effectiveness using the factor loadings matrix shown in Appendix Table 1. We denote these dimensions of principal skills as: Instruction Management, Internal Relations, Organization Man-agement, Administration, and External Relations. Below we describe each dimension.
Figure 1 groups the individual items under these headers according to which factor each elemental variable loaded on most heavily. The figure shows variation in principals’ ratings across individual items within and across the factors. On average, principals felt the most effective at developing relationships with students, communicating with parents, attending school activities, developing safe school environments, dealing with concerns from staffs, managing school schedules and using data to inform instruction. Principals felt least effective at fundraising, planning professional development for prospective principals, releasing or counseling out teachers, utilizing district office communications to enhance their goals, and working with local community members and organizations. While on average principals rated themselves highly on most tasks, we will see below that there is sufficient variation in the composite factor scores to identify differences across principals in their relative ratings across factors.
Instruction Management
The Instruction Management dimension repre-sents the set of tasks in which principals engage in order to promote, support and improve the implementation of curricular programs in class-rooms. As shown in Figure 1, 13 items from the principal questionnaire primarily load onto this factor. Three of the items with the highest load-ings are those that address the role of the principal in developing teachers’ instructional capacities: planning professional development for teachers (0.72), implementing professional development (0.66) and informally coaching teachers (0.62). The next three items that rank most highly in-volve the evaluative role the principal plays with respect to classroom instruction: evaluating curric-ulum (0.62), using assessment results for program evaluation (0.62) and formally evaluating instruc-tion and providing instructional feedback (0.60). Professional development and program evaluation clearly anchor principals’ assessments of their ef-fectiveness as managers of school instruction.
How effective do principals rate themselves with respect to the various Instruction Management measures? Figure 1 is organized to facilitate ease of comparison among items, ordering them from highest to lowest within factors. One general observation from scanning across all of the factors is the relative lack of variation; mean responses for all but one item (fundraising) fall above 3.0, which corresponds to “effective” on the rat-ings scale. In other words, principals as a group generally expressed confidence in their abilities to engage in and complete nearly all the tasks about which they were asked. Within the Instruction Management factor, less than half a rating point separated the task at which principals felt most effective (using data to inform instruction, 3.64) from the one at which they felt least effective (planning professional development for prospec-tive principals, 3.18). Yet while few principals rated themselves “ineffective” or only “somewhat effective” across the tasks assessed by the sur-
Tr iangulat ing Pr inc ipal Effect iveness 11
vey, there was more variation between those who rated themselves “effective” and those who rated themselves “very effective.” Thus while 65 percent gave themselves the highest score on using data to inform instruction, just 35 percent gave themselves a similar rating for their ability to plan professional development for potential principals.
Taking a self-assessment of four as an indication that a principal feels completely confident in his or her ability to complete a given task effectively, we find that in six of the 13 tasks measured under Instruction Management, at least half of respond-ing principals feel fully effective. In addition to data use, these are: developing a coherent edu-cational program across the school (61 percent), using assessment results for program evaluation (60 percent), formally evaluating teachers and provid-ing instructional feedback (57 percent), classroom observations (57 percent), and utilizing school meetings to enhance school goals (56 percent). At the other end of the spectrum, just 38 percent of principals expressed full confidence in their ef-fectiveness at directing supplementary instruction, and just 31 percent felt fully effective at releasing or counseling out ineffective teachers.
Internal Relations
The second dimension of principal task effectiveness we label Internal Relations. This factor captures effectiveness at tasks related to principals’ capacities for building strong interpersonal relationships within the school. Seven of the task items load most highly onto this factor. The items that load most highly are counseling staff about conflicts with other staff members (loading = 0.68) and counseling students or parents (0.66).
Figure 1 shows that there is even less variation in principals’ ratings of their effectiveness at build-ing interpersonal relationships than we saw with Instruction Management. The mean score for six of the seven items was 3.5 or higher, and the seventh, interacting socially with staff, had an aver-
age of 3.42. On each of these items, at least half of principals gave themselves the highest score of four, indicating that in general principals feel a high degree of confidence in their effectiveness in the interpersonal dimension. Seventy-two percent of principals rated themselves “very effective” at developing relationships with students, and 70 percent said they were “very effective” at com-municating with parents. At the other end of the spectrum, just 54 percent gave themselves the highest ratings on informally talking to teachers about students, and just over 50 percent felt fully effective at interacting socially with staff.
Organization Management
A third identifiable set of tasks captured the principal’s effectiveness at overseeing the func-tioning of the school. This set included tasks that we would expect the principal to take active and direct responsibility for executing throughout the year in pursuit of the school’s medium- and long-term goals. We refer to this dimension as Organi-zation Management. The three (of eight) question-naire items that load most highly onto this factor are maintaining campus facilities (loading = 0.65), managing budgets and resources (0.59), and de-veloping a safe school environment (0.55).
Again, the mean self-ratings for the Organization Management tasks were quite high on the whole, with seven of eight receiving a mean score of 3.5 or higher. Looking instead at the variation be-tween scores of three and four, we see that princi-pals rated themselves most effective at developing a safe school environment (“very effective” = 68 percent), dealing with concerns from staff (65 per-cent) and managing the budget (64 percent). The lowest scores were given to networking with other principals (47 percent), an item that in fact does not load highly on any of the five factors. Exempt-ing this item, no fewer than 53 percent of princi-pals indicated the highest level of effectiveness at any of the tasks in the Organization Management dimension.
Sc hool Leadersh ip Researc h12
Administration
We label the fourth dimension of principal task effective-ness Administration. Again, eight questionnaire items capture this construct. This area of task effectiveness is characterized by more routine administrative duties and tasks executed to comply with state or federal regulations. The two items that load most highly on this factor are managing student records and reporting and implement-ing standardized tests, both of which have loadings of 0.60. Other tasks in this area include managing school schedules, fulfilling compliance requirements and paper-work, and managing student attendance-related activi-ties. Administration also includes student discipline and student supervision (e.g. lunch duty).
In this area, principals report feeling most effective at man-aging school schedules and managing student discipline. Both of these items had means of about 3.65 with approx-imately two-thirds of principals assessing their effective-ness at the highest level on the scale. Fulfilling compliance requirements and implementing standardized tests are also tasks at which principals tend to rate themselves highly, with 60 and 51 percent, respectively, assigning themselves a score of “very effective” in these areas. Somewhat further down were records and reporting, student supervision and managing attendance. The lowest mean effectiveness score for the items under this factor went to fulfilling special education requirements at 3.30. Just 40 percent of prin-
cipals rated themselves “very effective” at these duties.
External Relations
The final dimension of principal task effec-tiveness we derived from the principals’ self-ratings concerns tasks related to working with stakeholders beyond the schoolhouse doors. Just four items load primarily on this factor: communicating with the district to obtain resources, working with local community members and organizations, utilizing district office communications to enhance goals, and fundraising. A comparison of the External Relations factor with the previous four shows that the four tasks identified under this head-ing tend to have much lower mean effectiveness scores than nearly any other items assessed by the questionnaire. In fact, with the exception of two Instruction Management items, the mean scores of all four External Relations tasks are lower than the lowest-scored tasks from any other factor. Only 38 percent of principals rated themselves as “very effective” at either communicating with the district to obtain resources or working with the local commu-nity. Thirty-three percent said they were “very effective” at utilizing district communications. A low 18 percent expressed the highest level of confidence in their effectiveness at fundraising,
with 26 percent describing themselves as “ineffective” or only “a little effective.”
Having uncovered the five factors of principal task effectiveness discussed above, we applied a standard factor scoring method to the principals’ responses to assign an effectiveness score to each principal in each of the five task areas. Because the resulting scores are on an indeterminate scale, we standardized the scores to have a mean of zero and standard deviation of one. Each principal’s five individual scores then measure standard deviations of self-assessed effectiveness above or below that of the average principal. These standardized factor scores are the focus of our main analyses.

Tr iangulat ing Pr inc ipal Effect iveness 13
PDifferences in Task Effectiveness
Across Schools and Principalsrincipals may assess themselves as more or less effective on a given dimension of job tasks not only because of their own skills but also because of the difficulty of the contexts in which they work. There is growing evidence that school context influences principals’ practice (Stein & Nelson 2003) and, consequently, their efficacy. For example, principals may have more demands in challenging school contexts, and thus
may need to focus their priorities on a narrower set of tasks (Goldring, Huff, May & Camburn, 2008). Moreover, schools with certain characteristics may be able to attract principals who are more effective on one dimension than on another. For these reasons, we might expect to see systematic differences in these effectiveness measures between schools. Similarly, principals may become relatively more effective as they gain experience in the job, or they may differ based on their background characteristics. To assess these possibilities, we compare principals by gender, experience, and education. We also compare schools by school level (i.e. elementary, middle or high school), school enrollment, and proportion of students eligible for free or reduced price lunch, a measure of poverty.
Table 2 shows that, on average, female principals rate themselves more highly on Instruction Management and Administration and less highly on Organization Man-agement than do their male peers. More experienced principals rate themselves more highly on Instruction Management, Internal Relations, and Organization Management than their less experienced peers, but do not rate themselves differently on Administration or External Relations. Principals with higher educational attainment also rate themselves higher on most dimen-sions. In particular, principals’ with doctoral degree rate themselves as stronger in Instruction Management, Organization Management and External Relations, while there is no difference by education level in Inter-nal Relations or Administration. Table 2 also shows no important differences by school level, with principals in elementary, middle and high schools rating themselves approximately equally, on average. This result is some-what surprising given that the organizational structures of high schools often differ from those of elementary schools in ways we might expect to emphasize the im-portance of different skill sets. We also find only minor differences in principals’ self-reported effectiveness by school enrollment, with principals in larger schools rat-ing themselves higher on External Relations.
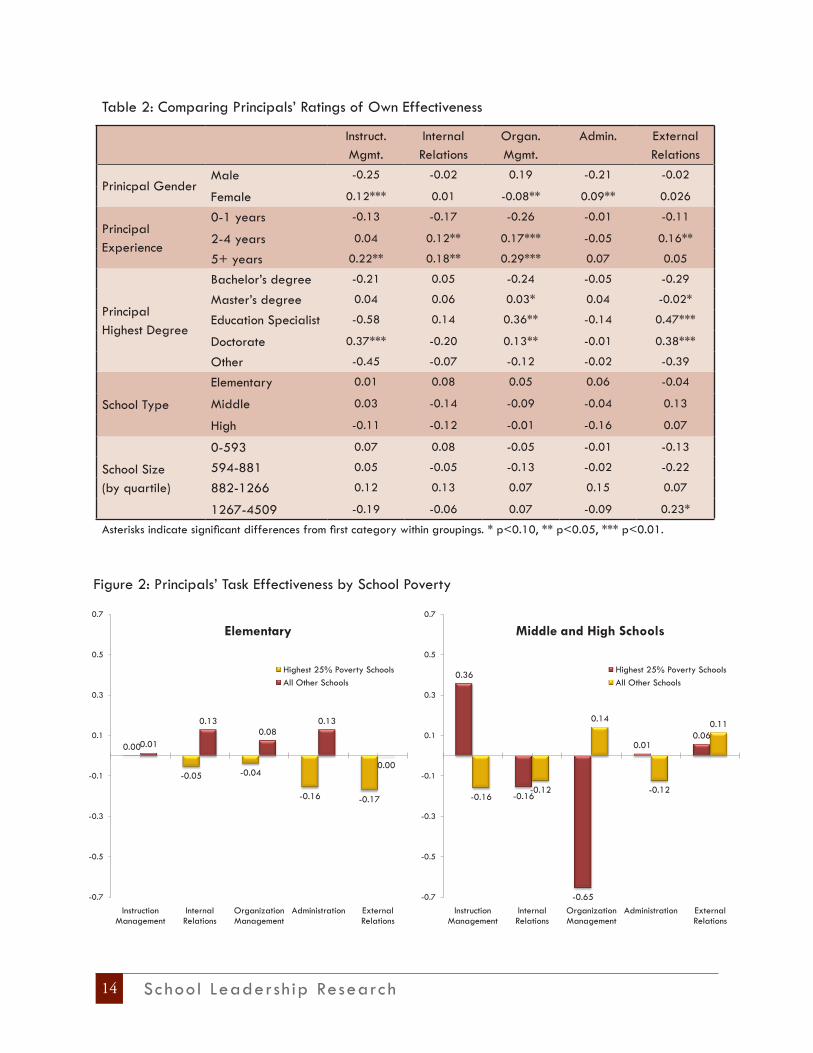
Figure 2 illustrates differences in principals’ self-assess-ments by poverty level. We use free and reduced price lunch eligibility as a proxy for student disadvantage and categorize schools by quartile, comparing the 25 percent
of schools with the highest concentrations of students in poverty with other schools in the district. Because of differences in poverty by school level, we separate elementary schools from middle and high schools for this analysis. The figure shows only small differences in average ratings by poverty level for elementary schools. None of the sample differences shown in the elementary school graph are statistically significant. At the high school level, however, principals in high-poverty schools are likely to feel more effective at Instruction Manage-ment and less effective at Organization Management than principals in other schools. These differences are quite large, totaling more than a quarter of a standard deviation for Instruction Management and more than half a standard deviation for Organization Management. Later we will argue that the stark differences in Orga-nization Management effectiveness between principals in schools at opposite ends of the student disadvantage spectrum raises significant equity concerns, as we will discover that the Organization Management dimension of task effectiveness has stronger ties to positive school performance than do the other dimensions. However, differences among principals’ ratings may come either from the skills of the principals or from the difficulty of the job. If higher poverty schools are more difficult to manage than are other schools, principals may not feel as effective in these schools. Of course, all of the tasks may be more difficult in high poverty schools; the findings below indicate a differential difficultly or lack of effec-tiveness in Organization Management.
Sc hool Leadersh ip Researc h14
Figure 2: Principals’ Task Effectiveness by School Poverty
Table 2: Comparing Principals’ Ratings of Own Effectiveness
Instruct.Mgmt.
Internal Relations
Organ.Mgmt.
Admin. External Relations
Prinicpal GenderMale -0.25 -0.02 0.19 -0.21 -0.02
Female 0.12*** 0.01 -0.08** 0.09** 0.026
Principal Experience
0-1 years -0.13 -0.17 -0.26 -0.01 -0.11
2-4 years 0.04 0.12** 0.17*** -0.05 0.16**
5+ years 0.22** 0.18** 0.29*** 0.07 0.05
Principal Highest Degree
Bachelor’s degree -0.21 0.05 -0.24 -0.05 -0.29
Master’s degree 0.04 0.06 0.03* 0.04 -0.02*
Education Specialist -0.58 0.14 0.36** -0.14 0.47***
Doctorate 0.37*** -0.20 0.13** -0.01 0.38***
Other -0.45 -0.07 -0.12 -0.02 -0.39
School Type
Elementary 0.01 0.08 0.05 0.06 -0.04
Middle 0.03 -0.14 -0.09 -0.04 0.13
High -0.11 -0.12 -0.01 -0.16 0.07
School Size (by quartile)
0-593 0.07 0.08 -0.05 -0.01 -0.13
594-881 0.05 -0.05 -0.13 -0.02 -0.22
882-1266 0.12 0.13 0.07 0.15 0.07
1267-4509 -0.19 -0.06 0.07 -0.09 0.23*
Asterisks indicate significant differences from first category within groupings. * p<0.10, ** p<0.05, *** p<0.01.
0.00
-0.05 -0.04
-0.16 -0.17
0.01
0.130.08
0.13
0.00
-0.7
-0.5
-0.3
-0.1
0.1
0.3
0.5
0.7
Instruction Management
Internal Relations
Organization Management
Administration External Relations
Highest 25% Poverty SchoolsAll Other Schools
Elementary
0.36
-0.16
-0.65
0.010.06
-0.16-0.12
0.14
-0.12
0.11
-0.7
-0.5
-0.3
-0.1
0.1
0.3
0.5
0.7
Instruction Management
Internal Relations
Organization Management
Administration External Relations
Highest 25% Poverty SchoolsAll Other Schools
Middle and High Schools
Tr iangulat ing Pr inc ipal Effect iveness 15
UPrincipal Task Effectiveness andMeasures of School Performanceltimately we would like to know which skills are particularly beneficial for principals in order to improve the performance of their schools. There are multiple difficulties with identifying these skills using survey data and statistical techniques. The first is that our measures of skill may not be capturing what we would like them to capture. Self-assessments of effectiveness are
clearly not the perfect measure of principal effectiveness. People do not always assess their own strengths accurately. Moreover, any single measure of school success is limited. Student test score performance, for example, may reflect school leadership skills but are also likely a reflection of the backgrounds of the students themselves. As a result, it is worth comparing principal’s assessment of their effectiveness to a range of other measures. In this section, we use three measures of school effectiveness, as discussed above: school grades in the Florida test-based school accountability system, teacher satisfaction, and parent grad-ing of schools.
The causal direction of the relationship between principals’ efficacy and school performance mea-sures is not always clear. It is easy to imagine that principals feel better about their job performance in schools that are performing better. A simple correlation or partial correlation of principal ef-ficacy and school performance would tell us little about the effects of principal skills on school out-comes. The analyses to follow address this causa-tion concern in two ways, though neither approach is sufficient for identifying causality. First, we do not use an overall measure of principal efficacy but instead scores based on their sense of effectiveness on five dimensions that are uncorrelated with one another by design, a result of the varimax rotation procedure we used in the creation of the factors. A principal who is high on one dimension is no more or less likely to be high on any of the other dimensions. Thus, whereas we may be concerned that a principal feels better about his skills overall when his school performs at a higher level, it is less obvious that these feelings would systematically be reflected among some skills rather than others. Second, we use a regression framework that adjusts for other characteristics of the school that, if omit-ted, might create biased estimates. All regressions account for school level, poverty and race. In addi-tion, in the analyses estimating school grades in the Florida accountability system, we run specifications controlling for prior school grade so as to better
estimate the relationship between principal task efficacy and performance gains. In the estimates of the other two measures, which are based on survey responses from teachers and parents, we run speci-fications controlling for school grade to separate the portion of these assessments attributable to the principal from the portion attributable to long-run school performance.
Principals’ Self-Assessed Task Effec-tiveness and State-Assessed School Effectiveness
Figure 3 gives a first descriptive look at the rela-tionship between principals’ assessment of their task effectiveness and school grades. The highest-performing schools, those assigned an A by the state accountability system, had principals who assessed themselves as more effective on all five of the dimensions. This difference is greatest for Organization Management and least strong for Instruction Management and External Relations. The associations between school performance and principal task efficacy depicted in Figure 3 may be causal, but it may also be the case that high performing schools differ in other ways that mask the true relationship between task effectiveness and performance. For example, if higher poverty schools have both lower Organization Manage-ment efficacy and lower performance, then the

Sc hool Leadersh ip Researc h16
Figure 3: Principals’ Task Effectiveness by School Accountability Grade
relationship between Organization Management and performance may just be a reflection of these poverty influences. To address this potential con-founding of relationships, we look at the relation between task efficacy and school performance in a multivariate framework that allows us to control for school characteristics.3
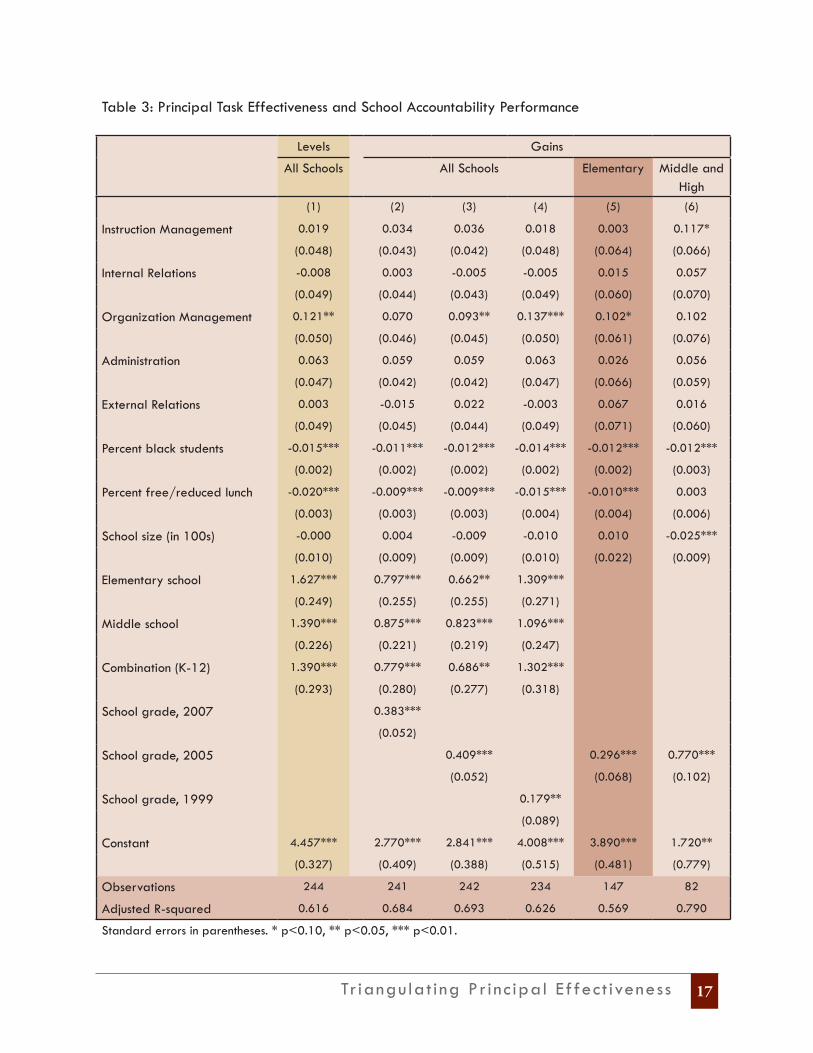
Table 3 shows the results of the analyses. Across all specifications, self-assessed effectiveness in Organization Management is positively related to school performance. In most specifications this relationship is statistically significant, and in those where it is not, the p-values fall just above the 0.10 cutoff. No other task-efficacy dimension is statisti-cally associated with school performance. As an example of the relationship between Organiza-tion Management and performance, in column 1, we see that for all schools, a standard deviation increase in Organization Management is associated with a 0.12-point increase in school accountability performance, which is an increase of approximately ten percent of a standard deviation.
The remaining columns include controls for prior school grades and, in this way, estimate the rela-tionship between the task dimensions and perfor-mance gains, rather than just performance levels. Our preferred control is the 2005 grades because it balances the advantage of assessing longer term gains with the disadvantage of potentially attribut-ing changes to principals that they were not re-sponsible for (column 3), though for completeness we include in columns 2 and 4 other prior years’ grades as controls as well. The point estimate for Organization Management in column 3 is 0.09, corresponding to a standardized beta value (effect size) of 0.08. For comparison, the effect sizes for percent black and percent subsidized lunch are -0.34 and -0.17, respectively, suggesting that the association between outcomes and Organization Management is between one-fourth and one-half as large as the association between outcomes and student demographics.4
Next we split the sample between elementary schools and middle and high schools to examine whether the effectiveness associations are driven by school level (columns 5 and 6). However, we find only small differences. While the Instruction Management coefficient is larger for secondary schools and statistically significant at the 0.10-lev-el, the other effectiveness variables remain similar. The point estimates for Organization Management are identical in both models (ß = 0.10), though due to the smaller number of upper-level schools, the coefficient is only statistically significant for elementary schools.
Teacher Satisfaction
The first two columns of Table 4 give the result of a similar estimation using teacher satisfaction as the outcome variable. The impact of principal skills on teachers is an important consideration both be-cause the teacher is a central stakeholder in schools and because teacher satisfaction and turnover have been linked to lower student performance (Judge et al., 2001; Ostroff, 1992; Rivkin, Hanushek & Kain, 2005). The regressions are performed at the
0.09
0.14
0.26
0.15
0.09
-0.09-0.11
-0.19-0.16
-0.07
-0.30
-0.20
-0.10
0.00
0.10
0.20
0.30
Instruction Management
Internal Relations
Organization Management
Administration External Relations
"A" SchoolsAll Other Schools
Tr iangulat ing Pr inc ipal Effect iveness 17
Table 3: Principal Task Effectiveness and School Accountability Performance
Levels Gains
All Schools All Schools Elementary Middle and High
(1) (2) (3) (4) (5) (6)
Instruction Management 0.019 0.034 0.036 0.018 0.003 0.117*
(0.048) (0.043) (0.042) (0.048) (0.064) (0.066)
Internal Relations -0.008 0.003 -0.005 -0.005 0.015 0.057
(0.049) (0.044) (0.043) (0.049) (0.060) (0.070)
Organization Management 0.121** 0.070 0.093** 0.137*** 0.102* 0.102
(0.050) (0.046) (0.045) (0.050) (0.061) (0.076)
Administration 0.063 0.059 0.059 0.063 0.026 0.056
(0.047) (0.042) (0.042) (0.047) (0.066) (0.059)
External Relations 0.003 -0.015 0.022 -0.003 0.067 0.016
(0.049) (0.045) (0.044) (0.049) (0.071) (0.060)
Percent black students -0.015*** -0.011*** -0.012*** -0.014*** -0.012*** -0.012***
(0.002) (0.002) (0.002) (0.002) (0.002) (0.003)
Percent free/reduced lunch -0.020*** -0.009*** -0.009*** -0.015*** -0.010*** 0.003
(0.003) (0.003) (0.003) (0.004) (0.004) (0.006)
School size (in 100s) -0.000 0.004 -0.009 -0.010 0.010 -0.025***
(0.010) (0.009) (0.009) (0.010) (0.022) (0.009)
Elementary school 1.627*** 0.797*** 0.662** 1.309***
(0.249) (0.255) (0.255) (0.271)
Middle school 1.390*** 0.875*** 0.823*** 1.096***
(0.226) (0.221) (0.219) (0.247)
Combination (K-12) 1.390*** 0.779*** 0.686** 1.302***
(0.293) (0.280) (0.277) (0.318)
School grade, 2007 0.383***
(0.052)
School grade, 2005 0.409*** 0.296*** 0.770***
(0.052) (0.068) (0.102)
School grade, 1999 0.179**
(0.089)
Constant 4.457*** 2.770*** 2.841*** 4.008*** 3.890*** 1.720**
(0.327) (0.409) (0.388) (0.515) (0.481) (0.779)
Observations 244 241 242 234 147 82
Adjusted R-squared 0.616 0.684 0.693 0.626 0.569 0.790
Standard errors in parentheses. * p<0.10, ** p<0.05, *** p<0.01.

Sc hool Leadersh ip Researc h18
teacher level but clustered at the school level to ac-count for the hierarchical nature of the data. The two models shown are identical, controlling for school and teacher characteristics, except that the second column adds a control for the school’s state accountability grade for 2007. Adding this control removes that part of teacher satisfaction associated with working in a traditionally high-performing school. In both models, again, Organization Management is positive, with coefficients ranging from 0.027 to 0.015, though the coefficient is only significantly different than zero in the first column, before con-trolling for last year’s accountability grade. The ef-fect size in column 2 is 0.02, compared to 0.15 for the 2007 grade and -0.11 for percent black. The decline in the coefficient between the two models suggests that a significant portion of Organization Management’s effects on teacher satisfaction may operate indirectly via its effects on student perfor-mance. Perhaps surprisingly, principal task efficacy in Administration is negatively and significantly related to teacher satisfaction in both models (ef-fect size = -0.03), suggesting that principals whose skills are strongest in routine administrative tasks are least equipped to create positive teacher work environments. Instruction Management is not as-sociated with teacher satisfaction in either model. In general, the low degree of power the principal effectiveness and other variables have in explain-ing teacher satisfaction may result from the rela-tive roughness and low variation of the available satisfaction measure.
Parents’ Ratings of School Performance The final two columns of Table 4 model parents’ assess-ments of the school from the school climate survey as a function of principal efficacy in the five task dimen-sions, controlling for school characteristics. We see that parents rate schools more highly when there are a lower concentration of black students or students eligible for subsidized lunch, when the school is smaller, when it is an elementary school relative to a high school or a high school relative to a middle school, and when the schools’ state accountability grade is higher.
More importantly for this study, we find again a positive association between principals’ self-assessed Organiza-tion Management skills and parents’ assessments of the schools’ performance in both models. This partial cor-relation is statistically significant at the 0.01-level, both with and without the control for school performance, though the smaller coefficient on Organization Manage-ment in the second model (ß = 0.14, effect size = 0.08) indicates that some of the relationship between this dimension and the parents’ assessment can be attributed to the tendency for principals with better Organization Management skills to be located in schools with higher-performing students. Some of this difference may result from the indirect effect that principal Organization Management has on student outcomes, as suggested in Table 3. None of the other areas of task efficacy are sta-tistically associated with parent rating in either model, suggesting that, at the margins, effective Organization Management skills are a more important determinant of parents’ views of their children’s schools than other principal skill groups.5

Tr iangulat ing Pr inc ipal Effect iveness 19
Table 4: Principal Task Effectiveness, Teacher Satisfaction, and Parent Climate Survey GradesTeacher
SatisfactionParent Climate Grades
(1) (2) (1) (2)Instruction Management -0.012 -0.011 -0.073 -0.025
(0.012) (0.013) (0.060) (0.048)
Internal Relations 0.023 0.022* 0.036 0.027
(0.016) (0.015) (0.056) (0.048)
Organization Management 0.027* 0.015 0.249*** 0.136**
(0.015) (0.014) (0.059) (0.053)
Administration -0.019* -0.021* 0.059 0.071
(0.011) (0.011) (0.053) (0.043)
External Relations -0.009 -0.011 0.082 0.041
(0.012) (0.012) (0.055) (0.042)
Percent black students -0.004*** -0.003*** -0.016*** -0.008***
(0.001) (0.001) (0.002) (0.002)
Percent free/reduced lunch -0.004*** -0.001 -0.025*** -0.007**
(0.001) (0.001) (0.003) (0.003)
School size (in 100s) -0.002 -0.003 -0.061*** -0.043***
(0.003) (0.002) (0.013) (0.012)
Elementary school 0.123 -0.105 1.479*** 0.360
(0.079) (0.070) (0.342) (0.345)
Middle school 0.004 -0.161*** 0.034 -0.617**
(0.073) (0.062) (0.312) (0.293)
Combination (K-12) 0.117 -0.064 0.996*** 0.265
(0.074) (0.068) (0.364) (0.339)
School grade, 2008 0.088*** 0.647***
(0.017) (0.062)
Female teacher 0.016 0.017
(0.025) (0.025)
Black teacher 0.107*** 0.111***
(0.025) (0.025)
Hispanic teacher -0.120*** -0.118***
(0.021) (0.021)
Teacher’s yrs. in current job 0.002 0.001
(0.002) (0.002)
Teacher’s age 0.006*** 0.006***
(0.001) (0.001)
Teacher holds MA degree -0.021 -0.027
(0.017) (0.017)
Constant 3.539*** 3.191*** 7.585*** 4.429***
(0.109) (0.125) (0.505) (0.485)
Observations 9838 9612 248 240
Adjusted R-squared 0.059 0.067 0.688 0.803
Standard errors in parentheses. * p<0.10, ** p<0.05, *** p<0.01.

Sc hool Leadersh ip Researc h20
Further Evidence on Principal Task Effectiveness
from Assistant Principal Assessments
he analyses thus far have been based on principals’ assessments of their own task effectiveness. We have seen that the principals in our sample distinguish five areas of effectiveness and that their efficacy at Organization Management tasks is most consistently associated with positive school outcomes. However, the usefulness of these results may be limited by the fact that they
are based on principals’ self-assessments, which are not an ideal measure of the principals’ true effective-ness at these tasks. While the principals’ self-ratings have an informational advantage in the sense that principals experience themselves performing all of the tasks, they are not unbiased observers and thus may not provide objective assessments. One means of evaluating the validity of the principals’ self-assess-ments is to check them against the ratings of another observer. This technique is commonly employed in the development of personality tests and leadership inventories (Leslie & Fleenor, 1998). To provide this external check, we use assistant principals’ evaluations of their supervising principals’ skill sets.
Using assistant principals’ ratings has advantages and disadvantages. Assistant principals observe their principals performing many but not all of the tasks, which makes them more qualified to judge principals’ competencies in some areas than in oth-ers. For example, the assistant principal may have a good sense of how well the principal works at maintaining campus facilities but not of how well the principal networks outside the school. Also, like principals, assistant principals are unlikely to be unbiased observers of their principal’s performance, though given that these biases need not run in the same direction as the principals’, finding similari-ties between the two sets of ratings would be good confirmation that the dual evaluations provide meaningful information about the principals’ skills. The approach that we take to the analysis of the assistant principals’ ratings is similar to that used for the principals’ ratings. We administered a survey to all assistant principals in the district to collect assessments of the principals’ effectiveness on the same set of 42 tasks given to the principals. Explor-atory factor analysis of these responses with varimax rotation identified groupings that we use to define the dimensions of assistant principal-assessed prin-cipal effectiveness.6
TUsing the minimum eigenvalue criterion, assistant principals’ distinguish three areas of principals’ task effectiveness: Instruction Management, Internal Relations, and Organization Management. The fac-tor loadings for this analysis are given in Appendix 2.These three factors generally are consistent with the first three factors identified by the principals. In contrast to the principals’ ratings, the assistant principals did not distinguish Organization Man-agement from more routine administrative tasks, nor did they identify a separate External Relations dimension, perhaps because they do not com-monly observe principals performing these tasks. Examination of the factor loadings matrix reveals less stringent differentiation of principal skills by the assistant principals in general. Compared to the matrix in Appendix 1, assistant principal items are more likely to load highly on at least two factors. In fact, five items, grouped together at the bot-tom of the table, load relatively highly on all three factors, suggesting that, from the perspective of the assistant principals, these tasks necessitate compe-tency across all three dimensions. A good example is efficacy at hiring personnel, which correlates with management of instruction and of the orga-nization more generally, as well with principals’ interpersonal skills.
Tr iangulat ing Pr inc ipal Effect iveness 21
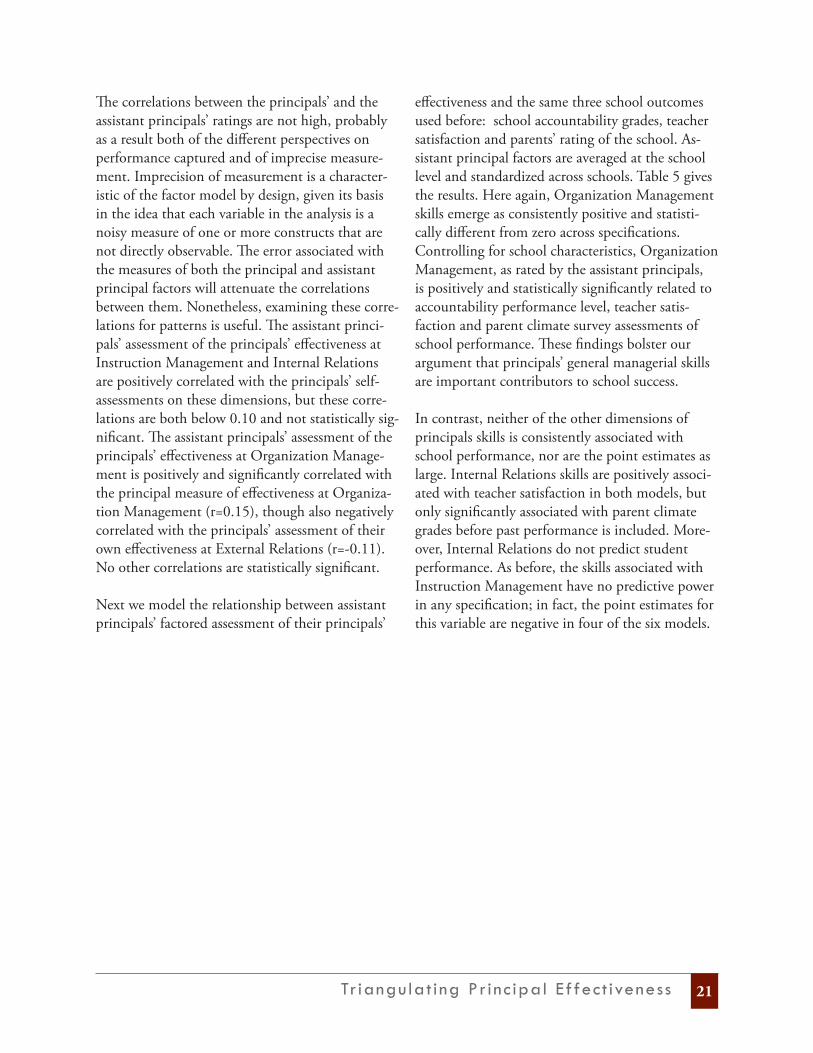
The correlations between the principals’ and the assistant principals’ ratings are not high, probably as a result both of the different perspectives on performance captured and of imprecise measure-ment. Imprecision of measurement is a character-istic of the factor model by design, given its basis in the idea that each variable in the analysis is a noisy measure of one or more constructs that are not directly observable. The error associated with the measures of both the principal and assistant principal factors will attenuate the correlations between them. Nonetheless, examining these corre-lations for patterns is useful. The assistant princi-pals’ assessment of the principals’ effectiveness at Instruction Management and Internal Relations are positively correlated with the principals’ self-assessments on these dimensions, but these corre-lations are both below 0.10 and not statistically sig-nificant. The assistant principals’ assessment of the principals’ effectiveness at Organization Manage-ment is positively and significantly correlated with the principal measure of effectiveness at Organiza-tion Management (r=0.15), though also negatively correlated with the principals’ assessment of their own effectiveness at External Relations (r=-0.11). No other correlations are statistically significant.
Next we model the relationship between assistant principals’ factored assessment of their principals’
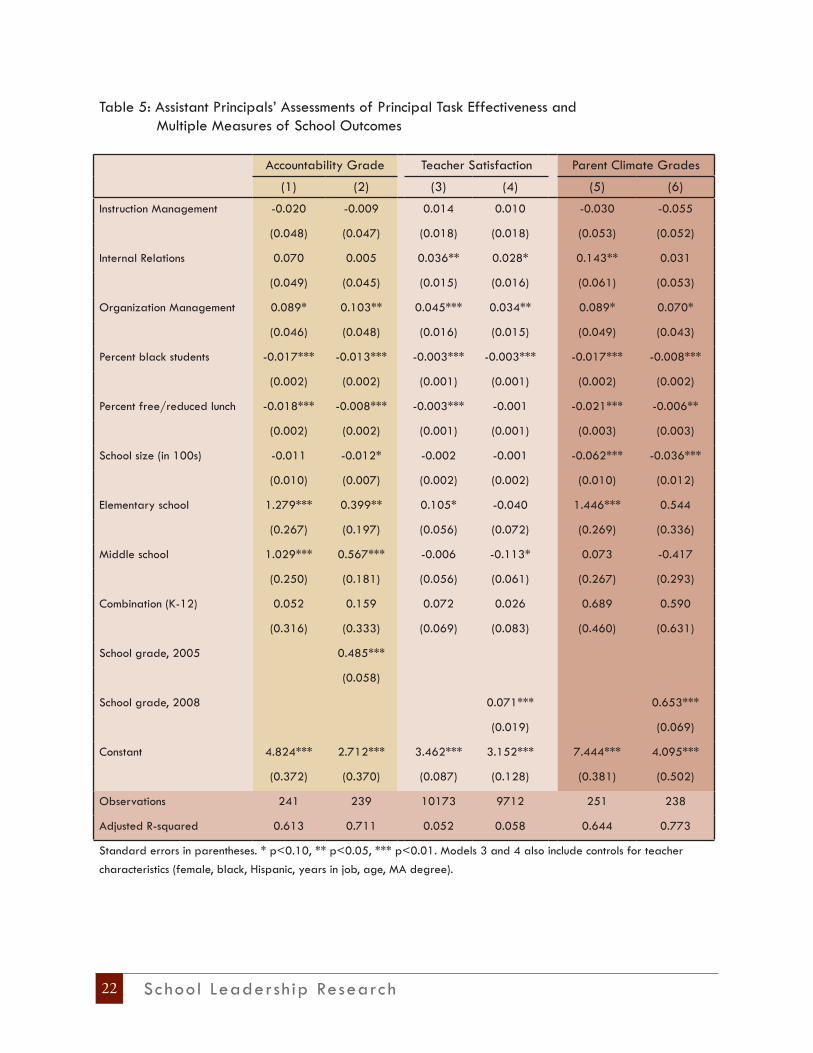
effectiveness and the same three school outcomes used before: school accountability grades, teacher satisfaction and parents’ rating of the school. As-sistant principal factors are averaged at the school level and standardized across schools. Table 5 gives the results. Here again, Organization Management skills emerge as consistently positive and statisti-cally different from zero across specifications. Controlling for school characteristics, Organization Management, as rated by the assistant principals, is positively and statistically significantly related to accountability performance level, teacher satis-faction and parent climate survey assessments of school performance. These findings bolster our argument that principals’ general managerial skills are important contributors to school success.
In contrast, neither of the other dimensions of principals skills is consistently associated with school performance, nor are the point estimates as large. Internal Relations skills are positively associ-ated with teacher satisfaction in both models, but only significantly associated with parent climate grades before past performance is included. More-over, Internal Relations do not predict student performance. As before, the skills associated with Instruction Management have no predictive power in any specification; in fact, the point estimates for this variable are negative in four of the six models.
Sc hool Leadersh ip Researc h22
Table 5: Assistant Principals’ Assessments of Principal Task Effectiveness and Multiple Measures of School Outcomes
Accountability Grade Teacher Satisfaction Parent Climate Grades
(1) (2) (3) (4) (5) (6)
Instruction Management -0.020 -0.009 0.014 0.010 -0.030 -0.055
(0.048) (0.047) (0.018) (0.018) (0.053) (0.052)
Internal Relations 0.070 0.005 0.036** 0.028* 0.143** 0.031
(0.049) (0.045) (0.015) (0.016) (0.061) (0.053)
Organization Management 0.089* 0.103** 0.045*** 0.034** 0.089* 0.070*
(0.046) (0.048) (0.016) (0.015) (0.049) (0.043)
Percent black students -0.017*** -0.013*** -0.003*** -0.003*** -0.017*** -0.008***
(0.002) (0.002) (0.001) (0.001) (0.002) (0.002)
Percent free/reduced lunch -0.018*** -0.008*** -0.003*** -0.001 -0.021*** -0.006**
(0.002) (0.002) (0.001) (0.001) (0.003) (0.003)
School size (in 100s) -0.011 -0.012* -0.002 -0.001 -0.062*** -0.036***
(0.010) (0.007) (0.002) (0.002) (0.010) (0.012)
Elementary school 1.279*** 0.399** 0.105* -0.040 1.446*** 0.544
(0.267) (0.197) (0.056) (0.072) (0.269) (0.336)
Middle school 1.029*** 0.567*** -0.006 -0.113* 0.073 -0.417
(0.250) (0.181) (0.056) (0.061) (0.267) (0.293)
Combination (K-12) 0.052 0.159 0.072 0.026 0.689 0.590
(0.316) (0.333) (0.069) (0.083) (0.460) (0.631)
School grade, 2005 0.485***
(0.058)
School grade, 2008 0.071*** 0.653***
(0.019) (0.069)
Constant 4.824*** 2.712*** 3.462*** 3.152*** 7.444*** 4.095***
(0.372) (0.370) (0.087) (0.128) (0.381) (0.502)
Observations 241 239 10173 9712 251 238
Adjusted R-squared 0.613 0.711 0.052 0.058 0.644 0.773
Standard errors in parentheses. * p<0.10, ** p<0.05, *** p<0.01. Models 3 and 4 also include controls for teacher characteristics (female, black, Hispanic, years in job, age, MA degree).
Tr iangulat ing Pr inc ipal Effect iveness 23
Discussion and Conclusionshis paper makes two contributions to the existing literature on principals’ work and prin-cipals’ effectiveness. First, it uses principals’ own assessment of their efficacy on a set of 42 tasks common to principal job to distinguish five dimensions of principal task-effectiveness. We do not pre-define these dimensions but instead use correlations across principals’ re-
sponses to uncover their own delineation of these dimensions. The areas of task effectiveness that emerge from this process are: Instruction Management, Internal Relations, Organization Management, Admin-istration, and External Relations. Across the board, principals feel effective at the work they do, but there are systematic differences, particularly with an overall lower sense of effectiveness in External Relations than in the other areas.
The remainder of the paper assesses the relationship between task-efficacy and school outcomes. The analyses emphasize the importance of principal Or-ganization Management skills for predicting school outcomes. Across measures derived from multiple constituents—students, teachers and parents—and on multiple dimensions, the principals’ effective-ness on organization management tasks consistently predict greater school performance. When we triangulate the principal’s assessment with those of the assistant principals in his or her school, we find similar results, confirming the central role that Organization Management effectiveness plays in successful schools. In contrast, we find few posi-tive relationships between school outcomes and the other four dimensions of task effectiveness we identify. In fact, for some outcome measures, we find statistically significant negative associations for some factors, such as the negative correlation be-tween Administrative efficacy and teacher satisfac-tion.
While we do not find positive associations between school outcomes and efficacy in instruction man-agement, our findings are not necessarily incon-sistent with research advocating the importance of instructional leadership for principals. However, they are inconsistent with the view that increasing the principal’s focus narrowly on overseeing instruc-tion and observing teachers in classrooms at the expense of managing key organizational functions, such as budgeting and maintaining campus facili-ties, is likely to result in school success. This view is corroborated by Hallinger (2005), who notes in
This review of the instructional leadership literature that despite popular images of instructional leaders directly supervising and evaluating teachers, very few studies find instructional leaders displaying hand-on supervision of classroom instruction. Rather, effective instructional leadership combines an understanding of the instructional needs of the school with an ability to target resources where they are needed, hire the best available teachers, provide teachers with the opportunities they need to improve, and keep the school running smoothly. Our analyses suggest that, at the margins, principal efficacy in these latter functions is more important for school effectiveness than previous work has emphasized (e.g., Heck, 1992; Leithwood, 1994). In contrast to Robinson, Lloyd, and Rowe (2008), who assert that “the closer educational leaders get to the core business of teaching and learning, the more likely they are to have a positive impact on students’ outcomes” (664), we conclude that principals devoting significant time and energy to becoming instructional leaders in their schools are unlikely to see improvement unless they increase their capacity for Organization Management as well.
These results argue for a broader definition of instructional leadership that includes skills embod-ied by our Organization Management dimension. Before the focus of the instructional leadership literature became direct interaction with teach-ers, Murphy (1988) argued as much, caution-ing against adopting a false dichotomy between management and instructional leadership, as “this

Sc hool Leadersh ip Researc h24
perspective incorrectly separates two potentially reinforcing constructs and overlooks the ways in which traditional, routine actions (i.e., manage-ment behaviors) can contribute to improved teaching and learning” (127). Recalling Marks and Printy’s (2003) call for integrating leadership per-spectives, we suggest that a more holistic view of school leadership as necessitating skills across mul-tiple dimensions, but especially as related to being the managers of the school as an organization, is important for identifying the ways that principals can promote school improvement.
Our findings have direct policy implications. First, districts seeking to identify the best candidates for open principal positions in their districts or to recruit potential candidates into the district’s principal pipeline may benefit by considering can-didates’ Organization Management competencies, such as those needed for effective teacher hiring and budget allocation. Almost all principals have substantial teaching experience prior to becoming an administrator, and this experience is likely to serve them well. However, many principals have few experiences managing complex organizations prior to entering administration in their school. As a result, it may be these skills, on average, that principals lack. It may well be that a productive strategy for increasing the performance of the districts’ lowest-achieving schools would be to shift the principals with the greatest management skills to those schools.
Unfortunately, in the district participating in the present study, we see little evidence of such a strategy. As we observe in Figure 2, the schools with the highest levels of student poverty, particu-larly at the middle and high school levels, tended to be led by principals assessing themselves the lowest on the Organizational Management dimen-sion. Instead, the district has hired principals into these schools who systematically are higher on the Instruction Management dimension, a human resource decision we have noted is supported by earlier research but that shows no evidence here of improving school performance. Given their strong
relationship with school performance in this study, a strategy of allocating principals with stronger Or-ganization Management skills may be one vehicle for promoting intra-district equity.
A second important implication is for the invest-ments that states and districts should make in principal preparation. In particular, pre-service and in-service administrator professional develop-ment programs may promote the greatest gains in overall principal effectiveness by focusing on the development of management competencies. Results of prior work on principal development programs are consistent with this recommendation. For example, Levine (2005) studies the content of top educational administration programs and concludes that even the best programs tend to be overly theoretical and disconnected from the needs of day-to-day school management. Similarly, in a study of 210 syllabi from educational leadership programs nationwide, Hess and Kelly (2007) con-clude that pre-service training is deficient in such key management topics as handling personnel and maintaining facilities. We suggest that cultivating a focus on development of Organization Manage-ment skills among school leaders should be con-sidered as one avenue for school improvement that might be pursued.
The study we have described faces several impor-tant limitations. The first is its limited geographic scope. While working with data from one large district holds many advantages, M-DCPS is atypi-cal in several respects, making external validity a concern. M-DCPS educates an uncommonly di-verse student body. Its large size (roughly 350,000 students) makes its leadership structure more hierarchical than most. At the time of our data col-lection, the district’s superintendent, Rudy Crew, was completing implementation of a strategic plan emphasizing instruction, professional development and school and district leadership that resulted in the district being named a finalist for the presti-gious Broad Prize in Urban Education (for the most improved urban school district in the nation) three years in a row. Thus, until further work is

Tr iangulat ing Pr inc ipal Effect iveness 25
ABOUT THE AUTHORS
JASON A. GRISSOM is assistant professor of public affairs at the Harry S Truman School of Public Affairs at the University of Missouri, a Policy Research Scholar at the University of Mis-souri Institute of Public Policy, and an affiliate of its P-20 Education Policy Research Center. His research focuses on quantitative analysis of the gov-ernance of K-12 public education, including both its management and political dimensions.
SUSANNA LOEB is professor of education at Stanford University, Director of the Institute for Research on Education Policy and Practice, and Co-Director at Policy Analysis for California Edu-cation. She specializes in the economics of educa-tion and the relationship between schools and federal, state, and local policies.
1. The number of regional centers was reduced from six to four after the data for this study were collected.
2. A small number of item responses were imputed prior to factoring to avoid loss of sample size.
3. We also considered the possibility that principal characteristics, such as experience and education, should be included in our models. In an alternative set of models, we included these variables in all of the principal effectiveness regressions and found that nei-ther experience nor education significantly explained any of dependent variables after the effectiveness factors were included. In none of the models could we reject the null hypothesis in a joint F-test that the variables all equaled zero. Moreover, the point estimates for the principal effectiveness variables were robust to the inclusion of these variables. As a result, in the interest of model parsimony we chose not to include principal characteristics in the models we report.
4. A comparison of the R2 coefficient in column 3 to one for an equivalent model without the five task ef-fectiveness variables shows that the principal variables explain 6–7% of the remaining variation in account-ability grades after accounting for school characteris-tics.
5. M-DCPS also provided us with students’ climate ratings, which were obtained in a survey similar to the one given to parents. The student grades were highly correlated with parents’ (r = 0.84); thus, the results obtained from using the student evaluations qualitatively were very similar to the parent results. For sake of brevity, these results are omitted.
6. Two survey items, Teaching students and Planning professional development for prospective principals, were dropped from the assistant principal analysis be-cause they contained more than 10% “I don’t know” or other missing responses. A small number of values were imputed to avoid loss of sample size due to item non-response.
ENDNOTESdone, we are not able to say how well our results generalize to other districts with different organi-zational structures, student bodies and cultures. This limitation is potentially a significant one given the argument in other studies that the deploy-ment of leadership skills and knowledge depends on context (Coburn, Touré, & Yamashita, 2009; Stein & Nelson, 2003). Expanding the analysis to other schools and districts also would allow for further testing and revision of the task effectiveness inventory on which this study’s results are based, which may provide school districts with a useful new tool for evaluating prospective and continuing principals.
A second limitation is the cross-sectional nature of the study, which prevents us from being able to examine how school outcomes may change when principals with different skill sets move into the school over time. This limitation also prevents us from doing a full analysis of how principal skills change and develop as they gain experience and adapt and respond to the particular school environ-ments in which they work. Developing longitudi-nal data sets that allow for these two areas of study would be a fruitful direction for future research.

Sc hool Leadersh ip Researc h26
References
Andrews, R., & Soder, R. (1987). Principal instructional leadership and school achievement. Educational Leadership, 44, 9-11.
Bass, B. M. (1998). Transformational leadership: Industrial, military, and educational impact. Mahwah, NJ: Erlbaum.Blase, J., & Blase, J. (1992). Handbook of instructional leadership: How really good principals promote teaching and
learning. Thousand Oaks, CA: Corwin Press, Inc.Bloom, N., & Van Reenen, J. (2007). Measuring and explaining management practices across firms and
countries. Quarterly Journal of Economics, 122(4), 1351-1408.Brewer, D. J. (1993). Principals and student outcomes: Evidence from U.S. high schools. Economics of Education
Review, 12(4), 281-292.Burns, J.M. (1978) Leadership. New York: Harper & Row.Cheng, Y. (1991). Leadership style of principals and organizational process in secondary schools. Journal of
Educational Administration, 29, 25-37.Coburn, C., Toure, J., & Yamashita, M. (2009). Evidence, interpretation, and persuasion: Instructional
decision making at the district central office. Teachers College Record, 111(4), 1115-1161.Davis, S., Darling-Hammond, L., LaPointe, M., & Meyerson, D. (2005). School leadership study: Developing
successful principals. Stanford, CA: Stanford University, Stanford Educational Leadership Institute.Figlio, D., & Lucas, M. (2004). What’s in a grade? School report cards and the housing market. American
Economic Review, 94(3), 591-604.Goldhaber, D., & Hannaway, J. (2004). Accountability with a kicker: Observations on the Florida A+
accountability plan. Phi Delta Kappan, 85(8), 598-605.Goldring, E., Huff, J., May, H., & Camburn, E. (2008). School context and individual characteristics: what
influences principal practice? Journal of Educational Administration, 46(3), 332-352.Goldring, E. B., & Pasternak, R. (1994). Principals’ coordinating strategies and school effectiveness. School
Effectiveness and School Improvement, 5(3), 239-253.Hale, E.L., & Moorman. H.N. (2003). Preparing school principals: A national perspective on policy and program
innovations. Washington, DC: Institute for Educational Leadership, and Edwardsville, IL: Illinois Education Research Council.
Hallinger, P. (2005). Instructional leadership and the school principal: A passing fancy that refuses to fade away. Leadership and Policy in Schools, 4, 1-20.
Hallinger, P., Bickman, L., Davis, K. (1996), School context, principal leadership and student achievement. Elementary School Journal, 96(5), 527-549.
Hallinger, P., & Heck, R. (1998). Exploring the principal’s contribution to school effectiveness: 1980-1995. School Effectiveness and School Improvement, 9, 157-191.
Hallinger, P., & Murphy, J. (1985). Assessing the instructional leadership behavior of principals. Elementary School Journal, 86(2), 217–248.
Heck, R.H. (1992). Principals’ instructional leadership and school performance: Implications for policy development. Educational Evaluation and Policy Analysis, 14(1), 21-34.
Heck, R.H., and Hallinger, P. (2005). The study of educational leadership and management. Educational Management Administration & Leadership, 33(2), 229-244.
Heck, R.H., Johnsrud, L.K., & Rosser, V.J. (2000). Administrative effectiveness in higher education: Improving assessment procedures. Research in Higher Education, 41(6), 663-684.
Hess, F.M., & Kelly, A.P. (2007). Learning to lead: What gets taught in principal-preparation programs. Teachers College Record, 109(1), 221-243.
Judge, T.A., Thoresen, C.J., Bono, J.E., & Patton, G.K. (2001). The job satisfaction-job performance relationship: A qualitative and quantitative review. Psychological Bulletin, 127(3), 376-407.
Tr iangulat ing Pr inc ipal Effect iveness 27
Kaplan, S.N., Klebanov, M.M., & Sorensen, M. (2008). What CEO characteristics and abilities matter? NBER Working Paper No. 14195.
Leithwood, K. (1994). Leadership for school restructuring. Educational Administration Quarterly, 30, 498-518.Leithwood, K., & Jantzi, D. (2008). Linking leadership to student learning: The contributions of leader
efficacy. Educational Administration Quarterly, 44(4), 496-528.Leithwood, K., Jantzi, D., Silins, H., & Dart, B. (1993). Using the appraisal of school leaders as an instrument
for school restructuring. Peabody Journal of Education, 68, 85-109.Leithwood, K., Seashore Louis, K., Anderson, S., & Wahlstrom, K. (2004). How leadership influences student
learning. St. Paul, MN: Center for Applied Research and Educational Improvement.Leslie, J., & Fleenor, J. (1998). Feedback to managers: A review and comparison of multi-rater instruments for
management development (3rd edition). Greensboro, NC: Center for Creative Leadership.Levine, A. (2005). Educating school leaders. New York: The Education Schools Project. Marcoulides, G.A., Larsen, T.J., & Heck, R.H. (1995). Examining the generalizability of a leadership model:
Issues for assessing administrator performance. International Journal of Educational Management, 9(6), 4-9.
Marks, H. M., & Printy, S. M. (2003). Principal leadership and school performance: An integration of transformational and instructional leadership. Educational Administration Quarterly, 39(3). 370-397.
Murphy, J. (1988). Methodological, measurement, and conceptual problems in the study of instructional leadership. Educational Evaluation and Policy Analysis, 10(2), 117-139.
Murphy, J., Elliott, S. N., Goldring, E., & Porter, A. C. (2006). Learning-centered leadership: A conceptual foundation. Nashville, TN: Learning Sciences Institute.
Ostroff, C. (1992). The relationship between satisfaction, attitudes, and performance: An organizational level analysis. Journal of Applied Psychology, 77(6), 963-974.
Porter, A. C., Goldring, E., Murphy, J., Elliott, S. N., & Cravens, X. A framework for the assessment of learning-centered leadership. Nashville, TN: Learning Sciences Institute.
Rivkin, S.G., Hanushek, E.A., & Kain, J.F. (2005). Teachers, schools, and academic achievement. Econometrica, 73(2), 417-458.
Robinson, V. M. J., Lloyd, C. A., & Rowe, K. J. (2008). The impact of leadership on school outcomes: An analysis of the differential effects of leadership types. Educational Administration Quarterly, 44(5), 635-674.
Rosser, V.J., Johnsrud, L.K., & Heck, R.H. (2003). Academic deans and directors: Assessing their effectiveness from individual and institutional perspectives. Journal of Higher Education, 74(1), 1-25.
Rouse, C.E., Hannaway, J., Goldhaber, D., & Figlio, D. (2007). Feeling the Florida heat? How low-performing schools respond to voucher and accountability pressure. National Bureau of Economics Research Working Paper 13681.
Southworth, G. (2002). Instructional leadership in schools: Reflections and empirical evidence. School Leadership and Management, 22(1), 73-91.
Spillane, J.P., Camburn, E.M., & Pareja, A.S. (2007). Taking a distributed perspective to the school principal’s workday. Leadership and Policy in Schools, 6(1), 103-125.
Stein, M. K., & Nelson, B. S. (2003). Leadership content knowledge. Educational Evaluation and Policy Analysis, 25(4), 423-448.
Waters, T., Marzano, R.J., & McNulty, B. (2003). Balanced leadership: What 30 years of research tells us about the effect of leadership on student achievement. Aurora, CO: Mid-Continent Research for Education and Learning.
Witziers, B., Bosker, R.J., & Krüger, M.L. (2003). Educational leadership and student achievement: The elusive search for an association. Educational Administration Quarterly, 39(3), 398-425.
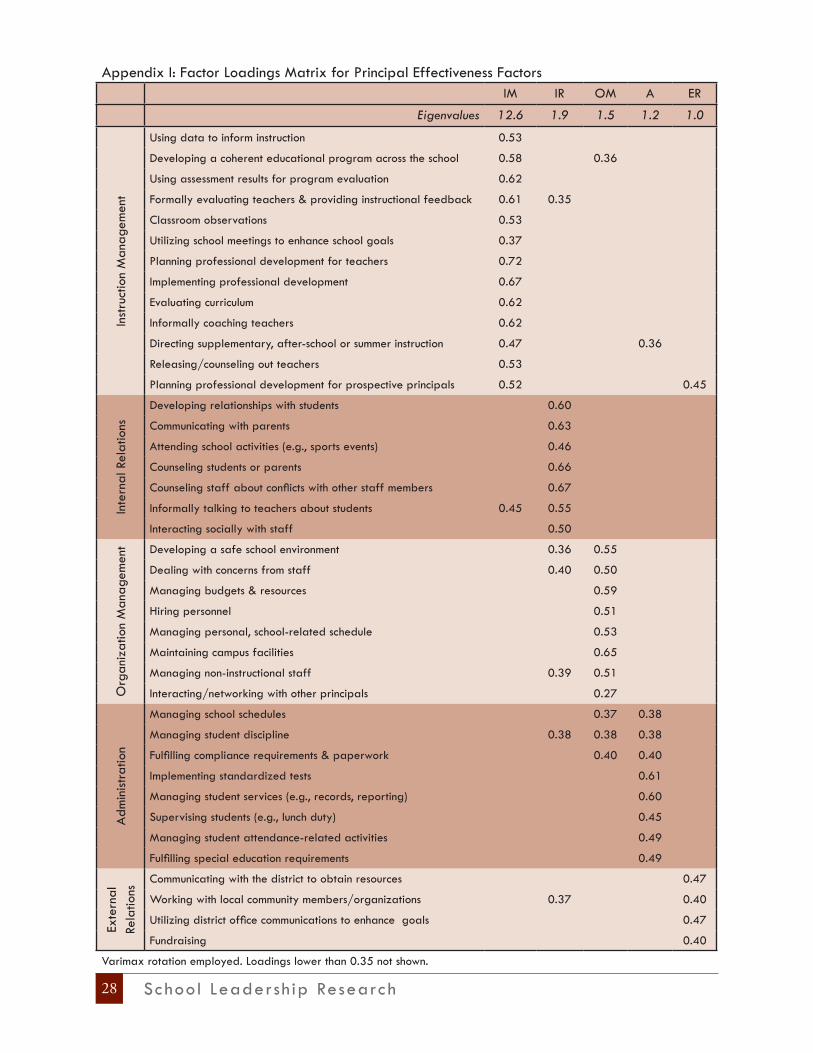
Sc hool Leadersh ip Researc h28
Appendix I: Factor Loadings Matrix for Principal Effectiveness FactorsIM IR OM A ER
Eigenvalues 12.6 1.9 1.5 1.2 1.0In
stru
ctio
n M
anag
emen
tUsing data to inform instruction 0.53
Developing a coherent educational program across the school 0.58 0.36
Using assessment results for program evaluation 0.62
Formally evaluating teachers & providing instructional feedback 0.61 0.35
Classroom observations 0.53
Utilizing school meetings to enhance school goals 0.37
Planning professional development for teachers 0.72
Implementing professional development 0.67
Evaluating curriculum 0.62
Informally coaching teachers 0.62
Directing supplementary, after-school or summer instruction 0.47 0.36
Releasing/counseling out teachers 0.53
Planning professional development for prospective principals 0.52 0.45
Inte
rnal
Rel
atio
ns
Developing relationships with students 0.60
Communicating with parents 0.63
Attending school activities (e.g., sports events) 0.46
Counseling students or parents 0.66
Counseling staff about conflicts with other staff members 0.67
Informally talking to teachers about students 0.45 0.55
Interacting socially with staff 0.50
Org
aniz
atio
n M
anag
emen
t Developing a safe school environment 0.36 0.55
Dealing with concerns from staff 0.40 0.50
Managing budgets & resources 0.59
Hiring personnel 0.51
Managing personal, school-related schedule 0.53
Maintaining campus facilities 0.65
Managing non-instructional staff 0.39 0.51
Interacting/networking with other principals 0.27
Adm
inist
ratio
n
Managing school schedules 0.37 0.38
Managing student discipline 0.38 0.38 0.38
Fulfilling compliance requirements & paperwork 0.40 0.40
Implementing standardized tests 0.61
Managing student services (e.g., records, reporting) 0.60
Supervising students (e.g., lunch duty) 0.45
Managing student attendance-related activities 0.49
Fulfilling special education requirements 0.49
Exte
rnal
Re
latio
ns
Communicating with the district to obtain resources 0.47
Working with local community members/organizations 0.37 0.40
Utilizing district office communications to enhance goals 0.47
Fundraising 0.40
Varimax rotation employed. Loadings lower than 0.35 not shown.

Tr iangulat ing Pr inc ipal Effect iveness 29
Appendix II: Factor Loadings Matrix for Assistant Principal Effectiveness FactorsIM IR OM
Eigenvalues 26.5 1.5 1.2In
stru
ctio
nal M
anag
emen
tUsing assessment results for program evaluation 0.8071
Planning professional development for teachers 0.8042
Evaluating curriculum 0.7996
Using data to inform instruction 0.7863
Implementing professional development 0.7646
Developing a coherent educational program across the school 0.7402 0.4237
Directing supplementary, after-school or summer instruction 0.6851
Fulfilling special education requirements 0.6686
Informally coaching teachers 0.6584 0.5428
Formally evaluating teachers & providing instructional feedback 0.6174 0.6088
Classroom observations 0.6033 0.5293
Implementing standardized tests 0.5937 0.5215
Releasing/counseling out teachers 0.5448 0.4507
Fundraising 0.5032 0.454
Inte
rnal
Rel
atio
ns
Communicating with parents 0.7695
Developing relationships with students 0.7406
Counseling staff about conflicts with other staff members 0.4306 0.7373
Interacting socially with staff 0.7303
Dealing with concerns from staff 0.7035 0.4145
Managing non-instructional staff 0.684 0.4177
Informally talking to teachers about students 0.4474 0.6704
Attending school activities (e.g. sports events) 0.4161 0.6692
Counseling students or parents 0.4853 0.6642
Working with local community members/organizations 0.4362 0.5875
Org
aniz
atio
n M
anag
emen
t
Managing school schedules 0.5654 0.6809
Developing a safe school environment 0.4222 0.6768
Maintaining campus facilities 0.4321 0.6503
Fulfilling compliance requirements & paperwork 0.582 0.6439
Managing student services (e.g. records, reporting) 0.5164 0.6075
Managing personal, school-related schedule 0.4631 0.5945
Managing student discipline 0.5661 0.5807
Supervising students (e.g. lunch duty) 0.456 0.5631
Managing student attendance-related activities 0.5136 0.5613
Interacting/networking with other principals 0.5132 0.5175
Managing budgets & resources 0.5027
Hiring personnel 0.4254 0.5222 0.4408
Utilizing district office communications to enhance goals 0.5247 0.4612 0.4999
Communicating with the district to obtain resources 0.4855 0.4705 0.4093
Engaging in self-improvement 0.5691 0.4674 0.4302
Utilizing school meetings to enhance school goals 0.5329 0.5335 0.4214
Varimax rotation employed. Loadings lower than 0.40 not shown.
Institute for Research on Education Policy & Practice
School Leadership Researchat the
Institute for Research on Education Policy & Practice
520 Galvez Mall CERAS Building, 5th Floor
Stanford UniversityStanford, CA 94305-3084
www.schoolleadershipresearch.org