trends in pediatric dentistry · pdf filetrends in pediatric dentistry 2015 aapd pediatric...
TRANSCRIPT

Trends in Pediatric Dentistry 2015AAPD Pediatric Oral Health Research and Policy Center
June, 2015
1

∗ General Dentist 151,989∗ Orthodontist 10,318∗ Oral Surgeon 7,262∗ Pediatric Dentist 6,673∗ Periodontist 5,480∗ Endodontist 5,250∗ Other Specialties 4,355
191,347 Professionally Active Dentists in the US (2013)

Active 6,017Life 505Affiliate 558Associate 74International 154Honorary 2Retired 771Predoctoral Students 386Postdoctoral Students 971International Students 97Allied 14
Friends of Pediatric Dentistry 10Total 9,560
AAPD Membership 2015
Professionally active dentists are those whose primary and/or secondary occupation is one of the following: private practice (full- or part-time), dental school faculty/staff member, armed forces, other federal service, state or local government employee, hospital staff dentist, graduate student/intern/resident, or other health/dental organization staff member.
Active private practitioners are those whose primary and/or secondary occupation is private practice, full- or part-time.
Basic Information
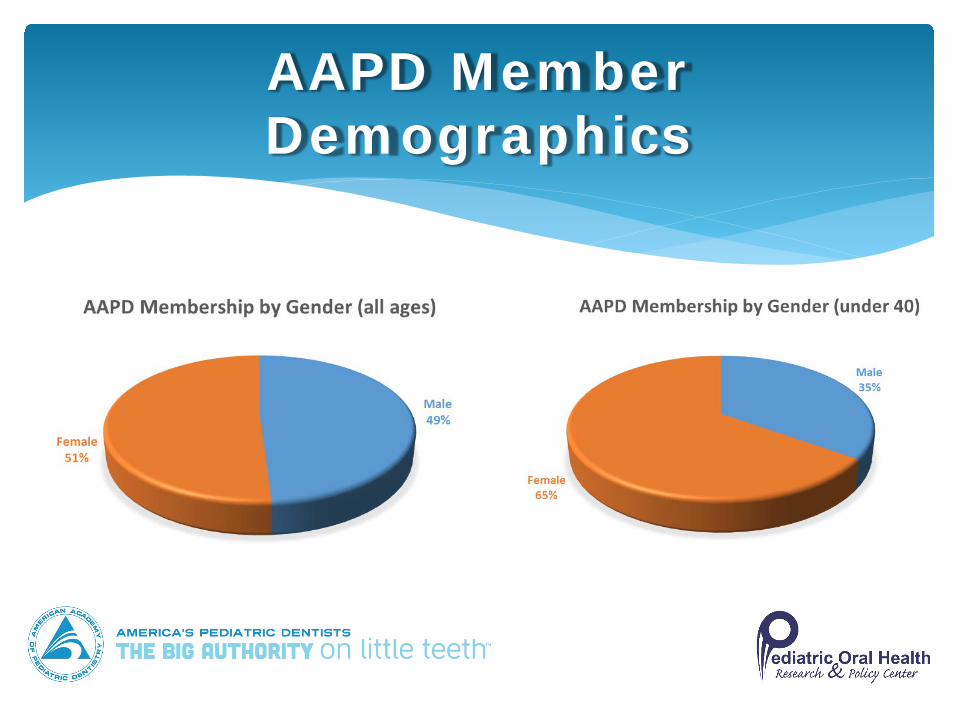
AAPD Member Demographics

The percentage of female pediatric dentistshas increased from 14% to 51% since 1998.
Source: American Academy of Pediatric Dentistry member database 2015

AAPD Member Demographics

The percentage of pediatric dentists over the age of 55 was 42.6% in 2011 — a slight decrease from a high of 42.9% in 2009.
0.00%5.00%
10.00%15.00%20.00%25.00%30.00%35.00%40.00%45.00%50.00%
Under40
40-44 45-49 50-54 55 andover
19962001200520092012
Source: American Dental Association, Health Policy Center, Surveys of Dental Practice, 2012

Since 1964, the AAPD has sponsored the American Board of Pediatric Dentistry (ABPD), fulfilling a requirement that to be recognized as a specialty an organization must demonstrate the ability to establish a certifying board (CDEL/ADA 2001). As the credentialing and certifying arm of the specialty, ABPD has a vision that we support:
To achieve excellence in pediatric dentistry through certification of all pediatric dentists.
4,421 AAPD Members are Board Certified

Pediatric dentists comprise the third largest specialty area and account for approximately 3.3 percent of all professionally active dentists, an increase of .2 percent since 2009.
Professionally Active Dentists
General Dentistsall other specialtiesPediatric Dentists
Source: American Dental Association, Health Policy Institute, Supply of Dentists in the U.S.: 2001-2013.

A solo dentist is personally liable for all general debts and liabilities of the practice, including vendor contracts and real property and equipment leases. On the other hand, a shareholder of a corporation is not personally liable for the corporation’s debts (except payroll taxes, workers compensation premiums and related obligations imposed by the government). There is one big exception, however: the dentist is always liable for his or her own professional negligence and the negligence of employees under the dentist’s supervision.
Incorporation and liability
Source: American Dental Association, Survey Center, Surveys of Dental Practice, 2012
Non-solo practices: The dental corporation not only shields each dentist from general liabilities of the dental corporation (discussed above), but also shields each dentist from liabilities arising from the acts of other dentists in the group.
Additional reasons include: possible tax advantages, name protection, easier to get a loan or attract investors
Incorporation and liability
Source: American Dental Association, Survey Center, Surveys of Dental Practice, 2012

Pediatric dentists, on average, spend approximately 88.5% of their time in the office treating patients
Source: American Dental Association, Health Policy Center, Surveys of Dental Practice, 2012
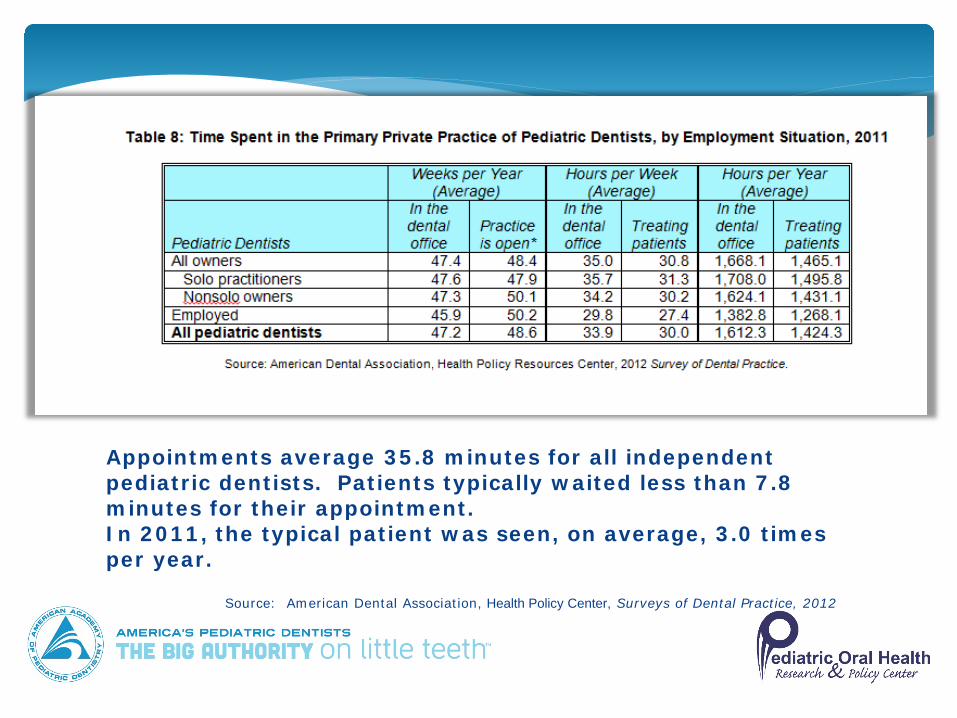
Appointments average 35.8 minutes for all independent pediatric dentists. Patients typically waited less than 7.8 minutes for their appointment.In 2011, the typical patient was seen, on average, 3.0 times per year.
Source: American Dental Association, Health Policy Center, Surveys of Dental Practice, 2012

The largest share of gross billings for all independent pediatric dentists came from private insurance (49.1%). Together, private insurance and direct patient payments accounted for 74.5% of annual gross billings. Government programs, managed care, and other sources represented 25.5% of annual gross billings.
0.00%
10.00%
20.00%
30.00%
40.00%
50.00%
60.00%
PrivateInsurance
Direct PatientPayment
GovernmentPrograms
Managed Care Other Sources
19982001200520092011
Source: American Dental Association, Survey Center, Surveys of Dental Practice, 2012
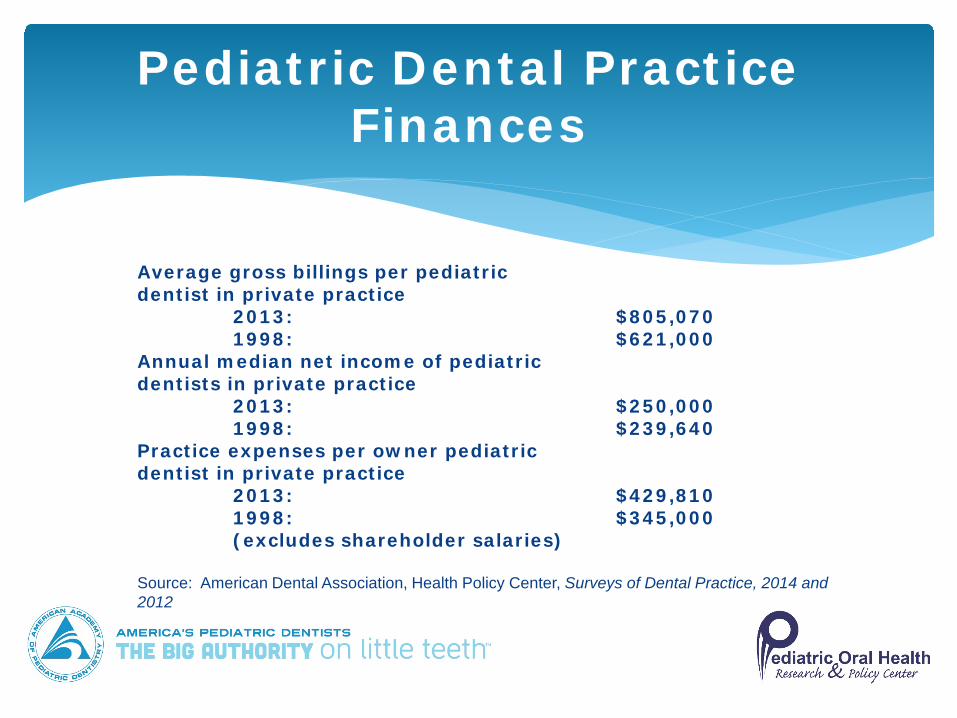
Average gross billings per pediatric dentist in private practice
2013: $805,0701998: $621,000
Annual median net income of pediatric dentists in private practice
2013: $250,0001998: $239,640
Practice expenses per owner pediatric dentist in private practice
2013: $429,8101998: $345,000(excludes shareholder salaries)
Source: American Dental Association, Health Policy Center, Surveys of Dental Practice, 2014 and 2012
Pediatric Dental Practice Finances

Patients by Source of Payment
Source: American Dental Association, Health Policy Center, Surveys of Dental Practice, 2012

Team Members Employed by All Independent Pediatric Dentists
Source: American Dental Association, Health Policy Center, Surveys of Dental Practice, 2012
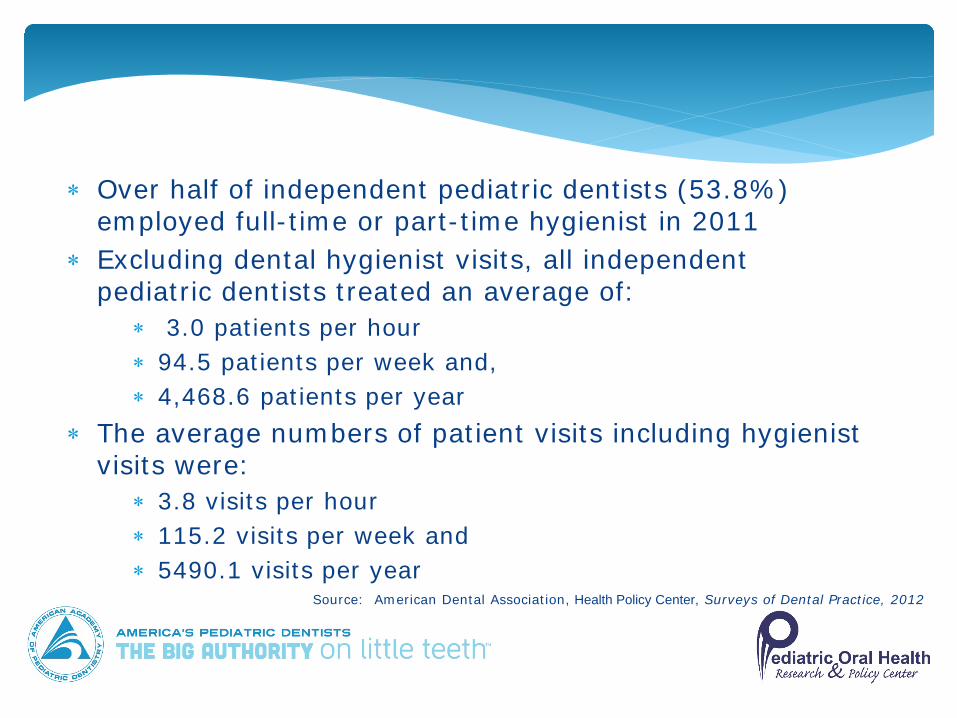
∗ Over half of independent pediatric dentists (53.8%) employed full-time or part-time hygienist in 2011
∗ Excluding dental hygienist visits, all independent pediatric dentists treated an average of:
∗ 3.0 patients per hour∗ 94.5 patients per week and,∗ 4,468.6 patients per year
∗ The average numbers of patient visits including hygienist visits were:
∗ 3.8 visits per hour∗ 115.2 visits per week and∗ 5490.1 visits per year
Source: American Dental Association, Health Policy Center, Surveys of Dental Practice, 2012

Access

23% of patients on
public insurance
5,165 total patient visits per year per
office
6,017 active private
practitioners
Estimated 7.4
million Medicaid visits per
year
Pediatric Dentists provide significant services to children participating in government insurance programs
Source: American Dental Association, Health Policy Center, Surveys of Dental Practice, 2012

Every child deserves a healthy start on life, but when it comes to oral health many children face significant challenges.
Young children in low-income families tend to have higher rates of tooth decay and have greater difficulty accessing ongoing basic dental care.
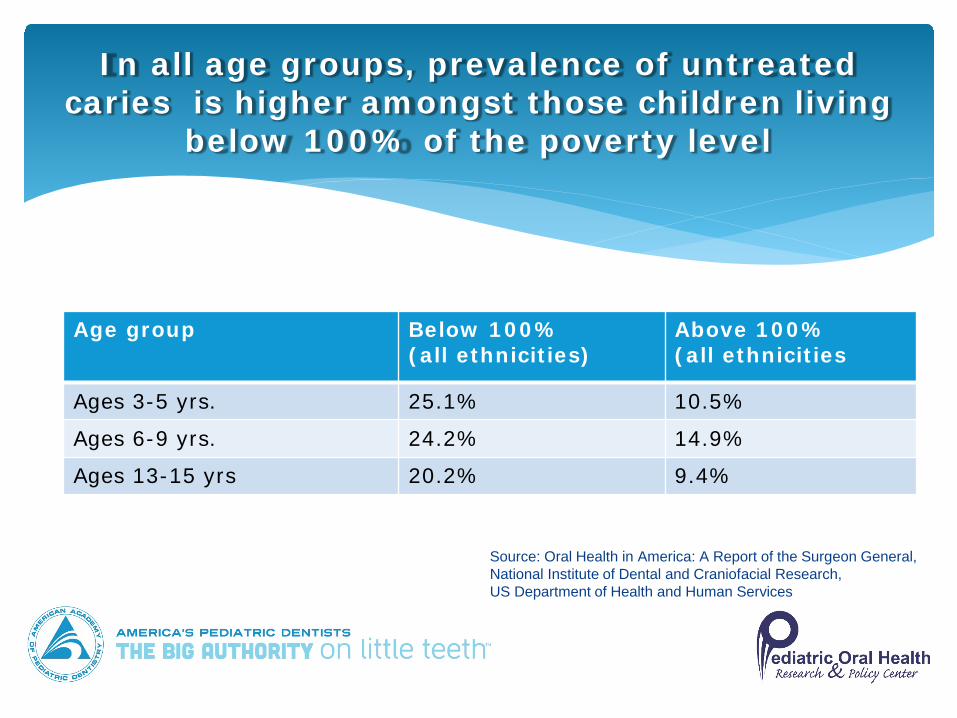
In all age groups, prevalence of untreated caries is higher amongst those children living
below 100% of the poverty level
Age group Below 100%(all ethnicities)
Above 100%(all ethnicities
Ages 3-5 yrs. 25.1% 10.5%
Ages 6-9 yrs. 24.2% 14.9%
Ages 13-15 yrs 20.2% 9.4%
Source: Oral Health in America: A Report of the Surgeon General, National Institute of Dental and Craniofacial Research, US Department of Health and Human Services

Prevalence of dental caries in primary teeth, by age and race among children
aged 2–8 years, 2011–2012
Source: Data Brief No 191, National Center for Health Statistics, 2015.

Prevalence of dental caries in permanent teeth, by age and race among children
aged 6–11 years, 2011–2012
Source: Data Brief No 191, National Center for Health Statistics, 2015.

Prevalence of dental caries in permanent teeth, by age and race among adolescents
aged 12–19 years, 2011–2012
Source: Data Brief No 191, National Center for Health Statistics, 2015.

• 70% of pediatric dentists accept Medicaid, CHIP or both
• Over 50% of all pediatric dentists are accepting new Medicaid patients
• 74% of pediatric dentists worked in practices that provided charitable dental care either free of charge or at a reduced rate to some patients in 2011
The need is great and pediatric dentists are stepping up to the plate to fill the gaps!

Common Barriers that Pediatric Dentists Encounter in this
Population
∗ Lack of oral health literacy on the part of parents
∗ Lack of early referrals by healthcare providers∗ Gap between knowledge and action by parents
and caregivers∗ Lack of insurance and an inability to pay for
services∗ Lack of or limited transportation options∗ Limited English proficiency and cultural and
societal barriers

Source: 2013 AAPD Cohort Survey on Case Management
82
44
27 24
4.50
102030405060708090
Providepaymentoptions
Assist in filingMedicaid
paperwork
Provideinformation
abouttransportation
Coordinatewith
CommunityServices
provide otherassistance
Percent of Pediatric Dentists That Provide Assistance to Publically Insured Patient Families
percent
Pediatric Dentists Help Families Succeed
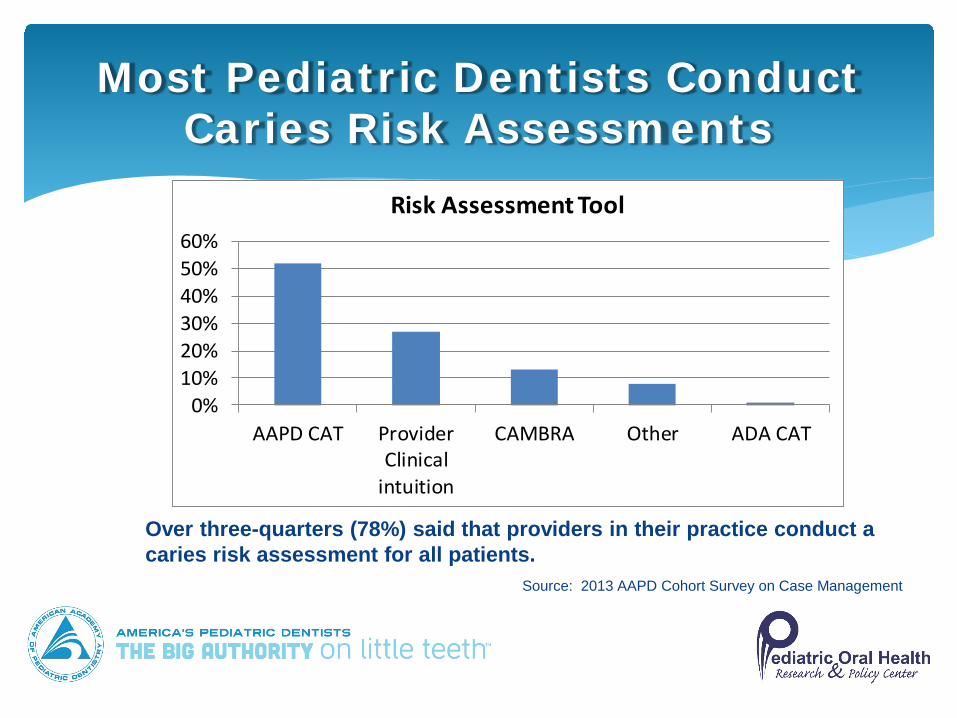
Most Pediatric Dentists Conduct Caries Risk Assessments
Over three-quarters (78%) said that providers in their practice conduct a caries risk assessment for all patients.
Source: 2013 AAPD Cohort Survey on Case Management
0%10%20%30%40%50%60%
AAPD CAT ProviderClinical
intuition
CAMBRA Other ADA CAT
Risk Assessment Tool

∗ The great majority (96%) indicated that they tailor educational activities to patient risk level.
∗ Over half (54%) use motivational interviewing in their practices
∗ Two-thirds of responding dentists’ practices have interpreters (67%) and oral health literature available in languages other than English (68%).
Pediatric Dentists Communicate with Families
Source: 2013 AAPD Cohort Survey on Case Management
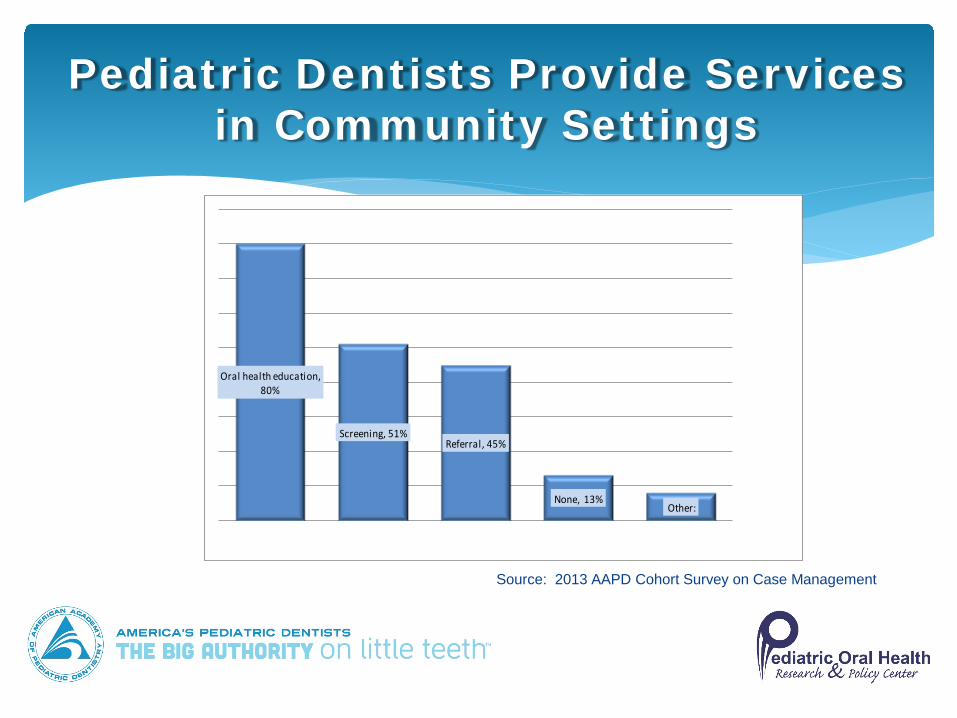
Oral health education, 80%
Screening, 51%Referral, 45%
None, 13%Other:
Pediatric Dentists Provide Services in Community Settings
Source: 2013 AAPD Cohort Survey on Case Management

∗ 59.5% use an operating room in a hospital or accredited surgical facility for inpatient and/or outpatient treatment
∗ Provide medically necessary care to those children who may be cognitively-immature, highly anxious or fearful, have special needs, or be medically-compromised and unable to receive treatment in a traditional office setting
∗ Positive effects on the quality of life for children and their families and can improve access to dental care
Most pediatric dentists use operating rooms
Source: American Dental Association, Health Policy Center, Surveys of Dental Practice, 2012

∗ Almost all pediatric dentists (99.5 percent) report that they care for patients with special needs.
∗ Nine in ten (89%) indicated that staff at their practice have training in treating patients with sensory impairments, developmental delays, or other special needs.
Pediatric Dentists Provide Care for Special Needs Patients
Source: American Dental Association, Health Policy Center, Surveys of Dental Practice, 2012
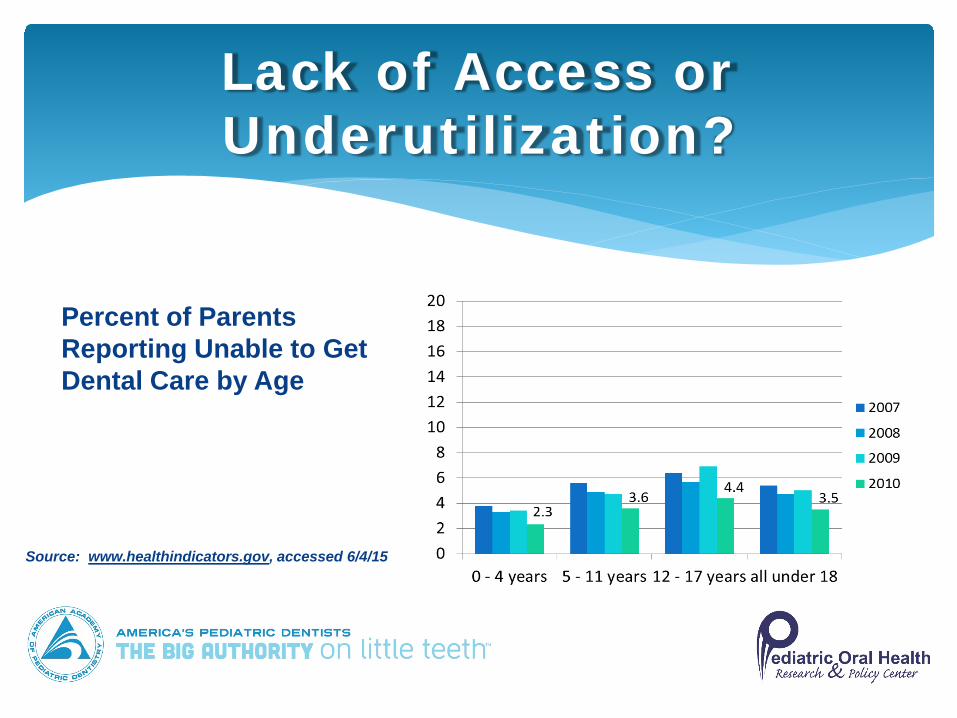
Lack of Access or Underutilization?
Source: www.healthindicators.gov, accessed 6/4/15
Percent of Parents Reporting Unable to Get Dental Care by Age

Age group Percentage of untreated caries
Percentage of parents reporting inability to get care
Age 2-5 years 10.0%
Age 0-4 years 2.3%
Age 6-8 years 20.1%
Age 9-11 years 7.9%
Age 5-11 years 3.6%
Ages 12-15 years 11.9%
Ages 16-19 years 19.1
Ages 12-17 years 3.5%
Average 13.8% 3.1%
Lack of Access or Underutilization?

Question: If the 13.8% of children with untreated caries is indicative of lack of access, why did only 3.1% of parents report an inability to access care when they attempted to get care for their children?
Lack of Access or Underutilization?

∗ Since 2010, HSHC grantees have provided more than 290,000 Dental Homes for children.
∗ HSHC issued more than $3.1 million to 70 agencies in 26 states since 2010.
∗ HSHC issues more than $1 million in grants and commitments to provide Dental Homes to children in the US in 2015.
∗ This year, HSHC awarded two Multi-Year Grants ($350,000 over five years per organization) to previous grantees.
∗ The 2015 HSHC Dental Home Day in Seattle provided care to 152 children with the help of over 60 AAPD volunteers.
∗ HSHC is establishing outcomes measures and data to track grantee effectiveness in providing Dental Homes for children.

Education Trends
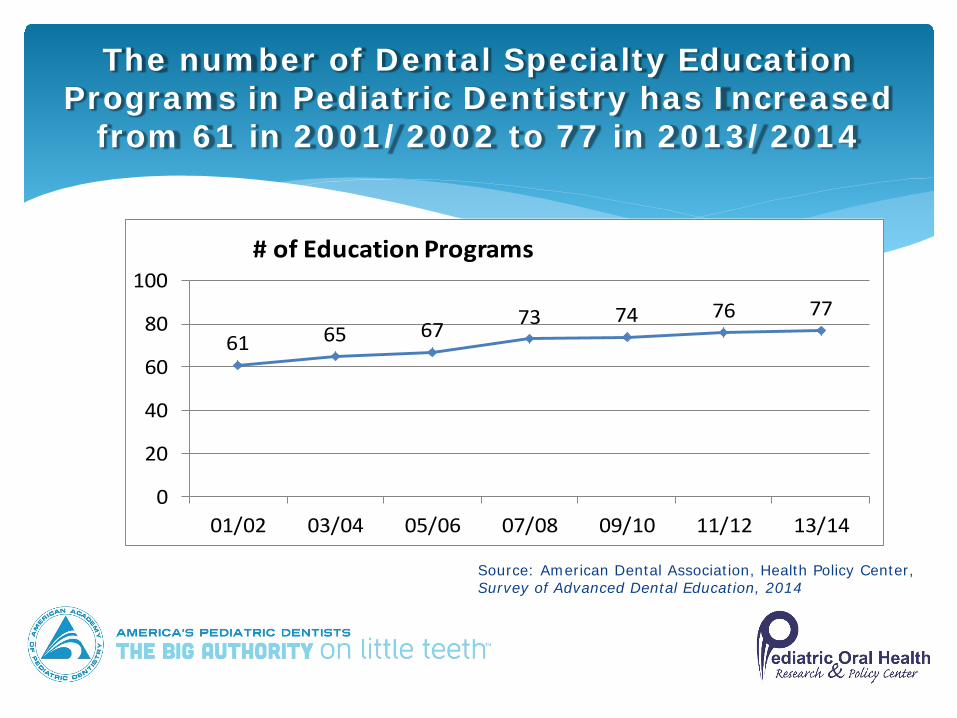
The number of Dental Specialty Education Programs in Pediatric Dentistry has Increased
from 61 in 2001/2002 to 77 in 2013/2014
61 65 67 73 74 76 77
0
20
40
60
80
100
01/02 03/04 05/06 07/08 09/10 11/12 13/14
# of Education Programs
Source: American Dental Association, Health Policy Center, Survey of Advanced Dental Education, 2014
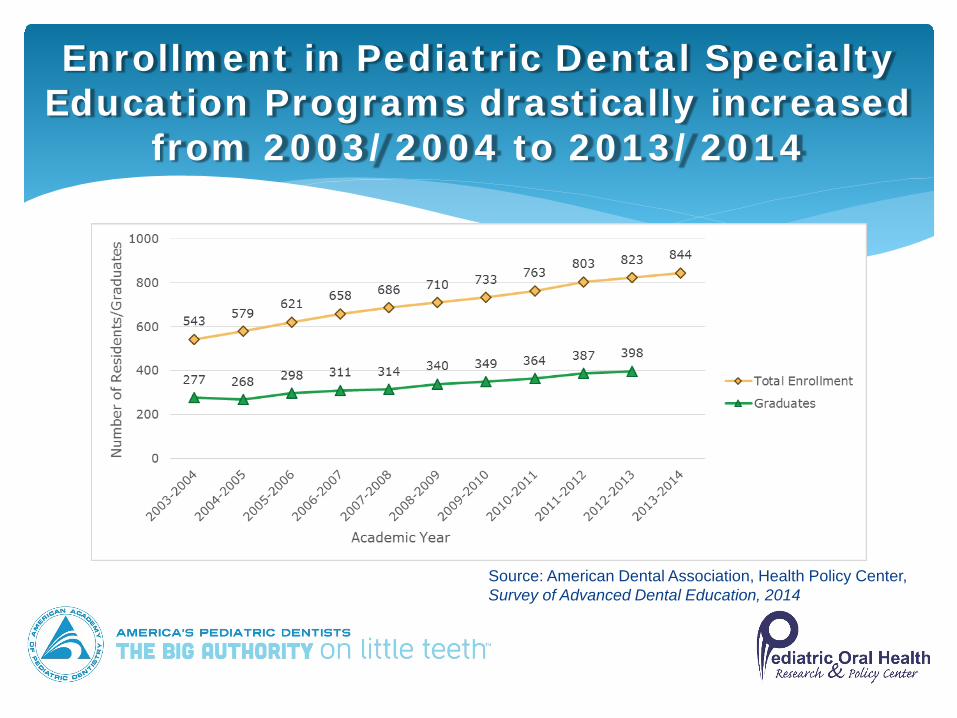
Enrollment in Pediatric Dental Specialty Education Programs drastically increased
from 2003/2004 to 2013/2014
Source: American Dental Association, Health Policy Center, Survey of Advanced Dental Education, 2014
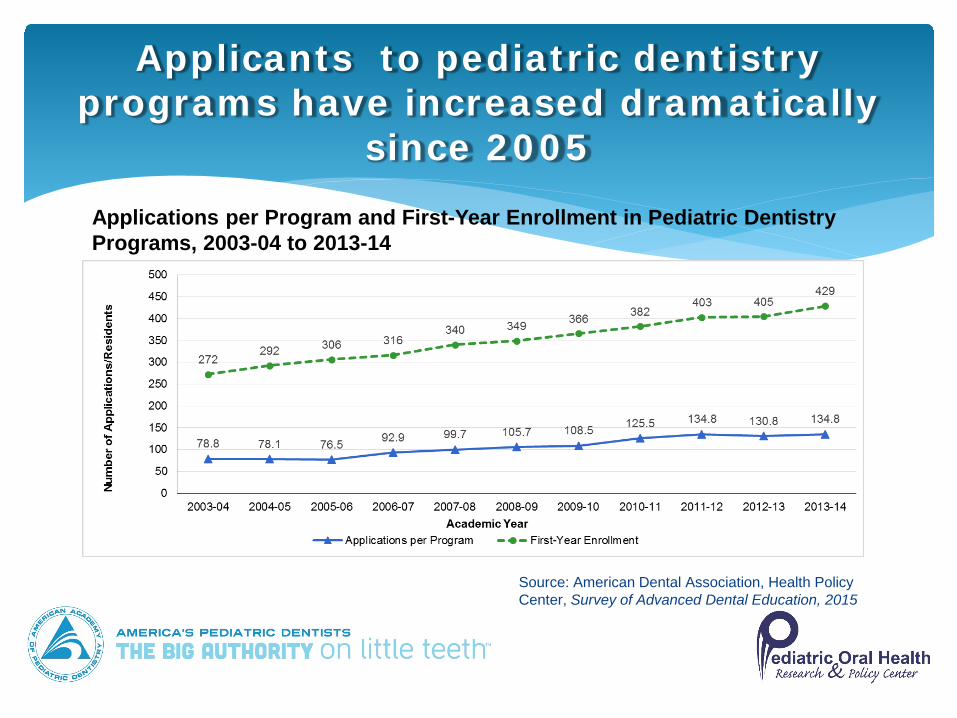
Applicants to pediatric dentistry programs have increased dramatically
since 2005
Source: American Dental Association, Health Policy Center, Survey of Advanced Dental Education, 2015
Applications per Program and First-Year Enrollment in Pediatric Dentistry Programs, 2003-04 to 2013-14

Enrollment Statistics
38.00%
62.00%
Enrollment by gender
MaleFemale55.3%
5.1%10.5%
0.8%
20.5%
0.4%0.4%
2.8%4.2%
Enrollment by race/ethnicityWhite
Black
Hispanic
American Indian
Asian
Native Hawaiian
Two or moreracesUnknown
Source: American Dental Association, Survey Center, Surveys of Dental Education 2010-2011

Please contact:
Robin Wright, PhDAssistant DirectorPediatric Oral Health Research and Policy [email protected] 227-2169
For more information…