trehalose accumulation and the hxt5- tps1 complex in ... · trehalose accumulation and the...
TRANSCRIPT

Trehalose accumulation and the Hxt5-
Tps1 complex in Saccharomyces
cerevisiae
Role in cell cycle elongation and glucose metabolism
Trehalose accumulatie en het Hxt5-Tps1 complex in
Saccharomyces cerevisiae
Rol in celcyclus verlenging en glucose metabolisme
(met een samenvatting in het Nederlands)
Proefschrift
ter verkrijging van de graad van doctor
aan de Universiteit Utrecht
op gezag van de rector magnificus, prof.dr. W.H. Gispen,
ingevolge het besluit van het college voor promoties
in het openbaar te verdedigen
op maandag 19 juni 2006 des middags te 12.45 uur
door
Gijsberdina Pieternella van Suijlekom
Geboren op 20 maart 1979, te Oosterhout

Promotor: Prof. Dr. J. Boonstra Co-promotor: Dr. B. Humbel

Paranimfen: Mike van Suylekom
Angélique van Opstal
Drukwerk: Optima Grafische Communicatie, Rotterdam
ISBN-10: 90-393-4260-1
ISBN-13: 978-90-393-4260-2

Voor mijn ouders,
voor David

Table of Contents List of Abbreviations Chapter 1 General Introdution Chapter 2 Nutrient driven cell cycle
progression in Saccharomyces cerevisiae
Chapter 3 Slt2 is activated during the G1
phase in Saccharomyces cerevisiae and is required for proper cell cycle progression
Chapter 4 Involvement of HXT5 in trehalose
accumulation and in glucose transport after gluconeogenesis in Saccharomyces cerevisiae
Chapter 5 The role of the Hxt5-Tps1 complex
in starved cells Chapter 6 Degradation of the hexose
transporter Hxt5 in Saccharomyces cerevisiae
Chapter 7 General Discussion Samenvatting Dankwoord List of publications Curriculum Vitae
6
7
17
49
73
99
117
137
147

List of Abbreviations AMP Adenosine mono-phosphate
ATP Adenosine tri-phosphate
cAMP Cyclic AMP
CDC Cell Division Cycle
CDK Cyclin-dependent kinase
CKI Cdk inhibiting protein
DAG Diacylglycerol
ER Endoplasmic reticulum
GFP Green fluorescent protein
GLUT Glucose transporter
HA Hemagglutinin
HAP Hap2/3/4/5 protein
Hxk Hexokinase
Hxt Hexose transporter
MAP Mitogen-activated protein
MAPK MAP kinase
MAPKK MAPK kinase
MAPKKK MAPKK kinase
MBF MCB binding factor
MCB Mlu1 cell cycle box
PDS Post diauxic shift
PEST region enriched in proline (P), glutamine (E), serine
(S) and threonine (T) residues
PKC Protein kinase C
PL Phospholipid
PLC Phospholipase C
SBF SCB binding factor
SCB Swi4,6-dependent cell cycle box
STRE Stress-responsive element
TOR Target of Rapamycin
Ub Ubiquitin

Chapter 1
General Introduction

Chapter 1
8
Introduction
The baker’s or budding yeast Saccharomyces cerevisiae is able to
survive under many different environmental conditions. Nutrient availability is
one of the environmental factors to which the cells have to adapt to. The cells
are able to respond to changes in their environment and under influence of the
extracellular conditions, they alter their cell size and cell cycle length (1-3).
When conditions are not favourable enough to enter the next cell cycle, haploid
cells enter a quiescent state and diploid cells form four haploid spores, which
can survive long under extreme conditions (4, 5).
The present chapter describes briefly the genes, proteins and processes
studied in this thesis and is followed by the outline of this thesis. The cell cycle
together with an involved signal transduction pathway, the methods for
synchronization and cultivation, and glucose transport together with reserve
carbohydrate metabolism are described in more detail in Chapter 2.
The cell cycle
The cell cycle can be divided into four phases. During the first Gap
(G1) phase, cells grow and prepare themselves for a new cell cycle. The
decision to enter the cell cycle or to enter a quiescent state is taken at the end
of the G1 phase and is located at a point called ‘Start’ (6). Exposure of haploid
cells to mating factor of the opposite type can also arrest cells before start (7).
Once cells have passed Start, they have committed themselves to complete the
cell cycle before they can enter the quiescent state. After Start, cells progress to
the DNA Synthesis (S) phase. In the S phase, DNA is replicated once, and this
is checked during the second Gap (G2) phase. In the G2 phase, the cells also
monitor their morphology to prevent binucleated cells or cell lysis. The last
phase is Mitosis (M phase) and in this phase the chromatids are separated and
two new cells are formed.
In contrast to most cells, S. cerevisiae cells divide asymmetrical with a
large mother cell and a small daughter cell (8). In wild type cells, entry into S
phase is characterized by the appearance of the bud, which grows during the S,
G2 and M phase until it is cleaved from the mother cell at the end of the M

General Introduction
9
phase. After mitosis, the mother cells enter the next cell cycle almost
immediately, while the daughter cells have to grow in size first.
Cyclins and cyclin-dependent kinases
Progression through the cell cycle is driven by the activity of cyclins
complexed to cyclin-dependent kinases (Cdk’s). In S. cerevisiae, Cdc28p is the
only Cdk required for cell cycle progression (9). The cyclins that bind to
Cdc28p define the different phases of the cell cycle. During the G1 phase, the
G1 cyclins Cln1p, Cln2p and Cln3p activate Cdc28p (10). Clb5p and Clb6p are
complexed to Cdc28 during S phase (11). Clb1p, Clb2p, Clb3p and Clb4p are
the mitotic cyclins and are required for progression to and through M phase
(12).
Regulation of G1 phase progression
CLN3 is the first cyclin expressed and transcribed during the G1 phase,
and Cln3p binds to and activates Cdc28p (13, 14). Via activation of the
transcription factor SBF (SCB (Swi4,6-dependent cell cycle box) binding
factor), Cln3-Cdc28 activates transcription of CLN1 and CLN2 (13-15). The
SBF transcription factor complex consists of the DNA binding protein Swi4
and the regulatory protein Swi6 (16). Cln1-Cdc28 and Cln2-Cdc28 induce
transition to S phase by stimulation of DNA replication and by positively
influencing bud formation (17, 18). During the G1 phase, the Cdk inhibitor
(CKI) Sic1 inhibits Clb5p and Clb6p activity (19). Sic1p is phosphorylated by
Cln1-Cdc28 and Cln2-Cdc28 and subsequently ubiquitinated and degraded
(19, 20). After degradation of Sic1p, Clb5-Cdc28 and Clb6-Cdc28 initiate DNA
replication.
Pkc1-Slt2 cell wall integrity pathway
One of the yeast signal transduction pathways is the mitogen activated
protein kinase (MAPK) Pkc1-Slt2 cell wall integrity pathway. This pathway is
involved in maintenance of the cell wall and adaptation of the cell wall to
changes in environmental en intracellular conditions. Cdc28p induces the

Chapter 1
10
activity of the Pkc1-Slt2 cell wall integrity pathway during the G1 phase. The
pathway consists of the upstream kinase Pkc1p, which is activated either via
receptors or via diacylglycerol (DAG), which is released under influence of
Cdc28 (21-26). Pkc1p activates Bck1p, which in turn activates Mkk1p and
Mkk2p. These two redundant kinases activate the most downstream kinase,
Slt2p (27-30).
Active Slt2p can phosphorylate Swi6p and this modification induces
the export of Swi6 out of the nucleus into the cytoplasm. Swi6p is localized to
the nucleus during the G1 phase, but is cytoplasmatic during the other phases
of the cell cycle (31, 32). The transcription of cell wall genes requires only the
presence of SWI4 (33). The controlled localization of Swi6p might therefore
enable a cell to control cell cycle progression in both DNA replication and cell
wall modulation.
Cell synchronization
Cell cycle studies mostly require that cells are synchronized at a
specific phase of the cell cycle and this can be obtained in several ways. The
cells can be arrested in a phase until all cells have reached that phase or the
cells in a specific phase are isolated from the rest of the population. The first
method uses chemicals, temperature-sensitive mutants, deprivation of factors
essential for growth, or synthetic mating factor (34-37). These synchronization
methods all interfere with normal cell cycle progression. The second method
uses the differences in size of S. cerevisiae to synchronize cells by elutriation
(37, 38). A combination of centrifugal force and medium flow enables this
method to specifically collect daughter cells in early G1 phase and this
synchronization is used in this study. It is also possible to collect cells of all
phases of the cell cycle by elutriation by increase of the medium flow and
collection of fractions of the outflow.
Nutrient availability and G1 phase length
Growth of synchronous early G1 phase cells in fed-batch cultures
revealed a correlation between the length of the G1 phase and the amount of

General Introduction
11
nutrients in the feed. The G1 phase was slowly elongated with decreasing
galactose fluxes until a switch point was reached. When the galactose flux was
set below that switch point, the G1 phase was rapidly elongated (3, 39). The
increase in G1 phase elongation was accompanied by the accumulation of the
reserve carbohydrates trehalose and glycogen (39).
Reserve carbohydrates trehalose and glycogen
Accumulation of reserve carbohydrates is important for cell viability.
The complex consisting of Tps1p, Tps2p, Tps3p and Tsl1p is responsible for the
accumulation of trehalose (40-45). Glycogen is accumulated by action of
Glg1p, Glg2p, Gsy1p, Gsy2p ad Glc3p (46-48). Cells are no longer able to
accumulate trehalose after deletion of TPS1 and no longer able to accumulate
glycogen by deletion of GSY1 together with GSY2.
The function of Tps1p
Cells deleted for TPS1 are not only unable to accumulate trehalose;
they are also unable to grow on glucose, fructose or mannose. Addition of
glucose to tps1∆ cells leads to hyperaccumulation of early glycolysis
intermediates together with decreased levels of ATP and inorganic phosphate
(49, 50). It was suggested that Tps1p functions as a regulator for import of
glucose into the glycolysis or into the cell by regulation of hexose transporter
(Hxt) proteins (40, 44, 51).
Hxt proteins
Glucose is transported into the cell by a family of hexose transporter
(Hxt) proteins. Of this family, HXT1-4 and HXT6/7 are the major hexose
transporters and their expression is regulated by the extracellular glucose
concentration (52-59). HXT5 is also capable of transporting glucose but its
expression is regulated by the growth rate of the cells (60, 61).

Chapter 1
12
Outline of this thesis
The aim of this thesis was to gain insight into the regulation of G1
phase progression, into the regulation of trehalose accumulation and into the
metabolism of Hxt5p, which appeared to be involved in trehalose
accumulation.
In Chapter 2, the main genes, proteins and signal transduction
pathways, which are involved in the processes described in this thesis, are
reviewed.
The role and requirement of the kinase SLT2 for cell cycle progression
was investigated and this study is described in Chapter 3. To localize the
timing of Slt2p activity in the cell cycle, the protein expression pattern of
several key players and the activity of the Slt2 during short and elongated G1
phases are described. The results indicate that the protein expression patterns
of Cln1p are dependent on the carbon source and the length of the G1 phase,
while Cln3p is independent on those variables. The activity of Slt2p was linked
to the length of G1 phase and deletion of SLT2 resulted in severe cell cycle
elongation.
In Chapter 4, the interplay between hexose transporters, trehalose
accumulation and TPS1 expression is examined. Accumulation of trehalose
correlated most with the expression of HXT5. The accumulation of trehalose
was not dependent on one hexose transporter in particular. Although
localization of Hxt5-HA by immunofluorescence microscopy indicates plasma
membrane localization, electron microscopy on cryosections revealed that
Hxt5-HA is predominantly localized at the endoplasmic reticulum. The
localization of Hxt5p in the endoplasmic reticulum might indicate a role in
gluconeogenesis as this is the place of the final step in gluconeogenesis in
mammalian cells and a glucose transporter is also present in the protein
complex involved in gluconeogenesis in the ER of mammalian cells. The
interaction of Hxt5p and Tps1p suggested a role for Hxt5p in the accumulation
of trehalose under conditions of gluconeogenesis or restriction of glucose
influx into the cell by Tps1p activity.

General Introduction
13
The role of the complex with Hxt5p and Tps1p was investigated in
Chapter 5. Deletion of TPS1 prevented cells from expression of the major
hexose transporters on glucose medium, and HXT5 expression was only
detected on glucose medium when HXT5 mRNA was already present in the
initial culture. The decrease in expression of the housekeeping genes suggests
that tps1∆ cells are unable to express mRNA at all. The immediate decrease in
trehalose levels after glucose addition to starved cells indicated a vectorial
shuttling of glucose from outside the cell to either glycolysis or carbohydrate
accumulation.
The localization and the degradation process of Hxt5p was examined
and this study is described in Chapter 6. Ubiquitination of Hxt5p was not
detected although the presence of a PEST-sequence and phosphorylation on at
least one serine residue suggested otherwise. The coexistence of the Hxt5-Tps1
interaction and the Hxt5 phosphorylation might however indicate a role for the
serine phosphorylation in the regulation of Hxt5p activity. In addition, Hxt5p
was only phosphorylated during a short time after induction of the growth
rate, which was caused by addition of glucose, while the majority of Hxt5p
degradation occurred later. Hxt5 was degraded in the vacuole after
internalization via endocytosis as observed by electron microscopy.
In Chapter 7, the studies in this thesis are placed in a broader
perspective and the results described are discussed.

Chapter 1
14
References
1. Alberghina, L., Smeraldi, C., Ranzi, B.M. and Porro, D. 1998, J. Bacteriol., 180, 3864-72.
2. Parviz, F. and Heideman, W. 1998, J. Bacteriol., 180, 225-30. 3. Silljé, H.H., ter Schure, E.G., Rommens, A.J., Huls, P.G., Woldringh,
C.L., Verkleij, A.J., Boonstra, J. and Verrips, C.T. 1997, J. Bacteriol., 179, 6560-5.
4. Gray, J.V., Petsko, G.A., Johnston, G.C., Ringe, D., Singer, R.A. and Werner-Washburne, M. 2004, Microbiol. Mol. Biol. Rev., 68, 187-206.
5. Kron, S.J. and Gow, N.A. 1995, Curr. Opin. Cell Biol., 7, 845-55. 6. Hartwell, L.H., Culotti, J., Pringle, J.R. and Reid, B.J. 1974, Science,
183, 46-51. 7. Konopka, J.B. and Fields, S. 1992, Antonie Van Leeuwenhoek, 62, 95-
108. 8. Hartwell, L.H. and Unger, M.W. 1977, J. Cell Biol., 75, 422-35. 9. Mendenhall, M.D. and Hodge, A.E. 1998, Microbiol. Mol. Biol. Rev.,
62, 1191-243. 10. Levine, K., Tinkelenberg, A.H. and Cross, F. 1995, Prog. Cell Cycle
Res., 1, 101-14. 11. Schwob, E. and Nasmyth, K. 1993, Genes Dev., 7, 1160-75. 12. Kuntzel, H., Schulz, A. and Ehbrecht, I.M. 1996, Biol. Chem., 377, 481-
7. 13. Dirick, L., Bohm, T. and Nasmyth, K. 1995, EMBO J., 14, 4803-13. 14. Stuart, D. and Wittenberg, C. 1995, Genes Dev., 9, 2780-94. 15. Dirick, L. and Nasmyth, K. 1991, Nature, 351, 754-7. 16. Moll, T., Schwob, E., Koch, C., Moore, A., Auer, H. and Nasmyth, K.
1993, Philos. Trans. R. Soc. Lond. B. Biol. Sci., 340, 351-60. 17. Benton, B.K., Tinkelenberg, A.H., Jean, D., Plump, S.D. and Cross,
F.R. 1993, EMBO J., 12, 5267-75. 18. Cvrckova, F. and Nasmyth, K. 1993, EMBO J., 12, 5277-86. 19. Deshaies, R.J. 1997, Curr. Opin. Genet. Dev., 7, 7-16. 20. Verma, R., Annan, R.S., Huddleston, M.J., Carr, S.A., Reynard, G. and
Deshaies, R.J. 1997, Science, 278, 455-60. 21. Verna, J., Lodder, A., Lee, K., Vagts, A. and Ballester, R. 1997, Proc.
Natl. Acad. Sci. U. S. A., 94, 13804-9. 22. Rajavel, M., Philip, B., Buehrer, B.M., Errede, B. and Levin, D.E. 1999,
Mol. Cell. Biol., 19, 3969-76. 23. Ketela, T., Green, R. and Bussey, H. 1999, J. Bacteriol., 181, 3330-40. 24. Philip, B. and Levin, D.E. 2001, Mol. Cell. Biol., 21, 271-80. 25. Zu, T., Verna, J. and Ballester, R. 2001, Mol. Genet. Genomics, 266,
142-55. 26. Marini, N.J., Meldrum, E., Buehrer, B., Hubberstey, A.V., Stone, D.E.,
Traynor-Kaplan, A. and Reed, S.I. 1996, EMBO J., 15, 3040-52. 27. Levin, D.E., Bowers, B., Chen, C.Y., Kamada, Y. and Watanabe, M.
1994, Cell. Mol. Biol. Res., 40, 229-39. 28. Irie, K., Takase, M., Lee, K.S., Levin, D.E., Araki, H., Matsumoto, K.
and Oshima, Y. 1993, Mol. Cell. Biol., 13, 3076-83.

General Introduction
15
29. Lee, K.S., Irie, K., Gotoh, Y., Watanabe, Y., Araki, H., Nishida, E., Matsumoto, K. and Levin, D.E. 1993, Mol. Cell. Biol., 13, 3067-75.
30. Lee, K.S. and Levin, D.E. 1992, Mol. Cell. Biol., 12, 172-82. 31. Queralt, E. and Igual, J.C. 2003, Mol. Cell. Biol., 23, 3126-40. 32. Sidorova, J.M., Mikesell, G.E. and Breeden, L.L. 1995, Mol. Biol. Cell,
6, 1641-58. 33. Igual, J.C., Johnson, A.L. and Johnston, L.H. 1996, EMBO J., 15,
5001-13. 34. Zarzov, P., Mazzoni, C. and Mann, C. 1996, EMBO J., 15, 83-91. 35. Anghileri, P., Branduardi, P., Sternieri, F., Monti, P., Visintin, R.,
Bevilacqua, A., Alberghina, L., Martegani, E. and Baroni, M.D. 1999, Exp. Cell Res., 250, 510-23.
36. Oehlen, L.J. and Cross, F.R. 1994, Genes Dev., 8, 1058-70. 37. Futcher, B. 1999, Methods Cell Sci, 21, 79-86. 38. Johnston, L.H. and Johnson, A.L. 1997, Methods Enzymol., 283, 342-
50. 39. Paalman, J.W., Verwaal, R., Slofstra, S.H., Verkleij, A.J., Boonstra, J.
and Verrips, C.T. 2003, FEMS Yeast Res, 3, 261-8. 40. Bell, W., Klaassen, P., Ohnacker, M., Boller, T., Herweijer, M.,
Schoppink, P., Van der Zee, P. and Wiemken, A. 1992, Eur. J. Biochem., 209, 951-9.
41. Vuorio, O.E., Kalkkinen, N. and Londesborough, J. 1993, Eur. J. Biochem., 216, 849-61.
42. Vandercammen, A., Francois, J. and Hers, H.G. 1989, Eur. J. Biochem., 182, 613-20.
43. Londesborough, J. and Vuorio, O. 1991, J. Gen. Microbiol., 137, 323-30.
44. Bell, W., Sun, W., Hohmann, S., Wera, S., Reinders, A., De Virgilio, C., Wiemken, A. and Thevelein, J.M. 1998, J. Biol. Chem., 273, 33311-9.
45. Reinders, A., Burckert, N., Hohmann, S., Thevelein, J.M., Boller, T., Wiemken, A. and De Virgilio, C. 1997, Mol. Microbiol., 24, 687-95.
46. Cheng, C., Mu, J., Farkas, I., Huang, D., Goebl, M.G. and Roach, P.J. 1995, Mol. Cell. Biol., 15, 6632-40.
47. Farkas, I., Hardy, T.A., Goebl, M.G. and Roach, P.J. 1991, J. Biol. Chem., 266, 15602-7.
48. Rowen, D.W., Meinke, M. and LaPorte, D.C. 1992, Mol. Cell. Biol., 12, 22-9.
49. Van Aelst, L., Hohmann, S., Bulaya, B., de Koning, W., Sierkstra, L., Neves, M.J., Luyten, K., Alijo, R., Ramos, J. and Coccetti, P. 1993, Mol. Microbiol., 8, 927-43.
50. Gonzalez, M.I., Stucka, R., Blazquez, M.A., Feldmann, H. and Gancedo, C. 1992, Yeast, 8, 183-92.
51. Thevelein, J.M. and Hohmann, S. 1995, Trends Biochem. Sci., 20, 3-10.
52. Diderich, J.A., Schepper, M., van Hoek, P., Luttik, M.A., van Dijken, J.P., Pronk, J.T., Klaassen, P., Boelens, H.F., de Mattos, M.J., van Dam, K. and Kruckeberg, A.L. 1999, J. Biol. Chem., 274, 15350-9.
53. Ko, C.H., Liang, H. and Gaber, R.F. 1993, Mol. Cell. Biol., 13, 638-48. 54. Liang, H. and Gaber, R.F. 1996, Mol. Biol. Cell, 7, 1953-66.

Chapter 1
16
55. Ozcan, S. and Johnston, M. 1995, Mol. Cell. Biol., 15, 1564-72. 56. Ozcan, S. and Johnston, M. 1999, Microbiol. Mol. Biol. Rev., 63, 554-
69. 57. Ye, L., Berden, J.A., van Dam, K. and Kruckeberg, A.L. 2001, Yeast, 18,
1257-67. 58. Ozcan, S. and Johnston, M. 1996, Mol. Cell. Biol., 16, 5536-45. 59. Ozcan, S., Leong, T. and Johnston, M. 1996, Mol. Cell. Biol., 16, 6419-
26. 60. Diderich, J.A., Schuurmans, J.M., Van Gaalen, M.C., Kruckeberg, A.L.
and Van Dam, K. 2001, Yeast, 18, 1515-24. 61. Verwaal, R., Paalman, J.W., Hogenkamp, A., Verkleij, A.J., Verrips,
C.T. and Boonstra, J. 2002, Yeast, 19, 1029-38.

Chapter 2
Nutrient driven cell cycle progression in
Saccharomyces cerevisiae
Denise van Suylekom, René Verwaal, Victor Winter, Theo Verrips
and Johannes Boonstra
Department of Molecular Cell Biology, Institute of Biomembranes,
Utrecht University, Padualaan 8, 3584 CH Utrecht, The Netherlands
Published in: Recent Research Developments in Molecular and Cellular
Biology (2003) 1; p.99-119

Chapter 2
18
Abstract
Cell cycle progression in Saccharomyces cerevisiae is, like in all cells, a tightly
controlled process. Work in our group has focused on how the progression
through the G1 phase is regulated. Accumulation of the reserve carbohydrates
trehalose and glycogen are shown to be important for elongation of the G1
phase when the cells are grown at low galactose concentrations. The glucose
transporter Hxt5p is suggested to play a role in accumulation of trehalose and
this is probably under control of the cAMP-PKA pathway. This pathway
positively influences early G1 phase progression, while a model is set up that
suggests that the PKC1-SLT2 pathway is important for late G1 to early S phase
progression.
Introduction
Knowledge on the molecular mechanisms that govern the progression
through the cell cycle has increased considerably during the last decades,
mainly because this knowledge is fundamental for understanding the cause
and subsequent treatment of many diseases, including cancer. Cell cycle
research in yeast has played a prominent role in these developments, due
similarity in regulation of cell cycle progression between yeast and higher
eukaryotes, and the advantages of yeast as model organisms because of the
readily applicable molecular biological approaches and defined and easy
culture conditions. Cell cycle regulation is usually determined by external
factors, and the main difference between yeast and higher eukaryotes concerns
the different properties of these external factors. In yeast, cell cycle
progression is largely determined by the availability of nutrients and to a lesser
extent by specific signal molecules such as pheromones. In mammalian cells,
cell cycle progression is determined by growth factors, extracellular matrix
factors and cell-attached signal molecules, and to a lesser extent by nutrients.
However, the intracellular signal transduction cascades that transmit the
external signal from the plasma membrane to the nucleus are largely
comparable. This homology in signal transduction systems and the homology
in the molecular systems that govern cell cycle progression make the yeast cell

Nutrient driven cell cycle progression in Saccharomyces cerevisiae
19
still an attractive organism to unravel the molecular systems that regulate cell
cycle progression by nutrients. In this review we will describe briefly the
current knowledge on cell cycle regulation in Saccharomyces cerevisiae and in
more detail the mechanisms governing nutrient-determined cell cycle
progression.
Cyclins and Cyclin-dependent kinases.
The cell division cycle or cell cycle can be divided in four successive
phases: the G1 (or Gap1) phase, the S (or Synthesis) phase, the G2 (or Gap2)
phase and the M (or Mitotic) phase (figure 1). Unlike other eukaryotic cells, the
division of S. cerevisiae is asymmetric, with a relative large mother and a small
daughter cell. After division, the mother cell will be able to start a new cell
cycle (almost) immediately, while the daughter cell has to grow in size before it
can enter the S phase. Environmental conditions determine the (specific) cell
size at which cells will leave the G1 phase and enter the S phase. This size
threshold increases in proportion to cell ploidy and decreases when more
nutrients are available. When conditions are not favourable, haploid cells will
enter a quiescent state, while diploid cells will undergo meiosis and form four
haploid spores that can survive long under extreme conditions. If conditions
are favourable, cells will start a new cell cycle. The characteristic sign that S.
cerevisiae cells have entered S phase is the appearance of a bud (1). This bud
will continue to grow during the S and G2 phase, until it is separated from the
mother at the end of mitosis. The decision whether to enter a new cell cycle or
to enter the quiescent state is taken at the end of the G1 phase, at a point called
'Start' (2). After cells have passed Start, cells initiate DNA replication, spindle
pole body duplication and bud growth. These events are critical for further cell
cycle events, namely mitosis and cytokinesis (reviewed in (3)). Prior to the
execution of Start, nutrient limitation or mating pheromones can arrest cells in
G1 (4).
Cell cycle progression is dependent upon the activity of molecular cell
cycle mediators, the cyclin dependent kinases (Cdk’s). One single Cdk, Cdc28p,
is sufficient and required for regulation of cell cycle progression in S.

Chapter 2
20
cerevisiae. Regulation of Cdc28p activity is dependent upon the interaction
with cyclins. Cyclins are a family of proteins that share limited homology at the
primary sequence level in a region called the 'cyclin box'. This cyclin box
encodes a structural motif that is required for interaction with and activation
of the Cdk partner. After binding to the cyclins, Cdc28p activity is regulated
further by a combination of activating and inhibiting phosphorylations and the
possible interaction with Cdk inhibiting proteins (CKIs). At different stages of
Figure 1: Cell cycle of Saccharomyces cerevisiae. Daughter cells start the
cycle as small cells and grow during G1 phase. CLN3 is constantly expressed and
during G1, the Cln3-Cdc28 complex induces transcription of CLN1 and CLN2.
Cln1,2-Cdc28 complexes induce passing of Start and entry into S phase which is
characterized by appearance of a bud. During S phase, CLB5 and CLB6 are
expressed. Clb5,6-Cdc28 complexes induce replication of DNA and are required for
S phase progression, while Clb1-4 are important for progression through G2 and M
phase.

Nutrient driven cell cycle progression in Saccharomyces cerevisiae
21
the cell cycle, different cyclins have to interact with and activate Cdc28. The G1
cyclins, Cln1p, Cln2p and Cln3p, activate Cdc28p during G1 phase. Clb5p and
Clb6p are required for S phase progression and Clb1 through 4 are the mitotic
cyclins, and are necessary for progression through the M phase.
In addition to Cdc28, S. cerevisiae, contains four other Cdk’s: Pho85p,
Kin28p, Srb10p and Ctk1p. These Cdk’s are not essential for cell cycle
progression, but contribute to it by regulating gene expression and
metabolism. Pho85p is the only other kinase that associates with multiple
cyclins, the other three Cdk’s interact with only one cyclin and regulate gene
expression by close links to the transcriptional machinery (reviewed in (5)).
Cell synchronization and fed-batch culturing
In order to be able to study progression of cells through the cell cycle,
in most instances the cells have to be synchronized. Synchronized populations
of S. cerevisiae can be obtained by several methods. These methods can be
divided into two categories: either the cells are arrested in a certain phase until
the entire population resides at the same point of the cell cycle, or cells in the
same phase are isolated from the remaining population.
The addition of α-factor leads to cell cycle arrest in G1 and is a
common method to synchronize S. cerevisiae. However, besides arresting the
cells at G1, the exposure to α-factor leads also to changes in the regulation of
mating behaviour and probably also influences other regulatory pathways (6).
Another way of synchronizing yeast cells is by using a temperature sensitive
cdc15 mutant. Cdc15p is a kinase participating in a MAP kinase pathway, and
has been demonstrated to be required for Clb2/Cdc28 kinase inactivation after
mitosis (7). By shifting the culture to the restrictive temperature, the Cdc15
protein becomes inactive, which leads to cell cycle arrest in late mitosis. A
disadvantage using this method is that the applied temperature shift to 37°C,
required for the inactivation of Cdc15, may also lead to a heat-shock response.
Other methods of cell synchronization include deprivation of essential factors

Chapter 2
22
required for growth (8), or by the exposure to certain specific inhibitors (9),
which block events required for progression through specific cell cycle phases.
Since the newly formed daughter cells are usually small, as compared
to the mother cells, cells can be synchronized using an elutriator.
Controlled progression through the cell cycle of synchronized cells can
be achieved by fed-batch culturing of the cells (10). For example, synchronous
cells obtained by elutriation, were incubated for a short period in minimal
medium without a carbon source. Subsequently, a low amount of galactose was
added to the culture with a constant rate. Under these conditions the residual
galactose concentration remained virtually constant and consequently also the
galactose consumption rate is constant. Using this method, the length of the G1
phase is determined by the galactose concentration in the feed, as
demonstrated by the expression of the S-phase gene H2A and the budding
percentage of the cells (figure 2.).
The precise control of the length of the G1-phase using this fed-batch
system gives the opportunity to study factors influencing cell cycle progression.
In figure 3 is shown how the expression of cell cycle specific transcripts of
CLN1, CLN2 and CLN3 varies when G1-phase is elongated by limiting the
amount of available galactose. In the upper part is the progression through the
Figure 2: Expression of H2A coincides with increase in budding
percentages of cells advancing through the cell cycle [taken from ref. 10].

Nutrient driven cell cycle progression in Saccharomyces cerevisiae
23
cell cycle mapped by determining budding percentages at steady intervals. It is
clearly visible that limiting the amount of galactose leads to a delayed onset of
the S-phase (10).
Regulation of cell cycle progression
Progression through the G1 phase is dependent upon the presence of
the G1 cyclins Cln1p, Cln2p and Cln3p. Neither of these proteins is essential for
passing Start, but deletion of all three genes results in a G1 arrest with
unbudded cells and unreplicated DNA (11, 12). Cln1 and Cln2 share a 75%
homology at the amino acid level, Cln3p is only 20 to 25% homologous to
Cln1p or Cln2p. Unlike CLN1 and CLN2, which are expressed in late G1 phase,
transcription of CLN3 is hardly cell cycle regulated but has a transient increase
during early G1 phase. The protein Cln3 appears present throughout the cell
cycle (13-15). The kinase activity of Cln3-Cdc28 is approximately 20 fold lower
than that of Cln2-Cdc28, when normalized to Cln protein level and Cln2p is
about five-fold more abundant when it was expressed from the CLN3 promoter
compared to Cln3p expressed from its own promoter (16). Another feature
showing that Cln3p has different functions than Cln1p and Cln2p is the fact
that in the absence of CLN3, BCK2 is required for growth, while it is not
required in the absence of both CLN1 and CLN2. Bck2 functions in the same
pathway as the serine/threonine phosphatase Sit4p, which is also required for
accumulation of CLN1 and CLN2 but not CLN3 mRNAs (see below for more
details about Sit4 and regulation of the cell cycle). Bck2p is a protein with
unknown working mechanism that can complement the cell lysis defect of
mutations in the Pkc1 cell integrity pathway (see below for more information
about the Pkc1 pathway in relation to the cell cycle). The function of Bck2p to
induce expression of CLN1 and CLN2 depends on SBF and MBF, just like
Cln3p. In contrast to Cln3p however, the function of Bck2p is not dependent
on Cdc28p. The lethality of a bck2 cln3∆ strain is rescued by overexpression of
RME1, which drives transcription of CLN2. This transcription is completely
independent on SBF or MBF transcription factors. In the absence of CLN3,
Bck2 activates transcription of CLN1 and CLN2 (17, 18).
Chapter 2
24
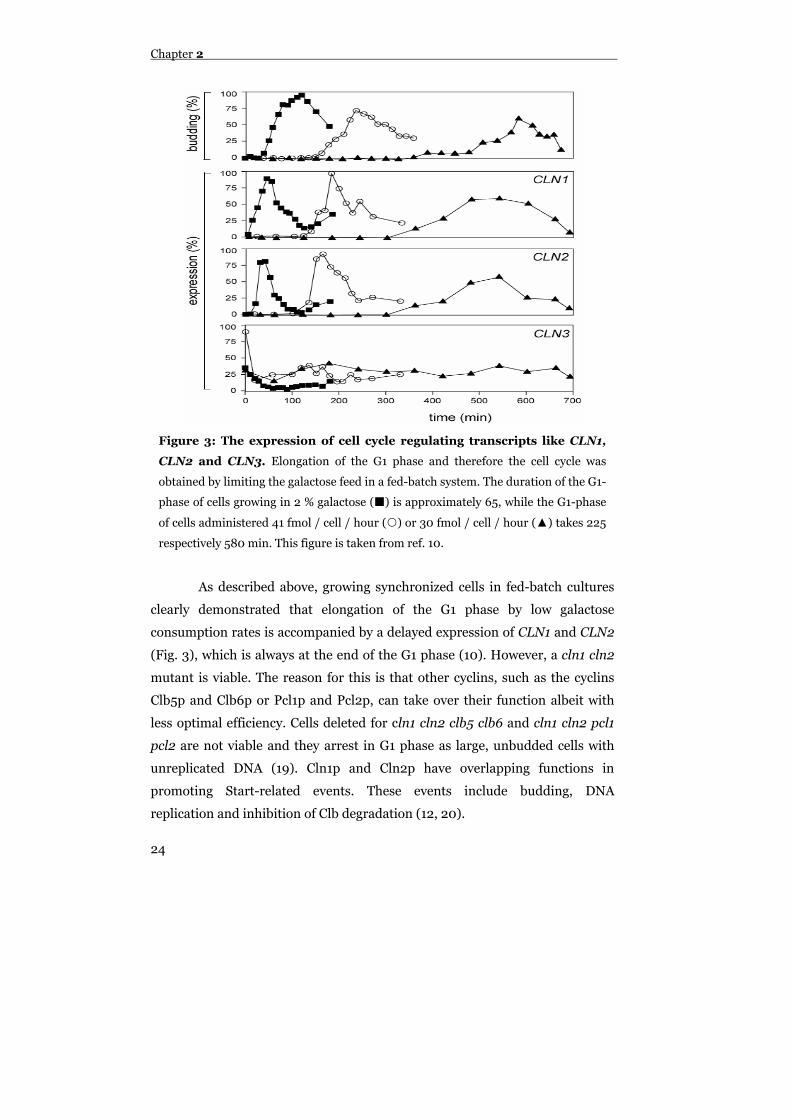
As described above, growing synchronized cells in fed-batch cultures
clearly demonstrated that elongation of the G1 phase by low galactose
consumption rates is accompanied by a delayed expression of CLN1 and CLN2
(Fig. 3), which is always at the end of the G1 phase (10). However, a cln1 cln2
mutant is viable. The reason for this is that other cyclins, such as the cyclins
Clb5p and Clb6p or Pcl1p and Pcl2p, can take over their function albeit with
less optimal efficiency. Cells deleted for cln1 cln2 clb5 clb6 and cln1 cln2 pcl1
pcl2 are not viable and they arrest in G1 phase as large, unbudded cells with
unreplicated DNA (19). Cln1p and Cln2p have overlapping functions in
promoting Start-related events. These events include budding, DNA
replication and inhibition of Clb degradation (12, 20).
Figure 3: The expression of cell cycle regulating transcripts like CLN1,
CLN2 and CLN3. Elongation of the G1 phase and therefore the cell cycle was
obtained by limiting the galactose feed in a fed-batch system. The duration of the G1-
phase of cells growing in 2 % galactose ( ) is approximately 65, while the G1-phase
of cells administered 41 fmol / cell / hour ( ) or 30 fmol / cell / hour (▲) takes 225
respectively 580 min. This figure is taken from ref. 10.

Nutrient driven cell cycle progression in Saccharomyces cerevisiae
25
The transcription factors SCB binding factor (SBF) and MCB binding
factor (MBF) are activated by Cln3p. SBF consists of the DNA-binding protein
Swi4 and the regulatory protein Swi6, and binds the repeated upstream
regulatory sequence CACGAAA, called SCB for Swi4,6-dependent cell cycle
box. Swi4 binds the SCB sequence via an N-terminal helix-turn-helix DNA
binding domain. The two carboxyterminal parts of Swi4p and Swi6p interact
and by this, Swi6p regulates SBF function (21). SWI4 expression was
demonstrated to occur approximately 10-20 minutes before CLN1and CLN2
expression when cells are grown at high growth rates, but this time interval
increased strongly during very low growth rates in the above-mentioned fed
batch culture conditions (10).
MBF consists also of Swi6p, but cooperates with the DNA binding protein
Mbp1 that binds the upstream regulatory sequence ACGCGT, or MCB for Mlu1
cell cycle box (21).
More than 200 genes have a maximal expression late in G1 phase and
most of them have one or more SCB or MCB elements in their upstream
sequences. Genes with SCB elements in their promoter include CLN1 and
CLN2, and the Pho85-associated cyclins PCL1 and PCL2. These four cyclins are
together with their Cdk’s required for the G1-S transition. Other genes that are
activated include genes involved in cell wall biosynthesis and budding (22).
MBF activated genes are predominantly involved in DNA repair and DNA
replication (23).
Deletion of SWI4 results in defects in budding (24). Deletion of CLN3
and SWI4 results in near lethality (25). Cells from a strain in which both swi4
and mbp1 are deleted arrest in G1 phase. Cells deleted for swi4 and swi6 show
a similar phenotype, probably because Mbp1p is inactive in the absence of
SWI6. swi6 and swi6 mbp1 mutants are viable, probably because Swi4p acts as
a transcription factor in the absence of Swi6p, albeit at lower capacity. Swi6p is
localized to the cytoplasm during most of the cell cycle, but is nuclear during
G1 phase. This nucleo-cytoplasmic shuttling is regulated by phosphorylation of
Ser160, which is close to the nuclear localization signal of Swi6p.
Phosphorylation of this serine residue is thought to inhibit the NLS and
prevent nuclear localization during S to M phase transition (26).

Chapter 2
26
SBF regulation via the subcomponent Swi6 occurs via Cln3p. The
regulation of cell size, pheromone sensitivity, S phase entry and budding by
Cln3p depends on Swi6p, although the consensus phosphorylation sites for
Cdc28p are not involved and stable complexes between Swi6p and Cln3p were
not detected (27).
During late G1 phase, Cln1p and Cln2p levels are higher than Cln3p
levels and the Cdc28p kinase activity associated with Cln3 is lower. Substrate
specificity also seems to differ between Cln1p and Cln2p on one hand and
Cln3p on the other hand. The idea is that the role of Cln1/Cln2-Cdc28 activity
is to target Sic1p for degradation allowing Clb5p and Clb6p to associate with
and activate Cdc28p kinase activity, while the main function of Cln3-Cdc28 is
to activate transcription of CLN1 and CLN2 (16). Besides protein levels and
substrate specificity for Cdc28p, the localization of cyclins is also important for
proper regulation of Cdc28p function/activity. The localization of Cln2p is
mainly cytoplasmic, while that of Cln3p is nuclear in large, budded cells. In the
cytoplasm, Cln2p is localized to sites of budding. Shuttling of Cln2p between
the nucleus and the cytoplasm is important for correct functioning of the
protein. Correct functioning of Cln3p requires a nuclear localization. This
localization is achieved by a bipartite nuclear localization signal and is not
dependent on interaction with Cdc28p. Mutations in Cln2p or Cdc28p that
abolish the interaction, result in loss of nuclear localization (28, 29). While
Cln1- and Cln2-Cdc28 kinase activity is regulated by the expression of CLN1
and CLN2, the kinase activity of Cln3-Cdc28 is regulated by the carbon source.
The activity is highest in cells growing on glucose and lowest in cells growing
on non-fermentable carbon sources such as ethanol. Also, CLN3 mRNA levels
are regulated by carbon source and the Ras-cAMP pathway positively regulates
Cln3 protein and activity levels. In addition, the Ras-cAMP pathway seems to
affect positively CLN1 and CLN2 expression as inhibition of the pathway leads
to a G1-arrest that is equal to that seen in nutrient starved cells. Depletion of
cAMP from the medium does hardly influence CLN3 mRNA levels, while it
decreases CLN1 and CLN2 mRNA levels and overexpression of CLN3
eliminates the requirement for cAMP. Deletion of cln3 inhibited induction of
CLN1 and CLN2 mRNAs by cAMP (30).

Nutrient driven cell cycle progression in Saccharomyces cerevisiae
27
Inhibition of the TOR pathway by rapamycin leads to a G1 arrest with large
unbudded cells that do not express the G1 cyclins. This G1 arrest is however a
secondary result as ectopic expression of CLN2 does not rescue the G1-arrest
(31). Binding of Whi3p, a CLN3-RNA binding protein also decreases
progression through the cell cycle in a dose-dependent manner with
overexpression of WHI3 causing G1 arrest (32). whi3∆ cells enter S phase at a
size that is approximately 25% smaller than wild type cells and expression of
G1/S transition genes starts at smaller cell sizes. The Cln3 protein and
phosphorylation levels were not affected in these whi3∆ mutants. A possible
explanation for this is that Whi3p restricts Cln3p at cytoplasmic foci and
thereby inhibits activation of SBF and MBF by Cln3-Cdc28 (33).
When cells have passed Start, the Clb5 and Clb6 cyclins interact with
Cdc28p, each at a different time, but their expression overlaps. DNA
replication is induced by both Clb5p and Clb6p followed by induction of
mitosis by Clb1-Clb4 (34, 35). Late in the G1 phase, the transcription factor
MBF initiates expression of CLB5 and CLB6 (36, 37). During the S phase,
CLB3 and CLB4 are expressed and followed by CLB1 and CLB2 during the G2
phase.
The role of Clb5p and Clb6p in DNA replication appears to be similar,
but not identical. When clb5 is deleted, DNA replication is initiated normally,
but it takes cells twice as long to complete replication. When clb6 is deleted, no
changes in onset and duration are observed, but when both clb5 and clb6 are
deleted, the phenotype is similar to that of CLB5 mutants: S phase is delayed
and bud formation and DNA replication occur no longer at the same time. So,
it seems that Clb6p has a minor role that is not yet elucidated (34, 38). When
cells are deleted for clb1, clb2, clb3 and clb4, they normally initiate and finish
DNA replication but fail to form bipolar mitotic spindles and these cells arrest
in G2 phase. The activation of Cdc28p kinase by Clb1-4 is required to stop
polarized bud growth. Early spindle assembly during the S phase is due to
Clb3p and Clb4p, while the elongation is under control of Clb1p and Clb2p (35,
39).

Chapter 2
28
One of the targets of Clb-Cdc28 kinase activity concerns the
transcription factor SWI5. Swi5p is nuclear during G1 phase, while it
accumulates in the cytoplasm before the end of anaphase. This accumulation is
dependent on Cdc28p-dependent phosphorylation of its nuclear localization
signal. Inactivation of Clb-Cdc28 kinase activity at the end of mitosis might
allow nuclear localization, where Swi5p can activate transcription of a number
of genes, including that of the Cdk inhibitor SIC1. SWI4 might also be
regulated by Clb-Cdc28 kinase activity, because repression of SBF-regulated
genes depends on CLB1, CLB2, CLB3 and CLB4, and association of Swi4p with
Clb2p can be detected in cells that are arrested in mitosis (40, 41).
Besides the essential Cdc28p, the Cdk Pho85p plays important roles in
cell metabolism and division but is not directly involved in the cell cycle.
Cdc28p and Pho85p are 51% homologous to each other. Like Cdc28p, Pho85p
interacts with and is activated by multiple cyclins (42). The cyclins Pcl1p and
Pcl2p seem to play a role in the regulation of G1 phase, although they are not
essential and deletion of both of the genes does not lead to a G1 cell cycle
arrest. When cln1 and cln2 are deleted however, PCL1 and PCL2 become
essential, as well as PHO85. Expression of PCL1 and PCL2 is under control of
SBF and is highest at Start. Overexpression of PCL1 and PCL2 rescues cell lysis
as observed in cells deleted for members of the SLT2 pathway. SLT2 is the
MAP kinase (MAPK) of the PKC1-SLT2 pathway, also called the cell wall
integrity pathway (see below). Over-expression of CLN1 and CLN2 does not
suppress this defect, indicating that although the genes can complement each
other, they also have different roles (43).
G1 to S transition is negatively regulated by the CLB kinase
inhibitor Sic1
Before cells enter S phase, Sic1p has to be ubiquitinated and
subsequently degraded. For ubiquitination, Sic1p needs to be phosphorylated
at least six different positions at the same time and Cln1/2-Cdc28 and Pcl1/2-
Pho85 kinase activity mediate these phosphorylations (44-46). Although six
phosphorylations are sufficient to target Sic1p for destruction, it contains nine

Nutrient driven cell cycle progression in Saccharomyces cerevisiae
29
potential phosphorylation sites. Seven of these sites are clustered in the first
105 N-terminal residues (46). When sic1 is deleted, cells suffer from premature
DNA replication and genome instability (47). Sic1p does not only inhibit G1
exit, it also promotes G1 entry after mitosis, both by inhibition of Clb-Cdc28
kinase activity (48). The inhibition of Clb-Cdc28 kinase activity at the end of
mitosis induces spindle disassembly, formation of two nuclei and cytokinesis
(49). Ubiquitination and degradation of the Clb cyclins causes Clb-Cdc28
kinase inactivation (50). SIC1 transcription increases late in M phase and this
increase is dependent on the transcription factor Swi5p. SIC1 expression is
inhibited at the G1 to S transition. When Sic1p is degraded as a result of
Cln1/2-Cdc28 kinase activity, the inhibition of Clb5/6-Cdc28 kinase activity is
released and DNA replication is initiated. By deletion of SIC1, the delay in DNA
replication in cln1 cln2 mutants is suppressed (44-46, 48).
Signal transduction pathways involved in cell cycle
regulation.
To maintain a certain mean cell size, the cell has to control the
increase in cell volume in relation to cell cycle progression. The initial idea
was, that when a critical cell size is reached, the levels of Cln3-Cdc28 increase,
Cln3-Cdc28 positively regulates Swi4p, which together with Swi6p induces
expression of SBF-regulated genes. Among these genes are CLN1 and CLN2,
and Cln1/2-Cdc28 activity then initiates passage through Start (51). However,
the cell size appears not to be the critical determinant for passage through
Start, because it was demonstrated that cells start to bud at a small size when
grown on high galactose levels, and at a larger size when grown on low
galactose levels (10). Apparently, proteins or regulatory systems are important
for regulation of passage through Start.
In mammalian cells, the MAPK pathway has been demonstrated to
play an important role in progression through the G1 phase of the cell cycle
(52). This tempted us to suggest that in yeast cells MAPK pathways might also
be positively involved in progression of the cell cycle. It has been shown that
the Pkc1 pathway is responsible for the phosphorylation of Swi4p and Swi6p

Chapter 2
30
and this phosphorylation is thought to be the activating step (43). The Pkc1
pathway consists of the upstream kinase Pkc1p, the MAPKKK Bck1p, the
MAPKKs Mkk1p and Mkk2p and finally the MAPK Slt2p (53-56). Pkc1p can be
activated via Rho1p by several membrane receptors, namely Wsc1-4 and
Mid2p, which all seem to signal under different conditions, but also seem to
have overlapping functions (57-61). Mid2p is specifically activated when cells
are exposed to mating pheromone (58) while wsc1wsc2wsc3∆ cells hardly
activate the PKC1-MAPK pathway in response to heat shock (57). It appeared
that Slt2p becomes active just before cells enter the S phase and this provided
a clue that members of the PCK1-SLT2 pathway may positively influence cell
cycle progression. This was strengthened by the observation that cells deleted
for SLT2 hardly formed new cells. Furthermore, cells progressing faster
through the cell cycle by overexpression of CLN3 contained more
phosphorylated and hence active Slt2p compared to wild type cells, indicating
that Slt2p may be one of the downstream targets of Cln3 and it was suggested
to be an upstream regulator of Cln1p and Cln2p (figure 4) (62).
However, facts that contradict this suggestion concern the
observations that the Pkc1 pathway is activated when cells are exposed to high
temperature, hypo-osmotic shock and compounds that interfere with cell wall
synthesis. The Pkc1 pathway is also activated in response to pheromone
treatment, although this activation is an indirect event due to cell wall changes
Figure 4: Initial Model of G1 phase regulation by PKC1-SLT2 pathway.
Nutrients induce the transcription of CLN3 and Cln3 forms a complex with Cdc28.
This complex initiates formation of the SBF complex consisting of Swi4 and Swi6.
Active Slt2 phosphorylates Swi4 and Swi6, which then induce transcription of CLN1
and CLN2. Cln1 and Cln2 complexed to Cdc28 finally induce progression to S phase.
Model after ref. 60.

Nutrient driven cell cycle progression in Saccharomyces cerevisiae
31
induced by activation of the pheromone MAPK pathway (6). Activation of the
MAP kinase Slt2p is only partially dependent on Cln1/2-Cdc28 kinase activity,
which places Slt2p downstream of Cln1/2-Cdc28 instead of Slt2p being an
upstream regulator of Cln1p and Cln2p (24). When cells deleted for slt2 were
grown on 1 M sorbitol, their growth rate was only slightly lower than that of
wild type cells grown on 1 M sorbitol and examination of the abundance of
Cln1p and phosphorylated Slt2p revealed an earlier appearance of Cln1 than
phosphorylated Slt2p (unpublished observations). Furthermore,
overexpression of CLN1 or CLN2 did not suppress defects of Pkc1ppathway
mutants (24, 43). These observations do however not devaluate the role of
Slt2p in the G1-S transition, because Slt2p is activated at the G1-S transition at
the same time as bud emergence; the growth defect of certain G1-defective
cdc28 alleles is exacerbated by slt2 mutants and certain pkc1 alleles and
overexpression of BCK2 partially suppressed the defects of pkc1 pathway
mutants (24). It was also demonstrated that both Slt2p and Cln2p localize to
the site of budding (63, 64) although Slt2p is probably not responsible for bud
formation as PKC1 deletion mutants are capable of forming buds (65). During
the cell cycle, CDC28 is required for timely activation of Slt2p, but during other
conditions, e.g. exposure to mating factor, activation of Slt2p is independent of
Cdc28p (6). The activation of Slt2p by Cdc28p occurs through phospholipase C
(PLC). Cdc28p activates PLC, which cleaves phosphatidylcholine to
diacylglycerol (DAG) and phospholipid (PL). Pkc1 is known to contain a
binding site for DAG, through which the Pkc1 pathway is activated (6, 65).
When Slt2p is activated, the expression of PCL1 and PCL2 increases, indicating
that active Slt2 promotes cell wall biosynthesis, which is important for proper
bud formation. Thus the renewed model (figure 7) places Slt2p downstream of
Cln1p and Cln2p, but upstream of PCL1 and PCL2 and other genes.
Overexpression of SWI4, PCL1 or PCL2 does indeed suppress the growth
defect of slt2 mutants (43).
As Slt2-GFP is localized to bud tips and the nucleus when cells are
exposed to mating factor (64, 66), Slt2p may also have a nuclear localization at
the end of the G1 phase. Apparently Slt2p functions to activate the
transcription factors Rlm1p, which induces genes of cell wall proteins and

Chapter 2
32
enzymes involved in cell wall biosynthesis (67, 68), and SBF which is, next to
regulation of the cell cycle, also involved in membrane and cell wall
biosynthesis and budding (69). Activated Slt2p has to be dephosphorylated in
order to decrease the activity of the Pkc1-pathway. Several phosphatases are
known to deactivate Slt2p: i.e. Ptp2p, Ptp3p, Msg5p and Sdp1p (70-72). Upon
heat shock and H2O2 treatment, the mRNA levels of SLT2, SDP1 and PTP2 are
induced. PTP3 and MSG5 mRNA levels did not change upon H2O2 treatment
and only transiently increases upon heat shock (70). All mRNAs were induced
after osmotic stress, but whether the activity of these phosphatases also
increases is unknown. These examples indicated that different phosphatases
are expressed and activated under different stress conditions.
As mentioned earlier, it is thought that the PKA/cAMP and the TOR
pathways are also involved in the cell cycle regulation by regulating protein
synthesis rate (73). How these two pathways influence cell cycle progression is
not known yet. One of the components of the TOR pathway is Sit4p, a
serine/threonine phosphatase that is involved in a number of processes,
including the TOR-pathway-regulated nutrient response, regulation of ion
homeostasis and intracellular pH and cell cycle regulation (74-76). Cells
deleted for SIT4 exhibit a low growth rate due to an increase in G1 phase
duration, depending on a gene called SSD1. SSD1 is a polymorphic gene that
can suppress the lethality of sit4∆ cells in some laboratory strains, but can not
in others (77). This extension of the G1 phase is partly due to the role SIT4
normally plays in the transcription control of the G1 cyclins CLN1 and CLN2,
and in the control of SWI4 expression. Sit4p is thought to act in the pathway
parallel to Cln3-Cdc28, the pathway involving Bck2p, to activate CLN1 and
CLN2 expression (17, 78). Indirectly, Sit4 is thus required for normal DNA
replication. Besides DNA synthesis, Sit4p is also thought to play a role in bud
formation. Sit4p is placed upstream of the Pkc1 pathway but downstream of
the cell surface receptors Wsc1-4 and Mid2p, and deletion of SIT4 leads to an
up-regulation of the Pkc1 pathway and to an enrichment of G1 cells in the
culture (79).
While Sit4p is a positive regulator of cell cycle progression, the
phosphatases Ppz1p and Ppz2p inhibit cell cycle progression. Overproduction

Nutrient driven cell cycle progression in Saccharomyces cerevisiae
33
of PPZ1 can rescue the cell lysis defect of mutants of the Pkc1 pathway, but
severe overexpression of PPZ1 results in a delay in the G1 to S transition, as
high levels of Ppz1 seem to interfere with budding initiation and DNA
synthesis (79, 80).
Another regulator of cell cycle progression, but on the transcription
level, is Azf1p, which induces CLN3 transcription in a glucose concentration-
dependent manner, although the mechanism is not yet clear (73).
Deletion of KNR4, a gene that encodes for a protein with unknown
function, is lethal when members of the Pkc1 pathway are missing, but
overexpression of KNR4 does not rescue the cell lysis phenotype of Pkc1
pathway deletion mutants. It is known that KNR4 and BCK2, which are
involved in Cln3-Cdc28 independent gene expression, function in the same
genetic pathway, but they must also have separate functions as indicated by
deletion studies. When CLN3 is deleted, not only BCK2 is required, but also
KNR4 (81, 82). Deletion of KNR4 deregulates transcription of cell cycle-
regulated genes such as CLN2 and PCL1 (82).
Relation between the nutrient availability, G1 phase duration
and reserve carbohydrate accumulation
By growing synchronized cells in fed-batch cultures, a tight correlation
between nutrient availability and the duration of the G1 phase was observed,
which was shown for haploid (83) and diploid cells (10). The cells were
cultured under galactose limitation, which was added to the cells at various but
constant rates as described above. The results of these studies demonstrated
that the relationship between the flux of the growth rate determining nutrient
and the length of the G1 phase was bi-phasic (Figure 4). When the galactose
consumption rate of haploid cells was decreased from 50 to 20 fmol cell-1.hr-1,
the G1 phase duration gradually increased from minimally 110 to 160 minutes
in length. At consumption rates lower than 20 fmol cell-1.hr-1, the G1 phase
duration rapidly elongated from 160 to 520 minutes at 14 fmol cell-1.hr-1 (83).
Furthermore, these studies also revealed that an increase in the G1
phase duration was accompanied with trehalose and glycogen accumulation

Chapter 2
34
when the galactose consumption rate was lower than 20 fmol cell-1hr-1 in
haploid cells (Figure 4, (83)), and below 31 fmol cell-1hr-1 in diploid cells (10).
These studies therefore indicated that accumulation of trehalose and glycogen
is related to the length of the G1 phase. Of particular interest were the
observations that the bi-phasic relation between length of the G1 phase and
galactose consumption rate was not observed in a mutant unable to synthesize
trehalose and glycogen (62). These observations suggested that the extreme
lengthening of the G1 phase when cells were grown at a low galactose
consumption rate was solely due to the fact the trehalose and glycogen were
accumulated under these conditions. Thus, besides various signalling proteins,
accumulation of reserve carbohydrates are also involved in progression
through the G1 phase of the cell cycle.
Proteins involved in reserve carbohydrates metabolism
Several carbon sources may be used as precursors for trehalose and
glycogen (Figure 5). Upon transport into the cell, glucose is phosphorylated
Figure 5. Bi-phasic relation between G1 phase duration, trehalose and
glycogen accumulation and the galactose consumption rate. Haploid wild
type cells synchronized early in the G1 phase were grown at different galactose
consumption rates. The G1 phase duration is defined as the time from inoculation
until 50% budding was reached. (●) G1 phase duration (min), (□) glycogen (fmol
(glucose) cell-1), (∆) trehalose (fmol (glucose) cell-1). This figure was taken from (60).

Nutrient driven cell cycle progression in Saccharomyces cerevisiae
35
into glucose-6-phosphate by hexokinase (84) and converted into glucose-1-
phosphate by phosphoglucomutase, encoded by PGM1 or PGM2 (85).
Subsequently, glucose-1-phosphate is converted into UDP-glucose by UDP-
pyrophosphorylase (Ugp1p, (86)). Galactose may serve as precursor for
trehalose and glycogen as depicted in Figure 5 (87). Non-fermentable carbon
sources like ethanol or glycerol, which may be ultimately converted into
glucose-6-phosphate by gluconeogenesis, can also be used as precursors for
trehalose. During conditions that result in accumulation of reserve
carbohydrates, the flux towards the precursors of trehalose and glycogen may
Figure 6. Overview of trehalose and glycogen metabolism in
Saccharomyces cerevisiae. Many carbon sources can serve as precursors for
trehalose and glycogen. The proteins and metabolites that are involved in trehalose
and glycogen metabolism are indicated. Tps1p, Tps2p, Tps3p and Tsl1p are present
in the trehalose synthase complex. For details see text.

Chapter 2
36
be increased by induction of PGM2 and UGP1 expression, as well as regulation
of the enzymatic activities of the enzymes (85, 86, 88).
As shown in Figure 5, trehalose is synthesized by the conversion of
glucose-1-phosphate or UDP-glucose into trehalose-6-phosphate, which is
catalyzed by trehalose-6-phosphate synthase, encoded by TPS1 (89, 90).
Subsequently, trehalose-6-phosphate phosphatase (Tps2p) mediates the
conversion of trehalose-6-phospate into trehalose and free phosphate (91, 92).
Tps1p and Tps2p are part of a large protein complex called the trehalose
synthase complex, which also contains the products of the TSL1 and TPS3
genes. Tsl1p and Tps3p are regulatory components that probably function to
stabilize the complex (89, 93, 94). Trehalose can be degraded by the action of
two types of trehalases. The first type, encoded by the NTH1 gene (95, 96), is a
cytoplasmic protein (97), which has its maximal activity at pH 6.8 – 7.0 and is
therefore called neutral trehalase (98). NTH2 encodes a protein with 77%
similarity to Nth1p, although the cellular role of Nth2p remains unclear (99).
The second type of trehalase is found in vacuoles (97) and is encoded by ATH1
(100). The enzyme is optimally active at pH 4.5 – 5.0 and therefore designated
as acidic trehalase (98). Synthesis of glycogen involves initiation, elongation
and ramification steps, which are mediated by the enzymes encoded by GLG1,
GLG2 and GLC3 (101-103). Glycogen degradation is mediated by the proteins
encoded by GPH1 and GDB1 (104, 105).
The role of Tps1p
Yeast cells deleted for tps1 display a variety of phenotypes, of which
the inability to grow on rapidly fermentable carbon sources like glucose is the
most profound (106). Upon addition of glucose, tps1 deletion mutants
hyperaccumulate glycolytic intermediates, and have reduced intracellular
levels of inorganic phosphate and ATP (107, 108). Reduction of ATP levels
suggests an imbalance between the upper part of glycolysis, in which ATP is
consumed, and the lower part of glycolysis, where ATP is generated. Mutations
that reduce sugar transport reduce the glucose-growth defect, indicating an
excessive sugar influx into glycolysis tps1 deletion mutants (109, 110). Deletion

Nutrient driven cell cycle progression in Saccharomyces cerevisiae
37
of hxk2 in the tps1 deletion mutant, thereby lowering the glucose
phosphorylation rate, results in regain of growth on glucose (109, 111). These
results imply that the system responsible for trehalose production is also
important for the control of glucose influx in glycolysis (111, 112). It was
proposed that Tps1p acts as a direct regulator of glucose transport and
phosphorylation, in conjunction with a sugar carrier and a sugar kinase to
form the “general glucose-sensing complex” (89, 94, 106, 113). The observation
that Tps1p may exists both as a free form and as a component of the trehalose
synthase complex supports the suggestion that Tps1p might exhibit additional
regulatory functions (94). Furthermore, these observations also suggest that a
link might exist between glucose transport and accumulation of trehalose.
Glucose, which can be transported by hexose transporters, is used as a
precursor for trehalose, during conditions when glucose becomes limited, or
during conditions when an extra demand for trehalose is required to withstand
harmful conditions. This glucose may be gained by lowering the amount of
glucose destined for glycolysis, or by increasing the uptake of glucose, for
example by increasing the amount of active glucose transporters. A system that
couples glucose transport directly to accumulation of trehalose during
conditions of slow growth could be beneficial for the yeast cell.
The possible role of Hxt5p in trehalose accumulation
In S. cerevisiae, transport of glucose across the plasma membrane is
mediated by a multigene family consisting of 20 genes, including HXT1-
HXT17, GAL2, SNF3 and RGT2, encoding Hxt proteins, (114-117). Individual
expression of HXT1-4 and HXT6-7 in the MC996 background strain, which
was deleted for HXT1-7 (hxt null mutant), resulted in regaining the ability to
grow on glucose. Over-expression of HXT5 or HXT8-17 (except HXT12, which
probably encodes a pseudogene) individually in the CEN.PK background strain
deleted for hxt1-17 and gal2 restored growth on glucose, indicating that Hxt5p,
Hxt8-11p and Hxt13-17p are also able to transport glucose (118). Therefore,
HXT1-4 and HXT6-7 were initially thought to encode the major Hxt proteins
(119). However, it was shown later that Hxt5p also exhibits glucose transport

Chapter 2
38
capacity (120, 121). Expression of the major HXT genes is mainly regulated by
extracellular the glucose concentration (115).
It appeared that expression of one of the remaining hexose
transporters is regulated in a completely different manner as compared to the
major HXT genes. HXT5 expression was not regulated by the extracellular
glucose concentration, but by the growth rate of yeast cells. Expression of
HXT5 was specifically induced when the growth rate of cells decreased, and
was maximally induced when glucose was depleted from the growth medium.
Furthermore, during exponential growth on fermentable carbon sources other
than glucose, like galactose, maltose, mannose or sucrose, HXT5 was not
expressed, but 24 hours after inoculation, during the stationary phase, HXT5
was expressed independent of the carbon source used. HXT5 was also
expressed during growth on the non-fermentable carbon sources ethanol and
glycerol, which results in decreased growth rates as compared to growth on
fermentable carbon sources. Experiments conducted in nitrogen-limited
continuous cultures indicated that HXT5 expression is indeed regulated by the
growth rate of cells, as HXT5 was only expressed at dilution rates lower than
0.10 h-1, and not at higher dilution rates (122).
Surprisingly, it appeared that the conditions that result in a decrease
in the growth rate of cells and thereby in an increase of expression of HXT5
also resulted in accumulation of trehalose (123). During growth in a nitrogen-
limited continuous culture, trehalose was only accumulated at dilution rates
lower than 0.10 h-1, concomitant with HXT5 expression. In glucose-grown
batch cultures, only the expression pattern of HXT5 completely matched the
pattern of trehalose accumulation, whereas expression of the major HXT genes
only partially overlapped the trehalose accumulation pattern. Furthermore,
during growth on non-fermentable carbon sources, HXT5 was also expressed
concomitant with trehalose accumulation (123). These observations suggested
that Hxt5p plays a role in accumulation of trehalose, specifically during growth
on glucose but also during growth on other carbon sources.

Nutrient driven cell cycle progression in Saccharomyces cerevisiae
39
Growth rate-regulated gene expression
Expression of genes is regulated by binding of transcription factors to
regulatory elements that are present in the promoter of genes. Having
established that expression of HXT5 is regulated by the growth rate of yeast
cells, this feature may be used as a tool to determine the mechanism behind
growth rate-regulated expression of HXT5 and perhaps also for expression of
other growth rate-regulated genes. It appeared that the promoter of HXT5
contained 5 putative regulatory elements being two stress responsive elements
(STREs, (124-127)), one PDS element (128) and two Hap2/3/4/5p (HAP)
complex binding sites (129). The STREs are located at -472 bp and -304 bp
relative to the translation initiation site respectively, the HAP2/3/4/5 binding
sites at -854 bp and -785 bp respectively and the PDS element at -544 bp,
which was determined by computer-assisted analysis of the HXT5 promoter
(130).
Mutational analysis each of these putative elements in the promoter of HXT5
revealed that the STRE most proximal to the translation initiation site (now to
be named STRE1) was extremely important in growth rate-regulated
expression of HXT5 (123). STREs are bound and activated by the transcription
factors Msn2p and Msn4p, which may bind to STRE1 in the promoter of HXT5
and could therefore be the most important transcription factors involved in
regulation of HXT5 expression.
Growth rate-regulated HXT5 expression is controlled by STRE1 The
presence of STREs in the HXT5 promoter suggests that the transcription
factors Msn2 and Msn4p, which are known to bind to STREs (131, 132), are
involved in regulation of HXT5 expression.
In order to act as transcription factors, Msn2/4p have to be present in the
nucleus, and it is known that the activity of the cAMP/PKA pathway
determines the localization of Msn2/4p (133). The activity of the cAMP/PKA
pathway is highly correlated to the availability and quality of the nutrients, and
thereby to the growth rate of cells. The activity of the cAMP/PKA pathway is
high when cells grow in a medium containing a high amount of fermentable
carbon sources, resulting in high growth rates of cells (113, 134). During these

Chapter 2
40
conditions, the transcription factors Msn2/4p are present in the cytoplasm.
The activity of the cAMP/PKA activity decreases when the medium becomes
deprived from fermentable carbon sources, for example when cells enter the
diauxic shift, resulting in a decrease of the growth rate of cells and Msn2/4p
translocation to the nucleus. Also during stress conditions, like growth at
increased temperatures or osmolarity, the growth rates of cells decrease and
Msn2/4p become localized in the nucleus (133). When Msn2p and Msn4p are
present in the nucleus, expression of genes that are enriched in STREs in their
promoter region is induced (135, 136).
Thus, in addition to regulation of expression of HXT5, the cAMP/PKA
pathway might regulate expression of a variety of genes in response to
decreased growth rates of cells, predominantly through inhibition of STRE-
driven gene expression at high growth rates. This was concluded from the
observation that expression of HXT5 was co-induced with a variety of other
genes, as determined by DNA microarray analysis, during a variety of
conditions that result in a decrease in the growth rate of cells. These studies
include addition of salt (137-139), cell damaging agents (140, 141) or ethanol
(142). Also, Gasch et al (143) described the family of environmental stress
response (ESR) genes, that corresponds to a cluster of genes that have similar
expression patterns under a variety of stress conditions, for example heat
shock, osmotic shock, growth into the stationary phase and nitrogen depletion.
All these conditions are again known to reduce the growth rate of yeast cells,
and result in induction of HXT5 expression. The clusters of genes were
characterized by the presence of a high amount of STREs in the promoters of
these induced genes. Apparently, the conditions that result in decreased
growth rate of the yeast cells are associated with decreased activity of the
cAMP/PKA pathway and expression of STRE-regulated genes. Therefore,
expression of the subset of genes, which is regulated by growth rates of cells,
may be specifically controlled by the cAMP/PKA pathway in S. cerevisiae.

Nutrient driven cell cycle progression in Saccharomyces cerevisiae
41
Conclusion
Clearly, the growth rate is dependent on the duration of the cell cycle and thus
of the length of the G1 phase. The accumulation of the reserve carbohydrates is
proven to be both a feature and a determinant of an elongated G1 phase as this
is accompanied by accumulation of both glycogen and trehalose in wild type
cells. A mutant unable to synthesize these carbohydrates does not elongate its
G1 phase at low galactose fluxes. Accumulation of trehalose is shown to
coincide with expression of the glucose transporter HXT5, and a role of Hxt5
in trehalose accumulation is suggested, also because deletion of HXT5 results
in lower trehalose levels. The cAMP-PKA signal transduction pathway might
be involved because this pathway regulates genes containing STREs in their
promoter, like HXT5 does. The cAMP-PKA pathway might also regulate cell
cycle progression, as CLN1 and CLN2 mRNA levels for example are positively
regulated by cAMP and both Cln3 protein levels as activity levels are
stimulated by cAMP. cAMP us thus a positive regulator of early G1 phase.
A possible regulator of late G1 to early S phase progression is the PLC1-SLT2
pathway. Deletion of components of this pathway does not affect progression
through early G1, but cells lyse because of a weakened cell wall.
Overexpression of late G1 genes such as PCL1 or PCL2 or the transcription
factor SWI4 relieves the cell lysis defect. The activation of the PKC1-SLT2
pathway during the cell cycle is known to be partially dependent on Cdc28 and
the model presented in figure 7 emerged. Shortly, nutrients stimulate the
formation of the Cln3-Cdc28 complex via the cAMP-PKA pathway. This
induces transcription of CLN1 and CLN2 via the SBF transcription complex.
Cln1,2-Cdc28 complexes induce S phase entry both via degradation of Sic1p
and via activation of the PKC1-SLT2 pathway. Activated Slt2p induces
transcription of cell wall genes and inhibits simultaneously transcription of cell
cycle genes. A sufficiently strong cell wall induces Sit4 activation, which down-
regulates the PKC1-SLT2 pathway and thus expression of cell wall genes. This
feedback secures a tight control of progression through G1 and S phase on one
hand and the right composition of the cell wall on the other hand.

Chapter 2
42
Figure 7: Current model of PKC1-SLT2 pathway involvement in the cell
cycle. Nutrients induce transcription of CLN3 via the cAMP-PKA pathway. Cln3-
Cdc28 induces formation of the Swi4-Swi6 complex in the nucleus. This complex
induces transcription of CLN1 and CLN2. Cdc28 complexes to Cln1 or Cln2 regulate
Sic1 degradation and thereby DNA replication, bud formation and spindle pole body
duplication. Cln1,2-Cdc28 also induces activation of the PKC1-SLT2 pathway and
activated Slt2 phosphorylates Swi6. Phosphorylation of Swi6 by Slt2 leads to
inhibition of the nuclear localization signal and the Swi4-Swi6 complex falls apart.
Swi6 relocates to the cytoplasm, and Swi4 alone induces transcription of cell wall
genes. A correct assembled cell wall leads to activation of Sit4, which inhibits the
PKC1-SLT2 pathway. This leads to inhibition of Swi6 phosphorylation and Swi6 is
again capable of entry into the nucleus. Via this feedback mechanism, the
production of the cell wall is kept in pace with progression through G1 phase and
entry into S phase.

Nutrient driven cell cycle progression in Saccharomyces cerevisiae
43
References
1. Hartwell, L.H. and Unger, M.W. 1977, J Cell Biol, 75, 422-35. 2. Hartwell, L.H., Culotti, J., Pringle, J.R. and Reid, B.J. 1974, Science,
183, 46-51. 3. Futcher, B. 1996, Yeast, 12, 1635-46. 4. Hereford, L.M. and Hartwell, J.H. 1974, J Mol Biol, 85, 445-61. 5. Andrews, B. and Measday, V. 1998, Trends Genet, 14, 66-72. 6. Zarzov, P., Mazzoni, C. and Mann, C. 1996, Embo J, 15, 83-91. 7. Anghileri, P., Branduardi, P., Sternieri, F., Monti, P., Visintin, R.,
Bevilacqua, A., Alberghina, L., Martegani, E. and Baroni, M.D. 1999, Exp Cell Res, 250, 510-23.
8. Oehlen, L.J. and Cross, F.R. 1994, Genes Dev, 8, 1058-70. 9. Futcher, A.B. (1993) Analysis of the cell cycle in Saccharomyces
cerevisiae. In Fantes, P.B., R. (ed.), The cell cycle, a practical approach. IRL Press at Oxford University Press, Oxford, pp. 69-92.
10. Sillje, H.H., ter Schure, E.G., Rommens, A.J., Huls, P.G., Woldringh, C.L., Verkleij, A.J., Boonstra, J. and Verrips, C.T. 1997, J Bacteriol, 179, 6560-5.
11. Cross, F.R. 1990, Mol Cell Biol, 10, 6482-90. 12. Richardson, H.E., Wittenberg, C., Cross, F. and Reed, S.I. 1989, Cell,
59, 1127-33. 13. Hadwiger, J.A., Wittenberg, C., Richardson, H.E., de Barros Lopes, M.
and Reed, S.I. 1989, Proc Natl Acad Sci U S A, 86, 6255-9. 14. Nash, R., Tokiwa, G., Anand, S., Erickson, K. and Futcher, A.B. 1988,
Embo J, 7, 4335-46. 15. Wittenberg, C., Sugimoto, K. and Reed, S.I. 1990, Cell, 62, 225-37. 16. Levine, K., Huang, K. and Cross, F.R. 1996, Mol Cell Biol, 16, 6794-
803. 17. Di Como, C.J., Chang, H. and Arndt, K.T. 1995, Mol Cell Biol, 15, 1835-
46. 18. Wijnen, H. and Futcher, B. 1999, Genetics, 153, 1131-43. 19. Espinoza, F.H., Ogas, J., Herskowitz, I. and Morgan, D.O. 1994,
Science, 266, 1388-91. 20. Koch, C., Schleiffer, A., Ammerer, G. and Nasmyth, K. 1996, Genes
Dev, 10, 129-41. 21. Breeden, L. 1996, Curr Top Microbiol Immunol, 208, 95-127. 22. Igual, J.C., Johnson, A.L. and Johnston, L.H. 1996, Embo J, 15, 5001-
13. 23. Lowndes, N.F., Johnson, A.L. and Johnston, L.H. 1991, Nature, 350,
247-50. 24. Gray, J.V., Ogas, J.P., Kamada, Y., Stone, M., Levin, D.E. and
Herskowitz, I. 1997, Embo J, 16, 4924-37. 25. Nasmyth, K. and Dirick, L. 1991, Cell, 66, 995-1013. 26. Sidorova, J.M., Mikesell, G.E. and Breeden, L.L. 1995, Mol Biol Cell, 6,
1641-58. 27. Wijnen, H., Landman, A. and Futcher, B. 2002, Mol Cell Biol, 22,
4402-18. 28. Miller, M.E. and Cross, F.R. 2000, Mol Cell Biol, 20, 542-55.

Chapter 2
44
29. Miller, M.E. and Cross, F.R. 2001, Mol Cell Biol, 21, 6292-311. 30. Hall, D.D., Markwardt, D.D., Parviz, F. and Heideman, W. 1998, Embo
J, 17, 4370-8. 31. Barbet, N.C., Schneider, U., Helliwell, S.B., Stansfield, I., Tuite, M.F.
and Hall, M.N. 1996, Mol Biol Cell, 7, 25-42. 32. Nash, R.S., Volpe, T. and Futcher, B. 2001, Genetics, 157, 1469-80. 33. Gari, E., Volpe, T., Wang, H., Gallego, C., Futcher, B. and Aldea, M.
2001, Genes Dev, 15, 2803-8. 34. Schwob, E. and Nasmyth, K. 1993, Genes Dev, 7, 1160-75. 35. Fitch, I., Dahmann, C., Surana, U., Amon, A., Nasmyth, K., Goetsch,
L., Byers, B. and Futcher, B. 1992, Mol Biol Cell, 3, 805-18. 36. Moll, T., Schwob, E., Koch, C., Moore, A., Auer, H. and Nasmyth, K.
1993, Philos Trans R Soc Lond B Biol Sci, 340, 351-60. 37. Koch, C., Moll, T., Neuberg, M., Ahorn, H. and Nasmyth, K. 1993,
Science, 261, 1551-7. 38. Epstein, C.B. and Cross, F.R. 1992, Genes Dev, 6, 1695-706. 39. Richardson, H., Lew, D.J., Henze, M., Sugimoto, K. and Reed, S.I.
1992, Genes Dev, 6, 2021-34. 40. Moll, T., Tebb, G., Surana, U., Robitsch, H. and Nasmyth, K. 1991, Cell,
66, 743-58. 41. Knapp, D., Bhoite, L., Stillman, D.J. and Nasmyth, K. 1996, Mol Cell
Biol, 16, 5701-7. 42. Toh-e, A., Tanaka, K., Uesono, Y. and Wickner, R.B. 1988, Mol Gen
Genet, 214, 162-4. 43. Madden, K., Sheu, Y.J., Baetz, K., Andrews, B. and Snyder, M. 1997,
Science, 275, 1781-4. 44. Ferrell, J.E., Jr. 2001, Nature, 414, 498-9. 45. Nishizawa, M., Kawasumi, M., Fujino, M. and Toh-e, A. 1998, Mol Biol
Cell, 9, 2393-405. 46. Verma, R., Annan, R.S., Huddleston, M.J., Carr, S.A., Reynard, G. and
Deshaies, R.J. 1997, Science, 278, 455-60. 47. Nugroho, T.T. and Mendenhall, M.D. 1994, Mol Cell Biol, 14, 3320-8. 48. Toyn, J.H., Johnson, A.L., Donovan, J.D., Toone, W.M. and Johnston,
L.H. 1997, Genetics, 145, 85-96. 49. Surana, U., Amon, A., Dowzer, C., McGrew, J., Byers, B. and Nasmyth,
K. 1993, Embo J, 12, 1969-78. 50. Glotzer, M., Murray, A.W. and Kirschner, M.W. 1991, Nature, 349,
132-8. 51. MacKay, V.L., Mai, B., Waters, L. and Breeden, L.L. 2001, Mol Cell
Biol, 21, 4140-8. 52. Hulleman, E., Bijvelt, J.J., Verkleij, A.J., Verrips, C.T. and Boonstra, J.
1999, J Cell Physiol, 180, 325-33. 53. Levin, D.E., Fields, F.O., Kunisawa, R., Bishop, J.M. and Thorner, J.
1990, Cell, 62, 213-24. 54. Irie, K., Takase, M., Lee, K.S., Levin, D.E., Araki, H., Matsumoto, K.
and Oshima, Y. 1993, Mol Cell Biol, 13, 3076-83. 55. Lee, K.S., Irie, K., Gotoh, Y., Watanabe, Y., Araki, H., Nishida, E.,
Matsumoto, K. and Levin, D.E. 1993, Mol Cell Biol, 13, 3067-75. 56. Lee, K.S. and Levin, D.E. 1992, Mol Cell Biol, 12, 172-82.

Nutrient driven cell cycle progression in Saccharomyces cerevisiae
45
57. Verna, J., Lodder, A., Lee, K., Vagts, A. and Ballester, R. 1997, Proc Natl Acad Sci U S A, 94, 13804-9.
58. Rajavel, M., Philip, B., Buehrer, B.M., Errede, B. and Levin, D.E. 1999, Mol Cell Biol, 19, 3969-76.
59. Ketela, T., Green, R. and Bussey, H. 1999, J Bacteriol, 181, 3330-40. 60. Philip, B. and Levin, D.E. 2001, Mol Cell Biol, 21, 271-80. 61. Zu, T., Verna, J. and Ballester, R. 2001, Mol Genet Genomics, 266,
142-55. 62. Paalman, J.W. 2001, ISBN 90-393-2818-8, The role of nutrients in G1
phase progression of Saccharomyces cerevisiae, University of Utrecht 63. Edgington, N.P. and Futcher, B. 2001, J Cell Sci, 114, 4599-611. 64. Baetz, K., Moffat, J., Haynes, J., Chang, M. and Andrews, B. 2001, Mol
Cell Biol, 21, 6515-28. 65. Marini, N.J., Meldrum, E., Buehrer, B., Hubberstey, A.V., Stone, D.E.,
Traynor-Kaplan, A. and Reed, S.I. 1996, Embo J, 15, 3040-52. 66. van Drogen, F. and Peter, M. 2001, Biol Cell, 93, 63-70. 67. Jung, U.S., Sobering, A.K., Romeo, M.J. and Levin, D.E. 2002, Mol
Microbiol, 46, 781-9. 68. Jung, U.S. and Levin, D.E. 1999, Mol Microbiol, 34, 1049-57. 69. Iyer, V.R., Horak, C.E., Scafe, C.S., Botstein, D., Snyder, M. and
Brown, P.O. 2001, Nature, 409, 533-8. 70. Hahn, J.S. and Thiele, D.J. 2002, J Biol Chem, 277, 21278-84. 71. Martin, H., Rodriguez-Pachon, J.M., Ruiz, C., Nombela, C. and
Molina, M. 2000, J Biol Chem, 275, 1511-9. 72. Mattison, C.P., Spencer, S.S., Kresge, K.A., Lee, J. and Ota, I.M. 1999,
Mol Cell Biol, 19, 7651-60. 73. Newcomb, L.L., Hall, D.D. and Heideman, W. 2002, Mol Cell Biol, 22,
1607-14. 74. Beck, T. and Hall, M.N. 1999, Nature, 402, 689-92. 75. Di Como, C.J. and Arndt, K.T. 1996, Genes Dev, 10, 1904-16. 76. Jiang, Y. and Broach, J.R. 1999, Embo J, 18, 2782-92. 77. Sutton, A., Immanuel, D. and Arndt, K.T. 1991, Mol Cell Biol, 11, 2133-
48. 78. Fernandez-Sarabia, M.J., Sutton, A., Zhong, T. and Arndt, K.T. 1992,
Genes Dev, 6, 2417-28. 79. Angeles de la Torre-Ruiz, M., Torres, J., Arino, J. and Herrero, E.
2002, J Biol Chem, 277, 33468-76. 80. Lee, K.S., Hines, L.K. and Levin, D.E. 1993, Mol Cell Biol, 13, 5843-53. 81. Martin-Yken, H., Dagkessamanskaia, A., Talibi, D. and Francois, J.
2002, Curr Genet, 41, 323-32. 82. Martin-Yken, H., Dagkessamanskaia, A., Basmaji, F., Lagorce, A. and
Francois, J. 2003, Mol Microbiol, 49, 23-35. 83. Paalman, J.W., Verwaal, R., Slofstra, S.H., Verkleij, A.J., Boonstra, J.
and Verrips, C.T. 2003, FEMS Yeast Res, 3, 261-8. 84. Gancedo, J.M., Clifton, D. and Fraenkel, D.G. 1977, J Biol Chem, 252,
4443-4. 85. Boles, E., Liebetrau, W., Hofmann, M. and Zimmermann, F.K. 1994,
Eur J Biochem, 220, 83-96.

Chapter 2
46
86. Daran, J.M., Dallies, N., Thines-Sempoux, D., Paquet, V. and Francois, J. 1995, Eur J Biochem, 233, 520-30.
87. Bhat, P.J. and Murthy, T.V. 2001, Mol Microbiol, 40, 1059-66. 88. Daran, J.M., Bell, W. and Francois, J. 1997, FEMS Microbiol Lett, 153,
89-96. 89. Bell, W., Klaassen, P., Ohnacker, M., Boller, T., Herweijer, M.,
Schoppink, P., Van der Zee, P. and Wiemken, A. 1992, Eur J Biochem, 209, 951-9.
90. Vuorio, O.E., Kalkkinen, N. and Londesborough, J. 1993, Eur J Biochem, 216, 849-61.
91. Vandercammen, A., Francois, J. and Hers, H.G. 1989, Eur J Biochem, 182, 613-20.
92. Londesborough, J. and Vuorio, O. 1991, J Gen Microbiol, 137 ( Pt 2), 323-30.
93. Reinders, A., Burckert, N., Hohmann, S., Thevelein, J.M., Boller, T., Wiemken, A. and De Virgilio, C. 1997, Mol Microbiol, 24, 687-95.
94. Bell, W., Sun, W., Hohmann, S., Wera, S., Reinders, A., De Virgilio, C., Wiemken, A. and Thevelein, J.M. 1998, J Biol Chem, 273, 33311-9.
95. Kopp, M., Muller, H. and Holzer, H. 1993, J Biol Chem, 268, 4766-74. 96. Kopp, M., Nwaka, S. and Holzer, H. 1994, Gene, 150, 403-4. 97. Keller, F., Schellenberg, M. and Wiemken, A. 1982, Arch Microbiol,
131, 298-301. 98. Londesborough, J. and Varimo, K. 1984, Biochem J, 219, 511-8. 99. Wolfe, K.H. and Lohan, A.J. 1994, Yeast, 10 Suppl A, S41-6. 100. Destruelle, M., Holzer, H. and Klionsky, D.J. 1995, Yeast, 11, 1015-25. 101. Farkas, I., Hardy, T.A., Goebl, M.G. and Roach, P.J. 1991, J Biol Chem,
266, 15602-7. 102. Cheng, C., Mu, J., Farkas, I., Huang, D., Goebl, M.G. and Roach, P.J.
1995, Mol Cell Biol, 15, 6632-40. 103. Francois, J. and Parrou, J.L. 2001, FEMS Microbiol Rev, 25, 125-45. 104. Hwang, P.K., Tugendreich, S. and Fletterick, R.J. 1989, Mol Cell Biol,
9, 1659-66. 105. Teste, M.A., Enjalbert, B., Parrou, J.L. and Francois, J.M. 2000, FEMS
Microbiol Lett, 193, 105-10. 106. Thevelein, J.M. and Hohmann, S. 1995, Trends Biochem Sci, 20, 3-10. 107. Gonzalez, M.I., Stucka, R., Blazquez, M.A., Feldmann, H. and
Gancedo, C. 1992, Yeast, 8, 183-92. 108. Van Aelst, L., Hohmann, S., Bulaya, B., de Koning, W., Sierkstra, L.,
Neves, M.J., Luyten, K., Alijo, R., Ramos, J. and Coccetti, P. 1993, Mol Microbiol, 8, 927-43.
109. Blazquez, M.A. and Gancedo, C. 1994, Curr Genet, 25, 89-94. 110. Neves, M.J., Hohmann, S., Bell, W., Dumortier, F., Luyten, K., Ramos,
J., Cobbaert, P., de Koning, W., Kaneva, Z. and Thevelein, J.M. 1995, Curr Genet, 27, 110-22.
111. Hohmann, S., Neves, M.J., de Koning, W., Alijo, R., Ramos, J. and Thevelein, J.M. 1993, Curr Genet, 23, 281-9.
112. Bonini, B.M., Van Vaeck, C., Larsson, C., Gustafsson, L., Ma, P., Winderickx, J., Van Dijck, P. and Thevelein, J.M. 2000, Biochem J, 350 Pt 1, 261-8.

Nutrient driven cell cycle progression in Saccharomyces cerevisiae
47
113. Thevelein, J.M. 1992, Antonie Van Leeuwenhoek, 62, 109-30. 114. Kruckeberg, A.L. 1996, Arch Microbiol, 166, 283-92. 115. Ozcan, S. and Johnston, M. 1999, Microbiol Mol Biol Rev, 63, 554-69. 116. Bisson, L.F., Coons, D.M., Kruckeberg, A.L. and Lewis, D.A. 1993, Crit
Rev Biochem Mol Biol, 28, 259-308. 117. Boles, E. and Hollenberg, C.P. 1997, FEMS Microbiol Rev, 21, 85-111. 118. Wieczorke, R., Krampe, S., Weierstall, T., Freidel, K., Hollenberg, C.P.
and Boles, E. 1999, FEBS Lett, 464, 123-8. 119. Reifenberger, E., Freidel, K. and Ciriacy, M. 1995, Mol Microbiol, 16,
157-67. 120. Diderich, J.A., Schuurmans, J.M., Van Gaalen, M.C., Kruckeberg, A.L.
and Van Dam, K. 2001, Yeast, 18, 1515-24. 121. Buziol, S., Becker, J., Baumeister, A., Jung, S., Mauch, K., Reuss, M.
and Boles, E. 2002, FEMS Yeast Res, 2, 283-91. 122. Verwaal, R., Paalman, J.W., Hogenkamp, A., Verkleij, A.J., Verrips,
C.T. and Boonstra, J. 2002, Yeast, 19, 1029-38. 123. Verwaal, R. 2003, Growth rate-regulated expression of the hexose
transporter HXT5 in Saccharomyces cerevisiae, Utrecht University 124. Mager, W.H. and De Kruijff, A.J. 1995, Microbiol Rev, 59, 506-31. 125. Ruis, H. and Schuller, C. 1995, Bioessays, 17, 959-65. 126. Siderius, M. and Mager, W.H. (1997) General stress response: in
search of a common denominator. In Mager, W.H. (ed.), Yeast Stress Responses, Landes, pp. 213-30.
127. Estruch, F. 2000, FEMS Microbiol Rev, 24, 469-86. 128. Boorstein, W.R. and Craig, E.A. 1990, Embo J, 9, 2543-53. 129. Olesen, J., Hahn, S. and Guarente, L. 1987, Cell, 51, 953-61. 130. van Helden, J., Andre, B. and Collado-Vides, J. 2000, Yeast, 16, 177-
87. 131. Martinez-Pastor, M.T., Marchler, G., Schuller, C., Marchler-Bauer, A.,
Ruis, H. and Estruch, F. 1996, Embo J, 15, 2227-35. 132. Schmitt, A.P. and McEntee, K. 1996, Proc Natl Acad Sci U S A, 93,
5777-82. 133. Gorner, W., Durchschlag, E., Martinez-Pastor, M.T., Estruch, F.,
Ammerer, G., Hamilton, B., Ruis, H. and Schuller, C. 1998, Genes Dev, 12, 586-97.
134. Thevelein, J.M., Cauwenberg, L., Colombo, S., De Winde, J.H., Donation, M., Dumortier, F., Kraakman, L., Lemaire, K., Ma, P., Nauwelaers, D., Rolland, F., Teunissen, A., Van Dijck, P., Versele, M., Wera, S. and Winderickx, J. 2000, Enzyme Microb Technol, 26, 819-25.
135. Boy-Marcotte, E., Tadi, D., Perrot, M., Boucherie, H. and Jacquet, M. 1996, Microbiology, 142 ( Pt 3), 459-67.
136. Boy-Marcotte, E., Perrot, M., Bussereau, F., Boucherie, H. and Jacquet, M. 1998, J Bacteriol, 180, 1044-52.
137. Posas, F., Chambers, J.R., Heyman, J.A., Hoeffler, J.P., de Nadal, E. and Arino, J. 2000, J Biol Chem, 275, 17249-55.
138. Rep, M., Krantz, M., Thevelein, J.M. and Hohmann, S. 2000, J Biol Chem, 275, 8290-300.
139. Yale, J. and Bohnert, H.J. 2001, J Biol Chem, 276, 15996-6007.

Chapter 2
48
140. Jelinsky, S.A., Estep, P., Church, G.M. and Samson, L.D. 2000, Mol Cell Biol, 20, 8157-67.
141. Jia, M.H., Larossa, R.A., Lee, J.M., Rafalski, A., Derose, E., Gonye, G. and Xue, Z. 2000, Physiol Genomics, 3, 83-92.
142. Alexandre, H., Ansanay-Galeote, V., Dequin, S. and Blondin, B. 2001, FEBS Lett, 498, 98-103.
143. Gasch, A.P., Spellman, P.T., Kao, C.M., Carmel-Harel, O., Eisen, M.B., Storz, G., Botstein, D. and Brown, P.O. 2000, Mol Biol Cell, 11, 4241-57.

Chapter 3
Slt2p is activated during the G1 phase in
Saccharomyces cerevisiae and is required
for proper cell cycle progression
Denise van Suylekom, Hans Paalman, Theo Verrips, Arie Verkleij,
Bruno M. Humbel and Johannes Boonstra*
Cellular Architecture and Dynamics, Utrecht University, Padualaan 8,
3584 CH Utrecht, the Netherlands

Chapter 3
50
Abstract
The use of cells synchronized by elutriation in combination with fed
batch culturing enables monitoring of cell cycle progression without
disturbance of cell cycle progression by chemicals or mutations. Culture of
elutriated, early G1 phase cells in fed batch cultures with different feeding rates
revealed a biphasic relationship between the length of the G1 phase and the
rate of galactose addition. Above a switch point, the length of the G1 phase was
slowly increased when the flux of galactose was decreased; below this switch
point, the length of the G1 phase was sharply increased when the flux of
galactose was decreased. In this study we show that this biphasic relationship
also exists for fed batch culturing with different glucose rates and that the
biphasic relationship between nutrient availability and the length of the G1
phase is dependent on the accumulation of trehalose and glycogen.
In order to place the events at the correct stage of the cell cycle, the
protein patterns of Cln1p, Cln3p, Swi4p and Swi6p were monitored. The levels
and patterns of these proteins appeared to be dependent on the length of the
G1 phase, while only minor differences in protein expression patterns arose
from culture on galactose instead of glucose.
Swi6p was phosphorylated at the end of the G1 phase. The
phosphorylation of Swi6p is dependent on the activity of the MAPK Slt2p.
Here we show that Slt2p is phosphorylated in a cell cycle dependent manner
and that this corresponded with Swi6p phosphorylation during the cell cycle.
Slt2p phosphorylation is restricted to mid G1 and S phase during short cell
cycles. Upon G1 phase elongation, Slt2p is phosphorylated at mid G1 but not
dephosphorylated after S phase entry. Deletion of SLT2 resulted in severe cell
cycle elongation. This is comparable with inhibition of MAPK activity in
mammalian cells and this is addressed in the discussion.
Introduction
The main cell cycle control point is located in the G1 phase and is
called ‘Start’ in the baker’s yeast, Saccharomyces cerevisiae. This checkpoint
Start is the point where the environmental signals are integrated and the

Slt2p activity during the G1 phase
51
decision is taken for cell cycle progression (1-3). Once a cell has passed Start, it
has committed itself to complete the entire cell cycle before it can arrest the
process. One of the environmental factors essential for cell cycle progression
concerns nutrient availability. The flux of nutrients supplied to cells has been
shown to change the length of the G1 phase, while S, G2 and M phase are kept
constant (4, 5). Our group has previously demonstrated a biphasic relationship
between the availability of galactose and the length of the G1 phase in both
diploid and haploid cells (6, 7). Elutriated, synchronous early G1 phase cells
were cultured in fed batch cultures and provided with determined fluxes of
galactose. The length of the G1 phase was relatively short with a duration of
110 minutes and increased only slowly to 160 minutes when the galactose flux
was lowered from 55 fmol cell-1 h-1 to 18 fmol cell-1 h-1. The galactose flux of 18
fmol cell-1 h-1 was a switch point as culturing of the early G1 phase cells with a
flux less than 18 fmol cell-1 h-1 resulted in a much larger increase in G1 phase
duration from 160 minutes at 18 fmol cell-1 h-1 to 520 minutes at 14 fmol cell–1
h-1. This G1 phase elongation was accompanied with the accumulation of the
reserve carbohydrates trehalose and glycogen (6, 7).
The mRNA expression of the G1 phase cyclins and of the transcription
factors SWI4 and SWI6 has been studied with this system of elutriation and
fed batch culturing with determined amounts of galactose (6). Cln3 in complex
with Cdc28 induces the transcription of the other two G1 cyclins, CLN1 and
CLN2 via the SBF transcription factor complex, which consists of SWI4 and
SWI6 (8, 9). The expression of CLN3 is comparable between different G1 phase
lengths. CLN1 and CLN2 expression are rapidly expressed in cells with a short
G1 phase, their expression is delayed in cells with an elongated G1 phase. In
both situations, the expression of CLN1 and CLN2 precedes bud formation
with 20 to 50 min. In this same fed batch system, the expression of the
transcription factors SWI4 and SWI6 was also monitored. SWI4 is transiently
expressed in cells with a short G1 phase with a peak almost simultaneously
with CLN1 and CLN2 expression. During an elongated G1 phase, SWI4
expression increases slowly and is kept constant from mid G1 phase onwards.
The correlation between SWI4 and CLN1/CLN2 expression is thereby lost
upon G1 phase elongation. SWI6 is in continuously expressed in cells with a

Chapter 3
52
short G1 phase. In cells with an elongated G1 phase, SWI6 was expressed at a
constant level, except for a peak in expression prior to S phase entry (6).
Swi6 is the regulatory component of the SBF complex, while Swi4p is
the DNA binding protein (9-14). Swi4p is localized in the nucleus in all stages
of the cell cycle, but Swi6p shuttles between the nucleus and the cytoplasm (15,
16). During the S, G2 and M phase, Swi6 is phosphorylated on its serine 160
residue and localized in the cytoplasm. In the G1 phase, unphosphorylated
Swi6p is localized in the nucleus and able to support SBF regulated
transcription (17). The proteins Cln1p and Cln2p bind Cdc28p and the activity
of the Cln1-Cdc28 and Cln2-Cdc28 complexes induce bud formation and
facilitate the initiation of DNA replication (8, 18-21). The influence of Cln1-
Cdc28 and Cln2-Cdc28 on bud formation might be executed via the mitogen
activated protein kinase (MAPK) Pkc1-Slt2 pathway. This signal transduction
cascade is involved in the maintenance of cell wall integrity and starts with
protein kinase C1 (Pkc1). Pkc1p is activated by its upstream membrane-
receptors and by Cdc28p proteins, which are probably bound to Cln1 and/or
Cln2 proteins (22-25). Bck1p is downstream of Pkc1p and upstream of the
redundant kinases Mkk1p and Mkk2p. The most downstream kinase of this
cascade is Slt2p (26-29). Deletion of members of this cascade, alone or in case
of the Mkk’s together, leads to cell lysis due to cell wall defects. These defects
can be relieved by addition of 1M sorbitol to the medium, which relieves the
cell wall stress caused by the osmolarity differences between the medium and
cell interior (27, 28, 30, 31). The MAPK Slt2p directly influences the
transcription factors Rlm1p and SBF (32, 33). Slt2p regulates the
phosphorylation of Swi6p, also on the serine residue that controls Swi6p
localization (17, 32, 33). The nuclear export of Swi6p enables Swi4p to induce
transcription of cell wall genes, which is necessary to allow growth of the
developing bud. The activity of Slt2 could therefore determine whether cells
progress through the cell cycle.
The MAPK signal transduction pathways are preserved from yeast to
mammals and are also present in plants (34, 35). The MAPK cascade is known
to be involved in cell cycle progression in various species during both G1, G2
and M phase (36-38). MAPK activity is associated with reactivation of

Slt2p activity during the G1 phase
53
quiescent (G0) cells and with the G1/S transition (39-42). The level of activity
of the MAPK cascade controls the progression through the cell cycle. Both too
high and too low levels of activity cause cell cycle arrest (reviewed in (43)). The
yeast MAPK cascade is also involved in both G1 and G2 phase progression and
the homology between yeast and mammalian MAPK is reflected in the
similarities of the processes in which the MAPKs are involved. For example,
both the yeast Pkc1 pathway and the mammalian MAPK cascade are involved
in G1 phase regulation and during the M phase in spindle pole body formation
or monitoring of its status (32, 38, 40, 44).
Although the above described yeast genes and proteins are all involved
in G1 phase progression, most of this very valuable knowledge is obtained with
experimental setups that used chemicals, temperature sensitive mutants,
deletion mutants or tagged proteins. In contrast to these artificial methods, the
use of an elutriator gives rise to a highly synchronized population of early G1
phase cells that can be studied without interference of chemicals or
redundancy mechanisms (45-47). Culturing of these elutriated, early G1 cells
with the use of a fed-batch system provides a method that enables the
manipulation of the G1 phase length and close monitoring of cell cycle
progression with a minimum of interventions. Because of the homology
between roles of mammalian and yeast MAPK during the cell cycle (e.g. (32,
38, 40, 44)), we explored the role of SLT2 in cell cycle progression. To properly
place the activity of Slt2p during the G1 phase, we first determined the
progression through the G1 phase by examination of the protein expression
patterns of Cln1p, Cln3p, Swi4p and Swi6p. Our results indicate regulated
protein expression patterns of the G1 cyclin Cln1p, which was dependent on
the length of the G1 phase and the carbon source provided. In contrast, Cln3p
protein levels were similar for all conditions tested. The transcription factor
components Swi4p and Swi6p were influenced in both amount and timing of
expression by the length of the G1 phase. Swi4p expression was higher during
short G1 phases than during elongated G1 phases, and was similar for glucose
and galactose grown cells. The Swi6p levels were different for glucose and
galactose cultured cells during short G1 phases, but similar during elongated
G1 phases. Slt2 became phosphorylated at mid G1 phase of 105 minutes and

Chapter 3
54
disappeared after S phase entry. In a G1 phase of 420 minutes, Slt2p was
phosphorylated also at mid G1 phase but remained present after S phase entry.
The phosphorylation of Slt2p is therefore dependent on the length of the G1
phase. Deletion of SLT2 revealed that the activity of Slt2p is required for
proper cell cycle progression.
Materials and methods
Strains, media and growth conditions
The S. cerevisiae strains used in this study are shown in Table 1. Strain
CEN.PK 113-7D was used as wild type in all experiments. Cells were grown at
30ºC at 180 rpm in a shaking incubator (New Brunswick Scientific, Edison,
USA) in 0.67% (w/v) yeast nitrogen base without amino acids (Difco, Sparks,
MD, USA) and a concentration or flux of the carbon source as indicated in the
text. If necessary, the appropriate amino acid was added to the medium at
20µg/ml.
Table 1: List of strains used.
Yeast strain Genotype Source CEN.PK 113-7D (K43)
MATa SUC2 MAL2-8c P. Kötter (Frankfurt, Germany)
SCU10 MATa SUC2 MAL2-8c MEL tps1::TRP1 gsy1::LEU2 gsy2::URA3
Sillje et al., 1999 (6)
Elutriation and fed batch culturing
Elutriation and subsequent fed batch experiments using glucose or
galactose as carbon source were performed as described (6, 7, 48, 49) with
some modifications. Cells were grown over-night in YNB 2% galactose and
collected by centrifugation at an OD600 of 0.5. The cell pellet was resuspended
in the same medium and the cells were sonicated and loaded into the
elutriation chamber of the elutriator rotor JE-6B (Beckman Coulter, Inc.) and
incubated at 30ºC. Small, new-born daughter cells were washed out of the
elutriator with a combination of centrifugal force and flow rates and collected
on ice, while the larger mother cells and budded cells remained in the

Slt2p activity during the G1 phase
55
elutriation chamber. After centrifugation, the early G1 phase cells were
resuspended in YNB medium containing 0.15 mM galactose. Dependent on the
experiment, the rate of glucose or galactose addition to the cells was adjusted
with a pump.
Analysis of cell cycle parameters
The cell size was monitored with an electronic particle counter
(Coulter MultiSizer II, Beckman Coulter, Inc., Fullerton, CA, USA). Cell
concentrations were calculated by Coulter® Multisizer AccuComp® (Beckman
Coulter, Inc.) with the use of the amount of sample measured. To determine G1
phase progression, the percentage of budded cells was determined by
microscopical analysis of at least 200 cells (6, 49).
Western Blot analysis
Equal amounts of cells were collected by centrifugation, washed with
ice-cold water and stored at -20°C until use. RIPA buffer (150 mM NaCl, 20
mM Tris-HCl pH 7.5, 1 mM EDTA, 1% SDS and 0.1% Triton X-100)
complemented with protease (Complete, Roche Diagnostics, Basel,
Switzerland) and phosphatases (NaF, 50mM) inhibitors was used as lysis
buffer. After SDS-PAGE, the proteins were transferred to PVDF membranes
(Roche). For detection, the membranes were blocked in PBS (137 mM NaCl, 8
mM Na2HPO4, 2.7 mM KCl, 1.5 mM KH2PO4), 0.1% Tween-20, 3.4% Protifar
Plus (Nutricia, Zoetermeer, the Netherlands) or TBS, 0.1% Tween-20, 5% BSA
(Sigma Chemical Company, St. Louis, MO, USA) and subsequently incubated
with antibody Sc6690 (goat-anti-Cln1p antibody), Sc6694 (goat-anti-Cln3p
antibody), Sc6736 (goat-anti-Swi4p antibody, Sc6736 (goat-anti-Swi6p
antibody), all obtained from Santa Cruz Biotechnology, Inc. (Santa Cruz, CA,
USA) or CST9101 (rabbit-anti-phospho-p44/p42 MAPK (Thr202/Tyr204)
antibody (Cell Signaling Technology, Inc, Danvers, MA, USA) which detects
phosphorylated Slt2p (50)). The antibodies obtained from Santa Cruz were
used at a concentration of 4 µg/ml, while the other antibodies were used at a
dilution of 1:1000. Anti-phospho p44/p42 antibody was diluted in TBS, 0.1%

Chapter 3
56
Tween-20; all other primary antibodies were diluted in PBS, 0.1% Tween-20.
After three washes of ten minutes each with PBS, 0.1% Tween-20, 3.4%
Protifar Plus or TBS, 0.1% Tween-20, the primary antibody was detected with
peroxidase-conjugated donkey-anti-goat or peroxidase-conjugated goat-anti-
rabbit (Jackson Immunoresearch Immunoresearch Antibodies Laboratories,
Inc., Westgrove, PA, USA). All secondary antibodies were used at a
concentration of 40 ng/ml in TBS, 0.1% Tween-20 or PBS, 0.1% Tween-20,
3.4% Protifar Plus. After three washes of ten minutes each with PBS, 0.1%
Tween-20, 3.4% PPotifar plus or TBS, 0.1% Tween-20, the proteins were
visualized with Enhanced Chemiluminescence (Renaissance, NEN Life Science
Products, Inc., Boston, MA, USA).
Results
Relation between the length of the G1 phase and flux of carbon source
Growth of synchronized early G1 phase cells with galactose revealed a
biphasic relationship between the length of the G1 phase and the flux of
galactose provided to these cells ((6, 7) and figure 1A). At 55 fmol galactose
cell-1 h-1, the G1 phase was 105 minutes. The G1 phase had increased slowly to
Figure 1. Relation between the duration of the G1 phase and the flux of
carbon source. Synchronous, early G1 phase wild type (♦, ■) and tps1∆gsy1∆gsy2∆
(▲) cells were synchronized by centrifugal elutriation and grown at different glucose
(♦) or galactose (■,▲) consumption rates as described in materials and methods.
The length of the G1 phase was defined as the time from initiation of carbon source
addition until 50% of the cells had formed a bud (6).

Slt2p activity during the G1 phase
57
160 minutes at 18 fmol galactose cell-1 h-1. However, the G1 phase rapidly
elongated to 420 minutes when the galactose flux was decreased to 15 fmol
cell-1 h-1. Similar results were obtained when glucose was used as a carbon
source. As shown in figure 1A, the length of the G1 phase also gradually
increased from 105 to 150 minutes when the flux of glucose was lowered from
55 fmol cell-1 h-1 to 14 fmol cell-1 h-1. When the glucose flux decreased below 14
fmol cell-1 h-1, the G1 phase rapidly elongated to 600 minutes at a glucose flux
of 7.5 fmol cell-1 h-1. The length of the G1 phase was however shorter when cells
were grown on glucose compared to cells grown on galactose with the same
flux. The switch point between short and elongated G1 phases was 14 and 18
fmol cell-1 h-1 for glucose and galactose respectively. The biphasic relation
between the length of the G1 phase and the provided carbon flux appeared a
general feature.
Accumulation of trehalose and glycogen is responsible for G1 phase
elongation
Trehalose and glycogen are accumulated during the G1 phase (6) and
the increase in accumulation of trehalose and glycogen correlates with the
increase in G1 phase duration in carbon-limited fed-batch cultures (7). To
investigate the role of trehalose and glycogen accumulation in G1 phase
elongation, we determined the length of the G1 phase in cells that are unable to
store both reserve carbohydrates. The effect of trehalose and glycogen
accumulation was studied in synchronous fed-batch cultures. Both wild type
cells and cells unable to accumulate trehalose and glycogen (SCU10) were
synchronized by elutriation in early G1 phase. Both yeast strains were grown in
fed-batch cultures at different galactose consumption rates. The wild type cells
and the SCU10 cells had a short G1 phase of 105 and 130 minutes respectively
at a galactose flux of 55 fmol cell–1 h-1 (figure 1B). The G1 phase of the wild type
cells was elongated to 520 minutes when the galactose flux was decreased to 14
fmol cell-1 h-1. The G1 phase of SCU10 cells however was approximately 120
minutes. The SCU10 cells completed their cell cycle, because daughter cells
were observed after 200 minutes of culturing. We therefore conclude that cells
are able to progress through the entire cell cycle in absence of trehalose and

Chapter 3
58
glycogen accumulation under conditions of low nutrient availability. In
addition, we conclude that the accumulation of trehalose and glycogen is
responsible for the elongation of the G1 phase in wild type cells under low
galactose consumption rates.
G1 cyclin and SBF complex protein expression during a short G1 phase
Earlier work showed the correlation between the length of the G1
phase on one hand and the mRNA expression of the different G1 cyclins
(CLN1, CLN2 and CLN3) and of the two components of the transcription factor
complex SBF (SWI4 and SWI6) on the other (6). To gain more insight in the
regulation of the G1 phase, the protein expression patterns of the G1 cyclins
Cln1p and Cln3p, and Swi4p and Siw6p were investigated during growth of
elutriated cells on glucose or galactose, and on both carbon sources with a
relative short and an elongated G1 phase. When the cells were grown with 55
fmol glucose cell-1 h-1, the G1 phase was 105 minutes (figure 1A). The protein
levels of Cln1 and Cln3 during this short G1 phase are shown in figure 2. At the
early G1 phase, Cln1p was present at a low level. The amount of Cln1p
increased during the G1 phase and remained at that level after entrance of the
Figure 2. Cell cycle distribution of Cln1p, Cln3p, Swi4p and Swi6p during
G1 phase of 105 minutes on glucose. Elutriated, early G1 phase cells were
grown with a flux of 55 fmol glucose cell-1 h-1. Cell lysates were subjected to gel
electrophoresis and western blotting as described in materials and methods. Blots
were detected with anti-Cln1p, anti-Cln3p, anti-Swi4p or anti-Swi6p specific
antibodies. The G1 and S/G2/M phase are indicated at the top of the figure. Arrows
point at the phosphorylated form of Swi6p.

Slt2p activity during the G1 phase
59
S phase. Cln3 protein was present in the early G1 phase cells, and increased
during the G1 phase. After entry into the S phase, the amount of Cln3 protein
remained constant. The increase of Cln3p expression during the G1 phase was
less intense than that of Cln1p during the same period. This indicates that the
protein expression of Cln1 is cell cycle elongated and that of Cln3p is not.
Because the transcription factor complex SBF is involved in the
regulation of transcription of the G1 phase cyclins, the protein expression
patterns of Swi4 and Swi6 were investigated. Both Swi4p and Swi6p appeared
during the first half of the G1 phase (figure 2). During the remaining part of the
G1 phase, the level of Swi4p and Swi6p increased. The amount of Swi4p
seemed to decrease when the culture reached the S phase in contrast to Swi6p
levels. A second band that migrated slower on gel was recognized by the anti-
Swi6 antibody in cells that entered late G1 phase and S phase (figure 2,
arrows). This slower migrating band might represent the phosphorylated form
of Swi6p as this was reported to migrate slower on SDS-PAGE gels (32). This
suggested Swi6p phosphorylation was consistent with the reported change in
localization of Swi6 from the nucleus to the cytoplasm at the end of the G1
phase, which is dependent on the phosphorylation of Swi6 (15, 17).
Elongation of the G1 phase influences the protein expression patterns
of Cln1, Cln3, and Swi6
Because the mRNA expression patterns of the G1 phase cyclins and of
the SBF components SWI4 and SWI6 were influenced by elongation of the G1
phase (6), the protein expression patterns of Cln1, Cln3, Swi4 and Swi6 were
investigated under similar conditions. The increase in G1 phase duration was
achieved by a decrease of the glucose flux to 9 fmol cell-1 h-1, which resulted in a
G1 phase of 420 minutes. Clnp1 was present at the beginning of the G1 phase,
and the expression remained constant during the first half of the G1 phase
(figure 3). The amount of Cln1 protein decreased during the second half of the
G1 phase and after the culture had entered the S phase, Cln1p disappeared
completely. Cln3p was also present at the early G1 phase and gradually
increased during the remainder of the G1 phase. Cln3 protein levels remained

Chapter 3
60
at that level when the culture had entered the S phase after 420 minutes
(figure 3). Swi4p was difficult to detect during the cell cycle with a short G1
phase, but it was not at all detectable when the G1 phase was elongated (data
not shown). While both Cln1p and Cln3p were detectable in the early G1 phase,
Swi6 protein was not present at the early G1 phase but appeared in the first
half of the G1 phase and Swi6p persisted during remainder of the G1 phase and
after the culture had entered the S phase (figure 3). Before the culture entered
the S phase, a second band was also recognized by the anti-Swi6 antibody,
probably representing the phosphorylated form of Swi6p (figure 3, arrows).
The slower migrating form of Swi6 disappeared between 2.5 and three hours
after the culture entered the S phase, while the faster migrating Swi6p band
was still present. This pattern corresponds to the reported localization of Swi6
in the cytoplasm during the S, G2 and M phases (15, 17).
Cln1 and Swi6 protein expression patterns during growth on
galactose
Because the G1 phase was elongated from 105 to 135 minutes when 55
fmol galactose cell-1 h-1 was used instead of 55 fmol glucose cell-1 h-1, Cln1 and
Swi6 protein levels were also determined during growth on galactose with
Figure 3. Cell cycle distribution of Cln1p, Cln3p and Swi6p during a G1
phase of 420 minutes on glucose. Elutriated, early G1 phase cells were grown
with a glucose flux of 9 fmol cell-1 h-1. Cell lysates were subjected to gel
electrophoresis and western blotting as described in materials and methods. Blots
were detected with anti-Cln1p, anti-Cln3p and anti-Swi6p specific antibodies. The
G1 and S/G2/M phase are indicated at the top of the figure. Arrows point at the
phosphorylated form of Swi6p.

Slt2p activity during the G1 phase
61
fluxes of 55 fmol cell-1 h-1 and 15 fmol cell-1 h-1 (figure 4A and B, respectively).
Culture of synchronous early G1 phase cells with 55 fmol galactose cell-1 h-1
resulted in a G1 phase of 135 minutes, while the duration of the G1 phase
increased to 420 minutes when the cells were cultured with 15 fmol galactose
cell-1 h-1 (figure 1A). Cln1 protein was already present at the early G1 phase in
the G1 phase of 135 minutes (figure 4A) and increased during the remainder of
the G1 phase. After the cells had entered S phase, the Cln1p signal remained
constant and this expression pattern was comparable to the pattern after
growth of elutriated cells on glucose with a G1 phase of 105 minutes. Swi6
protein appeared during the first half of the G1 phase and decreased when the
culture had entered S phase (figure 4A). A band of slower migrating Swi6p
appeared at the end of the G1 phase, somewhat earlier in the G1 phase as
during growth on glucose with a G1 phase of 105 minutes (figure 4A, arrows),
although the absolute time of appearance was the same. Slower migrating
Swi6p disappeared after the cells had entered the S phase, but the faster
Figure 4. Cell cycle distribution of Cln1p and Swi6p during G1 phases of
105 minutes (A) and 420 minutes (B) on galactose. Synchronized, early G1
phase cells were grown with a galactose flux of 55 fmol cell-1 h-1 (panel A) or 15 fmol
cell-1 h-1 (panel B). Cell lysates were subjected to gel electrophoresis and western
blotting as described in materials and methods. Blots were detected with anti-Cln1p,
and anti-Swi6p specific antibodies. The G1 and S/G2/M phase are marked at the
top of each panel. Arrows point at the phosphorylated form of Swi6p.

Chapter 3
62
migrating Swi6p signal remained present.
Lowering the galactose flux to 15 fmol cell-1 h-1 resulted in a G1 phase of
420 minutes (figure 1A). Cln1p was present at a low level in the early G1 phase
cells (figure 4B). The amount of Cln1 increased during the first half of the G1
phase and decreased in late G1 phase, and finally disappeared completely upon
entrance of S phase. This pattern was different from the Cln1 protein pattern
during growth on glucose with a G1 phase of 420 minutes when Cln1p was
most prominent present during the first half of the G1 phase. Swi6 protein
appeared during the first half of the G1 phase, which was similar to levels
measured in glucose and a high galactose flux cultures. Swi6 protein levels
increased during the remaining G1 phase. The cells entered S phase after 420
minutes and the amount of Swi6p decreased and disappeared completely
(figure 4B). Slower migrating Swi6p appeared at the end of the G1 phase and
this was comparable to the appearance of slower migrating Swi6p during
growth on glucose or at a high galactose flux. This second Swi6p band
increased together with the signal of faster migrating Swi6p during late G1
phase and was gone when the faster migrating band disappeared after the
culture had entered S phase. The Swi6 protein patterns corresponded to the
protein pattern during growth on glucose with a G1 phase of 420 minutes.
Therefore, we conclude that the pattern of presence of the slower migrating
Swi6 is dependent on the length of the G1 phase.
Taken together, these data indicate that progression through the G1
phase is similar for the carbon sources and G1 phase lengths investigated in
this study, although some differences result from growth on either galactose or
glucose. These differences might result from the lower energy yield of galactose
catabolism compared to glucose catabolism.
SLT2 is required for the presence of slower migrating Swi6p
In response to heat stress, Swip6p is phosphorylated by active Slt2p in
wild type cells and no phosphorylated Swi6p was detected in slt2∆ cells (32).
This phosphorylation of Swi6p halts the cell cycle in the G1 phase because the

Slt2p activity during the G1 phase
63
transcription of G1 phase specific genes is stopped. This also enables Swi4p
alone to induce transcription of cell wall genes in order to withstand the stress.
In order to confirm that the slower migrating Swi6p band observed by
Western blotting in our experiment represents the phosphorylated form of
Swi6p, we determined whether this band is present in slt2∆ cells. Wild type
cells and slt2∆ cells were cultured to the exponential phase. Half of the culture
was heat shocked for one hour at 39°C. Samples were collected and the cells
were lysed. Lysates were subjected to western blotting and Swi6 proteins were
detected. In wild type cells, a fraction of Swi6p migrated slower at 30°C and
this fraction increased upon heat shock (figure 5). In the slt2∆ cells, only the
faster migrated band of Swi6p was detected at both 30°C and 39°C. Therefore,
we conclude that the slower migrating band recognized by the anti-Swi6p
antibody represents the phosphorylated form of Swi6p.
The phosphorylation of Slt2 during the cell cycle is correlated to the
presence of slower migrating Swi6p
To investigate whether the cell cycle-dependent Swi6p
phosphorylation correlated with cell cycle-dependent activity of Slt2p,
phosphorylated Sltp2 was detected during the cell cycle. The phosphorylation
of Slt2 is coupled to its activity and active Slt2p is therefore determined by
antibody detection of phosphorylated Slt2p (51). In early G1 phase cells, Slt2
was not phosphorylated and no phosphorylated Slt2p was detected before the
mid of the G1 phase when elutriated cells were grown to a G1 phase of either
105 or 420 minutes (figure 6). During growth with a G1 phase of 105 minutes,
Figure 5. Swi6p is not phosphorylated in slt2∆∆∆∆ cells. Wild type (K43) and
slt2∆ (slt2) cells were grown to exponential phase at 30°C on medium
supplemented with 1 M sorbitol. Half of the culture of each strain was heat shocked
for 60 minutes at 39°C. Cells were collected and lysates were subjected to western
blotting as described in materials and methods.

Chapter 3
64
the Slt2p phosphorylation was high during late G1 and early S phase. The
phosphorylation of Slt2p slowly decreased and disappeared after S phase
entry. The appearance of phosphorylated Slt2p preceded the band of
phosphorylated Swi6p, while this Swi6p band persisted after the
disappearance of phosphorylated Slt2p.
During growth with a G1 phase of 420 minutes, Slt2p became also
phosphorylated at mid-G1 and the maximum signal was achieved during the
second half of the G1 phase. At the end of the G1 phase, the phosphorylation of
Slt2p decreased but remained present during the rest of the cell cycle. This
phosphorylation pattern corresponded with the presence of phosphorylated
Swi6.p Our data suggest that there might be a coupling between Swi6p
phosphorylation and Slt2p activity during the cell cycle, because the
phosphorylation of Swi6p is dependent on the activity of Slt2p (32) and
phosphorylated Slt2p preceded the presence of the phosphorylated Swi6p
band.
Deletion of SLT2 results in severe cell cycle delay
Because Slt2p phosphorylation seemed to be cell cycle regulated and
seemed to be involved in the regulation of Swi6p during the G1 phase, we
investigated whether SLT2 was required for proper cell cycle progression. The
use of chemicals such as PD098059 to inhibit Slt2p activity in wild type cells
was not possible because these chemicals do not pass the yeast cell wall.
Figure 6. Cell cycle distribution of active Slt2p (pSlt2p). Elutriated cells were
grown with a glucose flux of 55 fmol cell-1 h-1 (panel A) or 11 fmol cell-1 h-1 (panel B).
Cell lysates were subjected to gel electrophoresis and western blotting. Blots were
detected with anti-phosphorylated (active) Sltp2 specific antibodies. The G1 and
S/G2/M phase are stated at the top of each panel.

Slt2p activity during the G1 phase
65
Therefore, a slt2∆ mutant was used for this experiment. Both the mutant strain
and the wild type strain were cultured in medium supplemented with sorbitol,
which prevented cell lysis of the deletion mutant. Both strains were inoculated
at a concentration of 4*106 cells/ml and grown in batch culture for 24 hours. In
Figure 7. Cell cycle requirement of SLT2. Increase in cell concentration of wild
type (K43) and SLT2 deletion strain (∆slt2) from the beginning (0h) to after 24
hours (24h) of batch growth on medium supplemented with 1M sorbitol (A). Cell
size measurement on Coulter MultiSizer II shows no massive cell lysis after 24 hours
of batch culturing for wild type cells (red) or slt2∆ cells (green) (B). Sample amount
was selected to give comparable amplitudes in the graphs. The cell concentrations
were subsequently calculated by Coulter® Multisizer AccuComp®.

Chapter 3
66
figure 6 is shown that the wild type culture after 24 hours had a concentration
of 73*106 cells/ml and thus produced 69*106 daughter cells/ml (figure 7A). The
slt2∆ mutants strain had after 24 hours of batch growth only 8*106 cell/ml and
thus produced only 4*106 daughter cells/ml. Because no lysed cells were
observed under the microscope and cell size analysis lacked a peak in small
particles (figure 7B), no massive cell lysis had appeared in the wild type or the
slt2∆ strain. The lower amount of daughter cells after 24 hours in the slt2∆
strain was therefore not the result of massive cell lysis. After multiple (4 to 5)
days of growth, the slt2∆ strain was also able to reach a similar cell
concentration as the wild type strain and therefore we conclude that deletion
of SLT2 caused large cell cycle elongation and that SLT2 is required for proper
cell cycle progression.
In summary, our data show that the amount of carbon source provided
to early G1 phase cells determines the length of the G1 phase and thereby the
protein expression patterns observed. The second band of Swi6 protein
observed is dependent on the activity of Slt2p and was proven to be the
phosphorylated form of Swi6p. The activity of Slt2p is cell cycle regulated and
deletion of this kinase leads to a severe cell cycle progression delay.
Discussion
In this study, we investigated the progression though the G1 phase of
the cell cycle with synchronized, early G1 phase cells. With this method we
obtained synchronous cells without interfering the cell cycle with chemicals or
mutants (45-47). The use of a fed-batch system with different galactose fluxes
allowed us to regulate the length of the G1 phase (6, 7) and we show here that
the biphasic relationship between the length of the G1 phase and the carbon
flux provided to the cells is also applicable to fed-batch culturing with different
glucose fluxes. The switch point between short and elongated G1 phases was 18
fmol cell–1 h-1 for galactose (7), and 14 fmol cell-1 h-1 for glucose, reflecting the
higher energy yield of glucose compared to galactose. The G1 phase is not
elongated in cells deleted for the ability to store trehalose and glycogen. The
accumulation of trehalose and glycogen is thus responsible to elongate the G1

Slt2p activity during the G1 phase
67
phase. Under G1 phase elongation conditions, the energy stored in reserve
carbohydrates is not available for cell cycle progression, which is slowed down
as a result.
The progression through the G1 phase was monitored by
measurements of the budding percentage. The protein expression pattern of
G1 cyclins Cln1 and Cln3 demonstrated differences depending on the length of
the G1 phase. Culturing of synchronized, early G1 phase cells with 55 fmol
glucose or galactose resulted in different G1 phase lengths. This probably
explains the differences in protein expression patterns of Cln1 on glucose and
galactose. The expression of Cln3p was not altered by changes in length of the
G1 phase. The gradual increase in Cln3 protein expression correlated with the
mRNA expression data obtained by Silljé et al (6), but the pattern of Cln1
protein was not comparable to the mRNA data. The discrepancy between RNA
and protein expression patterns of CLN1 might result from residual Cln1p from
the previous cell cycle, or by more sensitive detection of Cln1p with antibodies
than the detection of CLN1 by Northern blot analysis.
The protein expression of Swi4 appeared to be higher during a G1
phase of 105 minutes than during a G1 phase of 420 minutes. The decreased
synchrony during the G1 phase of 420 might account for lowering of the Swi4p
signal. SWI4 mRNA/Swi4p is not continuously expressed during the cell cycle
and the amount of cells that express Swi4p at the times of sampling is
therefore decreased (6). The lower synchrony during elongated G1 phase might
decrease in this way the signal of the culture below the detection limit while
the total amount of Swi4p expression per cell during the period of Swi4p
expression is not altered. Swi6p was detectable during both G1 phase lengths.
The Swi6p expression was different for glucose and galactose during a G1
phase of 105 minutes. The Swi6p expression was similar on glucose and
galactose culturing with G1 phases of 420 minutes. The slower migrating Swi6
band represented the phosphorylated form of Swi6p that is known to appear at
the end of the G1 phase and persist throughout the S, G2 and M phase and only
disappears when the cells exit mitosis (15, 17). This Swi6p phosphorylation is
required for exit of Swi6p out of the nucleus at the end of the G1 phase and its
localization in the cytoplasm during the other phases of the cell cycle, and via

Chapter 3
68
this localization for proper cell cycle progression. The presence of the slower
migrating band of Swi6p corresponded with the known translocation of Swi6p
from the nucleus to the cytoplasm.
The phosphorylation and the localization of Swi6p is dependent on the
activity of the MAP kinase Slt2p (15, 17, 32). Slt2p is the executing kinase of the
Pkc1 cell wall integrity pathway which is involved in maintenance of the cell
wall (29). The activation of the Pkc1 pathway is known to be partially
dependent on the Cdc28p, but it is unknown which cyclin is involved in this
process (23). In this study we show that Slt2p is activated in mid-G1 phase
during growth on glucose for both short and elongated G1 phases. This
activation preceded the appearance of the phosphorylated Swi6p band in both
G1 phase lengths. The G1 cyclin involved in activation of Slt2p could not be
denoted from the results of our experiments because both Cln1p and Cln3p
proteins were already present before phosphorylated Slt2p appeared. The
activity of Slt2p was shown to be critical for proper cell cycle progression, as
deletion of SLT2 resulted in severe cell cycle elongation. The percentage of
budded cells increased in the SLT2 deletion mutant compared to the
percentage of budded wild type cells during the exponential phase in
asynchronous batch growth (data not shown). This indicates that the slt2∆
cells arrest at the second cell cycle restriction point, in the G2 phase, called the
cell morphology checkpoint.
The MAPK cascades are preserved from yeast to mammals (34, 35). In
mammalian cells, inhibition of the p42/p44 MAPK by the use of antisense
constructs, overexpresssion of kinase inactive mutants or inactivation by MPK-
1 blocks DNA synthesis and cell proliferation (41, 42).However, inhibition of
MAPK by the use of MEK inhibitor PD-98059 severely inhibited DNA
synthesis but did not block DNA synthesis completely (40). High-level activity
of p42/p44 MAPK results in cell cycle arrest (52, 53). In S. cerevisiae,
inhibition of Slt2 activity also results in severe cell cycle elongation. Although
no data are published about the direct link between increased Slt2 activity and
cell cycle progression, elevated Slt2 activity after stress is known to correlate
with cell cycle delay. E.g. mild heat shock and osmotic shock are known to
delay both bud formation and nuclear division and both stresses are

Slt2p activity during the G1 phase
69
demonstrated to increase Slt2 activity (54-57). Thus, the regulation of cell cycle
progression might be conserved from yeast to mammals for the role of MAPK.
Not only is the activity of MAPK required for cell cycle progression in both
yeast and mammals, overactivity of MAPK is correlated with cell cycle delay.
On the other hand, the activation of Slt2p is considered to be a side-
effect of trehalose accumulation under stress conditions. Heat shock results in
accumulation of trehalose, which increases the internal osmolarity of the cell.
The activation of Slt2 can under these conditions be prevented by osmotic
stabilization of the medium and the activity of Slt2p is also decreased in
mutants unable to accumulate trehalose in which the internal pressure is not
elevated during heat stress (58). It is however not known whether the cell cycle
is elongated in these mutants or under the osmotic stabilizing conditions.
More research is therefore necessary to investigate the possibility of secondary
Slt2p activation under stress conditions. The activity of Slt2p is required for
normal cell cycle progression, but the prolonged activity under nutrient
limitation might thus be caused by the accumulation of trehalose.
In general, the present study shows the correlation between G1 phase
length and the expression of Cln1p, Cln3p and Swi6p, and of Slt2p
phosphorylation. The expression of the different proteins is positively
regulated by the availability of nutrients, while the phosphorylation of Slt2p is
increased upon nutrient deprivation (59-63). The expression of these proteins
in turn determines the length of the G1 phase and this report demonstrates the
expression patterns of these proteins during short and elongated G1 phases.
The phosphorylation of Slt2p is regulated by the length of the G1 phase and is
required for proper cell cycle progression.

Chapter 3
70
References
1. Hartwell, L.H., Culotti, J., Pringle, J.R. and Reid, B.J. 1974, Science, 183, 46-51.
2. van Suylekom, D., Verwaal, R., Winter, V., Verrips, T. and Boonstra, J. 2003, Recent Research Developments in Cell Biology, 1, 99-119.
3. Wittenberg, C. and Flick, K. (2003) Cell Cycle Regulation During G1 Phase in Yeast: Decisions, Decisions, Decisions. In Boonstra, J. (ed.), G1 Phase Progression. Eurekah, Vol. 8.
4. Carter, B.L. and Jagadish, M.N. 1978, Exp. Cell Res., 112, 15-24. 5. Johnston, G.C., Singer, R.A., Sharrow, S.O. and Slater, M.L. 1980, J.
Gen. Microbiol., 479-84. 6. Silljé, H.H., ter Schure, E.G., Rommens, A.J., Huls, P.G., Woldringh,
C.L., Verkleij, A.J., Boonstra, J. and Verrips, C.T. 1997, J. Bacteriol., 179, 6560-5.
7. Paalman, J.W., Verwaal, R., Slofstra, S.H., Verkleij, A.J., Boonstra, J. and Verrips, C.T. 2003, FEMS Yeast Res, 3, 261-8.
8. Dirick, L., Bohm, T. and Nasmyth, K. 1995, EMBO J., 14, 4803-13. 9. Andrews, B.J. and Herskowitz, I. 1989, Cell, 57, 21-9. 10. Koch, C., Moll, T., Neuberg, M., Ahorn, H. and Nasmyth, K. 1993,
Science, 261, 1551-7. 11. Andrews, B.J. and Herskowitz, I. 1989, Nature, 342, 830-3. 12. Sidorova, J. and Breeden, L. 1993, Mol. Cell. Biol., 13, 1069-77. 13. Andrews, B.J. and Moore, L.A. 1992, Proc. Natl. Acad. Sci. U. S. A., 89,
11852-6. 14. Verma, R., Smiley, J., Andrews, B. and Campbell, J.L. 1992, Proc. Natl.
Acad. Sci. U. S. A., 89, 9479-83. 15. Queralt, E. and Igual, J.C. 2003, Mol. Cell. Biol., 23, 3126-40. 16. Baetz, K. and Andrews, B. 1999, Mol. Cell. Biol., 19, 6729-41. 17. Sidorova, J.M., Mikesell, G.E. and Breeden, L.L. 1995, Mol. Biol. Cell,
6, 1641-58. 18. Cherkasova, V., Lyons, D.M. and Elion, E.A. 1999, Genetics, 151, 989-
1004. 19. Oehlen, L.J., Jeoung, D.I. and Cross, F.R. 1998, Mol. Gen. Genet., 258,
183-98. 20. Ferrell, J.E., Jr. 2001, Nature, 414, 498-9. 21. Verma, R., Annan, R.S., Huddleston, M.J., Carr, S.A., Reynard, G. and
Deshaies, R.J. 1997, Science, 278, 455-60. 22. Gray, J.V., Ogas, J.P., Kamada, Y., Stone, M., Levin, D.E. and
Herskowitz, I. 1997, EMBO J., 16, 4924-37. 23. Marini, N.J., Meldrum, E., Buehrer, B., Hubberstey, A.V., Stone, D.E.,
Traynor-Kaplan, A. and Reed, S.I. 1996, EMBO J., 15, 3040-52. 24. Rajavel, M., Philip, B., Buehrer, B.M., Errede, B. and Levin, D.E. 1999,
Mol. Cell. Biol., 19, 3969-76. 25. Verna, J., Lodder, A., Lee, K., Vagts, A. and Ballester, R. 1997, Proc.
Natl. Acad. Sci. U. S. A., 94, 13804-9. 26. Levin, D.E., Fields, F.O., Kunisawa, R., Bishop, J.M. and Thorner, J.
1990, Cell, 62, 213-24.

Slt2p activity during the G1 phase
71
27. Irie, K., Takase, M., Lee, K.S., Levin, D.E., Araki, H., Matsumoto, K. and Oshima, Y. 1993, Mol. Cell. Biol., 13, 3076-83.
28. Lee, K.S. and Levin, D.E. 1992, Mol. Cell. Biol., 12, 172-82. 29. Lee, K.S., Irie, K., Gotoh, Y., Watanabe, Y., Araki, H., Nishida, E.,
Matsumoto, K. and Levin, D.E. 1993, Mol. Cell. Biol., 13, 3067-75. 30. Costigan, C. and Snyder, M. 1994, Mol. Gen. Genet., 243, 286-96. 31. Costigan, C., Gehrung, S. and Snyder, M. 1992, Mol. Cell. Biol., 12,
1162-78. 32. Madden, K., Sheu, Y.J., Baetz, K., Andrews, B. and Snyder, M. 1997,
Science, 275, 1781-4. 33. Watanabe, Y., Irie, K. and Matsumoto, K. 1995, Mol. Cell. Biol., 15,
5740-9. 34. Ligterink, W. and Hirt, H. 2001, Int. Rev. Cytol., 201, 209-75. 35. Widmann, C., Gibson, S., Jarpe, M.B. and Johnson, G.L. 1999, Physiol.
Rev., 79, 143-80. 36. Takenaka, K., Gotoh, Y. and Nishida, E. 1997, J. Cell Biol., 136, 1091-7. 37. Tachibana, K., Machida, T., Nomura, Y. and Kishimoto, T. 1997,
EMBO J., 16, 4333-9. 38. Wang, X.M., Zhai, Y. and Ferrell, J.E., Jr. 1997, J. Cell Biol., 137, 433-
43. 39. Ladha, M.H., Lee, K.Y., Upton, T.M., Reed, M.F. and Ewen, M.E. 1998,
Mol. Cell. Biol., 18, 6605-15. 40. Hulleman, E., Bijvelt, J.J., Verkleij, A.J., Verrips, C.T. and Boonstra, J.
1999, J. Cell. Physiol., 180, 325-33. 41. Pages, G., Lenormand, P., L'Allemain, G., Chambard, J.C., Meloche, S.
and Pouyssegur, J. 1993, Proc. Natl. Acad. Sci. U. S. A., 90, 8319-23. 42. Brondello, J.M., McKenzie, F.R., Sun, H., Tonks, N.K. and Pouyssegur,
J. 1995, Oncogene, 10, 1895-904. 43. Hulleman, E. and Boonstra, J. 2001, Cell. Mol. Life Sci., 58, 80-93. 44. Khalfan, W., Ivanovska, I. and Rose, M.D. 2000, Genetics, 155, 1543-
59. 45. Elliott, S.G. and McLaughlin, C.S. 1978, Proc. Natl. Acad. Sci. U. S. A.,
75, 4384-8. 46. Johnston, L.H. and Johnson, A.L. 1997, Methods Enzymol., 283, 342-
50. 47. Futcher, B. 1999, Methods Cell Sci, 21, 79-86. 48. Verwaal, R., Paalman, J.W., Hogenkamp, A., Verkleij, A.J., Verrips,
C.T. and Boonstra, J. 2002, Yeast, 19, 1029-38. 49. Woldringh, C.L., Huls, P.G. and Vischer, N.O. 1993, J. Bacteriol., 175,
3174-81. 50. Martin, H., Rodriguez-Pachon, J.M., Ruiz, C., Nombela, C. and
Molina, M. 2000, J. Biol. Chem., 275, 1511-9. 51. de Nobel, H., Ruiz, C., Martin, H., Morris, W., Brul, S., Molina, M. and
Klis, F.M. 2000, Microbiology, 146 ( Pt 9), 2121-32. 52. Woods, D., Parry, D., Cherwinski, H., Bosch, E., Lees, E. and
McMahon, M. 1997, Mol. Cell. Biol., 17, 5598-611. 53. Sewing, A., Wiseman, B., Lloyd, A.C. and Land, H. 1997, Mol. Cell.
Biol., 17, 5588-97.

Chapter 3
72
54. Chowdhury, S., Smith, K.W. and Gustin, M.C. 1992, J. Cell Biol., 118, 561-71.
55. Delley, P.A. and Hall, M.N. 1999, J. Cell Biol., 147, 163-74. 56. Kamada, Y., Jung, U.S., Piotrowski, J. and Levin, D.E. 1995, Genes
Dev., 9, 1559-71. 57. Garcia-Rodriguez, L.J., Valle, R., Duran, A. and Roncero, C. 2005,
FEBS Lett., 579, 6186-90. 58. Mensonides, F.I., Brul, S., Klis, F.M., Hellingwerf, K.J. and Teixeira de
Mattos, M.J. 2005, Appl. Environ. Microbiol., 71, 4531-8. 59. Gallego, C., Gari, E., Colomina, N., Herrero, E. and Aldea, M. 1997,
EMBO J., 16, 7196-206. 60. Parviz, F. and Heideman, W. 1998, J. Bacteriol., 180, 225-30. 61. Parviz, F., Hall, D.D., Markwardt, D.D. and Heideman, W. 1998, J.
Bacteriol., 180, 4508-15. 62. Torres, J., Di Como, C.J., Herrero, E. and De La Torre-Ruiz, M.A.
2002, J. Biol. Chem., 277, 43495-504. 63. Flick, K., Chapman-Shimshoni, D., Stuart, D., Guaderrama, M. and
Wittenberg, C. 1998, Mol. Cell. Biol., 18, 2492-501.

Chapter 4
Involvement of HXT5 in trehalose
accumulation and in glucose transport after
gluconeogenesis in Saccharomyces cerevisiae
Denise van Suylekom#, René Verwaal‡, Elly van Donselaar#, Theo
Verrips#, Arie Verkleij#, Bruno M. Humbel# and Johannes
Boonstra#
#Cellular Architecture and Dynamics, Utrecht University, Padualaan 8,
3584 CH Utrecht, the Netherlands
‡Section Fungal Genomics, Dept. of Microbiology, Wageningen
University, Drijenlaan 2, 6703 HA Wageningen, the Netherlands

Chapter 4
74
Abstract
Hexose transporter (Hxt) proteins facilitate the uptake of glucose in
Saccharomyces cerevisiae. The expression of the major hexose transporters
(HXT1-4 and HXT6/7) is regulated by the extracellular glucose concentration,
while the expression of HXT5 is regulated by the growth rate. The
accumulation of trehalose is important for stress-resistance and this
accumulation is regulated by the growth rate of the cells. This study shows that
especially the expression of HXT5 correlated with the accumulation of
trehalose during batch growth, fed-batch culturing and in continuous cultures,
but none of the hexose transporters was absolutely required for trehalose
accumulation. In addition, Hxt5p coimmunoprecipitated with Tps1p after
addition of glucose to starved cells, suggestion that Hxt5p forms a functional
complex with Tps1. Surprisingly, Hxt5p was mainly localized to the
endoplasmic reticulum during the stationary phase and only a small fraction
was localized to the plasma membrane. Homology with a glucose transporter
in the endoplasmic reticulum of mammalian cells suggests a role for HXT5 in
gluconeogenesis.
Introduction
Hexose transporter (Hxt) proteins facilitate the uptake of glucose in
Saccharomyces cerevisiae. The hexose transporter family consists of 20
members, of which HXT1-4 and HXT6/7 are the major hexose transporters.
The expression of the major hexose transporters is regulated by the
extracellular glucose concentration (2-9). In a strain deleted for HXT1-7,
growth on glucose requires at least one of the major hexose transporters (10).
Besides the major hexose transporters, only expression of HXT5 under its own
promoter enables growth on glucose, although only at low growth rate (11).
Therefore, HXT5 was initially not identified as capable of restoring growth on
glucose when HXT5 was the only hexose transporter expressed in a HXT1-7
null mutant (11).Overexpression of HXT8-11 or HXT13-17 restores growth on
glucose as well in a strain deleted for HXT1-17 and GAL2 (12).

Hxt5p plays a role in trehalose accumulation and gluconeogenesis
75
HXT1 expression is induced when the glucose concentration in the
medium is high and is characterized as a low-affinity hexose transporter (3, 9).
Both HXT2 and HXT4 become expressed when the glucose concentration is
low and are considered to be high-affinity hexose transporters (3, 13). The
expression of HXT3 is not dependent on the concentration, but only on the
presence of glucose and Hxt3p is defined as a hexose transporter with
intermediate affinity (3, 4, 6). HXT6 and HXT7 are induced under low glucose
conditions, and are not expressed after glucose depletion. Although HXT6 and
HXT7 only differ in two amino acids within the encoded proteins, HXT7
expression levels are higher than those of HXT6 (2, 7).
The expression of HXT5 is not regulated by the extracellular glucose
concentration, but by the growth rate of the cells (14). Studies of the promoter
of HXT5 revealed two stress-responsive elements (STREs), two HAP2/3/4/5p
binding sites (HAP elements) and one post-diauxic shift (PDS) element (15).
STRE elements are involved in stress responses (16) and one of the STRE
elements in the HXT5 promoter was shown to be required for HXT5
expression (15). HAP elements are implicated to positively influence
transcription during growth on non-fermentable carbon sources (17-20) and
the HAP elements in the HXT5 promoter indeed seem to be involved in
transcription after glucose depletion on batch growth or during growth on
non-fermentable carbon sources (15). PDS elements are involved in gene
expression during the diauxic shift and are regulated by the Ras/cAMP
pathway (21). The PDS element in the HXT5 promoter is suggested to regulate
expression during growth on ethanol (15).
Glucose that is transported into the cell is immediately phosphorylated
by a hexokinase (Hxk) to give glucose-6-phosphate (22). Dependent on the
conditions of the cells, glucose-6-phosphate enters glycolysis or is used to
synthesize the reserve carbohydrates trehalose and glycogen (23-25). Typically,
the growth rate of the cells determines whether reserve carbohydrates are
stored or not, and a lower growth rate results in higher accumulation of
trehalose and glycogen (1, 26, 27).
Both reserve carbohydrates are involved in cell survival; deletion of the
ability to store one of them leads to a minor decrease in cell survival, but the

Chapter 4
76
inability to store both drastically lowers the percentage of viable cells after an
incubation of several days (27, 28). The accumulation of glycogen can be
abolished by deletion of GSY1 together with GSY2, while trehalose is no longer
stored upon deletion of TPS1 (29-32). The other two members of the trehalose
accumulation (TPS) complex, TPS3 and TSL1, appear to serve as regulators
and are not required for trehalose accumulation (33). Deletion of the ability to
store trehalose by knocking out TPS1 caused an immediate arrest of growth of
these cells on glucose or fructose, irrespective on the ability to accumulate
glycogen (34, 35). It has been suggested that Tps1p itself, or the product
trehalose-6-phosphate, inhibits the import of glucose into the cell by
regulating Hxt proteins or the influx of glucose into the glycolysis by
modulation of the hexokinases (29, 33, 36). The importance of Tps1action is
reflected by the increase in early glycolysis intermediates and the depletion of
ATP when glucose is added to tps1∆ cells. This overflow of the glycolysis and
depletion of ATP renders it impossible for the cell to generate energy (ATP)
and the cells become literally energy exhausted (34-38).
Considering the proposed interaction of Tps1p with one or more
hexose transporters (36) and the growth defect of a tps1∆ strain on glucose
(34-38), we investigated the specific involvement of the hexose transporters in
trehalose accumulation. Because the precursor of trehalose is glucose, the
major hexose transporters were included in this study together with HXT5
which is reported to be expressed under trehalose synthesis conditions. The
data presented in this study show that none of the major hexose transporters
or HXT5 was specifically involved in the accumulation of trehalose. HXT5 was
the only hexose transporter always expressed under trehalose accumulating
conditions during batch and fed-batch culturing and in continuous cultures.
Hxt5p coimmunoprecipitated with Tps1after glucose addition to stationary
phase cells. This suggested a role of the Hxt5-Tps1 interaction after the
addition of glucose to starved cells. In this context, the existence of a glucose-
response complex (GRC) is suggested and discussed.
Surprisingly, electron microscopy on cryosections labelled for Hxt5-
HA revealed that Hxt5-HA was localized mainly to the endoplasmic reticulum
during the stationary phase and only a small fraction was localized to the

Hxt5p plays a role in trehalose accumulation and gluconeogenesis
77
plasma membrane. In mammalian cells, a glucose transporter is also localized
to the endoplasmic reticulum and this transporter is involved in
gluconeogenesis. A possible role for Hxt5p in gluconeogenesis is therefore
addressed in the discussion.
Materials and Methods
Strains, media and growth conditions
The S. cerevisiae strains used in this study are indicated in Table 1.
Cells were grown at 30°C at 180 rpm in a shaking incubator (New Brunswick
Scientific, Edison, NJ, USA) in 0.67% (w/v) yeast nitrogen base without amino
acids (Difco, Sparks, MD, USA) and 2% (w/v) of the carbon source as indicated
in the text.
Continuous culture experiments were performed as described
previously (14, 39). Cultures were started in EGLI medium as described by
Meijer et al., (39) and grown over night. Continuous culturing was then
started. The NH4+ concentration was adapted to 1.5 g.l-1 and the glucose
concentration in the feed was 200mM to ensure nitrogen limitation. Samples
of steady state situations were taken as described (39).
Fed batch experiments using galactose as carbon source were
performed as described (1, 14). In short, cells were grown in YNB medium
without amino acids and glucose as carbon source. The initial cell
concentration was 1.2*107 cells.ml-1, and the glucose concentration in the
medium was initially 0.05 mM. Glucose dissolved in YNB medium was
administered continuously to the cells at rates of 10 fmol and 50 fmol cell-1 h-1
respectively. Growth of the culture was monitored by measuring of the OD600
at intervals during the experiments.
Northern blot analysis
Total RNA was isolated, separated on agarose gels and transferred to
Hybond-N membrane (Amersham Pharmacia Biotech, Buckinghamshire,
United Kingdom) as described earlier (14). Oligonucleotides directed against
HXT1-7 (4) were labelled as described (14). A probe against U2 was obtained

Chapter 4
78
by PCR, using plasmid pRS313U2 as template and primers 5’-
GTTTTGCAAGGAAAGG-3’ and 5’-CGAGAGAAACATCAAGCG-3’. The probe
was labelled with [α-32P]dCTP using prime-a-gene labelling system according
to manufacturer’s protocol (Promega, Madison, Wisconsin, USA).
Hybridization and washing was performed as described earlier (14).
Table 1: List of strains used:
Yeast strain Genotype Source
CEN.PK 113-7D
(wild type)
MATa SUC2 MAL2-8c P. Kötter
(Frankfurt, Germany)
CEN.PK 113-3C
∆tps1
MATa SUC2 MAL2-8c
tps1::TRP1
(28)
CEN.PK 441-3B
∆hxt1
MATa SUC2 leu2-3,112,
hxt1::loxP
P. Kötter
(Frankfurt, Germany)
CEN.PK 441-3B
∆hxt2
MATa SUC2 leu2-3,112,
hxt2::loxP
P. Kötter
(Frankfurt, Germany)
CEN.PK 441-3B
∆hxt3
MATa SUC2 leu2-3,112,
hxt3::loxP
P. Kötter
(Frankfurt, Germany)
CEN.PK 441-3B
∆hxt4
MATa SUC2 leu2-3,112,
hxt4::loxP
P. Kötter
(Frankfurt, Germany)
MSY1
(∆hxt5)
MATa MAL2-8c SUC2 leu2-
3,112 ∆hxt5::LEU2
(11)
CEN.PK 441-3B
∆hxt6/7
MATa SUC2 leu2-3,112,
hxt6/7::loxP
P. Kötter
(Frankfurt, Germany)
KY98
(Hxt5-GFP)
MATa, SUC2, MAL2-8c ,
HXT5::GFP
A. Kruckeberg
(Amsterdam, the
Netherlands)
JBY20
(Hxt5-HA)
MATa, SUC2, MAL2-8c, ura3,
HXT5::HA
Jessica Becker
(Düsseldorf, Germany)

Hxt5p plays a role in trehalose accumulation and gluconeogenesis
79
Determination of trehalose and glucose levels
The amount of accumulated trehalose and the concentration of glucose
in the medium were determined enzymatically as described previously (1).
Western blot analysis
Equal amounts of cells were collected by centrifugation, washed with
ice-cold water and stored at -20°C until use. RIPA buffer (150 mM NaCl, 20
mM Tris-HCl pH 7.5, 1 mM EDTA, 1% SDS and 0.1% Triton X-100)
complemented with protease inhibitors (Complete, Roche Diagnostics, Basel,
Switzerland) was used as lysis buffer and cells were lysed by vigorously shaking
with 0.45 mm glass beads in a Mini BeadBeater 8 (Glen Mills Inc., New Jersey,
USA). After SDS-PAGE, the proteins were transferred to PVDF membranes
(Roche Diagnostics). For detection, the membranes were blocked in PBS pH
7.4 (137 mM NaCl, 2.7 mM KCl, 8.1 mM Na2HPO4, 1.5 mM KH2PO4), 0.1%
Tween-20, 3.4% Protifar Plus (Nutricia, the Netherlands) and subsequently
incubated with anti-Hxt1, anti-Hxt3, anti-Tps1 rabbit polyclonal or anti-HA
(12CA, Roche Diagnostics) mouse monoclonal antibodies. The antibodies were
used at a dilution of 1:500, diluted in PBS, 0.1% Tween-20, 3.4% protifar plus.
After three washes of ten minutes each with PBS, 0.1% Tween-20, 1% protifar
plus, the primary antibody was detected with peroxidase-conjugated goat-anti-
rabbit or rabbit –anti-mouse (Jackson Immunoresearch Antibodies
Laboratories, Inc., Westgrove, PA, USA)) at a dilution of 1:10,000 in TBS, 0.1%
Tween-20 or PBS, 0.1% Tween-20. After three washes of ten minutes each with
PBS, 0.1% Tween-20, 1% protifar plus, the proteins were visualized with
Enhanced Chemiluminescence (Renaissance, NEN Life Science Products, Inc.,
Boston, MA, USA).
Immunoprecipitation
Equal amounts of Hxt5-GFP expressing cells were washed once with
ice-cold H2O and cells were collected by centrifugation. Cells were suspended
in 500 µl PBS supplemented with complete protease inhibitors (Roche) and 20
mM NaF, and subsequently the cells were lysed by vigorously shaking with

Chapter 4
80
0.45 mm glass beads in a Mini BeadBeater 8for 1.5 min. 500 µl PBS containing
protease inhibitors, 20 mM NaF and 1% Tween-20 (Sigma Chemical Company,
St. Louis, MO, USA) was added, the sample was mixed and 800 µl lysate was
collected. Tps1 was immunoprecipitated from pre-cleared lysates with the use
of anti-Tps1 rabbit polyclonal antibody coupled to protein G sepharose beads
(Sigma Chemical Company). After binding, the beads were washed four times
with PBS containing protease inhibitors, 20 mM NaF and 0.5% Tween-20. 1.2x
reducing sample buffer was added and immunoprecipitates were separated on
SDS-PAGE gel. The proteins were transferred to PVDF membrane (Roche
Diagnostics) and detected with anti-GFP mouse monoclonal antibody (Roche
Diagnostics) at a dilution of 1:500 and rabbit-anti-mouse peroxidase (Jackson
Immunoresearch) at a dilution of 1:10,000, and visualized with Enhanced
Chemiluminescence (Renaissance). Blocking, washing and buffers are
described above under Western blotting.
Electron microscopy on cryosections
Cells were fixed for 15 min at 30°C and 180 rpm by adding an equal
volume of two times concentrated fixative (4% formaldehyde, 0.4%
glutaraldehyde in 0.1 M PHEM buffer (60 mM Pipes, 25 mM Hepes, 10 mM
EGTA and 2 mM MgCl2), pH 6.9). Cells were collected by centrifugation for 5
minutes at 4000 rpm and fixation was continued for 45 min at room
temperature with fresh fixative (1% formaldehyde, 0.1% glutaraldehyde in 0.1
M PHEM buffer). Then the cells were washed with 0.1 M PHEM buffer and
resuspended in 1% formaldehyde in 0.1 M PHEM buffer, and stored at 4°C
until further use. The cells were washed three times with 0.1 M PHEM buffer
and incubated for one hour at room temperature in 1% NaIO4 in 0.1 M PHEM
buffer,. Subsequently, the cells were washed three times with 0.1 M PHEM
buffer and embedded in 12% gelatin in 0.1 M PHEM buffer at 37°C. Cells were
centrifuged for two minutes at 15000 rpm and gelatin was solidified on ice. 1
mm3 cubes were cut, which were impregnated overnight on a turning wheel
with 2.3 M sucrose at 4°C (40). With a cryoultramicrotome (UC6 FC6, Leica,
Microsystems,, Vienna, Austria), 50-55 nm sections were cut for electron

Hxt5p plays a role in trehalose accumulation and gluconeogenesis
81
microscopy. Sections were picked up with 1.15 M sucrose/0.1% methylcellulose
in 0.05M PHEM buffer, pH 6.9 and dipped on formvar/carbon coated Cu
grids (Stork Veco B.V., Eerbeek, the Netherlands) for electron microscopy.
Mounted sections of JBY20 and K43 cells were washed five times with
PBS, pH 7.4 (137 mM NaCl, 2.7 mM KCl, 8.1 mM Na2HPO4, 1.5 mM KH2PO4)/
0.02 M Glycine. The sections were blocked by one incubation in PBS, 1% BSA
(Sigma) and subsequently incubated with mouse 12CA5 (Roche Diagnostics)
diluted 1:30 in PBS, 1% BSA for one hour. The labeled sections were washed
five times two minutes with PBS, 0.1% BSA and incubated for 20 minutes with
rabbit-anti-mouse IgG (Dako Denmark A/S, Glostrup, Denmark,) diluted
1:250 in PBS, 1% BSA. The sections were washed five times two minutes with
PBS, 0.1% BSA and then incubated 20 minutes with protein A 10 nm gold
(Dept. Cell Biology, University Medical Centre Utrecht, the Netherlands)
diluted 1:90 in PBS, 1% BSA. The sections were then rinsed three times shortly
and seven times for two minutes with PBS. The labeled sections were fixed for
five minutes in PBS, 1% glutaraldehyde and subsequently washed ten times
with aqua dest. This was followed by an incubation of five minutes in uranyl
oxalate, pH 7.4 (41) and two washes with aqua dest. Two rinses on ice on
uranylacetate, methylcellulose, pH 4.5 followed and the incubation was
continued with fresh solution for 5 minutes on ice. Excess of fluid was then
drained off, and the sections were dried at room temperature.
The sections were observed with a JEOL 1010 EX transmission
electron microscope (JEOL, Tachikawa, Japan) at 80 kV and images were
recorded on Agfa Scientia sheet film. The scanned pictures were processed
with Photoshop 5.5.
Results
Expression of HXT1-5, HXT7 and TPS1 during batch culture
Recently, we have suggested that Hxt5p was a good candidate for
regulation of Tps1p activity and consequently of trehalose synthesis (14). To
investigate a possible relationship between expression of HXT5 or one of the
major hexose transporters, and the expression of TPS1 or trehalose

Chapter 4
82
accumulation, we determined the expression of HXT1-7 and TPS1, and the
accumulation of trehalose during batch growth on glucose at an initial
concentration of 100 mM (figure 1A). HXT1, HXT3 and HXT4 were expressed
from 1 to 13 hours after start of the batch growth. When the glucose
Figure 1. Trehalose accumulation during batch growth correlates with
HXT5 and HXT7 expression and is continued in the stationary phase.
Batch growth was inoculated at t=0h on YNB medium containing 2% glucose. Cells
were collected each hour and Northern blot analysis of expression of HXT1-5, HXT7
and TPS1 is presented in panel A. The growth of the culture was monitored by
measurement of OD600 (B, ▲). Trehalose accumulation was determined
enzymatically as described by Silljé et al., (1) (B, ■).
HXT5
1 2 3 4 5 6 7 8 9 10 11 12 13 14 15 16 17 18 Time (hr)A.
U2
Time (hr)
OD
600
HXT1
HXT3
HXT7
B.
HXT2
HXT4
TPS1
0.1
1
10
1 2 3 4 5 6 7 8 9 10 11 12 13 14 15 16 17 180
1
2
3
4
5
6
Treh
alose accumulation
(mM
glucose eq/OD
600
units)

Hxt5p plays a role in trehalose accumulation and gluconeogenesis
83
concentration in the medium had declined below 10 mM, expression of HXT1,
HXT3 and HXT4 was repressed. HXT2 was only expressed at 1 hour after the
start of batch growth when the extracellular glucose concentration was still
above 100 mM. HXT5 expression was induced from 9 hours after the
beginning of batch growth at an extracellular glucose concentration of 35 mM
and was further induced after 13 hours after the initiation of batch growth.
This additional HXT5 expression coincided with exhaustion of glucose in the
medium at 15 hours after the start of the batch growth. The expression of
HXT5 was previously shown to depend on the growth rate of the cells (14). At
the beginning of HXT5 expression, the growth rate of the cells had decreased
as the culture entered the stationary phase (Fig. 1B). HXT6 mRNA was not
detectable in this experiment (data not shown). HXT7 was expressed between
9 and 14 hours after the start of batch growth, which is during the growth
phase with low glucose concentrations in the medium (decreasing from 47 mM
at 9 hours to 4 mM at 14 hours). TPS1 was already expressed at a low level at
the beginning of the experiment; the expression of TPS1 increased 5 hours
after the start of batch growth and was further increased from 9 to 14 hours
after the initiation of batch growth. TPS1 expression was reduced at later time
points but remained present at similar levels as compared to 5 to 8 hours after
the start of batch growth. Trehalose was however only accumulated after 10
hours after the initiation of batch growth, and this accumulation continued
when glucose in the medium was exhausted (figure 1B). During the
accumulation of trehalose, HXT1, HXT3, HXT4, HXT5 and HXT7 were
expressed until the extracellular glucose concentration had declined below 10
mM at 13 hours after the start of batch growth. When the glucose
concentration in the medium was still 4 mM (at 14 hours after the onset of
batch growth), both HXT5 and HXT7 were expressed. After glucose depletion,
HXT5 was the only hexose transporter expressed and trehalose accumulation
continued during this time. Gluconeogenesis with ethanol as precursor has
been suggested to be involved in providing glucose for trehalose accumulation
after glucose exhaustion in the medium (42). Apparently, no clear relationship
exists between TPS1 expression and a specific hexose transporter. Because
HXT2 was not expressed during trehalose accumulation or TPS1 expression,

Chapter 4
84
HXT2 is probably not involved in trehalose accumulation. The start of HXT5
and HXT7 expression coincided with the initiation of trehalose accumulation
and this suggests the involvement of at least one of these gene products in the
accumulation of trehalose.
Protein expression of Hxt1p, Hxt3p, Hxt5-HA and Tps1p during
batch culture
The protein expression patterns of several hexose transporters were
investigated in order to verify the mRNA expression data during batch culture
with an initial glucose concentration of 100mM. During the first hours of batch
growth, Hxt1p appeared and the protein levels of Hxt1p reached maximum
values between 4 and 6 hours after inoculation (figure 2A). The OD600 of the
culture increased during that time form 1 at inoculation to 3.1 at t=6h (figure
2B) and the culture grew exponentially at that time. The amount of glucose in
the medium decreased during that period from 100mM at t=0h to 77mM at
t=6h (figure 2B). After 11 hours of batch growth, Hxt1p was not detected
anymore. The extracellular glucose concentration was 1 mM at that time.
Hxt3p appeared during the first hour of batch growth and was maximally
expressed between 2 and 6 hours after inoculation, which was during the
decrease in glucose concentration in the medium from 100mM at t=2h to
77mM at t=6h (figure 2A). Hxt3p levels decreased after six hours of batch
growth and the latest time point at which Hxt3p was detected was after 9 hours
of batch growth. At this time, the glucose concentration in the medium was 54
mM, but decreased to 2 mM in the next hour. Protein expression of Tps1p was
very low in cells grown over night (figure 2A). Tps1p levels increased during
the first hours of batch growth. After 5 hours after inoculation, Tps1p levels
decreased but the protein remained present. Hxt5p was present during the
early hours of batch growth, and this was probably due to the presence of
Hxt5p in the preculture. Four hours after inoculation, Hxt5p disappeared and
reappeared again after nine hours of batch growth. The amount of Hxt5p
increased during later time points, at which extracellular glucose was
exhausted.

Hxt5p plays a role in trehalose accumulation and gluconeogenesis
85
Tps1
Hxt3Hxt1
0 1 2 3 5 6 7 8 9 10 11 124 Time (h)A
mM
glucose in medium
OD
600
Trehalose accumulation
(µM glucose eq/O
D600 units)
OD
600
Time (h)
Time (h)
B
C
Hxt5-HA
Figure 2. Trehalose accumulation increased after glucose depletion and
correlated with Hxt5p expression. HXT5::GFP expressing cells were
inoculated for batch growth in YNB medium containing 2% glucose at t=0h. Cells
were collected each hour and protein expression of Hxt1p, Hxt3p, Hxt5p and Tps1p
was examined (panel A). The growth of the culture was measured with the use of
OD600 determinations (B and C, ♦) and the amount of glucose in the medium (B, x)
and the accumulation of trehalose (C, ■) were examined enzymatically as described
by Silljé et al., (1).

Chapter 4
86
Trehalose accumulation started later than the presence of the Tps1
protein (figure 2A, C) and this suggest additional regulation of trehalose
accumulation besides the presence of Tps1. Over-night grown cells had stored
trehalose and this amount of trehalose was decreased by about 25% during the
first hour after inoculation. The background level of trehalose storage was
maintained as long as the glucose concentration in the medium was present at
a concentration above 55 mM (w/v). The glucose concentration decreased
rapidly from 54mM at t=9h to 2mM at t=10h, and the amount of glucose
stored in trehalose started to increase. The amount of trehalose increased for
the next two hours, and remained constant until 18h after inoculation. 24h
after inoculation, the amount of trehalose had decreased again to the level of
the cells used for inoculation of this batch culture. These data indicate that
mRNA levels of HXT genes correlated with the protein expression patterns of
the corresponding proteins. The protein expression is however shorter than
the mRNA expression. This might be caused by the detection limits of the
antibodies but also by the absence of the proteins by additional regulation of
protein expression. The accumulation of trehalose was only initiated when
Hxt5p was present.
Involvement of hexose transporters in trehalose accumulation
To investigate the role of individual hexose transporters on trehalose
synthesis, the accumulation of trehalose was determined in strains deleted for
one (HXT1-5) or two (HXT6/7) hexose transporters. The mutant strains and
wild type strain were grown in batch culture with an initial glucose
concentration of 2% for 24 hours. Figure 3A shows that deletion of the
individual hexose transporters did not result in aberrant growth patterns and
each mutant strain reached a similar OD600 after 24 hours as compared to the
wild type strain. Equal amounts of cells were collected to determine the
amount of accumulated trehalose (figure 3B). The accumulation of trehalose
was affected in all the hexose transporter deletion mutants. Deletion of HXT1,
HXT2, HXT3, HXT4 or HXT5 resulted in a decrease of trehalose accumulation
to 74%, 87%, 80%, 84%, or 82% respectively; deletion of HXT6/HXT7 reduced

Hxt5p plays a role in trehalose accumulation and gluconeogenesis
87
the amount of accumulated trehalose to 65% and this deletion gave the most
prominent effect. Thus, although deletion of HXT6/HXT7 decreased the
accumulation of trehalose most, all the hexose transporters seemed to be able
to provide glucose for of trehalose synthesis.
Figure 3. Influence of individual (HXT1-5) or double (HXT6/7) deletion of
hexose transporters on the accumulation of trehalose after 24 hours of
batch culture. Wild type cells and cells deleted for one or more hexose
transporters were grown in batch culture for 24 hours. Growth of the cultures was
measured by determination of OD600 (A) and the amount of accumulated trehalose
was determined by measurement of OD340 after enzymatic digestion as described
by Silljé et al., (1).
0
2
4
6
8
1 0
1 2
1 4
1 6
1 8
0 4 8 1 2 1 6 20 24
time (h)
OD
60
0
K43
hxt1
hxt2
hxt3
hxt4
hxt5
hxt6/7
0
0,1
0,2
0,3
0,4
0,5
0,6
0,7
0,8
K43 hxt1 hxt2 hxt3 hxt4 hxt5 hxt6/7
OD
34
0

Chapter 4
88
Trehalose accumulation correlated with low growth rates in nitrogen-
limited continuous cultures on glucose and in galactose-cultured fed
batch experiments
Although TPS1 is required for growth on glucose during all stages of
batch growth (43), trehalose was shown in figures 1 and 2 to be only
accumulated when the extracellular glucose concentration had decreased
below 50mM. The accumulation of trehalose is however also induced during
stress conditions when the concentration glucose in the medium is above
50mM. The accumulation of trehalose was shown before to be related to the
growth rate of the cells instead of to the extracellular glucose concentration
(26). The expression of HXT5 is also regulated by the growth rate of the cells
(14). To investigate the possibility that both trehalose accumulation and HXT5
expression were induced at the same growth rates, we determined the
accumulation of trehalose in nitrogen-limited continuous cultures and took
samples at different dilution rates (figure 4A). The extracellular glucose
concentration was kept at 200mM and the growth rate of the continuous
cultures was regulated by limiting the amount of nitrogen in the medium (39).
0
2
4
6
8
10
12
0.05 0.08 0.11 0.14 0.17 0.2
dilution rate (h-1)
Time (hr)
-202468
101214161820
0 2 4 6 8
Tre
hal
ose
accu
mul
atio
n(m
M g
luco
se/O
D60
0 u
nit
s)
A
B
Tre
hal
ose
accu
mul
atio
n(µ
M g
luco
se [
mg
DW
]-1 ) Figure 4. Trehalose
accumulation correlates
with the growth rate.
Nitrogen-limited continuous
cultures (A) and galactose
fed-batch cultures (B) were
sampled and trehalose
accumulation was
determined enzymatically as
described by Silljé et al. (1).
Fed batch culturing was
performed with either 55
fmol galactose cell-1 h-1 (■) or
10 fmol galactose cell-1 h-1
(▲).

Hxt5p plays a role in trehalose accumulation and gluconeogenesis
89
The major hexose transporters were expressed at similar levels for all
the dilution rates tested (data not shown), while HXT5 was only expressed at
the dilution rates 0.075 h-1 and 0.1h-1 (14). The data presented in figure 4A
demonstrate that trehalose was accumulated only at the dilution rates 0.075 h-1
and 0.1 h-1 and not at the higher growth rates. The expression of the major
hexose transporters during the continuous cultures and during the early
periods of trehalose accumulation during batch growth made it impossible to
exclude a role for the major hexose transporters in trehalose accumulation.
However, the dilution rates at which trehalose was accumulated corresponded
with the dilution rates at which HXT5 was expressed. The simultaneous
expression of HXT5 and trehalose synthesis in both batch growth and
continuous cultures, suggest a strong correlation between HXT5 expression
and trehalose accumulation.
Induction of a low growth rate can be achieved by fed-batch culturing
with low amounts of carbon source in the added medium (1). While HXT5 is
expressed during growth on galactose, the major hexose transporters are not
expressed (4) and therefore high and low growth rates on galactose medium
were used to investigate whether the correlation between HXT5 expression
and trehalose accumulation could be established. The accumulation of
Figure 5. Hxt5-GFP coimmunoprecipitates with Tps1p after glucose
addition to starved cells. HXT5::GFP expressing cells were grown to starvation
and glucose was added to a final concentration of 2%. At the indicated time points,
samples were collected and Tps1 was immunoprecipitated. Eluates and cell lysates
were loaded onto SDS-PAGE gels and after electrophoresis transferred to PVDF
membranes. The membrane of the immunoprecipitation (A) was detected with anti-
GFP to detect Hxt5-GFP that coimmunoprecipitated with Tps1p. Membranes with
lysate samples were detected with anti-Tps1 (B) and anti-GFP (C) to detect
respectively Tps1p and Hxt5-GFP in the cell lysates.

Chapter 4
90
trehalose was examined in a fed-batch culture in which the cells were grown at
either a high growth rate (achieved by growing cells with a flux of 55 fmol
galactose cell-1 h-1), or at a low growth rate (achieved by growing cells with a
flux of 10 fmol galactose cell-1 h-1). Figure 4B shows that during high growth
rates trehalose was not accumulated. When cells were grown at a low growth
rate, trehalose was rapidly accumulated. We have previously shown that in fed
batch cultures with 10 fmol galactose cell-1 h-1 HXT5 was expressed but not
during growth on 55 fmol galactose cell-1 h-1 (14). We therefore conclude that
the accumulation of trehalose is correlated with expression of HXT5 in wild-
type cells.
Interaction between Hxt5p and Tps1p
Because of the correlation between trehalose accumulation and HXT5
expression, we investigated a possible physical interaction between Hxt5p and
Tps1p. We were not able to coimmunoprecipitate Hxt5p together with Tps1p
from stationary phase cells (figure 5, t=0min). Figure 2C already showed that
the accumulation of trehalose was restricted to the first 18 hours of batch
growth. This might explain the lack of Tps1-Hxt5 interaction in stationary
phase cells. Because it was suggested before that trehalose might be transiently
accumulated after glucose addition to starved cells (36), we performed the
following experiment. Cells expressing HXT5::GFP were cultured to stationary
phase and subsequently transferred to fresh, 2% glucose containing medium.
Samples were collected at intervals and Tps1 was immunoprecipitated. After
gelelectrophoresis and Western blotting, the membranes were incubated with
anti-GFP to visualize Hxt5-GFP that might have been coimmunoprecipitated
with Tps1p. During the stationary phase, Tps1p was present at low levels
(figure 2) but rapidly appeared during the first 5 minutes after transfer of the
cells to fresh, 2% glucose containing medium. Tps1p remained present in the
cells (figure 2). Hxt5p was present in the stationary phase cells and remained
present during the first hour (figure 5). An interaction between Hxt5p and
Tps1p appeared 5 minutes after transfer of the cells to fresh, 2% glucose
containing medium. This interaction was still present at 30 minutes after

Hxt5p plays a role in trehalose accumulation and gluconeogenesis
91
transfer of the cells and was lost one hour after transfer of the cells to fresh, 2%
glucose containing medium. These data suggest a functional complex of Hxt5-
Tps1 after addition of glucose to starved cells.
Hxt5 localized to the endoplasmic reticulum in stationary phase cells
The role of Hxt5p as a hexose transporter requires the presence of this
transporter at the plasma membrane. Fluorescence studies of Hxt5-GFP
showed a signal that was characterized as plasma membrane labeling after
glucose exhaustion in batch growth (11). In order to localize Hxt5p in more
detail, we performed electron microscopy on cryosections labeled for Hxt5-HA.
Surprisingly, Hxt5-HA showed an intense endoplasmic reticulum (ER) labeling
and only a low plasma membrane (PM) labeling (figure 6A, B). The labeled ER
was situated just below the plasma membrane, which might explain the
supposed plasma membrane localization of Hxt5-GFP (11). Some vacuolar (V)
labeling is present as well as labeling of vesicular structures (VS). The labeling
of these latter structures might represent the constitutive renewal of Hxt5p at
the ER and the plasma membrane (Chapter 6). The mitochondria (M) were not
labeled for Hxt5p. The localization of Hxt5-HA at the plasma membrane
suggests that Hxt5p can indeed function as a hexose transporter in the
stationary phase.
The ER localization of Hxt5-HA suggests however, that Hxt5p has
other functions as well during the stationary phase. A possible role for Hxt5p
in gluconeogenesis is suggested by analogy with the presence of the glucose
transporter GLUT7 in the ER of mammalian cells, which is involved in
gluconeogenesis (44).
Discussion
In this study, we investigated the suggested interplay between one or
more hexose transporters with the expression of TPS1 and with the
accumulation of trehalose (14, 36). The expression of the hexose transporters
and TPS1 during batch growth revealed no explicit coexpression of one single
hexose transporter with TPS1. The accumulation of trehalose started when the

Chapter 4
92 extracellular glucose concentration was below 50 mM and at this time,
Figure 6. Electron microscopy of cryosections of starved cell detected for
Hxt5-HA. HXT5::HA expressing cells were grown to starvation and processed for
immunogoldlabeling on cryosections for electron microscopy. Several ultrastructures
are indicated in the figure: CM, cell membrane, CW, cell wall, M, mitochondrion; ER,
endoplasmic reticulum; V, vacuole; VS, vesicular structure. (A) magnitude 20K, (B)
magnitude 25K, scale bars 200 nm.

Hxt5p plays a role in trehalose accumulation and gluconeogenesis
93
extracellular glucose concentration was below 50 mM and at this time, HXT1,
HXT3, HXT4, HXT5 and HXT7 were all expressed, while HXT2 was not. The
expression of the hexose transporters during batch growth on glucose
corresponded with the data obtained by Diderich et al (4). The expression of
TPS1 has long been known to be required for exponential growth on glucose
(43) and the observed expression of TPS1 before trehalose accumulation
started was thus expected. The continued accumulation of trehalose after
glucose depletion together with the expression of HXT5 as only hexose
transporter at that time might suggest a more prominent role for HXT5 in
trehalose accumulation than for the major hexose transporters. Western blot
data confirmed the protein expression was parallel to the mRNA expression
patterns of HXT1, HXT3, HXT5 and TPS1. The accumulation of trehalose
started in these experiments several hours after the appearance of Tps1
protein. This suggested an extra regulation in the accumulation of trehalose
than only the presence of Tps1p. Trehalose accumulation continued after
glucose depletion, when Hxt5p was the only hexose transporter present.
The glucose used to accumulate trehalose during the stationary phase
has to be acquired by gluconeogenesis as the extracellular glucose was
exhausted (42). Tps1p is required immediately after addition of glucose to
starved cells or to cells cultured on other carbon sources than glucose, fructose
or mannose. Addition of glucose to tps1∆ cells causes a growth arrest by a
quick depletion of free phosphate and ATP, together with an increase of early
intermediates of the glycolysis (36). The suggested modulation of hexose
transport or entry of glucose into glycolysis (29, 33, 36) was strengthened by
the interaction between Hxt5p and Tps1p after glucose addition to stationary
phase cells. The interaction between Hxt5p and Tps1p suggests in this respect
either that trehalose is temporarily accumulated in these cells or that glucose
influx rate via Hxt5p is regulated by interaction with Tps1p. In the latter
model, a role was suggested for trehalose-6-phosphate in the inhibition of
hexokinases. This would lower the rate of glucose phosphorylation and thus
the rate of glucose influx into glycolysis. Both options could help cells to cope
with the increased concentrations of glucose in the medium by prevention of
an overflow of glycolysis. In any case, these models can only function if the

Chapter 4
94
components are in the same complex. We therefore propose that in starved
cells, a functional complex consisting of at least Hxt5p and Tps1p, but probably
also containing Hxk2p, is required to efficiently respond to glucose addition
and to prevent energy exhaustion. The presence of Hxk2p is required to
achieve that the early steps of glucose metabolism are carried out as a vectorial
process. In addition, deletion of HXK2 enable a tps1∆ strain to grow on glucose
(45) and this suggests that Hxk2p is somehow connected to Tps1p function.
Because of the suggested role of this complex, we named it the glucose-
response complex (GRC). Deletion of either Hxt5p or Hxk2p is not lethal for a
cell, because other proteins can take over. For Hxt5p, other hexose
transporters might become expressed, and for Hxk2p, Hxk1p or Glk1p might
take over. Deletion of TPS1, however, causes energy depletion, because no
redundant protein is available for activity of the GRC.
The surprising labeling of Hxt5 at the endoplasmic reticulum (ER) is in
analogy with the presence of a glucose transporter in the ER in mammalian
cells (44). In mammalian cells, the final step of gluconeogenesis, from glucose-
6-phosphate to free glucose, is performed in the ER. The resulting glucose is
transported out of the ER by GLUT7, which is homologous to glucose
transporters in the plasma membrane (44). The labeling of Hxt5p at the ER
suggests a role for Hxt5p in gluconeogenesis. Trehalose accumulated after
glucose depletion is probably formed from glucose derived by gluconeogenesis.
This might explain the simultaneous expression of HXT5 and the
accumulation of trehalose. The coimmunoprecipitation of Hxt5p and Tps1p
strengthens the suggestion that Hxt5p is directly involved in the accumulation
of trehalose. Possibly Hxt5p and Tps1p are also in the same complex under
trehalose accumulating conditions during for example batch growth. This
might ensure the storage of glucose from gluconeogenesis as trehalose in order
to prevent a futile cycle of gluconeogenesis and ethanol production.
The low abundance of Hxt5-HA at the plasma membrane might
explain the low concentration of glucose in the medium of ethanol-grown
nitrogen-limited continuous cultures (4). This low abundance of Hxt5p at the
plasma membrane prevents that cells lose much glucose that was generated via

Hxt5p plays a role in trehalose accumulation and gluconeogenesis
95
gluconeogenesis, but still enables cells to quickly respond to glucose addition
after depletion.
To summarize, we conclude that Hxt5p is involved in trehalose
accumulation and we suggest that the glucose-response complex GRC might
prevent an overflow of glucose into the glycolysis by restriction of glucose
influx into the cell or into the glycolysis. In this complex at least Hxt5p and
Tps1p are present and the GRC is supposed to function after glucose addition
to starved cells or to cells grown on other carbon sources than glucose, fructose
or mannose. The presence of Hxt5p in the ER during the stationary phase
suggests a role for Hxt5p in the gluconeogenesis and Hxt5p might shuttle
glucose derived from gluconeogenesis directly to the TPS complex for trehalose
accumulation.
Acknowledgements
We would like to thank Peter van de Kerkhof and Viola Oorschot for
their help with determining the antibody to use for labelling of Hxt5-HA in
cryosections for electron microscopy.

Chapter 4
96
References
1. Silljé, H.H., ter Schure, E.G., Rommens, A.J., Huls, P.G., Woldringh, C.L., Verkleij, A.J., Boonstra, J. and Verrips, C.T. 1997, J. Bacteriol., 179, 6560-5.
2. Ye, L., Berden, J.A., van Dam, K. and Kruckeberg, A.L. 2001, Yeast, 18, 1257-67.
3. Ozcan, S. and Johnston, M. 1995, Mol. Cell. Biol., 15, 1564-72. 4. Diderich, J.A., Schepper, M., van Hoek, P., Luttik, M.A., van Dijken,
J.P., Pronk, J.T., Klaassen, P., Boelens, H.F., de Mattos, M.J., van Dam, K. and Kruckeberg, A.L. 1999, J. Biol. Chem., 274, 15350-9.
5. Ozcan, S. and Johnston, M. 1999, Microbiol. Mol. Biol. Rev., 63, 554-69.
6. Ko, C.H., Liang, H. and Gaber, R.F. 1993, Mol. Cell. Biol., 13, 638-48. 7. Liang, H. and Gaber, R.F. 1996, Mol. Biol. Cell, 7, 1953-66. 8. Ozcan, S. and Johnston, M. 1996, Mol. Cell. Biol., 16, 5536-45. 9. Ozcan, S., Leong, T. and Johnston, M. 1996, Mol. Cell. Biol., 16, 6419-
26. 10. Reifenberger, E., Freidel, K. and Ciriacy, M. 1995, Mol. Microbiol., 16,
157-67. 11. Diderich, J.A., Schuurmans, J.M., Van Gaalen, M.C., Kruckeberg, A.L.
and Van Dam, K. 2001, Yeast, 18, 1515-24. 12. Wieczorke, R., Krampe, S., Weierstall, T., Freidel, K., Hollenberg, C.P.
and Boles, E. 1999, FEBS Lett., 464, 123-8. 13. Ozcan, S. 2002, J. Biol. Chem., 277, 46993-7. 14. Verwaal, R., Paalman, J.W., Hogenkamp, A., Verkleij, A.J., Verrips,
C.T. and Boonstra, J. 2002, Yeast, 19, 1029-38. 15. Verwaal, R., Arako, M., Kapur, R., Verkleij, A.J., Verrips, C.T. and
Boonstra, J. 2004, Yeast, 21, 747-57. 16. Ruis, H. and Schuller, C. 1995, Bioessays, 17, 959-65. 17. McNabb, D.S., Xing, Y. and Guarente, L. 1995, Genes Dev., 9, 47-58. 18. Forsburg, S.L. and Guarente, L. 1989, Genes Dev., 3, 1166-78. 19. Hahn, S., Pinkham, J., Wei, R., Miller, R. and Guarente, L. 1988, Mol.
Cell. Biol., 8, 655-63. 20. Olesen, J., Hahn, S. and Guarente, L. 1987, Cell, 51, 953-61. 21. Pedruzzi, I., Burckert, N., Egger, P. and De Virgilio, C. 2000, EMBO J.,
19, 2569-79. 22. Bisson, L.F. and Fraenkel, D.G. 1983, Proc. Natl. Acad. Sci. U. S. A.,
80, 1730-4. 23. Francois, J. and Parrou, J.L. 2001, FEMS Microbiol. Rev., 25, 125-45. 24. Parrou, J.L., Enjalbert, B., Plourde, L., Bauche, A., Gonzalez, B. and
Francois, J. 1999, Yeast, 15, 191-203. 25. Lillie, S.H. and Pringle, J.R. 1980, J. Bacteriol., 143, 1384-94. 26. Paalman, J.W., Verwaal, R., Slofstra, S.H., Verkleij, A.J., Boonstra, J.
and Verrips, C.T. 2003, FEMS Yeast Res, 3, 261-8. 27. Silljé, H.H., Paalman, J.W., ter Schure, E.G., Olsthoorn, S.Q., Verkleij,
A.J., Boonstra, J. and Verrips, C.T. 1999, J. Bacteriol., 181, 396-400. 28. Paalman, J.W. 2001, ISBN 90-393-2818-8, The role of nutrients in G1
phase progression of Saccharomyces cerevisiae, University of Utrecht

Hxt5p plays a role in trehalose accumulation and gluconeogenesis
97
29. Bell, W., Klaassen, P., Ohnacker, M., Boller, T., Herweijer, M., Schoppink, P., Van der Zee, P. and Wiemken, A. 1992, Eur. J. Biochem., 209, 951-9.
30. Farkas, I., Hardy, T.A., Goebl, M.G. and Roach, P.J. 1991, J. Biol. Chem., 266, 15602-7.
31. Farkas, I., Hardy, T.A., DePaoli-Roach, A.A. and Roach, P.J. 1990, J. Biol. Chem., 265, 20879-86.
32. Steinmetz, L.M., Scharfe, C., Deutschbauer, A.M., Mokranjac, D., Herman, Z.S., Jones, T., Chu, A.M., Giaever, G., Prokisch, H., Oefner, P.J. and Davis, R.W. 2002, Nat. Genet., 31, 400-4.
33. Bell, W., Sun, W., Hohmann, S., Wera, S., Reinders, A., De Virgilio, C., Wiemken, A. and Thevelein, J.M. 1998, J. Biol. Chem., 273, 33311-9.
34. Gonzalez, M.I., Stucka, R., Blazquez, M.A., Feldmann, H. and Gancedo, C. 1992, Yeast, 8, 183-92.
35. Van Aelst, L., Hohmann, S., Bulaya, B., de Koning, W., Sierkstra, L., Neves, M.J., Luyten, K., Alijo, R., Ramos, J. and Coccetti, P. 1993, Mol. Microbiol., 8, 927-43.
36. Thevelein, J.M. and Hohmann, S. 1995, Trends Biochem. Sci., 20, 3-10.
37. van de Poll, K.W., Kerkenaar, A. and Schamhart, D.H. 1974, J. Bacteriol., 117, 965-70.
38. van de Poll, K.W. and Schamhart, D.H. 1977, Mol. Gen. Genet., 154, 61-6.
39. Meijer, M.M., Boonstra, J., Verkleij, A.J. and Verrips, C.T. 1998, J. Biol. Chem., 273, 24102-7.
40. Tokuyasu, K.T. 1973, J. Cell Biol., 57, 551-65. 41. Tokuyasu, K.T. 1978, J. Ultrastruct. Res., 63, 287-307. 42. Peixoto, D.N. and Panek, A.D. 1999, Biochem. Mol. Biol. Int., 47, 873-
80. 43. Neves, M.J., Hohmann, S., Bell, W., Dumortier, F., Luyten, K., Ramos,
J., Cobbaert, P., de Koning, W., Kaneva, Z. and Thevelein, J.M. 1995, Curr. Genet., 27, 110-22.
44. Waddell, I.D., Zomerschoe, A.G., Voice, M.W. and Burchell, A. 1992, Biochem. J., 286 ( Pt 1), 173-7.
45. Hohmann, S., Neves, M.J., de Koning, W., Alijo, R., Ramos, J. and Thevelein, J.M. 1993, Curr. Genet., 23, 281-9.


Chapter 5
The role of the Hxt5-Tps1 complex in
starved cells
Denise van Suylekom#, René Verwaal‡, Theo Verrips#, Arie
Verkleij#, Bruno M. Humbel# and Johannes Boonstra#
#Cellular Architecture and Dynamics, Utrecht University,
Padualaan 8, 3584 CH Utrecht, the Netherlands
‡ Section Fungal Genomics, Dept. of Microbiology, Wageningen
University, Drijenlaan 2, 6703 HA Wageningen, the Netherlands

Chapter 5
100
Abstract
Recently we have demonstrated that Hxt5p interacts with trehalose–6-
phosphate synthase (Tps1p) to form the so-called glucose-response complex
(GRC). To vectorially shuttle glucose upon influx to either the glycolysis or
trehalose synthesis, the hexokinase II (Hxk2p) was also suggested to be
included in the GRC. The suggested function of the GRC is to restrict the influx
of glucose into glycolysis and thereby to enable cells to express the required
genes for growth on glucose, such as the major hexose transporters (HXT1-4
and HXT6/7).Cells that are unable to form this complex, because TPS1 is
deleted, are unable to grow in glucose. These cells rapidly become energy
exhausted due to accumulation of early intermediates of glycolysis and
depletion of ATP. As Hxt5p is the only hexose transporter expressed in
stationary phase cells, we have studied its role in these cells upon stimulation
of growth by the addition of glucose to the medium.
The ability to form the GRC did not affect the expression of HXT5 as
this gene was normally expressed on galactose medium in a tps1∆ mutant. The
GRC is however required for induction of expression of HXT5 and of HXT1,
HXT3/4 and HXT7 during growth on glucose.
Upon addition of glucose to starved cells, the amount of accumulated
trehalose was rapidly decreased. We therefore conclude that the GRC restricts
the influx of glucose not by transient accumulation of trehalose. Instead, it is
suggested that trehalose-6-phosphate inhibits Hxk2p.
Introduction
In Saccharomyces cerevisiae, a family of hexose transporter (Hxt)
proteins facilitates the transport of glucose into the cell. This family of hexose
transporters exists of at least 20 members. Six hexose transporters are
considered to be the major hexose transporters, namely HXT1-4 and HXT6/7
and their expression is regulated by the extracellular glucose concentration (1).
Expression of HXT5 was demonstrated to enable growth on glucose in
a strain deleted for HXT1-17 and GAL2, although this growth is at a very low
rate despite the moderate affinity of Hxt5p for glucose (2). Furthermore, HXT5

The role of the Hxt5-Tps1 complex in starved cells
101
is only expressed at low growth rates and its expression is independent on the
extracellular glucose concentration (3). Hxt5p was suggested to act as a reserve
hexose transporter that enables cells to transport glucose when this comes
available again after depletion (2).
Cells accumulate the reserve carbohydrates trehalose and glycogen
only at low growth rates (4, 5). Both trehalose and glycogen accumulation have
a role in survival after nutrient depletion and in stress resistance. Cells deleted
for the ability to store either trehalose or glycogen survive comparable periods
after nutrient depletion as wild type cells. Cells that are unable to accumulate
both trehalose and glycogen lose viability quickly after nutrient depletion (6,
7).
Glucose that is transported into the cell is phosphorylated by
hexokinases (encoded by HXK1, HXK2 or GLK1) and this yields glucose-6-
phosphate (8). Dependent on the conditions of the cells, glucose-6-phosphate
enters glycolysis or is used to accumulate the reserve carbohydrates trehalose
and glycogen (9-11). Glucose-6-phosphate is converted to glucose-1-phosphate
by phosphoglucomutase (encoded by PGM1 or PGM2) (12). Glucose-1-
phosphate is then converted into UDP-glucose by UDP-pyrophosphorylase
(encoded by UGP1) (13). UDP-glucose can be used to form trehalose by action
of the trehalose synthase complex. This multimer complex consists of Tps1p,
Tps2p, Tps3p and Tsl1p. Trehalose-6-phosphate synthase (encoded by TPS1)
converts UDP-glucose together with glucose-6-phosphate into trehalose-6-
phosphate (14, 15). Trehalose-6-phosphase phosphatase (encoded by TPS2)
dephosphorylates trehalose-6-phosphate, which yields trehalose and free
phosphate (16, 17). TPS3 and TSL1 probable encode regulatory proteins that
stabilize the complex and regulate its activity (14, 18, 19).
Deficiency in trehalose accumulation makes it impossible for cells to
grow on glucose, fructose or mannose, which are all transported by Hxt
proteins. tps1∆ cells grown on other carbon sources than glucose, fructose or
mannose are viable but are sensitive for glucose (20, 21). Addition of glucose to
tps1∆ cells results in a rapid depletion of ATP and a hyperaccumulation of early
intermediates of the glycolysis, especially fructose1,6-bisphosphate (20-24).

Chapter 5
102
This rapid overflow of the glycolysis is not caused by lack of capacity of the
glycolysis, as cells growing in the exponential phase on galactose medium have
sufficient glycolysis capacity, but by a lack of regulation of glucose influx into
glycolysis (25). It has been suggested that under normal conditions, Tps1p or
its product, trehalose-6-phosphate, restricts the influx of glucose into the cell
by interaction with hexose transporters or into the glycolysis by modulation of
the hexokinases (14, 19, 22). The growth defect of tps1∆ strains is relieved by
additional deletion of HXK2 (26), which reduces the hexokinase activity of the
cell. We have shown in the previous chapter that Hxt5p and Tps1p
coimmunoprecipitate after glucose addition to starved cells. We proposed the
presence of the glucose-response complex (GRC), which is a functional
complex consisting of at least Hxt5p and Tps1p, possibly together with Hxk2p.
The GRC is thought to be required to efficiently respond to glucose addition
and to prevent energy exhaustion after glucose addition.
In this report, we provide evidence that Hxt5-Tps1 indeed functions in
a complex to enable cells to cope with fresh glucose addition after glucose
depletion. tps1∆ cells demonstrated normal HXT5 expression during growth
on galactose, showing that the expression of HXT5 was not dependent on TPS1
or the GRC. Expression of HXT5 was continued after glucose addition when
the cells were first grown to starvation on galactose. When tps1∆ cells were
grown to the exponential phase on galactose, HXT5 and HXT1-4 plus HXT7
were not expressed. This indicates that the proposed complex is not functional
when TPS1 is deleted. The GRC functions in wild type cells probably by
inhibition of Hxk2p by trehalose-6-phosphate, as transient trehalose
accumulation after glucose addition was not observed.
Materials and Methods
Strains, media and growth conditions
The Saccharomyces cerevisiae strains used in this study are indicated
in Table 1. Cells were grown at 30°C at 180 rpm in a shaking incubator (New
Brunswick Scientific, Edison, NJ, USA) in 0.67% (w/v) yeast nitrogen base
without amino acids (Difco, Sparks, MD, USA) and 2% (w/v) of the carbon

The role of the Hxt5-Tps1 complex in starved cells
103
source as indicated in the text. For the JBY20 strain, uracil was added to a final
concentration of 2 µg/ml.
Table 1: List of strains used:
Yeast strain Genotype Source
CEN.PK 113-7D
(wild type)
MATa SUC2 MAL2-8c P. Kötter
(Frankfurt, Germany)
CEN.PK 113-3C
∆tps1
MATa SUC2 MAL2-8c
tps1::TRP1 (6)
JBY20
(Hxt5-HA)
MATa, SUC2, MAL2-8c,
ura3, HXT5::HA J. Becker
(Düsseldorf, Germany)
Northern blot analysis
Total RNA was isolated, separated on agarose gels and transferred to
Hybond-N membrane (Amersham Pharmacia Biotech, Buckinghamshire,
United Kingdom) as described earlier (3). Oligonucleotides directed against
HXT1-7 (27) were labelled as described (3). A probe against U2 was obtained
by PCR, using plasmid pRS313U2 as template and primers 5’-
GTTTTGCAAGGAAAGG-3’ and 5’-CGAGAGAAACATCAAGCG-3’. The probe
was labelled with [α-32P]dCTP using prime-a-gene labelling system according
to manufacturer’s protocol (Promega, Madison, Wisconsin, USA).
Hybridization and washing was performed as described earlier (3).
Real-time quantitative PCR
Total RNA was isolated as described by Verwaal et al. (3). To ensure similar
amounts of starting materials, total RNA concentrations were carefully
measured with a Nanodrop ND-1000 Spectrophotometer (Nanodrop
Technologies Inc., Wilmington, DE, USA). To 1 mg of total RNA, 1 ng 1.2kb
kanamycin positive control RNA (Promega, Wisconsin, USA) was added. Next,
chromosomal DNA was degraded by treatment with DNaseI (amplification
grade, Invitrogen, Carlsbad, CA, USA) according to manufacturer’s

Chapter 5
104
instructions. Subsequently, cDNA was amplified using Omniscript RT kit
(Qiagen, Hilden, Germany) with the following modifications: a 10mM dNTP
stock (Promega) and an Oligo-dT18 primer (Isogen Life Science, IJsselstein,
The Netherlands) were used in the reactions. Pipetting was performed by a
pipetting robot (Corbett Robotics, Mortlake, NSW, USA), using the amplified
cDNA, qPCR primers as indicated in Table 2 and ABsolute QPCR SYBR Green
Mix (Westburg, Leusden, The Netherlands). These qPCR primers were
designed using Primer3 (28). The qPCR reactions were performed in a Rotor
Gene RG-3000 real-time PCR machine (Corbett Research, Mortlake, NSW,
USA). To measure the relative changes in gene expression of HXT5, expression
of the housekeeping gene TDH3 was used as reference. The results are
presented as ratios of gene expression between the target gene (gene of
interest) and the reference gene (TDH3) (29).
Table 2: qPCR primers:
Gene Forward primer Reverse primer
TDH3 CGGTATGGCTTTCAGAGTCC CAACAGCGTCTTCGGTGTAA
HXT5 GGGCGTTGGTGGTATTACAG ATGGTACCCTCCATTGGACA
TPS1 TGAGCGATGTTTGTTTGGTC CATCGGTGTTCCAAGGATTT
Results
Effect of TPS1 deletion on the expression of HXT5 during culturing on
galactose
In the previous chapter, we demonstrated the presence of Hxt5p and
Tps1p in the same complex after glucose addition to starved cells and named
this complex GRC for glucose-response complex. To further elucidate the role
of the GRC, we investigated whether the ability to form this complex affected
the cell’s capacity to express HXT5. We examined the expression of HXT5 in a
wild type and a tps1∆ strain, which is unable to accumulate trehalose. Wild
type cells and tps1∆ cells demonstrated the same HXT5 expression pattern
when the strains were cultured on galactose to the exponential phase and

The role of the Hxt5-Tps1 complex in starved cells
105
transferred to fresh galactose medium (figure 1A). 6 hours after the cells were
transferred to fresh galactose medium, the cultures grew exponentially and
both strains showed no HXT5 expression: after 12 hours, both strains
exhibited HXT5 expression and this expression was further increased 24 hours
after the cells were transferred to fresh galactose medium. At the latest time
point, the cells had reached the stationary phase. These data indicate that the
expression of HXT5 is not dependent on the presence of the TPS1 gene and
therefore not on the presence of the GRC.
6 12 24 6 12 24
wildtype tps1A
6 12 24 6 12 24
wildtype tps1B
HXT5
U2
HXT5
ACT1
6 12 24 6 12 24
wildtype tps1C
HXT5
U2
Figure 1. HXT5
expression in wild
type and tps1∆∆∆∆ cells
during growth on
galactose, and after
transfer from
galactose to glucose
medium. Wild type cells
and tps1∆ cells were
grown to the exponential
phase on galactose
medium and transferred
to fresh, 2% galactose
containing YNB medium
(A). Wild type cells and
tps1∆ cells were grown on
galactose to either the
stationary phase (B) or
exponential phase (C) and
transferred to 2% glucose
containing YNB medium.
At the indicated time
points, cells were collected
and mRNA was isolated
for Northern blot
detection.

Chapter 5
106
Effect of TPS1 deletion on the expression of HXT5 during culturing on
glucose
The tps1∆ strain fails to grow on glucose, fructose and mannose, and
addition of one of these carbon sources to tps1∆ cells grown on galactose,
causes a growth arrest (20-24). Because addition of glucose to tps1∆ cells
caused immediate growth arrest and a low growth rate is an inducer of HXT5
expression, we investigated whether the expression of HXT5 was induced in
the tps1∆ mutant upon glucose addition. Wild type and the tps1∆ strain were
cultured on galactose to the stationary phase, and then transferred to fresh, 2%
glucose containing medium. The wild type strain exhibited the same
expression pattern as during continued growth on galactose, i.e. no HXT5
expression 6 hours after transfer to fresh glucose medium, low expression of
HXT5 12 hours after transfer and high HXT5 expression in the stationary
phase (figure 1B). The tps1∆ strain however exhibited HXT5 expression on 6,
12 and 24 hours after transfer to fresh glucose medium (figure 1B) while there
was no increase in OD600 (data not shown). The expression of HXT5 in the
tps1∆ mutant was at a maximum at 6 hours after transfer of the culture to fresh
glucose medium and decreases at 12 and 24 hours after transfer. These data
suggest that the lack of growth indeed induced HXT5 expression in the tps1∆
strain. On the other hand, the decrease in HXT5 expression in time in the
tps1∆ strain indicated that the observed expression might be a remnant of the
HXT5 expression in the preculture.
To investigate whether the observed HXT5 expression in tps1∆ cells
after transfer to glucose medium as shown in figure 1B was a remnant of HXT5
expression in the preculture or de novo expression, the following experiment
was performed. Wild type cells and tps1∆ cells were grown to the exponential
phase on galactose medium and subsequently transferred to glucose medium.
The wild type strain demonstrated the same HXT5 expression pattern as
described for figure 1A and 1B (figure 1C). The tps1∆ strain on the contrary
totally lacked HXT5 expression on 6, 12 and 24 hours after transfer (figure 1C)
while the OD600 did not increase. These data indicate that the tps1∆ strain was

The role of the Hxt5-Tps1 complex in starved cells
107
not able to express HXT5 on glucose in spite of the absence of growth and that
the expression of HXT5 demonstrated after preculture on galactose to the
stationary phase was a remnant of the HXT5 mRNA present during the
stationary phase and did not represent newly synthesized mRNA molecules.
Quantitative measurements of HXT5 expression
To further investigate the suggestion that HXT5 expression in tps1∆
cells is not possible during growth on glucose, we performed real-time
quantitative PCR to detect HXT5 mRNA from samples cultured as described
above (figure 2). HXT5 expression was determined in wild type and tps1∆
strains after preculture on galactose to the exponential or stationary phase,
and after 6 and 24 hours after transfer of the cells to fresh, glucose containing
medium (figure 2). As expected, the wild type strain demonstrated very low
HXT5 expression during the exponential phase during preculture on galactose
and elevated HXT5 expression in the stationary phase after preculture on
galactose. During the exponential phase on glucose (6 hours after transfer)
wild type cells from both preculture (exponential or stationary phase)
conditions showed no HXT5 expression. 24h after transfer to fresh, glucose
medium, wild type cells exhibited induced HXT5 expression independent of
their preculture conditions. The HXT5 expression in the stationary phase after
transfer to glucose medium was however higher when cells were cultured to
the stationary phase than when they were cultured to the exponential phase on
galactose. Thus, while the conditions at 24 hours after transfer to fresh
medium were comparable, the preculture conditions determined the
quantitative amount of HXT5 expression.
The tps1∆ mutant showed no HXT5 expression during the exponential
phase on galactose, which was comparable with the wild type cells. When the
tps1∆ cells, precultured on galactose to the exponential phase, were transferred
to glucose, HXT5 expression was not induced at 6h or at 24h after transfer to
glucose medium. The tps1∆ cells did not grow at all under these conditions and
therefore the absence of HXT5 expression was not a result from high growth
rates. When the tps1∆ mutant was grown to the stationary phase on galactose,

Chapter 5
108
these cells exhibited enhanced HXT5 expression. The tps1∆ cells expressed
comparable HXT5 levels as the wild type cells during the stationary phase on
galactose. When the galactose grown stationary phase tps1∆ cells were
transferred to fresh, glucose containing medium, they exhibited HXT5
expression at 6 hours after the transfer to glucose medium in contrast to the
wild type cells. 24 hours after transfer to fresh glucose medium, the tps1∆ cells
exhibited HXT5 expression, but only at the level found at 6 hours. The level of
HXT5 expression in the wild type strain was approximately 50% higher at the
stationary phase after glucose preculture than in the initial stationary phase of
the preculture on galactose; in the tps1∆ deletion strain the HXT5 expression
was decreased to approximately 25% 24h after transfer to glucose medium as
compared to the level of HXT5 at the stationary phase after galactose growth.
Because also the housekeeping genes that were used as references in these
experiments decline severely in the tps1∆ strain after transfer to glucose
Figure 2. Relative expression of HXT5. Wild type and tps1∆ cells were grown
to the stationary or exponential phase on galactose medium and subsequently
transferred to 2% glucose medium. At the indicated time points after transfer,
aliquots of cells were collected and mRNA was isolated. After cDNA synthesis,
qPRC was performed.

The role of the Hxt5-Tps1 complex in starved cells
109
medium, we suggest that the observed HXT5 signal in tps1∆ cells after transfer
to glucose medium is indeed a remainder of the signal in the stationary phase
culture. Taken together, these data suggest that the tps1∆ strain is normally
able to express HXT5 during growth on galactose but is unable to do this
during growth on glucose.
Effect of TPS1 deletion on expression of HXT1, HXT3/4 and HXT6/7
Efficient response to glucose by the GRC includes induction of
expression of major hexose transporters. This induction of expression might be
an indirect effect, as prevention of energy depletion might enable other
regulatory systems to induce the expression of the hexose transporters.
Because the tps1∆ strain is unable to grow on glucose and the regulation of
HXT5 was absent on glucose containing medium, we wondered whether the
expression of the major hexose transporters was also disturbed. Therefore, we
Figure 3. HXT1-4 and
HXT7 expression in
wild type and tps1∆∆∆∆
cells after transfer
from galactose to
glucose medium. Wild
type cells and tps1∆ cells
were grown on galactose
medium to the exponential
phase and transferred to
2% glucose containing YNB
medium. At the indicated
time points, cells were
collected and mRNA was
isolated for Northern blot
detection.

Chapter 5
110
investigated the expression of HXT1, HXT3, HXT4 and HXT6/7 in both wild
type and tps1∆ strains, which were precultured to the exponential phase on
galactose and subsequently transferred to fresh, glucose containing medium
(figure 3). None of the major hexose transporters was expressed in the
exponential phase on galactose medium (data not shown). In wild type cells,
HXT1, HXT3 and HXT4 were expressed at 6 hours after transfer to glucose
medium. Their expression was increased at 12 hours after supply of the new
medium and no expression was present anymore at 24 hours. HXT7 was not
expressed at 6 hours after transfer of the wild type cells to fresh, glucose
containing medium. 12 hours after the transfer HXT7 mRNA was present and
this expression was decreased at 24 hours after the addition of fresh, glucose
containing medium. The expression data of the major hexose transporters are
consistent with the data presented in figure 1 of the previous chapter. In the
tps1∆ strain however, none of the hexose transporters examined was
expressed. At 6, 12 and 24 hours after transfer of the cells to fresh, glucose
containing medium, HXT1, HXT3, HXT4 and HXT7 were not expressed.
Therefore, the expression of HXT1, HXT3, HXT4, HXT5 and HXT7 is
dependent on the presence of TPS1 during growth on glucose. Thus, disruption
of the GRC by deletion of TPS1 makes it impossible for cells to cope with
glucose.
Trehalose is rapidly degraded after glucose addition to starved cells
The way of GRC function was next investigated. It was proposed before
that such a complex would either use trehalose-6-phosphate to inhibit
hexokinases or trehalose accumulation to restrict the influx of glucose into
glycolysis (22). To investigate the way of GRC function to prevent energy
depletion, the amount of trehalose was investigated after glucose addition to
starved cells. In figure 4, the levels of trehalose are shown during a short time
after glucose addition. The amount of glucose that was stored as trehalose was
lowered already after two minutes after glucose addition to starved cells and
continued for five minutes. This level was kept constant at ten and fifteen

The role of the Hxt5-Tps1 complex in starved cells
111
minutes after addition of glucose to starved cells. The influx of glucose into
glycolysis is thus not regulated by synthesis of trehalose.
Taken together, these data presented in this study indicate that the
GRC functions by inhibition of hexokinases by trehalose-6-phosphate. The
GRC is probably composed of Hxt5p, Tps1p and a hexokinase. Disruption of
the GRC by deletion of TPS1 leaves the complex functionally inactive and cells
are then not able to respond to glucose.
Discussion
The presence of Hxt5p and Tps1p in the same complex after glucose
addition to starved cells led to the model of the glucose-response complex
(GRC) described in Chapter 4. Besides Hxt5p and Tps1p, we proposed that also
Hxk2p is involved in the GRC in order to acquire a vectorial process of the
early steps of glucose metabolism (8, 12, 13). This complex ensures an efficient
Figure 4. Trehalose is rapidly degraded after glucose addition to
starved cells. Cells were inoculated in batch culture and cultured for 48 hours.
Glucose was added to a final concentration of 2% and at the indicated time
points, samples were collected. The amount of glucose that was stored as
trehalose is shown.

Chapter 5
112
response to glucose addition by prevention of an overflow of glycolysis and
thus by prevention of energy exhaustion. In order to explore the action of the
GRC in more detail, the effect of disruption of the GRC was studied. The
expression of HXT5 in the tps1∆ mutant was similar to the expression in the
wild type strain during growth on galactose an the expression of HXT5 was
thus not dependent on the GRC. However, the expression of HXT5 differed
between the wild type and the tps1∆ strains when they were cultured on
glucose medium. The expression of HXT5 in the wild type strain on glucose
medium was similar to that on galactose medium. tps1∆ cells transferred to
glucose medium after being grown to the stationary phase on galactose showed
HXT5 mRNA, while no HXT5 was induced when the tps1∆ cells were
precultured to the exponential phase on galactose before transfer to glucose
containing medium. This indicated that tps1∆ cells on glucose were not
capable of inducing HXT5 expression in spite of the absence of growth, and
that the HXT5 expression in the tps1∆ cells from the stationary phase on
galactose medium was a remnant of the HXT5 expression in the preculture.
This assumption was further strengthened by the real time quantitative PCR
data, which showed a decrease in HXT5 expression levels when tps1∆ cells
precultured to the stationary phase on galactose were transferred to glucose
medium. The expression of HXT5 was therefore not dependent on the
presence of the TPS1 gene during growth on galactose, but it was during
growth on glucose.
The inability of the tps1∆ strain to grow on glucose seems to be related
to the inability to express any hexose transporter as also the major hexose
transporters were not expressed in the tps1∆ cells. In a broader perspective,
the inability of the tps1∆ strain to express any of the hexose transporters
examined might be caused by the energy depletion that is produced by the
addition of glucose to these cells (20-24), which renders it impossible for the
tps1∆ cells to do anything at all after energy depletion is reached. Additional
deletion of the hexose kinase II gene (HXK2) enable growth on glucose of a
tps1∆ strain (26). This indicated that glucose addition itself is not toxic to cells,
but the lack of regulation caused the energy depletion. The disruption of the

The role of the Hxt5-Tps1 complex in starved cells
113
GRC leads thus to energy depletion because of the lack of regulation of influx
of glucose into glycolysis.
Both trehalose accumulation and inhibition of Hxk2p by trehalose-6-
phosphate would decrease the influx of glucose into glycolysis (14, 19, 22).
Because the levels of accumulated trehalose dropped within minutes after
glucose addition to starved cells, we conclude that the GRC regulates the influx
of glucose into glycolysis by inhibition of Hxk2p via trehalose-6-phosphate. A
schematic model of the different components of the GRC and metabolic
intermediates is presented in figure 5.
Figure 5. Model of GRC. Glucose is transported into the cell via Hxt5p.
Glucose is directly phosphorylated by Hxk2 to glucose-6-phosphate. Glucose-6-
phosphate can be shuttled to either the glycolysis or via different intermediates
transformed into trehalose-6-phosphate. Trehalose-6-phosphate can inhibit
Hxk2 to phosphorylate glucose. The suggested vectorial process is then stopped
and no extra glucose can be transported in to the cell.

Chapter 5
114
References
1. Ozcan, S. and Johnston, M. 1999, Microbiol. Mol. Biol. Rev., 63, 554-69.
2. Diderich, J.A., Schuurmans, J.M., Van Gaalen, M.C., Kruckeberg, A.L. and Van Dam, K. 2001, Yeast, 18, 1515-24.
3. Verwaal, R., Paalman, J.W., Hogenkamp, A., Verkleij, A.J., Verrips, C.T. and Boonstra, J. 2002, Yeast, 19, 1029-38.
4. Silljé, H.H., ter Schure, E.G., Rommens, A.J., Huls, P.G., Woldringh, C.L., Verkleij, A.J., Boonstra, J. and Verrips, C.T. 1997, J. Bacteriol., 179, 6560-5.
5. Paalman, J.W., Verwaal, R., Slofstra, S.H., Verkleij, A.J., Boonstra, J. and Verrips, C.T. 2003, FEMS Yeast Res, 3, 261-8.
6. Paalman, J.W. 2001, ISBN 90-393-2818-8, The role of nutrients in G1 phase progression of Saccharomyces cerevisiae, University of Utrecht
7. Silljé, H.H., Paalman, J.W., ter Schure, E.G., Olsthoorn, S.Q., Verkleij, A.J., Boonstra, J. and Verrips, C.T. 1999, J. Bacteriol., 181, 396-400.
8. Gancedo, J.M., Clifton, D. and Fraenkel, D.G. 1977, J. Biol. Chem., 252, 4443-4.
9. Francois, J. and Parrou, J.L. 2001, FEMS Microbiol. Rev., 25, 125-45. 10. Parrou, J.L., Enjalbert, B., Plourde, L., Bauche, A., Gonzalez, B. and
Francois, J. 1999, Yeast, 15, 191-203. 11. Lillie, S.H. and Pringle, J.R. 1980, J. Bacteriol., 143, 1384-94. 12. Boles, E., Liebetrau, W., Hofmann, M. and Zimmermann, F.K. 1994,
Eur. J. Biochem., 220, 83-96. 13. Daran, J.M., Dallies, N., Thines-Sempoux, D., Paquet, V. and Francois,
J. 1995, Eur. J. Biochem., 233, 520-30. 14. Bell, W., Klaassen, P., Ohnacker, M., Boller, T., Herweijer, M.,
Schoppink, P., Van der Zee, P. and Wiemken, A. 1992, Eur. J. Biochem., 209, 951-9.
15. Vuorio, O.E., Kalkkinen, N. and Londesborough, J. 1993, Eur. J. Biochem., 216, 849-61.
16. Vandercammen, A., Francois, J. and Hers, H.G. 1989, Eur. J. Biochem., 182, 613-20.
17. Londesborough, J. and Vuorio, O. 1991, J. Gen. Microbiol., 137, 323-30.
18. Reinders, A., Burckert, N., Hohmann, S., Thevelein, J.M., Boller, T., Wiemken, A. and De Virgilio, C. 1997, Mol. Microbiol., 24, 687-95.
19. Bell, W., Sun, W., Hohmann, S., Wera, S., Reinders, A., De Virgilio, C., Wiemken, A. and Thevelein, J.M. 1998, J. Biol. Chem., 273, 33311-9.
20. Gonzalez, M.I., Stucka, R., Blazquez, M.A., Feldmann, H. and Gancedo, C. 1992, Yeast, 8, 183-92.
21. Van Aelst, L., Hohmann, S., Bulaya, B., de Koning, W., Sierkstra, L., Neves, M.J., Luyten, K., Alijo, R., Ramos, J. and Coccetti, P. 1993, Mol. Microbiol., 8, 927-43.
22. Thevelein, J.M. and Hohmann, S. 1995, Trends Biochem. Sci., 20, 3-10.
23. van de Poll, K.W., Kerkenaar, A. and Schamhart, D.H. 1974, J. Bacteriol., 117, 965-70.

The role of the Hxt5-Tps1 complex in starved cells
115
24. van de Poll, K.W. and Schamhart, D.H. 1977, Mol. Gen. Genet., 154, 61-6.
25. Neves, M.J., Hohmann, S., Bell, W., Dumortier, F., Luyten, K., Ramos, J., Cobbaert, P., de Koning, W., Kaneva, Z. and Thevelein, J.M. 1995, Curr. Genet., 27, 110-22.
26. Hohmann, S., Neves, M.J., de Koning, W., Alijo, R., Ramos, J. and Thevelein, J.M. 1993, Curr. Genet., 23, 281-9.
27. Diderich, J.A., Schepper, M., van Hoek, P., Luttik, M.A., van Dijken, J.P., Pronk, J.T., Klaassen, P., Boelens, H.F., de Mattos, M.J., van Dam, K. and Kruckeberg, A.L. 1999, J. Biol. Chem., 274, 15350-9.
28. Rozen, S. and Skaletsky, H. 2000, Methods Mol. Biol., 132, 365-86. 29. Pfaffl, M.W. 2001, Nucleic Acids Res, 29, e45.


Chapter 6
Degradation of the hexose transporter
Hxt5p in Saccharomyces cerevisiae
Denise van Suylekom, Elly van Donselaar, Lan Nguyen Do Ngoc,
Bruno M. Humbel*, and Johannes Boonstra
Cellular Architecture and Dynamics, Utrecht University,
Padualaan 8, 3584 CH Utrecht, the Netherlands
Submitted to: Biology of the Cell

Chapter 6
118
Abstract
Hxt5p is a member of a multigene family of hexose transporter (Hxt)
proteins which translocate glucose across the plasma membrane of the yeast
Saccharomyces cerevisiae. In contrast to other major hexose transporters of
this family, Hxt5p expression has been demonstrated to be regulated by the
growth rate of the cells and not by the external glucose concentration Further,
Hxt5p is the only glucose transporter expressed during stationary phase. These
observations suggest a different role for Hxt5p in S. cerevisiae. Therefore, we
have studied the metabolism and localization of Hxt5p in more detail.
Inhibition of HXT5 expression in stationary phase cells by addition of glucose,
which decreases the growth rate, leads to a decrease in the amount of Hxt5
protein within a few hours. Addition of glucose to stationary phase cells
resulted in a transient phosphorylation of Hxt5p on serine residues, but no
ubiquitination could be measured. The decrease in Hxt5p levels is caused by
internalization of the protein as observed by immunofluorescence microscopy.
In stationary phase cells, Hxt5p is localized predominantly at the cell
periphery, and upon addition of glucose to the cells the protein translocates to
the cell interior. The internalized Hxt5-HA protein is most probably localized
to endocytic structures and the vacuole, as the constitutive Hxt5-HA renewal
in stationary phase cells was demonstrated with electron microscopy to occur
via this pathway. These results suggest that internalization and degradation of
Hxt5p in the vacuole occur in an ubiquitination independent pathway.
Introduction
In Saccharomyces cerevisiae, glucose is transported into the cell by
hexose transporters, which are localized in the plasma membrane (1-5). The
family of hexose transporters consists of 20 members of which HXT1-4 and
HXT6-7 are the major hexose transporters. Expression of one of these
transporters allows growth on glucose in the MC996 background in which
HXT1-7 are deleted (6). The expression of the major hexose transporters is
mainly regulated by the extracellular glucose concentration (5). In addition,
overexpression of each of the genes HXT5, HXT8-11 or HXT13-17 in an hxt1-17

Degradation of Hxt5p
119
gal2 deletion strain in the CEN.PK background allows growth on glucose as
well (7), indicating that these Hxt proteins are also capable of transporting
glucose. Under normal conditions however, the expression of these genes is
low except for HXT5, HXT8 and HXT13 (5).
The Hxt proteins are highly homologous with 12 transmembrane
domains with both the amino- and carboxyterminal tails localized in the
cytoplasm (3). The lowest homology is found in the aminoterminal
intracellular parts. The largest protein is Hxt5p, which has 592 amino acids,
and this is approximately 20 residues longer than the major hexose
transporters (8). This difference is located mainly in the aminoterminal
intracellular part of the protein, which is 82 amino acids long while that of the
major hexose transporters contains between 50 and 65 amino acids.
Due to the differences in protein structure, it is tempting to suggest
that Hxt5p has a different function in the cells as compared to the major
hexose transporters. The HXT5 (YHR096c) gene is localized to chromosome
III, as are HXT1 and HXT4. As for the other HXT genes, deletion of HXT5 is
not lethal to the cells and no clear phenotype results from it (6, 9). HXT5
expression has been demonstrated to be regulated by the growth rate and its
expression is controlled by STRE and HAP elements in the HXT5 promoter
(10). Because of the involvement of the STRE elements under stress
conditions, and of HAP elements under glucose limitation and exhaustion, the
phenotype of growth-rate regulated HXT5 expression could therefore result
from the action of both STRE and HAP elements depending on the
environmental conditions. HXT5 expression is not strictly controlled by
glucose repression as in nitrogen-limited continuous cultures, the expression
of HXT5 is dependent on the growth rate while the glucose concentration in
the medium was constant (8). Besides, it is published that the deletion of
hexokinase II (HXK2) did not derepress HXT5 expression under high glucose
condition while it does derepress the high-affinity glucose transporters HXT2
and HXT7 (11). We also suggested a role for Hxt5p in trehalose accumulation
next to its function as a hexose transporter (8). As compared to wild-type cells,
an hxt5 mutant strain exhibits a relatively long lag phase before starting
exponential growth when glucose is re-administered after glucose depletion as

Chapter 6
120
(9), suggesting that Hxt5p plays a role in adaptation to growth conditions with
glucose as carbon and energy source. Under inducing conditions, Hxt5-GFP
demonstrated a plasma membrane localization while some label was present in
the cytoplasm (9).
We show here that in stationary phase cells, Hxt5-HA is present in
both the mother and the developing daughter cell. After increasing the growth
rate, the new buds were not labeled anymore and with ongoing time fewer cells
were labeled. The label present in stationary phase cells was located at the cell
periphery near the plasma membrane. After increase of the growth rate,
immunofluorescence demonstrated that Hxt5-HA became localized inside the
cells, probably at endocytic vesicles and in the vacuole. Furthermore, Hxt5p
was transiently phosphorylated on serine residues after addition of glucose to
the stationary phase cells, with a maximum after 30 minutes. No
ubiquitination of Hxt5p was however detected. We therefore suggest that the
phosphorylation of Hxt5p serves a regulatory role instead of an internalization
signal. It is concluded that while the expression of HXT5 is different from that
of the major hexose transporters, the degradation occurs via similar pathways
but is regulated in a different way.
Materials and Methods
Strains, media and growth conditions
The yeast strains used in this study were wild-type CEN.PK 113-7D
(MATa, SUC2, MAL2-8c), kindly provided by P. Kötter (Institut für
Mikrobiologie, Johann Wolfgang Goethe-Universität, Frankfurt am Main,
Germany) and JBY20 (Mata, SUC2, MAL2-8c, ura3, HXT5::HA) by J. Becker
(Institut für Mikrobiologie, Heinrich-Heine-Universität, Düsseldorf,
Germany). Yeast cells were grown in batch culture on 0.67% (w/v) yeast
nitrogen base without amino acids (Difco, Sparks, MD, USA) and 2% glucose,
supplemented with 2 µg/ml uracil for the JBY20 strain. Cells were grown at
30°C in a shaking incubator at 180 rpm (New Brunswick Scientific, Edison,
USA). Cells were grown for 48h to stationary phase for growth experiments, a

Degradation of Hxt5p
121
portion of the cells was transferred to fresh, 2% (w/v) glucose containing YNB
medium at an OD600 of 0.4 (±0.05).
Western Blot analysis
Analysis of proteins with Western blot was performed as described by
Verwaal et al (2002), with the modification that samples were centrifuged after
collection, washed with ice-cold water and stored at -20°C until use.
Furthermore, RIPA buffer (150 mM NaCl, 20 mM Tris-HCl pH 7.5, 1 mM
EDTA, 1%SDS and 0.1% Triton X-100) was used as lysis buffer. For detection,
PVDF membranes (Roche Diagnostics, Basel, Switzerland) were incubated
with anti-HA antibody 12CA5 (Roche) and peroxidase-conjugated rabbit-anti-
mouse (Jackson Immunoresearch, Cambridgeshire, United Kingdom).
Proteins were visualized with Enhanced Chemiluminescence (Renaissance,
NEN Life Science Products, Inc., Boston, MA, USA). The degradation of Hxt5-
HA was quantified by dividing the optical density of the signal for Hxt5-HA by
the signal for actin on the same PVDF membrane, and the standard errors of
the mean (n=5) were calculated and presented in the figure. Measurements
were performed on a Fluor-S MultiImager (BioRad, Hercules, CA, USA) and
calculations with Microsoft Office Excel.
Immunofluorescence microscopy on whole cells
2.5 * 106 yeast cells were fixed by adding an equal volume of 8%
formaldehyde and incubated for one hour. Cells were collected by
centrifugation at 1500 rpm for 5 minutes. Cells were washed once with 1 ml
fresh medium and incubated for 5 minutes with DET (0.1 M dithiothreitol,
0.02 M EDTA and 0.02 M Tris-HCl, pH 8.1). After collecting the cells by
centrifugation, the cell pellet was suspended in 0.9 M sorbitol /PBS pH 7.4
(137 mM NaCl, 2.7 mM KCl, 8.1 mM Na2HPO4, 1.5 mM KH2PO4). Cell walls
were digested by adding 10 µl zymolyase (5 mg/ml, Seikagaku Corp., Tokyo,
Japan) and incubated for 30 min at 30°C. Spheroplasts were washed with 0.9
M sorbitol/PBS and permeabilized with 0.9 M sorbitol/PBS/1% Triton X-100.
After two washes with 0.9 M sorbitol/PBS, cell suspensions were divided over

Chapter 6
122
poly-L-lysine (Sigma Chemical Company, St.Louis, MO, USA) coated cover
slips and allowed to settle for 30 min at room temperature. The excess fluid
was aspirated off and the coverslips were air-dried for 5 minutes. The
coverslips were blocked with PEM (0.1 M Pipes, pH 6.9, 1 mM EGTA, 0.1 mM
MgSO4)/1% BSA/0.1% NaN3 and subsequently labeled with anti-HA 12CA5
(Roche). Cells were washed with PEM/1% BSA/0.1% NaN3 and incubated in
the dark with goat-anti-mouse Cy3 (Jackson Immunoresearch,
Cambridgeshire, United Kingdom) in PEM/1% BSA/0.1% NaN3. Finally, the
cells were washed three times and embedded in moviol/DAPI (12). Images
were collected using a Nikon digital camera DXM 1200 with a Zeiss Plan
neofluar 40x objective (Zeiss, Oberkochen, Germany) and processed using
Photoshop 5.5.
Electron microscopy on cryosections
Cells were fixed for 15 min at 30°C and 180 rpm by adding an equal
volume of two times concentrated fixative (4% formaldehyde, 0.4%
glutaraldehyde in 0.1 M PHEM buffer (60 mM Pipes, 25 mM Hepes, 10 mM
EGTA and 2 mM MgCl2), pH 6.9). Cells were collected by centrifugation for 5
minutes at 4000 rpm and fixation was continued for 45 min at room
temperature with fresh fixative (2% formaldehyde, 0.2% glutaraldehyde in 0.1
M PHEM buffer). Then the cells were washed with 0.1 M PHEM buffer, and
resuspended in 1% formaldehyde in 0.1 M PHEM buffer and stored at 4°C until
further use. The cells were washed three times with 0.1 M PHEM buffer and
incubated for one hour at room temperature in 1% periodic acid in 0.1 M
PHEM buffer. Subsequently, the cells were washed three times with 0.1 M
PHEM buffer and embedded in 12% gelatin in 0.1 M PHEM buffer at 37°C.
Cells were centrifuged for two minutes at 15000 rpm and gelatin was solidified
on ice. 1 mm3 cubes were cut, which were impregnated overnight on a turning
wheel with 2.3 M sucrose at 4°C (13). With a cryoultramicrotome (UC6 FC6,
Leica, Microsystems, Vienna, Austria), 50-55 nm sections were cut for electron
microscopy. Sections were picked up with 1.15 M sucrose/0.1% methylcellulose

Degradation of Hxt5p
123
in 0.05M PHEM buffer and dipped on formvar/carbon coated Cu grids (Stork
Veco B.V., Eerbeek, the Netherlands) for electron microscopy.
Mounted sections of JBY20 were washed five times with PBS, pH 7.4
137 mM NaCl, 8 mM Na2HPO4, 2.7 mM KCl, 1.5 mM KH2PO4)/ 0.02 M
Glycine. The sections were blocked by one incubation in PBS, 1% BSA (Sigma,
Zwijndrecht, the Netherlands) and subsequently incubated with mouse 12CA5
anti-HA antibody (Roche Diagnostics) diluted 1:300 in PBS, 1% BSA for one
hour. The labeled sections were washed 5 times 2 minutes with PBS, 0.1% BSA
and incubated for 20 minutes with rabbit-anti-mouse IgG (Dako Denmark
A/S, Glostrup, Denmark) diluted 1:250 in PBS, 1% BSA. The sections were
washed five times two minutes with PBS, 0.1% BSA and then incubated 20
minutes with protein A 10 nm gold (Dept. Cell Biology, University Medical
Centre Utrecht, the Netherlands) diluted 1:90 in PBS, 1% BSA. The sections
were then rinsed three times shortly and seven times for two minutes with
PBS. The labeled sections were fixed for 5 minutes in PBS, 1% glutaraldehyde
and subsequently washed ten times with aqua dest. This was followed by an
incubation of 5 minutes in uranyl oxalate, pH 7.4 (14) and two washes with
aqua dest followed. Two rinses on ice on 0.4% aequous uranyl
acetate/methylcellulose, pH 4.5 followed and the incubation was continued
with fresh solution for 5 minutes on ice. Excess of fluid was then drained off
and the sections were dried at room temperature.
The sections were observed with a JEOL 1010 transmission electron
microscope (JEOL, Tachikawa, Japan) at 80 kV and images were recorded on
Agfa Scientia sheet film. The scanned pictures were processed with Photoshop
5.5.
Immunoprecipitation
Samples were washed once with ice-cold H2O and cells were collected
by centrifugation. Cells were suspended in 500 µl Tris/HCl pH 7.4
supplemented with complete protease inhibitors (Roche Diagnostics), sodium
fluoride and benzamidine, and subsequently the cells were lysed by vigorously
shaking with 0.45 mm glass beads in a Mini BeadBeater 8 (Glen Mills Inc.,

Chapter 6
124
New Jersey, USA) for 1.5 min. 500 µl Tris/HCl pH 7.4 containing protease
inhibitors, sodium fluoride, benzamidine and 1% Triton X-100 was added, the
sample was mixed and 800 µl lysate was collected. Hxt5-HA was
immunoprecipitated from pre-cleared lysates with the use of 12CA5 anti-HA
antibody (Roche Diagnostics) coupled to protein A or G sepharose beads
(Sigma), respectively. After binding, the beads were washed four times with
Tris/HCl pH 7.4, sodium fluoride, benzamidin and 0.5% Triton X-100. 1.2x
reducing sample buffer was added and immunoprecipitates were separated on
SDS-PAGE gel. The proteins were transferred to PVDF membrane and
detected with Fk2 anti-ubiquitin (Biomol, Exeter, United Kingdom) or anti-
phosphoSerine (Calbiochem, EMD Biosciences, Inc., San Diego, CA, USA) and
rabbit-anti-mouse peroxidase (Jackson Immunoresearch) and visualized with
Enhanced Chemiluminescence (Renaissance).
Results
Induction of Hxt5p degradation.
Hxt5p expression is known to be induced when cells have a low growth
rate and repressed when the growth rate is increased. Within one hour after
transfer of stationary phase cells to fresh, 2% glucose containing YNB medium,
HXT5 mRNA is not detected anymore (8). HXT5 tagged in the genome with an
HA-sequence was used to determine the rate of Hxt5 protein removal from the
culture after transfer of stationary phase cells to fresh, 2% glucose containing
medium. We chose to use tagged Hxt5 for our experiments as there are no
antibodies available for native Hxt5 protein. As shown in Fig. 1A, stationary
phase cells express Hxt5-HA. Addition of glucose to the cells resulted in a
decrease of the Hxt5-HA level to 66% of the initial level within one hour (Fig.
1A/C). Interestingly, the cells were still in the lag phase during this period,
indicating that the induction of Hxt5-HA expression was inhibited and the
degradation was induced immediately after the addition of glucose (Fig. 1B).
While the OD600 of the culture started to increase between one and two hours
after the addition of glucose, the amount of Hxt5-HA decreased further to 59%
of the initial amount of Hxt5-HA after 2 hours and 21% after 4 hours when the

Degradation of Hxt5p
125
culture reached the exponential phase of batch growth (Fig. 1). Thus while
HXT5 is not expressed anymore one hour after stationary phase cells were
transferred to growth rate promoting medium, the Hxt5-HA protein was more
slowly degraded and there was still Hxt5-HA protein present four hours after
cells were transferred to fresh medium. The decrease in Hxt5-HA protein
levels coincided with an increase in the growth rate, in agreement with
previous results (8).The fact that the initial decrease of the amount of Hxt5-HA
occurred already during the lag phase of the cells in fresh medium suggests for
an active degradation process of Hxt5p, which was initiated by the cell prior to
the increase in the growth rate of the culture.
Figure 1: Hxt5-HA
protein levels in
starved cells and after
induction of the
growth rate. Strain
JBY20 was grown to
stationary phase and
transferred to fresh, 2%
glucose containing YNB
medium. Cells were
collected at the moment of
inoculation and at each
hour. (A) Western blot
analysis of Hxt5-HA. (B)
Optical density at 600nm.
(C) Quantification of Hxt5-
HA levels, error bars
indicate the standard error
of the mean (n=5).

Chapter 6
126
Hxt5-HA degradation
It has been known for a long time that proteins destined for rapid
degradation contain a so-called PEST sequence. In Saccharomyces cerevisiae
ubiquitination of other transporters such as the galactose transporter and the
maltose transporter is reported also to be dependent on a PEST sequence (15,
16). Database research and algorithm analysis
(http://emb1.bcc.univie.ac.at/embnet/tools/bio/PESTfind) on Hxt5p
indicated a PEST-region located at amino acids 302-325, which is in the
longest intracellular part of the protein. PEST elements often contain
phosphorylation sites that play a role in targeting proteins for degradation (17).
To determine whether phosphorylation of one or more serine residues
coincided with Hxt5-HA degradation, the following immunoprecipitation
experiment was performed. Cells were grown to the stationary phase (t=0min)
and transferred to fresh, 2% glucose containing medium. At different time
points Hxt5-HA was immunoprecipitated and after gelelectrophoresis and
Western blotting detected with anti-phosphoserine antibodies. As shown in
Fig. 2B, the precipated Hxt5-HA clearly exhibited anti-phosphoserine
reactivity, which increased transiently after the shift of the cells to glucose-
containing medium. The maximal reactivity was obtained 10 – 30 minutes
after the medium shift, and reactivity returned to basal levels 60 minutes after
the medium change (fig. 2).
In S. cerevisiae, it is known that not only cytosolic proteins that are
selected for degradation in the proteasome can be covalently linked to
ubiquitin, but also transmembrane proteins that are degraded via the
endocytic pathway may have ubiquitin attached. Examples of these
transmembrane proteins are the galactose transporter Gal2 (15) and the
maltose permease (16). The PEST sequence of these proteins has been shown
to be involved in the ubiquitination of these transporters. To investigate
whether Hxt5-HA becomes ubiquitinated, stationary phase cells and stationary
phase cells incubated in fresh, 2% glucose containing YNB medium for 10, 30
and 60 minutes were subjected to immunoprecipitation using anti-HA
antibodies to precipitate Hxt5-HA. After gel-electrophoresis and Western

Degradation of Hxt5p
127
blotting, the blots were detected with anti-ubiquitin or anti-HA as indicated
(Fig. 2A). Although Hxt5-HA was present in the immunoprecipitates (Fig. 2C),
no anti-ubiquitin signal was detected (Fig. 2A). The fact that no ubiquitination
of Hxt5p could be found was not due to the experimental conditions, as the cell
lysates obtained in this experiment clearly exhibited anti-ubiquitin reactivity
(Fig. 2D). These observations suggest that Hxt5-HA is not ubiquitinated or
only to a low level. Together, these results demonstrate that exposure of
stationary phase cells to glucose results in rapid, transient phosphorylation of
0 10 30 60 Time (min)
72
55
40
33
100
130
170
A
B
CD
Figure 2: In vivo
ubiquitination and
phosphorylation of Hxt5-
HA. Strain JBY20 was grown to
starvation and transferred to
fresh, 2% glucose containing
medium. Cells were collected at
the moment of inoculation into
fresh medium and at the time
points indicated and
subsequently Hxt5-HA was
immunoprecipitated. After
electrophoresis and Western
blotting, the membranes were
detected for ubiquitination (A)
and phosporylation of serine
residues (B) of Hxt5-HA. The
immunoprecipitated Hxt5-HA
was detected and presented in
panel C. Whole cell lysates were
detected for ubiquitinated
proteins and presented in panel
D.

Chapter 6
128
Hxt5-HA, but not in ubiquitination of the protein. Therefore, the involvement
of the PEST sequence in the degradation of Hxt5-HA is unlikely.
Hxt5-HA localization
In order to elaborate on the site of Hxt5-HA degradation, the localization
of the protein has been studied using immunofluorescence microscopy.
Stationary phase cells were treated, and subsequently subjected to
immunofluorescence microscopy as described under Materials and Methods.
As shown in Fig. 3, Hxt5-HA labelling in stationary phase cells exhibited a
localization at the cell periphery (Fig. 3, t=0h), which indicates that the
transmembrane protein Hxt5-HA is localized at the plasma membrane during
stationary phase.
During the first two hours after transfer of cells to fresh, 2% glucose
containing medium, the localization of Hxt5-HA changed from a predominant
membrane localization to both membrane localization and some cytoplasmic
staining, the latter as a punctuate structure, while the intensity of the signal of
single cells decreased (Fig. 3A/B, t=0h, t=2h, filled arrowheads). The decrease
in labelling intensity explained partly the decrease in signal observed on the
Western blot between t=0h and t=2h. Another reason for the decrease in this
signal is that in contrast to stationary phase cells, two hours after transfer not
all the cells exhibited Hxt5-HA label anymore (Fig. 3A/B, filled arrows). More
cells lacked Hxt5-HA labelling at t=3h and t=4h in comparison to cells in the
stationary phase (filled arrows), where all cells were labelled. At t=4h, the
membrane labelling was faint and almost absent; the label present was more
internalized than during earlier time points During stationary phase, some of
the cells are able to progress slowly through the cell cycle. The buds of these
cells were labelled for Hxt5-HA (Fig. 3A/B, t=0, open arrowhead), but two
hours after transfer of the cells to fresh medium, new (developing) daughter
cells no longer exhibited Hxt5-HA labelling (Fig. 3A/B, t=2, t=4, double-
headed arrows). The internalization and subsequent degradation of Hxt5-HA
was therefore not the only cause of the decrease in signal in figure 1, but the
decrease in Hxt5-HA was also caused by prevention of Hxt5-HA to be

Degradation of Hxt5p
129
incorporated into new buds, because HXT5::HA was no longer expressed and
the existing proteins were not able to diffuse into the membrane of the
developing bud.
Quantification of the immunofluorescence pictures revealed that two
hours after increase of the growth rate, the percentage of cells with strong
Figure 3. Immunofluorescence of Hxt5-HA in starved cells and after
induction of growth. Strain JBY20 was grown to stationary phase and
transferred to fresh, 2% glucose containing YNB medium. Cells were collected at
the moment of inoculation into fresh medium and at each hour. (A) Hxt5-HA
labelling of whole fixed cells. (B) Nuclear staining with DAPI of whole, fixed
cells. Quantification of the immunofluorescence is shown in panel C, with cells
showing strong peripheral labelling (black bars), a weak peripheral labelling
(dark grey bars), punctate internal labelling (light grey bars) and no labelling
(white bars).
C
0%
20%
40%
60%
80%
100%
120%
0 2 3 4
time (h)
relativedistributionoflabel
0 2 3 4 Time (h)
Hxt5-HA
DAPI
A
B

Chapter 6
130
peripheral labelling had decreased from 100% to 27% (Fig. 3C). This
percentage was roughly the same at three hours after induction of the growth
rate, but when the cells reached the exponential phase, this percentage has
dropped to 24%. The percentage of cells that contained a weak peripheral
labelling increased from 0% at t=0h, to 48% after two hours. This labelling was
also relatively the same at three hours after increase of the growth rate, and
remained constant for the next hours. It seemed that the increase in weak
peripheral labelling arose from cells that had lost their strong membrane
labelling. Besides cells with a weak overall labelling, cells without label at the
periphery but with punctate labelling in the cell interior appeared. Two hours
after stationary phase cells were transferred to fresh, 2% glucose containing
medium, 13% of the cells showed punctate labelling, and this increased to 17%
at three hours after transfer. When the cells reached the exponential phase of
batch growth at four hours after transfer, this percentage increased rapidly to
40%.
In addition, unlabeled cells appeared. These cells are most likely the
daughter cells of mothers, which did not incorporate Hxt5-HA in the buds
anymore when they started budding after the addition of growth rate
promoting medium. The percentage of unlabeled cells was relatively constant
from two to three hours after the cells were transferred to growth rate
promoting medium, but increased in the following hour when the cells entered
the exponential phase of batch growth.
Taken together, these data suggest that the decrease in signal observed on
Western blot is caused by both dilution of Hxt5-HA proteins out of the culture
and by internalization and degradation.
Ultrastructural localization of Hxt5-HA
Immunofluorescence microscopy allowed us to define the localization of
Hxt5-HA described above to either the cell periphery or intracellular sites, but
to examine the internalization and degradation of Hxt5-HA in more detail, we
used stationary phase cells and performed immunogold labelling on
cryosections prepared according to Tokuyasu (13). Figure 4 shows a labelling

Degradation of Hxt5p
131
of Hxt5-HA at the plasma membrane (PM) in stationary phase cells. The label
present in the interior of the cell is partially localized to the endoplasmic
reticulum (ER, arrow), vesicular structures (VS) and the vacuole (V). This
labelling suggests a turnover of Hxt5 protein in the stationary phase. The ER
location is for newly synthesized Hxt5p, while the localization to vesicles and
the vacuole stands for the degradation pathway. Very little labelling was
present in the nucleus (N) or mitochondria (M). This internal labelling is in
analogy with the published degradation route of Hxt2p and Hxt7p, which are
internalized via the endocytic pathway (18-20).
Figure 4. Immunogoldlabeling on cryosections of Hxt5-HA in starved
cells. Strain JBY20 was grown to stationary phase and transferred to fresh, 2%
glucose containing YNB medium. Cells were collected 48 hours after the inoculation
of batch growth, , and Hxt5-HA was labeled with immunogold for electron
microscopy. Several ultrastructures are indicated in the figure: CM, cell membrane;
N, nucleus; M, mitochondrion; V, vacuole; VS, vesicular structure; ER, endoplasmic
reticulum. Scale bar 200 nm.

Chapter 6
132
Discussion
The expression of HXT5-HA is regulated by the growth rate and not by
the extracellular glucose concentration as is the case for the major hexose
transporters (2, 5, 8, 9, 21-26).HXT5 is expressed at low growth rates in
nitrogen-limited cultures irrespective of the high glucose concentration (200
mM) in the medium (8). The regulation of HXT5 expression is controlled by
STRE and HAP elements in the promoter (10). Although HAP elements are
regulated by glucose (27, 28), they are independent of Hxk2p. Hxk2p
influences the expression of the major hexose transporters dependent on the
extracellular glucose concentration (2, 11, 29), but deletion of HXK2 did not
derepress the expression of HXT5 (11). The molecular structure of Hxt5-HA on
the other hand is quite similar to that of the major hexose transporters, only
the amino-terminal domain of Hxt5-HA differs significantly from that of the
major hexose transporters (8). Because the induction of HXT5 expression is
regulated differently than that of the major hexose transporters, we were
interested whether the metabolism of the removal of Hxt5-HA from the culture
was also regulated differently as compared to the major hexose transporters
(18-20, 24). Biochemical and immunofluorescence studies demonstrated that
endocytosis, autophagy, and transport to the vacuole are involved in
degradation of the major hexose transporters Hxt2p, Hxt6p and Hxt7p (18-20,
24). Krampe et al. (19) reported a possible involvement of ubiquitination in the
degradation of Hxt6p and Hxt7p. No data are available for ubiquitination of
the other major hexose transporters.
Hxt5 protein levels on Western blot decreased when cells were
transferred to growth-promoting medium. Immunofluorescence studies
revealed that Hxt5-HA translocated from the cell periphery to cell interior,
which suggested internalization and degradation. Stationary phase cells
demonstrated a cell periphery labelling. More internalized label and more
unlabeled cells were visible when cells were kept longer on growth-rate-
promoting medium. This suggests an active degradation process for Hxt5p.
Hxt5-HA was also diluted out of the culture because mother cells in fresh, 2%
glucose did not incorporate Hxt5-HA in the developing bud, while they did

Degradation of Hxt5p
133
during the stationary phase. The increase in internal labelling showed that the
degradation of Hxt5-HA was induced by transfer to growth rate promoting
medium, because the internal labelling would otherwise not have increased
from t=0h to t=4h. The decrease in Hxt5p signal on Western blot is thus
caused by both degradation and dilution of Hxt5p out of the culture.
The clear vacuolar degradation that was observed in previous studies
of Hxt7p (20, 24), which showed a sole vacuole label of Hxt7-GFP, was not
found for Hxt5-HA. The vacuolar degradation of Hxt7 was only observed eight
hours after transferring the cells to medium in which HXT7 is no longer
expressed; Eight hours after HXT5-HA expressing cells were transferred to
fresh medium, the growth rate became slower again as the glucose
concentration became low. The cells were approaching stationary phase again
and therefore HXT5 expression was again induced.
For Hxt7p, it has been show that the amino- and carboxyterminal
domains of the protein are necessary for degradation (20). A part of the
amino-terminal domain of Hxt7p is described to be enriched in proline,
glutamic acid, serine and threonine amino acids (PEST-sequence like) and
such sequences are implicated in ubiquitin-dependent proteolysis (17, 20).
Phosphorylation of serine residues in the PEST-like sequence of the membrane
protein uracil permease was shown to be involved in ubiquitination and
subsequent vacuolar degradation of this transporter (30). Database research
clearly demonstrated the presence of a PEST-sequence in the middle part of
the Hxt5 protein, which is in the longest intracellular loop between
transmembrane domains 6 and 7. PEST sequences have been demonstrated
before in other permeases such as the maltose permease and the uracil
permease (16, 30). Immunodetection with anti-phospho-serine antibodies
demonstrated phosphorylation of at least one serine residue of Hxt5-HA. This
was in analogy with data for the uracil permease (FYR4 gene), of which
multiple serine residues of the PEST-sequence become phosphorylated before
degradation (30). A PEST-like sequence has been reported also for Hxt7 and it
is known that the ubiquitin system is involved in the degradation of this
transporter (20). However, no ubiquitination was found in
immunoprecipitated Hxt5-HA by detection with anti-ubiquitin antibodies.

Chapter 6
134
Therefore, we conclude that the PEST-sequence is probably not involved in the
degradation of Hxt5-HA. The phosphorylation of Hxt5-HA might instead
indicate a regulatory signal induced by improved environmental conditions,
because Hxt5-HA levels only decreased to 66% during the time of Hxt5-HA
phosphorylation on one or more serine residues.
Labelling of cryosections was used to examine in more detail the
localization of Hxt5 in stationary phase cells. The ultrastructural details were
well preserved and several organelles, such as nucleus, mitochondria and
plasma membrane, were identified. In cryosections of stationary phase cells
labelled for electron microscopy, the plasma membrane was labelled. The
internal ultrastructures that labelled during the stationary phase were the
vacuole and probably endocytic structures. The labelling of Hxt5-HA in the ER,
endocytic structures and the vacuole is most likely due to constitutive renewal
of Hxt5-HA.
In conclusion, these data indicate that Hxt5p is degraded via the same
mechanisms as the major hexose transporters Hxt2p, Hxt6p and Hxt7p and
other transporters, namely via endocytosis and transport to plus degradation
in the vacuole. Thus, while the expression of HXT5 and the regulation of
degradation of Hxt5-HA are regulated differently than that of the major hexose
transporters, the degradation mechanisms are similar.
Acknowledgements
We are grateful to Jessica Becker for providing strain JBY20. We are
indebted to René Verwaal for fruitful discussions and practical guidance.

Degradation of Hxt5p
135
References
1. Bisson, L.F., Coons, D.M., Kruckeberg, A.L. and Lewis, D.A. 1993, Crit. Rev. Biochem. Mol. Biol., 28, 259-308.
2. Ozcan, S. and Johnston, M. 1995, Mol. Cell. Biol., 15, 1564-72. 3. Kruckeberg, A.L. 1996, Arch. Microbiol., 166, 283-92. 4. Boles, E. and Hollenberg, C.P. 1997, FEMS Microbiol. Rev., 21, 85-111. 5. Ozcan, S. and Johnston, M. 1999, Microbiol. Mol. Biol. Rev., 63, 554-
69. 6. Reifenberger, E., Freidel, K. and Ciriacy, M. 1995, Mol. Microbiol., 16,
157-67. 7. Wieczorke, R., Krampe, S., Weierstall, T., Freidel, K., Hollenberg, C.P.
and Boles, E. 1999, FEBS Lett., 464, 123-8. 8. Verwaal, R., Paalman, J.W., Hogenkamp, A., Verkleij, A.J., Verrips,
C.T. and Boonstra, J. 2002, Yeast, 19, 1029-38. 9. Diderich, J.A., Schuurmans, J.M., Van Gaalen, M.C., Kruckeberg, A.L.
and Van Dam, K. 2001, Yeast, 18, 1515-24. 10. Verwaal, R., Arako, M., Kapur, R., Verkleij, A.J., Verrips, C.T. and
Boonstra, J. 2004, Yeast, 21, 747-57. 11. Petit, T., Diderich, J.A., Kruckeberg, A.L., Gancedo, C. and Van Dam,
K. 2000, J. Bacteriol., 182, 6815-8. 12. Rodriguez, J. and Deinhardt, F. 1960, Virology, 12, 316-7. 13. Tokuyasu, K.T. 1973, J. Cell Biol., 57, 551-65. 14. Tokuyasu, K.T. 1978, J. Ultrastruct. Res., 63, 287-307. 15. Brondijk, T.H., van der Rest, M.E., Pluim, D., de Vries, Y., Stingl, K.,
Poolman, B. and Konings, W.N. 1998, J. Biol. Chem., 273, 15352-7. 16. Medintz, I., Wang, X., Hradek, T. and Michels, C.A. 2000,
Biochemistry (Mosc). 39, 4518-26. 17. Rechsteiner, M. and Rogers, S.W. 1996, Trends Biochem. Sci., 21, 267-
71. 18. Kruckeberg, A.L., Ye, L., Berden, J.A. and van Dam, K. 1999, Biochem.
J., 339, 299-307. 19. Krampe, S., Stamm, O., Hollenberg, C.P. and Boles, E. 1998, FEBS
Lett., 441, 343-7. 20. Krampe, S. and Boles, E. 2002, FEBS Lett., 513, 193-6. 21. Diderich, J.A., Schepper, M., van Hoek, P., Luttik, M.A., van Dijken,
J.P., Pronk, J.T., Klaassen, P., Boelens, H.F., de Mattos, M.J., van Dam, K. and Kruckeberg, A.L. 1999, J. Biol. Chem., 274, 15350-9.
22. Ko, C.H., Liang, H. and Gaber, R.F. 1993, Mol. Cell. Biol., 13, 638-48. 23. Liang, H. and Gaber, R.F. 1996, Mol. Biol. Cell, 7, 1953-66. 24. Ye, L., Berden, J.A., van Dam, K. and Kruckeberg, A.L. 2001, Yeast, 18,
1257-67. 25. Ozcan, S. and Johnston, M. 1996, Mol. Cell. Biol., 16, 5536-45. 26. Ozcan, S., Leong, T. and Johnston, M. 1996, Mol. Cell. Biol., 16, 6419-
26. 27. Forsburg, S.L. and Guarente, L. 1989, Genes Dev., 3, 1166-78. 28. DeRisi, J.L., Iyer, V.R. and Brown, P.O. 1997, Science, 278, 680-6. 29. Randez-Gil, F., Sanz, P., Entian, K.D. and Prieto, J.A. 1998, Mol. Cell.
Biol., 18, 2940-8.

Chapter 6
136
30. Marchal, C., Haguenauer-Tsapis, R. and Urban-Grimal, D. 1998, Mol. Cell. Biol., 18, 314-21.

Chapter 7
General Discussion

Chapter 7
138
Saccharomyces cerevisiae is able to adjust the length of the cell cycle
by regulation of the length of the G1 phase (1, 2). Several extracellular variables
are able to modulate the length of the G1 phase and one important factor is
nutrient supply. The length of the G1 phase slowly increases with decreasing
fluxes of galactose until a switch point is reached; below that point the G1
phase is swiftly elongated (3). In Chapter 3 is described that not only below a
galactose flux of 18 fmol cell-1 h-1, the G1 phase rapidly elongates, but also
below a glucose flux of 14 fmol cell-1 h-1. Elongation of the G1 phase is known
to be accompanied by accumulation of the reserve carbohydrates trehalose and
glycogen (3, 4). The amount of energy used to accumulate the reserve
carbohydrates is not available for cell cycle progression, which results in an
elongated G1 phase. Cells that are deleted for the ability to store both trehalose
and glycogen are also unable to elongate their G1 phase; probably they use all
available energy for cell cycle progression. These results demonstrate that the
accumulation of trehalose and glycogen is thus not caused by the elongation of
the G1 phase, but that the elongation of the G1 phase is caused by the
accumulation of the reserve carbohydrates trehalose and glycogen.
CLN3 is the first cyclin to be expressed in the G1 phase and Cln3p
forms a complex with the cyclin-dependent kinase Cdc28 (5, 6). The Cln3-
Cdc28 complex induces transcription of the other two G1 cyclins, CLN1 and
CLN2, which encode highly homologous proteins (7-9). The transcription of
CLN1 and CLN2 is facilitated by the SBF transcription factor complex, which
consists of the nuclear, DNA binding protein Swi4 and the regulatory
component Swi6p, which is nuclear during the G1 phase and cytosolic during
the S, G2 and M phase (10-13). The localization of Swi6p is regulated by
phosphorylation on serine 160 by Slt2p (11). Slt2p is the MAPK of the Pkc1-
Slt2 cell wall integrity pathway and this pathway can be activated by
membrane receptors or Cdc28p; although the corresponding cyclin for Cdc28
is not determined yet, it was suggested that Cln1p or Cln2p is this activating
cyclin (14-21). Cln1 protein levels were to dependent on the length of the G1
phase and on the source, while Cln3 protein expression patterns were not
influenced by these variables. Cln1p might therefore be used to determine the
position in the cell cycle while Cln3p is not suitable for that purpose.

General Discussion
139
Swi4 protein expression was restricted to the G1 phase in cells with a
short G1 phase and undetectable in cells with an elongated G1 phase, which
might indicate that the Swi4p levels were lower during an elongated G1 phase.
However, the reduced synchrony of cultures with elongated G1 phases might
decrease the amount of Swi4 per time point below detection level, while the
total amount of Swi4p per cell is not altered. Swi6 protein patterns were
dependent on the carbon source provided to the cells. During both short and
elongated G1 phases on glucose, Swi6 protein was present throughout the cell
cycle.Swi6p levels disappeared after entry into S phase during both short and
elongated G1 phases on galactose. The phosphorylation of Swi6p appeared at
the end of the G1 phase in agreement by the study of Sidorova et al. (11).
The activity of the MAPK Slt2p preceded the phosphorylation of Swi6p
and continued as long as phosphorylated Swi6p was present. Deletion of the
SLT2 gene resulted in severe elongation of the cell cycle. Although more
research is needed, the increase in percentage of budded slt2∆ cells compared
to the percentage of budded wild type cells during batch growth, suggests that
slt2∆ cells are restricted at the morphogenesis checkpoint, which is located in
the G2 phase. Only Swi4p is required for the expression of cell wall genes (22).
Therefore, it is suggested that the phosphorylation of Swi6p enables a cell to
not only express the cyclins required for cell cycle progression via the SBF
complex, but to also express cell wall genes needed to modulate and expand
the cell wall. This cell wall modelling is necessary for bud formation and bud
growth. In this way, the cell can coordinate DNA replication and cell
morphology alteration during the cell cycle.
The regulated activity of another MAPK has been shown before in
yeast cells for the pheromone MAPK pathway but activity of this pathway
arrests a cell in the G1 phase (23). This indicates that activity of MAPK signal
transduction pathways is not always favourable for cell cycle progression.
MAPK signal transduction pathways are preserved from yeast to mammals and
MAPK activity is also regulated in mammalian and other animal cells during
the cell cycle (24). The best-studied MAPK pathway leads to activation of
p44MAPK and p42MAPK and the activity of this cascade is involved in cell cycle

Chapter 7
140
progression during all phases of the cell cycle (25-31). The involvement of yeast
MAPK cascades in cell cycle progression is also not restricted to the G1 phase.
The homology between yeast and mammalian MAPK pathways is
demonstrated in the processes in which the pathways of the different species
are involved. During the G1 phase, the yeast Pkc1-Slt2 pathway is involved, but
also the mammalian MAPK cascade plays a role in progression through the G1
phase. Both pathways are also involved during M phase in spindle pole body
formation or monitoring of its status (22, 26-28).
Quiescent mammalian cells are arrested in the G1 phase and
reactivation of these cells is associated with MAPK activity (29). MAPK activity
is also linked to the G1/S transition (26, 30, 31). The level of MAPK activity
must be controlled as well, as both too high and too low activity of the MAPK
pathway lead to cell cycle arrest (24, 32, 33). DNA synthesis and cell
proliferation is blocked in mammalian cells when the activity of the MAPK
pathway is inhibited by antisense constructs, overexpression of kinase inactive
mutant proteins or inactivation by MPK-1 (30, 31). In S. cerevisiae, inhibition
of Slt2p activity also results in severe cell cycle elongation. Although no data
are published about the direct link between increased Slt2p activity and cell
cycle progression, elevated Slt2 activity after stress is also known to correlate
with cell cycle delay. E.g. mild heat shock and osmotic shock are both known
to delay both bud formation and nuclear division and both stresses are
demonstrated to increase Slt2p activity (34-37). Thus, the regulation of cell
cycle progression by MAPK seems to be conserved from yeast to mammals.
Not only is the activity of MAPK required for cell cycle progression in both
yeast and mammals, overactivity of MAPK results in cell cycle delay.
The prolonged Slt2p activity in a cell cycle with an elongated G1 phase
might also be caused by the accumulation of trehalose. The increased
osmolarity that is caused by accumulation of trehalose activates the HOG
pathway. This leads to activation of the Pkc1-Slt2 pathway in order to remodel
the cell wall (38). Further research is required to explore the activity of Slt2p in
mutants unable to store trehalose, glycogen or both. With that research, it
should be possible to elucidate whether the Slt2 activation, during G1 phase

General Discussion
141
and after S phase entry, is an affect of trehalose accumulation in elongated cell
cycles.
Elongation of the G1 phase was demonstrated before in Chapter 3 to be
regulated by the accumulation of the reserve carbohydrates trehalose and
glycogen. The protein expression of Tps1 did not differ between short and
elongated G1 phases (data not shown) and therefore it is likely that the activity
of the trehalose accumulating complex is regulated. It has been suggested
before that Tps1p, or its product trehalose-6-phosphate, regulates the import
of glucose into the cell by regulation of the Hxt proteins, or the influx of
glucose into glycolysis. Because Tps1p is required during all stages of batch
growth on glucose, an additional regulatory mechanism should restrict
trehalose accumulation to the diauxic shift and the stationary phase. In
Chapter 4, the mutual influence between Tps1/trehalose accumulation and the
hexose transporters HXT1/7 was investigated. Our data show that TPS1 and
Tps1p are expressed throughout batch culture on glucose with an increase in
mRNA expression around the diauxic shift when trehalose accumulation was
initiated Although the expression of the hexose transporters was regulated and
the expression of individual hexose transporters was restricted to specific
periods of batch growth on glucose, the expression of TPS1 or trehalose
accumulation did not coincide with one hexose transporter specifically. During
the stationary phase however, only HXT5 was expressed while trehalose
accumulation continued. Trehalose accumulated at that time had to result
from gluconeogenesis as glucose in the medium was exhausted by then. Single
deletion of HXT-/5 or double deletion of HXT6/7 also had no clear effect on
the accumulation of trehalose after 24 hours of batch growth, although the lack
of effect could well result of redundancy mechanisms as trehalose
accumulation is very important for cell viability (39-43). Trehalose
accumulation is related to low growth rates (3, 4, 42) and stress conditions
(39-47) and we have previously published that expression of HXT5 is also
regulated by the growth rate (48). Fed-batch and continuous culturing data
presented in Chapter 4 indicate that trehalose accumulation coincided with
HXT5 expression under all conditions tested. The correlation between HXT5
expression and trehalose accumulation was strengthened by

Chapter 7
142
coimmunoprecipitation of Hxt5-GFP with Tps1p. Addition of glucose to wild-
type stationary phase cells, resulted in coimmunoprecipitation of Tps1p and
Hxt5p. This binding was lost after 30 minutes, indicating that Tps1p only
transiently binds Hxt5p after addition of glucose, or that after addition of
glucose the Tps1-Hxt5 complex is more stable. We propose the existence of a
functional complex of Hxt5p and Tps1p during stationary phase. In this
complex, probably Hxk2p is included, because the early steps in glucose
metabolism can then be exerted in a vectorial process. In addition, tps1∆ cells
become able to grow on glucose upon deletion of HXK2 (49) and this supports
that some interaction exists between Hxk2p and Tps1p. In the suggested
model, glucose transported into the cell by Hxt5p is phosphorylated by Hxk2p
and subsequently shuttled to trehalose accumulation via Tps1 or to the
glycolysis. This complex would enable a cell to cope with fresh glucose after
exhaustion and therefore we named it the glucose-response complex (GRC).
As Hxt5p was suggested to be a hexose transporter which would
transport glucose after this became available again (50), Hxt5p was expected to
localize at the plasma membrane. Electron microscopy studies showed
however that Hxt5p was localized mainly at the endoplasmic reticulum and
hardly at the plasma membrane. This study again shows the great value of high
resolution images obtained by election microscopy as Hxt5p was initially
localized to the plasma membrane by (immuno)fluorescence examination of
the localization of Hxt5-GFP or Hxt5-HA. The part of Hxt5p that is localized to
the plasma membrane might account for the initial glucose uptake once this
carbon source becomes available again. Although the Gal2p galactose
transporter is also thought to be able to transport glucose (51), initial influx of
glucose is probably completely dependent on Hxt5p activity during growth on
non-fermentable carbon sources like ethanol. The low presence of Hxt5p on
the plasma membrane might explain the low growth rate of an HXT5-only
mutant while the affinity of this transporter for glucose is moderate (50).
A possible role for Hxt5p in the endoplasmic reticulum membrane
might be found by homology of Hxt5p and GLUT7 in mammalian cells (52).
GLUT7 is also localized at the endoplasmic reticulum and is responsible for
transport of glucose derived by gluconeogenesis out of the endoplasmic

General Discussion
143
reticulum. The final step of gluconeogenesis, from glucose-6-phosphate to
glucose, is in mammalian cells performed in the endoplasmic reticulum. In
yeast cells, the localization of gluconeogenesis is not known, but might be
exerted at the same place as in mammalian cells. The localization of Hxt5p and
the correlation between HXT5 expression and trehalose accumulation
strengthen the suggestion that the glucose stored as trehalose after the diauxic
shift is derived from gluconeogenesis and that Hxt5p is involved in these
processes.
Although is seems not logical for yeast cells to make free glucose,
which can be transported out of the cells via hexose transporters, it was
reported before that Hxt5p plays a role in efflux of glucose during ethanol-
limited continuous cultures (53). The low abundance of Hxt5p on the plasma
membrane compared to amount of Hxt5p on the ER membranes might restrict
this efflux of glucose. The glucose obtained by gluconeogenesis might be
immediately converted to trehalose via the TPS complex which is bound to
Hxt5p. The minor loss of glucose via Hxt5p in the plasma membrane might be
the offer yeast cells bring to be also able to respond quickly to new glucose.
The mechanism by which the GRC regulates the influx of glucose into
glycoslysis was studied in Chapter 5. Disruption of the GRC by deletion of TPS1
had a strong effect on the expression of all of the hexose transporters.
Expression of the hexose transporters was not induced when tps1∆ cells were
transferred to glucose containing medium. Although these data might suggest
a stimulatory role for TPS1 in the expression of the hexose transporters, it is
more likely that rapid energy depletion after glucose addition was responsible.
This assumption is strengthened by the report of Thevelein and Hohmann (54)
that addition of glucose, even at very low concentrations, to galactose grown
tps1∆ caused growth arrest by rapid depletion of ATP and Pi, together with an
increase in initial sugar phosphates of glycolysis, especially fructose-1,6-
biphosphate (54).
In Chapter 6, the metabolism of Hxt5p was studied. Hxt5p was
removed from the cultures by both degradation and diminishing the number of
cells containing Hxt5p. The lowering of Hxt5p positive cells was achieved by

Chapter 7
144
restriction of Hxt5p to the mother cells and no incorporation of Hxt5p into
daughter cells anymore. Ubiquitination of Hxt5p was not detected, although
the protein sequence contains a putative PEST sequence and the Hxt5 protein
was transiently phosphorylated on one or more serine residues after the
addition of glucose to stationary phase cells. This serine phosphorylation
coincided with the interaction of Tps1p and Hxt5p, and therefore this serine
phosphorylation might not be a degradation signal but an activity regulating
signal. Another clue for this assumption is that the transient phosphorylation
was gone within one hour, whereas more than 60% of the protein was still
present at that time. The phosphorylation of Hxt5p further coincided with the
coimmunoprecipitation of Hxt5p and Tps1p. This indicates that the
phosphorylation of Hxt5p and the activity of the GRC are linked.
Electron microscopic analysis showed that the majority of Hxt5p was
localized to the endoplasmic reticulum (ER) just below the plasma membrane
and only a small fraction was localized to the plasma membrane itself (see
Chapter 4). Examination of the localization of Hxt5p in stationary phase cells
revealed that Hxt5p was not only localized at the endoplasmic reticulum and
the plasma membrane, but also at vesicular structures and the vacuole. A part
of the labelling at the endoplasmic reticulum and the labelling in vesicular
structures and the vacuole might represent the renewal of Hxt5p at the plasma
membrane. This degradation pathway for Hxt5p is similar to that of the major
hexose transporters Hxt2p, Hxt6p and Hxt7p. Together, the data presented in
Chapter 4, 5 and 6 make clear that Hxt5p has very different roles in growth
than the major hexose transporters and is subject to modification by
phosphorylation, but is degraded in via similar routes.

General Discussion
145
References
1. Carter, B.L. and Jagadish, M.N. 1978, Exp. Cell Res., 112, 15-24. 2. Johnston, G.C., Singer, R.A., Sharrow, S.O. and Slater, M.L. 1980, J.
Gen. Microbiol., 479-84. 3. Paalman, J.W., Verwaal, R., Slofstra, S.H., Verkleij, A.J., Boonstra, J.
and Verrips, C.T. 2003, FEMS Yeast Res, 3, 261-8. 4. Silljé, H.H., ter Schure, E.G., Rommens, A.J., Huls, P.G., Woldringh,
C.L., Verkleij, A.J., Boonstra, J. and Verrips, C.T. 1997, J. Bacteriol., 179, 6560-5.
5. MacKay, V.L., Mai, B., Waters, L. and Breeden, L.L. 2001, Mol. Cell. Biol., 21, 4140-8.
6. Cross, F.R. and Blake, C.M. 1993, Mol. Cell. Biol., 13, 3266-71. 7. Hadwiger, J.A., Wittenberg, C., Richardson, H.E., de Barros Lopes, M.
and Reed, S.I. 1989, Proc. Natl. Acad. Sci. U. S. A., 86, 6255-9. 8. Stuart, D. and Wittenberg, C. 1995, Genes Dev., 9, 2780-94. 9. Tyers, M., Tokiwa, G. and Futcher, B. 1993, EMBO J., 12, 1955-68. 10. Queralt, E. and Igual, J.C. 2003, Mol. Cell. Biol., 23, 3126-40. 11. Sidorova, J.M., Mikesell, G.E. and Breeden, L.L. 1995, Mol. Biol. Cell,
6, 1641-58. 12. Nasmyth, K. and Dirick, L. 1991, Cell, 66, 995-1013. 13. Sidorova, J. and Breeden, L. 1993, Mol. Cell. Biol., 13, 1069-77. 14. Lee, K.S., Irie, K., Gotoh, Y., Watanabe, Y., Araki, H., Nishida, E.,
Matsumoto, K. and Levin, D.E. 1993, Mol. Cell. Biol., 13, 3067-75. 15. Verna, J., Lodder, A., Lee, K., Vagts, A. and Ballester, R. 1997, Proc.
Natl. Acad. Sci. U. S. A., 94, 13804-9. 16. Rajavel, M., Philip, B., Buehrer, B.M., Errede, B. and Levin, D.E. 1999,
Mol. Cell. Biol., 19, 3969-76. 17. Ketela, T., Green, R. and Bussey, H. 1999, J. Bacteriol., 181, 3330-40. 18. Philip, B. and Levin, D.E. 2001, Mol. Cell. Biol., 21, 271-80. 19. Zu, T., Verna, J. and Ballester, R. 2001, Mol. Genet. Genomics, 266,
142-55. 20. Marini, N.J., Meldrum, E., Buehrer, B., Hubberstey, A.V., Stone, D.E.,
Traynor-Kaplan, A. and Reed, S.I. 1996, EMBO J., 15, 3040-52. 21. Zarzov, P., Mazzoni, C. and Mann, C. 1996, EMBO J., 15, 83-91. 22. Madden, K., Sheu, Y.J., Baetz, K., Andrews, B. and Snyder, M. 1997,
Science, 275, 1781-4. 23. Gustin, M.C., Albertyn, J., Alexander, M. and Davenport, K. 1998,
Microbiol. Mol. Biol. Rev., 62, 1264-300. 24. Hulleman, E. and Boonstra, J. 2001, Cell. Mol. Life Sci., 58, 80-93. 25. Volmat, V. and Pouyssegur, J. 2001, Biol. Cell., 93, 71-9. 26. Hulleman, E., Bijvelt, J.J., Verkleij, A.J., Verrips, C.T. and Boonstra, J.
1999, J. Cell. Physiol., 180, 325-33. 27. Khalfan, W., Ivanovska, I. and Rose, M.D. 2000, Genetics, 155, 1543-
59. 28. Wang, X.M., Zhai, Y. and Ferrell, J.E., Jr. 1997, J. Cell Biol., 137, 433-
43. 29. Ladha, M.H., Lee, K.Y., Upton, T.M., Reed, M.F. and Ewen, M.E. 1998,
Mol. Cell. Biol., 18, 6605-15.

Chapter 7
146
30. Pages, G., Lenormand, P., L'Allemain, G., Chambard, J.C., Meloche, S. and Pouyssegur, J. 1993, Proc. Natl. Acad. Sci. U. S. A., 90, 8319-23.
31. Brondello, J.M., McKenzie, F.R., Sun, H., Tonks, N.K. and Pouyssegur, J. 1995, Oncogene, 10, 1895-904.
32. Woods, D., Parry, D., Cherwinski, H., Bosch, E., Lees, E. and McMahon, M. 1997, Mol. Cell. Biol., 17, 5598-611.
33. Sewing, A., Wiseman, B., Lloyd, A.C. and Land, H. 1997, Mol. Cell. Biol., 17, 5588-97.
34. Chowdhury, S., Smith, K.W. and Gustin, M.C. 1992, J. Cell Biol., 118, 561-71.
35. Delley, P.A. and Hall, M.N. 1999, J. Cell Biol., 147, 163-74. 36. Kamada, Y., Jung, U.S., Piotrowski, J. and Levin, D.E. 1995, Genes
Dev., 9, 1559-71. 37. Garcia-Rodriguez, L.J., Valle, R., Duran, A. and Roncero, C. 2005,
FEBS Lett., 579, 6186-90. 38. Mensonides, F.I., Brul, S., Klis, F.M., Hellingwerf, K.J. and Teixeira de
Mattos, M.J. 2005, Appl. Environ. Microbiol., 71, 4531-8. 39. Nwaka, S., Kopp, M., Burgert, M., Deuchler, I., Kienle, I. and Holzer,
H. 1994, FEBS Lett., 344, 225-8. 40. Van Dijck, P., Colavizza, D., Smet, P. and Thevelein, J.M. 1995, Appl.
Environ. Microbiol., 61, 109-15. 41. Plourde-Owobi, L., Durner, S., Goma, G. and Francois, J. 2000, Int. J.
Food Microbiol., 55, 33-40. 42. Silljé, H.H., Paalman, J.W., ter Schure, E.G., Olsthoorn, S.Q., Verkleij,
A.J., Boonstra, J. and Verrips, C.T. 1999, J. Bacteriol., 181, 396-400. 43. Hazell, B.W., Nevalainen, H. and Attfield, P.V. 1995, FEBS Lett., 377,
457-60. 44. Singer, M.A. and Lindquist, S. 1998, Trends Biotechnol., 16, 460-8. 45. Guillou, V., Plourde-Owobi, L., Parrou, J.L., Goma, G. and Francois, J.
2004, FEMS Yeast Res, 4, 773-87. 46. Francois, J. and Parrou, J.L. 2001, FEMS Microbiol. Rev., 25, 125-45. 47. Parrou, J.L., Enjalbert, B., Plourde, L., Bauche, A., Gonzalez, B. and
Francois, J. 1999, Yeast, 15, 191-203. 48. Verwaal, R., Paalman, J.W., Hogenkamp, A., Verkleij, A.J., Verrips,
C.T. and Boonstra, J. 2002, Yeast, 19, 1029-38. 49. Hohmann, S., Neves, M.J., de Koning, W., Alijo, R., Ramos, J. and
Thevelein, J.M. 1993, Curr. Genet., 23, 281-9. 50. Diderich, J.A., Schuurmans, J.M., Van Gaalen, M.C., Kruckeberg, A.L.
and Van Dam, K. 2001, Yeast, 18, 1515-24. 51. Andre, B. 1995, Yeast, 11, 1575-611. 52. Waddell, I.D., Zomerschoe, A.G., Voice, M.W. and Burchell, A. 1992,
Biochem. J., 286 ( Pt 1), 173-7. 53. Diderich, J.A., Schepper, M., van Hoek, P., Luttik, M.A., van Dijken,
J.P., Pronk, J.T., Klaassen, P., Boelens, H.F., de Mattos, M.J., van Dam, K. and Kruckeberg, A.L. 1999, J. Biol. Chem., 274, 15350-9.
54. Thevelein, J.M. and Hohmann, S. 1995, Trends Biochem. Sci., 20, 3-10.

Samenvatting
147
Samenvatting
De gist Saccharomyces cerevisiae is bij de meeste mensen bekend
onder de naam ‘bakkersgist’. De bekendste toepassing van deze gist is het
gebruik voor het rijzen van brood, maar gist wordt ook gebruikt voor de
productie van alcohol in bier en wijn.
Gisten, maar ook planten, mensen en dieren zijn eukaryote
organismen terwijl bacteriën prokaryoot zijn. Het verschil tussen deze twee
groepen is dat in prokaryoten alle processen in de cel in één ruimte
plaatsvinden, en in eukaryoten is de cel opgedeeld in ‘hokjes’, de zogenaamde
organellen. In deze organellen worden verschillende processen in de cel
gescheiden en gereguleerd. Voorbeelden van die organellen zijn de kern en het
mitochondrion. In de kern ligt erfelijk materiaal (DNA) opgeslagen en een
mitochondrion is vergelijkbaar met een energiecentrale van een cel. Het DNA
in een kern bevat heel veel informatie. Deze informatie is opgedeeld in kleinere
stukjes, zoals een hoofdstukje in een encyclopedie. Elk hoofdstukje heet een
gen, en een cel kan dit hoofdstukje lezen en vertalen naar een boodschapper
RNA of messenger RNA (mRNA). Hoe vaak een cel dit hoofdstukje leest, dus
hoeveel mRNA er gemaakt wordt, is een maat voor de expressie van een gen.
Deze expressie wordt gereguleerd door een stukje DNA net voor het gen (de
promoter) samen met eiwitten die aan deze promoter binden. Het gemaakte
mRNA wordt buiten de kern, in het organel ‘endoplasmatisch reticulum’,
vertaald in eiwit.
Gist is een organisme dat bestaat uit één cel, terwijl mensen en dieren
uit miljarden cellen bestaan en daardoor multi-cellulaire organismes zijn. Door
hun ééncelligheid worden gisten vaak gebruikt als modelsysteem om processen
in menselijke of dierlijke cellen mee te bestuderen. De gistcel is in staat zich
veel sneller voort te planten dan mensen en dieren als organismen en sneller
dan menselijke en dierlijke cellen in laboratoriumkweek. Eén van de processen
die bestudeerd wordt in gist is dan ook de celdeling. De celdeling wordt ook
wel celcyclus genoemd en wordt opgedeeld in vier fasen. (Hfdst. 2, fig. 1)
namelijk de G1, S, G2 en M fase. In de G1 fase bereidt een cel zich voor op de
komende celcyclus. In de S fase wordt het DNA verdubbeld. In de G2 fase

148
wordt onder andere gecontroleerd of het verdubbelen van het DNA goed is
verlopen en of de structuur van de cel het toestaat om de gaan delen. In de M
fase wordt het verdubbelde DNA netjes verdeeld over de twee nieuwe cellen en
splitsen de cellen zich van elkaar.
Om ervoor te zorgen, dat deze complexe processen goed verlopen,
hebben eukaryote cellen controlepunten ingebouwd in hun celcyclus. Wanneer
er ernstige fouten ontstaan in deze controlepunten, kan dat ertoe leiden dat
een cel niet meer deelt, of ongecontroleerd gaat delen. In multi-cellulaire
organismes is deze laatste verstoring bekend als kanker. De te controleren
processen in de G2 fase zijn hierboven genoemd. In de G1 fase controleert een
cel of de omgeving goed genoeg is om een nieuwe ronde van de celcyclus te
starten. In gist is er één controlepunt in de G1 fase en dit punt heet ‘Start’. Eén
van de belangrijkste omgevingsfactoren die de cel meet op Start is de
hoeveelheid nutriënten. De hoeveelheid nutriënten regelt hoe snel een cel de
G1 fase kan doorlopen. Ook de kwaliteit van de nutriënten speelt een rol in de
lengte van de G1 fase. Cellen halen de meeste energie uit glucose en groeien
daarom ook het snelst op glucose. Omdat de lengte van de celcyclus
voornamelijk bepaald wordt door de lengte van de G1 fase, is de G1 fase op
glucose dus het kortst. De aanwezigheid van nutriënten regelt de snelheid en
hoeveelheid van de aanmaak van bepaalde eiwitten de belangrijk zijn voor de
progressie door de celcyclus. Deze eiwitten zijn specifiek voor de fase van de
celcyclus en heten cyclines. Er zijn drie G1-fase cyclines en deze activeren om
beurten het eiwit Cdc28 tijdens de G1 fase. Cln3 is het eerste eiwit dat
verhoogd wordt in de G1 fase en het Cln3-Cd28 complex zorgt voor vorming
van een complex van Swi4 en Swi6. Dit Swi4,6 complex in betrokken bij de
transcriptie van CLN1 en CLN2 mRNA, die vertaald worden in Cln1 en Cln2
eiwitten. Waarschijnlijk kunnen deze eiwitten samen met Cdc28 zorgen voor
de activatie van Slt2, dat deel uitmaakt van de Pkc1-Slt2 celwand-
integriteitsroute. Slt2 is betrokken bij veranderingen in de celwand die nodig
zijn voor de vorming van de dochtercel. Cln1- en Cln2-Cdc28 complexen
zorgen ook voor het aanzetten van DNA verdubbeling. De koppeling van DNA
verdubbeling en celwandverandering zorgt ervoor dat een cel steeds zijn DNA
verdubbeld als er ook een dochtercel gevormd wordt en andersom.

Samenvatting
149
In hoofdstuk 3 staat beschreven hoe de lengte van de G1 fase verandert
wanneer de hoeveelheid glucose of galactose (suikerflux) wordt verminderd. In
normale, wild type cellen worden reservestoffen aangemaakt en de G1 fase
verlengd wanneer de cellen gegroeid worden met een lage suikerflux. In
gemuteerde cellen die geen reservestoffen kunnen maken, wordt de G1 fase
ook niet verlengd. Tevens wordt in dit hoofdstuk beschreven hoe de niveaus
van G1 cycline-eiwitten veranderen tijdens de G1 fase wanneer deze lang of
kort is en of deze verandert wanneer cellen gevoed worden met galactose in
plaats van met glucose. Als laatste wordt in hoofdstuk 3 beschreven dat Slt2
geactiveerd wordt aan het midden van de G1 fase en dat deze activatie
doorloopt tot in de S fase tijdens groei met een hoge suikerflux. Wanneer
cellen met een lage suikerflux gegroeid worden, bouwt de cel ook
reservestoffen op. Deze veranderen de samenstelling in de cel al zodanig, dat
de celwand aangepast moet worden en Slt2 wordt dan inderdaad in het
midden van de G1 fase geactiveerd, maar deze activatie stopt niet in de S fase.
Het gebruik van gist in de levensmiddelenindustrie wordt steeds
verder gemodificeerd om de opbrengst en smaak van de levensmiddelen te
optimaliseren. Tijdens hun overleving en voortplanting hebben gisten
voedingsbronnen zoals koolstof en stikstof nodig. Om gist verder te
optimaliseren, moet eerst bekend zijn hoe de cel voedingsstoffen opneemt en
verwerkt. In dit perspectief wordt ook gekeken naar de opname van glucose.
De cel kan niet zomaar glucose opnemen, maar gebruikt hiervoor hexose
transporter-eiwitten (Hxt’s) die in de celmembraan zitten. Er zijn verschillende
Hxt’s in gist, maar er zijn er slechts 7 belangrijk, Hxt1,2,3,4,5,6 en 7. Deze
belangrijke Hxt’s zijn betrokken bij het opnemen van glucose. Dit glucose kan
door de cellen meteen gebruikt worden om energie te krijgen, maar kan ook
worden opgeslapen in de reservestoffen trehalose en glycogeen. Bij
verschillende concentraties glucose in het medium komen verschillende Hxt’s
tot expressie. Alleen de expressie van HXT5 wordt bepaald door de
groeisnelheid van de cel, en niet door de hoeveelheid glucose in de omgeving.
In hoofdstuk 4 staat beschreven dat Hxt5 betrokken is bij de opbouw
van de reservestof trehalose. Onder alle geteste omstandigheden werd HXT5
tot expressie gebracht als trehalose werd opgebouwd. Belangrijk is vooral dat

150
HXT5 tot expressie wordt gebracht nadat de glucose in de omgeving was
opgebruikt. Cellen maken dan zelf glucose vanuit bijvoorbeeld eiwitten of
ethanol, via een proces dat gluconeogenese heet. In zoogdiercellen vindt de
laatste stap van dit proces plaats in een organel dat het endoplasmatisch
reticulum genoemd wordt. Een glucose transporter die verwant is aan Hxt5
transporteert daar de nieuwe glucose dan vanuit dit organel de ‘vrije ruimte’
van de cel, het cytoplasma, in. In gist, zit Hxt5 ook in het endoplasmatisch
reticulum, wat erop wijst dat Hxt5 ook betrokken is bij de gluconeogenese.
Hxt5 zit in een complex samen met het belangrijkste eiwit van de trehalose-
opbouw, Tps1. Het bestaan van een complex dat de invoer van glucose (vanuit
de omgeving de cel in) reguleert wordt voorgesteld en bestaat uit tenminste
Hxt5 en Tps1. Dit complex is het ‘glucose-response complex’ genoemd, vrij
vertaald het ‘glucose-beantwoordend complex’.
In hoofdstuk 5 wordt beschreven welke functie het glucose-
beantwooordend complex heeft in gehongerde cellen en hoe dit complex werkt.
Wanneer Tps1 niet aanwezig is in cel, kan het glucose-beantwoordend complex
niet functioneren. Wanneer gehongerde cellen dan nieuw glucose krijgen,
wordt de invoer van glucose niet gereguleerd. Dit is wel nodig, omdat de eerste
stappen waarbij glucose wordt omgezet in energie, eerst energie kosten in
plaats van opleveren. De cellen die Tps1 missen, verbruiken al hun energie als
ze glucose krijgen en gaan dood.
De expressie van de HXT5 wordt anders gereguleerd dan de expressie
van de andere belangrijkde Hxt’s. Daarom is in hoofdstuk 6 beschreven via
welke routes in de cel, Hxt5 wordt afgebroken. Hxt5 volgt dezelfde routes als
de belangrijke Hxt’s, maar de regulatie van de afbraak is waarschijnlijk anders.
De belangrijke Hxt’s hebben een bepaalde volgorde in de bouwstenen van het
eiwit, dat de PEST-sequentie wordt genoemd. Het hebben van deze sequentie
gaat vaak samen met een modificatie van het eiwit net voordat het wordt
afgebroken. Dit heet ubiquitinering en daarbij worden één of meerdere
ubiquitine (dit is ook een bepaald eiwit) moleculen aan het af te breken eiwit
geplakt. Hoewel Hxt5 ook een PEST-sequentie heeft, wordt Hxt5 niet
geubiquitineerd. Wel wordt Hxt5 op een andere manier gemodificeerd,
namelijk met behulp van een fosfaat-groep. Deze modificatie is echter

Samenvatting
151
waarschijnlijk niet betrokken bij de afbraak, omdat de meeste afbraak pas
gebeurd als de fosfaat-groep alweer van Hxt5 af is. De aanwezigheid van de
fosfaat-groep en het glucose-beantwoordend complex komen tegelijk voor, en
daarom wordt gesuggereerd dat de fosfaat-groep misschien een regulerende
rol heeft in het glucose-beantwoordend complex.
In hoofdstuk 7 zijn de resultaten zoals beschreven in dit proefschrift
aan elkaar gekoppeld en in een breder perspectief geplaatst. De
overeenkomsten van Hxt5 met een glucose transporter in zoogdiercellen toont
aan, dat zelfs een mechanisme dat van belang is om een multi-cellulair
organisme te allen tijden van voldoende glucose te voorzien, geconserveerd is
vanaf het relatief eenvoudige organisme Saccharomyces cerevisiae.


153
Dankwoord
In dit stukje wil ik graag iedereen bedanken die een bijdrage heeft
geleverd aan het tot stand komen van dit proefschrift.
Ten eerste bedank ik mijn promoter Johannes. Jouw deur stond altijd
open als ik weer eens ergens niet uitkwam, of als ik resultaten had waarvan ik
vond dat je ze gelijk moest zien. Bedankt voor de vele discussies, het corrigeren
van mijn teksten en de grote vrijheid die ik heb gekregen om dit onderzoek uit
te voeren. Ik zal proberen in de toekomst minder te stressen, ik weet nu wel
dat het niet altijd hoeft.
Mijn copromoter, Bruno, wil ik graag bedanken voor de electronen-
microscopie en het corrigeren van mijn teksten. Dat je niet altijd alle
achtergrond informatie wist, blijf ik een voordeel vinden. Jouw commentaar en
vragen hielpen enorm om mijn experimenten te optimaliseren en mijn teksten
te verduidelijken.
Mijn (ex-)collega’s op het gist-lab. René, bedankt voor alles wat je me
hebt geleerd en wat ik verder mocht uitzoeken en nu in dit proefschrift
beschreven staat. Jouw bijdrage had ik niet kunnen missen! Jammer dat je niet
bij mijn verdediging kunt zijn, maar je hebt een goed excuus ;-) Sung, Victor en
Yvonne, bedankt voor jullie hulp op het lab. Mireille ,Marc en Christophe,
jullie brachten weer leven op het lab. Bedankt voor jullie gezelligheid! Marc,
succes met jouw promotie-onderzoek! Mercè, thank you for your help with the
cell cycle studies. Good luck with your own PhD study!
Lan en Elly, zonder jullie was de electronenmicroscopie niet gelukt.
Heel erg veel dank daarvoor! Het is mooier en beter dan ik voor mogelijk hield.
Miriam, Inge, Bart en Michael, bedankt voor jullie gezelschap op
N504! Ik zal de thee- en koffietijd erg missen. Michael, ik verwacht wel een
boekje van je hoor. Willie, Jan Andries, Chris, Fons, Hans en Cor, bedankt
voor jullie gezelligheid aan de koffietafel zo ’s morgens vroeg.
De andere AiO’s: Maarten, Erik, Misjaël, David, Rinse, bedankt voor
de afgelopen tijd en succes met jullie eigen promotie. Verder bedank ik Alya,
Anje, Antje, Arie, Bram K., Bram M,Cristina, Edward, Elsa, Frits, Hendrik,
Henk, Ilse, Irina, Jarno, Jord, José, Koert, Louise, Maurice, Mika, Mohammed,

154
Montse, Nuria, Paul, Peter, Pim, Ramon, Renée, Rob, Smiriti, Theo vd K, Theo
V, Ulrike, Wally en alle studenten van de afgelopen jaren voor jullie hulp en
vooral jullie gezelligheid. Cor en Ton, bedankt voor het brengen van de
bestellingen, en dat ik altijd even mocht komen winkelen.
Angélique, bedankt voor de steun en gezelligheid die je me de
afgelopen jaren hebt gegeven. Je hebt me er het laatste jaar echt doorheen
gesleept: bedankt! Ik vind het geweldig dat je mijn paranimf wilt zijn!
Hedi, bedankt dat ik jouw paranimf mocht zijn. Jammer dat je niet bij
mijn verdediging kunt zijn. Heel veel succes in de USA en we houden contact!
Janine, Sultana en Marjolein: onze lunchafspraken liepen nogal eens
mis, maar het was altijd wel gezellig. Janine, succes met de laatste loodjes van
je eigen promotie!
Nathalie, bedankt voor je vriendschap, en het begrip dat ik de laatste
tijd niet genoeg tijd voor je kon vrijmaken. Dat gaat veranderen!
Daniëlle, Maarten, Joyce, Michiel, Patrik, Inge: bedankt voor jullie
vriendschap en het aanhoren van mijn verhalen. Het is allemaal gelukt. Joyce,
jouw promotie is nog even weg, maar het gaat je lukken!
Lieve familie, allemaal heel erg bedankt voor jullie interesse en steun!
Zonder jullie hulp was ik nooit zo ver gekomen. In het bijzonder: lieve pap en
mam, bedankt dat jullie me altijd hebben gesteund, eerst tijdens mijn studie,
nu met mijn promotie. Grote broers Jacky en Mike, zo’n klein zusje is niet
altijd makkelijk hè. Bedankt voor jullie steun en gezelligheid. Jacky, hopelijk
heb ik nu even geen kaarsje meer nodig. Mike, heel erg bedankt dat je mijn
paranimf wilt zijn! Jeannette en Hilde, bedankt voor de gezelligheid en dat ik
altijd even kon uitbuien bij jullie en de kinderen. Jeffrey, Joury en Emma,
jullie tijd komt nog wel ;-) Bedankt voor jullie kind-zijn. Lieve David, heel erg
bedankt voor je steun, geduld, begrip en zorg in de afgelopen jaren, maar
vooral tijdens de laatste paar maanden.

155
List of publications
Vermeer H, Hendriks-Stegeman BI, van Suylekom D, Rijkers GT, van Buul-
Offers SC, Jansen M. An in vitro bioassay to determine individual sensitivity
to glucocortiods: induction of FKBP51 mRNA in peripheral blood mononuclear
cells. Molecular and Cellular Endocrinology, April 15 2004, 218(1-2): 49-55.
Fouraux MA, Deneka M, Ivan V, van der Heijden A, Raymackers J, van
Suylekom D, van Venrooij WJ, van der Sluijs P, Pruijn GJ. Rabip4’ is an
effector of rab5 and rab4 and regulates transport through early endosomes.
Molecular Biology of the Cell, February 15 2004, 15 (2): 611-24
Van Suylekom D, Verwaal R, Winter W, Verrips T, Boonstra J. Nutrient driven
cell cycle progression in Saccharomyces cerevisiae. Recent Research
Developments in Molecular and Cellular Biology, 2003 (1): 99-119.
Van Suylekom D, van Donselaar E, Nguyen Do Ngoc L, Humbel B, Boonstra J.
Degradation of the hexose transporter Hxt5p in Saccharomyces cerevisiae. l
(Submitted for publication)


157
Curriculum Vitae
Denise van Suylekom werd geboren op 20 maart 1979 in Oosterhout. In 1997
behaalde zij haar diploma aan het St. Oelbert Gymnasium in Oosterhout In
datzelfde jaar begon zij met haar studie Medische Biologie aan de Universiteit
Utrecht. Tijdens haar studie werd een eerste stage gelopen bij Pedriatische
Endocrinologie in het Wilhelmina Kinderziekenhuis in Utrecht onder
begeleiding van Dr. Maarten Jansen en Drs. Harry Vermeer. Een tweede stage
werd gelopen bij Celbiologie onder begeleiding van Dr. Peter van der Sluijs en
Drs. Magda Deneka. In 2002 werd de studie voltooid en begon zij als assitent
in opleiding aan de Universiteit Utrecht bij de vakgroep Cellular Architecture
and Dynamics onder begeleiding van Prof. Dr. Johannes Boonstra en Dr.
Bruno Humbel. Tijdens deze periode werd het promotieonderzoek zoals
beschreven in dit proefschrift verricht. Vanaf half april 2006 is de schrijfster
werkzaam bij YACHT als interim professional en is gedetacheerd bij DSM.
