treatment of nucleation and bubble dynamics in high heat...
TRANSCRIPT

TREATMENT OF NUCLEATION AND BUBBLE DYNAMICS IN HIGH HEAT FLUX FILM BOILING
Y. Liu and N. DinhDepartment of Nuclear Engineering,
North Carolina State UniversityRaleigh, NC 27695-7909, USA
[email protected], [email protected]
ABSTRACT
This paper reports results of a study of nucleate boiling on a thin liquid film at high heat fluxes. A method to identify and characterize active nucleation sites based on processing of heater surface temperature and local cooling/heating rate is developed. This method is applied to a select dataset of infrared thermometry imaging. The nucleation site density data are compared other literature data and correlations. A large variation and significant uncertainty was observed. Besides that, a range of data analysis is performed. The nucleation temperature, nucleation site distribution, nucleation rate, as well as the neighboring nucleation site distance was analyzed. The extracted data are used to benchmark fundamental modeling assumptions used in current treatments of nucleation and bubble dynamics, particularly for their applicability in high heat flux conditions. Attention is paid on stochastic, dynamic behaviors of nucleation. This scoping study also aims to provide suggestions on design of validation experiments and data processing procedures that enable assessment of model form uncertainty in wall boiling models at high heat fluxes.
KEYWORDSNucleate Boiling; Thin Liquid Film; High Heat Flux; Vapor Bubble; Nucleation Sites
1. INTRODUCTION
This paper is concerned with state-of-the-arts modeling and simulation capability to predict two-phase flow (TPF) and boiling heat transfer (BHT) processes. The modern capability referred here is based on two-fluid time or space averaged models, ranging from one-dimensional Eulerian-Eulerian formulation, to sub-channel analysis (SCA), and multi-dimensional Computational Multiphase Fluid Dynamics (CMFD) codes [1] [2] [3]. In the two-fluid models conservation equations of mass, momentum and energy are completed by a set of constitutive laws for inter-phase exchanges of mass, momentum, and energy. For example, wall boiling heat transfer models are used to derive closure relationships for mass exchange (evaporation), and energy sources (heat partitioning). Currently, the wall boiling model is based on nucleation parameters including nucleation site density (NSD), bubble departure diameter (BDD), and bubble departure frequency (BDF).
It is noted that the SCA and CMFD capabilities are developed and applied for Thermal-Hydraulic analysis in the Consortium for Advanced Simulation of Light Water Reactors (CASL). Previous work including sensitivity/uncertainty study conducted by CASL researchers on nuclear reactor thermal-hydraulics methods identified high sensitivity of the prediction to boiling heat transfer models, particularly to nucleation site density [4] [5]. In fact, it is well established that a physics-based sound understanding of nucleation behavior is essential to modeling and prediction of boiling thermal-hydraulics. However, a
4097NURETH-16, Chicago, IL, August 30-September 4, 2015 4097NURETH-16, Chicago, IL, August 30-September 4, 2015

formidable challenge in assessing applicability of differing models lies with lack of observations and measurements of complex two-phase flow processes in high heat flux flow boiling.
In this paper, vapor bubble nucleation in high heat flux boiling is studied by revisiting heater surface temperature data measured by infrared thermometric imaging in a liquid film boiling experiment BETA[6] [7]. It should be noted the conditions of BETA are quite different from the prototypical reactor condition. But BETA provided a direct visualization of the nucleation process. Information extracted from the visualized data is helpful to improve understanding of the nucleation phenomenon. In return, improved understanding of nucleation can be helpful to design validation experiment that provide data directly applicable to reactor conditions.
2. VAPOR BUBBLE NUCLEATION IN BOILING: AN UNCERTAINTY PERSPECTIVE
Nucleation of a second phase has attracted scientists’ attention over the past century or several decades. A number of experiments have been conducted to study nucleation. Although nucleation study was not limited to water-steam system, vapor bubble nucleation in water boiling is the subject of extensive investigation due to its importance in many industrial applications, including nuclear reactor safety. Theories and empirical correlations have been developed and applied to calculate nucleation and related characteristics. A short overview of widely used datasets and correlations is given in Appendix A. The state-of-the-practice wall-boiling models introduced active nucleation site density (NSD) as derived from photographic images. From the experimental measurement point of view, active nucleation sites are thus defined through a number of bubbles that are seen to present on the heater surface at a given time. In a sub-cooled environment, a large fraction of bubbles may simply station on the heater, while others may detach off the heater surface, to rapidly condense.
Thus, the NSD is a static and averaged parameter. In order to represent dynamics, the bubble departure frequency (BDF) is introduced. This implies the nucleation is always activated at the same sites with a given frequency, and a new bubble nucleates when the previous bubble departs off the heater’s surface. Given NSD (Na), BDD (dw) and BDF (f), a boiling model expresses the evaporation through the growth and departure of independent bubbles:
3
6w
evap g a
dm N f
���� (1)
For low-to-medium heat flux, the model basing on single-bubble behavior fits well with experimental observations. With increase of heat flux, effects of bubble-bubble interaction are modeled through bubble influence factor [1] or modification of nucleation site density based on “bubble crowding” [3].Nonetheless, accurately predict NSD, BDD and BDF for pool boiling (not to mention, sub-cooled flow boiling at high pressures) conditions especially under high heat fluxes remains a challenge. This is because (i) no experiments that could simultaneously measure all three nucleation parameter prompting the use of empirical correlations obtained from different experiments; (ii) the empirical correlations were limited to experimental conditions; and (iii) limited capability to perform measurements of NSD, BDD, and BDF in experiments under high heat flux conditions.
Taken NSD as an example. Empirical correlations for NSD have a similar form as ~ 1/ mcN R , where Rc is
the minimum cavity mouth radius required for activation. The Rc is a function of wall superheat and can be expressed as 1~cR T �� . As a result, the density can be expressed as a function of wall superheat
~ mN T� where m is derived from experimental data. The basis behind those correlations is the fact that given a wall superheat, how many cavities could be activated. The active nucleation site density is treated
4098NURETH-16, Chicago, IL, August 30-September 4, 2015 4098NURETH-16, Chicago, IL, August 30-September 4, 2015

as function of a heater’s thermal-physical properties and its surface morphological characteristics. According to this theory, vapor bubble nucleation should preferentially occur in the heater’s high temperature areas. This proposition is not confirmed by the data presented in the next Section. In fact, cavity theory of nucleation has been challenged by experimental data from boiling on nanoscopically smooth surfaces [8].
3. NUCLEATION EVENT DETECTION IN BOILING EXPERIMENTS
Appendix A provides an overview of experimental methods and correlations on nucleation site density. They were based on optical and intrusive techniques for exposing bubbles on heater surface. Appendix B gives an overview of BETA experimental method using infrared thermometric (IRT) imaging to measure the heater surface temperature with high resolution in time and space [6]. One feature of BETA that is important in this analysis is the heater (140 nm titanium film) is deposited on top of the glass substrate. The temperature measured by Infrared thermometry is the metal film heater. Such heater on top design has two advantages. First is to could minimize the thermal inertia effect of glass substrate. The lateral heat flux in substrate can be estimated from the spatial temperature variance between neighboring pixels. The value is in the range of 10 kW/m2 to 80 kW/m2. The vertical heat flux towards substrate from metal heater to glass substrate can be estimated by solving transient heat conduction equation. The value is in the range of - 300 kW/m2 (where heat flux is from substrate to metal film) to 180 kW/m2 (where heat flux is from metal film to substrate). The second advantage of the heater on top design is it is convenient to estimate the heat flux distribution towards liquid, which can be used to evaluate the heat partitioning model used as closure laws in two-fluid model. (A more detailed work would be discussed in a future report).
The IRT images obtained in the BETA-A pool boiling experiment serve as a basis to derive data on nucleation site density as reported in [6]. Nucleation sites were identified with “cold spots” (dark-scale areas corresponding to lower temperatures). It is instructive to note that the “cold spots” are thermal footprint of vapor bubbles that were nucleated, grown and departed off the heater’s surface; see Figure 1 (left column).
Given the BETA experimental glass substrate of 130 micrometers to a millimeter thick, the adiabatic heating rate can range as much as 500 K/s to 3000 K/s. As a result, bubble thermal footprint’s residence time can range from 5ms to 30ms that is a sequence of several to several dozens of images (for frame rate of 1000 fps to 3300 fps). Because of this inertia effect, the NSD measured through “cold spot” detection will be overestimate of the NSD. Furthermore, the “cold spot”-based NSD is still significantly lower than the NSD detected by optical methods.
In this paper, a novel technique of image data processing and analysis was proposed. The technique named temperature gradient (TG) is focused on IRT data obtained in BETA experiments. Rapid surface cooling is indicative of nucleation and growth of vapor bubbles. The main idea is to determine local cooling rate of heater surface using consecutive IRT images, and then use the rate of heater surface cooling to detect nucleation event. As shown in Figure 1.b, the active nucleation sites can be seen as the “dark spots,” which was caused by a large negative temperature gradient due to intense evaporation process of the microlayer under the bubble. Hereinafter, these TG “dark spot” is referred to as “cooling spots”, to distinguish them from IRT “dark spots” (“cold spots”) in thermal images. With the depletion of the microlayer, such evaporation process would be weakened; the dark spots would turn into “light spots” due to the deterioration of the heat transfer. The “light spots” would finally disappear upon coolant return via rewetting. Therefore, the “dark spots” shown in the TG image indicate the active nucleation sites on their early stage, while the TG “light spots” or “heating spots” indicate the sites with completion of the bubble growth. The data processing procedure and a preliminary uncertainty analysis are explained in Appendix C.
4099NURETH-16, Chicago, IL, August 30-September 4, 2015 4099NURETH-16, Chicago, IL, August 30-September 4, 2015

Figure 1. Four IRT consecutive frames of a) (left column) temperature (test Ti30-SA-III); b) (right column) temperature gradient (TG) of heater surface (heat flux = 2183 kW/m2); c) TG image
[5.38x6.51mm2] that exhibits thermal response of interacting bubbles
4. DATA PROCESSING RESULTS, OBSERVATIONS AND IMPLICATIONS
The classical definition of NSD is consistent with the (optical) diagnostic technique that is used to detect nucleation via surface bubbles. This approach ceases to reflect physical pictures at high heat fluxes and high void fraction flow regimes. The reason is optical hindrance of convoluting interfaces. It is noted that nucleation may occur in thin liquid film underneath of a vapor mushroom. So nucleation parameters can no more be identified through bubble-oriented observations. The infrared thermometric imaging combined with CVD thin film heater technique brought a new way to conduct boiling research. Nucleation events, can now be detected through bubble thermal footprints as in previous studies [6] and through bubble-induced rapid cooling and subsequent heating at the nucleation site, as explained in Appendix C.
In the following section, we denote (O.#) for Observation and (I.#) for Insight and Implications. Unless specifically noted, all data presented are from BETA-B test Ti30-SA-III, IR rate 3267.97 Hz.
4.1 Nucleation sites
Figure 2 exhibits accumulative spatial location of active nucleation sites on the BETA-B SAIII heater under increasing heat fluxes.
4100NURETH-16, Chicago, IL, August 30-September 4, 2015 4100NURETH-16, Chicago, IL, August 30-September 4, 2015

Figure 2. Spatial distribution of active nucleation sites under different heat fluxes (BETA-B SAIII test series)
(O.1) While the nucleation occurs quite uniformly, there exist persisting areas of low density of nucleation sites. These areas are characteristically hotter.(O.2) A visual observation has indicated that bubble nucleation tends to occur in the footprint of previous bubbles.
It is noted that the BETA-B SAIII heater is an aged heater from nanoscopically smooth heater surface. The aging surface builds a micro-structured oxide layer. These surface inhomogeneities (“Frankel islands”) can in-principle serve as nucleation site. For a given heater surface superheat, there are ample thermodynamically “qualified sites” for nucleation. However, for a given moment, only a few of the “qualified sites” are activated. Microscopic bubbles left behind on a micro-structured surface upon liquid return to dry patches may have contributed to reduction of nucleation energy barrier. This leads to reoccurring nucleation events.
Figure 3 shows the probability density function (PDF) of active NSD for different heat fluxes. With increasing heat flux, the distribution features a larger mean (from 10 to 30 per cm2) and variance value of NSD. However, this tendency is reversed when the heat flux increases to 1943 kW/m2 and 2183 kW/m2.The reason is unknown at this time. It is noted that these two runs exhibit different patterns of frequency distributions as discussed below.
(I.1) A wide spread of NSD values over time indicates a highly dynamic and stochastic character of nucleation pattern.
4101NURETH-16, Chicago, IL, August 30-September 4, 2015 4101NURETH-16, Chicago, IL, August 30-September 4, 2015
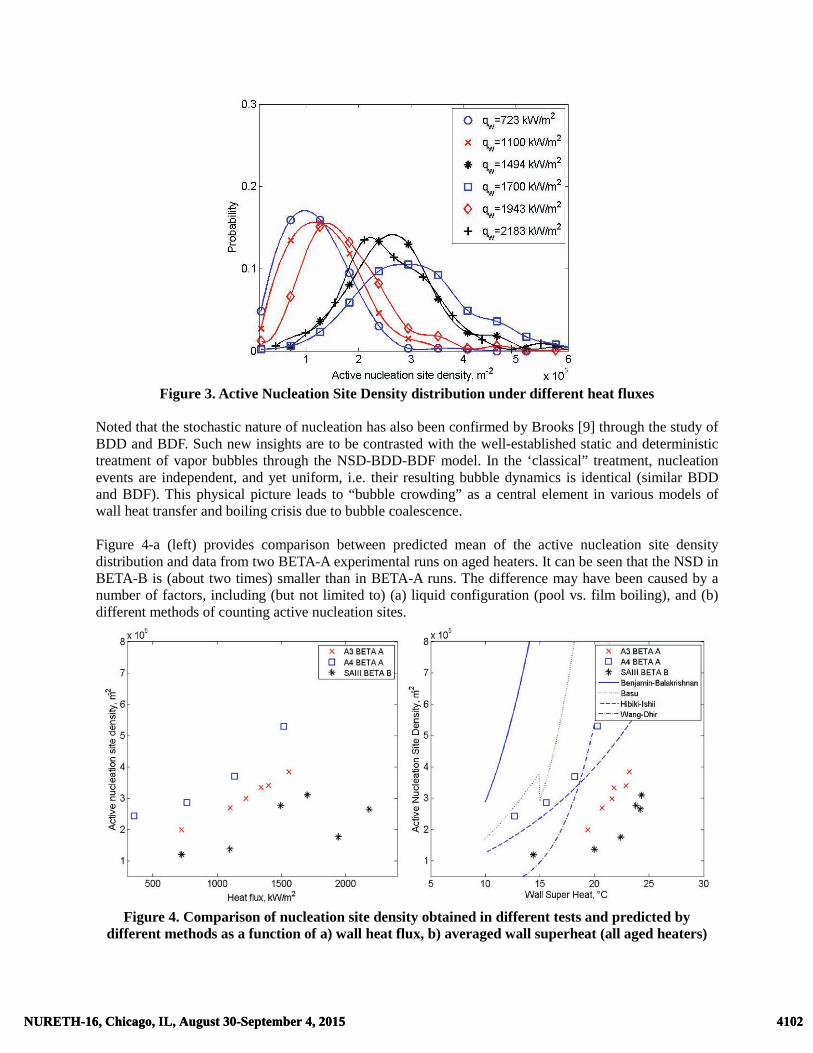
Figure 3. Active Nucleation Site Density distribution under different heat fluxes
Noted that the stochastic nature of nucleation has also been confirmed by Brooks [9] through the study of BDD and BDF. Such new insights are to be contrasted with the well-established static and deterministic treatment of vapor bubbles through the NSD-BDD-BDF model. In the ‘classical” treatment, nucleation events are independent, and yet uniform, i.e. their resulting bubble dynamics is identical (similar BDD and BDF). This physical picture leads to “bubble crowding” as a central element in various models of wall heat transfer and boiling crisis due to bubble coalescence.
Figure 4-a (left) provides comparison between predicted mean of the active nucleation site density distribution and data from two BETA-A experimental runs on aged heaters. It can be seen that the NSD in BETA-B is (about two times) smaller than in BETA-A runs. The difference may have been caused by a number of factors, including (but not limited to) (a) liquid configuration (pool vs. film boiling), and (b) different methods of counting active nucleation sites.
Figure 4. Comparison of nucleation site density obtained in different tests and predicted by different methods as a function of a) wall heat flux, b) averaged wall superheat (all aged heaters)
4102NURETH-16, Chicago, IL, August 30-September 4, 2015 4102NURETH-16, Chicago, IL, August 30-September 4, 2015

Figure 4-b (right) compares the BETA data on NSD as function of heater surface superheat against four widely used empirical correlations by different authors. It can be seen that the calculated NSD is much higher than the BETA-B data. The difference may have been caused by a number of factors, including (but not limited to) the above-mentioned (a), (b); and (c) difference of heater material and surface characteristics. It is noted that the empirical correlations predict a rapid increase of NSD at high superheat (hence, high heat fluxes). The correlations, however, were developed on basis of data obtained in low-to-medium heat flux conditions.
4.2 Nucleation temperature
Nucleation temperature is defined as heater surface temperature at the moment of prior to nucleation event and associated rapid cooling. Appendix C explains algorithm by which the nucleation temperature is determined.
(O.3) An analysis of IRT image sequences indicates that vapor bubble nucleation is not necessarily associated with high temperature region. This can be seen in Figure 1-a, and other IRT data. This observation is consistent with (O.1). That low-NSD areas have surface temperature higher than the heater-averaged temperature.
Figure.5 depicts the distribution of vapor bubble nucleation temperature and the heater surface temperature distribution at certain moments (frame) for a heat flux range from 0.7 to over 2.1 MW/m2.Nucleation is measured to occur on surface with superheat ranging from 10 K to 40 K. These are relatively higher value than nucleation temperature in low heat flux boiling.
(O.4) It can be seen that the mean nucleation temperature follows closely the surface mean temperature. Furthermore, the two distributions (of nucleation and surface temperatures) are also close.
Notably, if nucleation tends to happen in low temperature region (as proposed by the bubble-remnant consideration), then the nucleation temperature distribution would drift left (compared with the whole heater surface temperature). Conversely, if nucleation tends to happen in high temperature region (as current cavity model suggest), the nucleation temperature would drift to the right.
Figure 5. Nucleation temperature and Surface temperature
4103NURETH-16, Chicago, IL, August 30-September 4, 2015 4103NURETH-16, Chicago, IL, August 30-September 4, 2015

(I.2) Nucleation occurrence does not correlate to the local heater temperature. This insight is to be contrasted with thermodynamic arguments that relate nucleation to heater’s surface superheat. (I.3) Temperature independence of nucleation on otherwise uniform heater suggests that nucleation is stochastic event.
It needs to point out that the stochastic nature of nucleation doesn’t mean it is chaotic. The concept of self-organization [10] suggested that the activation of nucleation sites could be regarded as a constrained optimization process of the temperature peaks of the heater surface. So given the number and location of the potential nucleation sites, the activation of those sites should be the most efficient configuration to carry out the heat generated from the surface. In this sense, the distribution of nucleation could be an optimization that balances the heat removal from nucleation and from film evaporation.
Further investigation of such assumption is needed to check the correlation between nucleation activation and local heat transfer. If such assumption is valid, then the distribution of nucleation sites would be predictable.
4.3 Nucleation rate
Besides the active nucleation site density, infrared image can provide the nucleation dynamics via nucleation rate. By counting the “dark spots” appeared in a series of consecutive infrared frames, the distribution of the nucleation rate can be obtained, as shown in Figure.6 (left). Nucleation rate in BETA-Bexperiments (under high heat fluxes) is found to ranges from 10 to 30 events on one square centimeter over duration of 1ms.
The mean of the obtained nucleation rate distribution can be used to compare with the product of nucleation site density and bubble departure frequency used in the wall-boiling model. Figure. 6 (right) showed the combination of different nucleation models with the widely used bubble departure frequency model proposed by Cole.
4 ( )
3l g
w l
gf
d
� ���
� (2)
Figure 6. [a] (left) Nucleation rate distribution under different heat fluxes. [b] (right) Comparison of nucleation rate by different methods as a function of averaged wall superheat on aged heaters
4104NURETH-16, Chicago, IL, August 30-September 4, 2015 4104NURETH-16, Chicago, IL, August 30-September 4, 2015

(O.5) Nucleation rate (as well as NSD) calculated by different models varies greatly especially under high heat fluxes. (I.4) Caution must be exercised in applying “classical” wall boiling models to predict nucleation parameters at high heat fluxes.
In high heat-flux boiling, the evaporation rate is correspondingly high, leading to increase NSD as well as BDF. Higher NSD and BDF notwithstanding, given a typical size of “cooling spots” being 1 mm or less, there is a substantial fraction of the heater area that needs to be cooled by another cooling mechanism. At such a high range of heat flux (order of 1 MW/2) evaporation heat transfer is a must, for natural and force convection would be insufficient. It is likely that the flow pattern changes from bubbles to evaporatingthin film as proposed in [7]. Vapor bubbles nucleated on the surface burst through the liquid film as it occurred in the BETA-B experiments.
(I.5) At high heat fluxes, heat removal from the heater surface in a large fraction of the area is exercised through evaporating thin liquid film. The analysis supports the scale separation concept formulated in [7] [11]. It is instructive to note that this insight must be strengthened and confirmed by performing the analysis of IRT data from BETA-A experiments. This is to assess if findings from liquid film boiling experimental data are reproducible with pool boiling IR data.
It need to be noted that this formation of thin film under high heat flux is different from the film boiling in the high quality annular flow. The main difference is the mode that leads to boiling crisis. In annular flow film boiling, boiling crisis is caused by the “dryout” of the liquid film which is modeled as a global phenomenon, while in pool boiling and hopefully could be extended into subcooled flow boiling, the boiling crisis is caused by the failure of rewetting of the dry area left by nucleation which should be local phenomenon.
4.4. Nucleation spatial patterns
Figure 1-a (left column) shows the thermal footprint (IR imaging) of bubble-related evaporative heat transfer as well as convective heat transfer. Figure 1-c shows the effect of bubbles on removing heat from the surface. Notably, there are occasions that nucleation sites interact as it can be seen in frames “c” and “d”. Most interestingly, at the interaction zone, a high heating rate is evident. One possible explanation is that the deterioration of heat removal is due to build-up of stagnant liquid in the bubble-bubble collision zone.
Figure 2 provided a visual record of accumulative nucleation site distribution. While this distribution outlines areas of different concentration, it does not give the spatial dynamics of concurrent nucleation events and their potential interactions. Dinh and Tu [12] identified bubble-bubble interactions in their analysis ofoptical images of BETA-B data.
Figure 7 depicts a Poision-like distribution of the nearest distance between-neighboring nucleation sites.The Poisson-like distribution is in agreement with the experimental observation by Zou [13] for sub-cooledflow boiling. With increasing heat flux, the distribution sharpens as the mean distance decreases.
4105NURETH-16, Chicago, IL, August 30-September 4, 2015 4105NURETH-16, Chicago, IL, August 30-September 4, 2015

Figure 7. Distribution of nearest distance between neighboring active nucleation sites.
(O.6) The data (Ti30-SAIII) suggests that most likely a new vapor bubble will nucleate at a dsitance of 1 mm from one of active nucleation sites, while in average the distance is about 2 mm.(I.6) In combination, nucleation rate and nucleation spatial pattern exhibit behaviors of a dynamic and stochastic system. (I.7) The above insight is foundational to proposing a new treatment of nucleation. In fact, the current common use of static and averaged in time and space NSD and BDF simplifies calculation procedure, while also trip off significant information. The situation is similar to steady-state coarse-mesh treatment of turbulence.
5. SUMMARY REMARKS
In this paper, observations and measurements from a liquid film boiling experiment BETA-B were revisited. Vapor bubble nucleation behavior was analyzed using new information derived from processing of theBETA-B infrared thermometric imaging data. It should be noted that only one dataset Ti30-SA-III was pr
ocessed, and limited statistics was analyzed. The data processing technique contains many ad hoc parameters, for which a systematic calibration and testing are needed. These issues are focus on the ongoing development, which includes (i) improvement and verification of the data analysis procedure, (ii) quantification of uncertainty in measurement and analysis; (iii) broadened application for enhanced statistics and including BETA-A and other datasets.
Although approximate and exploratory, the TG image processing and data analysis already produced important observations and insights, which are highlighted in the preceding sections as O.1-…O.6; and I.1…I.7. The future work will include processing and synergistic analysis of optical photographic images, the IRT data, as well as the TG data. Particularly useful are thermal footprint data and cooling/heating rate data. Certain data of this class were analyzed but not explicitly included in the paper due to volume limits.
The insights derived from nucleation data analysis suggest that a new modeling framework for nucleation in boiling is needed to provide a more physical treatment. This treatment must allow for dynamic, stochastic behavior of nucleation.
4106NURETH-16, Chicago, IL, August 30-September 4, 2015 4106NURETH-16, Chicago, IL, August 30-September 4, 2015

ACKNOWLEDGMENTS
This work was supported by the Consortium of Advanced Simulation of Light Water Reactors (CASL). The BETA experimental program was supported by the Department of Energy NERI and NASA Fluid Physics program at the University of California-Santa Barbara. The authors thank Professor T.G. Theofanous and Dr. J.P. Tu for their seminal role and contribution in the BETA project.
REFERENCES
[1] �������������� ���������������������������������������������—Concept, validation and application to fuel assembly design," Nuclear Engineering and Design, vol. 237, no. 7, pp. 716-731, 2007.
[2] E.Michta, "Modeling of subcooled nucleate boiling with OpenFOAM," in Master's thesis, Royal Institute of Technology, Stockholm, 2011.
[3] L.A.Gilman, "Development of a general purpose subgrid wall boiling model from improved physical understanding for use in computational fluid dynamics," in PhD’s thesis, Massachusetts Institute of Technology, Cambridge, Massachusetts, 2014.
[4] V.Mousseau, B.Adams, K.Ivanov, M.Avramova, R.Salko and T.Blyth, "Apply VUQ Practices with Dakota to CTF for AMA-Relevant Problems," CASL, SAND2013-3093,April 2013.
[5] I.Asher, T.Drzewiecki, T.Grunloh, V.Petrov, K.Fidkowski and A.Manera, "Sensitivity, Verification, and Validation Studies of STAR-CD, STAR-CCM+, and Nphase CFD Boiling Models," CASL Technical Report: CASL-U-2012-0163-000, September 2012.
[6] T.G.Theofanous, J.P.Tu, A.T.Dinh and T.N.Dinh., "The boiling crisis phenomenon: Part I: nucleation and nucleate boiling heat transfer," Experimental Thermal and Fluid Science, vol. 26, no. 6–7, p. 775–792, 2002.
[7] T.G.Theofanous, T.N.Dinh, J.P.Tu and A.T.Dinh, "The boiling crisis phenomenon: Part II: dryout dynamics and burnout," Experimental Thermal and Fluid Science, vol. 26, no. 6-7, p. 793–810, 2002.
[8] T.N.Dinh, J.P.Tu, A.T.Dinh and T.G.Theofanous., "Nucleation phenomena in boiling on nanoscopically smooth surfaces," in Proceedings of 41st Aerospace Sciences Meeting and Exhibit, Washington, DC, 2003.
[9] R.Martinez-Cuencz, C.S.Brooks, E.Julia, T.Hibiki and M.Ishii, "Stochastic Nature of Wall Nucleation and Its Impact on the Time Average Boundary Condition," Journal of Heat Transfer, vol. 137, no. 2, p. 021504, 2015.
[10] R.A.Nelson, "Do we doubt too little? Examples from the thermal sciences," Experimental Thermal and Fluid Science, vol. 25, no. 5, pp. 255-267, 2001.
[11] T.G.Theofanous and T.N.Dinh., "High heat flux boiling and burnout as microphysical phenomena: mounting evidence and opportunities," Multiphase Science and Technology, vol. 18, no. 1, pp. 1-26, 2006.
[12] T.N.Dinh and J.P.Tu, "Observations of Bubble Nucleation and Interaction Dynamics in High Heat Flux Boiling," in ANS Winter Meeting, November, 2013.
[13] L.Zou and B.G.Jones, "Thermal interaction effect on nucleation site distribution in subcooled boiling," International Journal of Heat and Mass Transfer, vol. 55, no. 11-12, p.
4107NURETH-16, Chicago, IL, August 30-September 4, 2015 4107NURETH-16, Chicago, IL, August 30-September 4, 2015

2822–2828, 2012. [14] C.H.Wang and V.K.Dhir, "Effect of surface wettability on active nucleation site density
during pool boiling of water on a vertical surface," Journal of Heat Transfer, vol. 115, no. 3, p. 659–669, 1993.
[15] R.J.Benjamin and A.R.Balakrishnan., "Nucleation site density in pool boiling of saturated pure liquids: effect of surface microroughness and surface and liquid physical properties," Experimental Thermal and Fluid Science, vol. 15, no. 1, pp. 32-42, 1997.
[16] N.Basu, G.R.Warrier and V.K.Dhir., "Onset of Nucleate Boiling and Active Nucleation Site Density During Subcooled Flow Boiling," Journal of Heat Transfer, vol. 124, no. 4, p. 717–728, 2002.
[17] G.Kocamustafaogullari and M.Ishii, "Foundation of the interfacial area transport equation and its closure relations," International Journal of Heat and Mass Transfer, vol. 38, no. 3, p. 481–493, 1995.
[18] T.Hibiki and M.Ishii, "Active nucleation site density in boiling systems," International Journal of Heat and Mass Transfer, vol. 46, no. 14, p. 2587–2601, 2003.
[19] S.R.Yang and R.H.Kim, "A mathematical model of the pool boiling nucleation site density in terms of the surface characteristics," International Journal of Heat and Mass Transfer, vol. 31, no. 6, p. 1127–1135, 1988.
[20] R.Cole, "A photographic study of pool boiling in the region of the critical heat flux," AIChE Journal, vol. 6, no. 4, pp. 533-538, 1960.
[21] G.H.Yeoh, S.C.P.Cheung, J.Y.Tu and M.K.M.Ho, "Fundamental consideration of wall heat partition of vertical subcooled boiling flows," International Journal of Heat and Mass Transfer, vol. 51, no. 15-16, p. 3840–3853, 2008.
[22] N.Basu, G.R.Warrier and V.K.Dhir, "Wall Heat Flux Partitioning During Subcooled Flow Boiling: Part 1—Model Development," Journal of Heat Transfer, vol. 127, no. 2, pp. 131-140, 2005.
[23] V.I.Tolubinsky and D.M.Kostanchuk, "Vapor bubbles growth rate and heat transfer intensity at subcooled water boiling," in Heat Transfer 1970, Preprints of papers presented at the 4th International Heat Transfer Conference, Paris, 1970.
[24] H.C.Ünal, "Maximum bubble diameter, maximum bubble-growth time and bubble-growth rate during the subcooled nucleate flow boiling of water up to 17.7 MN/m2," International Journal of Heat and Mass Transfer, vol. 19, no. 6, p. 643–649, 1976.
[25] J.Klausner, R.Mei, D.Bernhard and L.Zeng, "Vapor bubble departure in forced convection boiling," International Journal of Heat and Mass Transfer, vol. 36, no. 3, p. 651 – 662,1993.
[26] B.Yun, A. Splawski, S.Lo and C. Song, "Prediction of a subcooled boiling flow with mechanistic wall boiling and bubble size models," CD-Adapco, 2010.
4108NURETH-16, Chicago, IL, August 30-September 4, 2015 4108NURETH-16, Chicago, IL, August 30-September 4, 2015

APPENDIX A: PAST EXPERIMENTS AND EMPIRICAL CORRELATIONS FOR NSD, BDF AND BDD
It is difficult to accurately measure active nucleation site density in boiling, especially under high heat flux conditions. Relevant experiments were performed by Wang and Dhir [14], Benjamin and Balakrishnan [15] on pool boiling, and Basu et al [16] on subcooled flow boiling. In such experiments the active nucleation site density was determined by identifying surface bubbles from photographic images (from top or side view). This method works for low-to-medium heat fluxes, but for high heat flux, intense boiling process leads to complex flow patterns with convoluting interfaces, hampering identification of the surface bubbles. Various measures are used to suppress the vapor structures are intrusive.
Kocamostafaogullari and Ishii [17] performed parametric study of active nucleation site density based onGaertner and Westwater’s experiment data. Hibiki and Ishii [18] proposed an empirical correlation based on study of the size and cone angle distributions of cavities on heater surface, and used the experiment data from Yang and Kim [19]. Empirical correlations for NSD are summarized in Table A1; all units are in SI.
Table A1. Empirical correlations for NSDSource Expression Detail
Wang-Dhir
Benjamin-Balakrishnan
Pr: Prandtl number
Basu
Kocamostafaogullari- Ishii
Hibiki-Ishii
Cole [20] conducted experiment to study the bubble departure frequency for pool boiling, and proposed a widely used empirical correlation, which assumes frequency is related to bubble departure diameter, and is employed in CFD studies. Yeoh [21] and Basu [22] proposed models to evaluate the BDF based on the bubble growth time and nucleation waiting time.
On the other hand, a considerable amount of researches has been done on prediction of bubble departure diameter. Tolubinsky [23] and Unal [24] performed experiments and get empirical correlations for the bubble departure diameter of subcooled flow boiling. Klausner [25] and Yun [26] proposed a mechanistic
29 6.07.81 10 (1 cos ) cR�� �� � : contact angle�
1.63 0.4 3sup
1218.8Pr ( ) T
� �
0.4
: Surface roughness parameter:
14.5-4.5( )+( )a aR P R P
� �
1/2
: Surface liquid interaction parameter
( )w w w
l l l
k Cp
k Cp
��
3 2.0sup
6.0sup
3.4 10 (1 cos ) , 15
0.34(1 cos ) , 15
T T K
T T K
�
�
� � � � �
� � �
* * 4.4 2( ) /c df R D� �
* ( ) / /l g g g� � � � � �� � � �
5 *0.92.5 10dDg
�� ��
�� ��
* 2 /c c dR R D�* 7 * 3.2 * 4.13( ) 2.157 10 (1 0.0049 )f � � �� �� � �
2 '
2[1 exp( )][exp( ( ) ) 1]
8ac
N fR
� ���
�� � �2
3
5 2
' 6
*
: 4.72 10 sites/m , 0.722 rad
2.5 10
log( )
( ) 0.01064 0.48246 0.22712
0.05468
aN
m
f
�
�
� �
� � �
�
�
�
� � �
�
� �
� �
�
� � � �
�
4109NURETH-16, Chicago, IL, August 30-September 4, 2015 4109NURETH-16, Chicago, IL, August 30-September 4, 2015

model based on force balance of the bubble nucleation process. The model can be applied to pool boiling and sub-cooled flow boiling of low flow rates. These models consider a fixed BDD and do not account for the effect of bubble-bubble interactions.
APPENDIX B: BETA-B EXPERIMENT DATASET
The BETA experiment was designed, built and conducted at the University of California, Santa Barbara to study boiling heat transfer up to and including critical heat fluxes (CHF). A detailed description of BETA experimental design and procedure is provided in references [6] [7] [11]. There are two settings: BETA (or BETA-A) configuration is pool boiling. BETA-B configuration is liquid film boiling. These experiments used micro-meter-thick metal film deposited on a glass substrate for ohmic heating. This design ensures uniform heat flux distribution on heating surface. The heater’s surface temperature is captured by high-speed infrared imaging of the nano-film heater from below. In BETA experiments, the heater surface oxidation (“aging”) was found to greatly affect the nucleation patterns and resulting CHF. The IRT data processed in this paper was obtained on BETA-B test series Ti30-SA-III with infrared imaging of a 6.51x5.38 mm2 section of a “heavily aged” heater (the heater size is 6.51x6.51 mm2). It should be noted that the BETA-B Ti30-SAIII test series was exploratory in nature. The data served as a basis to evaluate the experimental concept.
APPENDIX C: DATA PROCESSING PROCEDURE AND UNCERTAINTY ANALYSIS
This Appendix provides an overview of IRT image processing procedure for BETA-B experiment. The image is a 6.51x5.38 mm2 proportion of a 6.51x6.51mm2 heater, the pixels that represent the heater is 75x62, thus the size for one pixel is 0.0868 mm. In this sense, the uncertainty of the heater size is 1.4% to 1.6%, the uncertainty of the location of the nucleation event is� 0.04 mm.
A hierarchical clustering algorithm is adopted, implemented and used to identify active nucleation sites in temperature gradient snapshots obtained by differentiating values from consecutive IRT images. In a “bottom up” approach, the algorithm follows the procedure:
1. In the stored array of temperature gradient data, locate elements whose value is lower than a specifiedtemperature gradient.
2. Start with each elements in its own cluster.3. Compute the shortest Euclidean distance between each pair of clusters.4. Identify the closest clusters and merge them.5. Repeat the procedure until the shortest distance between each cluster is larger than a specified
distance (known as the single linkage criterion).
In practice, the filtering temperature gradient and characteristic distance are carefully tuned. The temperature gradient should be able to filter out noise while also be able to identify all the nucleation sites. If the characteristic distance is too small, one nucleation site might be split into two or even several. If it is too large, two or several nucleation sites might be identified as a single one. In order to avoid such situation, in the identification of nucleation sites, 15 frames were randomly chosen for each set of data. Nucleation sites were also manually identified and compared with the result processed by the hierarchical clustering algorithm. The filtering temperature gradient and characteristic distance were tuned for the two results to agree with each other. Moreover, clusters smaller than four pixels were discarded for the same filtering purpose. By perturbating the two parameters around the optimal value, a 10% - 15% variation of the results were observed. Thus, we conservatively assume the uncertainty from the clustering algorithm is 15%. Figure C1 depicts one example of the identification result. In this paper, both cooling spots and heating spots are identified as nucleation site. Because of the recording’s high frame rate, a typical
4110NURETH-16, Chicago, IL, August 30-September 4, 2015 4110NURETH-16, Chicago, IL, August 30-September 4, 2015

bubble’s thermal growth and departure duration may last for 2-3 frames. To avoid double counting of nucleation sites, an interval of five frames is chosen for the identification of active nucleation sites. Each dataset is based on processing of 500 frames.
To measure nucleation rate, consecutive TG frames were used. A large negative TG threshold is used to filter out the already nucleated sites and ensure that in each frame only newly activated nucleation sites are taken into account. For the data presented in this paper, nucleation events activated in each of consecutive 100 frames (which is around 31ms) were detected and used to evaluate nucleation rate.
The measurement of nucleation temperature TNUC follows a similar procedure, using a high negative TG threshold to detect nucleation event in frame (N+1). For the detected nucleation event, its nucleation center position (and related pixel [i,j] ) can be approximated. TNUC is the pixel [i,j] temperature TSUR
(N,i,j) in the IRT frame (N).
(a) temperature gradient (TG) (b) identified “cooling spots” (c) identified “heating spots”Figure C1. Identification of active nucleation sites through “cooling spots” and “heating spots” in a
temperature gradient snapshot (heat flux=1943 kW/m2)
Another uncertainty source came from possible omitted nucleation events between two frames. Since the nucleation events is millisecond level, and the time interval between two frames is 0.31ms, it is possible that a nucleation event that occurred between two frames might be lost. This part of uncertainty needs to be quantified by comparing the TG data with bubble image data in near future which has a much higher frequency. Noted that the uncertainty analyzed above were for the detection of nucleation events and nucleation location. The uncertainty of temperature measurement is dependent on the accuracy of measurement and the geometry and emissivity of the substrate and metal film. This part of uncertainty is not discussed in this paper.
It is noted that the data processing procedure and analysis algorithms are still under development, refinement and verification. Uncertainty quantification of both measurements and data processing are subject of a next report.
4111NURETH-16, Chicago, IL, August 30-September 4, 2015 4111NURETH-16, Chicago, IL, August 30-September 4, 2015