travel times and distances to radiotherapy centres for
TRANSCRIPT

1
Travel times and distances to RadiotherapyCentres for Head and Neck cancer patients in
England (2006-2008)
Oxford Cancer Intelligence Unit
2
The report has been produced in collaboration with the National Cancer Intelligence Network (NCIN) Head and Neck Cancers Site Specific Clinical Reference Group and is based on the information collected and quality assured by the regional cancer registries in England. (www.ukacr.org; www.ncin.org.uk)
This report has been compiled by: • Dr Kakoli Choudhury, Specialist Registrar in Public Health • Andrew Hughes, Senior Public Health Intelligence Analyst, OCIU • Gabriele Price, Senior Public Health Intelligence Analyst, OCIU • Dr Monica Roche, Medical Director, OCIU
3
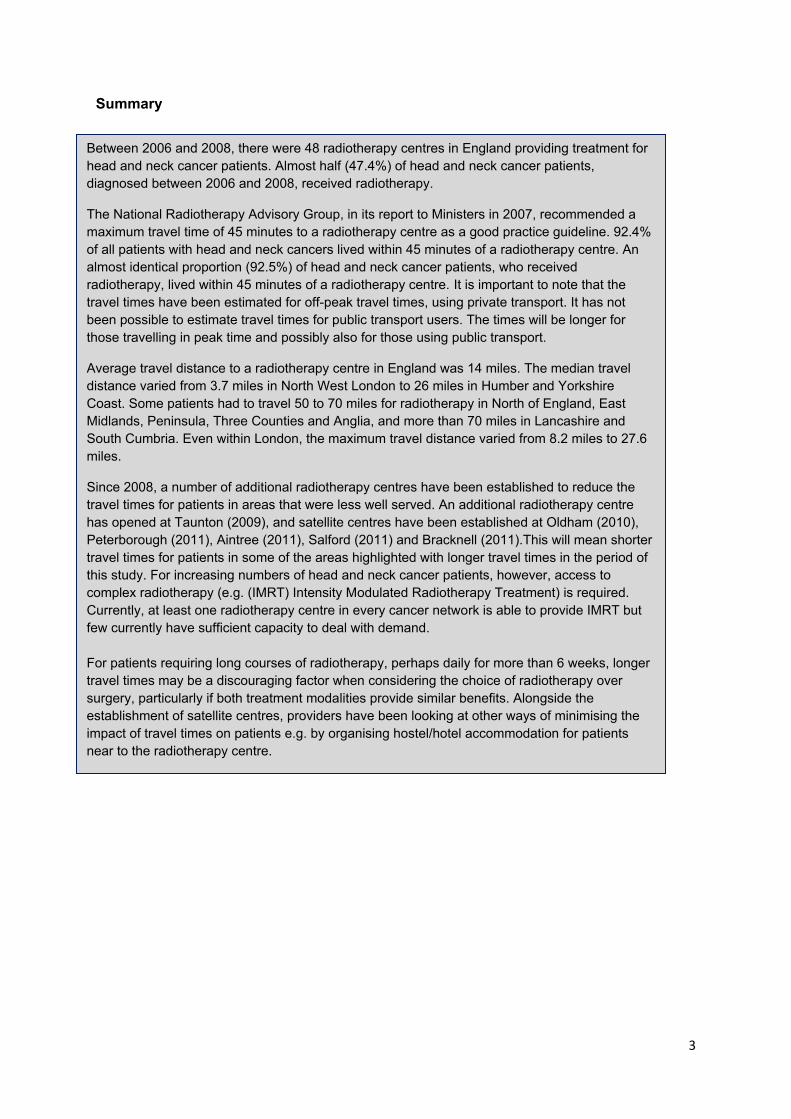
Summary
Between 2006 and 2008, there were 48 radiotherapy centres in England providing treatment for head and neck cancer patients. Almost half (47.4%) of head and neck cancer patients, diagnosed between 2006 and 2008, received radiotherapy.
The National Radiotherapy Advisory Group, in its report to Ministers in 2007, recommended a maximum travel time of 45 minutes to a radiotherapy centre as a good practice guideline. 92.4% of all patients with head and neck cancers lived within 45 minutes of a radiotherapy centre. An almost identical proportion (92.5%) of head and neck cancer patients, who received radiotherapy, lived within 45 minutes of a radiotherapy centre. It is important to note that the travel times have been estimated for off-peak travel times, using private transport. It has not been possible to estimate travel times for public transport users. The times will be longer for those travelling in peak time and possibly also for those using public transport.
Average travel distance to a radiotherapy centre in England was 14 miles. The median travel distance varied from 3.7 miles in North West London to 26 miles in Humber and Yorkshire Coast. Some patients had to travel 50 to 70 miles for radiotherapy in North of England, East Midlands, Peninsula, Three Counties and Anglia, and more than 70 miles in Lancashire and South Cumbria. Even within London, the maximum travel distance varied from 8.2 miles to 27.6 miles.
Since 2008, a number of additional radiotherapy centres have been established to reduce the travel times for patients in areas that were less well served. An additional radiotherapy centre has opened at Taunton (2009), and satellite centres have been established at Oldham (2010), Peterborough (2011), Aintree (2011), Salford (2011) and Bracknell (2011).This will mean shorter travel times for patients in some of the areas highlighted with longer travel times in the period of this study. For increasing numbers of head and neck cancer patients, however, access to complex radiotherapy (e.g. (IMRT) Intensity Modulated Radiotherapy Treatment) is required. Currently, at least one radiotherapy centre in every cancer network is able to provide IMRT but few currently have sufficient capacity to deal with demand. For patients requiring long courses of radiotherapy, perhaps daily for more than 6 weeks, longer travel times may be a discouraging factor when considering the choice of radiotherapy over surgery, particularly if both treatment modalities provide similar benefits. Alongside the establishment of satellite centres, providers have been looking at other ways of minimising the impact of travel times on patients e.g. by organising hostel/hotel accommodation for patients near to the radiotherapy centre.

4
1. Introduction
Radiotherapy services in England have been centralised with the view that more specialised knowledge, better facilities and sufficient patient throughput would promote expertise and better patient care. These advantages were expected to outweigh any disadvantage of longer travel times for some patients [1]. There is, however, concern that increased travel times for longer treatments such as radiotherapy may lead to decreased uptake (the distance decay factor). For head and neck cancer patients, longer travel time is a particular concern because radiotherapy is administered on an out-patient basis over a number of days, and some patients may require up to 35 separate treatment sessions. This may lead to more patients and clinicians opting for surgery instead of radiotherapy for the treatment of those cancers where both modalities of treatment offer similar benefits.
The National Radiotherapy Advisory Group, in its report [2] to Ministers in 2007, recommended a maximum travel time of 45 minutes to a radiotherapy centre as a good practice guideline.
2. Purpose of this paper
This paper describes the travel times and distances to radiotherapy centres in England for patients with head and neck cancers (excluding thyroid cancer) diagnosed between 2006 and 2008. The aim is to identify areas of the country with longer travel times and distances. This work was commissioned by the National Cancer Intelligence Network (NCIN) Head and Neck Cancer SSCRG (Site Specific Clinical Reference Group). It was identified as a priority area for work by patient representatives on the SSCRG.
3. Methodology
All new (incident) head and neck cancer cases (excluding thyroid cancer cases) diagnosed in residents of England between 2006 and 2008, were included in this study. All radiotherapy centres providing radiotherapy to head and neck cancer patients in England between 2006 and 2008 were included. 3.1. Literature review
A literature review was carried out in August 2011 to identify published original research articles on possible impact of travel times to radiotherapy centres on treatment decisions. Embase and Medline databases were searched.
The Department of Health and NHS Information Centre websites were searched to identify any relevant guidelines and reports.

5
3.2. Head and neck cancers in England between 2006 and 2008
Data on new cases of head and neck cancer and on radiotherapy treatments in England between 2006 and 2008 were extracted from the NCDR (National Cancer Data Repository). The ICD-10 (International Classification of Diseases, 10th Revision) codes used in data extraction are in Appendix I.
3.3. Travel times and distances to radiotherapy centres in England
A geographical information system (GeoExploit) was used to map the radiotherapy centres in England and to estimate travel times from each patient’s residence to their nearest radiotherapy centre. Those who resided outside the boundaries of the English Cancer Registries were excluded. Duplicate records were removed. Travel times were assessed using digital NAVTEQ road network to measure off-peak private car journey times. The average travel distances for patients were estimated for every postcode location to the nearest radiotherapy centres, regardless of whether this was the actual centre for treatment.
The detailed methodology is in Appendix II.
4. Results
4.1. Literature review
Two studies were identified which examined the effect of geographical accessibility on treatment of cancer [1, 3], but no studies were found which specifically examined the effect on treatment of head and neck cancer.
Jones et al [1] used data from the Northern and Yorkshire Cancer Registry between 1994 and 2002 to examine the relationship between radiotherapy and travel distance in 117,097 patients with breast, colon, rectum, lung and prostate cancers. They found that, after adjusting for age, sex and deprivation, the odds ratios for receiving radiotherapy were significantly lower in the patients who had to travel more than 50 minutes compared to those who had to travel less than 25 minutes [0.80 (95% confidence interval {CI} 0.73-0.87) for breast cancer, 0.64 (95% CI 0.57-0.73) for rectal cancer, 0.86 (95% CI 0.80-0.91) and 0.88 (95% CI 0.79-0.99) for prostate cancer. However it was not significant in patients with colon cancer (odds ratio 0.80, 95% CI 0.60-1.1).
Cosford et al [3] found no significant association between travel time for radiotherapy and radiotherapy uptake among cancer patients in Hertfordshire and Bedfordshire in 1991. The number of patients included in the study was not mentioned.
4.2. Head and neck cancer radiotherapy centres
There were 50 radiotherapy centres in England, during 2006-2008, which provided radiotherapy to head and neck cancers patients, excluding thyroid cancers (source National Cancer Action Team). These centres are mapped in figure 1.

6
Fig 1 Head and neck radiotherapy centres in England and areas within 45 minutes drive time by private transport during off-peak period
The radiotherapy centres are named in Appendix III.

7
4.3. Head and neck cancer incidence rates and travel times for all patients with head and neck cancer to nearest radiotherapy centre
The age standardised head and neck cancer incidence rate for England for the three years between 2006 and 2008 was 11.17 (95% CI 11.00 – 11.33) per 100,000 population. Among cancer networks, this varied from 9.22 (95% CI 8.53 – 9.91) per 100,000 in Thames Valley to 14.17 (95% CI 13.28 – 15.07) per 100,000 in Merseyside and Cheshire.
92.4% (range 65.3% -100%) of patients with head and neck cancer lived within 45 minutes of the nearest radiotherapy centre. The figures were 69% (range 39.3% - 100%) and 29.2% (range 7.8% - 80.8%), for those residing within 30 minutes and 15 minutes respectively, of the nearest radiotherapy centre.
These are shown in table 1. The cancer networks are arranged in ascending order by age- standardised incident rates.

8
Table 1 Percentage of patients with incident head and neck cancer residing within 15, 30 and 45 minutes of a head & neck radiotherapy centre by cancer network 2006 – 2008
Cancer network Average annual
number of cases
Age standardisedincident head & neck
cancer rate per 100,000 (95% CI within brackets)
Percentage of all patients
residing within 45 min
of a radiotherapy
centre
Percentage of all patients
residing within 30 min of a
radiotherapy centre
Percentage of all patients
residing within 15 min of a
radiotherapy centre
England 6,563 11.17 (11.00 – 11.33) 92.4 69.0 29.2 Thames Valley 239 9.22 (8.53 – 9.91) 99.0 62.9 18.0 Surrey, West Sussex and Hampshire
132 9.27 (8.33 – 10.21) 100.0 68.9 12.1
Kent and Medway 183 9.27 (8.47 – 10.07) 99.8 88.7 19.8 Dorset 93 9.36 (8.17 – 10.56) 86.0 64.6 30.1 Mount Vernon 132 9.46 (8.51 – 10.41) 100.0 88.7 19.9 Essex 165 9.5 (8.63 – 10.37) 99.7 86.2 29.8 Three Counties 131 9.64 (8.65 – 10.63) 84.7 52.9 17.2 Central South Coast 240 9.64 (8.91 – 10.38) 90.6 68.1 26.7 Anglia 338 9.97 (9.34 – 10.61) 84.5 45.8 18.9 Sussex 157 10.21 (9.24 – 11.19) 88.8 49.3 22.2 Avon, Somerset and Wiltshire
237 10.23 (9.45 – 11.00) 84.2 56.6 31.1
Peninsula 234 10.37 (9.56 – 11.18) 90.1 78.1 40.8 East Midlands 506 10.61 (10.06 – 11.16) 91.5 74.7 37.1 Arden 126 10.78 (9.67 – 11.89) 100.0 92.9 33.7 North London 156 10.97 (9.95 – 11.99) 100.0 95.0 74.5 Greater Midlands 262 11.04 (10.24 – 11.83) 100.0 91.7 40.9 North Trent 243 11.50 (10.65 – 12.36) 98.3 58.5 20.9 Yorkshire 340 11.67 (10.94 – 12.40) 95.9 65.0 23.1 Pan Birmingham 236 11.78 (10.89 – 12.67) 100.0 94.0 35.7 Humber and Yorkshire Coast
159 11.85 (10.76 – 12.94) 65.3 39.3 25.2
South West London 188 12.10 (11.07 – 13.12) 100.0 76.2 19.4 North West London 214 12.58 (11.59 – 13.58) 100.0 100.0 74.2 North East London 172 12.85 (11.72 – 13.99) 100.0 100.0 80.8 North of England 473 12.94 (12.25 – 13.63) 93.0 72.5 29.7 Lancashire and South Cumbria
239 13.12 (12.13 – 14.11) 85.0 41.1 7.8
South East London 185 13.15 (12.02 – 14.27) 100.0 81.0 32.0 Greater Manchester and Cheshire
446 13.24 (12.51 – 13.96) 100.0 68.9 19.7
Merseyside and Cheshire 337 14.17 (13.28 – 15.07) 95.4 41.1 12.8
9
4.4. Travel times for patients receiving radiotherapy
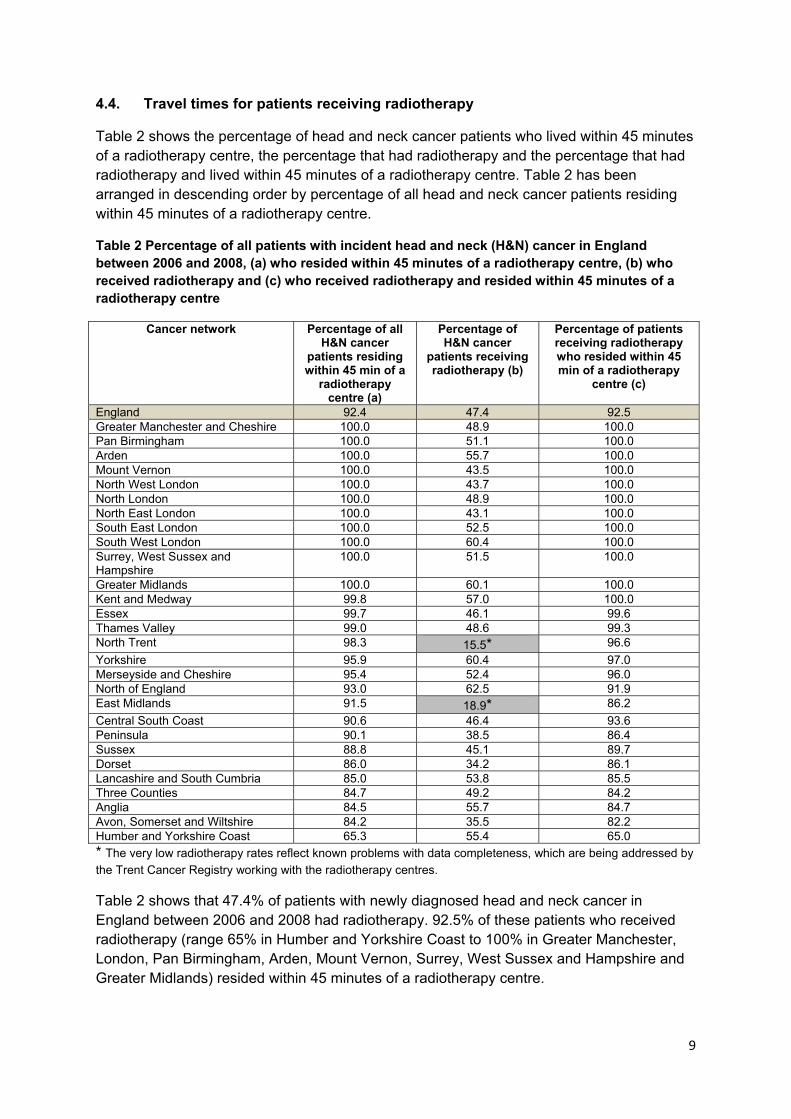
Table 2 shows the percentage of head and neck cancer patients who lived within 45 minutes of a radiotherapy centre, the percentage that had radiotherapy and the percentage that had radiotherapy and lived within 45 minutes of a radiotherapy centre. Table 2 has been arranged in descending order by percentage of all head and neck cancer patients residing within 45 minutes of a radiotherapy centre.
Table 2 Percentage of all patients with incident head and neck (H&N) cancer in England between 2006 and 2008, (a) who resided within 45 minutes of a radiotherapy centre, (b) who received radiotherapy and (c) who received radiotherapy and resided within 45 minutes of a radiotherapy centre
Cancer network Percentage of all H&N cancer
patients residing within 45 min of a
radiotherapy centre (a)
Percentage of H&N cancer
patients receiving radiotherapy (b)
Percentage of patients receiving radiotherapy who resided within 45 min of a radiotherapy
centre (c)
England 92.4 47.4 92.5 Greater Manchester and Cheshire 100.0 48.9 100.0 Pan Birmingham 100.0 51.1 100.0 Arden 100.0 55.7 100.0 Mount Vernon 100.0 43.5 100.0 North West London 100.0 43.7 100.0 North London 100.0 48.9 100.0 North East London 100.0 43.1 100.0 South East London 100.0 52.5 100.0 South West London 100.0 60.4 100.0 Surrey, West Sussex and Hampshire
100.0 51.5 100.0
Greater Midlands 100.0 60.1 100.0 Kent and Medway 99.8 57.0 100.0 Essex 99.7 46.1 99.6 Thames Valley 99.0 48.6 99.3 North Trent 98.3 15.5* 96.6 Yorkshire 95.9 60.4 97.0 Merseyside and Cheshire 95.4 52.4 96.0 North of England 93.0 62.5 91.9 East Midlands 91.5 18.9* 86.2 Central South Coast 90.6 46.4 93.6 Peninsula 90.1 38.5 86.4 Sussex 88.8 45.1 89.7 Dorset 86.0 34.2 86.1 Lancashire and South Cumbria 85.0 53.8 85.5 Three Counties 84.7 49.2 84.2 Anglia 84.5 55.7 84.7 Avon, Somerset and Wiltshire 84.2 35.5 82.2 Humber and Yorkshire Coast 65.3 55.4 65.0 * The very low radiotherapy rates reflect known problems with data completeness, which are being addressed by the Trent Cancer Registry working with the radiotherapy centres.
Table 2 shows that 47.4% of patients with newly diagnosed head and neck cancer in England between 2006 and 2008 had radiotherapy. 92.5% of these patients who received radiotherapy (range 65% in Humber and Yorkshire Coast to 100% in Greater Manchester, London, Pan Birmingham, Arden, Mount Vernon, Surrey, West Sussex and Hampshire and Greater Midlands) resided within 45 minutes of a radiotherapy centre.

10
Figure 2 compares the percentage of head and neck cancer patients diagnosed between 2006 and 2008 who lived within 45 minutes of a radiotherapy centre with the percentage of patients undergoing radiotherapy for each of the cancer networks in England.
Figure 2 Percentage of head and neck cancer patients in England diagnosed between 2006 and 2008 who resided within 45 minutes of a radiotherapy centre and percentage of head and neck cancer patients who received radiotherapy by cancer network
* The very low radiotherapy rates for North Trent and East Midlands Cancer Networks reflect known problems with data completeness, which are being addressed by the Trent Cancer Registry working with the radiotherapy centres.
Figure 2 shows that at cancer network level, there is no clear relationship between the percentage of patients undergoing radiotherapy and the percentage of patients living within 45 minutes of a radiotherapy centre. For example, in North East London, 100% of patients lived within 45 minutes of a radiotherapy centre and 43.1% received radiotherapy. In contrast, in Humber and Yorkshire Coast, only 65.3% of patients lived within 45 minutes of a radiotherapy centre, but 65% received radiotherapy.
4.5. Travel distances
Table 3 shows the average, median, and maximum travel distances in miles from the nearest radiotherapy centre in England between 2006 and 2008. The table is arranged in ascending order by average distance to nearest radiotherapy centre.
0
10
20
30
40
50
60
70
80
90
100
Percentage of incident head and neck cancer patients between 2006 and 2008 who resided within 45 minutes of a radiotherapy (RT) centre and percentage of those who received RT
Percentage residing within 45 min of a RT centre Percentage receiving RT

11
The average distance to the nearest radiotherapy centre in England was 14 miles (range 4.2 miles in North East London to 22.8 miles in Lancashire and South Cumbria). The median distance to the nearest centre ranged from 3.7 miles in North West London to 26 miles in Humber and Yorkshire Coast. The maximum distance varied from 8.2 in North East London to 71.1 miles in Lancashire and South Cumbria.
Table 3 Average, median and maximum distances in miles to nearest radiotherapy centre for incident head and neck cancer patients by cancer networks in England between 2006 and 2008
Cancer network Average distance in miles travelled to
nearest radiotherapy centre for all patients
with incident head and neck cancers
Median distance in miles travelled to
nearest radiotherapy centre for all patients
with incident head and neck cancers
Maximum distance in miles travelled to nearest radiotherapy centre for
all patients with incident head and neck cancers
England 14.0 11.8 71.1 North East London 4.2 4.2 8.2 North West London 4.4 3.7 12.7 North London 6.0 4.1 27.6 South East London 7.7 7.1 20.2 Pan Birmingham 8.1 7.1 23.4 South West London 9.3 9.2 21.4 Greater Midlands 10.2 8.3 34.7 Arden 10.6 10.3 30.4 Essex 11.5 12.4 29.5 Greater Manchester and Cheshire
12.2 10.8 28.5
East Midlands 13.2 10.2 56.5 Mount Vernon 13.4 13.4 27.3 Central South Coast 13.9 11.8 36.4 North of England 14.3 11.9 68.8 Kent and Medway 14.3 15.0 30.2 Yorkshire 14.5 14.1 36.8 North Trent 14.8 15.3 34.5 Peninsula 15.0 11.8 56.2 Surrey, West Sussex and Hampshire
15.5 15.0 29.9
Merseyside and Cheshire
15.9 15.6 30.5
Dorset 16.3 11.1 43.2 Thames Valley 16.3 17.2 36.7 Sussex 18.3 17.2 39.9 Avon, Somerset and Wiltshire
18.8 17.1 46.9
Three Counties 20.7 20.3 55.4 Anglia 21.8 21.8 51.8 Humber and Yorkshire Coast
22.1 26.0 49.9
Lancashire and South Cumbria
22.8 19.6 71.1
5. Discussion
92.4% of patients with incident head and neck cancer residing in England and diagnosed between 2006 and 2008 lived within 45 minutes of a radiotherapy centre. This headline figure is reassuring but it masks considerable variation between networks. Though the median distance was 26 miles or less in all cancer network areas, a wide variation was seen

12
in different parts of England. In four cancer network areas (East Midlands, Peninsula, Three Counties and Anglia) some patients had to travel between 50 and 60 miles for radiotherapy. In North of England some patients had to travel between 61 and 70 miles and in Lancashire and South Cumbria, some patients had to travel more than 70 miles to access radiotherapy. Within London the maximum travel distance varied from 8.2 miles to 27.6 miles. It should also be noted that not all patients received radiotherapy in their nearest radiotherapy centre. Established clinical pathways may lead to referrals to somewhere other than the nearest centre. For example, patients from Walsall undergo radiotherapy in Birmingham instead of in Wolverhampton, which is their nearest centre.
Since 2008, a number of additional and satellite radiotherapy centres have been established and this was intended to reduce the travel times for patients in areas that were less well served. An additional radiotherapy centre has opened at Taunton (2009), and satellite centres have been established at Oldham (2010), Peterborough (2011), Aintree (2011), Salford (2011) and Bracknell (2011).This will mean shorter travel times for patients in some of the areas highlighted with longer travel times in the period of this study. For increasing numbers of head and neck cancer patients, however, access to complex radiotherapy (e.g. (IMRT) Intensity Modulated Radiotherapy Treatment) is required. Currently, at least one radiotherapy centre in every cancer network is able to provide IMRT but few currently have sufficient capacity to deal with demand. It is important to note that the travel times have been estimated for off-peak travel times, using private transport. It has not been possible to estimate travel times for public transport users. The times will be longer for those travelling in peak time and possibly also for those using public transport. Travel times by ambulance or hospital transport may also be longer, with patients having to fit in with availability of transport. Those using private transport may find parking problems within the hospital grounds, which may add to their journey times. This means that actual travel times are often longer than predicted by the modelling data.
For patients requiring long courses of radiotherapy, perhaps daily for more than 6 weeks, longer travel times may be a discouraging factor when considering the choice of radiotherapy over surgery, particularly if both treatment modalities provide similar benefits. Alongside the establishment of satellite centres, providers have been looking at other ways of minimising the impact of travel times on patients e.g. by organising hostel/hotel accommodation for patients near to the radiotherapy centre.
References
1. Jones AP, Haynes R, Sauerzapf V et al. Travel time to hospital and treatment for breast, colon, rectum, lung, ovary and prostate cancer. Europ. J Cancer 2008; 44: p. 992-9.
2. National Radiotherapy Advisory Group. Radiotherapy: Developing a world class service for England; A Report to Ministers 2007. http://www.dh.gov.uk/prod_consum_dh/groups/dh_digitalassets/@dh/@en/documents/digitalasset/dh_074576.pdf (last accessed on 31st Aug 2011)
3. Cosford P, Garrett C, Turner K. Travel times and radiotherapy uptake in two English counties. Public Health 1997; 111: p. 47-50.

13
4. NHS Information Centre. National Head and Neck Cancer Audit 2010 (Amended) http://www.ic.nhs.uk/webfiles/Services/NCASP/audits%20and%20reports/Head_and_Neck_Cancer_Audit_2010/NHS_Head_Neck_Cancer_Audit_ERRATA.pdf (last accessed on 31st Aug 2011)
Appendix I
ICD-10 codes used to extract data
Cancer Type
ICD-10 codes
Oral cavity C02, C03, C04 and C06 Salivary glands C07 and C08 Oropharynx C01, C09 and C10 Nasopharynx C11 Hypopharynx C12 and C13 Larynx C32 Palate C05
Appendix II
Methodology for estimating travel times and distances
Travel times to specialist centres were determined by creating isochrones around each of the radiotherapy centres at 15 minutes, 30 minutes and 45 minutes. Digital NAVTEQ road network was used to calculate travel distances and times. The road network included streets in urban areas and unclassified roads. Average speed on each road class (Motorways, Primary Roads, A Roads, B Roads, Unclassified Roads and Streets) was used. The proportion of patients within each of the 3 isochrones was estimated by a count of patient postcodes.
The average travel distances for patients were estimated for every postcode location to the nearest radiotherapy centres, regardless of whether this was the actual centre of treatment. The methodology for each travel distance within the GIS used ‘shortest time’ algorithm, rather than the ‘shortest distance’ in order to approximate real-life conditions in private transportation. The shortest time used a route with the least time for the patient from the point of origin (home postcode) to the point of treatment. The altered average speeds were used as per the isochrone calculation.

14
Appendix III
Key to radiotherapy centres
Three Counties 1 Cheltenham General Hospital Anglia 2 Addenbrooke’s Hospital 3 Ipswich Hospital 4 Norfolk & Norwich University Hospital Arden 6 University Hospital, Coventry Avon, Somerset & Wiltshire 7 Bristol Royal Infirmary 8 Royal United Hospital, Bath Central South Coast 9 St Mary’s Hospital , Portsmouth 10 Southampton General Hospital Dorset 11 Poole General Hospital East Midlands 12 Derbyshire Royal infirmary 13 Leicester Royal Infirmary 14 Lincoln County Hospital 15 Northampton General Hospital 16 Queen’s Medical Centre Campus Essex 17 Colchester General Hospital 18 Southend Hospital Greater Manchester & Cheshire 19 Christie Hospital Greater Midlands 20 New Cross Hospital 21 North Staffordshire Royal Infirmary 22 Royal Shrewsbury Hospital Humber & Yorkshire Coast 23 Hull Royal Infirmary Kent & Medway 24 Maidstone District General Hospital 51 Kent & Canterbury Hospital (satellite centre for Maidstone) Lancashire & South Cumbria 25 Royal Preston Hospital Merseyside & Cheshire 26 Clatterbridge Centre for Oncology Mount Vernon 27 Mount Vernon Cancer Centre North East London 28 Queen’s Hospital 29 St Bartholomew’s Hospital North London 30 North Middlesex Hospital 31 University College London North of England 32 Cumberland Infirmary 33 Freeman Hospital 34 James Cook University Hospital North Trent 36 Royal Hallamshire Hospital North West London 37 Charing Cross Hospital 38 Northwick Park Hospital Pan Birmingham 39 Queen Elizabeth Hospital Peninsula 40 Derriford Hospital 41 Royal Cornwall Hospital (Treliske) 42 Royal Devon & Exeter Hospital (Wonford) 43 Torbay District General Hospital

15
South East London 44 St Thomas’s Hospital South West London 45 The Royal Marsden Hospital Surrey, West Sussex & Hampshire 46 Royal Surrey County Hospital Sussex 47 Royal Sussex County Hospital Thames Valley 48 John Radcliffe Hospital 49 Royal Berkshire Hospital Yorkshire 50 St James’s University Hospital, Leeds