travel demand modeling at · pdf filesouthern methodist university ... transportation data...
TRANSCRIPT

Travel Demand Modelingat NCTCOG
Arash MirzaeiNorth Central Texas Council Of Governments
for
Southern Methodist UniversityThe ASCE Student Chapter
October 24, 2005

Contents
NCTCOGDFW Regional Model StructureApplication Examples

What is NCTCOG?
The North Central Texas Council of Governments (NCTCOG) is a voluntary association of local governments, and was established to assist local governments in planning for common needs, cooperating for mutual benefit, and coordinating for sound regional development.

NCTCOG Departments
1. Executive Director’s Office2. Agency Administration3. Community Services4. Emergency Preparedness5. Environment And Development6. Public Affairs7. Research And Information Resources8. Transportation (Also Serves As The MPO)9. Workforce Development

What is a MPO?
Federal highway and transit statutes require, as a condition forspending federal highway or transit funds in urbanized areas, the designation of Metropolitan Planning Organizations (MPOs), which have responsibility for planning, programming and coordination of federal highway and transit investmentsISTEA's requirement that a portion of Surface Transportation Program funds be made available for expenditure in metropolitan areas with populations over 200,000, along with project selection through the metropolitan planning process is one mechanism that has brought shared responsibility for highway and transit investment decisions in metropolitan regions


4,536,010
6,671,351
4,848,237
5,650,339
7,952,0708,503,146
0
1,000,000
2,000,000
3,000,000
4,000,000
5,000,000
6,000,000
7,000,000
8,000,000
9,000,000
10,000,000
1995 2000 2005 2010 2015 2020 2025 2030 2035 2040
Previous Plan Demographics (Mobility 2025 Update) New Plan Demographics (Mobility 2025, 2004 Update)
(Previous Plan)
(New Plan)
Total Population Within The Dallas – Fort Worth Metropolitan Planning Area

Transportation DepartmentProgram Areas
1. Administration
2. Air Quality Planning And Operations
3. Information Systems
4. Strategic Initiatives And Community Outreach
5. Transportation Planning
6. Transportation Programming And Operations

Information Systems
Transportation Data Management (Including Web-Based Activities And GIS Support)
Travel Model development and Traffic Simulation
Computer Maintenance

Regional Transportation Model
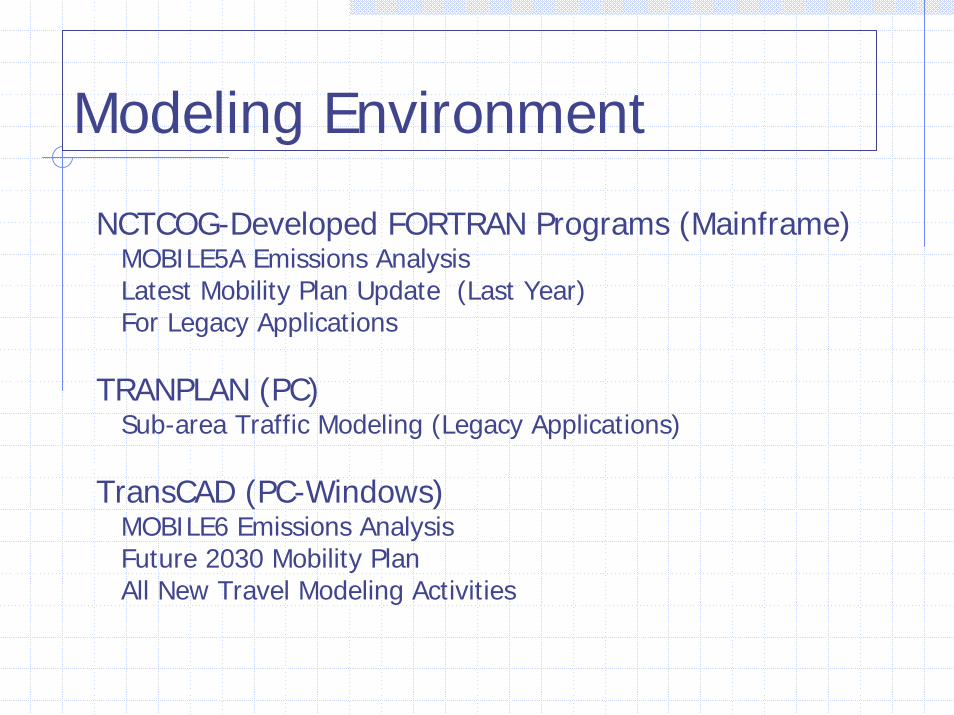
Modeling Environment
NCTCOG-Developed FORTRAN Programs (Mainframe)MOBILE5A Emissions AnalysisLatest Mobility Plan Update (Last Year)For Legacy Applications
TRANPLAN (PC)Sub-area Traffic Modeling (Legacy Applications)
TransCAD (PC-Windows)MOBILE6 Emissions AnalysisFuture 2030 Mobility PlanAll New Travel Modeling Activities

Modeling ParadigmThe Ideal Solution
Ideally, we should build a detail model to replicate every person’s daily travel decisions:
travel or not?if yes, where to?at what time?using what mode (car drive alone, car shared-ride, transit, bicycle, walk)?path?
Then, we should model long term decisions of a person to predict futureFinally, we can aggregate everyone’s decisions and observe the effect on a project.This approach is currently impractical. Why?

Modeling ParadigmThe Practical Solution
Practically, we model collective trip patterns for groups of people in a travel survey zone (TSZ). We estimate:
number of motorized trips produced and attractedhow trips are distributed among TSZsmode share of distributed trips(car drive alone, car shared-ride, and transit)?assign trips to roadway or transit paths.
Then, we model long term growth of population and employment for each zone. Finally, we aggregate collective decisions and observe the effect on a project.This approach is less than ideal but generally works for big decisions.

Travel D em andForecasting Process
UrbanActivity
TripFrequency
DestinationChoice
M odeChoice
Roadw ayRoute
Choice
TransitRoute
Choice
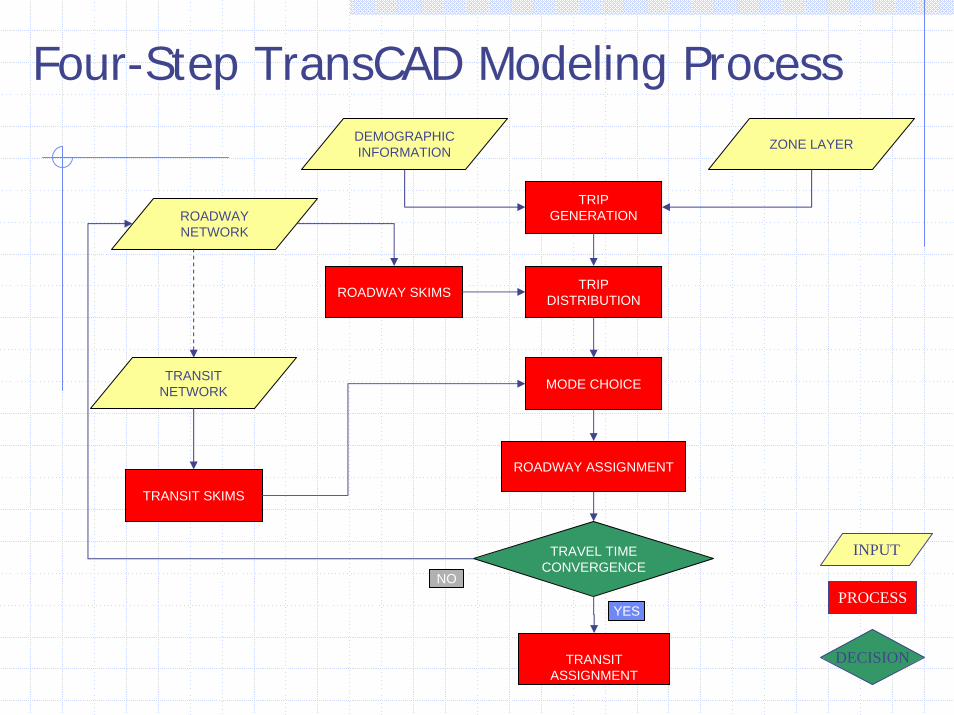
Four-Step TransCAD Modeling Process
TRIP GENERATION
TRIP DISTRIBUTION
MODE CHOICE
ROADWAY ASSIGNMENT
TRAVEL TIMECONVERGENCE
TRANSIT ASSIGNMENT
NO
YES
ZONE LAYERDEMOGRAPHIC INFORMATION
ROADWAY NETWORK
TRANSIT NETWORK
LOO
P
ROADWAY SKIMS
TRANSIT SKIMS
INPUT
PROCESS
DECISION

The “Practicality”Of Real-World Modeling
Actual Scope Of Human Behavior Model ScopeAll Person Trips Motorized Person TripsAll Travel Purposes HBW, HNW, NHB, And Truck Purpose CategoriesAll Occupations Basic, Retail, And Service JobsAll Households Income And Household Size Categories (Plus Auto Ownership Breakdowns)All Streets Non-Local Streets
Individual Data Aggregate Data (Zones)


Creation Of 4,874-Zone Structure
Start With Year 2000 Census Block LayerGround Truth RectificationSome Block Splits (e.g., DFW And Love Field Airport)76,336 Blocks Aggregated to 6,399 zonesAdd 61 External Station “Tiny Circle” Zones = 6,460 Total Zones
Aggregate The 6,460-Zone Layer= 4,813 Internal Zones + 61 External Station Zones= 4,874 TransCAD Model Zones


TransCAD Model Size
4874 Zones Retained For ALL Modeling StepsFrom Trip Generation To Traffic/Transit Assignment4813 Internal + 61 ExternalNumber Of Zone-To-Zone Pairs = 23.8 Million
Year 2025: 27,000 Roadway Links+ 9,600 Zone Connectors
Over 36,600 Coded Links22,000 Network Nodes
2025 Transit410 Coded One-Way Bus Lines And 36 Rail Lines14,500 Bus Stops And 171 Rail Stations

Single-PC Model Run Times(For 3.2 GHz Pentium PC)
Full “No Feedback” Model Run = 647 Minutes (10.8 Hours)
Trip Generation = 1.0 minuteRoadway Skimming (4) = 11 minutesTrip Distribution = 11 minutesMarket Segmentation = 6 minutesTransit Prep And Skimming (4) = 77 minutesMode Choice (13) = 65 minutesMatrix Preparations (For Transit Assignment) = 10 minutesTransit Assignment (4) = 21 minutesMatrix Preparations (For Traffic Assignment) = 98 minutesTraffic Assignment (3) = 347 minutes (5.8 hours)

AUTOMATED NETWORK CONVERSION

Roadway Preparation
Link Free SpeedBased On Speed Limit, Distance, Area Type, Functional Class, And Intersection Control
Directional Hourly CapacityBased On Lanes, Area Type, Functional Class, And Divided/Undivided Designation
Time Period CapacityAM Peak, PM Peak, And OffPeak

Trip Generation
GISDK Macro LanguageSeven “Regular” Internal-Internal Trip Purposes4 HBW, 1 HNW, 1 NHB, And 1 Truck
InputsPopulation, Households, Median Household IncomeBasic, Retail, And Service Jobs (From SIC Codes)Special Generators (Shopping Malls, Colleges, Hospitals, Airports)


SMU as a Special Generator


What Is A Trip ProductionAnd A Trip Attraction?
TRIP = Use Of Motorized Transportation (Auto, Motorcycle, Truck, Or Public Transit) For At Least A Portion Of The Journey Between Two Activities
Home to Work = Home-Based Work (HBW) trip; Home is both Origin and Production end, while Work is both Destination and Attraction end
Work to Home = Also a HBW trip; Work is both Origin and Attraction end, while Home is both Destination and Production end
Nonhome to Nonhome = Nonhome-Based (NHB) trip; first activity of a NHB trip is always the Origin and Production end, while the second activity is always the Destination and Attraction end


Trip Production Rate Tablefor HBW
Household SizeInc.Q.
1 2 3 4 5 6+
1 0.870 1.347 2.082 2.354 2.003 2.003
2 1.288 1.916 2.491 2.583 2.908 3.524
3 1.288 2.192 2.756 2.771 3.168 3.168
4 1.288 2.192 2.866 2.866 3.213 4.458


External Station Trip Tables
Internal-External And External-Internal (IE/EI) Weekday Passenger Vehicles (Total Trip Ends)
External-External (EE) Weekday Passenger Vehicles
IE/EI Weekday Trucks (Six Or More Tires)
EE Weekday Trucks (Six Or More Tires)

TRIP GENERATION LIMITATIONS
Calibrated Trip Rates Represent Survey-Based AveragesA low-income, two-person household in Frisco has the same number of
HNW trip productions as a low-income, two-person household indowntown Dallas
A suburban furniture store with 50 retail employees (jobs) has the samenumber of HNW attractions as a suburban grocery store with 50 retailemployees
Trip Rates Are Not Impacted By Changes In AccessibilityTrip rates remain fixed, regardless of changes in roadway travel times
or accessibility to transit

Trip Distribution
Gamma-Format Gravity Model (7 Purposes)Four HBW Groups (Income Quartiles) – AM Peak SkimsHNW (Non-Airport) -- OffPeakNHB (Non-Airport) -- OffPeakTrucks (Vehicles With Six Or More Tires) -- OffPeak
Base Year Trip Table Factoring (6 Purposes)HNW And NHB Airport TripsFour External-Related Auto/Truck Trips


Zone To Zone Skim TablesFor Mode Choice
Four AM Peak Skims (6:30a – 8:59a)Roadway – Without HOV Links Available (Drive Alone)Roadway – With HOV Links Available (Shared Ride 2 And 3+)Transit – Drive Access (PA Format)Transit – Walk Access (PA Format)
Four OffPeak SkimsRoadway Is 18-hour Offpeak
Without HOV Links Available (Drive Alone)With HOV Links Available (Shared Ride 2 And 3+)
Transit Is 6-hour Mid-Day Offpeak (9:00a – 2:59p)Drive Access (PA Format)Walk Access (PA Format)

Mode Choice InputsAuto Travel
Roadway Travel TimeRoadway Length (Operating Cost)Daily Parking Cost
Transit TravelIn-Vehicle Transit Travel Time (Includes Dwell)Walk (Or Drive) Access TimeWalk Transfer And Egress TimeInitial And Transfer Wait TimeTransit FareMarket Segment And Area Type Constants

HBW Mode Choice Model Structure
Choice
Drive Alone Shared Ride 3+Shared Ride 2
Transit Drive Transit WalkAuto

HNW Mode Choice Model Structure
Choice
Shared Ride 3+Shared Ride 2 Transit Drive Transit Walk
Shared RideDrive Alone Transit Drive

NHB Mode Choice Model Structure
Choice
Drive Alone Shared Ride 3+Shared Ride 2 Transit Drive Transit Walk

Mode Choice OutputsFor each trip purpose, person trip tables
by mode:
Drive-aloneShared-rideWalk to TransitDrive to Transit

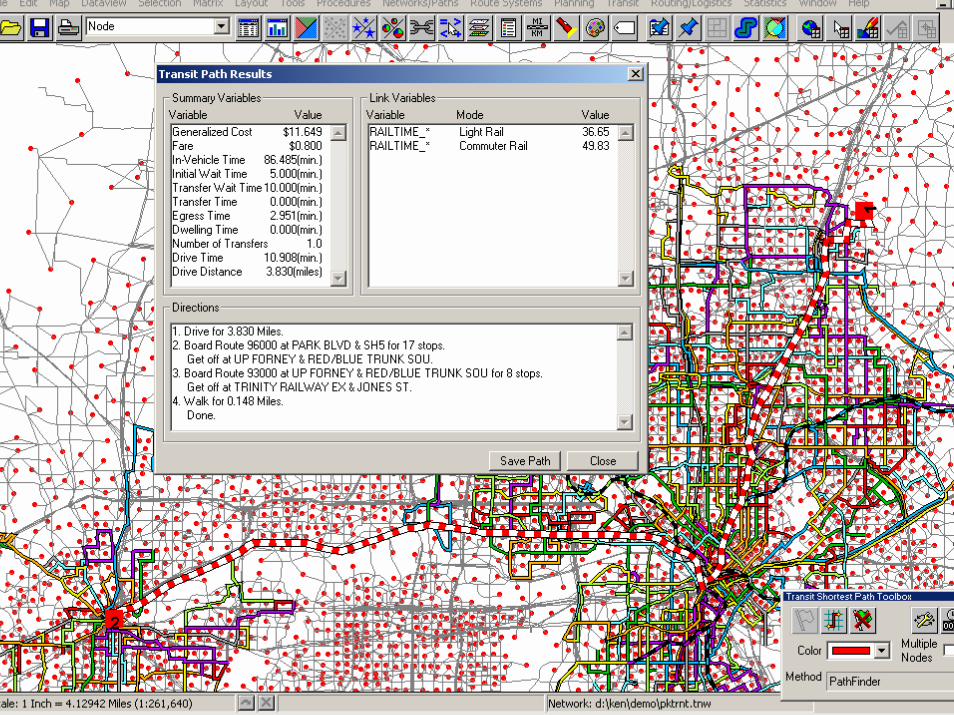
Transit Assignment
Four Multi-Path (TransCAD Pathfinder) Production-Attraction Assignments
For All HBW Transit TripsPeak Transit-Initial Drive Access (Park-and-Ride)Peak Transit-Initial Walk Access (No Park-and-Ride)
For All HNW And NHB Transit TripsOffpeak Transit-Initial Drive Access (Park-and-Ride)Offpeak Transit-Initial Walk Access (No Park-and-Ride)

Traffic Assignment Preparation
Production-Attraction To Origin-Destination Trip Table Transposing, Factoring, And Aggregation
AM Peak Period (2.5 Hours)
PM Peak Period (3.5 Hours)
Off Peak Period (18 Hours)

Traffic Assignment
User Equilibrium Generalized Cost (Three 30-Iteration Assignments)
A.M. Peak (6:30a – 8:59a: 2.5 hours)P.M. Peak (3:00p – 6:29p: 3.5 hours)OffPeak (18 hours)
Four Vehicle Classes Loaded SimultaneouslyDrive AloneShared-Ride “Sees” HOV LanesShared-Ride “Doesn’t See” HOV LanesTrucks (Vehicles With 6 Or More Tires)

Post-Processing Of Link Speeds
Example: AM Peak Directional Link Speeds
Allocate (Based on Observed Time-Of-Day Factors) The 2.5-Hour AM Peak Assignment Volume Into Three Sub-Periods
6:30a – 6:59a (30 Minutes)7:00a – 7:59a (60 Minutes)8:00a – 9:00a (60 Minutes)
Calculate V/C ratios For Each Sub-PeriodNote: Capacity for 30-minute period is ½ the hourly capacity
Apply The “Post Process” Volume Delay Curves

Model Outputs:Supply-Side Calculations
Number Of Coded Transit Lines
Roadway Network Links (Or Miles) With Transit
Total Physical Stops And “Line” StopsHow Many Are Rail StationsHow Many Are Transit Park-And-Ride Locations
AM Peak And Mid-Day OffPeak Vehicle Miles AndHours Of Travel
Population And Employment Within “Buffer” Areas

Direct Model Outputs
Person Trip (Production-Attraction) Matrices (4874 x 4874)By Trip Purpose And Mode Of Travel
Roadway And Transit Skim Matrices (4874 x 4874)
ONs And OFFs (Boardings And Alightings) For EachCoded Transit Stop
Transit “Link” Flow File (Stop To Stop)
Movements File (Line To Line Rider Transfers)
Link-Level Traffic Volumes And Speeds By Vehicle Class and Time Of Day

Model Outputs:Demand-Side Calculations
Transit Boardings And AlightingsBy Mode, By Route, By Line, Or By Rail StationFor Weekday, Or For Each Of Four Assignments
Regional Average Transfer RatesBoardings, Riders, And Boardings Per Rider
Transit Passenger Miles And Hours
Rail Station Mode-Of-Access/Egress Summaries


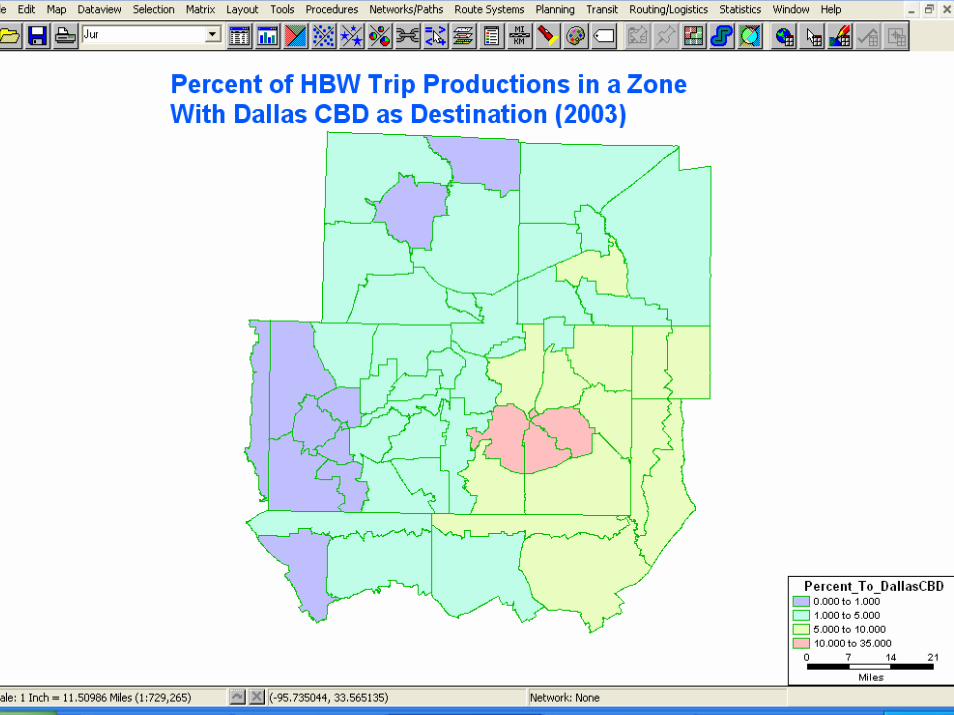
Some Application Examples
Regional Rail Corridor StudyDallas CBD Study