transportation planning for an aging population in metro...
TRANSCRIPT

Transportation Planning for an Aging Population in Metro Vancouver:
An Assessment of the North ShoreSeniors Go Bus Program
Megan Fitzgerald & Silver Harbour Seniors Activity Centre
Prepared for the South Coast British Columbia Transportation Authority (TransLink) | Submitted September 2009
ACKNOWLEDGEMENTS
Silver Harbour Seniors’ Activity CentreAnnwen Loverin, Executive DirectorJohn McCann, Scheduler & Driver
TransLinkDan Freeman, Transportation Planner, Transit PlanningGraeme Masterton, Manager, Transit PlanningJoanna Brownell, Transportation Planner, Transit PlanningPeter Hill, Manager, Access Transit OfficePeter Klitz, Transportation Planner, Transit PlanningMartin Lay, Director, Access Transit OfficeTeresa O’Reilly, Program Manager, Transit Planning
Westside Seniors Empowerment CoalitionJulie Wall, Seniors Co-ordinator, Kitsilano Neighbourhood HouseSusan Carthy, Volunteer, Kitsilano Neighbourhood House
University of British ColumbiaCarole Jolly, Director, UBC TREKTim McDaniels, Research Supervisor, School of Community and Regional PlanningTom Koch, Adjunct Professor, Geography/Gerontology
TABLE OF CONTENTS
..........................................................................................EXECUTIVE SUMMARY i
.....................................................................................Demographic trends i
.............Transportation issues as perceived by seniors on the North Shore i
................................................North Shore Seniors’ Go Bus—a solution? ii
..............................................The Go Bus model’s relevance to TransLink iii
................................................................................................1. INTRODUCTION 1
...........................................................................................1.1 Background 1
...............................................................................................1.2 Overview 3
.............................................................................................1.3 Objectives 3
.........................................................................................1.4 Methodology 4
........................................................................................2. LITERATURE REVIEW 5
........................................................................2.1 Defining “senior citizen” 5
.................2.2 Demographic trends and the implications of growing older 5
.......................................................................2.3 Disability among seniors 7
.....................................................2.4 Accessibility and accessible design 8
................................................................................2.5 Paratransit service 8
...................................................2.6 Meeting the needs of older travellers 9
..........................................................................2.7 Transportation equity 10
..........................................................3. A SNAPSHOT OF THE NORTH SHORE 12
............................................................................3.1 Geographic context 12
.....................................................................................3.2 Demographics 13
...........................................................3.3 Current transportation options 13
4. TRANSPORTATION ISSUES AFFECTING SENIORS ON THE NORTH SHORE 16
.....................................................................4.1 Summary of key themes 16
..........................................................................................4.2 Conclusion 22

..................................................5. NORTH SHORE SENIORS GO BUS MODEL 23
.................................................................................5.1 What is Go Bus? 23
.................................................................................................5.2 History 23
.............................................5.3 Organizational structure and operations 24
................................................................................................5.4 Budget 26
.............................................................................................5.5 Ridership 28
...........................................................................5.6 Go Bus performance 32
.................................................................5.7 Strengths and weaknesses 34
..........................6. OPTIONS FOR IMPROVING SENIORS TRANSPORTATION: 36
............................................................................ANALYSIS OF ALTERNATIVES 36
.............................................................................6.1 Problem statement 36
.....................................................................6.2 TransLink policy context 37
...............................................................................6.3 Evaluation criteria 40
.........................................................................................6.4 Alternatives 42
.........................................6.5 Evaluation of alternatives and implications 46
...................................................................6.6 Discussion of alternatives 46
..........................................................................................6.7 Conclusion 50
.................................................................................................7. CONCLUSION 51
.............................................................................................7.1 Summary 51
................................................................................7.2. Study limitations 51
...........................................................7.3 Further research opportunities 52
.....................................................................................................REFERENCES 53
APPENDIX A. SENIORS’ TRANSPORTATION SERVICES IN NORTH AMERICA 57
.........................................................................APPENDIX B. GO BUS SURVEY 61
LIST OF FIGURES
...........................................Figure 1. North Shore Seniors Go Bus vehicle! iii
.....................Figure 2. Projected growth of senior population, 65 and over! 6
...............................Figure 3. View of North Vancouver from Burrard Inlet! 12
.............................Figure 4. Median age and proportion of seniors, 2006! 13
..............Figure 5. Transportation options for seniors on the North Shore! 15
............................................................................Figure 6. Inside Go Bus! 26
.............................................................Figure 7. Go Bus funding sources! 27
....................................Figure 8. Average annual Go Bus operating costs! 28
................................................................Figure 9. Go Bus ridership data! 29
.............................................................Figure 10. Maps of Go Bus areas! 29
....................Figure 11. Average daily number of Go Bus riders by month! 30
.....Figure 12. Average daily number of Go Bus riders by type of weather! 32
.............Figure 13. Comparison of service performance measures, 2008! 33
..................................Figure 14. Current limitations of the Go Bus model! 35
...Figure 15. Three approaches in helping seniors access transportation ! 37
.........................................................Figure 16. Access Transit strategies! 38
.......................................................Figure 17. Community shuttle vehicle! 45
.............................................Figure 18. Alternative-consequences matrix! 47
.........................................................Figure 19. Map of Navette Or routes! 57
........................................................................Figure 20. Navette Or flyer! 58
..........................................................Figure 21. Map of Silver Star routes! 59
EXECUTIVE SUMMARY
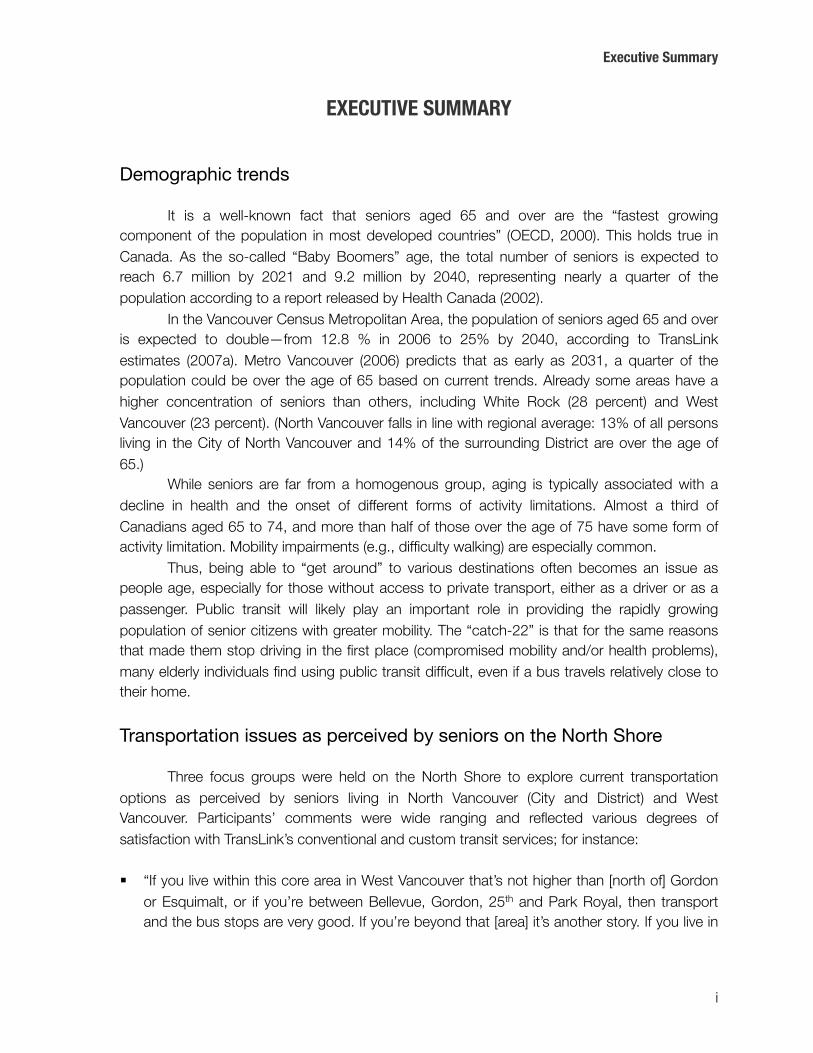
Demographic trends
It is a well-known fact that seniors aged 65 and over are the “fastest growing component of the population in most developed countries” (OECD, 2000). This holds true in Canada. As the so-called “Baby Boomers” age, the total number of seniors is expected to reach 6.7 million by 2021 and 9.2 million by 2040, representing nearly a quarter of the population according to a report released by Health Canada (2002).
In the Vancouver Census Metropolitan Area, the population of seniors aged 65 and over is expected to double—from 12.8 % in 2006 to 25% by 2040, according to TransLink estimates (2007a). Metro Vancouver (2006) predicts that as early as 2031, a quarter of the population could be over the age of 65 based on current trends. Already some areas have a higher concentration of seniors than others, including White Rock (28 percent) and West Vancouver (23 percent). (North Vancouver falls in line with regional average: 13% of all persons living in the City of North Vancouver and 14% of the surrounding District are over the age of 65.)
While seniors are far from a homogenous group, aging is typically associated with a decline in health and the onset of different forms of activity limitations. Almost a third of Canadians aged 65 to 74, and more than half of those over the age of 75 have some form of activity limitation. Mobility impairments (e.g., difficulty walking) are especially common.
Thus, being able to “get around” to various destinations often becomes an issue as people age, especially for those without access to private transport, either as a driver or as a passenger. Public transit will likely play an important role in providing the rapidly growing population of senior citizens with greater mobility. The “catch-22” is that for the same reasons that made them stop driving in the first place (compromised mobility and/or health problems), many elderly individuals find using public transit difficult, even if a bus travels relatively close to their home.
Transportation issues as perceived by seniors on the North Shore
Three focus groups were held on the North Shore to explore current transportation options as perceived by seniors living in North Vancouver (City and District) and West Vancouver. Participants’ comments were wide ranging and reflected various degrees of satisfaction with TransLink’s conventional and custom transit services; for instance:
“If you live within this core area in West Vancouver that’s not higher than [north of] Gordon or Esquimalt, or if you’re between Bellevue, Gordon, 25th and Park Royal, then transport and the bus stops are very good. If you’re beyond that [area] it’s another story. If you live in
Executive Summary
i

the Properties, which I did for years, there’s one bus per hour and it was about four blocks from where I lived.”
“On the new buses they’ve done away with one of the poles in the middle, so you’ve got straps to hang on and they slide. So if the driver breaks heavily, you go running down the floor.”
“I used to go over to VGH when I had my hip done . . . and sometimes [HandyDART providers] they’re a bit sharp, but it worked quite well then. But that was only medicinal [sic], it’s not for recreation.”
Such comments suggest that many seniors are still faced with significant barriers that limit their ability to access transportation. Despite recent improvements to accessibility of the regional transit system, the new low-floor, accessible buses are, in some ways, less accessible to seniors. For example, the design of the accessible seating area has fewer dedicated seats and vertical poles to hold onto. As a result, it seems that many seniors, including the frail and elderly, either cannot or are choosing not to use conventional transit. Similarly, HandyDART—though it works well for many—is not always perceived as a viable transportation alternative, particularly for recreational trips.
North Shore Seniors’ Go Bus—a solution?
The North Shore Seniors Go Bus program is a multi-stakeholder partnership that provides transportation in the City of North Vancouver, District of North Vancouver and the District of West Vancouver, collectively known as the North Shore. The service was first implemented in fall 2006 using a bus donated by Evergreen House at Lions Gate Hospital, and currently operates three, 8-hour days per week. The shuttle route stops at a number of locations, including drugstores, grocery stores, medical centres, senior centres, seniors’ housing sites, community centres and other important services.
From an operational standpoint, the service is perhaps best characterized as a demand-responsive shuttle with a set of destinations rather than a fixed route. Unlike conventional transit, Go Bus has the flexibility to deviate from its route to pick up clients at their homes. The driver also provides assistance with getting to and from the vehicle, carrying parcels and transporting mobility devices. How is it different from HandyDART? Go Bus tends to be oriented more towards recreational outings and shopping trips while HandyDART has a policy of prioritizing medical- and work-related travel. For some, Go Bus is just as much a social experience as it is a means of transportation.
Focus group participants had an overwhelming appreciation for Go Bus whether they used the service or not. As one of the focus group participants put it:
The thing is we’re getting older. Right now, I’m 95 and in a few years, I’m not going to be able to get on and off a bus. If there’s something like the Go Bus around for us, I’d still be able to get places.
Executive Summary
ii
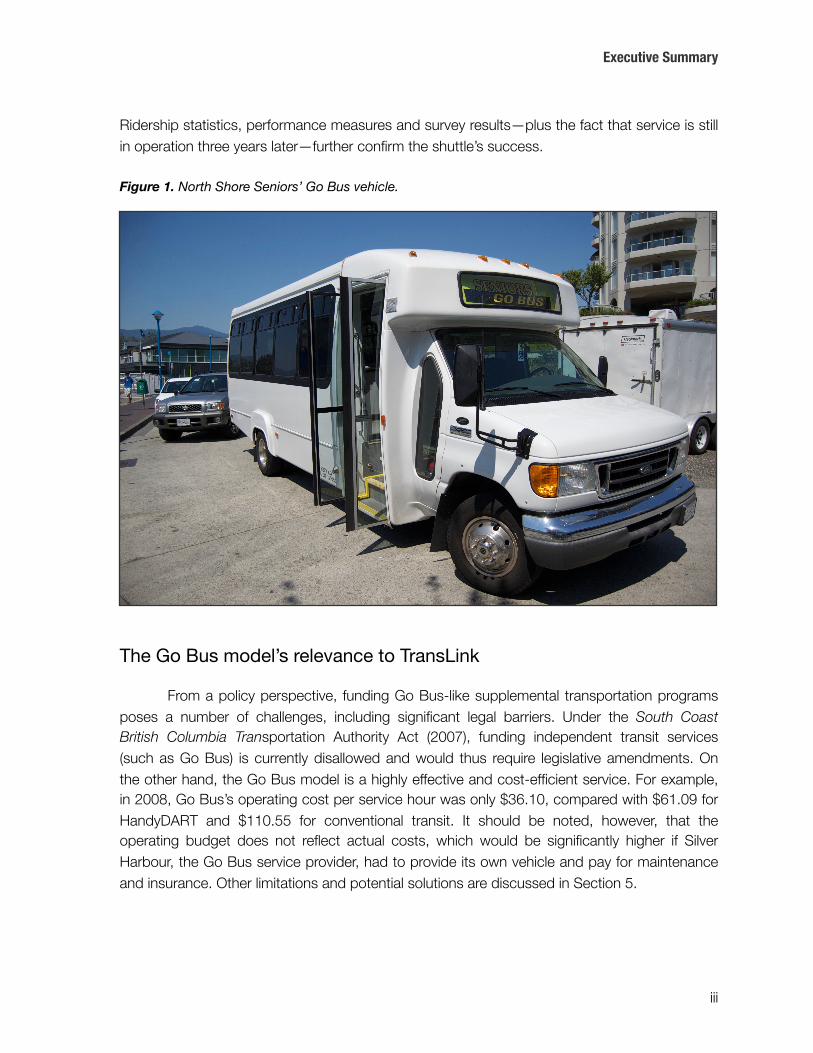
Ridership statistics, performance measures and survey results—plus the fact that service is still in operation three years later—further confirm the shuttle’s success.
Figure 1. North Shore Seniors’ Go Bus vehicle.
The Go Bus model’s relevance to TransLink
From a policy perspective, funding Go Bus-like supplemental transportation programs poses a number of challenges, including significant legal barriers. Under the South Coast British Columbia Transportation Authority Act (2007), funding independent transit services (such as Go Bus) is currently disallowed and would thus require legislative amendments. On the other hand, the Go Bus model is a highly effective and cost-efficient service. For example, in 2008, Go Bus’s operating cost per service hour was only $36.10, compared with $61.09 for HandyDART and $110.55 for conventional transit. It should be noted, however, that the operating budget does not reflect actual costs, which would be significantly higher if Silver Harbour, the Go Bus service provider, had to provide its own vehicle and pay for maintenance and insurance. Other limitations and potential solutions are discussed in Section 5.
Executive Summary
iii
In addition to funding Go Bus-like services, three other policy alternatives are discussed within this report, including:
Implementing an enhanced customer service strategy—this alternative proposes further development of TransLink’s customer support and community outreach initiative through a new transportation demand management (TDM) strategy aimed at seniors.
Providing a new transit service type targeting seniors similar to TransLink’s Community Shuttle service type, though the route(s) would connect senior-friendly destinations.
Maintaining current service levels—i.e., “do nothing.”
This study argues that the “do nothing” approach is not a long-term mobility strategy. While significant improvements to accessibility have been made, the sheer number of elderly seniors—many of whom will have mobility impairments restricting their use of conventional transit—is bound to overwhelm the custom transit system. Using this report as foundation for future research, further development and analysis of the proposed and/or new policy alternatives is recommended. Ultimately, improving seniors’ transportation is more than just a matter of selecting one option over another: There is no “silver bullet,” or single solution to all seniors mobility problems. Non-driving seniors need a wide range of transportation options enabling them go where they want, when they want, to continue to live full and active lives.
Executive Summary
iv
Transportation Planning for an Aging Population in Metro Vancouver:
An Assessment of the North Shore Seniors Go Bus Program
1. INTRODUCTION
TransLink’s purpose, as defined by the South Coast British Columbia Transportation Authority Act (1998, §3.1), is to:
provide a regional transportation system that
(a) moves people and goods, and(b) supports (i) the regional growth strategy, (ii) provincial and regional environmental objectives, including air quality and greenhouse gas emission reduction objectives, and (iii) the economic development of the transportation service region.
Among other things, TransLink is responsible for managing and operating the regional transportation system in Metro Vancouver, preparing and implementing plans, and establishing eligibility criteria for custom transit services including HandyDART. TransLink is not mandated to provide seniors-specific transportation services, but to serve the general public.
Within Metro Vancouver, seniors comprise a rapidly growing population cohort with unique transportation needs. This under-served group provides not only as a case study but also as a case in itself. Seniors, defined as those who are 65 and older, are a group for whom public transportation is critical. Often there is no option but public transport, especially among non-drivers: “The health and mobility conditions of this age group may not only affect their ability to drive, but may result in a greater need for transportation assistance and support” (Beverly Foundation, 2003, p. 3). TransLink’s existing services, including custom transit, attempt to meet this groups’ need, but are not seen as sufficient by many current and potential users, for reasons discussed in this study.
The North Shore Seniors Go Bus provides a test case of an alternative service model for this aging constituency of transit users. While not the subject of this paper, it is also worth noting that the Go Bus model of service may have relevance to a larger group of people with physical and cognitive differences who find existing services difficult to access.
1.1 Background
Worldwide, the number of people aged 65 and older is increasing faster than ever before. In 2006, senior citizens accounted for only 12.8 percent of the population in the Vancouver Census Metropolitan Area (Statistics Canada, 2009). Yet by 2040, one quarter of the population in Metro Vancouver will be over the age of 65 (TransLink, 2007a). Throughout
Introduction
1

North America and much of the developed world, transportation providers will inevitably need to address a number of challenges associated with the rapid growth of this elderly population. For TransLink, this means providing a family of transportation services—conventional and customized—for likely twice as many seniors as they serve today.
Counter to stereotypes of older people as frail and inactive, seniors are highly active, healthier, and able to travel to a wider range of destinations than in the past. According to the Transportation Research Board (TRB): “Most older persons will have been automobile drivers all their lives and can be expected to demand high-levels of mobility and high-quality transportation services from all modes of travel that they use” (2002, p. 3). At the same time, being able to “get around” to various destinations often becomes an issue as people age, particularly among the “older old,” aged 75 and over.
Statistics show that seniors are most likely to have some form of disability compared to other age groups. According to Statistics Canada’s Profile of Disability (which the profile defined as “activity limitations”), 2001, 12.4 percent of the total Canadian population reported activity limitations. In comparison, 31.2 percent of persons aged 65 to 74, and a staggering 53.3 percent of persons 74 and older have some form of disability that reduces the kind or number of activities they can do. Mobility problems, in particular, affect more than 1.1 million persons aged 65 and over or nearly four out of five seniors with disabilities (Statistics Canada, 2002).
Seniors may not consider themselves “disabled,” yet on the other hand, they are often slow to board and alight conventional buses and may be concerned about being seated before the bus begins to move. For example, a report published by the Westside Seniors Empowerment Coalition (WSEC, 2008) states: “Seniors are reluctant to use the bus because it is too crowded and they are scared of falling” (p. 5). As Ana Torres-Davis from the American Association of Retired Persons (AARP) puts it: “A bus driver cannot give frail elderly other support that they may need, for example, getting to or through the door of their destination” (2008, p. 284). Many seniors are unable to walk extended distances; thus, long gaps between bus stops become a critical issue, especially in sloped areas and during inclement weather. Similarly, carrying groceries and other parcels may compound existing mobility problems.
While accessibility of the public transit system in Metro Vancouver has improved for seniors, including those with disabilities (for example, with the introduction of low-floor buses), further improvements are still needed. Broadly speaking, accessible transit is designed to meet the needs of all transit users, including persons with visual, hearing, cognitive, and mobility impairments. However, most often “accessible” simply means that transit is accessible primarily to persons with limited mobility such as those who use wheelchairs.
There are also a number of issues surrounding TransLink’s custom transit services, which includes HandyDART door-to-door services and the Taxi Saver program. As noted in one of TransLink’s Access Transit reports: “Up to 70% of HandyDART service is used for medical and social service trips leaving very little service available for users to engage in social, recreational or other activities” (2007b, p. 12). Equally important is the fact that seniors have different needs and wants compared to other HandyDART users. While integration of different
Introduction
2

ages works in theory it is less successful in practice, for example seniors using HandyDART must wait for after school pickups before being dropped at their destination. The one-size-fits-all model of paratransit (forms of transportation that are more flexible and personalized than conventional fixed-route, fixed-schedule transit) also fails to recognize the benefits of socializing among peers. Indeed, it can be argued for all transit-users that the experience of travelling is as important as getting to the destination itself—especially if the experience is a negative one.
The North Shore Seniors Go Bus service was initiated because community-based service providers on the North Shore felt that seniors, especially the “older-old,” were inadequately supported by both conventional and custom transit services. Although the number of non-driving seniors who are unable to use public transport is unknown, Clearly many seniors were sacrificing certain activities (e.g., recreation and grocery shopping) due to lack of transportation. In comparison, Go Bus, which follows a designated route similar to conventional public transit, offers an extra level of convenience by picking up and dropping off seniors where they live.
1.2 Overview
This study is founded on a vision of enhanced mobility and transportation for today’s and tomorrow’s seniors. Its intent is to serve as a starting point for further research on seniors’ transportation strategies in Metro Vancouver. The literature review presented in section 2 draws on academic and industry-based research from a wide range of disciplines including but not limited to transportation planning, human geography, disability studies and gerontology. The middle sections—3 through 5—focus on the North Shore Seniors’ Go Bus, a supplemental transportation program for seniors based in the City and District of North Vancouver and District of West Vancouver (collectively known as the “North Shore”). The study concludes with a discussion of policy alternatives. Opportunities for further research include a region-wide study of seniors’ transportation issues and comprehensive analysis of mobility strategies.
1.3 Objectives
The primary objectives of this report are to:
Identify transportation-related issues as defined by key stakeholders, including seniors, advocacy groups, and service providers.
Assess the current public transportation system in terms of ease of use, accessibility, and convenience as perceived by seniors living on the North Shore.
Compile background information on Go Bus. Review seniors’ supplemental transportation services and provide case studies.
Derive a list of policy alternatives for improving seniors’ transportation and assess the viability of each option.
Introduction
3
1.4 Methodology
The underlying methodology is best described as a mixed methods research design. The design consciously seeks to bring together a variety of perspectives, reflecting the diversity of stakeholders’ experiences and knowledge (e.g., individual seniors, seniors’ advocacy groups, non-profit agencies, municipal governments, and the regional transportation authority).
1.4.1 Methods
A combination of qualitative and quantitative methods were used, including literature review, focus groups, expert interviews with Go Bus providers, onboard surveys, and data analysis.
A review of relevant literature was conducted to provide academic context for the Go Bus case study. The literature review (section 2) draws on an extensive foundation of secondary data including policy documents, governmental plans, academic research, and industry reports. Statistics Canada is the main source of demographic data for the geographic areas included within the study.
Focus groups were used to review the strengths and weaknesses of current transportation options available to seniors living on the North Shore. Two focus groups were held on December 3, 2008, at the Silver Harbour Seniors Centre in North Vancouver. Group members included: (1) Go Bus users living in North Vancouver—City and District, and (2) nonusers living in North Vancouver. A third focus group was held on January 15, 2009, at the West Vancouver Seniors’ Activity Centre, including a mix Go Bus users and nonusers living in West Vancouver.1 Participants were recruited through community newsletters targeting seniors and by word of mouth (non-purposive sampling). A total of 33 people participated in the focus groups: 11 in the first group, 12 in the second group, and 10 in the third group. All participants were over the age of 65. The majority of Go Bus users were over 75, whereas nonusers tended to be younger seniors.
In July 2009, a survey of Go Bus riders was conducted on behalf of Silver Harbour Seniors’ Activity Centre and TransLink. The purpose of the survey was twofold: (a) to establish of profile of riders and (b) to elicit feedback on Go Bus from respondents. Over a period of three days, riders were verbally asked a series of questions about their current and former modes of transportation, including Go Bus. A total of twenty-six riders were surveyed.
A series of unstructured interviews with Go Bus organizers provided additional information about Go Bus history, day-to-day operations and financing.
Finally, hand-written data from bus logs was entered into a spreadsheet program to generate summary statistics on ridership and calculate performance measures.
Introduction
4
1 A fourth group was planned but cancelled due to low attendance which required that West Vancouver participants be combined.

2. LITERATURE REVIEW
The goal of this section is to review selected literature on transportation in an aging society and discuss the implications of these findings for transportation planning. It should be noted that much of the literature is based on American experiences and may not be entirely applicable to Canadian cites, which tend to be less automobile-oriented.
2.1 Defining “senior citizen”
“Senior citizen” broadly refers to anyone belonging to the 65 and over age group. The Oxford English Dictionary defines a “senior citizen” as an “elderly person, esp. [sic] one who is past the age of retirement” (1989, n.p). Common synonyms include “aged,” “elderly,” “retired persons,” and “older adults.” Turcotte and Schellenberg (2006) observe: “These definitions, not so precise but often taken for granted, can naturally be contested,” since 65 is relatively young. In Canada, the average life expectancy is roughly 80 years, with many persons living past that age (p. 7). While experts disagree on how “senior citizen” might be objectively defined (e.g., current life expectancy minus a certain number of years), 65 is the usual threshold—and probably the most practical definition given that Canadians are entitled to receive a pension at that age. The age of 65 also marks the transition into what is commonly referred to as the “golden years” of retirement.
Of course, it is important to note that aging is experienced uniquely among persons who might have the same numeric age, thus seniors should not be treated as a homogeneous group. As Fozard (2000) points out, “Intrinsic variability in aging resulting from genetic influences are amplified by environmental factors such as differential exposure to disease, environmental pollutants and carcinogens, lifestyle variations, and variability in the manmade environment” (p. 3). For example, a growing body of literature suggests that seniors who are financially well off are more likely to be healthier and more active compared to their counterparts who are struggling to make ends meet. Moreover, the experience of aging and what it means to be a senior has dramatically changed over the last few decades. Research shows that today’s seniors are healthier and live longer due to better medical care, access to health services, and public health measures. They tend to have more education than previous generations of seniors and are better off economically (TRB, 2004). With so-called “baby boomers” quickly approaching retirement, the first of whom will turn 65 in 2010, what it means to be a senior will inevitably continue to change.
2.2 Demographic trends and the implications of growing older
Seniors aged 65 and over, are the “fastest growing component of the population in most developed countries” (OECD, 2000, p. 10). In the United Stated, 12.6 percent of the total population was 65 or older based on 2007 population data (US Census Bureau, 2007), yet it is predicted that the number of senior Americans will more than double between 1995 and 2050
Literature Review
5

—from 33.5 million to 79 million (US Census Bureau, 1996). Similarly, seniors constitute the fastest growing population group in Canada: “As the ‘baby boomers’ born between 1946 and 1965) age, the seniors population is expected to reach 6.7 million in 2021 and 9.2 million in 2041” (Health Canada, 2002, p. 3). As shown in Figure 2, the fastest growth is occurring among the oldest Canadians, those who are 85 and above, followed by the 75 to 84 age cohort. Women tend to outlive men, thus a higher percentage of seniors are female. In 2005, just over half (52 percent) of Canadians aged 65 to 69 were women, whereas 75 percent of persons 90 and older were women (Turcotte and Schellenberg, 2002).
Figure 2. Projected growth of senior population, 65 and over (Health Canada, 2002).
Not only is the population aging there are a number of social, economic, and health-related changes affecting the status of the elderly compared to that of previous generations. Overall, new generations of older Canadians will be healthier, more active, and better educated; they are also more likely to be financially well-off (Health Canada, 2002). In 1901, the average life expectancy in Canada was 50 years for women and 47 years for men (Martel and Bélanger, 2000). In contrast, exactly a hundred years later, the health-adjusted life expectancy (i.e., the number of years of good health) for Canadians aged 65 was 14.4 years (79.4) for women and 12.7 years (77.7) for men (Turcotte and Schellenberg, 2002). In other words, Canadians are living roughly thirty years longer than they were a century ago.
In 2003, 37 percent of seniors reported that they were in “excellent or very good health” (Statistics Canada, 2006, p. 46). Those who reported themselves in good health were more likely to have a higher level of education. The same study found that 58 percent of university-educated persons aged 65 to 74 said they were in excellent or very good health. However, while today’s seniors are healthier, aging is typically associated “with a decline in general health and with the onset of different forms of activity limitations” (Turcotte and Schellenberg, 2002, p. 44).
Literature Review
6

2.3 Disability among seniors
Broadly speaking, disability refers to: “Any restriction or lack . . . of ability to perform an activity in the manner or within the range considered normal for a human being,” as the result of a physical, sensory, or cognitive condition, and/or other health problems (World Health Organization, 1981). In 2001, 3.6 million Canadians, many of whom are seniors, reported having “activity limitations,” meaning that one in eight, (12.4 percent) have a disability. The disability rate increases dramatically with age: “From 3.3% among children aged 0 to 14, it rises to nearly 10% among adults aged 15 to 64 and climbs to more than 40% among persons aged 65 and over” (Statistics Canada, 2001, p. 8).
Mobility problems (i.e., difficulty walking) are the most common form of impairment affecting Canadian seniors, especially women. According to the document A Profile of Disability in Canada, 2001, 23.3 percent of people aged 65 to 74 reported having mobility problems, compared to 42.9 percent of people aged 75 and over (Statistics Canada, 2001). As noted by Torres-Davis: “For the same reasons that made them stop driving in the first place, elderly individuals with compromised mobility or health problems find using a public transportation stop difficult or impossible even if it is close to their home or destination” (2008, p. 284).
Those with a disability are less likely to hold a driver’s license. In one study, about 60 percent of non-disabled seniors possessed a driver’s license. In comparison, only about a third (34 percent) of seniors with a manual dexterity problem or uncorrected vision problem (34 percent) had a driver’s license. The study found that: “Among those with a disability, the proportions holding a license were consistently lower, although how much lower depended on the [type of] disability” (Millar, 1999, p. 64).
In any discussion of disability, it is important to recognize that many of these facts are shaped by the way society thinks about disablement. Gleeson (1996) argues that researchers need to think of disability not as a medical definition based on physiological weakness; but as a socially constructed, normative concept reflecting the idea of what humans ought to be. As such, many people prefer the term, “impairment,” because it makes no assumption about the capacity of a person and has less social stigma. As Gleeson puts it: “Far from being a natural human experience, disability is what may become of impairment as each society produces itself: socio-spatially, there is no necessary correspondence between impairment and disability” (1996, p. 391).
For many people with physical or cognitive impairments, including older adults who have had to stop driving, alternative modes of transportation are essential. A poorly planned built environment reinforces the concept of disability by preventing disabled people from accessing many services and facilities such as public transit systems. For example, buses are often wheelchair accessible, yet bus stops themselves may not have sufficient room for a wheelchair to load or seating for those with health problems that prevent them from standing for long periods. The term “transportation disadvantaged” is often used to describe “people whose range of transportation alternatives is limited, especially in the availability of relatively easy-to-use and inexpensive alternatives for trip making” (TRB, 2003b, p. 8-48). Seniors are often included in this group, though it is important to note that impairment is a more decisive
Literature Review
7
factor than age itself. Although many seniors are far from frail, the fact remains that seniors are more likely to have disabling conditions that require public transportation alternatives in lieu of the private automobile.
2.4 Accessibility and accessible design
The words “accessibility” and “access” have many meanings and implications. In the context of transportation planning, “accessibility” often refers to the concept of physical access to goods, services, and destinations; however, it can also mean accessible design (also known as “universal design”) which refers to inclusive facility design that accommodates everyone including those with mobility and cognitive impairments, and other special needs (Litman, 2008a & 2008c). Despite our society’s evolving understanding of the term, the idea of “accessible” is still too often limited to wheelchair accessibility. For example, the US-based Transportation Research Board, administered by the National Academy of Sciences still defines an accessible transit system as one, “that can transport any mobile person, including those who are physically disabled, and in which the vehicles and stops or stations are designed to accommodate patrons confined to wheelchairs” (2003, 8-46).
Typically designed for people who are unable to use conventional transit, custom transit services are hardly a new phenomenon in North America. In 1970, U.S. Congress mandated that: “elderly and handicapped persons have the same right as other persons to utilize mass transportation facilities and services” (as cited in Wachs, 1979, p. 1). By 1975, the US Department of Transportation had adopted regulations requiring that transportation authorities pay more attention to the transportation needs of the elderly. In Canada, the most important disability legislation at the federal level is the Canadian Human Rights Act (1978), which outlaws discrimination in the delivery of goods and services because of mental and physical disability.
Each province also has its own disability Act or Code that covers other types of services such as public transit, which are not included under federal legislation. In British Columbia, section 8(1) of the Human Rights Code states that: “a person must not, without a bona fide and reasonable justification,” deny or discriminate against “a person or class of persons regarding any accommodation, service or facility customarily available to the public because of . . . physical or mental disability.” Mandated accessible transportation standards or guidelines are absent from BC’s provincial legislation, thus the onus to improve services for customers with disabilities falls upon transit agencies.
2.5 Paratransit service
Most conventional transit systems in North America are supplemented by shuttle services for people who find it difficult to access public transit due to illness or disability. Paratransit is a broad term for forms of transportation that are “more flexible and personalized than conventional fixed route, fixed-schedule service” (TRB, 2003b, p. 8-28). “Special mobility” or “custom transit” services, also known as “dial-a-ride,” are a subset of paratransit, and most often include “vans and small buses designed to accommodate people in wheelchairs, or who
Literature Review
8
have other special needs,” provided by either transit agencies or non-profit organizations (Litman, 2008b). Such services are often described as being demand-responsive, which simply means that services run on flexible routes and provide door-to-door service in response to passenger bookings made with the coordinating transport agency.
As outlined in the TRB’s Transit Capacity and Quality of Service Manual (2003b), demand-responsive operations can be characterized by the following:
(a) The vehicles do not operate over a fixed route or schedule except, perhaps, on a temporary basis to satisfy a special need; and (b) typically, the vehicle may be dispatched to pick up several passengers at different pickup points before taking them to their respective destinations and may even be interrupted en route to these destinations to pick up other passengers.” (p. 8-49)
In serving this niche market, paratransit expands the options available to transportation-disadvantaged clients by providing a service that fits in “along the continuum between private automobile travel on one end and conventional, fixed route transit on the other” (Cervero, 1997, p. 261). Customers whose disabilities prevent them from using fixed route services often describe paratransit as a “lifeline” to the outside world. Thus, the importance of such services is not to be taken lightly—many customers do not have other options.
While the operating cost of custom transit tends to be less per mile than conventional transit, the cost per passenger mile is much higher due to lower average loads. Hence, services are typically limited to those who are unable to use public transit without assistance according to disability-related legislation. According to a 1995 study by the US Federal Transit Administration, public dial-a-ride services in the United States cost nearly four times as much as conventional bus transit in terms of the operating cost per passenger trip: $10.38 versus $1.79 (Cervero, 1997). However, the use of scheduling and dispatching software is helping to improve the viability of demand-responsive transportation (c.f. Round & Cervero, 1996).
The question of financial viability aside, the regulatory environment is perhaps the most significant barrier to implementing private paratransit services. Cervero (1997) documents the legal history of paratransit regulations in the United States. In his discussion of the motives for regulating urban transportation, he explains: “In the urban transit arena, governments have historically sought to protect franchise carriers or public providers from competition in the belief that mass transit, like water and electric utilities, is fundamentally a natural monopoly” (Cervero, 1997, p. 155). Even though most North American households own a car nowadays, private transportation carriers are still treated as a threat to public transit services under contemporary laws and regulations governing paratransit.
2.6 Meeting the needs of older travellers
A study for the U.S. Senate Committee on Banking, Housing and Urban Affairs by DeSalles (2002) estimates that more than half of American seniors live in the suburbs (56 percent), while only one out of five seniors live in an urban city centre (21 percent) (cited in Rosenbloom, 2003). The remainder live outside metropolitan areas in favour of rural
Literature Review
9
communities. This trend can be explained by the fact that seniors are living longer healthier lives, and are therefore more likely to remain in their homes—a phenomenon which is broadly referred to as aging-in-place. Sandra Rosenbloom, a professor of planning and gerontology at the University of Arizona, puts it well: “In large measure, this ‘greying’ of the suburbs resulted not from migration in the 1990s, but from residential decisions made long ago” (2003, p. 3).
According to Statistics Canada, seniors living in suburban or rural areas are most likely to have limited access to transportation, compared to their urban counterparts (Turcotte, 2006). Some authors (Glasglow & Blakely, 2000) have suggested that this situation puts seniors living in rural areas at greater risk of isolation, as well as making it more difficult for them to access community services. Accessibility in low-density communities is one of the most fundamental challenges for transportation planning authorities (Hanson & Giuliano, 2004). One of the problems with suburban transit services is that they are often less productive (i.e., more costly per rider) than routes in the metropolitan core. Coordinated flexible feeder services in lower-density areas are a component essential to connecting such communities with major bus routes, bus rapid transit, and rail. More research, including best practices, is needed in this area.
The Transit Cooperative Research Program (TCRP) Report 82 (2002), suggests that older consumers expect a higher level of service as characterized by the five service attributes outlined in the report: acceptability (i.e., reliability and comfort), accessibility, adaptability, availability, and affordability. The authors’ findings suggest that seniors are most concerned about reliability and on-time arrivals because many are unable to wait outside for extended periods especially in inclement weather. Being able to access buses and transit information as well as the destinations they need is essential. Older travellers also want flexible services—such as door-to-door service and the option to travel with guests. Travellers also ask for greater availability such as longer hours during the week or custom-transit services requiring less than 24-hour notice (TRB, 2002, pp. xx–xxi).
2.7 Transportation equity
The concept of transportation equity seeks to ensure that the needs of all communities, particularly low-income groups and people with disabilities, are addressed within transportation planning and policy-making processes. Historically, many transportation professionals have failed to recognize the impact of transportation policy on access to social and economic opportunities (Sanchez, Stolz, & Ma, 2003). Access to education, job prospects, and other opportunities require adequate transportation, hence “[t]ransportation is often a requirement for equity of opportunity” (Litman, 2002, p. 51). In this sense, transportation can profoundly affect quality of life, particularly in the absence of accessible, lower-cost alternatives.
Litman (2002; 2007) suggests that there are at least three categories of transportation equity: (a) horizontal equity; (b) vertical equity concerning income; and (c) vertical equity, which addresses special mobility needs. Horizontal equity is based on the concept that “equal individuals and groups should receive equal shares of resources, bear equal costs, and in other ways be treated the same” (2007, p. 3). With horizontal equity the user pays for only the costs
Literature Review
10
he or she accrues. Vertical equity, in comparison, is based on a system of cross-subsidization whereby those with greater ability to pay for a particular service contribute more than those who have less. Under this approach, transportation policies would compensate for “overall inequities” by benefiting disadvantaged groups including people with limited economic means and those with special mobility needs (Litman, p. 4).
With vertical equity, fairness is valued over equal distribution amongst diverse socio-economic groups. In the case of transportation investments, the question often becomes one of “whether certain groups or individuals will experience a disproportionate share of the burden or will receive windfall benefits” (Patton and Sawicki, 1993, p. 216). For example, transportation investments such as a new bridge or highway will often benefit commuters but do little to serve the needs of those without a car. To address transportation inequity transportation-disadvantaged groups must be provided with a viable alternative to the convenience and mobility of a car. Public transit, paratransit, and supplemental transportation programs serve different niches of the transportation-dependant population and therefore contribute to transportation equity.
Literature Review
11

3. A SNAPSHOT OF THE NORTH SHORE
Figure 3. View of North Vancouver from Burrard Inlet.
3.1 Geographic context
Part of Metro Vancouver, the North Shore, located north of the Burrard Inlet, is comprised of the District of West Vancouver, the City of North Vancouver, and the District of North Vancouver. These three municipalities are located on the south sloping foothills of the Coast Mountains and are physically separated from the City of Vancouver and the rest of the region by three major bodies of water—Howe Sound to the west, Burrard Inlet to the south, and the Indian Arm to the east.
Ambleside and Lonsdale are the two official municipal town centres as identified by the Metro Vancouver Census. Lynn Valley has also been proposed as a Municipal Town Centre in Metro Vancouver’s new Regional Growth Strategy (2009). The City of North Vancouver is relatively densely populated with a number of residential high-rise buildings in the Central Lonsdale and Lower Lonsdale areas. The District of North Vancouver, in comparison, offers a number of separate commercial neighbourhood centres rather than a true urban core, including Edgemont Village, Upper Lonsdale, Lynn Valley, Main Street, Parkgate, and Deep Cove. West Vancouver is mainly residential although a 25-block strip along Marine Drive serves as a commercial district, featuring shops, small offices, restaurants, banks, and other common amenities. West Vancouver is also home to Park Royal Shopping Centre.
The sub-region can be characterized as a primarily low-density, suburban area built around several urbanized commercial corridors—namely, Lonsdale and Ambleside The North
A Snapshot of the North Shore
12

Shore also has a number of smaller commercial hubs that are situated within residential areas. Single-family residences continue to be the most common land use despite ongoing development.
3.2 Demographics
In 2006, the population of the North Shore area was roughly 169,900, accounting for 8 percent of Metro Vancouver’s total population (Metro Vancouver, 2006). Figure 4 compares the proportion of seniors by municipality. While the proportion of seniors in the City and District of North Vancouver is on par with the regional average, West Vancouver is perhaps a better indication of the region’s greying future.
Figure 4. Median age and proportion of seniors in 2006 (Statistics Canada, 2009).
Geographic Area Median Age Total Population Total pop. 65 and over
% of pop. 65 and over
North Vancouver (City) 40 45,160 6,075 13%
North Vancouver (District) 42 82,570 11,165 14%
West Vancouver 49 42,120 9,690 23%
Vancouver (CMA) 39 2,116,470 271,435 13%
British Columbia 41 4,113,485 599,810 15%
3.3 Current transportation options
Seniors living on the North Shore have access to a wide range of seniors transportation options. As in other areas, this includes public transit, HandyDART, and subsidized taxi services, all of which are coordinated by TransLink. On the North Shore, a number of community-based agencies have also responded to a growing demand for age-friendly services by developing a variety of transportation options for non-driving seniors. According to TRB (2004): “Specialized transportation services might be needed because an individual does not have access to an automobile or is unable to use fixed-route public transportation because of a disability or because of the nature of the trip he/she needs to make” (p. 31).
Linking neighbourhoods and transit facilities, TransLink’s conventional transit system provides access to destinations throughout Metro Vancouver. As of June 2008, all TransLink buses were wheelchair accessible; however, only about half (51 percent) of Metro Vancouver bus stops are currently wheelchair accessible (P. Hill, personal communication, May 13, 2009). The sloped terrain and absence of sidewalks in certain areas of the North Shore can make it difficult for people with mobility impairments to access bus stops. Furthermore, many stops do not have accessible seating.
A Snapshot of the North Shore
13
Local initiatives, including community-based transport and volunteer driver programs, are viewed as important to maintaining seniors’ independence within the community. On the North Shore, most of these services are operated by non-profit organizations for the purpose of providing transportation to and from activities and other programs. Specialized transportation services available to seniors living on the North Shore include the Seniors’ Go Bus, the West Vancouver Seniors’ Activity Centre shuttle, the Doris the Bus shopping program, and Driving Miss Daisy (a privately owned accompaniment services) as well as a number of volunteer driving programs.
Figure 5 (on the following page) provides a comparison of some of these different services.
A Snapshot of the North Shore
14
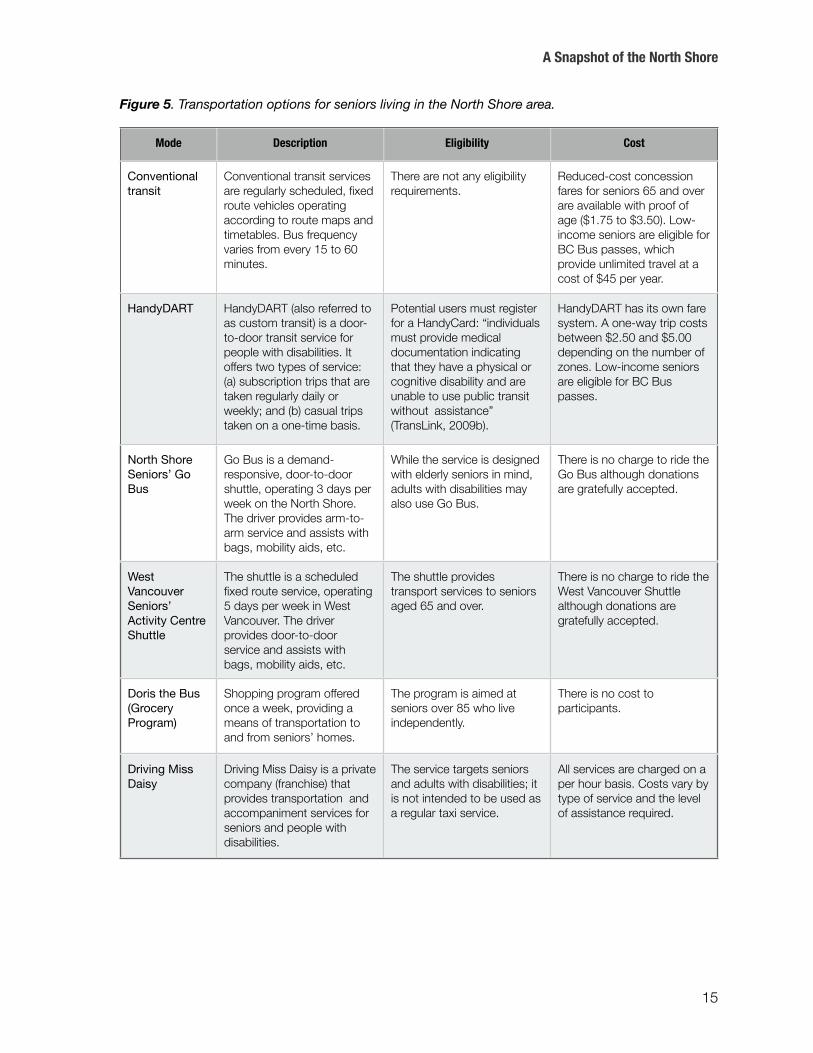
Figure 5. Transportation options for seniors living in the North Shore area.
Mode Description Eligibility Cost
Conventional transit
Conventional transit services are regularly scheduled, fixed route vehicles operating according to route maps and timetables. Bus frequency varies from every 15 to 60 minutes.
There are not any eligibility requirements.
Reduced-cost concession fares for seniors 65 and over are available with proof of age ($1.75 to $3.50). Low-income seniors are eligible for BC Bus passes, which provide unlimited travel at a cost of $45 per year.
HandyDART HandyDART (also referred to as custom transit) is a door-to-door transit service for people with disabilities. It offers two types of service: (a) subscription trips that are taken regularly daily or weekly; and (b) casual trips taken on a one-time basis.
Potential users must register for a HandyCard: “individuals must provide medical documentation indicating that they have a physical or cognitive disability and are unable to use public transit without_assistance” (TransLink, 2009b).
HandyDART has its own fare system. A one-way trip costs between $2.50 and $5.00 depending on the number of zones. Low-income seniors are eligible for BC Bus passes.
North Shore Seniors’ Go Bus
Go Bus is a demand-responsive, door-to-door shuttle, operating 3 days per week on the North Shore. The driver provides arm-to-arm service and assists with bags, mobility aids, etc.
While the service is designed with elderly seniors in mind, adults with disabilities may also use Go Bus.
There is no charge to ride the Go Bus although donations are gratefully accepted.
West Vancouver Seniors’ Activity Centre Shuttle
The shuttle is a scheduled fixed route service, operating 5 days per week in West Vancouver. The driver provides door-to-door service and assists with bags, mobility aids, etc.
The shuttle provides transport services to seniors aged 65 and over.
There is no charge to ride the West Vancouver Shuttle although donations are gratefully accepted.
Doris the Bus (Grocery Program)
Shopping program offered once a week, providing a means of transportation to and from seniors’ homes.
The program is aimed at seniors over 85 who live independently.
There is no cost to participants.
Driving Miss Daisy
Driving Miss Daisy is a private company (franchise) that provides transportation and accompaniment services for seniors and people with disabilities.
The service targets seniors and adults with disabilities; it is not intended to be used as a regular taxi service.
All services are charged on a per hour basis. Costs vary by type of service and the level of assistance required.
A Snapshot of the North Shore
15

4. TRANSPORTATION ISSUES AFFECTING SENIORS ON THE NORTH SHORE
This section reviews the strengths and weaknesses of current transportation options on the North Shore, and summarizes key themes from the focus groups held on December 3, 2008, and January 15, 2009. The purpose of the focus groups was to explore current transportation options and elicit feedback on the different modes from seniors living in the City and District of North Vancouver and the District of West Vancouver. By design, the discussion primarily focused on conventional transit, HandyDART, and Go Bus and concentrated on the strengths and weaknesses of each mode.
4.1 Summary of key themes
Focus group comments were wide ranging and reflected various degrees of satisfaction with TransLink’s conventional and custom transit services.
4.1.1 Conventional transit
More than half of the participants, including both Go Bus users and nonusers, took transit on a regular basis. Overall, most felt that bus drivers tended to be more aware of seniors’ needs when boarding the bus. The timing of buses is reliable making it easy to get around by transit. Participants, however, noted that the level of service varies from area to area: Some areas have more frequent bus service and better coverage than others do. Comments included the following:
“I buy a monthly pass and it works fine. I haven’t had a car for 16 years now so I go by transit all the time.”
“The new little community bus that goes up to Whidby seems to be very, very successful . . . [it] practically stops right outside Kiwanis and then goes right up 21st St. It’s a small bus and it’s getting the same kind of feeling for the people that use [it] that there is for our shuttle bus. So that’s been a really wonderful addition to the normal TransLink system.”
“Public transit is pretty good, but it depends on where you live.” “If you live within this core area in West Vancouver that’s not higher than Gordon or
Esquimalt, or if you’re between Bellevue, Gordon, 25th and Park Royal, then transport and the bus stops are very good. If you’re beyond that [area] it’s another story. If you live in the Properties, which I did for years, there’s one bus per hour and it was about four blocks from where I lived, and that’s not fun.”
Certain types of physical impairments made using conventional transit more difficult. Walking to the bus stop was an issue for some, especially when the bus was more than a
Transportation Issues Affecting Seniors on the North Shore
16
block or two away, and one person commented that it was difficult to read signage. Other comments included:
“Transit isn’t close enough.”
“On the main routes, fine, it’s no problem. But if you have to walk three blocks that way and two blocks the other way, it’s hardly worth getting a transit bus if you’re only going a short distance.”
“Many of us can’t see the buses, we can’t see the sign on the buses, so you have to ask a young person what bus is coming.”
Many focus group participants disliked the design of TransLink’s new buses. The design of the accessible seating area at the front of the bus, the accessibility and usability of seats, straps, and the buzzer line were the main concerns. In particular, many participants felt that more poles were needed to grab onto and that the accessible seats were difficult to use, especially when the bus was in motion. The older models of buses (now phased out) had extra handles located in the accessible seating area providing quick access to handholds. This helped to reduce frail seniors’ risk of falling when the bus was in motion. Focus group participants commented that:
“On the new buses they’ve done away with one of the poles in the middle, so you’ve got straps to hang on and they slide. So if the driver breaks heavily, you go running down the floor.”
“My arms don’t go above my shoulders, I can’t reach the straps.” “You go ‘round and just about all the bus routes here in North Vancouver for sure, are
windy . . . I try holding onto the bottom of my seat but that doesn’t always do it.”
It was also noted that accessible seating is limited and in high demand. Accessible seating spaces are often occupied by strollers and wheelchairs, which results in fewer seats for elderly patrons:
“They say it’s only for older people, but then they come with baby carriages in there and sometimes the double-ones, there’s no place you can sit [at the front of the bus]. I have to have my buggy . . .” When strollers are there, “there’s no way to get out.”
A number of participants expressed concern about the jarring motion of the buses, particularly when boarding and alighting. Participants were worried about falling because of the abrupt, stop-start pattern of movement.
“It’s very difficult, especially with the new buses to get up and be ready to get off because the bus goes all over the place . . . Sometimes the bus driver, mostly they are quite nice,
Transportation Issues Affecting Seniors on the North Shore
17
they let you sit down before they go. But some drivers, they don’t, and I’ve fallen. Who you have as a driver makes a difference.”
“I don’t take the city bus because I’m a little nervous about getting on and off.” “My only quibble with these buses—and I’m on the buses quite often—is that the drivers
are really heavy-footed both on accelerating and on the brake. And I’m pretty agile . . . but you get jerked around. If I had a walker or a cane, it would make me very nervous.”
While the cost of public transit was less of an issue, the price in Metro Vancouver was thought to be more costly than other places where they had travelled to or lived. One person suggested that seniors receive a free bus pass, while another felt that the threshold for a subsidized bus pass was somewhat arbitrary and unfair to people just slightly above the cut-off point:
“It annoys me because I’m just a thousand dollars over the limit to get that pass, and have to pay $42 per month.”
Overall, it was felt that transit offered good value—especially in comparison to the cost of owning and operating a vehicle, which is unaffordable for many seniors. Focus group participants were principally concerned about the risk of falls, the walking distance to bus stops and insufficient seating for older adults.
4.1.2 HandyDART
There is still a great deal of stigma amongst seniors associated with taking HandyDART. Seniors may not consider themselves handicapped, yet many have trouble accessing and using public transit. HandyDART vehicles are designed to carry “passengers with physical or cognitive disabilities who are unable to use public transit without assistance” (TransLink, 2009b, n.p.).
The eligibility requirements were the main barrier to accessing HandyDART’s services. Many focus group participants were either ineligible or were not sure whether they qualified for HandyDART, others were unclear on how to register for HandyCard.
Participants also tended to associate HandyDART with medical trips, whereas it was felt that Go Bus was better for recreation, shopping, and social outings: It was felt that such trips would not be possible with HandyDART. One participant from West Vancouver explained that while she wouldn’t normally use HandyDART, it was nonetheless convenient for medical trips:
“I used to go over to VGH when I had my hip done . . . and sometimes they’re a bit sharp, but it worked quite well then. But that was only medicinal [sic], it’s not for recreation.”
Poor service was another core theme among both North Vancouver and West Vancouver participants. Many focus group members expressed their frustration with
Transportation Issues Affecting Seniors on the North Shore
18

HandyDART recalling hassles with advance booking, long waiting times while aboard the vehicle, and unpredictable arrival times:
With HandyDART, “you never know when you’re going to get there . . . It might take an hour to get to your destination.”
“So many specialists over town [at Vancouver General], and HandyDART going at 8 o’clock in the morning and coming back at 11 in the morning doesn’t make any sense at all. As Joan says, you can sometimes have a 9 o’clock appointment and still be waiting for it at 11.”
Many felt that booking in advance was too much trouble, especially for recreational trips. As one participant remarked, HandyDART is “not convenient when you have to order a week ahead.”
4.1.3 Taxis
Taxis provide door-to-door service and are more flexible (time-wise) than HandyDART yet most focus group members disliked using taxis and raised concerns about the reluctance of taxi drivers to pick up elderly customers due to certain stereotypes (e.g., seniors don’t tip). It was also felt that many taxi drivers were insensitive to seniors’ needs, for example because they neglect to provide assistance with getting in and out of the vehicle or with lifting and loading mobility aids.
North Vancouver participants said that they avoided using taxis citing cost, poor service, and limited accessibility as reasons:
“I think the taxi drivers should be given a course . . . so they can understand a bit more about seniors, because the taxi drivers can be extremely unpleasant . . . I do not like taking taxis; I find them the worst of all transportation.”
A handful of focus group participants were unsure about where they could buy tickets. HandyDART contractors selling Taxi Saver coupon books were to be phased out shortly after the focus groups were held (February 2009), thus causing some confusion.
Limited eligibility for the Taxi Saver Program was also identified as a concern. To make use of the program, clients must register for a HandyCard; not everyone is registered or even qualifies. Yet without subsidies travelling by taxi is cost-prohibitive for many seniors especially those on a fixed budget. Compared to other transportation options, taxis are expensive:
“I live on Bellmont, and if I take a taxi [to Edgemont Village] it’s $3 each way, so that’s $6 just to go a mile.”
The above sentiment was shared by West Vancouver participants who were also concerned with taxis being unreliable and reluctant to carry passengers who cannot walk or use transit for shorter trips:
Transportation Issues Affecting Seniors on the North Shore
19
“Not only is a taxi unbelievably expensive, but some people they need more assistance—more than a taxi driver is ever willing to give. They literally need to be supported to the door.”
“Many people do use them but the taxi drivers are not always dependable because you order the taxi and you’re going to, say, Lion’s Gate Hospital, for an operation at 8 o’clock in the morning. So you want the taxi at 7 o’clock . . . but that taxi doesn’t always arrive.”
Getting a taxi is really a challenge . . . I know of a lady who lives in Dundarave and her husband is in Inglewood [Care Centre, less than 5 kilometres away] . . . it’s a short ride, and invariably if they take her there, they won’t take her back because the ride is too short.”
4.1.4 Go Bus
In comparison to other means of transport, there was overwhelming support among all participants for seniors’ shuttle service whether they used the service or not. For example, nonusers recognized how the service helped their peers and saw themselves using the service in the future. Most if not all participants, who rode Go Bus also used a combination of other modes to get around, including public transit:
“I’m using all three systems—buses, Go Bus, and taxis—and taxis are my least liked; I’d rather take the regular bus. But my favourite is the Go Bus because you don’t ever get a driver that looks after seniors like John does.”
“There’s not as much jarring [motion]. I had back surgery and I find it’s a much smoother ride than the regular bus.”
Seniors transportation allows older adults to access healthy, active living opportunities. Go Bus users can go where they want without needing to ask for assistance from family; the service enables seniors of all ages and abilities to live independently with dignity and pride:
“Many senior citizens, we don’t have anybody to look after us because they’re involved looking after our grandchildren. So, consequently I would say the majority of us seniors are on our own for finding transportation. We don’t depend, and don’t want to depend on family. They’re involved greatly with their family and far away in Mission and places like that.”
“All the young people are working . . . they’re all professional now and don’t have time to take Mom to the dentist.”
It was also recognized that Go Bus was more than just a transportation service. Many participants viewed it as a connection to social life and as a support to daily living (e.g., shopping):
Transportation Issues Affecting Seniors on the North Shore
20
“It’s a little family . . . we all talk together, and you don’t get that on the public bus. There’s every convenience that a senior—handicapped or not—would want.”
All Go Bus users were fond of the driver, John, and felt that he was critical to the success of Go Bus:
“I’m very happy with the bus driver, John: he’s efficient, he’s polite . . . and no matter what he’s talking about with the passengers he always keeps his eyes on the road, never puts anyone in danger. With John, he gives you personal attention. He makes sure you get on the bus and then he puts your walker or scooter on.”
“I have one friend that is blind and has trouble reading the buses because she can’t read the numbers—but John is great because he’s right there to pick her up at her door and see that she gets safely on the bus and safely off the bus.”
“What we’ve got is so great. John [the driver] is so good with us all. He knows us all by first name . . . and its door-to-door service, which we need more of.”
The few suggestions for improving Go Bus were primarily about increasing Go Bus service, as indicated above. There were a number of requests for more service days, which in turn would provide service to more neighbourhoods:
“I really don’t think there’s anything better than what we’ve got by now, but it would be lovely if it could be more frequently.
“I love it too although I wish it could come a bit more. I come here [Silver Harbour] on Mondays too, and if it rains badly I’m not going to take the transit bus.”
“Go Bus is an adjunct, and it’s a very useful way; we don’t have enough of it to say it’s my only way of transport.”
West Vancouver Go Bus users had a slightly different perspective although they shared many of the same views. As one person from the West Vancouver focus group commented: “The Go Bus will pick-you up, he’s more flexible” than the fixed route shuttle in West Vancouver, “many people need that extra flexibility.” None of the participants were heavily reliant on the Go Bus—likely, in part, because the West Van shuttle provides service 5 days a week. Many of the West Vancouver participants also expressed that they were still very healthy and able to get around on their own, but were still pleased that the service existed:
“We only use the shuttle sometimes because we’re active and we walk.” “I know you can phone your [grocery] orders but there’s something about shopping . . .
going around picking them up, it’s healthy. I think that’s very important for people who are shut-in.”
Transportation Issues Affecting Seniors on the North Shore
21

The idea of charging for the Go Bus service also came up during the West Vancouver focus group:
“I think if we sold tickets [for the shuttle] . . . books of ten or even a monthly pass, that would be a very good idea. I don’t think anyone goes free these days, you don’t expect to, just because we’re seniors . . . as we say, you get better service when you go door-to-door.”
4.2 Conclusion
There are still many barriers to using public transit despite recent improvements In some ways, the new low-floor, accessible buses are less accessible to seniors in terms of the design of the accessible seating area, which has fewer dedicated seats and vertical poles to hold onto. As a result, many seniors, including the frail and elderly, either cannot or are choosing not to use conventional transit. HandyDART services are generally not perceived as a viable alternative, particularly for recreational trips. If HandyDART had shorter waiting times and it wasn’t so cumbersome to register with, the service would perhaps be better received by users.
Many focus group participants used different modes of transportation depending on their destination. Go Bus serves an unmet need for transportation to social and recreational destinations and to shopping centres. Rather than being in competition with public transit, Go Bus tends to serve frailer seniors. Since the shuttle travels at a slower pace, it is often faster and simply more convenient for active seniors to use conventional transit or to walk or drive. Furthermore, because Go Bus only runs one day per week in each area it cannot be a primary mode of transportation at its current level of service. Go Bus is, nonetheless, highly valued by its users—largely because its personalized service makes transport an enjoyable, social experience.
Transportation Issues Affecting Seniors on the North Shore
22
5. NORTH SHORE SENIORS GO BUS MODEL
This purpose of this section is to provide a comprehensive overview of Go Bus’s history, organizational structure, budget, and ridership.
5.1 What is Go Bus?
The North Shore Seniors Go Bus program is a multi-stakeholder partnership that provides seniors with transportation in the North Shore area. The service was first implemented in Fall 2006 using a bus donated by Evergreen House at Lions Gate Hospital. While running on a regular schedule similar to conventional public transportation, Go Bus offers an extra level of convenience by picking up and dropping off seniors where they live. The shuttle operates in specific neighbourhoods on each of three days stopping at a number of locations including seniors' and community centres, seniors’ housing complexes, drugstores, grocery stores, medical centres, and other important service locations. Originally designed as a fixed route shuttle following a schedule, the service soon became a more flexible, demand-responsive service in answer to its clients’ needs.
The Go Bus program was started because seniors in the North Shore had identified a need that was not served by the current transit system. This program has also been requested by seniors’ coalitions on Bowen Island, Burnaby and Kitsilano.
5.2 History
With the growing need for seniors’ transportation solutions in mind, the Go Bus program was initiated in response to a funding opportunity from the Union of British Columbia Municipalities (UBCM). Recognizing that many seniors were falling through the cracks—served by neither conventional nor custom transit—the three municipalities, Vancouver Coastal Health, and a number of community-based organizations came together to discuss transportation solutions for seniors living on the North Shore. In the fall of 2005, twelve senior-serving organizations gathered at the City of North Vancouver’s municipal hall to discuss how they could respond to the UBCM grant opportunity. Collectively, the group decided to apply for funding for a shuttle bus; however, to receive the grant the initiative needed a non-profit program administrator. In partnership with the City of North Vancouver, the Silver Harbour Seniors’ Activity Centre agreed take on the position.
The grant was approved by the UBCM and along with the funding, came the task of designing and implementing a seniors’ shuttle service. Several brainstorming sessions were led by Silver Harbour in May 2006; a diverse mix of partners attended including:
Vancouver Coastal Health;
Seniors recreational centres, community centres, the local neighbourhood house, and seniors wellness programs;
North Shore Seniors Go Bus Model
23

Services for frail seniors such as Capilano Community Services, North Shore Adults at Risk, and North Shore Peer Support;
HandyDart representatives from TransLink; and North Shore Community Resources and the Service to Seniors Coalition, who act as
information clearinghouses for the North Shore.
In addition to identifying key locations, participating organizations went through a list of seniors’ programs and evaluated whether further transportation was needed to encourage participation. Corresponding program start and end times were then identified which in turn created a schedule by connecting the key locations on a map. The working group also sought out a driver who had experience working with seniors and who would also be able to promote the program. An ad for the position was posted in the classified sections of several local newspapers and promoted through personal networks. Seventeen people applied, and five were interviewed for the position. Meanwhile, a lengthy legal agreement was worked out between Silver Harbour and the Evergreen House at Lions Gate Hospital, allowing the use of Evergreen’s bus. Go Bus went into operation at the end of June 2006 and is now celebrating its third year in service.
5.3 Organizational structure and operations
The Silver Harbour Centre, under the direction of Executive Director Annwen Loverin, operates the Go Bus program. Time spent overseeing Go Bus operations are usually several hours per week. (Silver Harbour offers 70 other recreational programs and seniors’ services in addition to Go Bus.)
5.3.1 Staffing
The driver’s position is paid, rather than volunteer to ensure service reliability and because of the significant responsibilities required of the driver The driver works three 8-hour days per week and costs roughly $30,000 per year to employ. In addition to operating the vehicle, he is also responsible for:
Assisting seniors to and from the bus as needed;
Helping carry parcels and mobility aids;
Scheduling rides by phone; Answering inquiries about Go Bus;
Promoting the Go Bus among potential users; and Keeping a daily record of mileage, gas, donations, and number of riders.
Finding a driver with the right personality turned out to be extremely important, as was acknowledged at the United Way’s Solutions for Seniors workshop: “The technical expertise, professionalism, and caring demeanour of the driver is an excellent match for the clientele’s
North Shore Seniors Go Bus Model
24

needs” (United Way, 2009, p. 2). As one focus group participant put it: “I’m using all three systems—buses, Go Bus, and taxis . . . But my favourite is the Go Bus because you don’t ever get a driver that looks after seniors like John does.” The Go Bus’s success can be attributed, at least in part, to the extra level of assistance and the warm, personalized service provided by the driver John
5.3.2 Routes and scheduling
Operating three 8-hour days per week, the Go Bus has three separate routes covering the three municipalities. Go Bus serves most of the central neighbourhoods in each municipality. Silver Harbour plans to expand the service to outlying neighbourhoods and increase service to five days a week when funding becomes available.
One of the lessons learned from the 2006 UBCM pilot was that while a scheduled route-based service provides operating efficiencies, flexibility is required to support seniors’ use of the service. Over time, the route evolved from a fixed route with set pickup times to a flexible route based on a general time schedule. The bus will drive near the identified Go Bus stops, but the driver will not wait if no one has called in to request a ride. Thus, Go Bus combines the efficiencies of operating on a semi-scheduled route (e.g., seniors’ activity centres) with the flexibility of requests for door-to-door service. The service is perhaps best likened to a hybrid of TransLink’s neighbourhood-based community shuttles and HandyDART. While the bus may not show up exactly on time (as with HandyDART), the flexibility, and extra level of support have been tailored to better suit clients’ needs.
Go Bus clients usually phone the driver to request a ride a day in advance although ongoing bookings for repeat trips can easily be arranged. For example, many clients use the service to travel to and from a particular program at the same time every week. The bus typically picks people up at their homes (e.g., subsidized housing, seniors’ homes, and apartments with high concentrations of older adults). Recreation and seniors’ centres, grocery stores, pharmacies, malls, and medical buildings are popular destinations.
While the use of demand-responsive transportation scheduling software is increasingly common, all scheduling is still done the “old fashioned” way on paper or simply by memory. The applicability and cost of scheduling software to the Go Bus model should be researched if the program is to be expanded across the region.
5.3.3 Vehicle
The vehicle used by Go Bus is borrowed from Vancouver Coastal Health’s Evergreen House care facility. Vehicle maintenance and insurance are provided and paid for by Vancouver Coastal Health. Fuel is the only major vehicle-related expense and costs roughly $50 per day or just over $7,000 annually. The only other cost is removable, magnetic signage for the outside of the bus, which amounts to about $200 per year.
The bus has 14 seats and space for three wheelchairs. Empty space on the bus is often used for walkers and shopping bags.
North Shore Seniors Go Bus Model
25
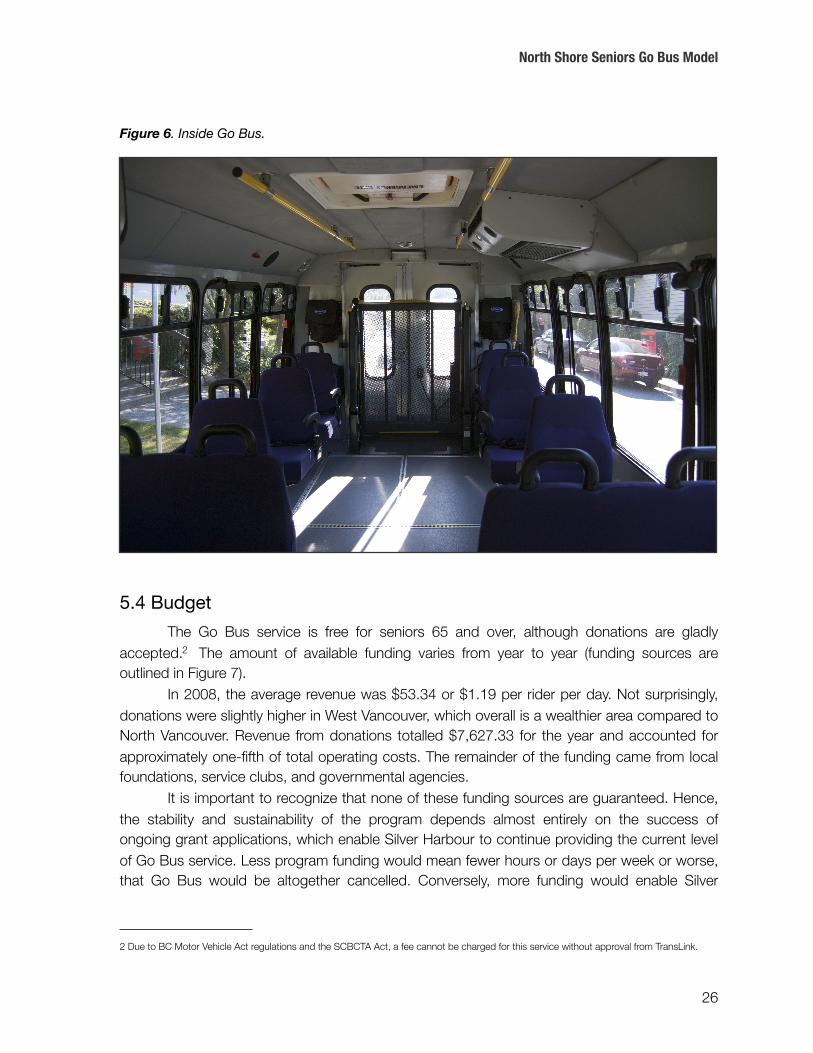
Figure 6. Inside Go Bus.
5.4 Budget
The Go Bus service is free for seniors 65 and over, although donations are gladly accepted.2 The amount of available funding varies from year to year (funding sources are outlined in Figure 7).
In 2008, the average revenue was $53.34 or $1.19 per rider per day. Not surprisingly, donations were slightly higher in West Vancouver, which overall is a wealthier area compared to North Vancouver. Revenue from donations totalled $7,627.33 for the year and accounted for approximately one-fifth of total operating costs. The remainder of the funding came from local foundations, service clubs, and governmental agencies.
It is important to recognize that none of these funding sources are guaranteed. Hence, the stability and sustainability of the program depends almost entirely on the success of ongoing grant applications, which enable Silver Harbour to continue providing the current level of Go Bus service. Less program funding would mean fewer hours or days per week or worse, that Go Bus would be altogether cancelled. Conversely, more funding would enable Silver
North Shore Seniors Go Bus Model
26
2 Due to BC Motor Vehicle Act regulations and the SCBCTA Act, a fee cannot be charged for this service without approval from TransLink.
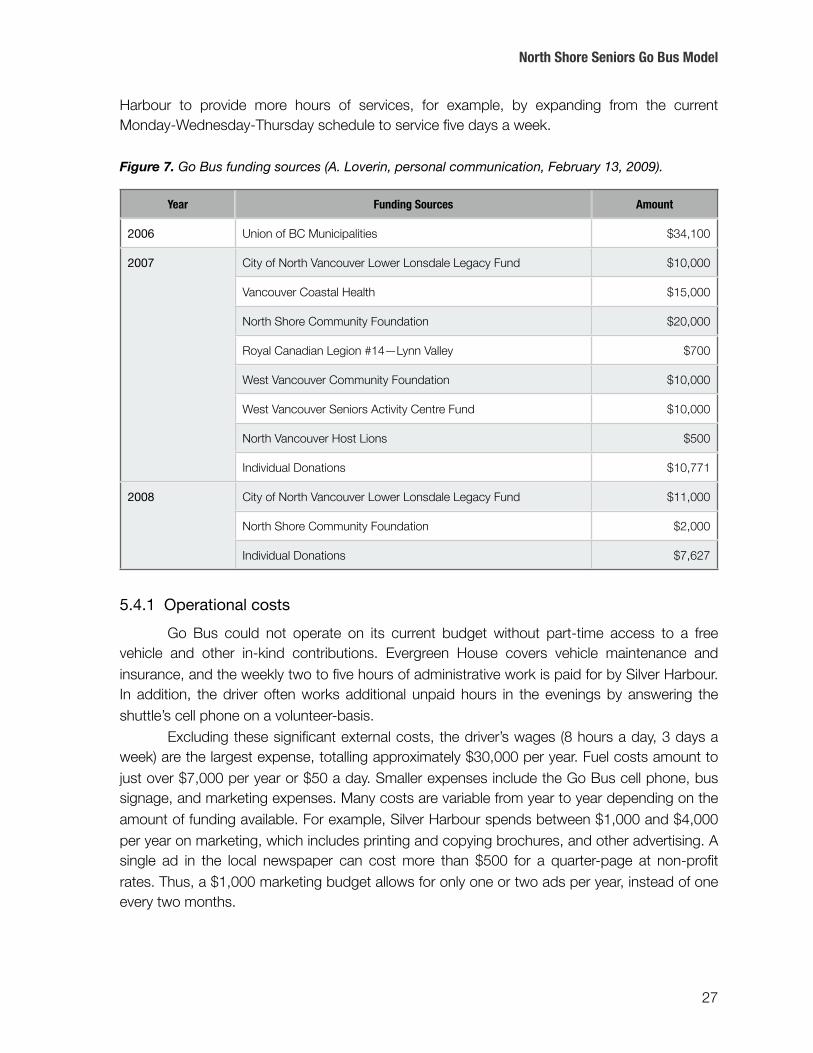
Harbour to provide more hours of services, for example, by expanding from the current Monday-Wednesday-Thursday schedule to service five days a week.
Figure 7. Go Bus funding sources (A. Loverin, personal communication, February 13, 2009).
Year Funding Sources Amount
2006 Union of BC Municipalities $34,100
2007 City of North Vancouver Lower Lonsdale Legacy Fund $10,0002007
Vancouver Coastal Health $15,000
2007
North Shore Community Foundation $20,000
2007
Royal Canadian Legion #14—Lynn Valley $700
2007
West Vancouver Community Foundation $10,000
2007
West Vancouver Seniors Activity Centre Fund $10,000
2007
North Vancouver Host Lions $500
2007
Individual Donations $10,771
2008 City of North Vancouver Lower Lonsdale Legacy Fund $11,0002008
North Shore Community Foundation $2,000
2008
Individual Donations $7,627
5.4.1 Operational costs
Go Bus could not operate on its current budget without part-time access to a free vehicle and other in-kind contributions. Evergreen House covers vehicle maintenance and insurance, and the weekly two to five hours of administrative work is paid for by Silver Harbour. In addition, the driver often works additional unpaid hours in the evenings by answering the shuttle’s cell phone on a volunteer-basis.
Excluding these significant external costs, the driver’s wages (8 hours a day, 3 days a week) are the largest expense, totalling approximately $30,000 per year. Fuel costs amount to just over $7,000 per year or $50 a day. Smaller expenses include the Go Bus cell phone, bus signage, and marketing expenses. Many costs are variable from year to year depending on the amount of funding available. For example, Silver Harbour spends between $1,000 and $4,000 per year on marketing, which includes printing and copying brochures, and other advertising. A single ad in the local newspaper can cost more than $500 for a quarter-page at non-profit rates. Thus, a $1,000 marketing budget allows for only one or two ads per year, instead of one every two months.
North Shore Seniors Go Bus Model
27
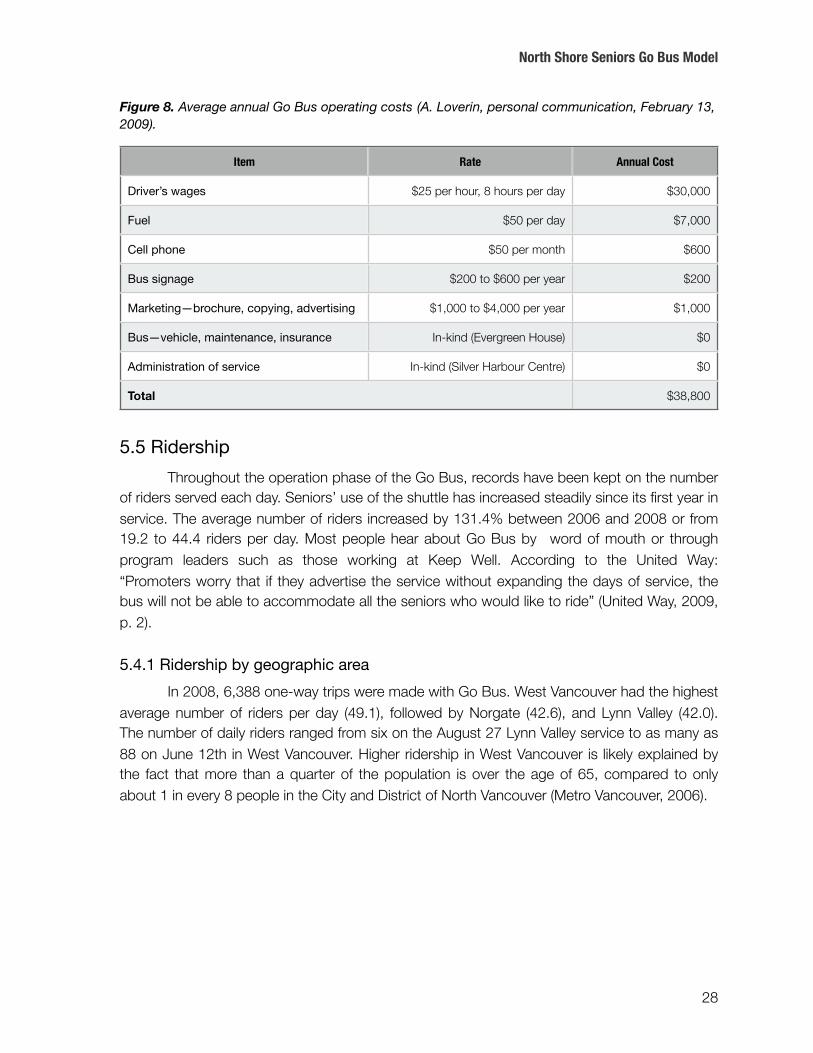
Figure 8. Average annual Go Bus operating costs (A. Loverin, personal communication, February 13, 2009).
Item Rate Annual Cost
Driver’s wages $25 per hour, 8 hours per day $30,000
Fuel $50 per day $7,000
Cell phone $50 per month $600
Bus signage $200 to $600 per year $200
Marketing—brochure, copying, advertising $1,000 to $4,000 per year $1,000
Bus—vehicle, maintenance, insurance In-kind (Evergreen House) $0
Administration of service In-kind (Silver Harbour Centre) $0
TotalTotal $38,800
5.5 Ridership
Throughout the operation phase of the Go Bus, records have been kept on the number of riders served each day. Seniors’ use of the shuttle has increased steadily since its first year in service. The average number of riders increased by 131.4% between 2006 and 2008 or from 19.2 to 44.4 riders per day. Most people hear about Go Bus by word of mouth or through program leaders such as those working at Keep Well. According to the United Way: “Promoters worry that if they advertise the service without expanding the days of service, the bus will not be able to accommodate all the seniors who would like to ride” (United Way, 2009, p. 2).
5.4.1 Ridership by geographic area
In 2008, 6,388 one-way trips were made with Go Bus. West Vancouver had the highest average number of riders per day (49.1), followed by Norgate (42.6), and Lynn Valley (42.0). The number of daily riders ranged from six on the August 27 Lynn Valley service to as many as 88 on June 12th in West Vancouver. Higher ridership in West Vancouver is likely explained by the fact that more than a quarter of the population is over the age of 65, compared to only about 1 in every 8 people in the City and District of North Vancouver (Metro Vancouver, 2006).
North Shore Seniors Go Bus Model
28

Figure 9. Go Bus ridership data.
Area Norgate Lynn Valley West Van All Areas
Total riders 1,917 2,016 2,455 6,388
Total days 45 48 50 143
Avgerage riders 42.6 42.0 49.1 44.7
Minimum riders 25 6 18 6
Maximum riders 66 82 88 88
Figure 10. Maps of Go Bus areas.
North Shore Seniors Go Bus Model
29

North Shore Seniors Go Bus Model
30
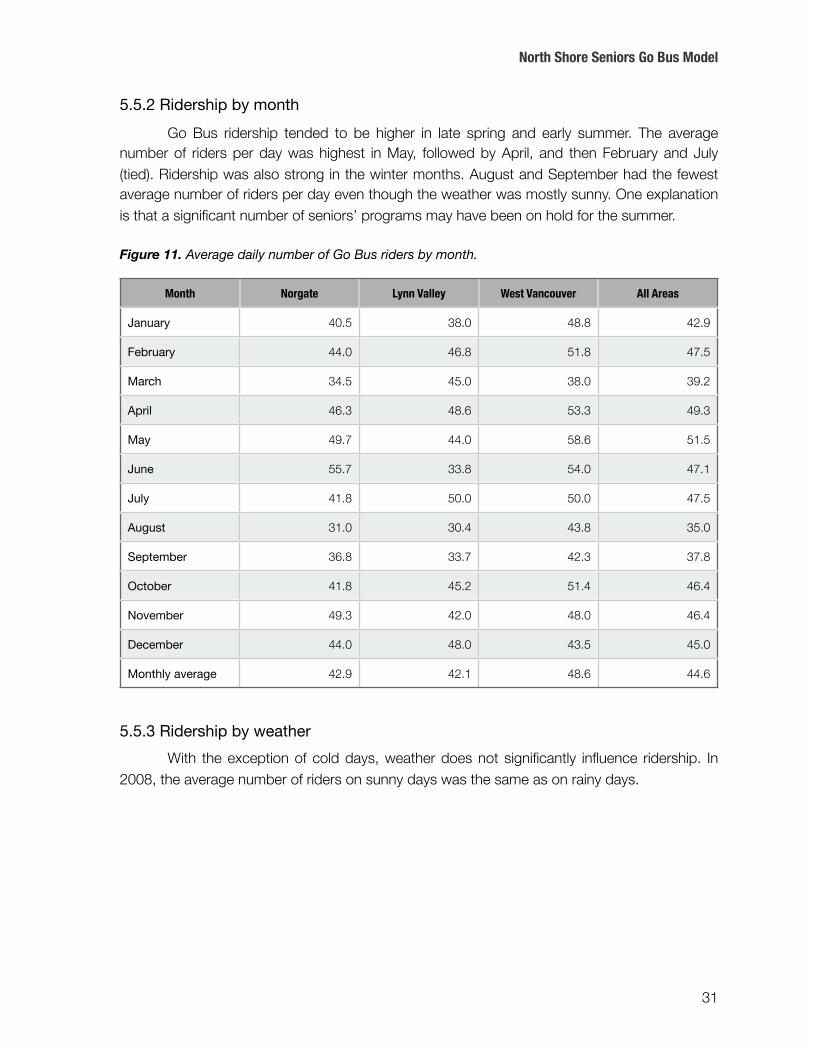
5.5.2 Ridership by month
Go Bus ridership tended to be higher in late spring and early summer. The average number of riders per day was highest in May, followed by April, and then February and July (tied). Ridership was also strong in the winter months. August and September had the fewest average number of riders per day even though the weather was mostly sunny. One explanation is that a significant number of seniors’ programs may have been on hold for the summer.
Figure 11. Average daily number of Go Bus riders by month.
Month Norgate Lynn Valley West Vancouver All Areas
January 40.5 38.0 48.8 42.9
February 44.0 46.8 51.8 47.5
March 34.5 45.0 38.0 39.2
April 46.3 48.6 53.3 49.3
May 49.7 44.0 58.6 51.5
June 55.7 33.8 54.0 47.1
July 41.8 50.0 50.0 47.5
August 31.0 30.4 43.8 35.0
September 36.8 33.7 42.3 37.8
October 41.8 45.2 51.4 46.4
November 49.3 42.0 48.0 46.4
December 44.0 48.0 43.5 45.0
Monthly average 42.9 42.1 48.6 44.6
5.5.3 Ridership by weather
With the exception of cold days, weather does not significantly influence ridership. In 2008, the average number of riders on sunny days was the same as on rainy days.
North Shore Seniors Go Bus Model
31
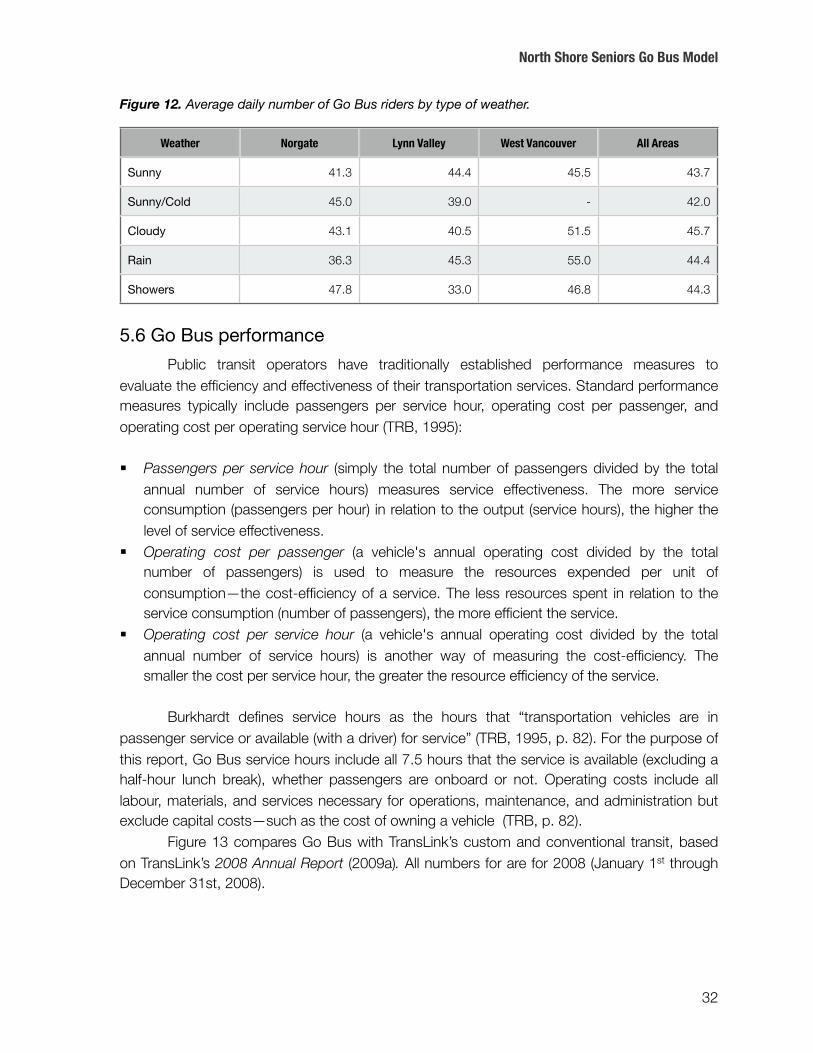
Figure 12. Average daily number of Go Bus riders by type of weather.
Weather Norgate Lynn Valley West Vancouver All Areas
Sunny 41.3 44.4 45.5 43.7
Sunny/Cold 45.0 39.0 - 42.0
Cloudy 43.1 40.5 51.5 45.7
Rain 36.3 45.3 55.0 44.4
Showers 47.8 33.0 46.8 44.3
5.6 Go Bus performance
Public transit operators have traditionally established performance measures to evaluate the efficiency and effectiveness of their transportation services. Standard performance measures typically include passengers per service hour, operating cost per passenger, and operating cost per operating service hour (TRB, 1995):
Passengers per service hour (simply the total number of passengers divided by the total annual number of service hours) measures service effectiveness. The more service consumption (passengers per hour) in relation to the output (service hours), the higher the level of service effectiveness.
Operating cost per passenger (a vehicle's annual operating cost divided by the total number of passengers) is used to measure the resources expended per unit of consumption—the cost-efficiency of a service. The less resources spent in relation to the service consumption (number of passengers), the more efficient the service.
Operating cost per service hour (a vehicle's annual operating cost divided by the total annual number of service hours) is another way of measuring the cost-efficiency. The smaller the cost per service hour, the greater the resource efficiency of the service.
Burkhardt defines service hours as the hours that “transportation vehicles are in passenger service or available (with a driver) for service” (TRB, 1995, p. 82). For the purpose of this report, Go Bus service hours include all 7.5 hours that the service is available (excluding a half-hour lunch break), whether passengers are onboard or not. Operating costs include all labour, materials, and services necessary for operations, maintenance, and administration but exclude capital costs—such as the cost of owning a vehicle (TRB, p. 82).
Figure 13 compares Go Bus with TransLink’s custom and conventional transit, based on TransLink’s 2008 Annual Report (2009a). All numbers for are for 2008 (January 1st through December 31st, 2008).
North Shore Seniors Go Bus Model
32
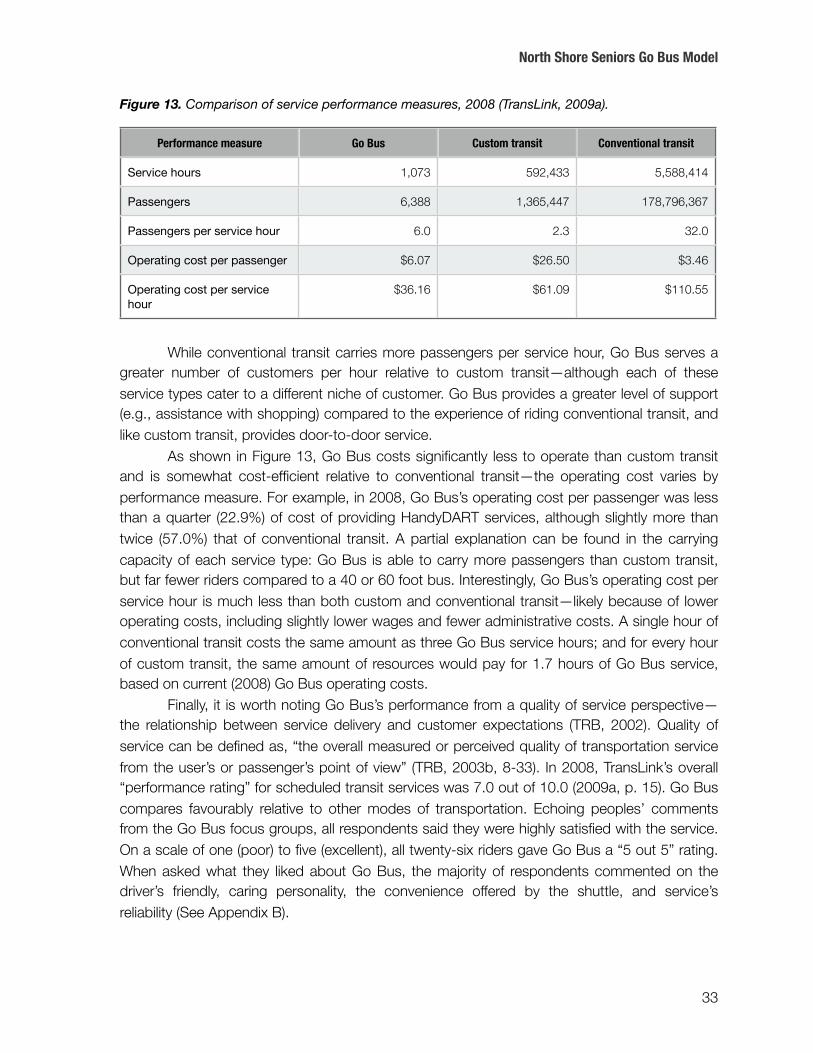
Figure 13. Comparison of service performance measures, 2008 (TransLink, 2009a).
Performance measure Go Bus Custom transit Conventional transit
Service hours 1,073 592,433 5,588,414
Passengers 6,388 1,365,447 178,796,367
Passengers per service hour 6.0 2.3 32.0
Operating cost per passenger $6.07 $26.50 $3.46
Operating cost per service hour
$36.16 $61.09 $110.55
While conventional transit carries more passengers per service hour, Go Bus serves a greater number of customers per hour relative to custom transit—although each of these service types cater to a different niche of customer. Go Bus provides a greater level of support (e.g., assistance with shopping) compared to the experience of riding conventional transit, and like custom transit, provides door-to-door service.
As shown in Figure 13, Go Bus costs significantly less to operate than custom transit and is somewhat cost-efficient relative to conventional transit—the operating cost varies by performance measure. For example, in 2008, Go Bus’s operating cost per passenger was less than a quarter (22.9%) of cost of providing HandyDART services, although slightly more than twice (57.0%) that of conventional transit. A partial explanation can be found in the carrying capacity of each service type: Go Bus is able to carry more passengers than custom transit, but far fewer riders compared to a 40 or 60 foot bus. Interestingly, Go Bus’s operating cost per service hour is much less than both custom and conventional transit—likely because of lower operating costs, including slightly lower wages and fewer administrative costs. A single hour of conventional transit costs the same amount as three Go Bus service hours; and for every hour of custom transit, the same amount of resources would pay for 1.7 hours of Go Bus service, based on current (2008) Go Bus operating costs.
Finally, it is worth noting Go Bus’s performance from a quality of service perspective—the relationship between service delivery and customer expectations (TRB, 2002). Quality of service can be defined as, “the overall measured or perceived quality of transportation service from the user’s or passenger’s point of view” (TRB, 2003b, 8-33). In 2008, TransLink’s overall “performance rating” for scheduled transit services was 7.0 out of 10.0 (2009a, p. 15). Go Bus compares favourably relative to other modes of transportation. Echoing peoples’ comments from the Go Bus focus groups, all respondents said they were highly satisfied with the service. On a scale of one (poor) to five (excellent), all twenty-six riders gave Go Bus a “5 out 5” rating. When asked what they liked about Go Bus, the majority of respondents commented on the driver’s friendly, caring personality, the convenience offered by the shuttle, and service’s reliability (See Appendix B).
North Shore Seniors Go Bus Model
33

5.7 Strengths and weaknesses
From the customer’s perspective, Go Bus provides:
Transportation in a consistent and coordinated way. Clients know exactly what to expect which eliminates many of the worries associated with travelling.
Friendly personalized service including assistance with parcels and “arm-to-arm” support from home to destination and back.
An opportunity to socialize amongst peers and to venture out of home.
From an operational standpoint, Go Bus manages to provide door-to-door service while maintaining the efficiency that comes from servicing shared destinations—such as housing complexes, shopping malls, and seniors’ activity centres. Because the program only has a limited number of service hours, service is concentrated in areas with the highest need, which allows for better use of the shuttle’s capacity: The bus is often full. The fact that community organizers planned the shuttle service has also undoubtedly played a role in its success. Local knowledge of key destinations informed the route, while the organizers’ awareness of program start, and end times helped shape the initial schedule. Finally, while funding has admittedly been a challenge, bureaucratic autonomy has its strengths. Silver Harbour has the flexibility to adapt the service as needed, which serves to strengthen what was already a successful model. As Cervero points out: “While there might be a role for sponsorship, it does not follow that public operators with high labour costs should always deliver the services themselves” (1997, p. 154).
As mentioned above, lack of sustainable funding sources is Go Bus’s most significant restriction. Simply put, most if not all of Go Bus’s limitations are related to funding in one way or another. Many of Go Bus’s problems—such as partial geographic coverage and one-person staffing—could be easily addressed with additional funding: Although finding money is not as simple. Many grants target short-term pilot projects, whereas others would require that Silver Harbour venture into new services beyond the organization’s mission. Consequently, the service risks “spreading itself thin.”
North Shore Seniors Go Bus Model
34
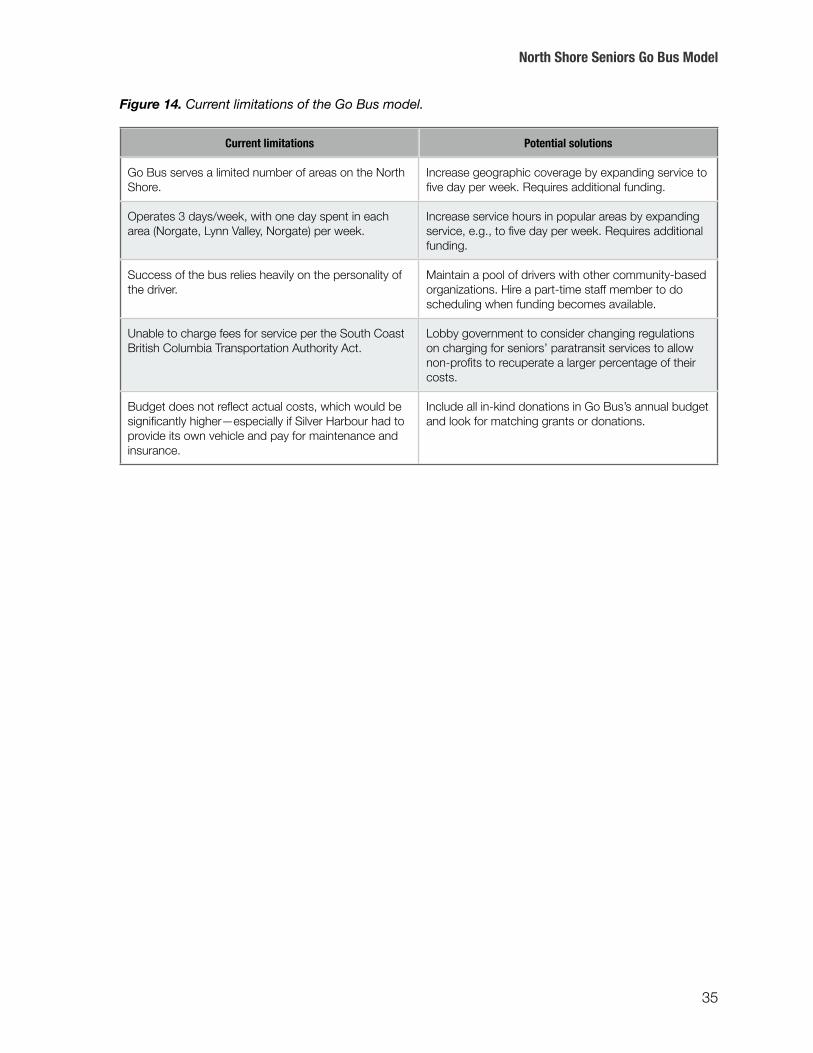
Figure 14. Current limitations of the Go Bus model.
Current limitations Potential solutions
Go Bus serves a limited number of areas on the North Shore.
Increase geographic coverage by expanding service to five day per week. Requires additional funding.
Operates 3 days/week, with one day spent in each area (Norgate, Lynn Valley, Norgate) per week.
Increase service hours in popular areas by expanding service, e.g., to five day per week. Requires additional funding.
Success of the bus relies heavily on the personality of the driver.
Maintain a pool of drivers with other community-based organizations. Hire a part-time staff member to do scheduling when funding becomes available.
Unable to charge fees for service per the South Coast British Columbia Transportation Authority Act.
Lobby government to consider changing regulations on charging for seniors’ paratransit services to allow non-profits to recuperate a larger percentage of their costs.
Budget does not reflect actual costs, which would be significantly higher—especially if Silver Harbour had to provide its own vehicle and pay for maintenance and insurance.
Include all in-kind donations in Go Bus’s annual budget and look for matching grants or donations.
North Shore Seniors Go Bus Model
35

6. OPTIONS FOR IMPROVING SENIORS TRANSPORTATION: ANALYSIS OF ALTERNATIVES
TransLink, like many transportation authorities, is challenged with providing services for an increasingly elderly and frail population. Responding to the question, “Is Go Bus a type of service that TransLink should offer?,” the following section provides a preliminary assessment of four different alternatives for improving seniors’ mobility:
TransLink implements customer service strategy TransLink funds independent transportation services for seniors
TransLink provides new transit service targeting seniors TransLink maintains current service levels (“do nothing”)
Each of these alternatives have implications beyond their affect on seniors mobility, including significant financial costs, legal ramifications and varying impacts on social and regional equity. The aim of this section is to provide a framework for evaluation and to highlight the strengths and weaknesses of each alternative.
6.1 Problem statement
According to the 2006 Census, seniors accounted for approximately 13 percent of the population in the Metro Vancouver region, the metropolitan area surrounding and including the City of Vancouver, BC. In other words, one out of every eight Metro Vancouver residents is over the age of 65. At 28 percent, West Vancouver has the highest percentage of senior citizens relative to the total municipal population, followed by White Rock (23 percent) and the City of Langley (17 percent). Across the region, the 2006 Census recorded 271,465 people over the age of 65—a 10 percent increase since 2001 and a remarkable 23 percent increase compared to 1996 data. Similarly, by 2031, it is estimated that “one out of every four of the region’s residents could be over 65” as the generation of “Boomers” age (Metro Vancouver, 2006, p. 5).
The implications for health and transportation are manifold. The transition to “giving up the keys” when driving safely becomes an issue often leaves seniors with limited means of transportation. Mitigating factors include chronic health problems, limited finances, lack of information about existing services, social isolation and the absence of traditional family supports, which may compound existing mobility, sensory and/or cognitive impairments. A broader menu of transportation choices are needed to enable seniors to live full, active lives and to allow for seniors’ inclusion in all facets of community life. Advocates for seniors’ mobility—such as the Beverly Foundation, Independent Transportation Network (ITNAmerica) and AARP (formerly known as the American Association of Retired Persons)—propose a variety of alternatives from adapting or modifying existing options to creating new transportation services. Figure 15 illustrates the three main approaches to improving seniors transportation.
Options for Improving Seniors Transportation
36

Figure 15. Three main approaches in helping seniors access transportation (Kerschner, 2003, p. 5).
6.2 TransLink policy context
Relevant policies, plans and Provincial legislature published by or pertaining to TransLink are reviewed in this subsection.
6.2.1 Transit Service Guidelines Public Summary Report (2004)
Based on an accompanying set of measures, TransLink’s Transit Service Guidelines (TSGs) are intended to “assist in continually adjusting and improving transit service to meet its varied customer needs” (p. 1). The TSGs are comprised of seven customer service objectives which apply to a number of transit services types, excluding HandyDART.3 According to the guidelines, transit services should be:
Simple—easy to use; easy to understand Comprehensive—an integrated network connecting residential areas with major
destinations; minimum number of transfers Frequent—short waiting-times; fast, direct routes
Convenient—available early morning through late at night; easy to make transfers
Comfortable—adequate space and seating aboard vehicles Reliable—on-time performance; neither early nor late
Efficient—reasonably cost-effective service matching customer demand
The document also provides a basis for “evaluating proposed improvements to existing transit services and for considering new transit services” (p. 1). For example, new Community
Options for Improving Seniors Transportation
37
3 Different service standards will apply (standards to be developed).
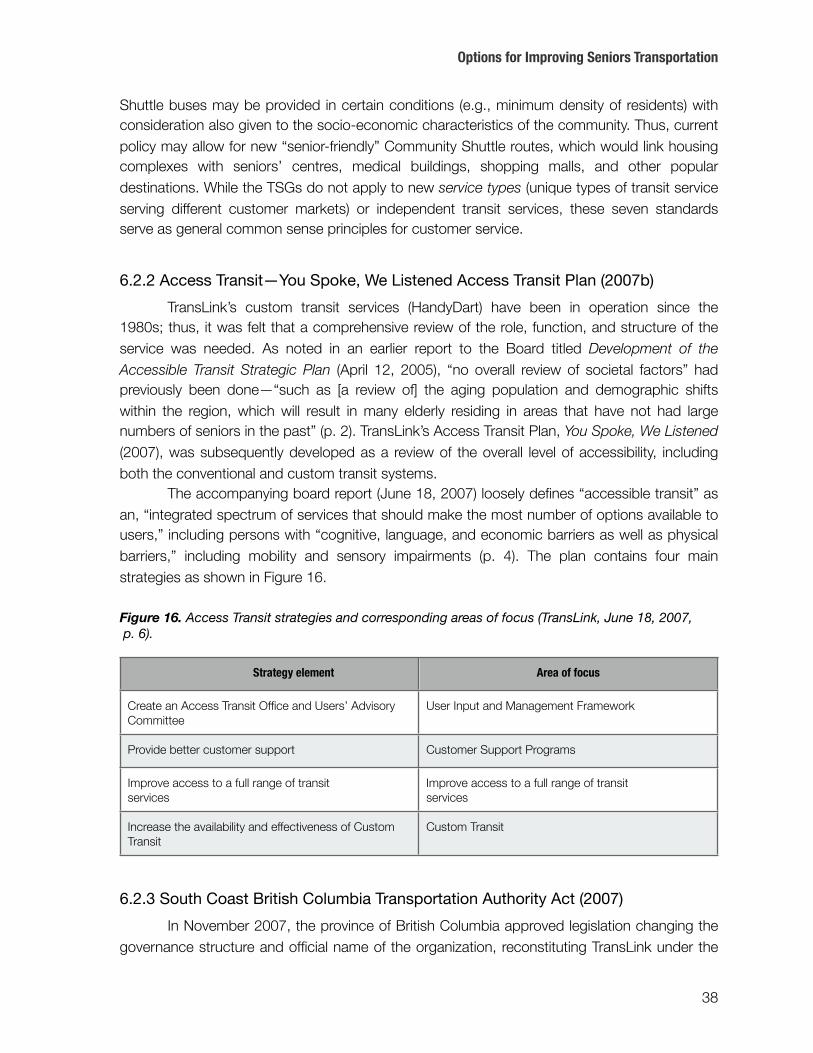
Shuttle buses may be provided in certain conditions (e.g., minimum density of residents) with consideration also given to the socio-economic characteristics of the community. Thus, current policy may allow for new “senior-friendly” Community Shuttle routes, which would link housing complexes with seniors’ centres, medical buildings, shopping malls, and other popular destinations. While the TSGs do not apply to new service types (unique types of transit service serving different customer markets) or independent transit services, these seven standards serve as general common sense principles for customer service.
6.2.2 Access Transit—You Spoke, We Listened Access Transit Plan (2007b)
TransLink’s custom transit services (HandyDart) have been in operation since the 1980s; thus, it was felt that a comprehensive review of the role, function, and structure of the service was needed. As noted in an earlier report to the Board titled Development of the Accessible Transit Strategic Plan (April 12, 2005), “no overall review of societal factors” had previously been done—“such as [a review of] the aging population and demographic shifts within the region, which will result in many elderly residing in areas that have not had large numbers of seniors in the past” (p. 2). TransLink’s Access Transit Plan, You Spoke, We Listened (2007), was subsequently developed as a review of the overall level of accessibility, including both the conventional and custom transit systems.
The accompanying board report (June 18, 2007) loosely defines “accessible transit” as an, “integrated spectrum of services that should make the most number of options available to users,” including persons with “cognitive, language, and economic barriers as well as physical barriers,” including mobility and sensory impairments (p. 4). The plan contains four main strategies as shown in Figure 16.
Figure 16. Access Transit strategies and corresponding areas of focus (TransLink, June 18, 2007, p. 6).
Strategy element Area of focus
Create an Access Transit Office and Users’ Advisory Committee
User Input and Management Framework
Provide better customer support Customer Support Programs
Improve access to a full range of transitservices
Improve access to a full range of transitservices
Increase the availability and effectiveness of Custom Transit
Custom Transit
6.2.3 South Coast British Columbia Transportation Authority Act (2007)
In November 2007, the province of British Columbia approved legislation changing the governance structure and official name of the organization, reconstituting TransLink under the
Options for Improving Seniors Transportation
38
South Coast British Columbia Transportation Authority Act (SCBCTA Act).4 The SCBCTA Act currently serves as the legislative framework for TransLink’s plans and actions. The purpose of the Authority and its responsibilities are laid out in Part 1 of the act.
From a legal standpoint, the SCBCTA Act has several important implications for establishing new seniors’ transportation services. Under section 5, the act explicitly states that:
no person or municipality may establish or operate or approve the establishment or operation of independent transit services in the transportation service region unless it does so
(a) with the approval of the authority, and (b) under any terms and conditions the authority requires (2007, §5[1]).
Independent transit services may only be approved by TransLink if it can be demonstrated that such services “will not reduce the effectiveness or financial viability of the regional system” (§5.2). Funding independent transit services is forbidden (§5[3]).
The SCBCTA Act also requires that TransLink prepare a long term strategy outlining the authority’s goals and strategies for the region. In preparing a strategic plan, TransLink must consider anticipated population growth in the transportation service region (§193).
6.2.4 Transport 2040 (2008)
As the region’s long-term transportation strategy, Transport 2040 lays out the challenges facing the Metro Vancouver region over the next 30 years, identifies key goals and offers a set strategies to reach those goals. Specifically, the plan features six strategic goals:
Greenhouse gas emissions from transportation are aggressively reduced, in support of provincial and regional targets
Most trips are by transit, walking and cycling The majority of jobs and housing in the region are located along the
Frequent Transit Network Travelling in the region is safe, secure, and accessible for everyone
Economic growth and efficient goods movement are facilitated through effective management of the transportation network
Funding for TransLink is stable, sufficient, appropriate and influences transportation choices (p. 26)
Four key strategies and accompanying initiatives set the course for how TransLink proposes to advance the above goals.
Options for Improving Seniors Transportation
39
4 TransLink was created in 1998 (then called the Greater Vancouver Transportation Authority, or GVTA) to replace BC Transit in the Greater
Vancouver Regional District (now Metro Vancouver) and assume certain transportation responsibilities previously held by the provincial
government.

As noted in the document, “How we meet the challenge of keeping over 3 million people mobile will determine our success as a region, especially when one-quarter of the population will be over 65 years old in 2040.” To accommodate an aging population, the plan looks to “complete communities” that support independent living and “highly accessible transit services.” The plan also predicts a greater need for “localized and midday travel” to match changing travel patterns as people age (p. 9).
6.3 Evaluation criteria
In selecting an appropriate seniors’ mobility strategy, there are a number of questions pertaining to impacts and outcomes that should first be considered. The following subsection describes the five different criteria, including: Effectiveness, cost-efficiency, responsiveness to community goals, equity and administrative ease.
6.3.1 Effectiveness
Effectiveness is the extent to which the proposed alternative will address the issues set out in the problem statement: “It measures whether the policy or program has its intended effect . . . [f]or example, whether a nutrition program is improving the diet of low-income pregnant women” (Patton & Sawicki, 1993, p. 220). In this case, the study evaluates whether a proposed alternative sustains and improves the mobility of seniors living in Metro Vancouver. Specifically, questions to be addressed include:
Does the alternative provide transportation to locations that satisfy core needs and enhance quality of life, including travel for recreational purposes and mental well-being?
Does the alternative accommodate the needs of a majority of seniors in the community, including older adults with mobility, sensory and/or cognitive impairments?
Does the alternative improve the availability of transportation?
Does the alternative offer affordable access to transport across a broad range of income levels?
6.3.2 Cost-efficiency
The issue of seniors’ mobility is not only question of how to improve transportation for seniors but also question of who should pay for such services. In an ideal world where resources were unlimited, transit agencies would be able to provide more transit services, supplemented by unlimited custom transit for people with disabilities, and a higher quality of service. In reality, many North American transportation authorities are cutting transit services to merely stay afloat. Thus, another crucial dimension of the seniors’ mobility problem is the need for balance between economic efficiency and long term planning objectives.
As noted in the Transit Service Guidelines (2004), “TransLink has a strategic financial objective to provide a cost-efficient transit service to ensure the most effective service is delivered within the available budget” (p. 12). Therefore, in addition to being effective, the
Options for Improving Seniors Transportation
40
proposed alternative should also be cost-efficient—i.e., maximizing benefits with a given amount of resources. Questions pertaining to cost-efficiency include the following:
Does the alternative maximize improvements to seniors transportation services with a given amount of resources?
Does the alternative achieve the intended objectives at a minimum cost?
6.3.3 Equity
The concept of transportation equity seeks to ensure that the needs of all communities, particularly transportation-disadvantaged (low-mobility) groups, are addressed in transportation policy and planning processes. Equity asks the questions of “who pays?” and “who benefits?” A proposed alternative may impact equity if it will change the distribution of benefits and burdens (Patton & Sawicki, 1993). A set of policy alternatives will often have varying impacts on different groups in society. Policies and projects seldomly affect all parties equally.
In transportation policy and planning, “equity” can take on a number of different meanings (see subsection 2.7). Horizontal equity is the principle that people should bear equal costs and receive an equal share of benefits. Vertical equity, in comparison, holds that those with a greater ability to pay for a particular service compensate for “overall inequities” (Litman, 2002; Litman, 2007). For example, cost-efficient routes serving high volumes of commuters might cross-subsidize lower volume transit services serving people with special mobility needs and/or limited economic means.
In this case, there are at least two different equity concerns that should be addressed:
Does the alternative ensure a fair distribution of costs and benefits among all regional tax payers?
Does the alternative ensure a fair distribution of costs and benefits between various social groups, including low-mobility groups (children, seniors, low-income households, people with disabilities, etc.)?
As discussed in the Oxford Companion to Philosophy (2005), “Fairness in its broadest sense requires that any two individuals [or municipalities] be treated equally unless there is some morally relevant distinction between them” (Hooker, ¶ 5). The notion of “transportation disadvantage” is one such distinction. Litman (2007), for example, argues that transport policies are equitable if they favour transportation disadvantaged groups (defined in terms of mobility need and socioeconomic status), therefore compensating for overall inequities.5
Options for Improving Seniors Transportation
41
5 Similarly, Rawls’ concept of “justice as fairness” requires that social benefits and burdens are allocated in such a way as to make the position
of the least well-off as good as it can be (Blackburn, 2005, ¶ 1).

6.3.4 Administrative ease
Finally, an organization’s administrative system must be capable of implementing the
policy or program: “[A] technically feasible, economically possible, and politically viable policy cannot be implemented . . . if the administrative talent and delivery systems are not available” (Patton & Sawicki, 1993, p. 218). Administrative ease is factor of how much work are required to deliver the alternative and whether existing supports are in place. In short, how easy is it to implement the alternative? Questions to be addressed include:
Does TransLink have the authority to implement the proposed alternative?
Does TransLink have the capability (staff and financial resources) to implement the alternative?
Does the operating agency have the vehicles, facilities and other supports available for the proposed alternative?
6.4 Alternatives
The following section looks at three different alternatives for improving seniors’ mobility. Maintaining the current level of transit service (“do nothing”) is considered as a fourth alternative .
6.4.1 TransLink implements customer service strategy
The Access Transit Plan (June 18, 2007) report states that, “To increase accessibility of the transit system, the volume and complexity of customer needs must be accommodated and supported by staff through enhanced customer service” (TransLink, p. 9). Broadly speaking, customer service can be understood as the services an organization offers to its customers, including but not limited to service standards, performance measures, communication strategies, passenger amenities and staff training (TRB, 2003b). Examples of customer service improvements relevant to seniors include:
More reliable arrival and departure times
Comfortable, universally accessible bus stops and waiting areas A seniors’ info-line to call for “one-stop transportation shopping”
More accessible seating and lower hand rails aboard conventional buses “Bus buddy programs” that teach seniors how to use transit
Education for service providers about seniors’ special needs (TRB, 2002, pp. 83–91)
Enhanced customer service is already one of several initiatives outlined within TransLink’s Access Transit Plan. Specifically, the plan identifies opportunities in four areas: (a) Website, (b) system signage and assistance, (c) staff training, and (d) customer training and support and community outreach.
Options for Improving Seniors Transportation
42
This alternative proposes further development of TransLink’s customer support and community outreach initiative through a new transportation demand management (TDM) strategy aimed at seniors. TRB (2003b) defines TDM as “the concept of managing or reducing travel demand rather than increasing the supply of transportation facilities”—in this case, transportation services. Transportation Demand Management (TDM) strategies to encourage increased use of transit, ridesharing, and other alternatives to the single-occupant automobile have traditionally been used as tool for congestion relief. Here the goal is similar: To shift transportation demand to other modes. A seniors’ TDM strategy would help to facilitate the integration of public transit with other established transportation options, such as HandyDART, taxis, and supplemental transportation programs. It would also help to increase customer awareness of the numerous transportation options for various trip purposes.6
Specific actions that TransLink might undertake include:
Liaising with federal, provincial, municipal and community-based agencies
Maintaining a comprehensive database of shuttle services, volunteer driving programs and other transportation-related services aimed at seniors
Providing seniors and other individuals (family members, health professionals, etc.) with information on a broad range of transportation alternatives
Assisting with the development of driver training programs
Linking with volunteer groups to provide peer-led travel training aboard conventional transit
Working with municipalities to improve taxi service quality (e.g., increased awareness and sensitivity to seniors’ unique needs)
Ensuring market research on customer service is inclusive of seniors in their evaluations.
6.4.2 TransLink funds independent transportation services for seniors
There are countless examples of community-based supplemental transportation programs for seniors across North America—indeed, in the Lower Mainland—and many different types of services; for instance:
Hospitals often organize transportation services for helping seniors access health care services. Senior centres develop transportation programs for a variety of purposes . . . Parks and recreation programs provide transportation services to enable seniors to participate in their activity programs . . . Shopping centres and grocery stores create transportation services to enable seniors to participate in the economy (Kerschner, 2003, p. 6).
This alternative proposes that TransLink administers a new program which would fund community-based, independent transportation services—for example, $30,000 per organization offering transportation service to a specified maximum for the entire program. Under the said program, TransLink would help cover operating costs (e.g., salary, fuel,
Options for Improving Seniors Transportation
43
6 TRB TDM committee ABE50 is currently involved in researching this topic. For more information, visit <http://www.trb-tdm.org>.

maintenance costs, advertising), requiring ownership or access to an appropriate vehicle to be eligible for funding. In addition to capital costs (e.g., vehicles, facilities and other supports), the remainder of operating costs would need to be funded through other sources, including but not limited to grants from local municipalities, government agencies, and/or foundations, in-kind services and private contributions. Applicants would need to provide their own insurance. Further, an extensive legal agreement between TransLink and the operating agency would ensure that TransLink is not held liable for any costs arising from accidents.
In short, TransLink would serve as program administrator and financial contributor whereas participating agencies would be responsible for designing, implementing and operating said transportation services. Types of agencies might include seniors’ centres, neighbourhood houses or even local governments. Section 5, which outlines Go Bus’ history, organizational structure, and budget, provides a sample business model for operating agencies.
Characteristics of the actual transportation service(s) include:
Routes designed around senior-oriented origins and destinations Closed service (seniors only) aimed at frail and elderly riders with the possibility of
expanding the service to be more inclusive of adults with disabilities No registration or membership required
Non-rushed service—slower pace allowing for the driver to provide assistance with boarding and alighting
Enhanced customer service—driver would assist with boarding and the handling of mobility aids
More space aboard vehicles for mobility aids and shopping bags
6.4.3 TransLink provides new transit service type targeting seniors
Under this alternative, TransLink would design and implement a new transit service type targeting seniors that would operate several days a week. Precedents include STM Montreal’s three Navettes Or seniors’ shuttle and the Regional Transportation Commission of Southern Nevada’s eleven “Silver Star” routes, serving the growing population of seniors in Las Vegas (see Appendix A).
Using minibuses, the routes would connect residential areas containing a minimum density of seniors with “senior-friendly” destinations in the community—shopping centres, medical offices, community centres and so forth. The proposed service would also cater to passengers with disabilities and other (i.e., non-exclusive to seniors). Following a fixed-route, the service would be similar to TransLink’s Community Shuttle concept, combining “the reliability of regular buses with the efficiency and personal feel of smaller vehicles” (CMBC, n.d.). The service delivery framework would be almost the same as Community Shuttle service type—for example, same fare system, ability to transfer between service types, etc.
Options for Improving Seniors Transportation
44

Figure 17. Community shuttle vehicle.
Key differences between the proposed seniors’ transit service and existing Community Shuttle service type include:
Routes designed around senior-oriented origins and destinations
Not a closed service (everyone welcome) though specifically aimed at elderly seniors and individuals with disabilities
Alternating schedule—different communities and/or municipalities are served on alternate days
More frequent midday service
Non-rushed service—slower pace allowing for the driver to provide assistance with boarding and alighting
Enhanced customer service—driver would assist with boarding and the handling of mobility aids
More space aboard vehicles for mobility aids and shopping bags
Bus stops along seniors routes should be 100% accessible Different marketing process—for example, through collaboration with community centres,
neighbourhood houses, ICBC, community health service providers, etc.
In designing the service, TransLink would need to develop criteria for introducing new seniors’ transit services (e.g., minimum density of seniors per hectare, similar to the 2004 TSGs). Communities should have a measurable and demonstrated need to be considered for the service.
6.4.4 TransLink maintains current level of service (“do nothing”)
Public transit would continue to operate at the current level of service. This option is fairly self-explanatory. TransLink would:
Options for Improving Seniors Transportation
45
Manage the existing network and services without significant changes to service types
Maintain current HandyDART eligibility (keep as-is)
Not implement any new senior-oriented customer service programs
In terms of accessibility, a recent assessment of TransLink fleet and facilities in Metro Vancouver concluded that “TransLink accessibility compares very favourably with other transit agencies in North America” (n.d., p. 29). Conventional transit services—SeaBus, West Coast Express, B-Line, Buses, Community Shuttles and SkyTrain—are wheelchair accessible and, as of 2009, all TransLink buses are either lift-equipped or provide low-floor access. The conventional transit system is supplemented by custom transit services, (“HandyDART”) for people with disabilities who are unable to use public transit without assistance. Opportunities for further improvements (e.g., increased availability of HandyDART services) would be put on hold under this alternative.
6.5 Evaluation of alternatives and implications
An alternative-consequences matrix is used to evaluate the four different policies. Evaluation criteria are displayed along the vertical axis while alternatives are along the horizontal axis. Ratings are based on a constructed scale ranging from 3 (very beneficial/excellent) to –3 (very harmful/poor) drawing on extensive qualitative research. A rating of 0 indicates no impact or mixed impacts. A more comprehensive analysis might also provide quantitative estimates—for example, cost/benefit analysis7—to better illustrate the “pros and cons” of each alternative.
6.6 Discussion of alternatives
Based on existing best practices from TransLink and beyond, the first three alternatives offer a broad range of benefits—as well as certain drawbacks. Doing “nothing” is not a long-term mobility strategy. While significant improvements to accessibility have been made, the sheer number of elderly seniors—many of whom will have mobility impairments restricting their use of conventional transit—is bound to overwhelm custom transit system. Indeed, certain contingents suggest that TransLink is already struggling to keep up with the current level of demand for accessible transit.
Options for Improving Seniors Transportation
46
7 Concerned with how society chooses to use its resources, cost/benefit analysis (CBA) is a systematic evaluation of the social, environmental
and/or economic advantages (benefits) and disadvantages (costs) of a set of alternatives. CBA is useful for determining “whether a particular
option is cost-effective, and which option provides the greatest overall benefits” (Litman, 2007: 1-3). For example, see Cost Benefit Analysis of
Providing Non-Emergency Medical Transportation (TRB, 2006).
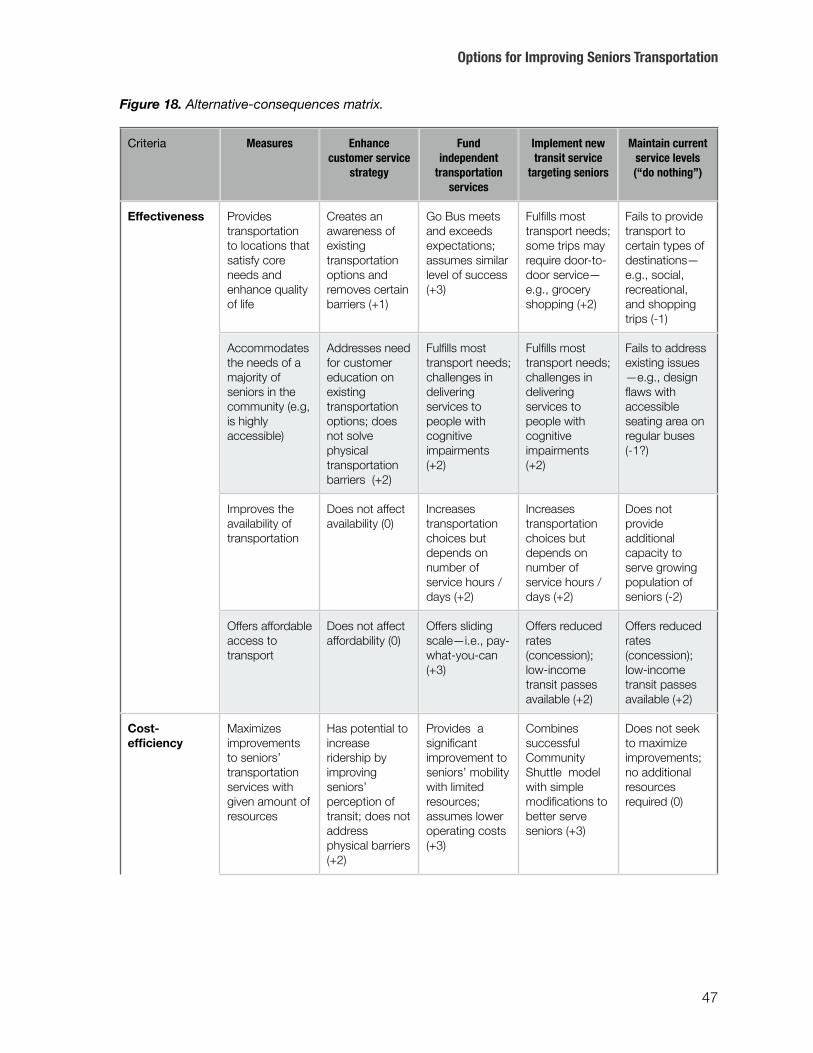
Figure 18. Alternative-consequences matrix.
Criteria Measures Enhance customer service
strategy
Fund independent
transportation services
Implement new transit service
targeting seniors
Maintain current service levels (“do nothing”)
Effectiveness Provides transportation to locations that satisfy core needs and enhance quality of life
Creates an awareness of existing transportation options and removes certain barriers (+1)
Go Bus meets and exceeds expectations; assumes similar level of success (+3)
Fulfills most transport needs; some trips may require door-to-door service—e.g., grocery shopping (+2)
Fails to provide transport to certain types of destinations— e.g., social, recreational, and shopping trips (-1)
Effectiveness
Accommodates the needs of a majority of seniors in the community (e.g, is highly accessible)
Addresses need for customer education on existing transportation options; does not solve physical transportation barriers (+2)
Fulfills most transport needs; challenges in delivering services to people with cognitive impairments (+2)
Fulfills most transport needs; challenges in delivering services to people with cognitive impairments (+2)
Fails to address existing issues—e.g., design flaws with accessible seating area on regular buses(-1?)
Effectiveness
Improves the availability of transportation
Does not affect availability (0)
Increases transportation choices but depends on number of service hours / days (+2)
Increases transportation choices but depends on number of service hours / days (+2)
Does not provide additional capacity to serve growing population of seniors (-2)
Effectiveness
Offers affordable access to transport
Does not affect affordability (0)
Offers sliding scale—i.e., pay-what-you-can (+3)
Offers reduced rates (concession); low-income transit passes available (+2)
Offers reduced rates (concession); low-income transit passes available (+2)
Cost-efficiency
Maximizes improvements to seniors’ transportation services with given amount of resources
Has potential to increase ridership by improving seniors’ perception of transit; does not address physical barriers (+2)
Provides a significant improvement to seniors’ mobilitywith limited resources; assumes lower operating costs (+3)
Combines successful Community Shuttle model with simple modifications to better serve seniors (+3)
Does not seek to maximize improvements; no additional resources required (0)
Options for Improving Seniors Transportation
47

Criteria Measures Enhance customer service
strategy
Fund independent
transportation services
Implement new transit service
targeting seniors
Maintain current service levels (“do nothing”)
Achieves the intended objectives (e.g., community goals) at minimum cost
Addresses broad range of customer service issues; increases awareness of transportation choices without delivering new service (+3)
Allows TransLink to set program budget—i.e. total amount of funding –while customized service provided by third party (+3)
Requires more resources compared to independent transport service—e.g., additional capital costs including new buses (+2)
Does not respond to objectives; no additional resources required (0)
Equity Ensures fair distribution of costs and benefits among regional tax-payers
Offers equal access to customer service programs throughout region (+3)
Depends on distribution of services; organizational commitment likely to vary by municipality (-1?)
Depends on distribution of services; “benefits” (transit service) allocated based on community needs (+1)
Does not affect the distribution of costs and benefits (0)
Equity
Ensures fair distribution of costs and benefits between social groups
Benefits everyone; however, addressing cultural differences may present certain challenges (+2)
Primarily benefits seniors; little to no benefit for other low-mobility groups—e.g., people with disabilities (-1)
Targets seniors but is also inclusive of people with disabilities and other individuals (+1)
Strives for fair distribution, yet certain groups (e.g., commuters) often receive better service than others—i.e. low-mobility groups (-1)
Administrative ease
TransLink’s authority to implement alternative
Compliments TransLink values (+3)
Requires legislative amendments; currently disallowed under SCBCTA Act (-2)
Is relatively to implement; similar to existing Community Shuttle service type (+2?)
Does not apply—no implementation required (0)
Administrative ease
TransLink’s capability (e.g., staff and resources) to implement alternative
Requires staff time and resources to develop new initiative (+2)
While requires less funding relative to operating new service, program administration may provide difficult / costly (+1?)
Requires staff time and resources to develop new transit service; may require purchase of new vehicles(+1)
Does not apply—no implementation required (0)
Options for Improving Seniors Transportation
48

Criteria Measures Enhance customer service
strategy
Fund independent
transportation services
Implement new transit service
targeting seniors
Maintain current service levels (“do nothing”)
Operating agency’s level of access to vehicles, facilities, and other supports
Does not require new vehicles or facilities (+3)
May require partnerships with other community-based stake-holders; will vary (+2)
May require new vehicles, staff, etc. (+2)
Does not apply—no implementation required (0)
TotalTotal +21 +15 +20 -3
From a mobility standpoint, independent demand-responsive transportation services are perhaps the most effective way of delivering “senior-friendly” transportation in Metro Vancouver. The Go Bus format of service delivery, for example, enables seniors to go where they want, when they want—though service hours are currently limited—and offers friendly, non-intimidating customer services. Another advantage of independent transportation services is that they are easily customized to meet the specific needs of each community. Implementing a new TransLink service type also has benefits. For instance, Go Bus focus group participants liked TransLink’s Community Shuttle approach to delivering transit service. A new service type modelled after Community Shuttle would presumably be well-received by seniors. Measurable improvements to customer service would also be appreciated by elderly transit users among others. Customer service on its own, however, does not address physical barriers (e.g., inaccessible bus stops, poor vehicle design, etc.).
Cost-efficiency also weighs heavily as a criterion, especially considering TransLink’s current financial situation. Funding independent transportation programs (i.e., outsourcing seniors’ transportation services to transport service providers) offers the advantage of externalizing capital costs. It also facilitates cost-sharing between government agencies; under the proposed alternative, TransLink funds only partial costs. On the other hand, if TransLink were to implement its own seniors routes, it would have the benefit of delivering a “tried-and-true” service, requiring only a few modifications to the Community Shuttle model. Improvements to customer service promote greater use of existing transit services.
Administrative ease is a third essential criterion. A plan is nothing without implementation, which in turn requires legal authority, institutional commitment, capability and capital resources. As the law currently stands, it is illegal for TransLink to fund “private transit services” (SCBCTA Act, 2007, §5[3]). While not impossible, it would certainly be difficult to change legislature; for example, proposed amendments may have legal ramifications beyond the intended objectives. Thus, from a purely administrative point of view, customer service programs and new transit services are perhaps more favourable strategies.
Equity concerns and community goals should also be factored into any decision pertaining to seniors’ mobility. In light of the fact that all transit fares are subsidized, it is
Options for Improving Seniors Transportation
49

important to consider how taxpayers will pay for a new alternative: “Do we cut or replace transit service or funding for another TransLink program? Or do we keep all programs and charge more for them?” (T. O’Reilly, personal communication, August 17, 2009).
6.7 Conclusion
Any evaluation, qualitative or not, is based on certain assumptions—e.g., that improving seniors’ mobility is a necessary and worthy objective. Rather than highlighting the salience of one particular alternative over the others, this section tries to provide a framework for thinking about seniors’ transportation alternatives. Excluding the status quo, the three alternatives draw on best practices from across North America. (All three options were given 15 or more points in total using the simple matrix shown in subsection 6.5). Each alternative has its own strengths and weaknesses. This report stops short of weighting the criteria as the relative importance of each criterion will vary by organization depending on their vision, mission and values. Ultimately, improving seniors’ transportation is more than just a matter of selecting one option over another—a case of “A and B” rather than a decision between “A or B.” Ultimately, non-driving seniors need a wide range of transportation options enabling them go where they want, when they want, to continue to live full and active lives.
Options for Improving Seniors Transportation
50

7. CONCLUSION
The final section of this preliminary study summarizes keys findings, describes the main limitations of the present study, and identifies opportunities for future research.
7.1 Summary
This study strives to answer two main questions: “What is Go Bus?” and secondly, “Is Go Bus a type of service that TransLink should offer?”
North Seniors’ Go Bus is a door-to-door transportation service for seniors. The driver provides assistance with getting to and from the vehicle, carrying parcels, and transporting mobility devices. From an operational standpoint, the service is perhaps best characterized as a demand-responsive shuttle on a semi-fixed transit route. Unlike public transit, the service has the flexibility to deviate from its route to pick up clients at their homes, thus providing door-to-door service.
While there is some overlap with HandyDART, Go Bus tends to be oriented more towards recreational outings and shopping trips than HandyDART, which has a policy of prioritizing medical- and work-related travel. Thus, Go Bus acts as a lifeline to the physical, emotional, and social well-being of elderly seniors who are either afraid or unable to use conventional transit. Focus group participants had an overwhelming appreciation for Go Bus whether they used the service or not. As one of the focus group participants put it:
The thing is we’re getting older. Right now, I’m 95 and in a few years, I’m not going to be able to get on and off a bus. If there’s something like the Go Bus around for us, I’d still be able to get places.
Ridership statistics and performance results; survey results; and the fact that service is still in operation three years later further confirms the shuttle’s success.
Whether the Go Bus model is “right” for TransLink depends on the organizations’ priorities and its approach to seniors transportation.
7.2. Study limitations
Three limitations need to be acknowledged and addressed regarding the present study. The first limitation concerns the sampling methodology for obtaining focus group participants, namely the use of non-probability sampling. Non-probability sampling is constrained by the fact that participants are not randomly selected. In particular, there is no protection against biases introduced by the investigator—or in this case the focus group recruiters—in the selection of the sample. Feedback from the focus groups in this study is not necessarily representative of all seniors living on the North Shore. In fact, it is likely that certain groups are underrepresented in this study. For instance, seniors with a valid driver’s license and access to a vehicle are poorly
Conclusion
51
represented in this study due to its narrow but specific focus on conventional and custom public transit and the Go Bus model of shuttle services.
The second limitation has to do with the extent to which the findings can be generalized beyond the focus groups. The number of focus group participants represents only a small sample of seniors living on the North Shore. Some of the reasons for this include limited time and resources, and inaccessibility to the entire senior population (i.e., all older 65+ adults) living on the North Shore. It should be recognized that the purpose of these focus groups and surveys is primarily to provide a brief snapshot of the transportation-related issues affecting seniors living on the North Shore as well as their general reaction to the Go Bus service. To this end, the results cannot be generalized beyond the specific sample that was used. (The same issues apply to the Go Bus survey.)
Finally, the study presumes a system of age-based categorizations rather than physical capabilities-based categorizations. As such, people from different age groups (e.g., younger adults with mobility impairments) or going to unconventional destinations have not been considered in this study of the Go Bus service. Some might argue that the arbitrary designation by age group is a serious question to be considered (T. Koch, personal communication, December 10, 2008); however, the debate of age versus ability remains beyond the scope of this paper. Planners must be cautious of generalizations because not all seniors have the same transportation needs—for example, an 85 year old will have different travel needs compared to another 85 year old (TRB, 2002).
7.3 Further research opportunities
A clear definition of seniors’ mobility needs across the region would help to ensure that region-wide transportation solutions are effective. The Transport 2040 (TransLink, 2008) consultation process provides an opportunity to hear from older adults across the Metro Vancouver area; however, public consultation activities may have to be adapted to meet the specific needs of seniors. For example, web-based forums are probably inappropriate for engaging with elderly seniors. At the same time, it is also essential that seniors’ service providers be included in the decision-making process. According to the TRB: “It is not unusual for human services agencies, advocates, and other organizations that have an interest in transportation but are not primarily transportation providers to have little say in transportation planning processes and planning decisions” (TRB, 2004, p. 27). Indeed, the success of recent seniors’ transportation forums such as those led by the United Way and the BCAA Traffic Safety Foundation are proof of the level of interest in sharing information and developing solutions. TransLink’s leadership would help to increase coordination among agencies and to develop new partnerships. Long-term, dedicated sources of funding—even minimal amounts—would help to ensure the sustainability of current seniors’ transportation services while enabling the exploration of further opportunities.
Conclusion
52
REFERENCES
Accessibility for Ontarians with Disabilities, S.O. c. 11 (2005). Retrieved February 2, 2009, from: http://www.mcss.gov.on.ca/mcss/english/pillars/accessibilityOntarioAmericans with Disabilities Act of 1990, Pub. L. No. 101-336, §2, 104 Stat. 328. (1991). Retrieved January 31, 2009, from: http://www.ada.gov/pubs/ada.htmBailey, L. (2004). Aging Americans: Stranded without options. Washington, DC: Surface Transportation Policy Project.Beverly Foundation. (2003). Supplemental transportation programs for seniors. Retrieved March 13, 2009, from: http://www.beverlyfoundation.org/library/ transportationoptions/SupplementalTransportationPrograms_whitepaper.pdfBlackburn, S. (2008). Justice as fairness. In The Oxford dictionary of philosophy. Retrieved on July 29, 2009 from Oxford Reference Online.Burkhardt, J. E. (2000). Limitations of mass transportation and individual vehicle systems for older persons. In K. Schaie & M. Pietrucha (Eds.), Mobility and transportation in the elderly (97–124). New York, NY: Springer.Coast Mountain Bus Company. (n.d.) Community shuttles. Retrieved July 29, 2009, from: http://www.coastmountainbus.com/services/bus_services/community_shuttlesEuropean Conference Ministers of Transport (2000). Transport and the aging of the population (Round Table No. 112). Paris: Organization for Economic Cooperation and Development.Fozard, J.L. (2000). Sensory and cognitive changes with age. In K. Schaie & M. Pietrucha (Eds.), Mobility and transportation in the elderly (1–44). New York, NY: Springer.Glasgow, N., & Blakely, R. M. (2000). Older non-metropolitan residents' evaluations of their transportation arrangements. Journal of Applied Gerontology 19(1), 95–116.Golledge, R. (1993). Geography and the disabled: A survey with special reference to vision impaired and blind populations. Transactions of the Institute of British Geographers, 18(1), 63–85.Government of British Columbia, Ministry of Housing and Social Development. (n.d.). Additional assistance for British Columbians in need. Retrieved May 19, 2009, from: http://www.eia.gov.bc.ca/PROGRAMS/other.htm#bpGovernment of Ontario, Ministry of Community and Social Services. (2009, pending). Final proposed transportation accessibility standard. Retrieved February 2, 2009, from: http://www.mcss.gov.on.ca/mcss/english/pillars/accessibilityOntario/Hanson, S., & Giuliano, G. (2004). The geography of urban transportation. New York, NY: Guilford Press.Health Canada. (2002). Canada’s aging population (No. H39-608/2002E). Retrieved November 5, 2008, from: http://www.phac-aspc.gc.ca/seniors-aines/pubs/ fed_paper/pdfs/fedpager_e.pdfHooker, B. (2005). Fairness. In The Oxford companion to philosophy. Retrieved July
References
53
29, 2009, from Oxford Reference Online.Human Rights Code, R.S.B.C. c. 210 (1996). Retrieved January 31, 2009, from: http://www.bclaws.caInstitute of Public Administration. (1975). Planning handbook: Transportation services for the elderly. Washington, D.C.: Author.Kerschner, H. (2003). STPs [supplemental transportation programs]: Concepts for practice. Retrieved February 12, 2009, from: http://www.beverlyfoundation.org/library/ transportationoptions/STPsConcepts_whitepaper.pdfLitman, T. (2002). Evaluating transportation equity. World Transport Policy & Practice, 8(2), 50–65.Litman, T. (2007). Evaluating transportation equity: Guidance for incorporating distributional impacts in transportation planning. In TDM Encyclopedia (Victoria Transport Policy Institute). Retrieved May 13, 2009, from: http://www.vtpi.org/equity.pdfLitman, T. (2008a). Accessibility. In TDM Encyclopedia (Victoria Transport Policy Institute). Retrieved August 13, 2008, from: http://www.vtpi.org/tdm/tdm84.htmLitman, T. (2008b). Shuttle services. In TDM Encyclopedia (Victoria Transport Policy Institute). Retrieved August 13, 2008, from: http://www.vtpi.org/tdm/tdm39.htmLitman, T. (2008c). Universal design. In TDM encyclopedia (Victoria Transport Policy Institute). Retrieved August 13, 2008, from: http://www.vtpi.org/tdm/tdm69.htmLoverin, A. (n.d.). North Shore Seniors Go Bus information sheet. (Available from Silver Harbour Seniors’ Activity Centre, 144 East 22nd St., North Vancouver, BC V7L 4L5).Loverin, A. (2007). North Shore Seniors Go Bus (Evaluation report). (Available from Silver Harbour Seniors’ Activity Centre, 144 East 22nd St., North Vancouver, BC V7L 4L5).Martel, L., and Bélanger, A. (2000). Dependence-free life expectancy in Canada. Canadian Social Trends, 58, 26–29.Metro Vancouver. (2006). 2006 Census bulletin #3 – population by age. Retrieved November 16, 2008, from: http://www.metrovancouver.org/about/publications/Publications/ Census2006_PopbyAge_Bulletin_3.pdfOntarians with Disabilities Act, S.O., c. 32 (2001). Retrieved February 6, 2009, from: http://www.e-laws.gov.on.ca/html/statutes/english/elaws_statutes_01o32_e.htmOxford English Dictionary. (2nd ed.). (1989). New York, NY: Oxford University Press.Porter, A. (2002). Compromise & constraint: Examining the nature of transport disability in the context of local travel. World Transport Policy & Practice, 8(2), 9–16.Rosenbloom, S. (2003). The mobility need of older Americans: Implications for transportation reauthorization. Washington, DC: Brookings Institution.Round, A., & Cervero, R. (1996). Future ride: Adapting new technologies to paratransit in the United States (Working Paper No. 655). Berkeley, CA: University of California at Berkeley, Institute of Urban and Regional Development.South Coast British Columbia Transportation Authority Act S.B.C. c. 30. (2007). Retrieved January 31, 2009, from: http://www.bclaws.ca
References
54
Statistics Canada. (2002). A Profile of Disability in Canada, 2001. Retrieved February 2, 2009, from: http://www.statcan.gc.ca/pub/89-577-x/index-eng.htmStatistics Canada. (2009). 2006 community profiles—Vancouver (CMA). Retrieved February 2, 2009, from: http://www12.statcan.gc.ca/census-recensement/2006/dp-pd/prof/ 92-591/index.cfm?Lang=ETorres-Davis, A. (2008). The need for improved transportation options for the elderly and the elder advocate’s role. J. of Poverty Law and Policy, 42 (5-6), pp. 281–291.TransLink. (n.d.) Accessible TransLink: An assessment of the accessibility of TransLink and facilities in the Greater Vancouver Region. Burnaby, BC: Author.TransLink. (1999). Community Bus 2000: State of the art review. Burnaby, BC: Author.TransLink. (2004). Transit service guidelines public summary report. Burnaby, BC: Author.TransLink. (April 12, 2005). Development of the Accessible Transit Strategic Plan (TransLink Board report). Retrieved July 22, 2009, from: http://www.translink.caTransLink. (June 18, 2007). Access transit plan. (TransLink Board report). Retrieved February 9, 2009, from the BC Legislative Library: http://www.llbc.leg.bc.ca/public/ Pubdocs/bcdocs/416137/AccessTransitPlan.pdfTransLink. (2007a). Transport 2040 backgrounder. Retrieved August 1, 2008, from the BC Legislative Library: http://www.llbc.leg.bc.ca/public/PubDocs/bcdocs/435019/ Backgrounder.pdfTransLink. (2007b). Universally accessible bus stop guidelines. Burnaby, BC: Author.TransLink. (2008). Transport 2040. Burnaby, BC: Author.TransLink. (2009a). TransLink 2008 Annual Report. Retrieved June 30, 2009, from: http://www.translink.ca/en/About-TransLink/Annual-Reports.aspxTransLink. (2009b). Accessible transit. Retrieved June 18, 2009, from: http://www.TransLink.ca/en/Rider-Info/Accessible-Transit.aspxTransportation Research Board (TRB). (1998). Paratransit contracting and service delivery methods (TCRP Synthesis No. 31). Washington, DC: National Academy Press.TRB. (1995). Users' manual for assessing service-delivery systems for rural passenger transportation (TCRP Report No. 6). Retrieved July 17, 2009, from: http://www.trb.org/news/blurb_detail.asp?id=2610TRB (1999). Transportation in an aging society: A decade of experience (Conference proceedings). Retrieved February 9, 2009, from: http://onlinepubs.trb.org/ Onlinepubs/conf/reports/cp_27.pdfTRB. (2002). Improving public transit options for older persons (TCRP Report No. 82). Washington, DC: National Academy Press.TRB. (2003a). Resource requirements for demand-responsive transportation service (TCRP Report No. 98). Washington, DC: National Academy Press.TRB. (2003b). Transit capacity and quality of service manual (TCRP Report No. 100, 2nd Ed.) Washington, DC: National Academy Press.TRB. (2004). Strategies to increase coordination of transportation services for the
References
55
transportation disadvantaged (TCRP Report No. 105). Washington, DC: National Academy Press.TRB. (2006). Cost benefit analysis of providing non-emergency medical transportation (TCRP Web-Only Document No. 29). Retrieved on July, 29 2009, from: http://onlinepubs.trb.org/Onlinepubs/tcrp/tcrp_webdoc_29.pdfTRB. (2007). Toolkit for integrating non-dedicated vehicles in paratransit service (TCRP Report No. 121). Washington, DC: National Academy Press.Turcotte, M. (2006). Seniors access to transportation (Statistics Canada Catalogue No. 11-008). Retrieved September 10, 2008, from: http://www.statcan.gc.ca/bsolc/olc- cel/olc-cel?catno=11-008-X20060059528&lang=engTurcotte, M. & Schellenberg, G. (2006) A portrait of seniors in Canada (Statistics Canada Catalogue no. 89-519-XIE). Retrieved September 10, 2008, from: http://www.statcan.gc.ca/pub/89-519-x/89-519-x2006001-eng.pdfUnion of British Columbia Municipalities. (2006). North Shore Seniors Go Bus: A project of the UBCM seniors housing and support initiative. Richmond, BC: Author.U.S. Census Bureau. (1996). Population projections of the United States by age, sex, race, and Hispanic origin: 1995 to 2050 (No. P25-1130). Retrieved November 5, 2008, from: http://www.census.gov/prod/1/pop/p25-1130.pdfU.S. Census Bureau. (2007). Percent of the total population who are 65 years and over. Retrieved November 5, 2008, from: http://factfinder.census.govUnited Way. (2009). United Way solutions for seniors: Seniors transportation. Retrieved on July 29, 2009, from: http://www.uwlm.ca/NR/rdonlyres/AF02D447-58AB-455E-887C- FB7AD343B441/92494/Backgrounder.pdfVancouver Coastal Health. (2006). Free shuttle for seniors on the North Shore. Health Link. Retrieved February 8, 2009, from: http://bcgh.ca/enewsletter/ files2006-09-01NorthShore/free_shuttle_service_for_seniors.htmlWachs, M. (1979). Transportation for the elderly. Berkeley, CA: University of California Press.Westside Seniors Empowerment Coalition. (2008). Westside shuttle proposal. Retrieved on August 12, 2009 from: http://www.uwlm.ca/NR/rdonlyres/ AF02D447-58AB-455E-887C-FB7AD343B441/93135/ WestsideShuttleBusProposal.pdf
References
56
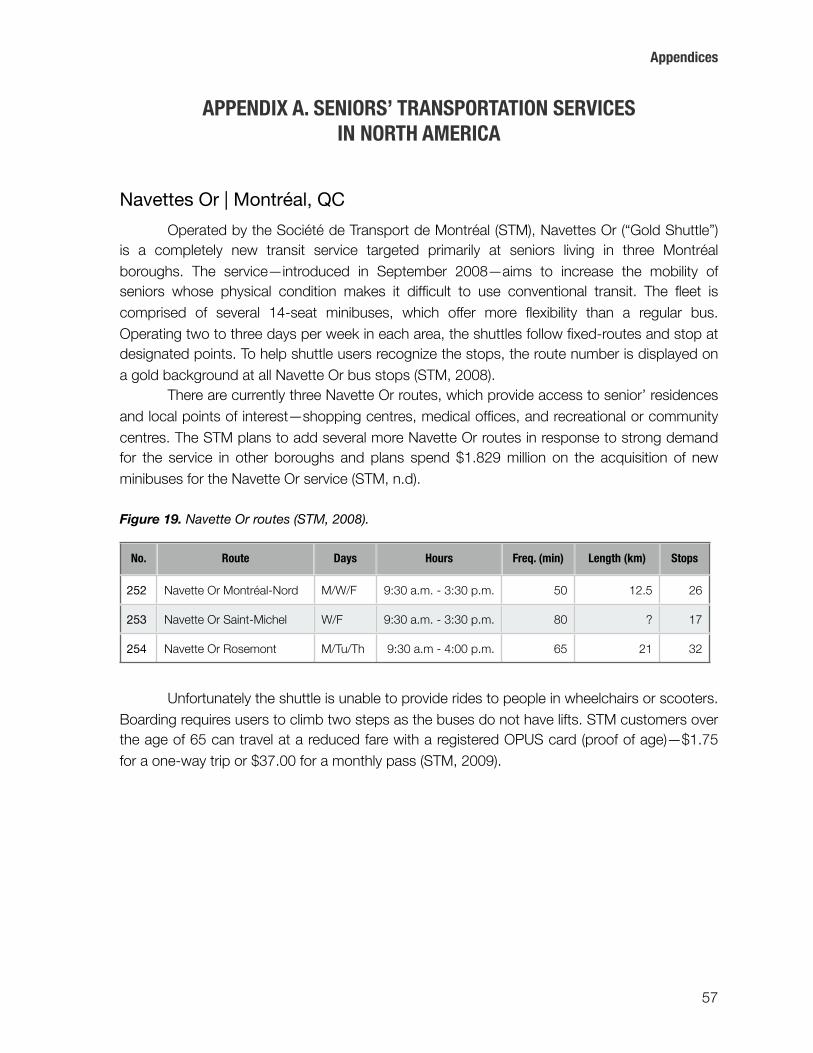
APPENDIX A. SENIORS’ TRANSPORTATION SERVICES IN NORTH AMERICA
Navettes Or | Montréal, QC
Operated by the Société de Transport de Montréal (STM), Navettes Or (“Gold Shuttle”) is a completely new transit service targeted primarily at seniors living in three Montréal boroughs. The service—introduced in September 2008—aims to increase the mobility of seniors whose physical condition makes it difficult to use conventional transit. The fleet is comprised of several 14-seat minibuses, which offer more flexibility than a regular bus. Operating two to three days per week in each area, the shuttles follow fixed-routes and stop at designated points. To help shuttle users recognize the stops, the route number is displayed on a gold background at all Navette Or bus stops (STM, 2008).
There are currently three Navette Or routes, which provide access to senior’ residences and local points of interest—shopping centres, medical offices, and recreational or community centres. The STM plans to add several more Navette Or routes in response to strong demand for the service in other boroughs and plans spend $1.829 million on the acquisition of new minibuses for the Navette Or service (STM, n.d).
Figure 19. Navette Or routes (STM, 2008).
No. Route Days Hours Freq. (min) Length (km) Stops
252 Navette Or Montréal-Nord M/W/F 9:30 a.m. - 3:30 p.m. 50 12.5 26
253 Navette Or Saint-Michel W/F 9:30 a.m. - 3:30 p.m. 80 ? 17
254 Navette Or Rosemont M/Tu/Th 9:30 a.m - 4:00 p.m. 65 21 32
Unfortunately the shuttle is unable to provide rides to people in wheelchairs or scooters. Boarding requires users to climb two steps as the buses do not have lifts. STM customers over the age of 65 can travel at a reduced fare with a registered OPUS card (proof of age)—$1.75 for a one-way trip or $37.00 for a monthly pass (STM, 2009).
Appendices
57
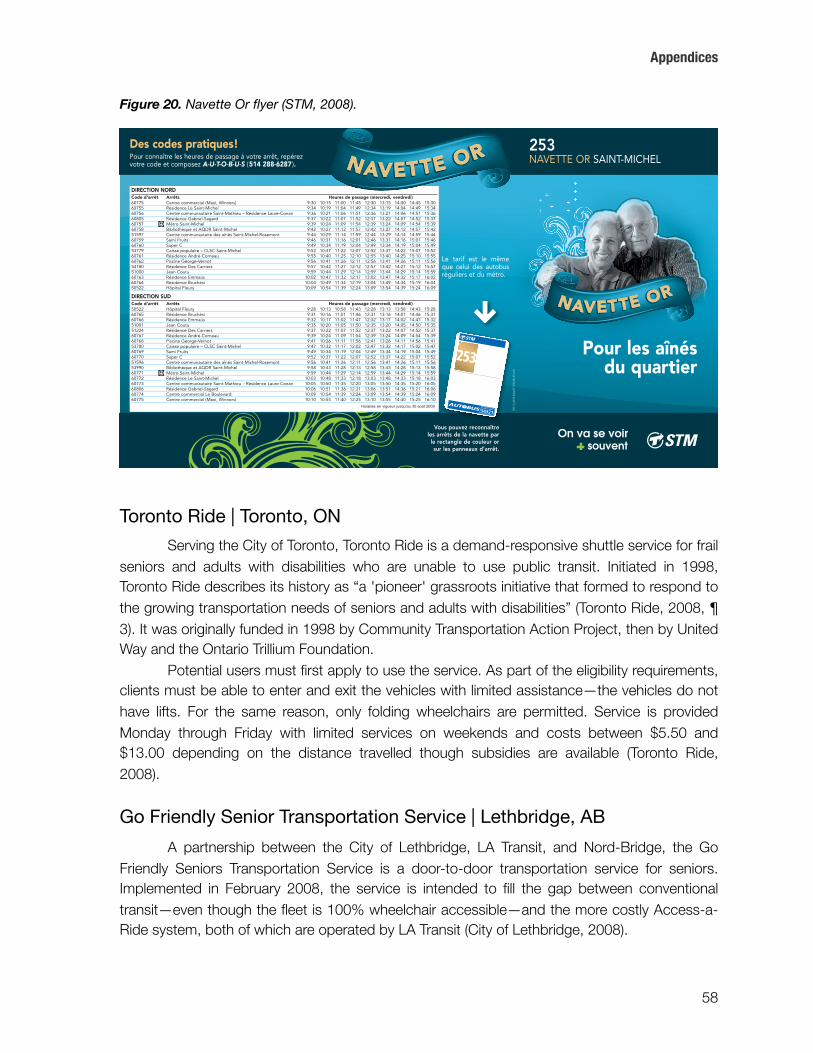
Figure 20. Navette Or flyer (STM, 2008).
Toronto Ride | Toronto, ON
Serving the City of Toronto, Toronto Ride is a demand-responsive shuttle service for frail seniors and adults with disabilities who are unable to use public transit. Initiated in 1998, Toronto Ride describes its history as “a 'pioneer' grassroots initiative that formed to respond to the growing transportation needs of seniors and adults with disabilities” (Toronto Ride, 2008, ¶ 3). It was originally funded in 1998 by Community Transportation Action Project, then by United Way and the Ontario Trillium Foundation.
Potential users must first apply to use the service. As part of the eligibility requirements, clients must be able to enter and exit the vehicles with limited assistance—the vehicles do not have lifts. For the same reason, only folding wheelchairs are permitted. Service is provided Monday through Friday with limited services on weekends and costs between $5.50 and $13.00 depending on the distance travelled though subsidies are available (Toronto Ride, 2008).
Go Friendly Senior Transportation Service | Lethbridge, AB
A partnership between the City of Lethbridge, LA Transit, and Nord-Bridge, the Go Friendly Seniors Transportation Service is a door-to-door transportation service for seniors. Implemented in February 2008, the service is intended to fill the gap between conventional transit—even though the fleet is 100% wheelchair accessible—and the more costly Access-a-Ride system, both of which are operated by LA Transit (City of Lethbridge, 2008).
253NAVETTE OR SAINT-MICHEL
NAVETTE OR
Vous pouvez reconnaîtreles arrêts de la navette parle rectangle de couleur orsur les panneaux d’arrêt.
Des codes pratiques!Pour connaître les heures de passage à votre arrêt, repérezvotre code et composez A-U-T-O-B-U-S (514 288-6287 ).
Pour les aînésdu quartier
DIRECTION NORDCode d'arrêt Arrêts Heures de passage (mercredi, vendredi)60775 Centre commercial (Maxi, Winners) 9:30 10:15 11:00 11:45 12:30 13:15 14:00 14:45 15:3060755 Résidence Le Saint-Michel 9:34 10:19 11:04 11:49 12:34 13:19 14:04 14:49 15:3460756 Centre communautaire Saint-Mathieu – Résidence Laure-Conan 9:36 10:21 11:06 11:51 12:36 13:21 14:06 14:51 15:3660805 Résidence Gabriel-Sagard 9:37 10:22 11:07 11:52 12:37 13:22 14:07 14:52 15:3760757 Métro Saint-Michel 9:39 10:24 11:09 11:54 12:39 13:24 14:09 14:54 15:3960758 Bibliothèque et AQDR Saint-Michel 9:42 10:27 11:12 11:57 12:42 13:27 14:12 14:57 15:4251597 Centre communautaire des aînés Saint-Michel-Rosemont 9:44 10:29 11:14 11:59 12:44 13:29 14:14 14:59 15:4460759 Sami Fruits 9:46 10:31 11:16 12:01 12:46 13:31 14:16 15:01 15:4660760 Super C 9:49 10:34 11:19 12:04 12:49 13:34 14:19 15:04 15:4953779 Caisse populaire – CLSC Saint-Michel 9:52 10:37 11:22 12:07 12:52 13:37 14:22 15:07 15:5260761 Résidence André-Corneau 9:55 10:40 11:25 12:10 12:55 13:40 14:25 15:10 15:5560762 Piscine George-Vernot 9:56 10:41 11:26 12:11 12:56 13:41 14:26 15:11 15:5654180 Résidence Des Carriers 9:57 10:42 11:27 12:12 12:57 13:42 14:27 15:12 15:5751000 Jean Coutu 9:59 10:44 11:29 12:14 12:59 13:44 14:29 15:14 15:5960763 Résidence Emmaüs 10:02 10:47 11:32 12:17 13:02 13:47 14:32 15:17 16:0260764 Résidence Bruchési 10:04 10:49 11:34 12:19 13:04 13:49 14:34 15:19 16:0450522 Hôpital Fleury 10:09 10:54 11:39 12:24 13:09 13:54 14:39 15:24 16:09
DIRECTION SUDCode d'arrêt Arrêts Heures de passage (mercredi, vendredi)50522 Hôpital Fleury 9:28 10:13 10:58 11:43 12:28 13:13 13:58 14:43 15:2860765 Résidence Bruchési 9:31 10:16 11:01 11:46 12:31 13:16 14:01 14:46 15:3160766 Résidence Emmaüs 9:32 10:17 11:02 11:47 12:32 13:17 14:02 14:47 15:3251001 Jean Coutu 9:35 10:20 11:05 11:50 12:35 13:20 14:05 14:50 15:3551224 Résidence Des Carriers 9:37 10:22 11:07 11:52 12:37 13:22 14:07 14:52 15:3760767 Résidence André-Corneau 9:39 10:24 11:09 11:54 12:39 13:24 14:09 14:54 15:3960768 Piscine George-Vernot 9:41 10:26 11:11 11:56 12:41 13:26 14:11 14:56 15:4153780 Caisse populaire – CLSC Saint-Michel 9:47 10:32 11:17 12:02 12:47 13:32 14:17 15:02 15:4760769 Sami Fruits 9:49 10:34 11:19 12:04 12:49 13:34 14:19 15:04 15:4960770 Super C 9:52 10:37 11:22 12:07 12:52 13:37 14:22 15:07 15:5251596 Centre communautaire des aînés Saint-Michel-Rosemont 9:56 10:41 11:26 12:11 12:56 13:41 14:26 15:11 15:5653990 Bibliothèque et AQDR Saint-Michel 9:58 10:43 11:28 12:13 12:58 13:43 14:28 15:13 15:5860771 Métro Saint-Michel 9:59 10:44 11:29 12:14 12:59 13:44 14:29 15:14 15:5960772 Résidence Le Saint-Michel 10:03 10:48 11:33 12:18 13:03 13:48 14:33 15:18 16:0360773 Centre communautaire Saint-Mathieu – Résidence Laure-Conan 10:05 10:50 11:35 12:20 13:05 13:50 14:35 15:20 16:0560806 Résidence Gabriel-Sagard 10:06 10:51 11:36 12:21 13:06 13:51 14:36 15:21 16:0660774 Centre commercial Le Boulevard 10:09 10:54 11:39 12:24 13:09 13:54 14:39 15:24 16:0960775 Centre commercial (Maxi, Winners) 10:10 10:55 11:40 12:25 13:10 13:55 14:40 15:25 16:10
Horaires en vigueur jusqu’au 30 août 2009
NAVETTE OR
0911
3-22
10N
AVE
TTES
OR
JG(R
3)
Le tarif est le mêmeque celui des autobusréguliers et du métro.
Appendices
58
The cost is $2.25 per one-way trip or free with a City Bus Pass ($22 per month). Riders are asked to call the day before to arrange pickup. The shuttle operates Monday through Friday but only at certain times:
Monday, Wednesday & Thursday: 8:45-11:35 a.m., 2:00-2:30 a.m. & 3:30-4:00 p.m.;
Tuesday: 9:45-11:45 a.m. & 3:30-4:00 p.m.; and Friday: 8:45 a.m.-12:45 p.m. & 3:15-4:00 p.m. (Nord-bridge Senior Citizens Association,
n.d)
Ride Connection | Portland, OR
Established in 1988, Ride Connection is a nonprofit organization in Portland, Oregon that provides rides for older adults and people with disabilities. The agency has since grown to includes a network of over 30 agencies, utilizes a variety of funds from both public sources and private foundations and businesses, and involves more than 300 volunteers in providing the service. A range of specialized transportation services are offered in the Clackamas, Multnomah and Washington Counties varying by area—including four different shuttle services as well as U-Ride transportation services in rural areas (Ride Connection, 2005a).
Ride About is one of Ride Connection’s free shuttle services for older adults (60+) and people with disabilities, serving the north Portland. Service is available Monday through Friday, allowing clients to access grocery stores and local neighbourhood centres. An attendant accompanies the shuttle to assist with heavy shopping bags. While there is no cost to ride the shuttle, donations are gladly accepted (Ride Connection, 2005b).
RTC Silver Star and Flexible Demand Response | Las Vegas, NV
Operated by the Regional Transportation Commission of Southern Nevada (RTC), “Silver Star” routes supplement the RTC’s paratransit and fixed route services: “A growing population of senior citizens in Las Vegas and an increasing demand for mobility required a compromise between the flexibility of the Regional Transportation Commission of Southern Nevada's (RTC's) fixed-route service and the door-to-door capabilities of RTC Americans with Disabilities Act (ADA) Paratransit” (RTC, 2009, ¶1). The Silver Star service is a community fixed-route service that was developed with the seniors’ transportation needs in mind. The eleven routes provide access to senior housing, local shopping, medical offices, and recreational services. Service is available two days a week.
The RTC also offers an advance reservation service to age-restricted communities—Flexible Demand Response (FDR). Anyone living in these communities may use the service, which is available three days a week. FDR rides are scheduled by calling the service up to three days in advance. Funded by the Division for Aging Services, both services connect with the regular RTC fixed-routes to “provide a broad range of destinations for passengers” (RTC, 2008, p. 10).
Appendices
59
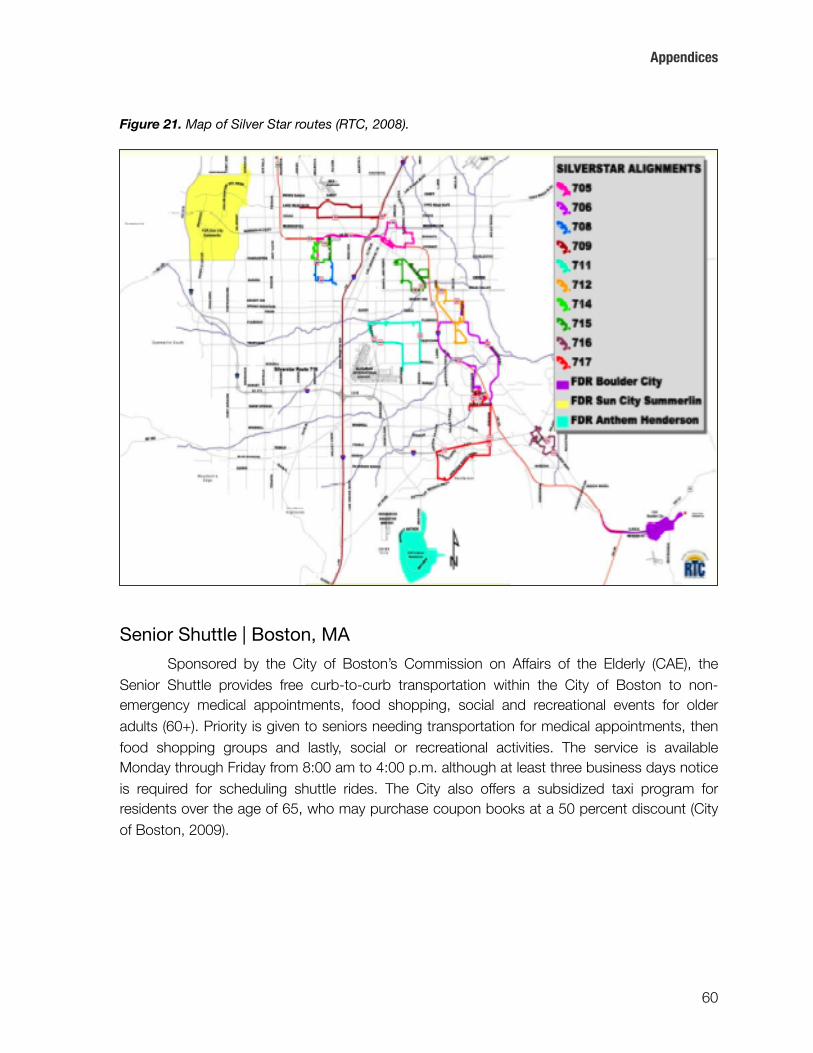
Figure 21. Map of Silver Star routes (RTC, 2008).
Senior Shuttle | Boston, MA
Sponsored by the City of Boston’s Commission on Affairs of the Elderly (CAE), the Senior Shuttle provides free curb-to-curb transportation within the City of Boston to non-emergency medical appointments, food shopping, social and recreational events for older adults (60+). Priority is given to seniors needing transportation for medical appointments, then food shopping groups and lastly, social or recreational activities. The service is available Monday through Friday from 8:00 am to 4:00 p.m. although at least three business days notice is required for scheduling shuttle rides. The City also offers a subsidized taxi program for residents over the age of 65, who may purchase coupon books at a 50 percent discount (City of Boston, 2009).
Appendices
60

APPENDIX B. GO BUS SURVEY
Overview
In July 2009, a survey of Go Bus riders was conducted on behalf of Silver Harbour Seniors’ Activity Centre and TransLink. The purpose of the survey was twofold: (a) to establish of profile of riders and (b) to elicit feedback on Go Bus from respondents. Over a period of three days, riders were verbally asked a series of questions about their current and former modes of transportation, including Go Bus. A total of twenty-six riders were surveyed, taking between three and four hours per day:
Wednesday, July 22nd – 8 riders surveyed Thursday, July 23rd – 12 riders surveyed
Monday, July 27th – 6 riders surveyed8
Ridership characteristics
Of those surveyed, thirteen riders lived in the North Vancouver (City or District) while the other thirteen people lived in the West Vancouver.
Two-thirds of the riders used some kind of mobility aid while aboard Go Bus: nine riders used a walker, seven people used a cane and one person used a wheelchair.
In terms of age, most riders were in their eighties according to the driver. The eldest rider was 99 years old and uses the bus once a week to travel to bingo at Silver Harbour Seniors’ Activity Centre. In comparison, the youngest—and only rider under 65 during the survey period—was in her early forties and regularly uses the service as an alternative to HandyDART.
Questions about Go Bus
The majority of respondents said they took Go Bus once a week—the bus only operates three days per week—while others utilized the service more sporadically (“once in a blue moon”). In response to the question, “How often do you use Seniors Go Bus?,” of those who responded:
4 said they used Go Bus less than once a month
1 said once every two weeks 13 said once a week
3 said twice a week
Appendices
61
8 Most of the riders on Monday, July 27th had already responded to the survey— the route (Norgate-Lonsdale) overlaps with the other two routes. Thus fewer people were surveyed even though the shuttle was busy throughout the morning.

0 said three or more times a week
To the next question, “How did you hear about Seniors Go Bus?,” of those who responded:
1 said they heard about Go Bus through a poster 2 said through a flyer
1 said through the newspaper 3 said through word of mouth
3 said through a care facility
8 said through a seniors’ centre (Silver Harbour, John Braithwaite)
The mall (Capilano or Park Royal) was the most common destination among respondents—likely due to the concentration of stores in one location and the opportunity to have lunch with friends. For example, when asked about their destination that day:
9 said they were going to the mall
3 said the grocery store 1 said the drugstore
1 said the medical centre
7 said a community centre or seniors’ centre (Silver Harbour or John Braithwaite) 5 said another destination (Evergreen care facility, Ambleside, Central Lonsdale)
Echoing peoples’ comments from the Go Bus focus groups, all respondents said they were highly satisfied with the service. On a scale of one (poor) to five (excellent), all twenty-six riders gave Go Bus a “5 out 5” rating. When asked what they liked about Go Bus, most respondents commented on the driver’s friendly, caring personality. Three people made positive remarks about the convenience of the service; two people said they appreciated the service’s reliable pickup times; and one person commented that Go Bus was much easier for her to board and alight Go Bus compared to conventional transit. The only suggestion for improvement—other than the refrain of “nothing . . . it’s perfect as is”—was that Go Bus be offered more days per week.
Questions about other modes of transportation
Survey respondents were incredibly knowledgeable about the different transportation services available to seniors on the North Shore—from “Doris the Bus” offered by Capilano Community Services Seniors’ Hub to TransLink’s Taxi Saver program. To the question, “In addition to Go Bus, what modes of transportation do you currently use? (select all that apply)”:
0 people said that they drive
10 people said that friends and family provide rides
Appendices
62
8 people said that they use the “regular bus” (conventional transit) 7 people said that they use HandyDART
7 people said that they use taxis 6 people said that they walk or wheel
Many riders commented that, before using Go Bus, they either owned a car and drove or else used public transit. When asked, “What modes of transportation did you use before you started using Go Bus? (select all that apply),” of those who responded:
11 said they drove
5 said that friends and family provided rides 13 said they took the “regular bus” (conventional transit)
4 said they took HandyDART 3 said they used Taxi Savers
4 said they walked or wheeledMost riders were eligible for HandyDART but few used the service more than once a
month—in some cases, never. When asked, “Are you eligible for HandyDART and Taxi Savers?” of those who responded: Nineteen said “yes” (73 percent) whereas only four respondents reported that they were ineligible (15 percent); the remainder were unsure of their eligibility (12 percent). In response to the question, “How often do you use HandyDART?,” of those who responded:
17 said less than once a month 0 said once every two weeks
4 said once a week
1 said twice a week 0 said three or more times a week
Similarly, two-thirds of respondents said they rarely used conventional transit—a number of people said they were worried about falling, or else routes were to far from they live. In response to the question, “How often do you use public transit?,” of those who responded:
16 said less than once a month 0 said once every two weeks
3 said once a week
5 said twice a week 1 said three or more times a week
Concluding comments
Because there are often fewer riders in summer (when programs tend to be cancelled), surveying riders in winter or spring months would likely yield a greater number of responses.
Appendices
63
Nonetheless, the above results are a good indication of rider satisfaction. The survey also offers new insights on riders’ travel patterns and attempts to sketch a profile of Go Bus riders. With a few exceptions as noted in the above, most riders are elderly (80+) non-drivers. Based on survey responses, it can also be assumed that many Go Bus riders also rely on public transit, HandyDART and taxis, especially since Go Bus operates on a limited schedule.
Appendices
64