transportation and safety study - pioneer … avenue and fuller street...... los under traffic...
TRANSCRIPT

LUDLOW
SEPTEMBER 2010 Prepared Under the Direction of Pioneer Valley MPO By: Pioneer Valley Planning Commission 60 Congress Street Springfield 01104-3419 Prepared in cooperation with the Town of Ludlow, Massachusetts Department of Transportation and the U.S. Department of Transportation - Federal Highway Administration and the Federal Transit Administration. The views and opinions of the Pioneer Valley Planning Commission expressed herein do not necessarily state or reflect those of the U.S. Department of Transportation.
WEST AVENUE AND FULLER STREET INTERSECTION
TRANSPORTATION AND SAFETY STUDY

TABLE OF CONTENTS I. Introduction .........................................................................................3
A. Study Area...................................................................................................................................... 3 II. Existing Transportation Conditions ..........................................................7
A. Average Daily Traffic Volume..................................................................................................... 7 B. Peak Hour Volume and Turning Movement Counts............................................................... 8 C. Safety............................................................................................................................................. 10 1. Crash Rate Analysis .................................................................................................................. 10 2. Collision Diagram ..................................................................................................................... 11
D. Level of Service Analysis............................................................................................................ 14 E. Queue Length .............................................................................................................................. 15 F. Signal Warrant Analysis............................................................................................................. 16 G. Multi‐Way ‘STOP’ Warrant Analysis ....................................................................................... 18
III. Recommendations ...............................................................................20
A. Pavement Markings .................................................................................................................... 20 B. Geometry and Curbing............................................................................................................... 20 C. Regulatory and Warning Signs ................................................................................................. 23 D. Traffic signal warrants................................................................................................................ 23
List of Tables
Table 1: Average Annual Daily Traffic in 2010........................................................................................ 7 Table 2: Comparison of Traffic Volumes in 2004 and 2010.................................................................... 8 Table 3: Crash History .............................................................................................................................. 11 Table 4: Crashes included in Collision Diagram................................................................................... 13 Table 5: Level of Service (LOS) Designations for Unsignalized Intersections................................... 14 Table 6: Existing Level of Service ............................................................................................................ 15 Table 7: 95th Percentile Queue Length at Fuller Street Approach...................................................... 15 Table 8: Signal Warrant Analysis Results............................................................................................... 16 Table 9: LOS Designations for Signalized Intersections....................................................................... 17 Table 10: LOS under Traffic Signal Control ........................................................................................... 17 Table 11: Multi‐Way ‘STOP’ Warrant Analysis Results ....................................................................... 18 Table 12: LOS under Multi‐Way ‘STOP’ Sign Control ......................................................................... 19 List of Figures
Figure 1: Study Area ................................................................................................................................... 5 Figure 2: Aerial Image of the Intersection................................................................................................ 6 Figure 3: Turning Movement Counts ....................................................................................................... 9 Figure 4: Collision Diagram ..................................................................................................................... 12 Figure 5: Proposed Curbing and Driveway Improvements ................................................................ 21 Figure 6: Proposed Turning Lane separated by an Island ................................................................... 22

ABBREVIATIONS
1 a.m. Afore Meridian 2 AADT Average Annual Daily Traffic 3 ADT Average Daily Traffic 4 ATR Automatic Traffic Recorders 5 Ave. Avenue 6 FY For Year 7 LOS Level of Service 8 MassDOT Massachusetts Department of Transportation 9 MPH Miles per Hour
10 MUTCD Manual on Uniform Traffic Control Devices 11 p.m. Post Meridian 12 PVPC Pioneer Valley Planning Commission 13 Rd. Road 14 St. Street 15 TMC Turning Movement Counts 16 TRB Transportation Research Board 17 VPH Vehicles per Hour

3
I. INTRODUCTION
The Ludlow Master Plan committee identified the intersection of West Avenue and Fuller Street in the Town of Ludlow as an intersection of concern as part of their Master Plan process. Pioneer Valley Planning Commission (PVPC) conducted a transportation and safety study at the intersection as part of the FY 2010 Unified Planning Work Program. PVPC also performed a traffic signal warrant analysis to examine the feasibility of installing a traffic signal at the intersection. This study builds on a previous 2004‐2005 study conducted for the Fuller Street corridor and examines the existing conditions at the intersection. A series of short‐term recommendations have been developed to improve existing traffic operations and increase safety.
A. STUDY AREA
The intersection of West Avenue and Fuller Street is a three way intersection located in the southwest section of the Town of Ludlow. It is an unsignalized intersection with Fuller Street operating as the minor street under ‘STOP’ sign control. Land use in the immediate vicinity of the intersection is a mix of commercial and residential. There are also several side streets off of West Avenue in close proximity to the intersection that provide access to additional residences. The intersection is characterized by a large uncontrolled curb cut providing access to a restaurant and hair salon to the northeast of the intersection. The geometry of the intersection also creates an acute angle that restricts sight distance from Fuller Street to the northwest and interferes with right turns from Fuller Street onto West Avenue. As a result, this movement is prohibited for large vehicles such as trucks.
Both West Avenue and Fuller Street are classified as urban major collectors (U5) in the vicinity of the intersection. The speed limit for both approaches of West Avenue are posted at 30 miles per hour, however, the roadway curves sharply northwest of the intersection and the speed limit is reduced to 20 mph at the curvature and again increased to 30 mph at the intersection.
Overall the pavement in the vicinity of the intersection is in poor condition. The most severe pavement condition was observed on Fuller Street on the eastern side of the roadway due to the absence of curbing in this area. Bituminous curbing is located along the western side of Fuller Street and northern side of West Avenue. Sidewalks are located along both sides of West Avenue to the northwest of the
___________________________________________________________________________Introduction
4
intersection and only on the southern side of West Avenue to the southeast of the intersection. A sidewalk is also located along on the western side of Fuller Street.
Pavement markings in the vicinity of the intersection consist of double yellow centerlines and a white STOP line on Fuller Street. Markings were noted to be in poor condition at the time of the field inventory. No edge lines or crosswalks are provided in the immediate vicinity of the intersection. Right turns from West Avenue onto Fuller Street were observed to be performed at high speeds due to the existing geometry of the intersection and lack of edge lines and curbing along this corner.
..

___________________________________________________________________________Introduction
5
Figure 1: Study Area
90
20
21
141
LUDLOW
WA
Z S
T RE
ET
WEST AVENUE
MO
TYK
A S
TREE
T
STEBBINS STREET
FULL
ER
STR
EE
T
N
Town of Ludlow
Intersection of West Avenue and Fuller Street

___________________________________________________________________________Introduction
6
Figure 2: Aerial Image of the Intersection
90
ARCH STREET
WA
Z S
TRE
ET
WEST AVENUE
STEBBINS STREETM
OTY
KA
STR
EET
FUL LE
R S
T RE
ET
MASSACHUSETTS TURNPIKE
100Feet

7
II. EXISTING TRANSPORTATION CONDITIONS
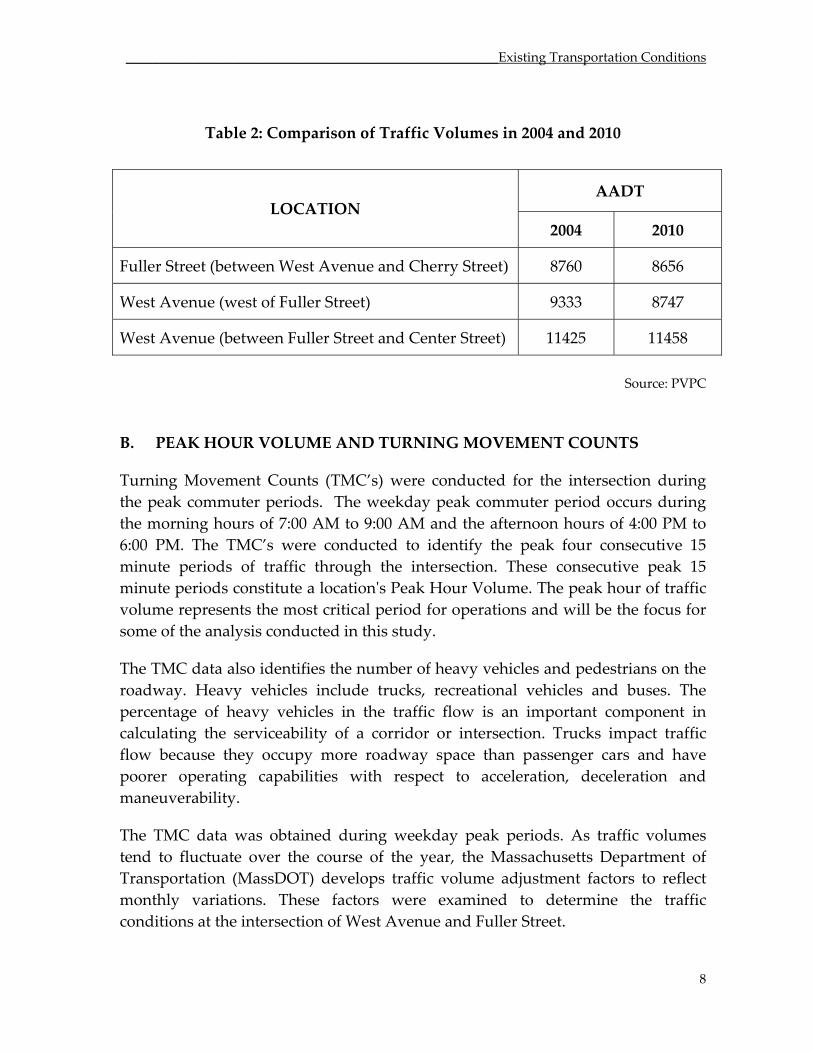
This section provides a technical evaluation of the transportation components for the intersection. It includes a presentation of the data collected, analysis of traffic operations, and a series of observations and conclusions derived from the analysis. A. AVERAGE DAILY TRAFFIC VOLUME Average Daily Traffic (ADT) volumes were compiled for a typical weekday at all three approaches of the intersection using Automatic Traffic Recorders (ATRs). All ADT volumes were factored to represent Average Annual Daily Traffic (AADT) using factors developed by the Massachusetts Department of Transportation (MassDOT). Table 1 identifies the AADT at these locations. The present traffic volumes on these streets were compared to the traffic volumes collected by PVPC in the calendar year 2004 to determine the growth in traffic over the period of last 6 years. Table 2 shows the comparison of the 2004 and 2010 traffic volumes. As seen from the table, overall the volume of traffic at this intersection has been constant between 2004 and 2010. There is a marginal decrease of approximately 6% on West Avenue west of Fuller Street.
Table 1: Average Annual Daily Traffic in 2010
Weekday Traffic LOCATION
NB/EB SB/WB TOTAL
Fuller Street (between West Avenue and Cherry Street) 4853 3803 8656
West Avenue (west of Fuller Street) 4895 3852 8747
West Avenue (between Fuller Street and Center Street) 5810 5648 11458
Source: PVPC
________________________________________________________Existing Transportation Conditions
8
Table 2: Comparison of Traffic Volumes in 2004 and 2010
AADT LOCATION
2004 2010
Fuller Street (between West Avenue and Cherry Street) 8760 8656
West Avenue (west of Fuller Street) 9333 8747
West Avenue (between Fuller Street and Center Street) 11425 11458
Source: PVPC
B. PEAK HOUR VOLUME AND TURNING MOVEMENT COUNTS
Turning Movement Counts (TMC’s) were conducted for the intersection during the peak commuter periods. The weekday peak commuter period occurs during the morning hours of 7:00 AM to 9:00 AM and the afternoon hours of 4:00 PM to 6:00 PM. The TMC’s were conducted to identify the peak four consecutive 15 minute periods of traffic through the intersection. These consecutive peak 15 minute periods constitute a locationʹs Peak Hour Volume. The peak hour of traffic volume represents the most critical period for operations and will be the focus for some of the analysis conducted in this study.
The TMC data also identifies the number of heavy vehicles and pedestrians on the roadway. Heavy vehicles include trucks, recreational vehicles and buses. The percentage of heavy vehicles in the traffic flow is an important component in calculating the serviceability of a corridor or intersection. Trucks impact traffic flow because they occupy more roadway space than passenger cars and have poorer operating capabilities with respect to acceleration, deceleration and maneuverability.
The TMC data was obtained during weekday peak periods. As traffic volumes tend to fluctuate over the course of the year, the Massachusetts Department of Transportation (MassDOT) develops traffic volume adjustment factors to reflect monthly variations. These factors were examined to determine the traffic conditions at the intersection of West Avenue and Fuller Street.
________________________________________________________Existing Transportation Conditions
9
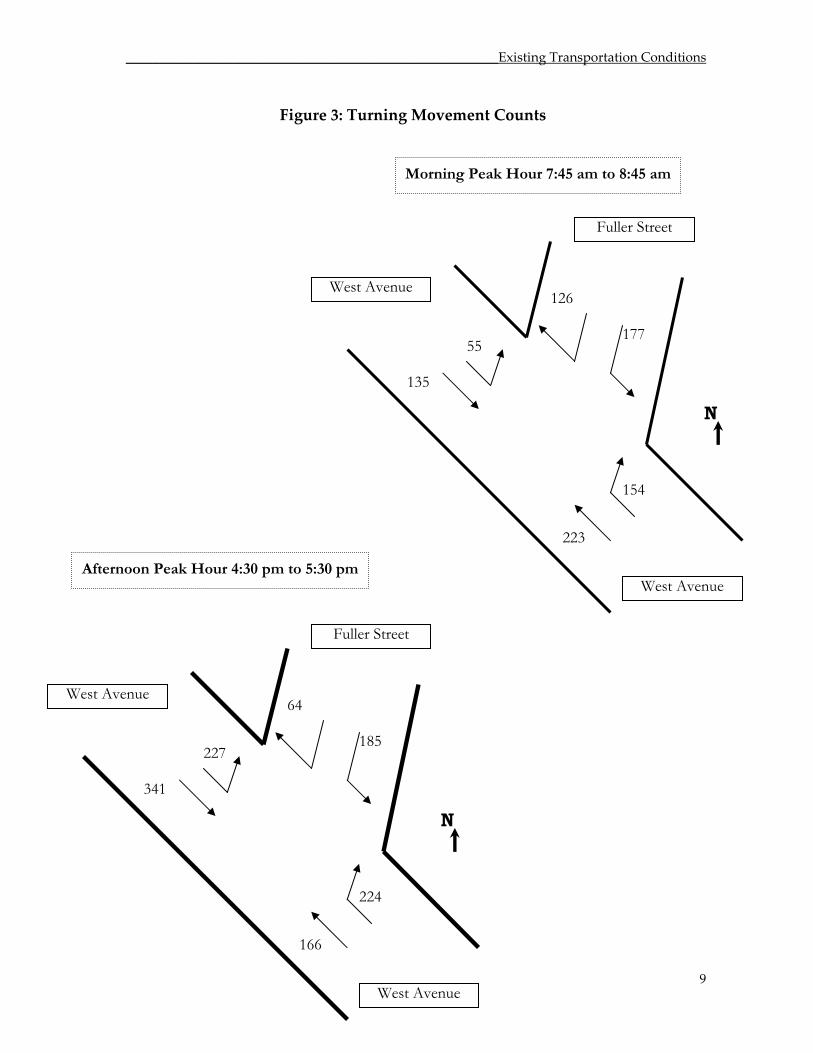
Figure 3: Turning Movement Counts
West Avenue
Fuller Street
West Avenue
N 135
55
126
177
223
154
West Avenue
Fuller Street
West Avenue
N 341
227
64
185
166
224
Morning Peak Hour 7:45 am to 8:45 am
Afternoon Peak Hour 4:30 pm to 5:30 pm

________________________________________________________Existing Transportation Conditions
10
It can be seen from the TMC diagrams that Fuller Street has a high approach traffic volume despite operating as the minor street. Most of the vehicles at this approach were observed to make a left turn onto West Avenue during the afternoon peak hour. C. SAFETY
To study safety, PVPC obtained the crash history of the intersection from the MassDOT crash data and the Ludlow Police Department. Actual crash reports were studied and analyzed to form a collision diagram of the intersection and identify patterns that could potentially contribute to the crashes in this area.
1. Crash Rate Analysis
A crash rate analysis was performed to compare the value at the intersection to the average value for MassDOT District 2 intersections. The crash rate per million entering vehicles was calculated. In theory, crash rates can increase as the traffic volume along the roadway increases or as the potential for conflict is increased. The crash rate per million entering vehicles takes into consideration the number of crashes at an intersection and the number of vehicles that enter the intersection over the course of an average day. Based on MassDOT data, the average crash rate for unsignalized intersections in District 2 is 0.67.
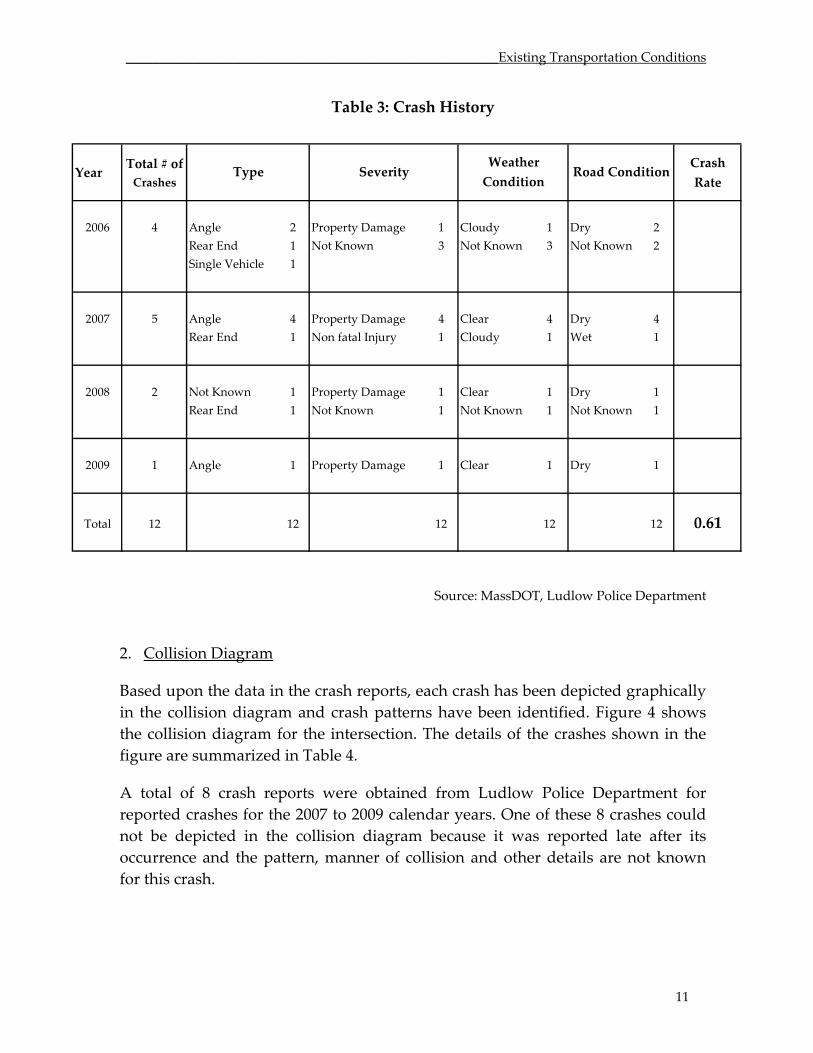
As shown in Table 3, the crash rate at the intersection of West Avenue and Fuller Street is 0.61 which is lower than the average value for other intersections of similar type in MassDOT District 2. This value indicates that the number of crashes occurring at this intersection is not higher than the number of crashes occurring at other similar intersections in the region when the volume of vehicles entering the intersection is taken into consideration.
A total of 12 crashes were recorded during the 2006 to 2009 calendar years. All the crashes resulted in minor property damage only. A mix of angle, rear end and single vehicle crashes was observed.
________________________________________________________Existing Transportation Conditions
11
Table 3: Crash History
Year Total # of Crashes
Crash Rate
2006 4 Angle 2 Property Damage 1 Cloudy 1 Dry 2Rear End 1 Not Known 3 Not Known 3 Not Known 2Single Vehicle 1
2007 5 Angle 4 Property Damage 4 Clear 4 Dry 4Rear End 1 Non fatal Injury 1 Cloudy 1 Wet 1
2008 2 Not Known 1 Property Damage 1 Clear 1 Dry 1Rear End 1 Not Known 1 Not Known 1 Not Known 1
2009 1 Angle 1 Property Damage 1 Clear 1 Dry 1
Total 12 12 12 12 12 0.61
Type SeverityWeather Condition
Road Condition
Source: MassDOT, Ludlow Police Department
2. Collision Diagram
Based upon the data in the crash reports, each crash has been depicted graphically in the collision diagram and crash patterns have been identified. Figure 4 shows the collision diagram for the intersection. The details of the crashes shown in the figure are summarized in Table 4.
A total of 8 crash reports were obtained from Ludlow Police Department for reported crashes for the 2007 to 2009 calendar years. One of these 8 crashes could not be depicted in the collision diagram because it was reported late after its occurrence and the pattern, manner of collision and other details are not known for this crash.

________________________________________________________Existing Transportation Conditions
12
Figure 4: Collision Diagram
N
West Avenue
Fuller Street
West Avenue
1,2,8
3
4,7
5
Parked Car
Angle Pedestrian
Rear End Side Swipe
Motorcycle Lane Change
Head-on
Out of Control
Traffic Flow
________________________________________________________Existing Transportation Conditions
13
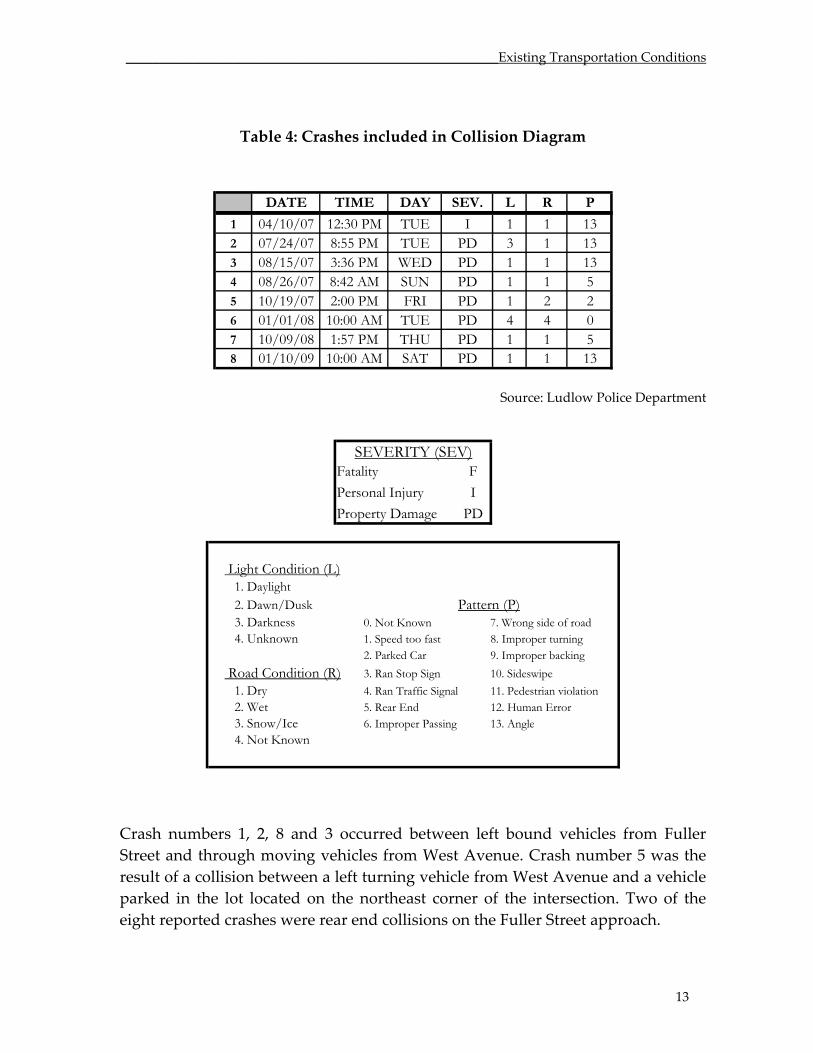
Table 4: Crashes included in Collision Diagram
DATE TIME DAY SEV. L R P
1 04/10/07 12:30 PM TUE I 1 1 132 07/24/07 8:55 PM TUE PD 3 1 133 08/15/07 3:36 PM WED PD 1 1 134 08/26/07 8:42 AM SUN PD 1 1 55 10/19/07 2:00 PM FRI PD 1 2 26 01/01/08 10:00 AM TUE PD 4 4 07 10/09/08 1:57 PM THU PD 1 1 58 01/10/09 10:00 AM SAT PD 1 1 13
Source: Ludlow Police Department
Fatality FPersonal Injury IProperty Damage PD
SEVERITY (SEV)
Light Condition (L) 1. Daylight 2. Dawn/Dusk 3. Darkness 0. Not Known 7. Wrong side of road 4. Unknown 1. Speed too fast 8. Improper turning
2. Parked Car 9. Improper backing Road Condition (R) 3. Ran Stop Sign 10. Sideswipe 1. Dry 4. Ran Traffic Signal 11. Pedestrian violation 2. Wet 5. Rear End 12. Human Error 3. Snow/Ice 6. Improper Passing 13. Angle 4. Not Known
Pattern (P)
Crash numbers 1, 2, 8 and 3 occurred between left bound vehicles from Fuller Street and through moving vehicles from West Avenue. Crash number 5 was the result of a collision between a left turning vehicle from West Avenue and a vehicle parked in the lot located on the northeast corner of the intersection. Two of the eight reported crashes were rear end collisions on the Fuller Street approach.

________________________________________________________Existing Transportation Conditions
14
D. LEVEL OF SERVICE ANALYSIS
The intersection was examined with regard to capacity and delay characteristics to determine the existing Level of Service (LOS). LOS is an indicator of the operating conditions which occur on a roadway under different volumes of traffic and is defined in the 2000 Highway Capacity Manual by six levels, ‘A’ through ‘F’. A number of operational factors can influence the LOS including geometry, travel speeds, delay, and the number of pedestrians. Table 5 presents the LOS designations for an unsignalized intersection.
Table 5: Level of Service (LOS) Designations for Unsignalized Intersections
Source: Highway Capacity Manual
Depending on the time of day and year, a roadway may operate at varying levels. Level of Service ‘A’ represents the best operating conditions and is an indicator of ideal travel conditions with vehicles operating at or above posted speed limits with little or no delays. Conversely, LOS ‘F’, or failure, generally indicates forced flow conditions illustrated by long delays and vehicle queues. Level of Service ‘C’ indicates a condition of stable flow and is generally considered satisfactory in rural areas. Under LOS ‘D’ conditions, delays are considerably longer than under LOS ‘C’, but are considered acceptable in urban areas. At LOS ‘E’ the roadway begins to operate at unstable flow conditions as the facility is operating at or near its capacity.
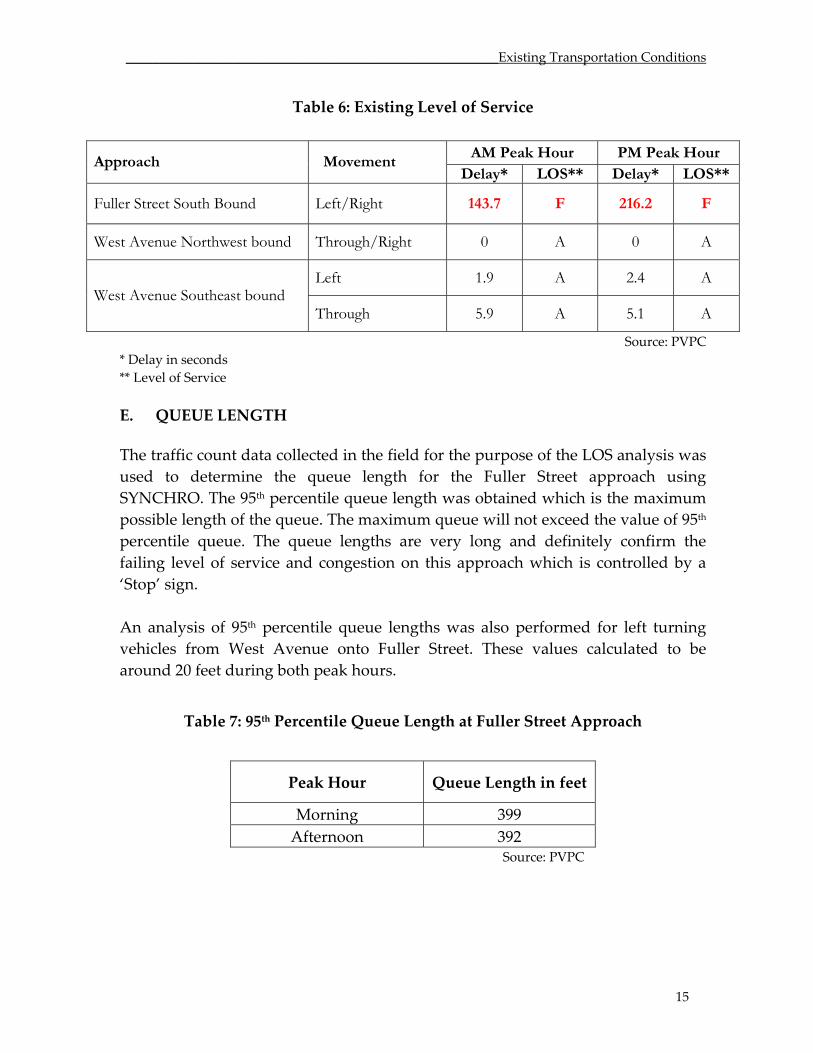
Table 6 shows that Fuller Street approach operates at LOS ‘F’ and has very large delays during both the morning and afternoon peak hours. Congestion problems were clearly evident along the Fuller Street approach at the time of the field inventory.
LOS Expected Delay To Minor Street Average Control Delay (s/veh) A Little or no delay 0.0 to 10.0 B Short traffic delays >10.0 to 15.0 C Average traffic delays >15.0 to 25.0 D Long traffic delays >25.0 to 35.0 E Very long delays >35.0 to 50.0 F Extreme delays >50.0
________________________________________________________Existing Transportation Conditions
15
Table 6: Existing Level of Service
Source: PVPC * Delay in seconds ** Level of Service E. QUEUE LENGTH The traffic count data collected in the field for the purpose of the LOS analysis was used to determine the queue length for the Fuller Street approach using SYNCHRO. The 95th percentile queue length was obtained which is the maximum possible length of the queue. The maximum queue will not exceed the value of 95th percentile queue. The queue lengths are very long and definitely confirm the failing level of service and congestion on this approach which is controlled by a ‘Stop’ sign. An analysis of 95th percentile queue lengths was also performed for left turning vehicles from West Avenue onto Fuller Street. These values calculated to be around 20 feet during both peak hours.
Table 7: 95th Percentile Queue Length at Fuller Street Approach
Peak Hour Queue Length in feet
Morning 399 Afternoon 392
Source: PVPC
AM Peak Hour PM Peak Hour Approach Movement
Delay* LOS** Delay* LOS**
Fuller Street South Bound Left/Right 143.7 F 216.2 F
West Avenue Northwest bound Through/Right 0 A 0 A
Left 1.9 A 2.4 A West Avenue Southeast bound
Through 5.9 A 5.1 A

________________________________________________________Existing Transportation Conditions
16
F. SIGNAL WARRANT ANALYSIS
The intersection of West Avenue with Fuller Street was analyzed to determine whether a traffic signal is required. The Manual on Uniform Traffic Control Devices (MUTCD) identifies eight different warrants to evaluate if an intersection meets the minimum requirements for signalization. One or more warrants must be satisfied to justify a traffic signal however engineering judgment dictates if an intersection warrants the installation of a signal. The installation of a traffic signal must improve the safety and operation of the location under study. Table 8 presents the results of the signal warrant analysis.
Of the eight total warrants for the installation of a traffic signal, Warrant 1 – Eight Hour Vehicular Volume is generally considered the most important as it requires minimum volumes to be met on both the major and minor streets for at least eight hours. Warrant 2 – Four Hour Vehicular Volume and Warrant 3 – Peak Hour Volume also requires minimum volumes to be met but over shorter timeframes. Warrant 7 – Crash Experience requires 80% of the volume requirements of Warrant 1 to be satisfied and at least 5 crashes of a type correctable through traffic signalization to have occurred over the last year. This warrant also requires that less restrictive remedies such as improved signage and pavement markings be tried and have failed to reduce crashes before a signal can be installed.
Table 8: Signal Warrant Analysis Results
Warrant Description Status
1 Eight Hour Volume Satisfied 2 Four Hour Volume Satisfied 3 Peak Hour Not Applicable 4 Pedestrian Volume Not Satisfied 5 School Crossing Not Applicable 6 Coordinated Signal System Not Applicable 7 Crash Experience Not Satisfied 8 Roadway Network Not Applicable
Source: PVPC The above table shows that the intersection fulfills the volume requirements to satisfy warrants 1 and 2 for installation of a signal assembly.

________________________________________________________Existing Transportation Conditions
17
PVPC examined the LOS for the intersection under traffic signal control. Operations were examined under an actuated‐uncoordinated 3 phase signal plan for both morning and afternoon peak hours. Table 9 presents the LOS designations for a signalized intersection and Table 10 presents the LOS obtained from the analysis of the intersection.
Table 9: LOS Designations for Signalized Intersections
Category Description Delay (in seconds)
LOS A Describes a condition of free flow, with low volumes and relatively high
speeds. There is little or no reduction in maneuverability due to the presence
of other vehicles and drivers can maintain their desired speeds. Little or no delays result for side street motorists.
< 10.0
LOS B Describes a condition of stable flow, with desired operating speeds relatively
unaffected, but with a slight deterioration of maneuverability within the traffic stream. Side street motorists experience short delays.
>10.0 to 20.0
LOS C Describes a condition still representing stable flow, but speeds and
maneuverability begin to be restricted. Motorists entering from side streets
experience average delays.
>20.0 to 35.0
LOS D Describes a high‐density traffic condition approaching unstable flow. Speeds and maneuverability become more restricted. Side street motorists may
experience longer delays.
>35.0 to 55.0
LOS E Represents conditions at or near the capacity of the facility. Flow is usually
unstable, and freedom to maneuver within the traffic stream becomes extremely difficult. Very long delays may result for side street motorists.
>55.0 to 80.0
LOS F Describes forced flow or breakdown conditions with significant queuing along
critical approaches. Operating conditions are highly unstable as characterized
by erratic vehicle movements along each approach.
> 80.0
Source: Highway Capacity Manual 2000
Table 10: LOS under Traffic Signal Control
Source: PVPC * Delay in seconds ** Level of Service
AM Peak Hour PM Peak Hour Approach Movement
Delay* LOS** Delay* LOS**
Fuller Street South Bound Left 13.0 B 12.3 B
West Avenue Northwest bound Through 7.7 A 4.8 A
West Avenue Southeast bound Left/Through 25.8 C 29.0 C

________________________________________________________Existing Transportation Conditions
18
The conditions at Fuller Street approach improve considerably from ‘LOS F’ to ‘LOS B’ under traffic signal control and the delay in the afternoon peak hour is reduced from more than 200 seconds to about 12 seconds. West Avenue southeast bound approach has some increase in delay but the approach ‘LOS C’ does not indicate any major congestion issues. G. MULTI‐WAY ‘STOP’ WARRANT ANALYSIS The intersection was also examined to determine whether a multi ‐ way ‘STOP’ sign control is warranted to improve safety and congestion at the intersection. The Manual on Uniform Traffic Control Devices (MUTCD) identifies four distinct criteria to evaluate if an intersection meets the minimum requirements for multi – way ‘STOP’ sign installation. The First criterion warrants the multi – way ‘STOP’ installation as an interim measure at intersections where traffic control signals are warranted. Criterion 2, similar to Warrant 7 for crashes in a signal warrant analysis requires the intersection to have five or more reported crashes in 12 month period that are susceptible to correction by the multi – way ‘STOP’. The third criterion sets minimum volume requirements for major street and minor street approaches. Criterion four is met if the requirements in both criteria two and three are satisfied to 80% of the minimum values. Table 11 shows the results of the multi – way ‘STOP’ warrant analysis for the intersection of West Avenue with Fuller Street.
Table 11: Multi‐Way ‘STOP’ Warrant Analysis Results
Criterion Description Status 1 Interim Measure Can be Considered 2 Crash Warrant Not Satisfied
Condition 1: Major Street Volume MET Condition 2: Minor Street Combined Volume MET 3 Higher Speed on Major Street Approaches N.A.*
Satisfied
4 80% of Minimum Requirements Not Satisfied Source: PVPC
* N. A. = Not Applicable As can be seen from the above table, the intersection also satisfies the volume criteria for the installation of a multi – way ‘STOP’ sign.
PVPC examined the LOS for the intersection under multi‐way ‘STOP’ sign control to compare the delays with the operations of the traffic signal control. Table 12 presents the LOS at the intersection under ‘STOP’ sign control for all three approaches.
________________________________________________________Existing Transportation Conditions
19
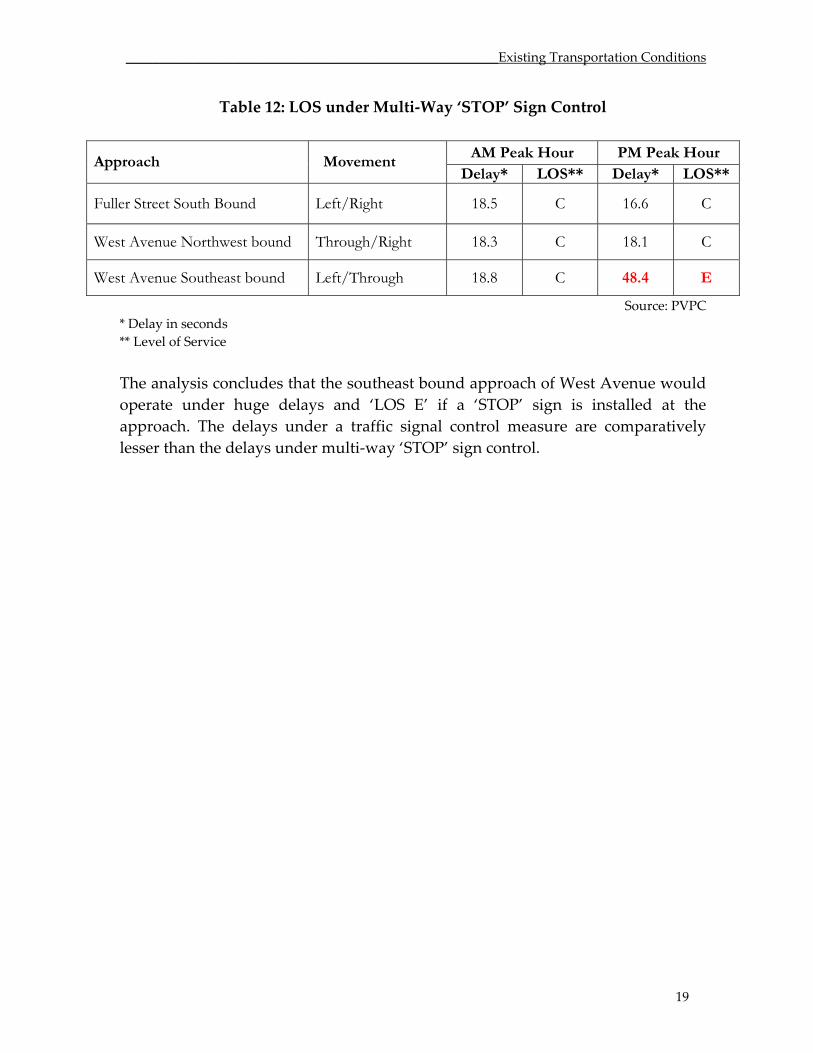
Table 12: LOS under Multi‐Way ‘STOP’ Sign Control
Source: PVPC * Delay in seconds ** Level of Service The analysis concludes that the southeast bound approach of West Avenue would operate under huge delays and ‘LOS E’ if a ‘STOP’ sign is installed at the approach. The delays under a traffic signal control measure are comparatively lesser than the delays under multi‐way ‘STOP’ sign control.
AM Peak Hour PM Peak Hour Approach Movement
Delay* LOS** Delay* LOS**
Fuller Street South Bound Left/Right 18.5 C 16.6 C
West Avenue Northwest bound Through/Right 18.3 C 18.1 C
West Avenue Southeast bound Left/Through 18.8 C 48.4 E

20
III. RECOMMENDATIONS
The intersection of West Avenue with Fuller Street is characterized by high traffic volumes and an unusual geometry that contribute to long delays on Fuller Street. The following short term recommendations have been made to improve transportation conditions at the intersection.
A. PAVEMENT MARKINGS
Pavement markings in the vicinity of intersection have faded and need to be repainted. The use of white pavement edge lines would help to define the northeast corner of the intersection. Right turning traffic from West Avenue onto Fuller Street presently performs this maneuver at high speeds, because of the absence of curbing and pavement edge lines. It is recommended that the Town of Ludlow consider repainting the markings and pavement edge lines for all the approaches at this intersection.
B. GEOMETRY AND CURBING Fuller Street intersects at an acute angle with West Avenue limiting sight distance to the northwest. It is recommended that the Town of Ludlow talk to the property owners to discuss potential measures such as change to the existing landscaping that could improve sight distance in this area. An unrestricted driveway on the northeast corner of the intersection contributes to confusion in this area and encourages drivers to turn right from West Avenue onto Fuller Street at high speeds. The absence of curbing has also resulted in the deterioration of the pavement in this location. It is recommended that the Town of Ludlow consider reducing the existing curve radius and installing granite curbing in this area to prevent further damage to the pavement and define driveway entry and exit points. Figures 5 and 6, show two different alternatives of changing the geometry of the intersection and defining the right turn lane for the vehicles turning right from West Avenue approach. It is recommended that the Town of Ludlow consider undertaking an engineering study to determine the suitability and feasibility of each alternative to improve the existing intersection geometry.

21
Figure 5: Proposed Curbing and Driveway Improvements

22
Figure 6: Proposed Turning Lane separated by an Island
23
C. REGULATORY AND WARNING SIGNS The existing regulatory sign that prohibits heavy vehicles from making right turns onto West Avenue would be more affective if it were supplemented with a written plaque. The Manual on Uniform Traffic Control Devices (MUTCD), 2009 Edition gives guidelines for selective exclusion signs in Section 2B.39 on page 76. It is recommended that the Town of Ludlow consider examining the necessity of installing an additional sign at this location. ‘Intersection Ahead’ warning signs are recommended for both approaches of West Avenue to the intersection to alert drivers of the approaching intersection. D. TRAFFIC SIGNAL WARRANTS The intersection of West Avenue and Fuller Street meets the minimum volume requirements for installation of a multi ‐ way ‘Stop’ and also for the installation of a traffic signal. The delays under a traffic signal control measure are comparatively lesser than the delays under multi‐way ‘STOP’ sign control. It is recommended that Town of Ludlow consider undertaking an engineering study to examine the feasibility of installing a signal at the intersection in near future to reduce congestion on Fuller Street and to improve transportation conditions at that location. It is also recommended that the Town consider examining the impact of the signal at this intersection on the congestion along Center Street corridor which is one of the moderately congested corridors of the Pioneer Valley region.