transport and traffic summary technical analysis
TRANSCRIPT

Appendix ETransport and traffic summary
technical analysis


COASTCONNECT: CALOUNDRA TO MAROOCHYDORE
TRANSPORT & TRAFFIC
SUMMARY – TECHNICAL ANALYSIS
JULY 2009

COAST CONNECT TRANSPORT & TRAFFIC
SUMMARY – TECHNICAL ANALYSIS
Status: Draft 004: Project Number A1080200
BUILDING A BETTER WORLD 1 www.m whg loba l . com.au
CONTENTS COASTCONNECT - CALOUNDRA TO MAROOCHYDORE TRANSPORT AND TRAFFIC SUMMARY TECHNICAL ANALYSIS
1.� INTRODUCTION 2�
2.� REGIONAL TRANSPORT NETWORK MODELLING 8�
3.� LOCAL AREA MODELLING 11�
4.� VALIDATION 13�
5.� FORECASTING OUTPUTS 18�
6.� TRAVEL DEMAND MANAGEMENT 26�
7.� CONCLUSIONS 27�
FIGURES
Figure 1-1: CoastConnect Corridor and Related Projects 4�
Figure 3-1: Extent of Vissim Model 12�
Figure 4-1: Private Vehicle Travel Time Routes and Validation Results 14�
Figure 5-1: Travel Time Statistics (Average 2 hour Morning Peak) 18�
Figure 5-2: Selected Key Corridors 24 Hour Mode Share results by direction by year 21�
Figure 5-3: Travel Time Statistics (AM Peak Hour) 22� TABLES Table 1-1: Summary Descriptions for Modelled Scenarios 7�
Table 4-1: 24 Hour Screenline Validation Results 13�
Table 4-2: Public Transport Validation Results 14�
Table 4-3: Validation Criteria 15�
Table 4-4: GEH Compliance Criteria 16�
Table 4-5: Bus Travel Time Validation (Northbound) 17�
Table 4-6: Bus Travel Time Validation (Southbound) 17�
Table 5-1: Total Person Trips 19�
Table 5-2: Level of Service Definitions 23�
Table 5-3: Intersection Performance 2016 24�
Table 5-4: Intersection Performance 2026 25�

COAST CONNECT TRANSPORT & TRAFFIC
SUMMARY – TECHNICAL ANALYSIS
Status: Draft 004: Project Number A1080200
BUILDING A BETTER WORLD 2 www.m whg loba l . com.au
1. INTRODUCTION MWH and PB were commissioned by both TransLink, and the Department of Transport and Main Roads to undertake the transport modelling associated with the CoastConnect: Caloundra to Maroochydore Quality Bus Corridor project. The purpose of the modelling is to inform the design process and to assess the project impacts and its feasibility. The modelling is used to inform the Concept Design Impact Management Plan (CDIMP) and was designed to meet the requirements of the Terms of Reference. The purpose of the CDIMP is to describe the proposed project infrastructure and document a preliminary analysis of the project’s likely benefits and potential impacts. This allows the identification of local issues to ensure they are able to be managed appropriately in the future. The CDIMP will be submitted to the Queensland Government for assessment and possible approval. Once approved, the alignment will be preserved for future staged delivery, subject to funding. This document is supplementary to the CDIMP documents, and summarises the findings of the detailed reports including:
a) The Regional Transport Network - Model Development Report April 2009 b) The Local Transport Network - Micro-simulation Vissim Model Report March 2009
1.1 BACKGROUND CoastConnect: Caloundra to Maroochydore is an important part of the Queensland Government’s long-term plan to meet the transport needs of the fast-growing Sunshine Coast by providing faster and more reliable public transport options. The CoastConnect project builds upon the TransLink Network Plan and has been allocated State Government funds in the South East Queensland Infrastructure Plan and Program (2008). Between 2007 and 2031, the Sunshine Coast’s population is expected to increase by up to 84% requiring the construction of approximately 98,500 dwellings. Furthermore, the tourism industry is expected to continue to play an integral part in the local economy, with the region attracting more than eight million visitors during 2007; 63% of whom were domestic day visitors. This massive growth in population and tourism on the Sunshine Coast means more cars, more congestion and more pollution. This puts pressure on the region, the transport system and the Sunshine Coast way of life. Which is why it is important to plan for improved public transport – to provide a balanced system and ensure the Sunshine Coast remains a great place to live, work and play. 1.2 THE PROJECT CoastConnect is a State Government initiative to help manage traffic congestion, in the face of large growth pressures, and make public transport fast, frequent and reliable between Caloundra and Maroochydore. To make public transport an attractive alternative to car travel, a mix of priority measures such as dedicated bus lanes, transit lanes and traffic light priority for buses at congested intersections, will be considered. Stretching from Cooma Terrace Caloundra to Horton Parade Maroochydore, the corridor follows 2 alternate alignments for ultimate bus service operations and maximum passenger coverage; one on the suburban network along the coast line, and the other slightly inland using higher order roads, including the motorway where possible, for express routes.

COAST CONNECT TRANSPORT & TRAFFIC
SUMMARY – TECHNICAL ANALYSIS
Status: Draft 004: Project Number A1080200
BUILDING A BETTER WORLD 3 www.m whg loba l . com.au
This project proposes a mixture of infrastructure improvements to suit different parts of the coast, including:
• Bus lanes – a dedicated lane for buses and emergency vehicles • Bus queue bypasses – an additional length of lane to enable buses to
bypass the traffic waiting at traffic lights • Dedicated on-road cycle lanes • Bus stations in key activity areas • Bus stop upgrades
These improvements will make bus travel on the Sunshine Coast faster, easier and more reliable than ever before. For further details on the project corridor design, please refer to Figure 1-1: CoastConnect Corridor and Related Projects.

COAST CONNECT TRANSPORT & TRAFFIC
SUMMARY – TECHNICAL ANALYSIS
Status: Draft 004: Project Number A1080200
BUILDING A BETTER WORLD 4 www.m whg loba l . com.au
Figure 1-1: CoastConnect Corridor and Related Projects

COAST CONNECT TRANSPORT & TRAFFIC
SUMMARY – TECHNICAL ANALYSIS
Status: Draft 004: Project Number A1080200
BUILDING A BETTER WORLD 5 www.m whg loba l . com.au
1.3 PROJECT NEED
The Sunshine Coast is one of the fastest growing regions in Australia, with the average annual growth rate for 2006 to 2026 predicted to be around 2.4%. In 2007, the estimated resident population of the Sunshine Coast Regional Council area was 303,050 people. In 2031, the projected population is expected to be as high as 558,880 people. The study area is expected to continue its rapid growth as the coastal communities at Caloundra, Kawana Town Centre, Mooloolaba, Alexandra Headland and Maroochydore accommodate increased urban densities. The Sunshine Coast Regional Council has identified the need for higher densities around the major centres and these precincts are a prime market for public transport. With an increased number of commuters to the west of the corridor, future demand for bus travel will be amplified. This massive growth brings with it the need to move more people more efficiently between the key centres of Caloundra, Kawana, Mooloolaba and Maroochydore. Preliminary analysis of bus operations along the corridor shows that elements of the existing bus network are at capacity or not operating to their full capability. This includes the Sunshine Plaza, Kawana Shoppingworld and Caloundra bus stations. There are a number of key congestion points and the standard of stops and shelters along the corridor can be improved. The option to do nothing will see this congestion increase in the future even with the addition of future road projects in the region. The principal challenge for the region is to manage this growth in ways that will sustain the Sunshine Coast’s lifestyle. Better public transport will ensure the Sunshine Coast keeps moving, improve mobility for those without ready access to a car, and cater for the increasing number of people who are choosing to travel in a more sustainable way. As the Sunshine Coast continues to grow, the resulting increase in cars and congestion present the risk of Nicklin Way, Brisbane Road, Alexandra Parade and Aerodrome Road, grinding to a halt. The bus lanes along Nicklin Way, transit lanes along Brisbane Road and the bus priority at intersections along Alexandra Parade and Aerodrome Road are designed to make sure this doesn’t negatively impact future bus travel. CoastConnect – Caloundra to Maroochydore will ensure that no matter how congested these roads become in the future, buses will have a level of priority that will provide the community with a high-quality public transport option. The CoastConnect – Caloundra to Maroochydore project provides a cost effective public transport solution that can be delivered in stages over the short-to-medium term and build upon the existing bus system. It is important to plan public transport networks ahead of population and employment growth to ensure future development occurs in a sustainable way. The CoastConnect – Caloundra to Maroochydore project has been planned to be built and opened in stages over the short-to-medium term. Planning for the entire corridor is being undertaken now to identify and protect the land needed for the project. Planning for the project now will help minimise potential impacts in the future and ensure the project is well integrated as the Sunshine Coast continues to grow and develop.
COAST CONNECT TRANSPORT & TRAFFIC
SUMMARY – TECHNICAL ANALYSIS
Status: Draft 004: Project Number A1080200
BUILDING A BETTER WORLD 6 www.m whg loba l . com.au
1.4 SCOPE
The scope of this report includes: • An overview of the strategic and local model structures used, and its relationship to the
Sunshine Coast Transport Forecasting Model (SCTFM), developed in Emme/2 • Documentation of the key inputs and assumptions for the modelling methodology • A description of the trip generation and trip distribution models (contained in the SCTFM)
and the mode choice and trip assignment models built into Visum • A description of the key validation criteria guidelines used and the performance of the base
model results against the parameters • A list of assumptions used for the future year base models including road and public
transport projects, demographics and public transport service assumptions • A series of strategic model outputs for both Public Transport and Private vehicles to
describe the key characteristics of the network with and without the project • Model outputs from the micro-simulation modelling to specify the operating conditions of the
transport network with and without the project 1.5 METHODOLOGY Travel demand forecasting was required as part of the design process for the CoastConnect project CDIMP. A strategic transport model was available for the Sunshine Coast, known as the Sunshine Coast Transport Forecasting Model (SCTFM). As part of this project, a methodology and process was developed to provide a linkage between the existing SCTFM model, and the new Visum based Sunshine Coast Multi-Modal Model designed specifically for the CoastConnect project. SCTFM (Version 2) was road based whereas Visum is multi-modal to more accurately reflect mode choice for public transport users. The strategic modelling process involved the use of stated preference surveys to calculate the mode choice parameters that affect the choice of mode based on a perceived cost of travel. These parameters are calibrated to existing current survey network statistics recorded for the base year. Future year models include assumptions on new infrastructure improvements, including the project, and projections of the demographic profiles for the region that reflect the changes in population, employment and education. A Technical Working Group (TWG) was established with stakeholders from government planning departments to advise on the development of the models and their assumptions. In principle, agreement was received from the TWG based on the models ability to be “fit for purpose” for the requirements of the project. Results of the strategic model include both network wide and high level corridor specific statistics. These results are commensurate with the scale and nature of the strategic model. For a more detailed assessment of the project corridor; its operating performance and impacts on the road network, a local area micro-simulation model was developed in Vissim. This model used the trip origin and destination matrix from the strategic model to inform its demand matrix. Performance statistics at an intersection level have been used from the Vissim model with further refinement using Sidra; a specialist intersection modelling package.

COAST CONNECT TRANSPORT & TRAFFIC
SUMMARY – TECHNICAL ANALYSIS
Status: Draft 004: Project Number A1080200
BUILDING A BETTER WORLD 7 www.m whg loba l . com.au
1.6 MODEL DESCRIPTION The traffic forecasting and traffic analysis applications applied in this study used computer-based models to forecast road traffic demand based on land use (in the form of demographic descriptors), travel characteristics, road infrastructure and public transport services. Modelling was undertaken for the following spatial areas:
• The Regional Transport Network, including the entire Sunshine Coast Region • The Local Area Network, including the project corridor and its intersecting streets
Strategic modelling of the regional transport network was undertaken using model packages; Emme/2 and Visum. Local area network modelling for the corridor was undertaken using Vissim and Sidra. Combined, the modelling packages provide the necessary data required to address the requirements of the Terms of Reference. The following years were modelled:
• 2006: The base year for validation • 2016: CoastConnect notional year of opening • 2026: 10 years post-opening horizon
�The following time periods were modelled for the various model years:
• AM peak: 7am – 9am • PM peak: 4pm – 6pm • Day time off peak: 9am – 4pm (Visum only) • Night time off peak: 6pm – 7am (Visum only)
Year Reference Name Summary Description
2006 2006 Base The existing network and current bus services as of the year 2006.
2016 2016 Do Minimum (with MMTC)
Additional road and public transport projects/services to 2016 as per current government planning including the MMTC project with 2 lanes, CAMCOS to Caloundra, no change to Brisbane Road, modified on/off ramps to Queens Road and excluding the CoastConnect project.
2016 2016 Do Something
Additional road and public transport projects/services to 2016 as per current government planning including the MMTC with 2 lanes, CAMCOS to Caloundra, modified on/off ramps to Queens Road & including CoastConnect projects and the Brisbane Road upgrade (SCRC).
2026 2026 Do Minimum
Additional road and public transport projects/services to 2026 as per current government planning including the MMTC project with 2 lanes, CAMCOS to Maroochydore, no change to Brisbane Road, modified on/off ramps to Queens Road and excluding the CoastConnect project.
2026 2026 Do Something
Additional road and public transport projects/services to 2026 as per current government planning including the MMTC with 2 lanes, CAMCOS to Maroochydore, modified on/off ramps to Queens Road & CoastConnect projects and the Brisbane Road upgrade (SCRC).
Table 1-1: Summary Descriptions for Modelled Scenarios
COAST CONNECT TRANSPORT & TRAFFIC
SUMMARY – TECHNICAL ANALYSIS
Status: Draft 004: Project Number A1080200
BUILDING A BETTER WORLD 8 www.m whg loba l . com.au
2. REGIONAL TRANSPORT NETWORK MODELLING
2.1 STRATEGIC MODEL STRUCTURE
The existing Sunshine Coast Transport Forecasting Model (SCTFM) version 2, developed in Emme/2 is structured as a traditional “4 step” model. However, it contains a set of mode split factors rather than a mode choice model. To maintain consistency with this model, minimise duplication of effort and to maximise the functions of the Emme/2 and Visum packages, it was decided to construct the new strategic model (CMQBCM) as follows:
• Trip generation and trip distribution in Emme/2 then exporting the person-trip matrices to Visum; and
• Importing person-trip matrices into Visum and building mode choice and trip assignment modules within this package
The mode choice and trip assignment modelling was undertaken in Visum as it provides the following advantages:
• Very detailed public transport and private vehicle travel pattern output statistics • An interface directly with the Vissim simulation modelling package • Allows model parameters to be modified relatively easily within a new “clean” model
structure which does not have to be manipulated to fit the existing structure of the SCTFM version 2 Emme/2 model
The following strategic modelling components were used in the development of the CoastConnect Visum model.
2.2 MODEL INPUTS
The following key strategic model inputs are used in the model:
• Demographics: Demographic data was sourced from each of the local authorities for each proposed forecast year. Where available, preference was given to the use of each Council’s Local Growth Management Strategy (LGMS) projections. The final demographic data set used was based on a 2007 projection prior to local government amalgamations and was endorsed by the TWG.
• Road Networks: The latest SCTFM version 2 Emme/2 model road networks were used as the basis for the modelled road network. Road networks for years up to 2026 were based on SEQIPP, Council’s infrastructure plans, and TransLink’s public transport infrastructure plans. Key Assumptions on the assumed road infrastructure can be viewed in Table 1-1: Summary Descriptions for Modelled Scenarios
• Public Transport Networks and Services: The public transport network was developed and built based on information from TransLink for the base network. Future public transport services were based on the TransLink Network Plan and TransLink’s Public Transport Network Strategy for 2016 and 2026.
• Traffic Zoning System: The geographical extents of the modelled traffic zones are the same as applied in SCTFM. The internal zones boundaries represent the combined extent of Caloundra City Council, Maroochy Shire Council and Noosa Shire Council now amalgamated as the Sunshine Coast Regional Council (SCRC).
• Mode Choice Parameters: Parameters for the modelling were developed from a combination of the Stated Preference surveys recently undertaken as part of this project. The final parameters were validated to known data.
COAST CONNECT TRANSPORT & TRAFFIC
SUMMARY – TECHNICAL ANALYSIS
Status: Draft 004: Project Number A1080200
BUILDING A BETTER WORLD 9 www.m whg loba l . com.au
• Assignment Parameters: The delays on links and delays on turns are added for each route path available for each origin to destination and these travel times are included in the equilibrium assignment calculations.
2.3 TRIP GENERATION The process, whereby the total number of trips to and from individual traffic zones is calculated, is referred to as Trip Generation. This is the first of the major steps that constitute any four-step transportation model. The trip generation process used in the CMQBCM has been undertaken as per the original SCTFM version 2. 2.4 TRIP DISTRIBUTION The Trip Distribution used in the modelling process has been adopted from the SCTFM version 2 model to keep consistency in the four-step modelling process. The form of the trip distribution sub-model implemented in SCTFM is a “Gravity” Model. Within this sub-model, the number of trips between two zones is proportional to the total number of trips ends (trip productions and attractions) and inversely proportional to the cost of travel between the zones. 2.5 MODE CHOICE The Mode Choice Model has been developed and adapted from the findings of the Sunshine Coast Model Development Stated Preference Survey Data Analysis Report produced by Bitzios Consulting for TransLink. A Stated Preference Survey was carried out relating specifically to the different choices people may make when deciding between different types of public transport and private vehicle use. The Public Transport Captives Model was developed using demographic data for the year 2006. Public transport captives include those persons that do not own a vehicle or do not have a current driver’s license and are, therefore, reliant on public transport for all trip making purposes.
2.6 TRIP ASSIGNMENT The Public Transport Trip Assignment Model allocates trips to alternative public transport paths based on the relative costs of these paths. “Conventional bus” costs have been used as the basis for deriving the relative costs of other public transport modes as well as for the access and egress components of the public transport trip. The standards defined by the Stated Preference Survey have been adopted for the CDIMP. 2.7 DWELL TIME FUNCTIONS The dwell times (i.e. the time that a bus spends at a stop to serve passengers) used in the 2006 Validated Base Model for bus and heavy rail are expressed as:
• Dwell per bus (s) = 5s x boardings per service + 1.5s x alightings per service + 5s
clearance time; and • Heavy passenger rail = 15 seconds
2.8 PUBLIC TRANSPORT ASSIGNMENT PROCEDURE
The “headway-based” assignment technique has been used to accommodate the modelling of future year scenarios where timetable based scheduling is not available. A pseudo ‘timetable’ is calculated using headways, dwell times and bus travel times on modelled links.

COAST CONNECT TRANSPORT & TRAFFIC
SUMMARY – TECHNICAL ANALYSIS
Status: Draft 004: Project Number A1080200
BUILDING A BETTER WORLD 10 www.m whg loba l . com.au
2.9 TRAFFIC ASSIGNMENT PARAMETERS & PROCEDURES
As with the current Emme/2 SCTFM assignment method, linked based delays are calculated on volume to capacity relationships.

COAST CONNECT TRANSPORT & TRAFFIC
SUMMARY – TECHNICAL ANALYSIS
Status: Draft 004: Project Number A1080200
BUILDING A BETTER WORLD 11 www.m whg loba l . com.au
3. LOCAL AREA MODELLING
3.1 LOCAL MODEL STRUCTURE
Local area modelling was undertaken in the Vissim software package. This was chosen for its seamless interaction with Visum. Vissim allows detailed investigations of signalised intersections and vehicle interaction through sophisticated simulation techniques. This enables an accurate assessment of the operating impacts of new infrastructure under future traffic conditions. Vissim models have been developed for the AM and PM Peak Periods for the years 2006, 2016 and 2026. Refer to Figure 3-1: Extent of Vissim Model.
• Data Sources: The base year Vissim model network was developed using aerial photography to develop the existing road network in 2006
• Signalised Intersection Data: Intersection layouts and traffic signal timings for the 2006 base year were obtained from the Department of Main Roads and the Sunshine Coast Regional Council
• Demand Matrices: The demand matrices for the Vissim model were provided as cordon matrices from the regional Visum model. The cordon matrices were for a two-hour period in both the morning and evening peak periods
• Traffic Count Data: Traffic counts were used to calibrate and validate the base model. • Public Transport Networks and Services: Three sources of travel time data were used
to inform the validation of bus travel time in the model. The first source was the timetable for the services. A second source of travel time data was the bus travel time data; as obtained from the Queensland Transport travel time surveys in August 2005. The third source is the actual travel time data from 28 August 2008 to 1 October 2008, as derived from the on-vehicle ticketing system
• Project Design Plans: The design plans were used to amend the base model road geometry to replicate the future corridor design with the project

COAST CONNECT TRANSPORT & TRAFFIC
SUMMARY – TECHNICAL ANALYSIS
Status: Draft 004: Project Number A1080200
BUILDING A BETTER WORLD 12 www.m whg loba l . com.au
Figure 3-1: Extent of Vissim Model

COAST CONNECT TRANSPORT & TRAFFIC
SUMMARY – TECHNICAL ANALYSIS
Status: Draft 004: Project Number A1080200
BUILDING A BETTER WORLD 13 www.m whg loba l . com.au
4. VALIDATION 4.1 STRATEGIC MODELLING REGIONAL TRANSPORT NETWORK
VALIDATION The process of validation according to the Australian Transport Council Guidelines is used to ensure modelled results are consistent with observed data such as traffic counts, travel times and ticketing information. The validation process is undertaken to ensure the model is fit for purpose for the project and model type. To establish if the regional model is fit-for purpose the validation process assessed the following data: • Traffic: 24hr Screenline data and travel times • Travel Times: Private vehicle travel time • Public Transport: Ticketing information and travel times (Bus)
4.1.1 24 HOUR SCREENLINE RESULTS
The criteria used as a guideline to satisfy TransLink’s validation requirements was based on Land Transports NZ Economic Evaluation manual – Volume 1. Based on the guidelines outlined, the results of the validation process achieved a desirable level of validation for private vehicle and public transport travel. This level of validation meets the criteria considered appropriate for the CoastConnect study therefore the model is deemed ‘fit for purpose’ for use in the CDIMP and business case analysis. Table 4-1: 24 Hour Screenline Validation Results (below) shows the summary of the 24 Hour screenline validation results.
Validation Data Validation Criteria Desired Result Achieved Result
24 hr. Screenline Counts
Absolute Difference (AD)
For links < 700 vehicles per day in each direction�
At Least 85% of flows have an AD of + or - 100%
80%
AD For links > 700 and < 2700 vehicles per day in each direction
At Least 85% of flows have an AD of + or – 20%
100%
AD For links > 2700 vehicles per day in each direction
At Least 85% of flows have an AD of + or – 20%
100%
MAD All Links At Least 85% meet above criteria
86%
Individual Link
GEH < 5.0
At least 60% 76%
Individual Link
GEH < 10.0
At least 95% 96%
Individual Link
GEH < 12.0
All 100%
Screenline
GEH < 4.0
Most Cases 89%
Table 4-1: 24 Hour Screenline Validation Results

COAST CONNECT TRANSPORT & TRAFFIC
SUMMARY – TECHNICAL ANALYSIS
Status: Draft 004: Project Number A1080200
BUILDING A BETTER WORLD 14 www.m whg loba l . com.au
4.1.2 TRAVEL TIME VALIDATION RESULTS A graphical analysis, showing the average, minimum, maximum and the 95th percentile confidence intervals of the observed travel time runs, was used to ensure modelled travel times between links were consistent by peak period and direction. A summary of the outputs displayed in Figure 4-1: Private Vehicle Travel Time Routes and Validation Results, shows the combined travel time for each direction, by each period aggregated for the total travel time on each route.
0
500
1000
1500
2000
Tim
e (s
ecs)
37 38 39 40 41 42Route
Combined travel times for each direction for each period
Min Max
Av Model
���������� �������������������������������������������������� � !�"����������#��$�%"�������&��'"�(������)��
Figure 4-1: Private Vehicle Travel Time Routes and Validation Results The average travel time for all routes falls in the lower half of the observed maximum and minimum travel times. Noting this, all total-route modelled travel times fall within, or are very close to, one standard deviation above and below the mean of observed travel times. This provides further confidence in addition to the adopted criteria, that the model is validated and performing as expected with regards to private vehicle travel times. 4.1.3 TICKETING RESULTS Route 600 is considered to be an important route to validate as it currently travels along the corridor. It should be noted that the comparison of each time period on Route 600 returns a GEH statistic of less than 3. This result provides a high level of confidence in the models ability to simulate the actual travel times recorded by buses on the corridor. Table 4-2: Public Transport Validation Results, shows public transport ticketing validation.
Validation Data Validation Criteria Desired Result Achieved Result
PuT Ticketing Data by Period Converted to hourly flow for each period (required for GEH Statistic)
Individual Count (GEH < 5.0) At least 60% 79%
Individual Count (GEH < 10.0) At least 95% 97%
Individual Count (GEH < 12.0) All 100% 100%
Table 4-2: Public Transport Validation Results

COAST CONNECT TRANSPORT & TRAFFIC
SUMMARY – TECHNICAL ANALYSIS
Status: Draft 004: Project Number A1080200
BUILDING A BETTER WORLD 15 www.m whg loba l . com.au
4.2 LOCAL AREA MODELLING VALIDATION The Vissim model was calibrated using available datasets including:
• Travel times along the corridor • Traffic volumes on side streets • Traffic volumes on the main corridor
4.2.1 VALIDATION CRITERIA
The validation criteria used are based on The Department of Main Roads adopted validation criteria for micro-simulation projects. Table 4-3: Validation Criteria (below) outlines the relevant validation criteria used.
Criteria Target
Link Flows The modelled hourly flows for individual links are to be: • Within 100 vehicles/hour of the counted hourly flow for links with
flow less than 700 vehicles/hour, or • Within 15% of the counted hourly flow for links with flow between
700 and 2,700 vehicles/hour, or • Within 400 vehicles/hour of the counted hourly flow for links with a
flow greater than 2,700 vehicles/hour The modelled hourly flows for the sum of all links are to be within 5%
GEH Statistics GEH statistics: • Must be less than 5 for individual link flows for greater than 85% of
cases • Must be less than 4 for sum of all link counts
Travel times for selected routes
Median time relative to observed should be within 10%
Model stability Total screenline variation between maximum and minimum values to be within 5% based on 5 different random seed values.
Others A visual check of the model must be completed to ensure that the model operates in accordance with the existing network and without any unforeseen complications or anomalies.
Table 4-3: Validation Criteria 4.2.2 VALIDATION PROCESS The validation process used in adjusting the 2006 AM and PM matrices to more closely replicate the observed traffic counts was a matrix balancing technique. Matrix balancing aims to re-distribute traffic volumes at an Origin and Destination level for each trip. Where appropriate, the observed traffic volumes at the external zones of the model were used as fixed trip end totals This process resulted in the majority of the external zones matching the required validation criteria. The validation was undertaken individually for the model covering the CoastConnect corridor south of the Sunshine Motorway (Southern Model) and the model covering the CoastConnect

COAST CONNECT TRANSPORT & TRAFFIC
SUMMARY – TECHNICAL ANALYSIS
Status: Draft 004: Project Number A1080200
BUILDING A BETTER WORLD 16 www.m whg loba l . com.au
corridor north of the Sunshine Motorway (Northern Model). The model was split for ease of development. The Visum strategic model cordon for the 2006 base year was compared to observed traffic volumes. Observed link flows on side streets at intersections with the CoastConnect corridor were compared to the volumes at the external zones from the Visum strategic model. 4.2.3 LINK FLOWS AND GEH CRITERIA Mid-block traffic volumes along the corridor were compared to observed traffic volumes. The models all comply with the GEH criteria, see Table 4-4: GEH Compliance Criteria, below:
GEH Northern Model Southern Model
AM model PM model AM model PM model
<12 100% 100% 100% 100%
<10 100% 100% 100% 100%
<5 100% 85% 95% 85%
Table 4-4: GEH Compliance Criteria Based on the results from Table 4-4: GEH Compliance Criteria it is evident that the model is performing in accordance with the required model calibration standard (i.e. all values are either 85% or better). The results provide confidence that the model is validated and performing as expected.
4.2.4 PRIVATE VEHICLE TRAVEL TIMES
A comparison of the observed travel times and the travel time output from Vissim was also performed to validate the model. The analyses indicate that the modelled travel times are within 10% of the observed travel times. This achieves the required calibration standard of 10% or less.
4.2.5 BUS TRAVEL TIMES
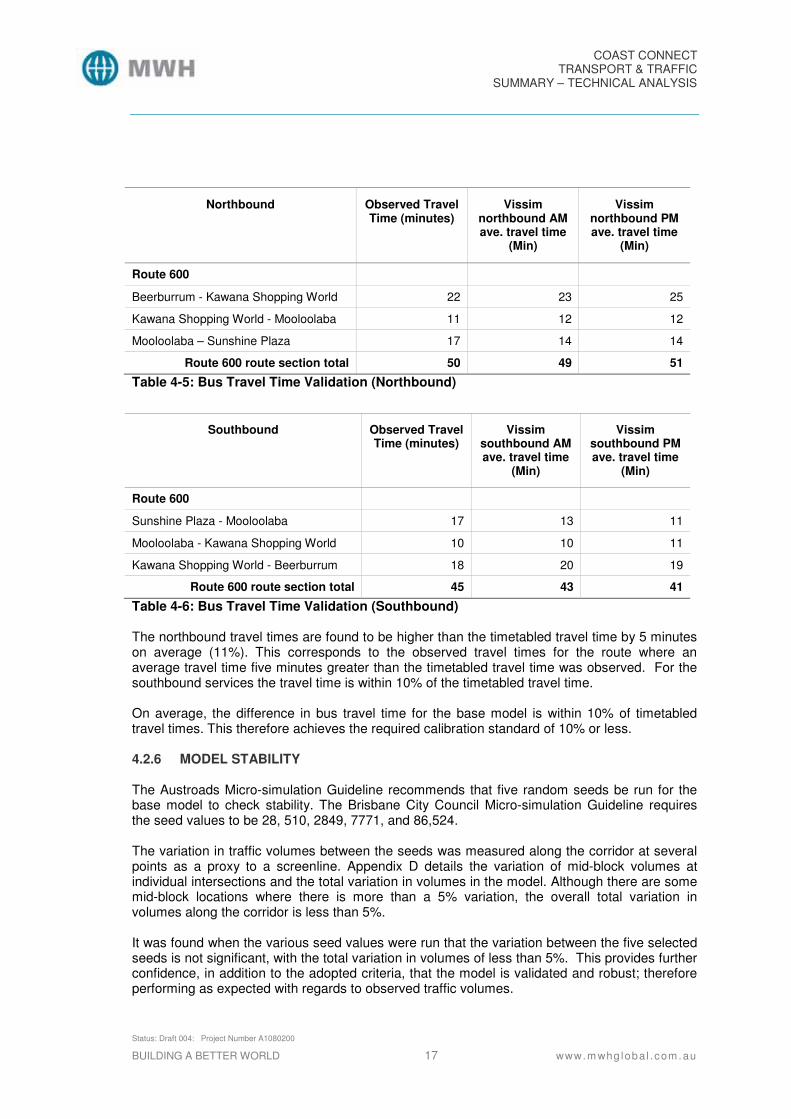
The Vissim model travel time for the bus services was determined based on the average travel time for bus services along the corridor. Since the Vissim model did not cover the full length of the bus routes, the travel times for sections covered in the model were validated against timetabled travel times for route 600 which runs along most of the length of the modelled CoastConnect corridor. Average travel times for the northbound and southbound services were compared to the timetabled travel time for the morning and evening peak hours in Table 4-5: Bus Travel Time Validation (Northbound) and Table 4-6: Bus Travel Time Validation (Southbound), overleaf.
COAST CONNECT TRANSPORT & TRAFFIC
SUMMARY – TECHNICAL ANALYSIS
Status: Draft 004: Project Number A1080200
BUILDING A BETTER WORLD 17 www.m whg loba l . com.au
Northbound Observed Travel Time (minutes)
Vissim northbound AM ave. travel time
(Min)
Vissim northbound PM ave. travel time
(Min)
Route 600
Beerburrum - Kawana Shopping World 22 23 25
Kawana Shopping World - Mooloolaba 11 12 12
Mooloolaba – Sunshine Plaza 17 14 14
Route 600 route section total 50 49 51
Table 4-5: Bus Travel Time Validation (Northbound)
Southbound Observed Travel Time (minutes)
Vissim southbound AM ave. travel time
(Min)
Vissim southbound PM ave. travel time
(Min)
Route 600
Sunshine Plaza - Mooloolaba 17 13 11
Mooloolaba - Kawana Shopping World 10 10 11
Kawana Shopping World - Beerburrum 18 20 19
Route 600 route section total 45 43 41
Table 4-6: Bus Travel Time Validation (Southbound) The northbound travel times are found to be higher than the timetabled travel time by 5 minutes on average (11%). This corresponds to the observed travel times for the route where an average travel time five minutes greater than the timetabled travel time was observed. For the southbound services the travel time is within 10% of the timetabled travel time. On average, the difference in bus travel time for the base model is within 10% of timetabled travel times. This therefore achieves the required calibration standard of 10% or less. 4.2.6 MODEL STABILITY The Austroads Micro-simulation Guideline recommends that five random seeds be run for the base model to check stability. The Brisbane City Council Micro-simulation Guideline requires the seed values to be 28, 510, 2849, 7771, and 86,524. The variation in traffic volumes between the seeds was measured along the corridor at several points as a proxy to a screenline. Appendix D details the variation of mid-block volumes at individual intersections and the total variation in volumes in the model. Although there are some mid-block locations where there is more than a 5% variation, the overall total variation in volumes along the corridor is less than 5%. It was found when the various seed values were run that the variation between the five selected seeds is not significant, with the total variation in volumes of less than 5%. This provides further confidence, in addition to the adopted criteria, that the model is validated and robust; therefore performing as expected with regards to observed traffic volumes.

COAST CONNECT TRANSPORT & TRAFFIC
SUMMARY – TECHNICAL ANALYSIS
Status: Draft 004: Project Number A1080200
BUILDING A BETTER WORLD 18 www.m whg loba l . com.au
5. FORECASTING OUTPUTS Results of the strategic modelling process across the transport network have been reported for both a ‘With Project’ and a ‘Without Project’ scenario by an analysis of:
• Travel times on the corridor for both private vehicles and buses • Overall public transport patronage and mode share figures • Global Network statistics including Vehicle Kilometres Travelled (VKT), Vehicle Hours
Travelled (VHT), and Person Kilometres Travelled (PKT) 5.1 STRATEGIC REGIONAL NETWORK MODEL RESULTS
5.1.1 TRAVEL TIME STATISTICS
Travel times provide an indication of the corridor performance and the benefits provided by the priority infrastructure treatments. Limitations in the strategic model operating parameters generally result in an underestimation of intersection delays. As a result, travel times are expected to be slightly lower than the micro-simulation modelling in Vissim over the full corridor. Although both models have been validated to surveyed travel times, the variance is considered to be reasonable over the 22km corridor, as variations are to be expected with day to day differences in traffic volumes, congestion and dwell times experienced by the buses. Figure 5-1: Travel Time Statistics (below) demonstrates the travel time for the corridor as a comparison of private and public transport for each modelled year. The travel time routes are taken from the AM Peak period (as an average travel time across 2 hours) from Caloundra to Maroochydore (northbound) at an approximate distance of 22km. The specific routes include:
• Bus (Route 600): Follows the entire CoastConnect corridor and includes estimated dwell times
• Car (Corridor): The average travel times for all cars on links that follow the entire CoastConnect corridor
Figure 5-1: Travel Time Statistics (Average 2 hour Morning Peak)
COAST CONNECT TRANSPORT & TRAFFIC
SUMMARY – TECHNICAL ANALYSIS
Status: Draft 004: Project Number A1080200
BUILDING A BETTER WORLD 19 www.m whg loba l . com.au
Travel time results indicate that, on average during the 2 hour morning peak northbound, there is a 20% to 30% reduction in bus travel times in 2026, with the CoastConnect Project between Caloundra and Maroochydore. Private vehicle travel times along the corridor in 2016 were also marginally reduced, however by a much smaller amount, only 2.5% in the northbound direction. This minimal reduction would be due to the introduction of the MMTC into the network and the re-distribution of traffic across the network reducing slightly the congestion on the corridor. In 2026, car travel times along the CoastConnect corridor in the peak period, between Caloundra and Maroochydore, increase marginally by 3% in the northbound direction. This indicates that the general level of congestion on the corridor has increased. 5.1.2 REGIONAL TRAVEL STATISTICS The results of a comparative analysis between the base and option, for 2026, indicate a minor decrease in the amount of private vehicle trips by 0.22% across the overall network. The trend in public transport is an increase in total person trips by 4.2%. Other key findings from the region wide network statistics include:
• Total vehicle trips increase from 702,000 to 1,097,000 from 2006 to 2026 • Total public transport trips increase from 25,000 to 58,000 • Total public transport person trips increase by 1.3% between base and option models
for 2016, and by 4.2% in 2026 • Public Transport Kilometres travelled in 2026 increase by 6% with the project
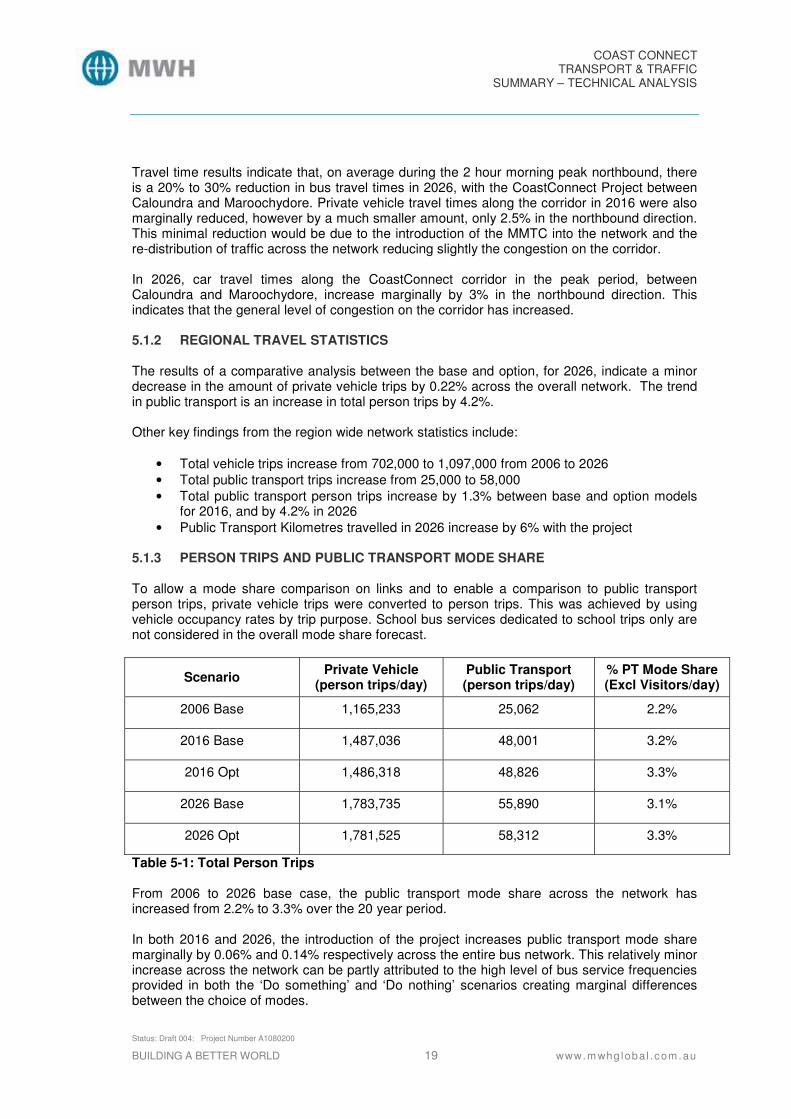
5.1.3 PERSON TRIPS AND PUBLIC TRANSPORT MODE SHARE To allow a mode share comparison on links and to enable a comparison to public transport person trips, private vehicle trips were converted to person trips. This was achieved by using vehicle occupancy rates by trip purpose. School bus services dedicated to school trips only are not considered in the overall mode share forecast.
Scenario Private Vehicle (person trips/day)
Public Transport (person trips/day)
% PT Mode Share (Excl Visitors/day)
2006 Base 1,165,233 25,062 2.2%
2016 Base 1,487,036 48,001 3.2%
2016 Opt 1,486,318 48,826 3.3%
2026 Base 1,783,735 55,890 3.1%
2026 Opt 1,781,525 58,312 3.3%
Table 5-1: Total Person Trips From 2006 to 2026 base case, the public transport mode share across the network has increased from 2.2% to 3.3% over the 20 year period. In both 2016 and 2026, the introduction of the project increases public transport mode share marginally by 0.06% and 0.14% respectively across the entire bus network. This relatively minor increase across the network can be partly attributed to the high level of bus service frequencies provided in both the ‘Do something’ and ‘Do nothing’ scenarios creating marginal differences between the choice of modes.
COAST CONNECT TRANSPORT & TRAFFIC
SUMMARY – TECHNICAL ANALYSIS
Status: Draft 004: Project Number A1080200
BUILDING A BETTER WORLD 20 www.m whg loba l . com.au
The modest gains in public transport mode share are generally a result of large background growth in population and increased trip generation coupled with the addition of road capacity in the network. This project results in a large increase in the reliability and efficiency of the public transport system and is likely to translate into a greater acceptance and attraction of the public to travel by bus. As the public gains confidence in the choice to use public transport as a viable alternative to the private motor vehicle, the mode share is likely to increase beyond the predicted levels.
To supplement the information supplied, a diagrammatic representation of 5 key locations has been illustrated as
Figure 5-2: Selected Key Corridors 24 Hour Mode Share results by direction by year. Although the regional mode share increases are minor, the corridor specific results indicate a higher shift towards public transport. For example, at Aerodrome Road north of Maud Street in Maroochydore, public transport mode share compared to 2006 has increased from 5% to 10%, with the project in 2016 in the southbound direction. At Alexandra Parade north of Buderim Street, public transport mode share increased from 12% to 17% from 2006 to 2016, in the northbound direction. This demonstrates the benefits of the public transport priority increase in the project corridor and the potential for increasing public transport trips. The modelled trend demonstrates a drop in the mode share in 2026 on particular sections of the corridor due to the return of private vehicles to the corridor. This demand was removed with the introduction of the MMTC in 2016 but as it reaches its capacity new trips in 2026 are diverted back to the project corridor. This trend correlates only to the patronage percentage and not the magnitude of public transport users as they continue to rise. The application of additional Travel Demand Measures would further enhance the attraction of public transport trips to major activity centres and encourage an increase in patronage. National and international experience suggests that modest gains in relative travel time when coupled with improvements in reliability and frequency can translate to significant shifts in public transport mode share. The modelling process is based on current trends and surveyed perception of mode choice parameters. While every attempt is made in the model to predict the shift in public perception in the future, and capture the future land use and employment growth with the introduction of the project, it is anticipated that the parameters may underestimate the mode shift to public transport. Recent figures for Brisbane’s South East Busway patronage levels support the fact that actual patronage figures were well in excess of the modelled forecast figures produced in the project assessment process.

COAST CONNECT TRANSPORT & TRAFFIC
SUMMARY – TECHNICAL ANALYSIS
Status: Draft 004: Project Number A1080200
BUILDING A BETTER WORLD 21 www.m whg loba l . com.au
Figure 5-2: Selected Key Corridors 24 Hour Mode Share results by direction by year
COAST CONNECT TRANSPORT & TRAFFIC
SUMMARY – TECHNICAL ANALYSIS
Status: Draft 004: Project Number A1080200
BUILDING A BETTER WORLD 22 www.m whg loba l . com.au
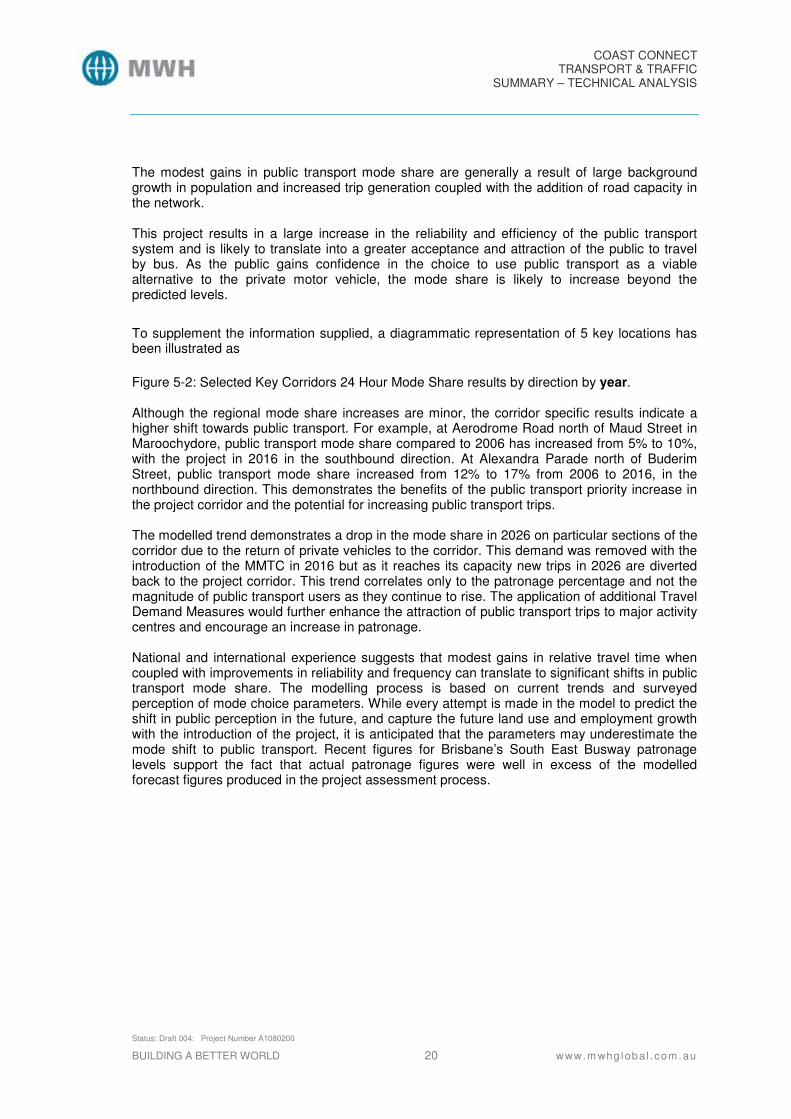
5.2 LOCAL AREA MODELLING RESULTS The impact of the CoastConnect corridor on morning peak hour travel times for cars and buses was measured in the Vissim model of the corridor. Figure 5-3: Travel Time Statistics details the travel times recorded from the Vissim model along the CoastConnect Corridor for buses and general traffic.
Figure 5-3: Travel Time Statistics (AM Peak Hour) Bus travel times in the morning peak hour improve by more than 20% due to the CoastConnect corridor. The full benefit of the corridor is realised when the corridor becomes congested. This can be seen when comparing the travel time savings realised in 2016 and 2026. The benefits of the CoastConnect project, in terms of improved travel times for public transport passengers, will only increase over time with increased traffic congestion. The impact on general traffic of the proposed CoastConnect corridor is limited south of the Sunshine Motorway. Along much of the corridor the project mostly provides priority to public transport without removing capacity for general traffic. The impact on general traffic is therefore limited in the modelled years. In the short term, one of the benefits of the Quality Bus Corridor will be the ability for buses to bypass congestion caused by incidents and accidents. This has not been modelled in the Vissim model. 5.2.1 INTERSECTION PERFORMANCE To supplement the regional and corridor statistics, five major intersections along the corridor have been analysed in detail to assess the level of performance as a result of the project. This analysis will provide an indication of the level of congestion experienced by vehicles travelling the corridor and the impact of the project on intersection operating performance. The degree of congestion for general roadways is often described using a traffic performance indicator called Level of Service (LOS), where links and intersections are rated A to F depending on the traffic operations. LOS is defined as a qualitative measure describing operational conditions within a traffic stream and describes these conditions in terms of factors such as speed and travel time, traffic interruptions, comfort and convenience, and safety.

COAST CONNECT TRANSPORT & TRAFFIC
SUMMARY – TECHNICAL ANALYSIS
Status: Draft 004: Project Number A1080200
BUILDING A BETTER WORLD 23 www.m whg loba l . com.au
Definitions for levels of service are described in Table 5-2: Level of Service Definitions: Level of Service Example Description
A
Free Flow Free flow in which individual drivers are not affected by the presence of others in the traffic stream.
B
Reasonably Free Flow Stable flow with reasonable freedom to select desired speed and to manoeuvre.
C
Stable Flow Still stable flow, but most drivers are restricted in their freedom to select desired speed and to manoeuvre.
D
Approaching Unstable Flow Close to the limit of stable flow and approaching unstable flow. All drivers are severely restricted in choosing desired speed and to manoeuvre.
E
Unstable Flow Traffic volume is close to capacity with virtually no freedom to select desired speed or to manoeuvre.
F
Forced or Breakdown Flow Forced traffic flow or flow breakdown occurs and queuing and excessive delays result.
Table 5-2: Level of Service Definitions

COAST CONNECT TRANSPORT & TRAFFIC
SUMMARY – TECHNICAL ANALYSIS
Status: Draft 004: Project Number A1080200
BUILDING A BETTER WORLD 24 www.m whg loba l . com.au
Within urban areas, congestion is more readily experienced at intersections than at mid-block sections of streets. Intersection performance can be measured by:
• Level of service (LOS), based on average delays • Degree of saturation (DOS), which is the proportion of traffic entering the intersection
relative to the intersection capacity • Average Delay in seconds
Table 5-3: Intersection Performance demonstrates the findings of the intersection analysis for five major intersections on the corridor both with and without the project for 2006 and 2016.
2006 2016 Without CoastConnect
2016 With CoastConnect
Intersection Period LOS DOS Average Delay LOS DOS Average
Delay LOS DOS Average Delay
Nicklin Wy. Pt.
Cartwright, Marawa St.
AM C 0.83 34 D 0.71 35.8 D 0.94 26.3
PM D 1.00 48 D 0.82 39.4 D 0.95 28.8
Nicklin Wy, Main Dr,
Wyanda Dr.
AM C 1.00 35 D 1.00 36.6 B 0.75 15.8
PM C 1.00 33 E 1.00 75.5 B 0.67 14.3
Nicklin Wy, Palkana Dr,
Kawana Island Blvd.
AM D 1.00 40 D 1.00 40.3 D 1.00 38.8
PM D 1.00 49 D 1.00 41.4 D 1.00 41.8
Nicklin Wy, Erang St.
AM C 1.00 20 F 1.00 129.3 B 1.00 16.6
PM B 1.00 16 F 1.00 120.5 B 1.00 17.5
Nicklin Wy, Lake Kawana
Blvd. (W)
AM E 1.00 57 D 1.00 49.3 D 1.00 46.7
PM B 0.76 12 D 1.00 50 D 1.00 39.3
Table 5-3: Intersection Performance 2016

COAST CONNECT TRANSPORT & TRAFFIC
SUMMARY – TECHNICAL ANALYSIS
Status: Draft 004: Project Number A1080200
BUILDING A BETTER WORLD 25 www.m whg loba l . com.au
Table 5-4: Intersection Performance 2026 demonstrates the findings of the intersection analysis for five major intersections on the corridor both with and without the project for 2006 and 2026.
2006 2026 Without CoastConnect
2026 With CoastConnect
Intersection Period LOS DOS Average Delay LOS DOS Average
Delay LOS DOS Average Delay
Nicklin Wy. Pt.
Cartwright, Marawa St.
AM C 0.83 34 C 0.71 29.0 D 0.92 30.6
PM D 1.00 48 C 0.86 34.2 F 1.00 7.7
Nicklin Wy, Main Dr,
Wyanda Dr.
AM C 1.00 35 C 0.75 27.4 C 0.55 21.3
PM C 1.00 33 D 0.96 43.6 C 0.78 22.1
Nicklin Wy, Palkana Dr,
Kawana Island Blvd.
AM D 1.00 40 F 1.00 109.9 C 0.95 26.3
PM D 1.00 49 E 1.00 70.5 D 1.00 41.0
Nicklin Wy, Erang St.
AM C 1.00 20 C 1.00 34.8 B 0.99 17.0
PM B 1.00 16 C 1.00 28.5 B 1.00 16.8
Nicklin Wy, Lake Kawana
Blvd. (W)
AM E 1.00 57 E 1.00 63.1 D 0.96 37.6
PM B 0.76 12 C 0.90 25.2 C 0.90 25.8
Table 5-4: Intersection Performance 2026
In summary the introduction of the project has been achieved with negligible impacts on the overall intersection performance. In the majority of scenarios the intersection performance has improved with the proposed works resulting in an overall benefit to the network.

COAST CONNECT TRANSPORT & TRAFFIC
SUMMARY – TECHNICAL ANALYSIS
Status: Draft 004: Project Number A1080200
BUILDING A BETTER WORLD 26 www.m whg loba l . com.au
6. TRAVEL DEMAND MANAGEMENT Travel Demand Management (TDM) policies are aimed at influencing travel demand without the provision of major infrastructure. To support the CoastConnect Project, a number of TDM strategies have been identified to ensure the investment in CoastConnect realises its maximum potential. The following key strategy areas are reviewed in detail; Car Parking, Road Capacity and Efficiency, Bus Network Improvements, Public Transport Fare Structure: Business Travel Plans, Travel Awareness and Promotion, and Land Use Structure. The key objectives of the proposed TDM strategy are to:
• Facilitate growth in public transport patronage across the Sunshine Coast • Reduce the dependence on private vehicles trips along the CoastConnect corridor • Increase regulation on parking within key activity centres along the CoastConnect
corridor • Support other road network policies to encourage more efficient use of available road
capacity • Contribute to growth of business and the tourism industry • Provide a high degree of social acceptability to residents and visitors • Ensure collaborative involvement in TDM implementation between State and Local
Government, businesses and individuals • Provide a framework for monitoring and ensuring TDM measures are responsive to
changing needs The recommendations on TDM strategies do not represent Government policy. The investigation is intended to inform any future study that any Government organisation may instigate and recommend feasible options for future scenario testing in the Visum model developed for the CoastConnect project.
COAST CONNECT TRANSPORT & TRAFFIC
SUMMARY – TECHNICAL ANALYSIS
Status: Draft 004: Project Number A1080200
BUILDING A BETTER WORLD 27 www.m whg loba l . com.au
7. CONCLUSIONS The Sunshine Coast is one of the fastest growing regions in Australia, with the average annual growth rate for 2006 to 2026 predicted to be around 2.4%. This massive growth in population and tourism on the Sunshine Coast means more cars, more congestion and more pollution. This puts pressure on the region, the transport system and the Sunshine Coast way of life. Which is why it is important to plan for improved public transport – to provide a balanced system and ensure the Sunshine Coast remains a great place to live, work and play. With the introduction of CoastConnect, the public transport mode share across the network will increase from 2.2% to 3.3%. On the project corridor there are higher shifts towards public transport. For example at Aerodrome Road north of Maud Street in Maroochydore, public transport mode share compared to 2006 has increased from 5% to 10%. At Alexandra Parade north of Buderim Street, public transport mode share increased from 12% to 17% from 2006 to 2016. Travel time results for the route 600 bus service with the CoastConnect Project between Caloundra and Maroochydore indicate that there are potential savings of 20% to 30% across the morning peak period compared to the ‘Do nothing’ cases. Private vehicle travel times along the CoastConnect corridor in the 2026 peak period between Caloundra and Maroochydore increase marginally by 3% in the northbound direction. Travel times in 2016 were however marginally reduced by 2.5% in the northbound direction. Across the region the project will result in an increase in person trips travelled on public transport of 4.15% demonstrating its ability to attract new passengers with increased reliability and improved efficiency. Trends on the corridor and to major activity centres show a greater increase in mode share statistics. Passenger kilometres travelled by bus will also increase by 6% and passenger hours travelled increase by around 4%. The results of the modelling process demonstrate the benefits of the public transport priority treatments on the project corridor. The CoastConnect project creates increased reliability and improved efficiency in the corridor and will increase the number of public transport trips, particularly for shorter trips involving major activity centres.