translating excellence in science into customer benefit0223e7d8-82b0-4df1-9e1e-87... ·...
TRANSCRIPT
Translating excellence in science into customer benefit
Dr. K. Mahler: Head of Investor Relations
Dr. Stefan Frings: Global Product Strategy (HER 2 Franchise Leader)
September 2009
2
This presentation contains certain forward-looking statements. These forward-looking statements
may be identified by words such as ‘believes’, ‘expects’, ‘anticipates’, ‘projects’, ‘intends’, ‘should’,
‘seeks’, ‘estimates’, ‘future’ or similar expressions or by discussion of, among other things, strategy,
goals, plans or intentions. Various factors may cause actual results to differ materially in the future
from those reflected in forward-looking statements contained in this presentation, among others:
1 pricing and product initiatives of competitors;
2 legislative and regulatory developments and economic conditions;
3 delay or inability in obtaining regulatory approvals or bringing products to market;
4 fluctuations in currency exchange rates and general financial market conditions;
5 uncertainties in the discovery, development or marketing of new products or new uses of existing products, including without limitation negative results of clinical trials or research projects, unexpected side-effects of pipeline or marketed products;
6 increased government pricing pressures;
7 interruptions in production
8 loss of or inability to obtain adequate protection for intellectual property rights;
9 litigation;
10 loss of key executives or other employees; and
11 adverse publicity and news coverage.
Any statements regarding earnings per share growth is not a profit forecast and should not be interpreted to mean that Roche’s earnings or earnings per share for this year or any subsequent period will necessarily match or exceed the historical published earnings or earnings per share of Roche.
For marketed products discussed in this presentation, please see full prescribing information on our website –www.roche.com
All mentioned trademarks are legally protected

3
Performance up-date
Strategy
Summary
4
CHF bn
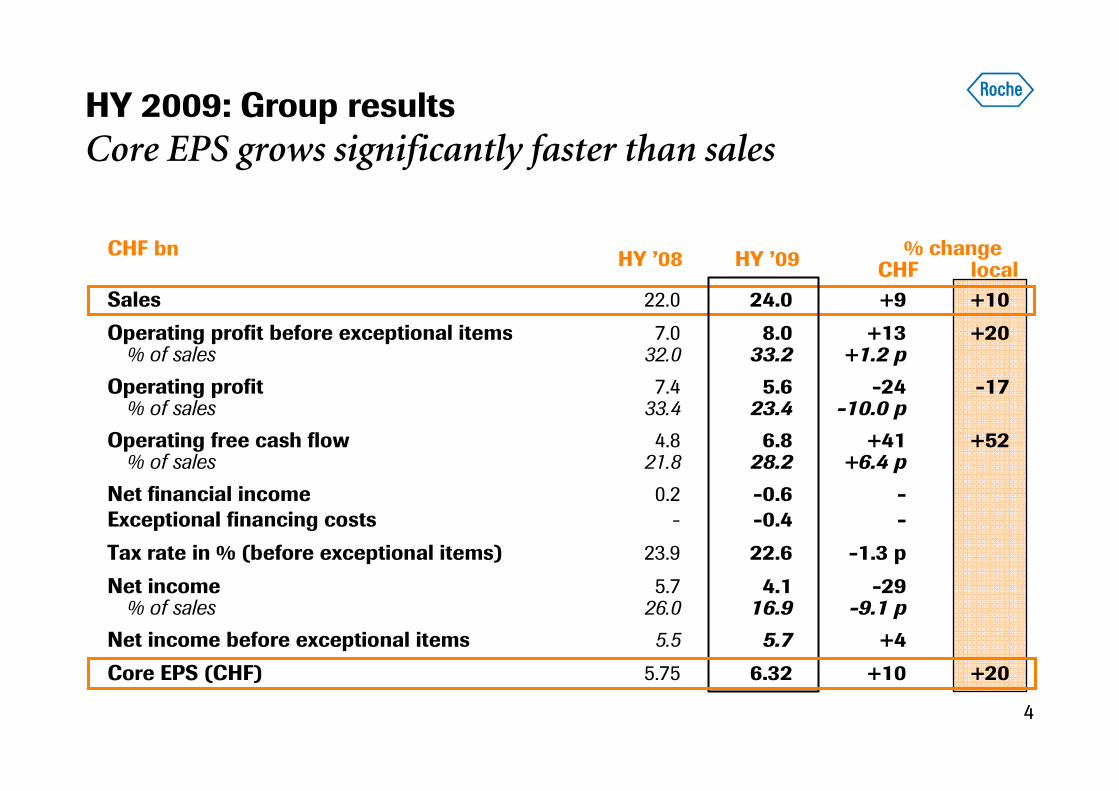
Sales 22.0 24.0 +9 +10
Operating profit before exceptional items 7.0 8.0 +13 +20% of sales 32.0 33.2 +1.2 p
Operating profit 7.4 5.6 -24 -17% of sales 33.4 23.4 -10.0 p
Operating free cash flow 4.8 6.8 +41 +52% of sales 21.8 28.2 +6.4 p
Net financial income 0.2 -0.6 -Exceptional financing costs - -0.4 -
Tax rate in % (before exceptional items) 23.9 22.6 -1.3 p
Net income 5.7 4.1 -29% of sales 26.0 16.9 -9.1 p
Net income before exceptional items 5.5 5.7 +4
Core EPS (CHF) 5.75 6.32 +10 +20
HY 2009: Group results
Core EPS grows significantly faster than sales
HY ’08% change
CHF localHY ’09
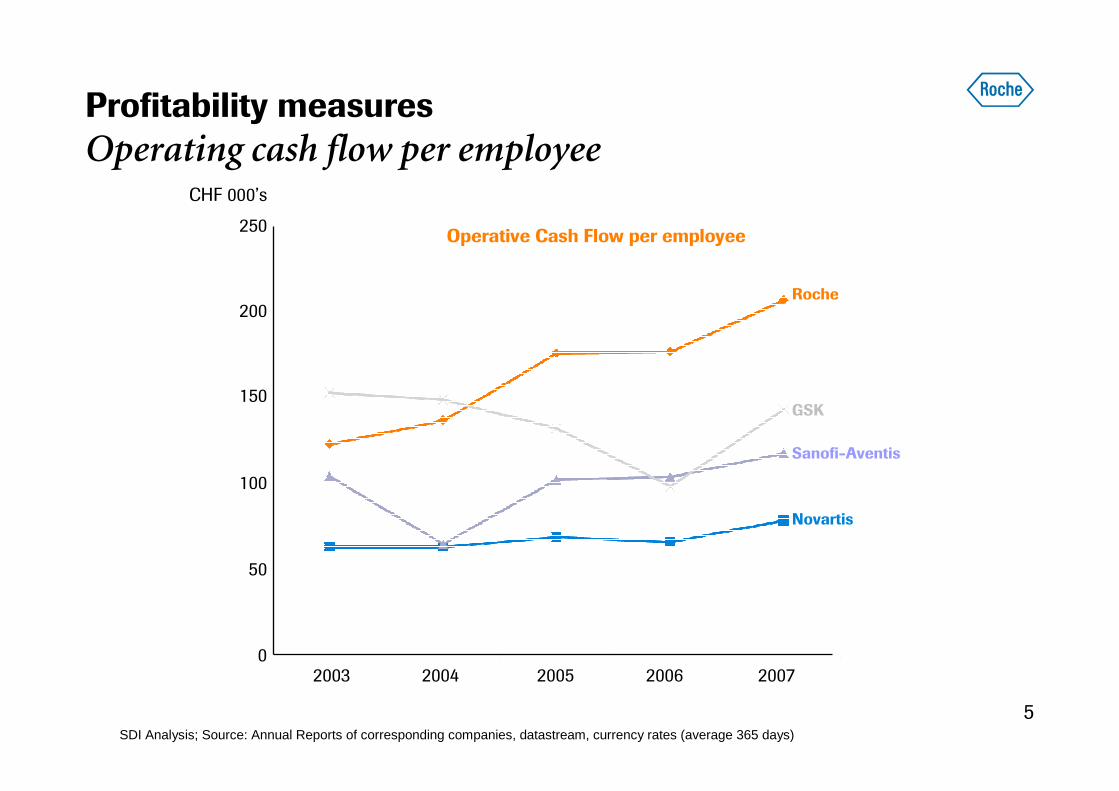
5SDI Analysis; Source: Annual Reports of corresponding companies, datastream, currency rates (average 365 days)
200720052004 20062003
150
100
200
50
0
Operative Cash Flow per employee250
CHF 000’s
Novartis
Roche
Sanofi-Aventis
GSK
Profitability measures
Operating cash flow per employee
6
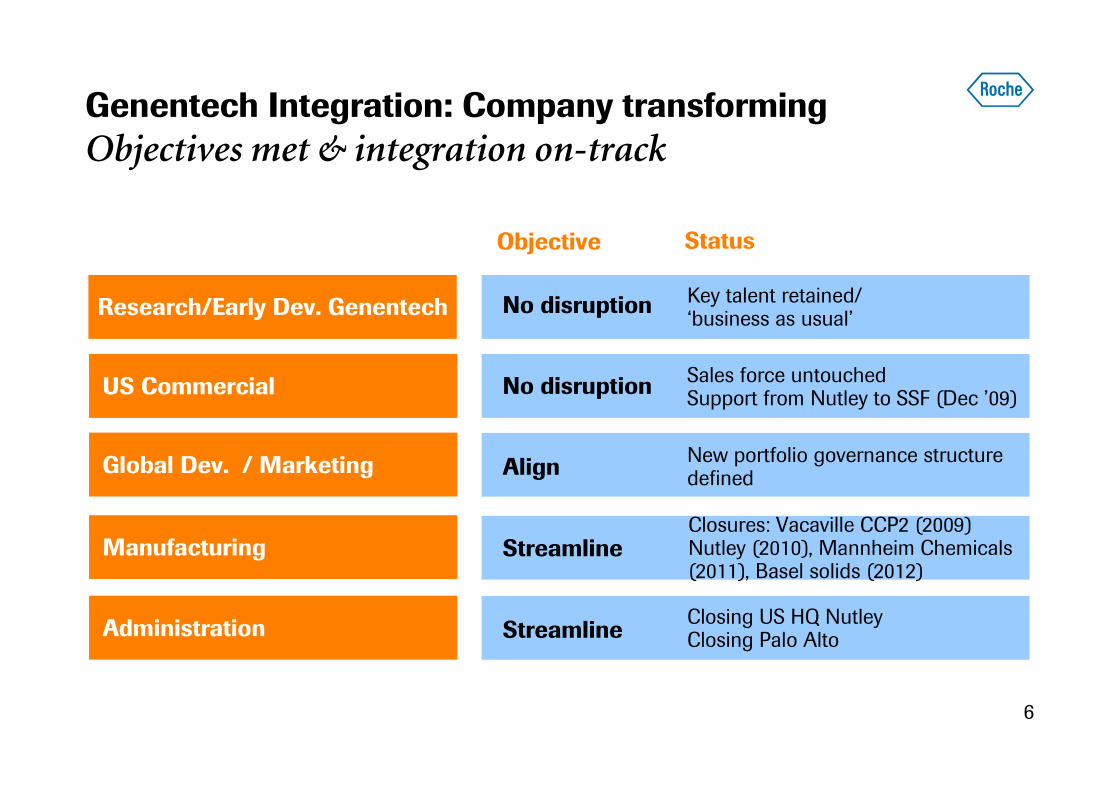
Genentech Integration: Company transforming
Objectives met & integration on-track
Research/Early Dev. Genentech
US Commercial
Global Dev. / Marketing
Manufacturing
Administration
Objective Status
No disruption Key talent retained/‘business as usual’
No disruptionSales force untouchedSupport from Nutley to SSF (Dec ’09)
AlignNew portfolio governance structuredefined
StreamlineClosures: Vacaville CCP2 (2009) Nutley (2010), Mannheim Chemicals (2011), Basel solids (2012)
StreamlineClosing US HQ NutleyClosing Palo Alto

7
Performance up-date
Strategy
Summary
8
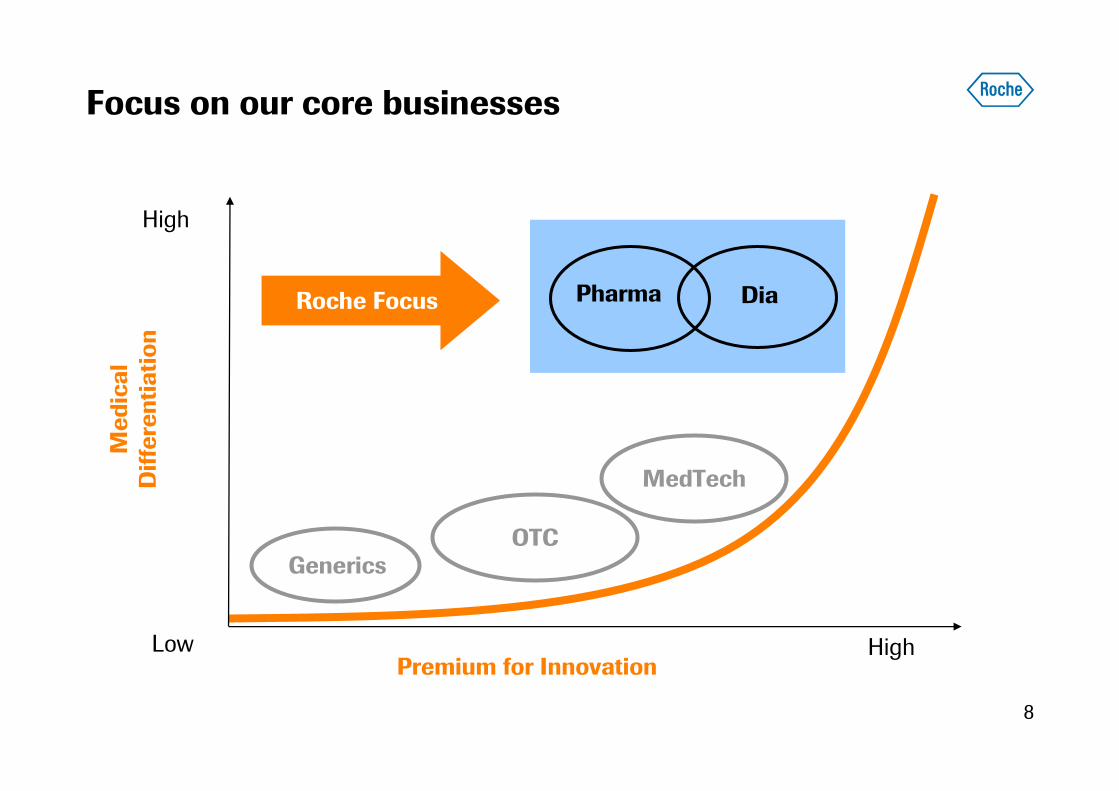
Focus on our core businesses
Generics
Low
High
Premium for Innovation
Roche Focus Dia
MedTech
OTC
Pharma
High
Medical
Differentiation
9
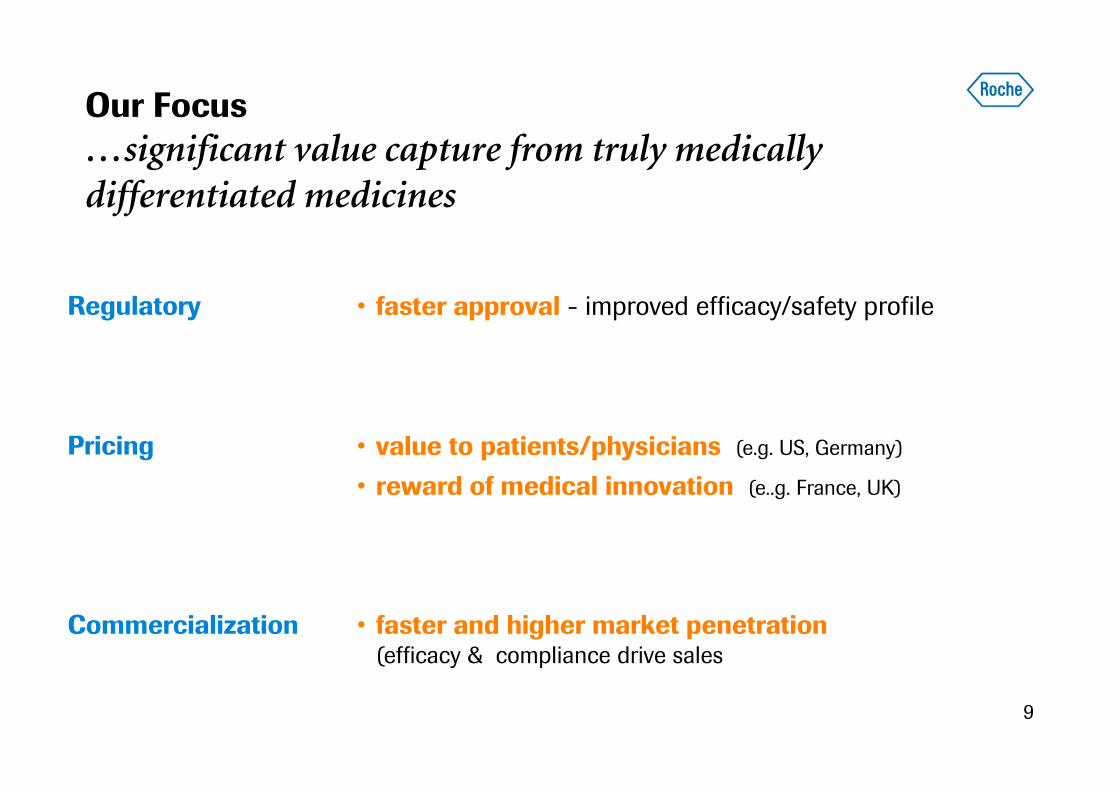
Commercialization
Regulatory • faster approval - improved efficacy/safety profile
• faster and higher market penetration(efficacy & compliance drive sales
• value to patients/physicians (e.g. US, Germany)
• reward of medical innovation (e..g. France, UK)
Our Focus
…significant value capture from truly medically differentiated medicines
Pricing
10
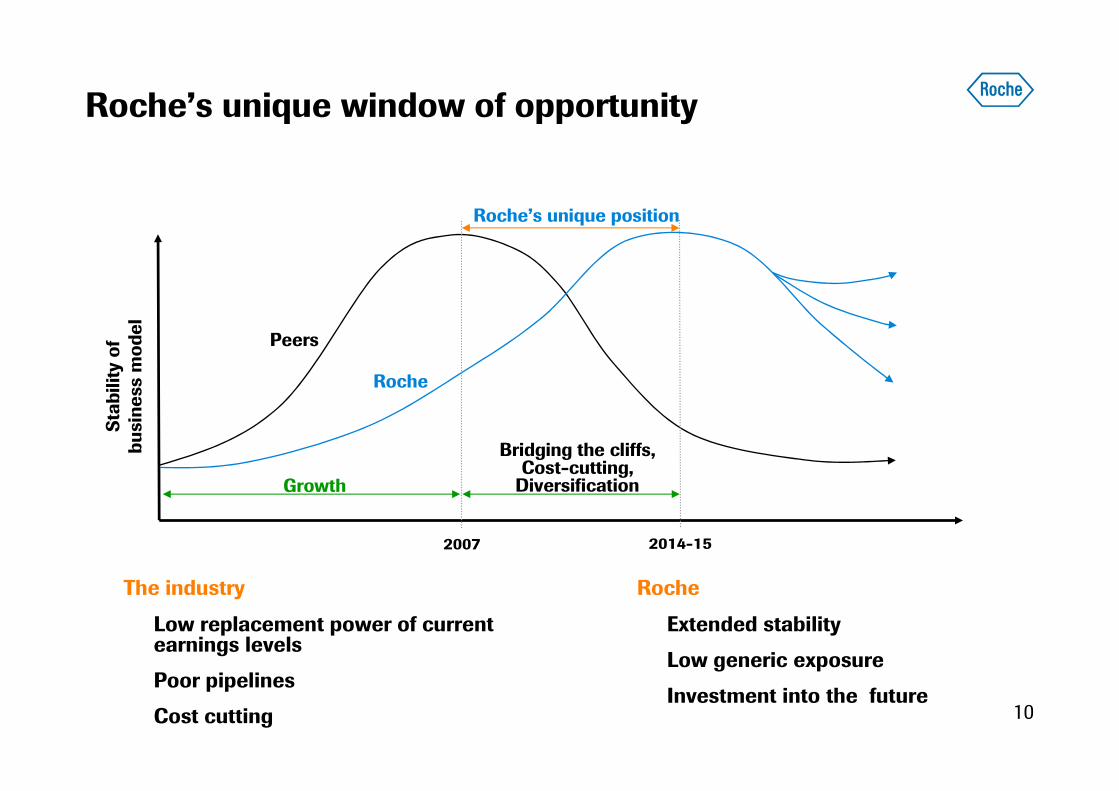
Roche’s unique window of opportunity
The industry
Low replacement power of current earnings levels
Poor pipelines
Cost cutting
2007 2014-15
Growth
Bridging the cliffs, Cost-cutting, Diversification
Peers
Roche
Roche’s unique position
Stability of
business model
Roche
Extended stability
Low generic exposure
Investment into the future
11
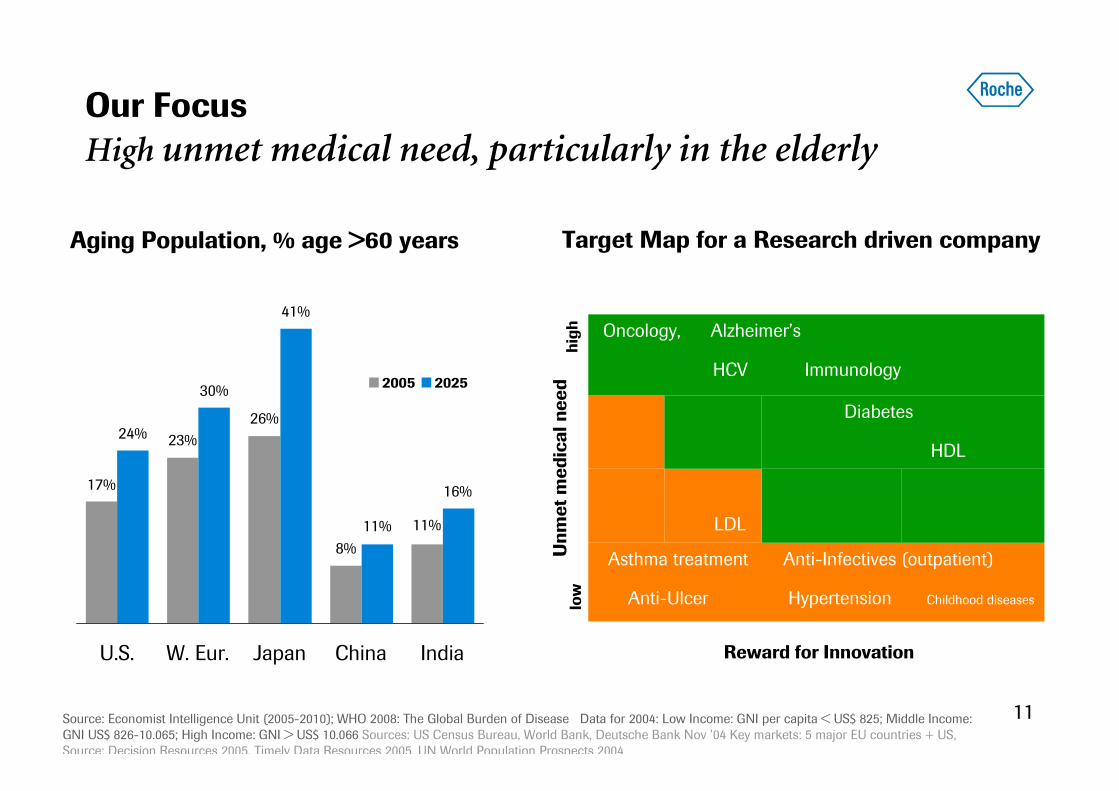
Our Focus
High unmet medical need, particularly in the elderly
Source: Economist Intelligence Unit (2005-2010); WHO 2008: The Global Burden of Disease Data for 2004: Low Income: GNI per capita < US$ 825; Middle Income:
GNI US$ 826-10.065; High Income: GNI > US$ 10.066 Sources: US Census Bureau, World Bank, Deutsche Bank Nov ’04 Key markets: 5 major EU countries + US,
Source: Decision Resources 2005, Timely Data Resources 2005, UN World Population Prospects 2004
2005 2025
Aging Population, % age >60 years
IndiaU.S. W. Eur. Japan China
24% 23%
30%
26%
41%
8%
11% 11%
16%17%
Asthma treatment Anti-Infectives (outpatient)
Anti-Ulcer Hypertension Childhood diseases
Oncology, Alzheimer’s
HCV Immunology
LDL
Diabetes
HDL
low
high
Unmet medical need
Reward for Innovation
Target Map for a Research driven company
12
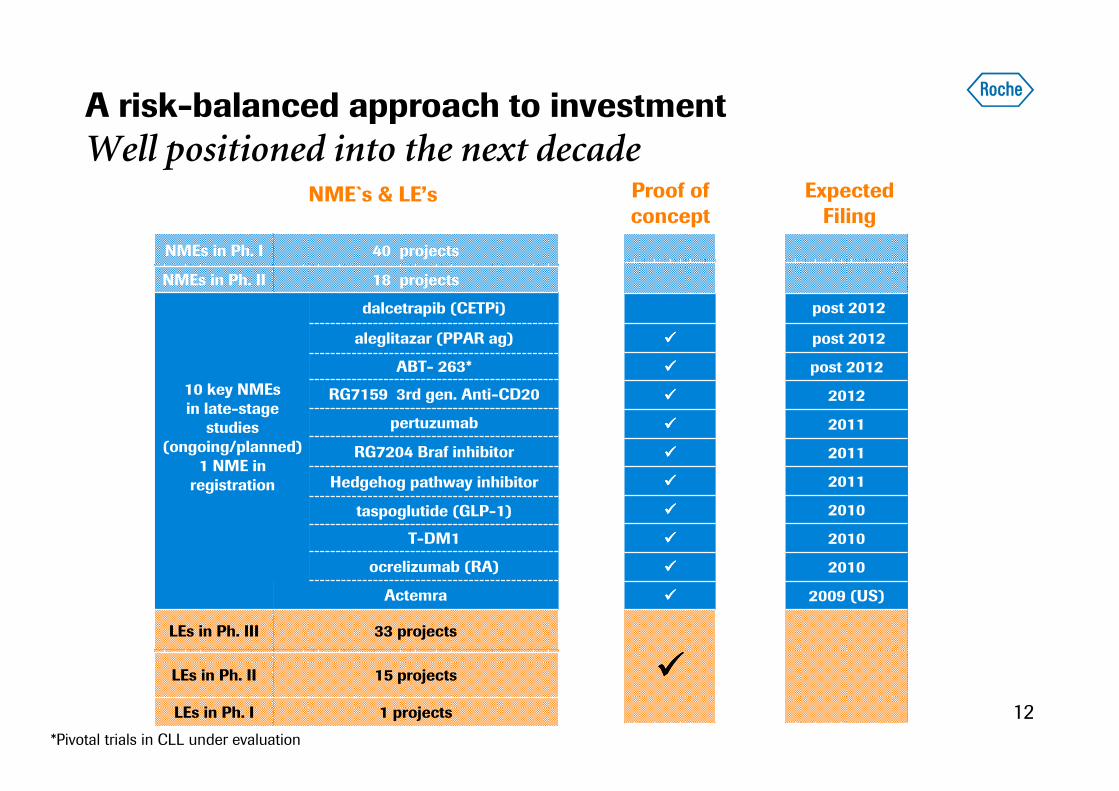
A risk-balanced approach to investment
Well positioned into the next decade
2009 (US)
post 2012
post 2012
2012
2011
2011
2010
2011
post 2012
2010
2010
Actemra
LEs in Ph. I
LEs in Ph. II
LEs in Ph. III
NMEs in Ph. II
NMEs in Ph. I
aleglitazar (PPAR ag)
dalcetrapib (CETPi)
RG7159 3rd gen. Anti-CD20
pertuzumab
ABT- 263*
Hedgehog pathway inhibitor
33 projects
15 projects
1 projects
10 key NMEsin late-stagestudies
(ongoing/planned)1 NME in registration
18 projects
40 projects
ocrelizumab (RA)
T-DM1
taspoglutide (GLP-1)
RG7204 Braf inhibitor
NME`s & LE’s ExpectedFiling
*Pivotal trials in CLL under evaluation
Proof of concept
����
����
����
����
����
����
����
����
����
����
����
13
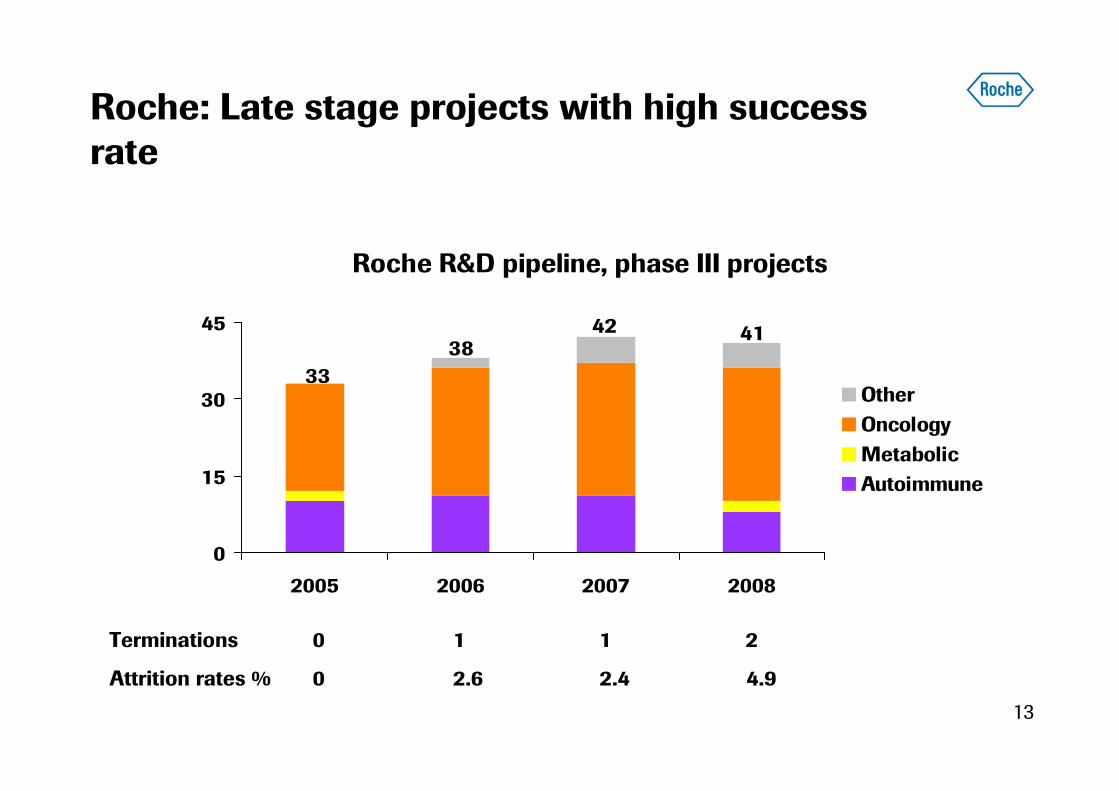
Roche: Late stage projects with high success rate
Roche R&D pipeline, phase III projects
0
15
30
45
2005 2006 2007 2008
Other
Oncology
Metabolic
Autoimmune
41
33
3842
Terminations 0 1 1 2
Attrition rates % 0 2.6 2.4 4.9
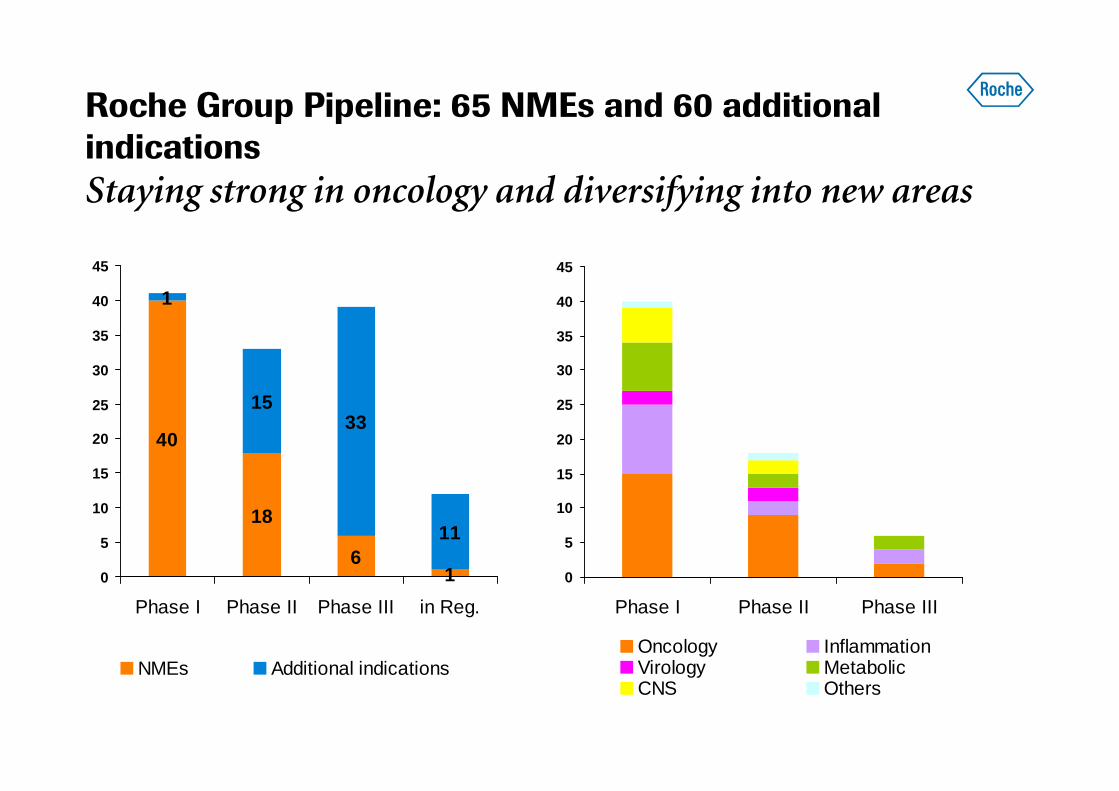
Roche Group Pipeline: 65 NMEs and 60 additional indications
Staying strong in oncology and diversifying into new areas
0
5
10
15
20
25
30
35
40
45
Phase I Phase II Phase III
Oncology InflammationVirology MetabolicCNS Others
40
18
61
1
1533
11
0
5
10
15
20
25
30
35
40
45
Phase I Phase II Phase III in Reg.
NMEs Additional indications
15
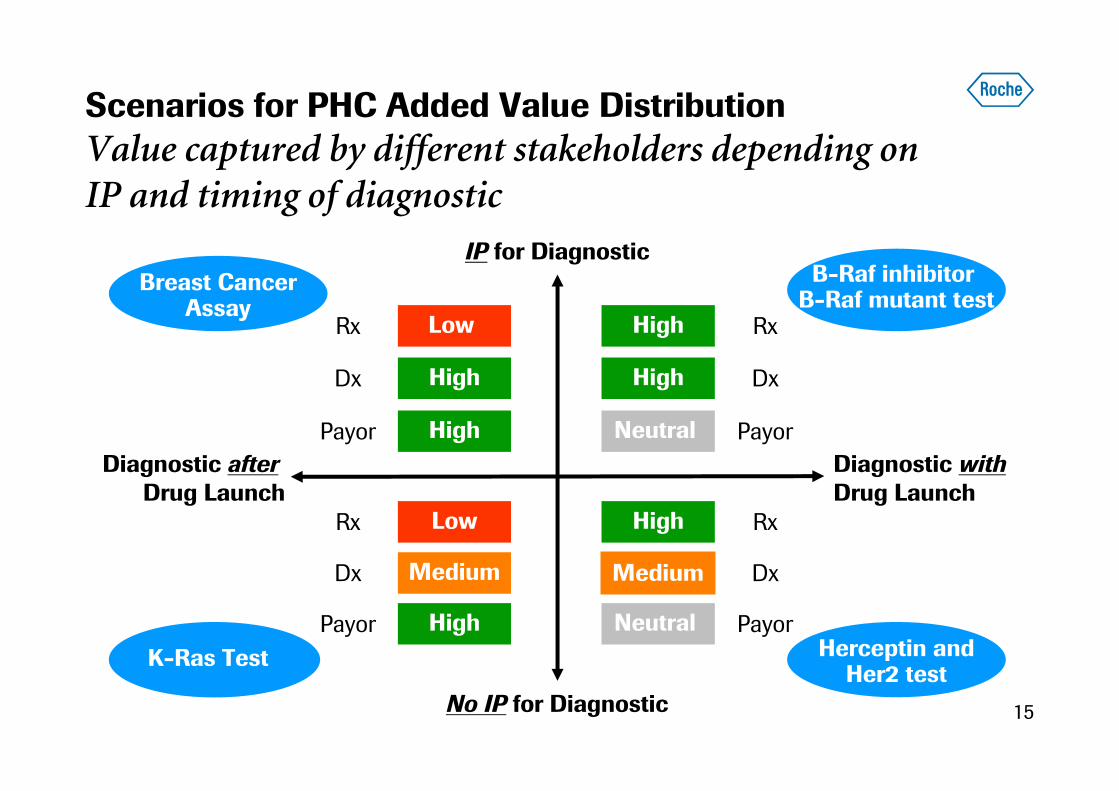
Scenarios for PHC Added Value Distribution
Value captured by different stakeholders depending on IP and timing of diagnostic
Diagnostic after
Drug LaunchDiagnostic with
Drug Launch
IP for Diagnostic
No IP for Diagnostic
Breast CancerAssay
Rx
Payor
Dx
Low
High
High
K-Ras Test
Rx
Payor
Dx
Low
High
Medium
Herceptin andHer2 test
Rx
Dx
Payor
High
Medium
Neutral
B-Raf inhibitor B-Raf mutant test
Rx
Dx
Payor
High
High
Neutral
16
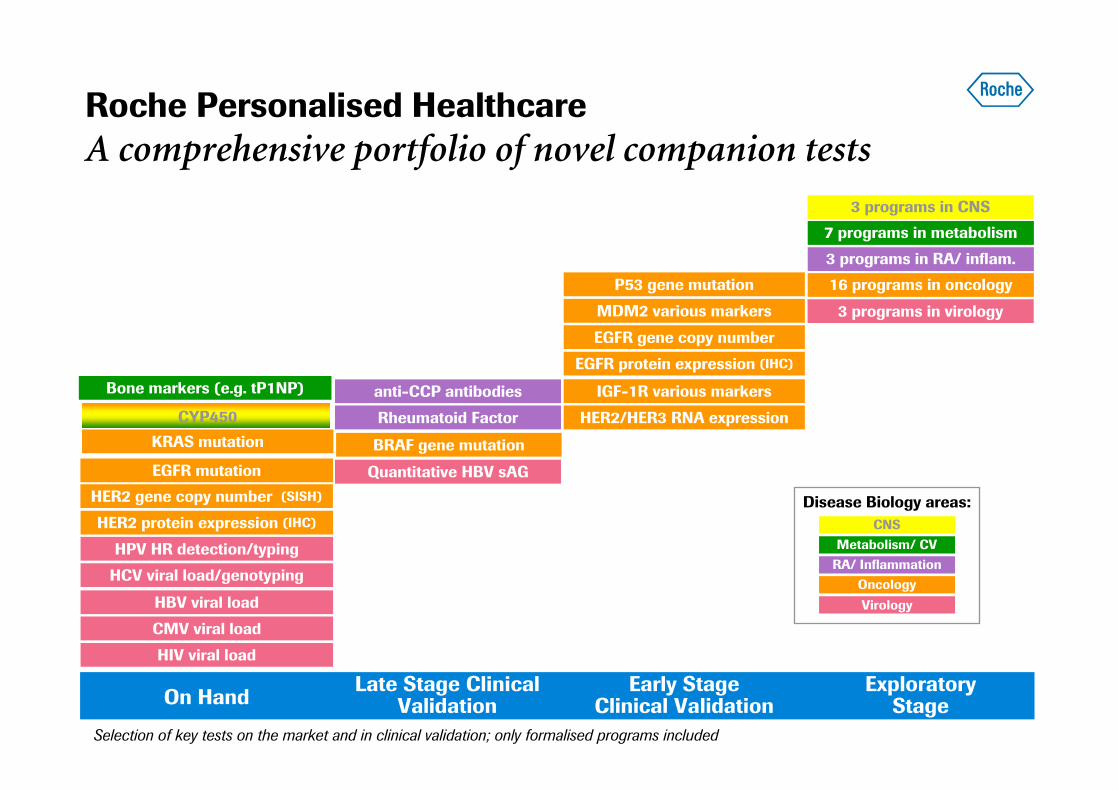
Roche Personalised Healthcare
A comprehensive portfolio of novel companion tests
HER2 protein expression (IHC)
On HandLate Stage Clinical
ValidationEarly Stage
Clinical Validation
HBV viral load
HCV viral load/genotyping
HIV viral load
EGFR gene copy number
EGFR protein expression (IHC)
EGFR mutation
KRAS mutation BRAF gene mutation
Rheumatoid Factor
Bone markers (e.g. tP1NP)
P53 gene mutation
HER2 gene copy number (SISH)
HPV HR detection/typing
Exploratory Stage
Oncology
Metabolism/ CV
RA/ Inflammation
Disease Biology areas:
CNS
Virology
CMV viral load
Quantitative HBV sAG
MDM2 various markers
IGF-1R various markers
HER2/HER3 RNA expression
Selection of key tests on the market and in clinical validation; only formalised programs included
16 programs in oncology
7 programs in metabolism
3 programs in RA/ inflam.
3 programs in CNS
3 programs in virology
anti-CCP antibodies
CYP450
17
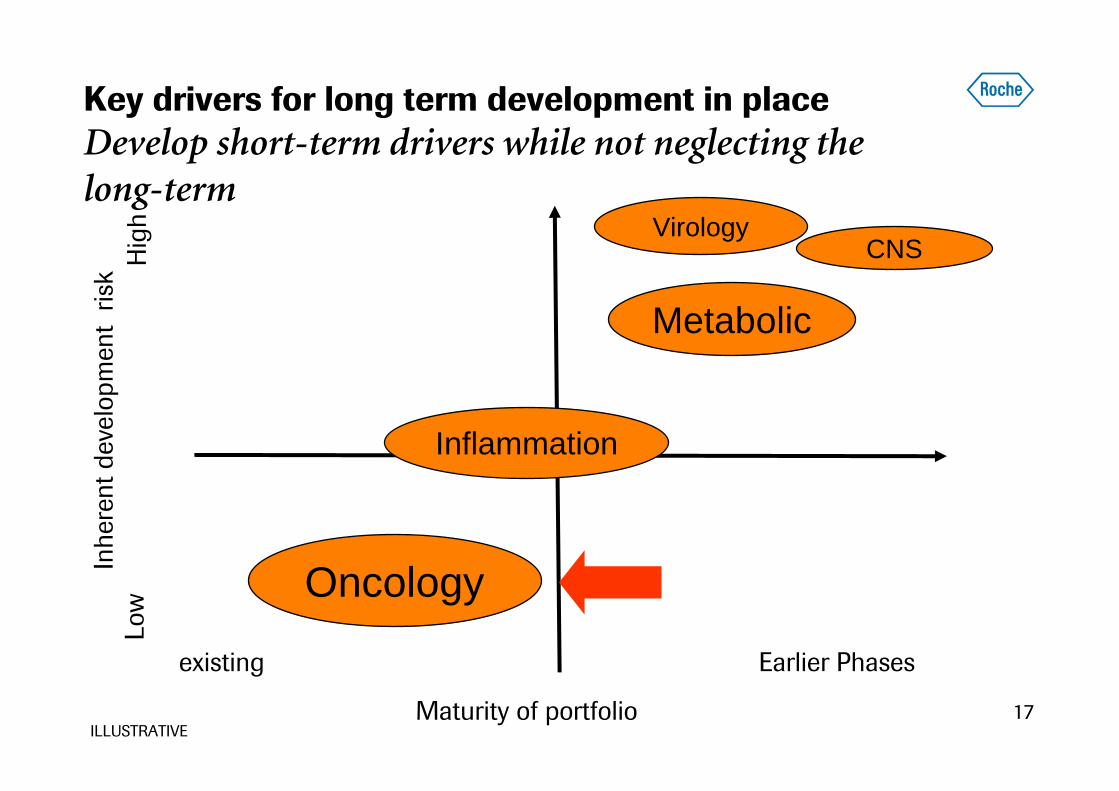
Key drivers for long term development in place
Develop short-term drivers while not neglecting the long-term
existing Earlier Phases
ILLUSTRATIVE
Inh
ere
nt
de
velo
pm
en
t r
isk
Maturity of portfolio
Lo
wH
igh
Oncology
Inflammation
Metabolic
CNSVirology
18
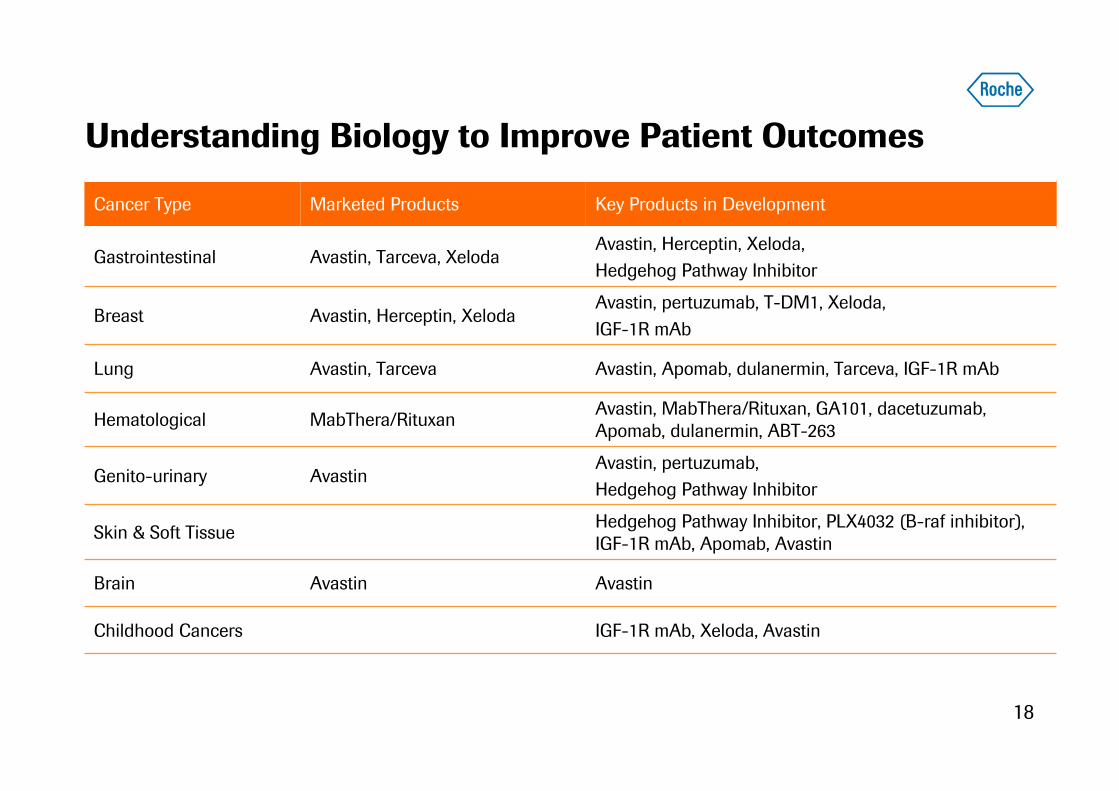
Understanding Biology to Improve Patient Outcomes
Cancer Type Marketed Products Key Products in Development
Gastrointestinal Avastin, Tarceva, XelodaAvastin, Herceptin, Xeloda,
Hedgehog Pathway Inhibitor
Breast Avastin, Herceptin, XelodaAvastin, pertuzumab, T-DM1, Xeloda,
IGF-1R mAb
Lung Avastin, Tarceva Avastin, Apomab, dulanermin, Tarceva, IGF-1R mAb
Hematological MabThera/RituxanAvastin, MabThera/Rituxan, GA101, dacetuzumab, Apomab, dulanermin, ABT-263
Genito-urinary AvastinAvastin, pertuzumab,
Hedgehog Pathway Inhibitor
Skin & Soft TissueHedgehog Pathway Inhibitor, PLX4032 (B-raf inhibitor), IGF-1R mAb, Apomab, Avastin
Brain Avastin Avastin
Childhood Cancers IGF-1R mAb, Xeloda, Avastin
19
What it takes to establish standard of care
Aiming for first and best in class cancer medicines
• Clinically meaningful and statistically superior benefit
• Broad combinability, especially with established backbones
• Positive risk-benefit profile, improving or maintaining quality of life
• Clinical data for all relevant settings and combinations
• Building trust through strong scientific rationale and breadth of clinical data,
including phase IV and real-life experience
20
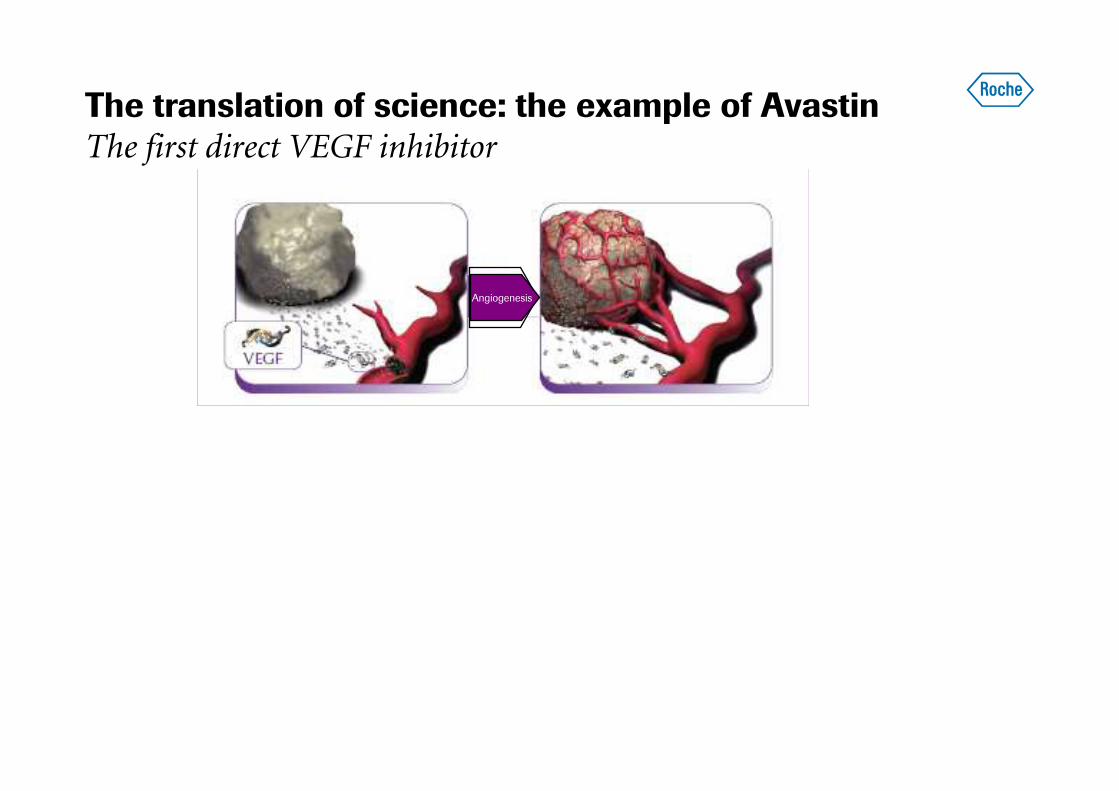
The translation of science: the example of Avastin The first direct VEGF inhibitor
Angiogenesis

21
The translation of science: the example of Avastin The first direct VEGF inhibitor
Avastin: Precise VEGF inhibition
Regression of tumourvasculature
Normalization of surviving vasculature
Inhibition of new and
recurrent vessel growth
Angiogenesis
Avastin, a humanized monoclonal antibody which inhibits tumour angiogenesis by directly targeting VEGF
. . . maintains control of tumour growth and metastases
2222
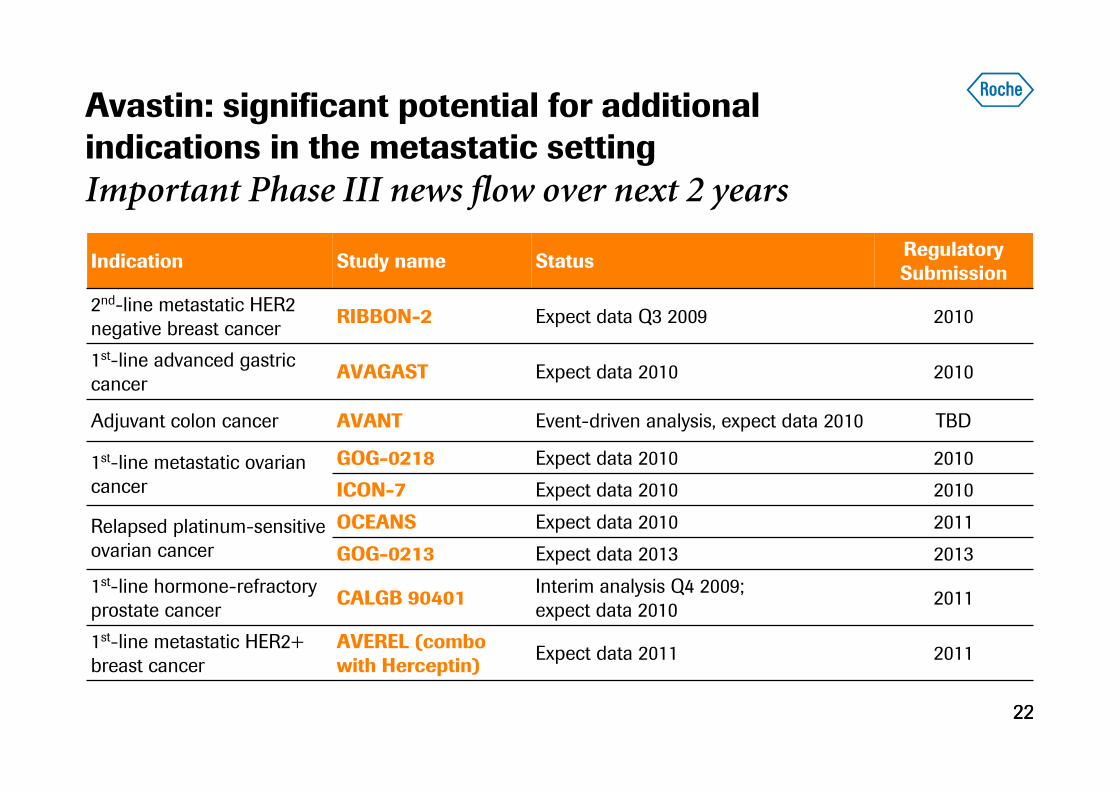
Avastin: significant potential for additional indications in the metastatic setting
Important Phase III news flow over next 2 years
Indication Study name StatusRegulatory Submission
2nd-line metastatic HER2
negative breast cancerRIBBON-2 Expect data Q3 2009 2010
1st-line advanced gastric
cancerAVAGAST Expect data 2010 2010
Adjuvant colon cancer AVANT Event-driven analysis, expect data 2010 TBD
1st-line metastatic ovarian
cancer
GOG-0218 Expect data 2010 2010
ICON-7 Expect data 2010 2010
Relapsed platinum-sensitive
ovarian cancer
OCEANS Expect data 2010 2011
GOG-0213 Expect data 2013 2013
1st-line hormone-refractory
prostate cancerCALGB 90401
Interim analysis Q4 2009;
expect data 20102011
1st-line metastatic HER2+
breast cancer
AVEREL (combo with Herceptin)
Expect data 2011 2011
23
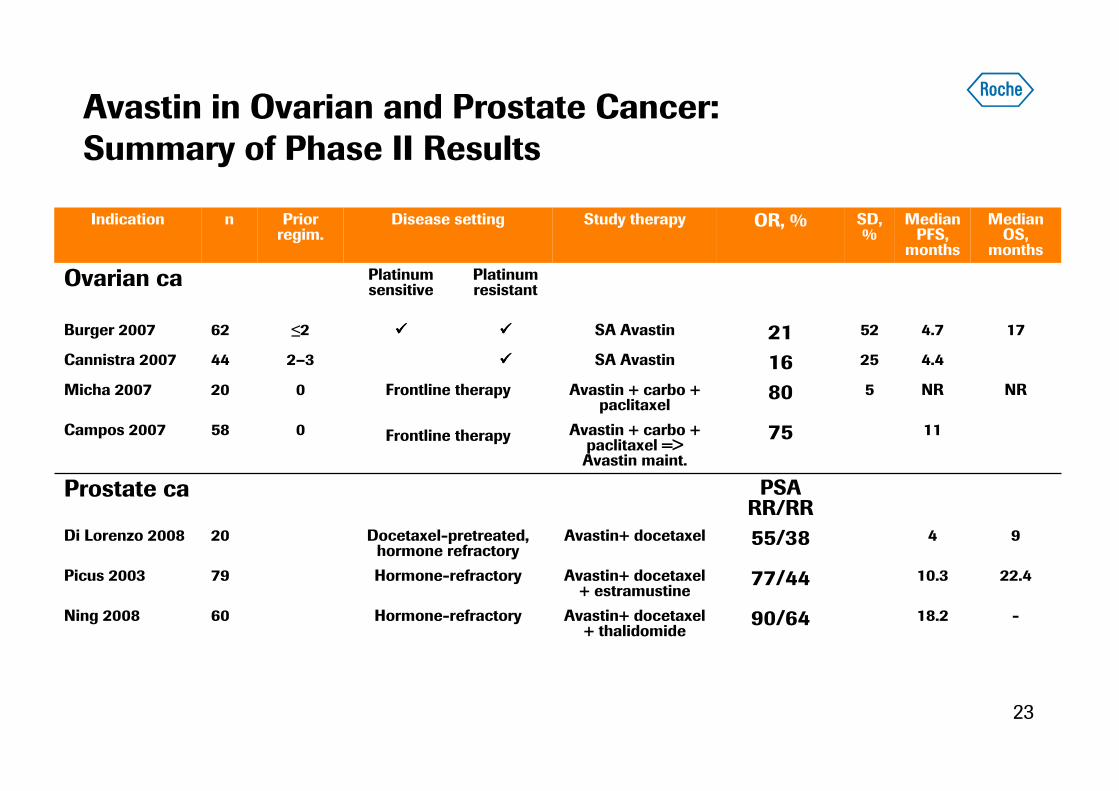
Avastin in Ovarian and Prostate Cancer: Summary of Phase II Results
Platinum resistant
Platinum sensitive
Ovarian ca
Hormone-refractory
9455/38Avastin+ docetaxelDocetaxel-pretreated, hormone refractory
20Di Lorenzo 2008
22.410.377/44Avastin+ docetaxel + estramustine
79Picus 2003
NRNR580Avastin + carbo + paclitaxel
Frontline therapy
Frontline therapy
020Micha 2007
1175Avastin + carbo + paclitaxel => Avastin maint.
058Campos 2007
-18.290/64Avastin+ docetaxel + thalidomide
Hormone-refractory60Ning 2008
PSARR/RR
Prostate ca
Indication n Prior regim.
Disease setting Study therapy OR, % SD, %
Median PFS,
months
Median OS,
months
Burger 2007 62 ≤2 ���� ���� SA Avastin 21 52 4.7 17
Cannistra 2007 44 2–3 ���� SA Avastin 16 25 4.4
24
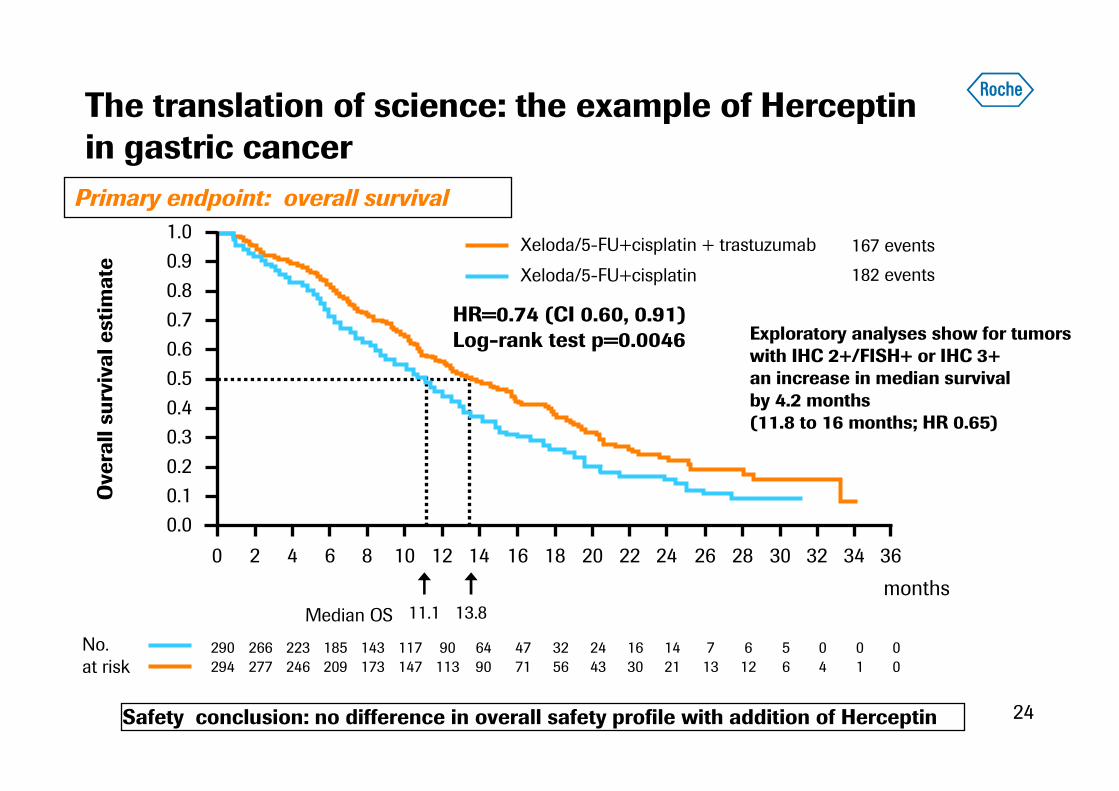
The translation of science: the example of Herceptin in gastric cancer
months
290
294
266
277
223
246
185
209
143
173
117
147
90
113
64
90
47
71
32
56
24
43
16
30
14
21
7
13
6
12
5
6
0
4
0
1
0
0
No. at risk
11.1 13.8
0.0
0.1
0.2
0.3
0.4
0.5
0.6
0.7
0.8
0.9
1.0
0 2 4 6 8 10 12 14 16 18 20 22 24 26 28 30 32 34 36
182 events Xeloda/5-FU+cisplatin
Overall survival estimate
HR=0.74 (CI 0.60, 0.91)Log-rank test p=0.0046
Median OS
Xeloda/5-FU+cisplatin + trastuzumab 167 events
Safety conclusion: no difference in overall safety profile with addition of Herceptin
Primary endpoint: overall survival
Exploratory analyses show for tumors with IHC 2+/FISH+ or IHC 3+ an increase in median survival by 4.2 months (11.8 to 16 months; HR 0.65)
25
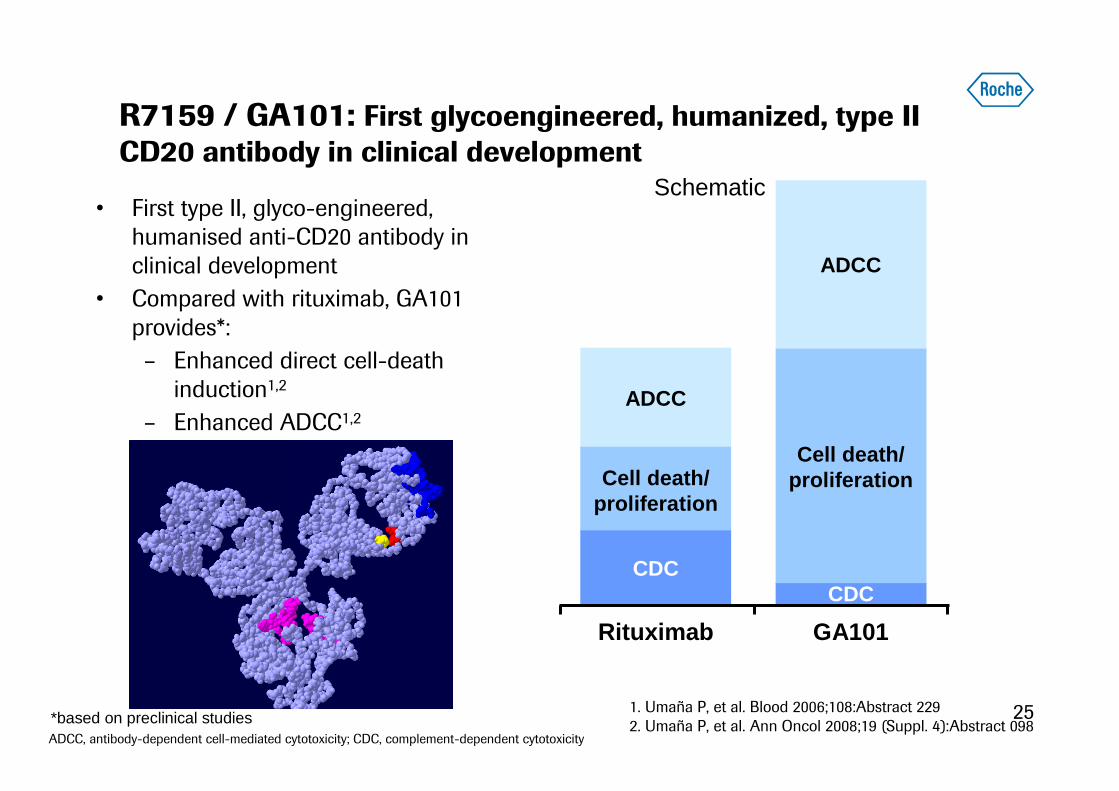
Schematic
R7159 / GA101: First glycoengineered, humanized, type II CD20 antibody in clinical development
• First type II, glyco-engineered,
humanised anti-CD20 antibody in
clinical development
• Compared with rituximab, GA101
provides*:
– Enhanced direct cell-death
induction1,2
– Enhanced ADCC1,2
1. Umaña P, et al. Blood 2006;108:Abstract 229
2. Umaña P, et al. Ann Oncol 2008;19 (Suppl. 4):Abstract 098ADCC, antibody-dependent cell-mediated cytotoxicity; CDC, complement-dependent cytotoxicity
*based on preclinical studies
GA101
CDC
Cell death/proliferation
ADCC
Rituximab
Cell death/proliferation
CDC
ADCC
26
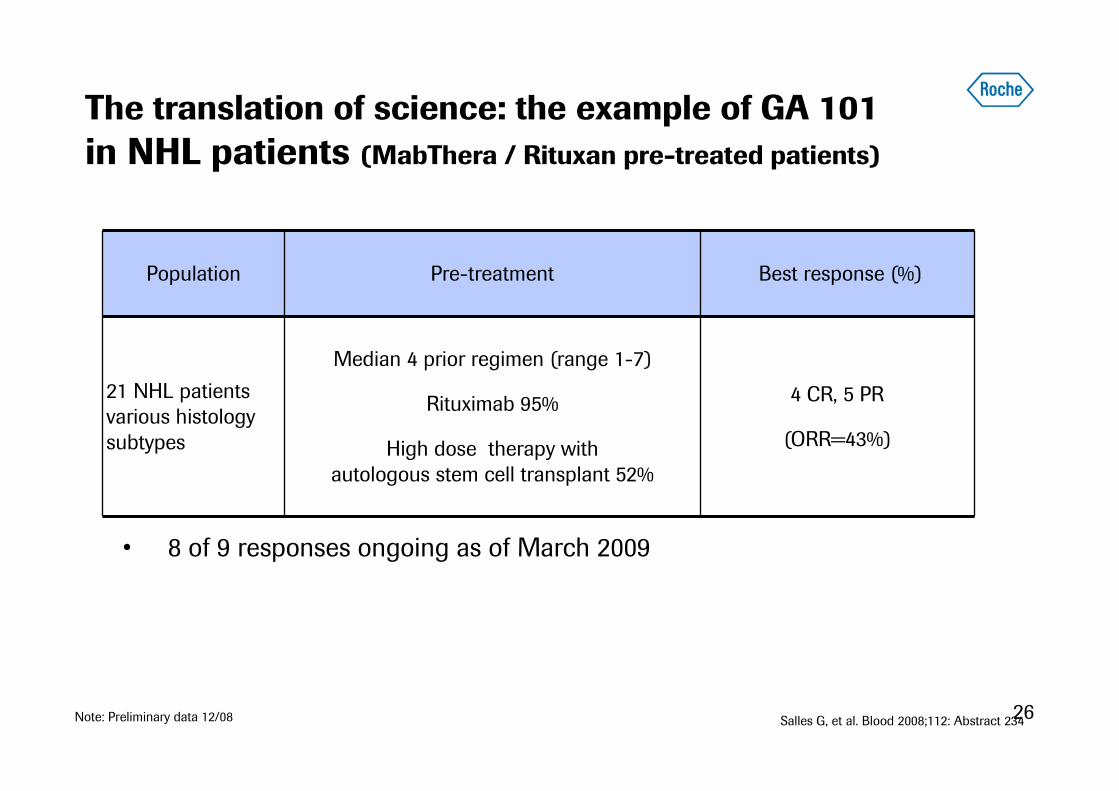
The translation of science: the example of GA 101
in NHL patients (MabThera / Rituxan pre-treated patients)
Population Pre-treatment Best response (%)
21 NHL patients
various histology
subtypes
Median 4 prior regimen (range 1-7)
Rituximab 95%
High dose therapy with
autologous stem cell transplant 52%
4 CR, 5 PR
(ORR=43%)
• 8 of 9 responses ongoing as of March 2009
Note: Preliminary data 12/08 Salles G, et al. Blood 2008;112: Abstract 234
27
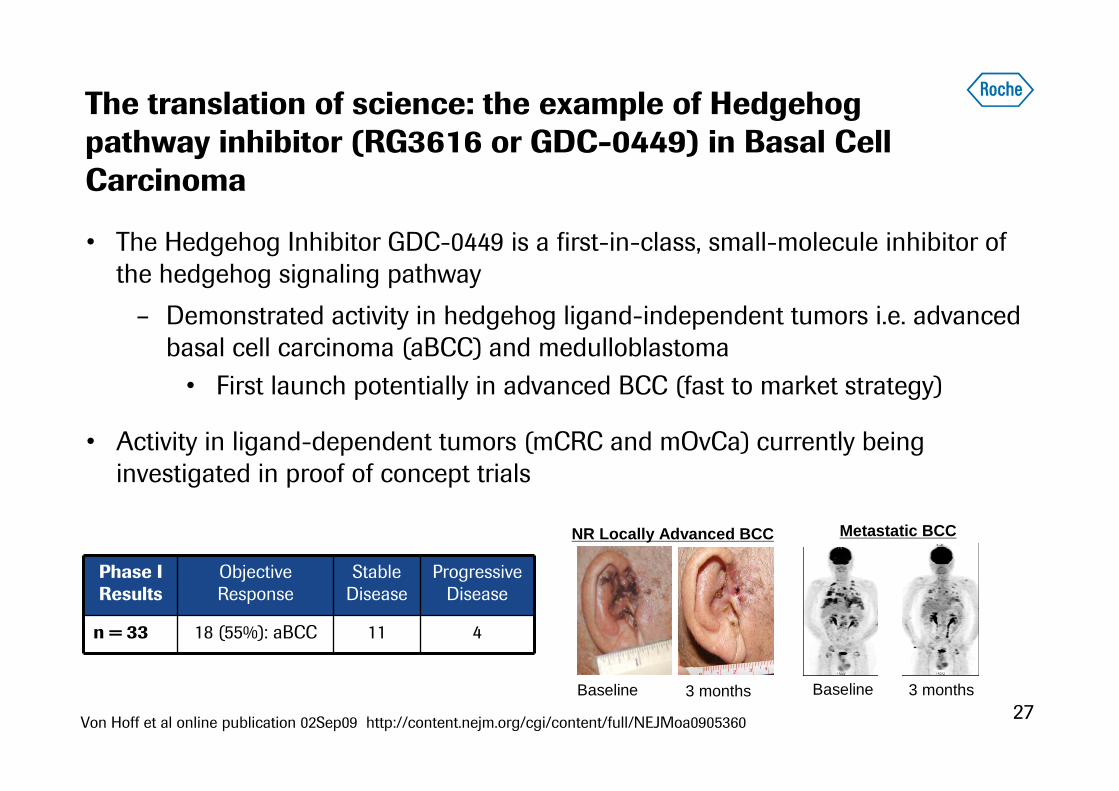
The translation of science: the example of Hedgehog pathway inhibitor (RG3616 or GDC-0449) in Basal Cell Carcinoma
• The Hedgehog Inhibitor GDC-0449 is a first-in-class, small-molecule inhibitor of
the hedgehog signaling pathway
– Demonstrated activity in hedgehog ligand-independent tumors i.e. advanced
basal cell carcinoma (aBCC) and medulloblastoma
• First launch potentially in advanced BCC (fast to market strategy)
• Activity in ligand-dependent tumors (mCRC and mOvCa) currently being
investigated in proof of concept trials
Baseline 3 months
NR Locally Advanced BCC
Phase I Results
Objective Response
Stable Disease
Progressive Disease
n = 33 18 (55%): aBCC 11 4
Baseline 3 months
Metastatic BCC
Von Hoff et al online publication 02Sep09 http://content.nejm.org/cgi/content/full/NEJMoa0905360
28
The translation of science: the example of b-raf inhibitor R7204 in malignant melanoma exemplifying Personalized Health Care
• R7204 highly selective inhibitor for BRAF V600E mutations
– demonstrated by in vitro assays and in vivo preclinical models
• Mutation associated with certain tumors (e.g., melanoma, CRC, thyroid) and poorer
prognosis (compared to wild type)
• Co-development with companion diagnostic for identification of target patient population:
– Mutation testing in Phase I provided early POC in melanoma based on response rates
in mutation-positive patients
• Focus on V600E-positive melanoma patients for initial fast to market registration strategy
– Frequency of mutation in target population consistent with expectations (~50% for
melanoma)
– Companion diagnostic will be used for patient selection in registration studies
29
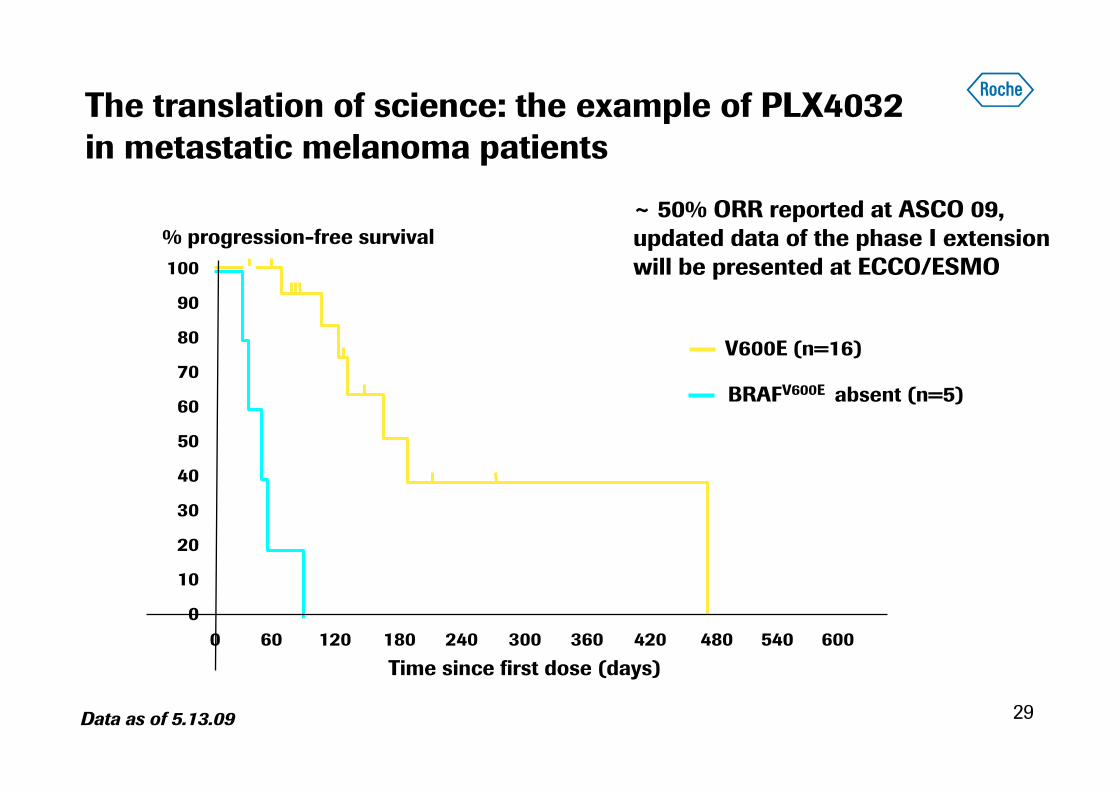
The translation of science: the example of PLX4032in metastatic melanoma patients
% progression-free survival
Time since first dose (days)
100
90
80
70
60
50
40
30
20
10
0
0 60 120 180 240 300 360 420 480 540 600
V600E (n=16)
Data as of 5.13.09
BRAFV600E absent (n=5)
~ 50% ORR reported at ASCO 09,updated data of the phase I extensionwill be presented at ECCO/ESMO
30
Strategy
Pipeline update on key programs
Summary
31
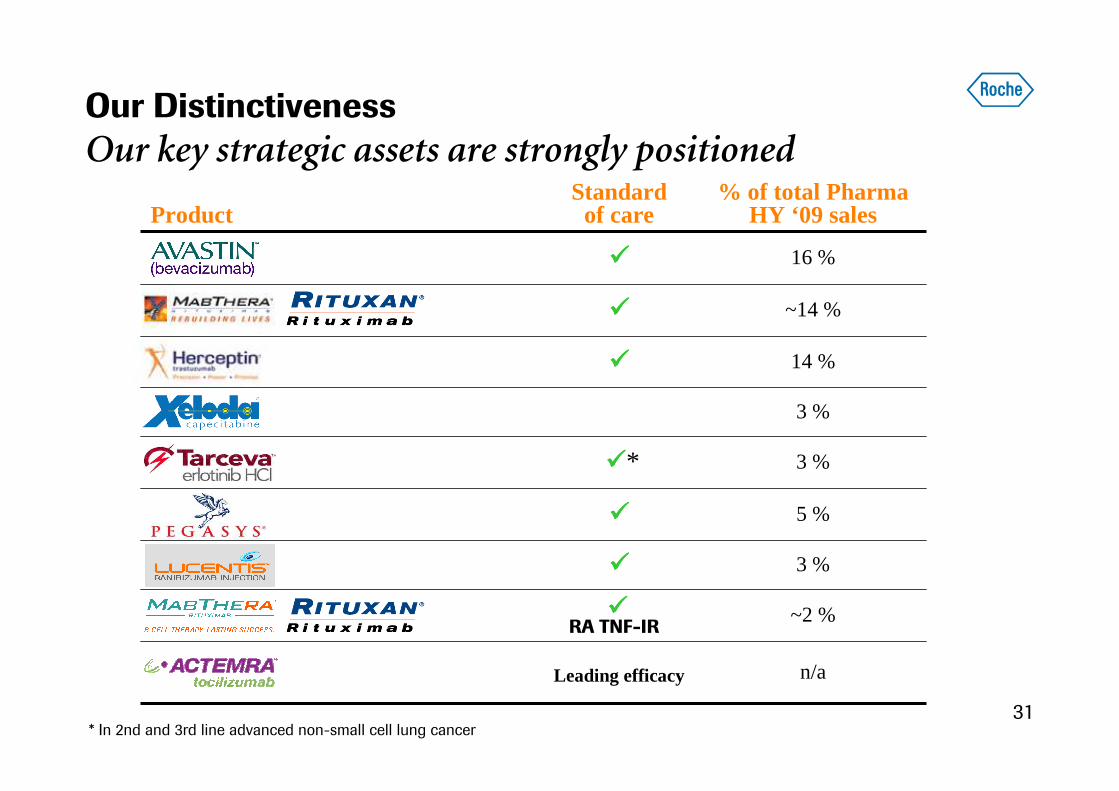
Our Distinctiveness
Our key strategic assets are strongly positioned
ProductStandardof care
% of total PharmaHY ‘09 sales
���� 16 %
���� ~14 %
���� 14 %
3 %
����* 3 %
���� 5 %
���� 3 %
~2 %
Leading efficacy n/a
* In 2nd and 3rd line advanced non-small cell lung cancer
����RA TNF-IR
32
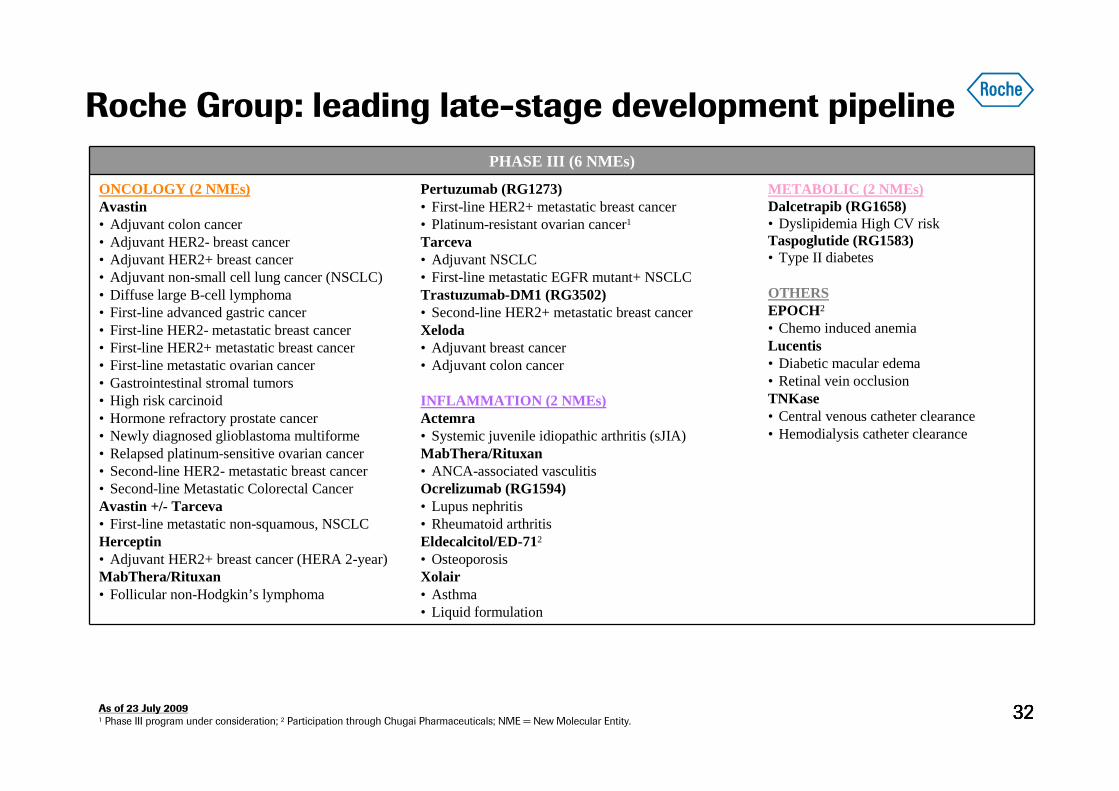
Roche Group: leading late-stage development pipeline
3232
PHASE III (6 NMEs)
ONCOLOGY (2 NMEs)Avastin • Adjuvant colon cancer• Adjuvant HER2- breast cancer• Adjuvant HER2+ breast cancer • Adjuvant non-small cell lung cancer (NSCLC)• Diffuse large B-cell lymphoma • First-line advanced gastric cancer• First-line HER2- metastatic breast cancer• First-line HER2+ metastatic breast cancer• First-line metastatic ovarian cancer • Gastrointestinal stromal tumors• High risk carcinoid• Hormone refractory prostate cancer • Newly diagnosed glioblastoma multiforme• Relapsed platinum-sensitive ovarian cancer• Second-line HER2- metastatic breast cancer• Second-line Metastatic Colorectal CancerAvastin +/- Tarceva• First-line metastatic non-squamous, NSCLCHerceptin• Adjuvant HER2+ breast cancer (HERA 2-year)MabThera/Rituxan• Follicular non-Hodgkin’s lymphoma
Pertuzumab (RG1273)• First-line HER2+ metastatic breast cancer• Platinum-resistant ovarian cancer1
Tarceva• Adjuvant NSCLC• First-line metastatic EGFR mutant+ NSCLCTrastuzumab-DM1 (RG3502)• Second-line HER2+ metastatic breast cancerXeloda• Adjuvant breast cancer• Adjuvant colon cancer
INFLAMMATION (2 NMEs)Actemra• Systemic juvenile idiopathic arthritis (sJIA)MabThera/Rituxan• ANCA-associated vasculitisOcrelizumab (RG1594)• Lupus nephritis • Rheumatoid arthritisEldecalcitol/ED-712
• OsteoporosisXolair• Asthma• Liquid formulation
METABOLIC (2 NMEs)Dalcetrapib (RG1658)• Dyslipidemia High CV riskTaspoglutide (RG1583)• Type II diabetes
OTHERSEPOCH2
• Chemo induced anemiaLucentis• Diabetic macular edema• Retinal vein occlusionTNKase • Central venous catheter clearance• Hemodialysis catheter clearance
As of 23 July 20091 Phase III program under consideration; 2 Participation through Chugai Pharmaceuticals; NME = New Molecular Entity.
33
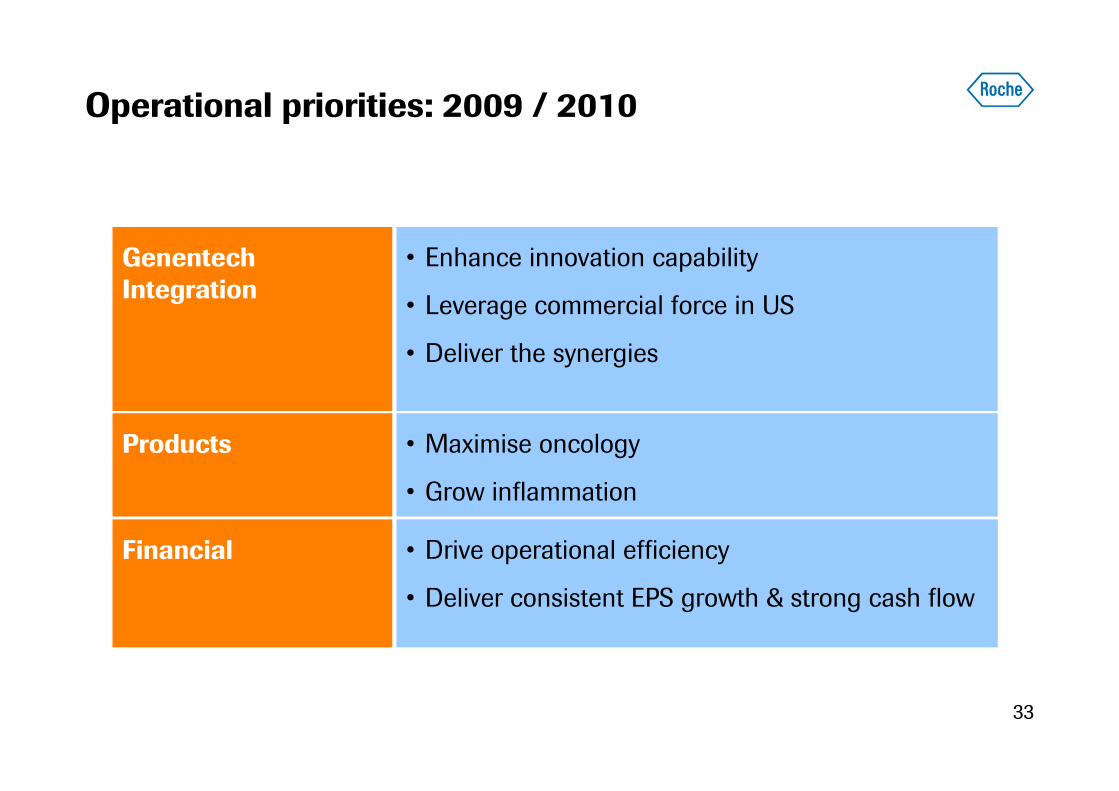
Genentech Integration
Operational priorities: 2009 / 2010
Financial
• Enhance innovation capability
• Leverage commercial force in US
• Deliver the synergies
• Drive operational efficiency
• Deliver consistent EPS growth & strong cash flow
Products • Maximise oncology
• Grow inflammation
34
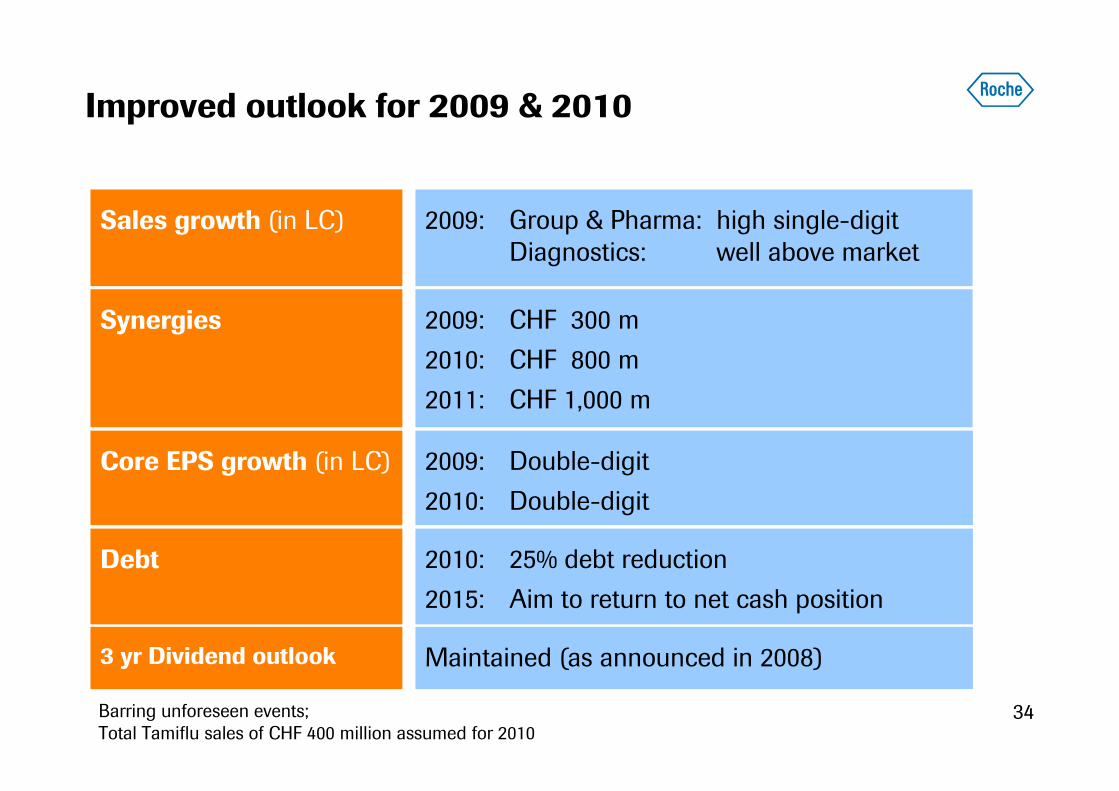
Improved outlook for 2009 & 2010
Barring unforeseen events;Total Tamiflu sales of CHF 400 million assumed for 2010
Sales growth (in LC)
Core EPS growth (in LC)
2009: Group & Pharma: high single-digit
Diagnostics: well above market
2009: Double-digit
2010: Double-digit
Synergies 2009: CHF 300 m
2010: CHF 800 m
2011: CHF 1,000 m
Debt 2010: 25% debt reduction
2015: Aim to return to net cash position
3 yr Dividend outlook Maintained (as announced in 2008)
35
We Innovate Healthcare