translating measurement findings into rehabilitation ... · translating measurement findings into...
TRANSCRIPT
JRRDJRRD Volume 48, Number 10, 2011
Pages 1211–1222
Journal of Rehabil itation Research & Development
Translating measurement findings into rehabilitation practice: An example using Fugl-Meyer Assessment-Upper Extremity with patients following stroke
Craig A. Velozo, PhD, OTR/L;1* Michelle L. Woodbury, PhD, OTR/L2
1Rehabilitation Outcomes Research Center and Brain Rehabilitation Research Center, Malcom Randall Department of Veterans Affairs (VA) Medical Center, Gainesville FL; and Department of Occupational Therapy, College of Public Health and Health Professions, University of Florida, Gainesville, FL; 2Ralph H. Johnson VA Medical Center, Charles-ton SC; and Department of Health Sciences and Research, Medical University of South Carolina, Charleston, SC
Abstract—Standardized assessments are critical for advancingclinical rehabilitation, yet assessment scores often provide littleinformation for rehabilitation treatment planning. A keyformrecovery map is an innovative way for a therapist to recordpatient responses to standardized assessment items. The formenables a therapist to view the specific items that a patient canor cannot perform. This information can assist a therapist in tai-loring treatments to a patient’s individual ability level. We dem-onstrate how a keyform recovery map can be used to informclinical treatment planning for individuals with stroke-relatedupper-limb motor impairment. A keyform map of poststrokeupper-limb recovery defined by items of the Fugl-MeyerAssessment-Upper Extremity (FMA-UE) was generated by apreviously published Rasch analysis. Three individuals withstroke enrolled in a separate research study were randomlyselected from each of the three impairment strata of the FMA-UE. Their performance on each item was displayed on theFMA-UE keyform. The forms directly connected qualitativedescriptions of patients’ motor ability to assessment measures,thereby suggesting appropriate shorter and longer term rehabili-tation goals. This study demonstrates how measurement theorycan be used to translate a standardized assessment into a useful,evidence-based tool for making clinical practice decisions.
Key words: assessment, clinical goal setting, Fugl-MeyerAssessment, item response theory, measurement, occupationaltherapy, Rasch analysis, rehabilitation, stroke, upper limb.
INTRODUCTION
Clinical rehabilitation therapists have been chal-lenged, if not mandated, to use standardized assessmentsas part of clinical practice. Educational accreditationstandards and practice frameworks for clinical rehabilita-tion disciplines such as physical and occupational ther-apy require that students learn and use standardizedassessments [1–2]. More recently, the growing demandfor evidence-based practice carries with it an implicitmandate to use reliable and valid standardized assess-ments as the basis of clinical decision making [3–6].
In spite of this foundational training and best-practicefocus, standardized assessments are used infrequently. Forexample, a multicenter retrospective review of medical
Abbreviations: CTT = classical test theory, FIM = FunctionalIndependence Measure, FMA-UE = Fugl-Meyer Assessment-Upper Extremity, GMFM-66 = Gross Motor Function Measure-66, IRT = item response theory, logit = log-odd unit, OPHI-II =Occupational Performance History Interview-II.*Address all correspondence to Craig A. Velozo, PhD,OTR/L; Department of Occupational Therapy, College ofPublic Health and Health Professions, University of Flor-ida, PO 100164, Gainesville, FL 32610; 352-273-6128; fax:352-273-6042. Email: [email protected]:10.1682/JRRD.2010.10.0203
1211
1212
JRRD, Volume 48, Number 10, 2011
charts showed that only 13 percent of 248 individuals withstroke were assessed for unilateral neglect with stand-ardized assessments as recommended by practice guide-lines [7]. A recent survey of 253 Canadian occupationaltherapists revealed that only 27 percent reported usingstandardized assessments of unilateral spatial neglect [8],and a qualitative interview with 12 Swedish occupationaltherapists working with individuals with brain injuryrevealed that the therapists were reluctant to use stand-ardized assessments [9]. In a survey of 300 Canadian phys-iotherapists conducted by Abrams et al., 90 percent agreedthat “health professionals should monitor the outcome oftheir treatment using reliable and valid tools,” yet less than30 percent reported routine use of standardized assessments[10]. Furthermore, Kay et al. reported that in spite of con-certed educational efforts to motivate therapists to use pub-lished outcomes scales, 6 years later, less than half of thetherapists incorporated published scales into practice [11].There is also an inherent dissatisfaction with instrumentsthat have widespread use. For example, in the 102 Euro-pean stroke rehabilitation facilities surveyed by Torenbeeket al., while the majority of therapists used published scales,such as the Barthel Index or Functional Independence Mea-sure (FIM™), more than 90 percent of the respondentsreported dissatisfaction with these instruments [12].
For good reasons, we continue to promote the advance-ment of standardized assessment tools in evidence-basedclinical rehabilitation [6]. Standardized assessments allowcomparisons against norms, objectively document theeffectiveness of interventions, and promote the translationof clinical research into clinical practice. The validity ofrehabilitation constructs within the scientific communitywill likely depend on the quality of the tools used to meas-ure these constructs [13]. Rigorous assessments are undeni-ably the key to the advancement of rehabilitation practiceand science.
Clearly, standardized assessments have a critical rolein clinical professions, and yet therapists are challengedin incorporating these assessments into day-to-day clini-cal practice. While educators, researchers, and profes-sional organizations continue to criticize therapists fornot using standardized assessments, we may need to con-template whether or not standardized assessments haveany immediate benefit to the practicing therapist. Thecritical question may be “What has my standardizedassessment done for me (the therapist) lately?” In orderto better understand the plight of standardized assessment
in practice, we need to reevaluate the assessment processand the role of measurement in this process.
Every measure begins with a qualitative experience[14–16]. The clinical evaluation incorporates in-depthpatient interviews (e.g., narratives, ethnographies), obser-vations of behaviors (e.g., developmental milestones,performance of self-care or instrumental activities of dailyliving tasks), and informal observations of patient participa-tion (e.g., interacting with peers, community integration). Itis the qualitative features of the therapist-patient interactionthat lead to real-time interpretation of the patient’s statusand the formulation of a treatment plan tailored to theunique needs of the individual and his or her context. Whilestandardized assessments provide a means to quantify someor all of the assessment process, many assessments do rela-tively little to immediately inform the therapist beyond thequalitative interaction. While administrators, healthcareaccrediting agencies, payers, and of course, researchers usenumbers to make critical clinical, financial, and scientificdecisions, unfortunately, the numbers often add little valueto the immediate clinical reasoning process.
The restricted use of assessment instruments in clini-cal practice may be a function of the measurement modelunderlying the development of these instruments, that is,classical test theory (CTT). CTT explains the observedscore into two components, the true score and error score[17]. The majority of investigations using this meas-urement model are at the observed-score level (e.g., inter-rater reliability of the observed scores across raters orpredictive validity of the observed scores relative to agold standard measure). In essence, this model providesan understanding of the construct (e.g., upper-limb func-tioning) at the level of the whole instrument. Further-more, the observed scores are assessment (test) andsample dependent. That is, an individual’s observed scoredepends on whether he or she takes an easy or hard test,and reliability and validity values are highly dependenton the characteristics of the sample [18].
Item response theory (IRT) models may provide awindow to extend the applicability of assessments in clin-ical practice. In contrast to CTT, IRT focuses on the itemrather than the test. While extensive reviews of IRT exist[19–21], critical to this study is the following characteris-tic of all IRT models: the attempt to measure person abil-ity (often referred to as a latent trait) relative to itemdifficulty. In contrast to CTT, the values of person abilityand item difficulty are sample independent [22]. In thesimplest of the IRT models, the Rasch model, there is a

1213
VELOZO and WOODBURY. Translating measurement findings into rehabilitation practice
probabilistic relationship of person ability to item diffi-culty, with individuals of low ability having a high proba-bility of failing or getting low ratings on both the easy andhard items of an assessment and individuals of high abil-ity having higher probability (than individuals with lowability) of passing or getting high ratings on harder itemsand a very high probability of passing or getting high rat-ings on easy items [23]. This relationship of item diffi-culty and person ability forms the basis of generatingpatient evaluation forms called keyforms that can provideimmediate, useful information to the therapist.
Linacre introduced the keyform as an instantaneousmeasure for the cognitive construct of the FIM [24]. Thisform is generated from the “General Keyforms” outputtable produced from Rasch analysis using the Winstepssoftware program (Winsteps; Chicago, Illinois) [25]. Theform looks similar to a survey questionnaire, with theitems of the survey on one side of the form and numberscorresponding to the rating scale of each item placed onthe other side of the form. While the keyform is similar toa survey questionnaire, it has two additional features. First,the items of the assessment are ordered on the basis ofRasch item-difficulty calibrations. The items progressfrom the easiest items on the bottom of the form to thehardest items on the top of the form. Second, the ratingsfor the items are not lined up in straight vertical columns ason a typical survey. Instead each rating for each item isassociated with a difficulty calibration. Item ratings stair-step from left to right to correspond with increasingamounts of person ability required to perform more diffi-cult items.
Linacre with the FIM cognitive scale [24] and, later,Kielhofner et al. with the Occupational Performance His-tory Interview-II (OPHI-II) [26] demonstrated how thesekeyforms could be used for evaluating patients andimmediately deriving Rasch linear measures during theassessment process. This was accomplished by circlingratings (for each item) corresponding to patients’performance (i.e., on the items of the FIM keyform) orinterview responses (i.e., on the items of the OPHI-IIkeyform). Then, by drawing a vertical line “through thebulk of the items” [24] and intersecting the x-axis,the evaluator could immediately determine the Raschperson-ability measure of the patient. Linacre and Kiel-hofner et al. showed that the conversion of raw scores tointerval measures could be derived without specializedsoftware programs and statistical expertise because thekeyform is generated from previous analysis of data and
can be scored in real time. Similarly, Bode et al. devel-oped a self-scoring key (keyform) for the Galveston Ori-entation and Amnesia Test to identify extraordinaryresponse patterns [27]. Like Linacre and Kielhofner etal., Bode et al. recommended use of the keyform to gen-erate instantaneous interval measures.
A further step, beyond instantaneous measurement, isthe application of the keyform to clinical treatment plan-ning. Critical to this step is the acknowledgement thatthe items on an instrument represent amounts of theconstruct under observation. That is, the items reflect anitem-difficulty hierarchical structure. Avery et al. clearlydemonstrate the item-difficulty structure in their presenta-tion of their Gross Motor Ability Estimator for the GrossMotor Function Measure-66 (GMFM-66) [28]. Becausechildhood motor development proceeds along predictabledevelopment milestones (e.g., head control precedes sit-ting, which precedes crawling, which precedes walking),the structure of the keyform acquires meaning. Theresearchers, using a keyform, present the example of achild scoring 60/100 on the GMFM-66 [28]. This child hasconsistent ratings of 3 (can complete the movement task)for items such as “lifting head to midline,” “sit and lowersto prone,” and “stands with arms free.” In addition, thischild has consistent ratings of 0 (cannot complete themovement task) for items such as “jump forward 30 cm,”“up steps with no rail,” and “hop 10 times left foot.” The“transition zone” is where the child scores a 2 (partiallycompletes the movement task) or 1 (initiates the movementtask) on items such as “high kneeling to stand,” “up 4 stepsholding rail,” and “walk between lines.” This zone repre-sents the emerging motor ability skills of the child. Items atthis level are at the “just right challenge” level; for items farbelow this level, the child has a high probability of suc-ceeding, and for items far above this level, the child has ahigh probability of failing.
A recent study of the Fugl-Meyer Assessment-UpperExtremity (FMA-UE) offers an opportunity to create akeyform to assist neurorehabilitation therapists in planningtreatment aimed at improving upper-limb motor functionin persons with stroke [29]. This assessment of stroke-related upper-limb motor impairment was chosen forinvestigation because it is reliable and valid and often usedin rehabilitation research studies [30–32]. The 33 items ofthe assessment are scored on a 3-point rating scale: 0 =unable to perform, 1 = partial ability to perform, and 2 =near normal ability to perform [33]. Importantly, for thepurposes of the present article, the FMA-UE is potentially
1214
JRRD, Volume 48, Number 10, 2011
useful for rehabilitation therapists interested in document-ing upper-limb motor recovery during therapy.
Woodbury et al. applied Rasch analysis to 512 partici-pants’ responses to the 33 FMA-UE items [29]. The resultsled to a modified 30-item FMA-UE, which was shown tobe a unidimensional measure of voluntary upper-limbmotor ability. Furthermore, the results arranged the FMA-UE items along a hierarchical continuum according to diffi-culty (i.e., from least to most difficult). The item-difficultyhierarchy is a visual representation of the overall constructthe assessment is intended to measure and describes a pro-gression of this construct, i.e., defines a continuum ofbehaviors representing poststroke upper-limb motor recov-ery. The item-difficulty hierarchy challenged the traditionalmotor control conceptual framework underlying the FMA-UE. That is, recovery of poststroke upper-limb movementdid not proceed in a strict synergistic-to-isolated andreflexive-to-integrated sequence as would be expected bythe traditional framework. Instead, the Rasch-generateditem-difficulty hierarchy was consistent with contemporarymotor control evidence that suggests an individual’s abilityto perform a given arm or hand movement is a dynamicinteraction between neural factors and the task-specific dif-ficulty of the movement.
The Rasch analysis of this sample produced a key-form. Importantly, the FMA-UE item-difficulty hierarchywas consistent across 98 percent of a 512-person sampleat a single time point and was invariant in a 377-personsample across two testing occasions [29,34]. These find-ings strongly suggest that the FMA-UE keyform can beapplied to a larger population of individuals with stroke.
The purpose of this article is to extend previousresearch by demonstrating how the FMA-UE keyform canbe used to inform treatment planning. The present studywill show how patient performance documented on a key-form can be immediately used in combination with otherpatient-specific information to set goals and plan treatment.
METHODS
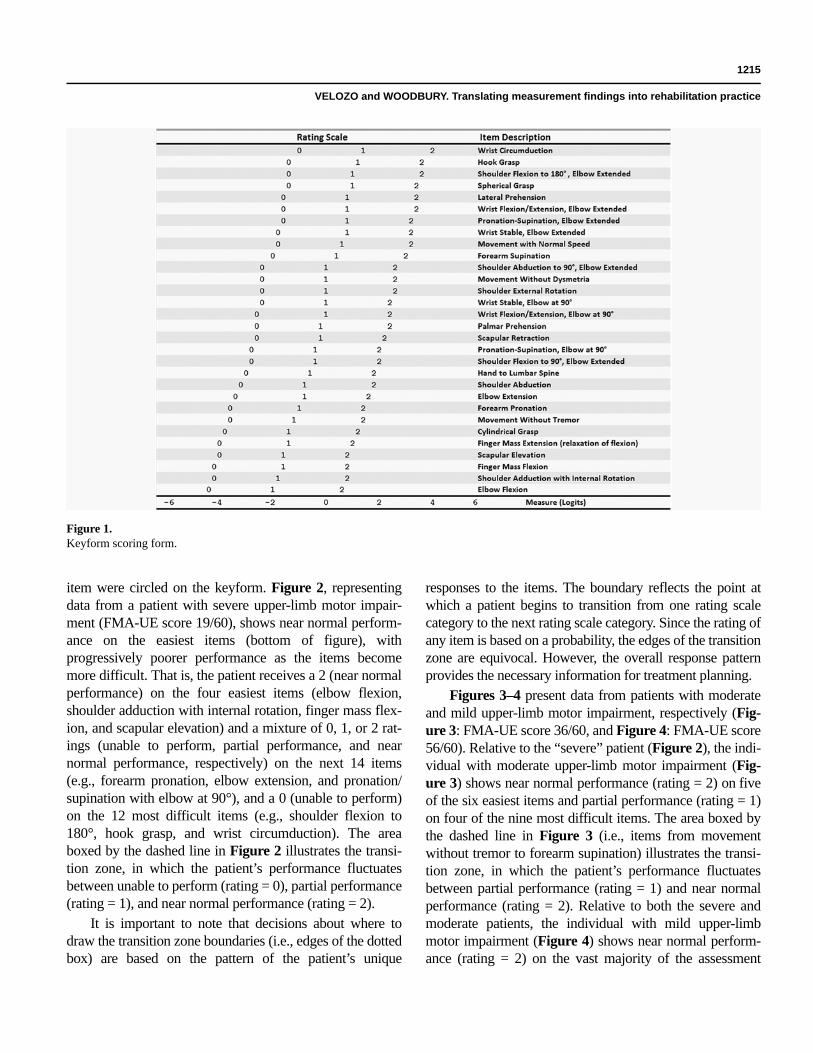
The keyform scoring form presented in this article wasgenerated in a previous published analysis of FMA-UE dataobtained from 512 individuals, aged 69.8 ± 11.1 years.These individuals were between 0 and 145 days from theirfirst mildly to moderately severe cortical stroke. Detailedsample demographics are presented elsewhere [29]. Thiskeyform scoring form is illustrated in Figure 1. FMA-UEitems are listed to the right of the figure in descending diffi-
culty order (top to bottom). The rating scale for each item (0,1, and 2) is to the left of the figure. As can be seen, the ratingscale stair-steps from the left to the right. Easier items (bot-tom of the figure) have ratings to the far left of the figure,and harder items (top of the figure) have ratings close to theright of the figure. This stair-stepping corresponds to the dif-ficulty of each item. That is, the ratings for each item areplaced relative to the measurement scale (in log-odd units[logits]) at the bottom of the figure, which estimates thepatient’s upper-limb motor ability. For example, for elbowflexion, the rating of 1 corresponds to approximately –2.0logits, while for wrist circumduction the rating of 1 corre-sponds to approximately 1.0 logits. The logit is an interval-level unit of measurement that represents the log-odds ratioof the probability that an individual will successfully orunsuccessfully accomplish an item at a particular part of therating scale [23].
In order to demonstrate the application of the keyformfor clinical practice, we used the keyform scoring form con-structed in the Woodbury et al. Rasch analysis [29] to dis-play FMA-UE data from three patients with stroke enrolledin a separate prospective research study in our laboratory. Atotal of 55 participants were recruited from the database ofthe Brain Rehabilitation Research Center, a Department ofVeterans Affairs Rehabilitation Research and DevelopmentCenter of Excellence. Subjects were included in the study ifthey (1) had experienced a single, unilateral ischemic strokeat least 3 months prior; (2) demonstrated passive range ofmotion in affected shoulder, elbow, and wrist within func-tional limits; and (3) were 18 to 90 years of age. Potentialsubjects were excluded if they were unable to understandthree-step directions; had a demonstrated orthopedic condi-tion, pain, or impaired corrected vision that would alter thekinematics of reaching; or had experienced a brain stem orcerebellar stroke. All participants were administered theFMA-UE by trained evaluators according to standardizedprocedures outlined by Duncan et al. [30]. The sample wasdivided into three categories of upper-limb motor impair-ment (mild, moderate, severe) based on the aggregate FMA-UE score. Commonly used FMA-UE cutoff scores definedeach category: 0 to 20 severe, 21 to 50 moderate, and 51 to66 mild [33]. For the purposes of this article, one participantwas randomly selected from each impairment level.
RESULTS
Data from the three randomly selected individuals isdisplayed in Figures 2–4. The participant’s ratings for each
1215
VELOZO and WOODBURY. Translating measurement findings into rehabilitation practice
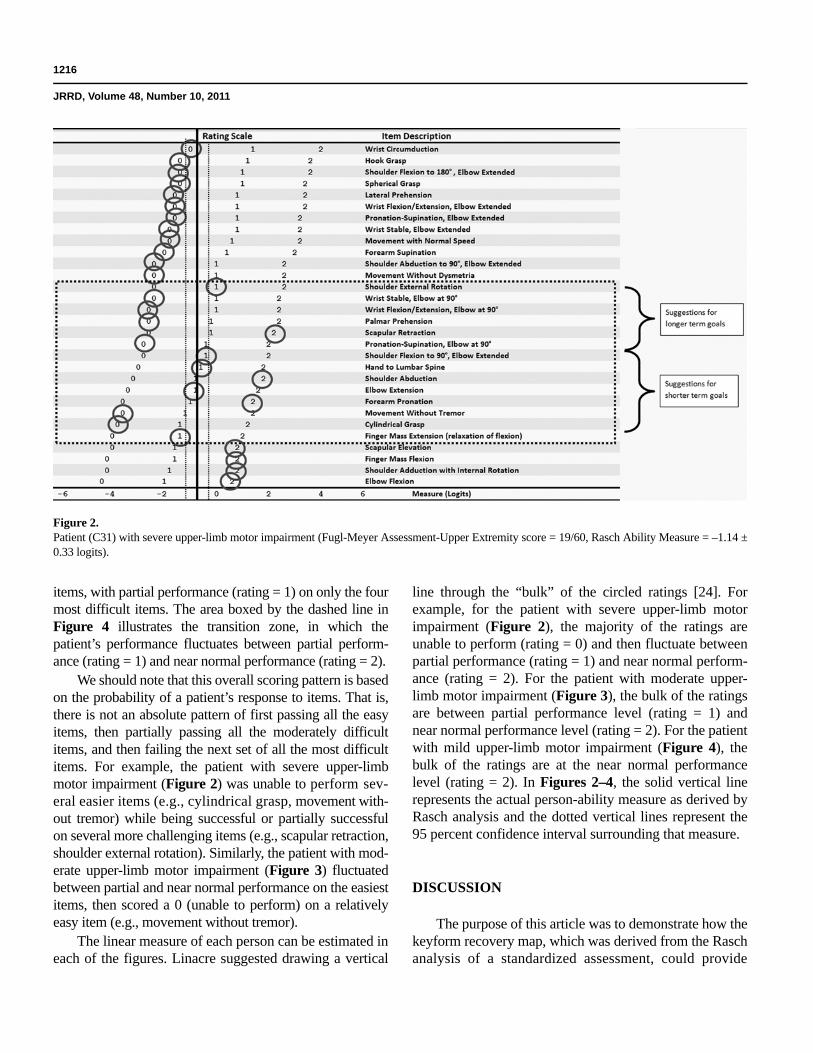
item were circled on the keyform. Figure 2, representingdata from a patient with severe upper-limb motor impair-ment (FMA-UE score 19/60), shows near normal perform-ance on the easiest items (bottom of figure), withprogressively poorer performance as the items becomemore difficult. That is, the patient receives a 2 (near normalperformance) on the four easiest items (elbow flexion,shoulder adduction with internal rotation, finger mass flex-ion, and scapular elevation) and a mixture of 0, 1, or 2 rat-ings (unable to perform, partial performance, and nearnormal performance, respectively) on the next 14 items(e.g., forearm pronation, elbow extension, and pronation/supination with elbow at 90°), and a 0 (unable to perform)on the 12 most difficult items (e.g., shoulder flexion to180°, hook grasp, and wrist circumduction). The areaboxed by the dashed line in Figure 2 illustrates the transi-tion zone, in which the patient’s performance fluctuatesbetween unable to perform (rating = 0), partial performance(rating = 1), and near normal performance (rating = 2).
It is important to note that decisions about where todraw the transition zone boundaries (i.e., edges of the dottedbox) are based on the pattern of the patient’s unique
responses to the items. The boundary reflects the point atwhich a patient begins to transition from one rating scalecategory to the next rating scale category. Since the rating ofany item is based on a probability, the edges of the transitionzone are equivocal. However, the overall response patternprovides the necessary information for treatment planning.
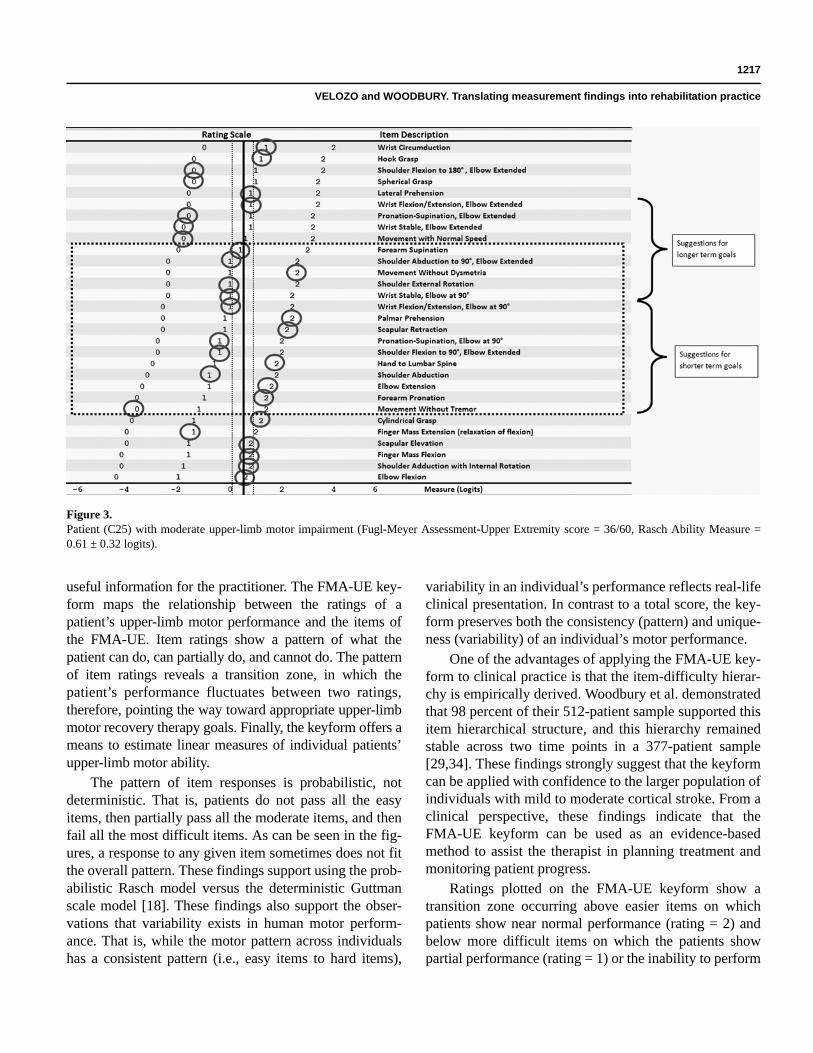
Figures 3–4 present data from patients with moderateand mild upper-limb motor impairment, respectively (Fig-ure 3: FMA-UE score 36/60, and Figure 4: FMA-UE score56/60). Relative to the “severe” patient (Figure 2), the indi-vidual with moderate upper-limb motor impairment (Fig-ure 3) shows near normal performance (rating = 2) on fiveof the six easiest items and partial performance (rating = 1)on four of the nine most difficult items. The area boxed bythe dashed line in Figure 3 (i.e., items from movementwithout tremor to forearm supination) illustrates the transi-tion zone, in which the patient’s performance fluctuatesbetween partial performance (rating = 1) and near normalperformance (rating = 2). Relative to both the severe andmoderate patients, the individual with mild upper-limbmotor impairment (Figure 4) shows near normal perform-ance (rating = 2) on the vast majority of the assessment
Figure 1.Keyform scoring form.
1216
JRRD, Volume 48, Number 10, 2011
items, with partial performance (rating = 1) on only the fourmost difficult items. The area boxed by the dashed line inFigure 4 illustrates the transition zone, in which thepatient’s performance fluctuates between partial perform-ance (rating = 1) and near normal performance (rating = 2).
We should note that this overall scoring pattern is basedon the probability of a patient’s response to items. That is,there is not an absolute pattern of first passing all the easyitems, then partially passing all the moderately difficultitems, and then failing the next set of all the most difficultitems. For example, the patient with severe upper-limbmotor impairment (Figure 2) was unable to perform sev-eral easier items (e.g., cylindrical grasp, movement with-out tremor) while being successful or partially successfulon several more challenging items (e.g., scapular retraction,shoulder external rotation). Similarly, the patient with mod-erate upper-limb motor impairment (Figure 3) fluctuatedbetween partial and near normal performance on the easiestitems, then scored a 0 (unable to perform) on a relativelyeasy item (e.g., movement without tremor).
The linear measure of each person can be estimated ineach of the figures. Linacre suggested drawing a vertical
line through the “bulk” of the circled ratings [24]. Forexample, for the patient with severe upper-limb motorimpairment (Figure 2), the majority of the ratings areunable to perform (rating = 0) and then fluctuate betweenpartial performance (rating = 1) and near normal perform-ance (rating = 2). For the patient with moderate upper-limb motor impairment (Figure 3), the bulk of the ratingsare between partial performance level (rating = 1) andnear normal performance level (rating = 2). For the patientwith mild upper-limb motor impairment (Figure 4), thebulk of the ratings are at the near normal performancelevel (rating = 2). In Figures 2–4, the solid vertical linerepresents the actual person-ability measure as derived byRasch analysis and the dotted vertical lines represent the95 percent confidence interval surrounding that measure.
DISCUSSION
The purpose of this article was to demonstrate how thekeyform recovery map, which was derived from the Raschanalysis of a standardized assessment, could provide
Figure 2.Patient (C31) with severe upper-limb motor impairment (Fugl-Meyer Assessment-Upper Extremity score = 19/60, Rasch Ability Measure = –1.14 ±0.33 logits).
1217
VELOZO and WOODBURY. Translating measurement findings into rehabilitation practice
useful information for the practitioner. The FMA-UE key-form maps the relationship between the ratings of apatient’s upper-limb motor performance and the items ofthe FMA-UE. Item ratings show a pattern of what thepatient can do, can partially do, and cannot do. The patternof item ratings reveals a transition zone, in which thepatient’s performance fluctuates between two ratings,therefore, pointing the way toward appropriate upper-limbmotor recovery therapy goals. Finally, the keyform offers ameans to estimate linear measures of individual patients’upper-limb motor ability.
The pattern of item responses is probabilistic, notdeterministic. That is, patients do not pass all the easyitems, then partially pass all the moderate items, and thenfail all the most difficult items. As can be seen in the fig-ures, a response to any given item sometimes does not fitthe overall pattern. These findings support using the prob-abilistic Rasch model versus the deterministic Guttmanscale model [18]. These findings also support the obser-vations that variability exists in human motor perform-ance. That is, while the motor pattern across individualshas a consistent pattern (i.e., easy items to hard items),
variability in an individual’s performance reflects real-lifeclinical presentation. In contrast to a total score, the key-form preserves both the consistency (pattern) and unique-ness (variability) of an individual’s motor performance.
One of the advantages of applying the FMA-UE key-form to clinical practice is that the item-difficulty hierar-chy is empirically derived. Woodbury et al. demonstratedthat 98 percent of their 512-patient sample supported thisitem hierarchical structure, and this hierarchy remainedstable across two time points in a 377-patient sample[29,34]. These findings strongly suggest that the keyformcan be applied with confidence to the larger population ofindividuals with mild to moderate cortical stroke. From aclinical perspective, these findings indicate that theFMA-UE keyform can be used as an evidence-basedmethod to assist the therapist in planning treatment andmonitoring patient progress.
Ratings plotted on the FMA-UE keyform show atransition zone occurring above easier items on whichpatients show near normal performance (rating = 2) andbelow more difficult items on which the patients showpartial performance (rating = 1) or the inability to perform
Figure 3.Patient (C25) with moderate upper-limb motor impairment (Fugl-Meyer Assessment-Upper Extremity score = 36/60, Rasch Ability Measure =0.61 ± 0.32 logits).

1218
JRRD, Volume 48, Number 10, 2011
(rating = 0). This transition zone can be the basis for goalsetting and treatment planning. Because items in the tran-sition zone are at the “just right challenge” level for theindividual, the position of items in relationship to thiszone reflect the patient’s expected next steps in the post-stroke upper-limb motor recovery process. Motor behav-iors (items) within the transition zone may suggestappropriate shorter term functional goals, while motorbehaviors (items) above the transition zone may form thefoundation for appropriate longer term functional goals.
For example, in Figure 3, the patient is transitioningbetween partial and near normal ability for motor behav-iors (items) such as elbow extension, shoulder flexion to90° with elbow extended, and shoulder external rotation.Reasonable short-term goals would be directed at func-tional activities involving reaching away from the body,such as bathing (washing/drying body parts), dressing(obtaining clothing from storage area), and/or job perform-ance (completing work-related desktop activities).
Figure 3 shows that this patient is having more diffi-culty with shoulder abduction to 90° with elbow extended,wrist flexion/extension with elbow extended, and wrist cir-
cumduction. Reasonable long-term goals would be directedat functional activities involving more extreme reach andthe coordinated use of multiple joints, such as dressing (fas-tening and adjusting clothing and shoes), home manage-ment (yard/garden work), and shopping (selecting andpurchasing items). These treatment goals are by no meansintended to be exhaustive. In the hands of an innovativerehabilitation therapist with excellent task-analysis skills,the keyform can provide a framework for myriad patient-tailored goals.
While the ideal of research is to translate findings intopractice, this lofty goal is often inhibited by the scientificmethods available. Rasch methodologies present an inno-vative way to think about our standardized assessments.For the first time, a methodology is available that connectsassessment scores and ratings to the qualitative content ofan instrument. This connection not only allows us toreevaluate traditional expectations of poststroke upper-limb recovery but also maps recovery as a progression ofitem difficulties. A premise of this article is that stand-ardized assessments have offered the practicing therapistlittle benefit for making day-to-day clinical practice
Figure 4.Patient (C17) with mild upper-limb motor impairment (Fugl-Meyer Assessment-Upper Extremity score = 56/60, Rasch Ability Measure = 3.55 ±0.55 logits).

1219
VELOZO and WOODBURY. Translating measurement findings into rehabilitation practice
decisions. The keyform recovery map provides a frame-work to facilitate goal setting and treatment planning byrestructuring the assessment using Rasch analysis. Effortssuch as these may show promise for closing the gapbetween research and practice in rehabilitation.
LIMITATIONS
There are several limitations to this study. First,regarding instantaneous measurement, as proposed byLinacre and Kielhofner et al., keyforms have considerableerror in determining person measures, especially for indi-viduals at the extremes of the distribution. For example,for the individual with mild upper-limb motor impairment(Figure 4), using Linacre’s suggestion for determining aperson’s measure [24] by placing a vertical line throughthe “bulk” of the responses, the rater would likely placethe vertical line to the left of the actual measure (left of thevertical line depicted in the figure), possibly outside of the95 percent confidence interval (dotted vertical lines). Thisimprecision of the keyform is a function of increased errorat the extremes of the instrument (i.e., at the ceiling andfloor), especially when attempting to measure individualsof very high or very low ability. Relative to the individualdepicted in Figure 4, if the instrument had more difficultitems (i.e., items for which the individual showed partialperformance), a more accurate placement of the verticalline and determination of the individual’s measure couldbe achieved.
In addition, as with all statistical values, the location ofthe demarcations of the transition zone and decisions forshorter term and longer term goals is imprecise (i.e., can-not be specified to an individual item on the item hierar-chy). Moreover, the previous suggestions for interventionsare hypothetical. That is, these suggested interventionshave not been applied to clinical populations within clini-cal practice. A promising clinical study would be to deter-mine whether an intervention generated through keyformsis more or less effective than traditionally derived clinicalinterventions.
CONCLUSIONS
In summary, keyforms provide an innovative way toimmediately apply the findings from a standardizedassessment to clinical practice. This methodology incor-
porates evidence-based practice (e.g., empirically derivedFMA-UE item-difficulty hierarchy) with state-of-the-artmeasurement theory (i.e., IRT). We should note that thedemonstration given here is not intended to suggest thatclinically useful keyforms can be generated from anyassessment. The FMA-UE is a well-developed, psycho-metrically sound instrument that supports a logical item-difficulty hierarchy. Standardized assessments with thesecharacteristics, or that are designed with these character-istics in mind, should serve as candidates for creatingkeyforms that will support day-to-day clinical practice.
CLINICAL MESSAGE
• Evaluation forms, such as keyforms, may assist thera-pists in making day-to-day clinical decisions.
• Keyforms can be created using IRT statistical meth-ods, which connect the score to patients’ performanceon specific items.
• Well-developed standardized assessments, especiallythose with a logical item-difficulty structure, may bepromising candidates for generating keyforms.
ACKNOWLEDGMENTS
Author Contributions:
Study concept and design: C. A. Velozo, M. L. Woodbury.
Acquisition of data: M. L. Woodbury.
Analysis and interpretation of data: C. A. Velozo, M. L. Woodbury.
Drafting of manuscript: C. A. Velozo, M. L. Woodbury.
Critical revision of manuscript for important intellectual content: C. A. Velozo, M. L. Woodbury.
Statistical analysis: M. L. Woodbury.
Obtained funding: M. L. Woodbury.
Financial Disclosures: The authors have declared that no competing interests exist.
Funding/Support: This material is based on work supported by the Department of Veterans Affairs, Veterans Health Administration, Office of Research and Development, Rehabilitation Research and Development Service, Career Development-2 Award (project B6332W), principal investigator Michelle L. Woodbury.
Institutional Review: The protocol for the study was approved by the University of Florida Institutional Review Board and was conducted in a manner that conformed to the approved protocol.
Participant Follow-Up: The authors do not plan to notify participants of the publication of this study because of a lack of contact information.
1220
JRRD, Volume 48, Number 10, 2011
REFERENCES
1. American Physical Therapy Association. Guide to physicaltherapist practice. Second edition. American Physical Ther-apy Association. Phys Ther. 2001;81(1):9–746.[PMID: 11175682]
2. Occupational therapy practice framework: Domain andprocess. Am J Occup Ther. 2002;56(6):609–39.[PMID: 12458855]http://dx.doi.org/10.5014/ajot.56.6.609
3. Sackett DL, Rosenberg WM, Gray JA, Haynes RB, Rich-ardson WS. Evidence based medicine: What it is and whatit isn’t. BMJ. 1996;312(7023):71–72. [PMID: 8555924]
4. Salter K, Jutai JW, Teasell R, Foley NC, Bitensky J, BayleyM. Issues for selection of outcome measures in stroke reha-bilitation: ICF activity. Disabil Rehabil. 2005;27(6):315–40.[PMID: 16040533]http://dx.doi.org/10.1080/09638280400008545
5. Bennett S, Bennett JW. The process of evidence-based prac-tice in occupational therapy: Informing clinical decisions.Aust Occup Ther J. 2000;47(4):171–80.http://dx.doi.org/10.1046/j.1440-1630.2000.00237.x
6. Law M. Evidence-based rehabilitation: A guide to practice.Thorofare (NJ): Slack; 2002.
7. Menon-Nair A, Korner-Bitensky N, Wood-Dauphinee S,Robertson E. Assessment of unilateral spatial neglect poststroke in Canadian acute care hospitals: Are we neglectingneglect? Clin Rehabil. 2006;20(7):623–34.[PMID: 16894806]http://dx.doi.org/10.1191/0269215506cr974oa
8. Menon-Nair A, Korner-Bitensky N, Ogourtsova T. Occupa-tional therapists’ identification, assessment, and treatmentof unilateral spatial neglect during stroke rehabilitation inCanada. Stroke. 2007;38(9):2556–62. [PMID: 17673707]http://dx.doi.org/10.1161/STROKEAHA.107.484857
9. Holmqvist K, Kamwendo K, Ivarsson AB. Occupationaltherapists’ descriptions of their work with persons suffer-ing from cognitive impairment following acquired braininjury. Scand J Occup Ther. 2009;16(1):13–24.[PMID: 18609240]http://dx.doi.org/10.1080/11038120802123520
10. Abrams D, Davidson M, Harrick J, Harcourt P, Zylinski M,Clancy J. Monitoring the change: Current trends in out-come measure usage in physiotherapy. Man Ther. 2006;11(1):46–53. [PMID: 15886046]http://dx.doi.org/10.1016/j.math.2005.02.003
11. Kay T, Myers A, Huijbregts M. How far have we comesince 1992? A comparative survey of physiotherapists’ useof outcome measures. Physiother Can. 2001;53:268–75.
12. Torenbeek M, Caulfield B, Garrett M, Van Harten W. Cur-rent use of outcome measures for stroke and low back painrehabilitation in five European countries: First results of the
ACROSS project. Int J Rehabil Res. 2001;24(2):95–101.[PMID: 11421397]http://dx.doi.org/10.1097/00004356-200106000-00002
13. Corcoran M. Defining and measuring constructs. Am JOccup Ther. 2007;61(1):7–8.
14. Thurstone LL. A method of scaling psychological and edu-cational tests. J Education Psychol. 1925;16(7):433–51.http://dx.doi.org/10.1037/h0073357
15. Thurstone LL. The scoring of individual performance. J Edu-cation Psychol. 1926;17(7):446–57.http://dx.doi.org/10.1037/h0075125
16. Bezruczko N. Faulty thinking by educational researchers.Rasch Meas Trans. 1990;4(3):114–15.
17. Hambleton RK, Jones RW. Comparison of classical test theoryand item response theory and their applications to test devel-opment. Education Meas Issues Prac. 1993;12(3):38–47.http://dx.doi.org/10.1111/j.1745-3992.1993.tb00543.x
18. Nunnally JC, Bernstein IH. Psychometric theory. 3rd ed.New York (NY): McGraw-Hill; 1994.
19. Fayers PM. Applying item response theory and computeradaptive testing: The challenges for health outcomesassessment. Qual Life Res. 2007;16 Suppl 1:187–94.[PMID: 17417722]http://dx.doi.org/10.1007/s11136-007-9197-1
20. Jette AM, Haley SM. Contemporary measurement tech-niques for rehabilitation outcomes assessment. J RehabilMed. 2005;37(6):339–45. [PMID: 16287664]http://dx.doi.org/10.1080/16501970500302793
21. Reise SP, Waller NG. Item response theory and clinicalmeasurement. Annu Rev Clin Psychol. 2009;5:27–48.[PMID: 18976138]http://dx.doi.org/10.1146/annurev.clinpsy.032408.153553
22. Velozo CA, Kielhofner G, Lai JS. The use of Rasch analy-sis to produce scale-free measurement of functional ability.Am J Occup Ther. 1999;53(1):83–90. [PMID: 9926224]
23. Wright BD, Stone MH. Best test design. Chicago (IL):Mesa Press; 1979.
24. Linacre JM. Instantaneous measurement and diagnosis. In:Smith RM, editor. Physical medicine and rehabilitationstate of the art reviews. Vol 11: Outcome measurement.Philadelphia (PA): Hanley & Belfus; 1997. p. 315–24.
25. Winsteps Rasch measurement computer program [computerprogram]. Version 3.61.2. Chicago (IL): Winsteps.com;2006.
26. Kielhofner G, Dobria L, Forsyth K, Basu S. The construc-tion of keyforms for obtaining instantaneous measuresfrom the Occupational Performance History Interview rat-ing scales. OJTR. 2005;25(1):(23–32).
27. Bode RK, Heinemann AW, Semik P. Measurement propertiesof the Galveston Orientation and Amnesia Test (GOAT) andimprovement patterns during inpatient rehabilitation. J Head
1221
VELOZO and WOODBURY. Translating measurement findings into rehabilitation practice
Trauma Rehabil. 2000;15(1):637–55. [PMID: 10745181]http://dx.doi.org/10.1097/00001199-200002000-00004
28. Avery LM, Russell DJ, Raina PS, Walter SD, RosenbaumPL. Rasch analysis of the Gross Motor Function Measure:Validating the assumptions of the Rasch model to create aninterval-level measure. Arch Phys Med Rehabil. 2003;84(5):697–705. [PMID: 12736885]
29. Woodbury ML, Velozo CA, Richards LG, Duncan PW,Studenski S, Lai SM. Dimensionality and construct validityof the Fugl-Meyer Assessment of the upper extremity. ArchPhys Med Rehabil. 2007;88(6):715–23. [PMID: 17532892]http://dx.doi.org/10.1016/j.apmr.2007.02.036
30. Duncan PW, Propst M, Nelson SG. Reliability of the Fugl-Meyer Assessment of sensorimotor recovery followingcerebrovascular accident. Phys Ther. 1983;63(10):1606–10.[PMID: 6622535]
31. Gladstone DJ, Danells CJ, Black SE. The Fugl-MeyerAssessment of motor recovery after stroke: A critical reviewof its measurement properties. Neurorehabil Neural Repair.2002;16(3):232–40. [PMID: 12234086]http://dx.doi.org/10.1177/154596802401105171
32. Van Wijck FM, Pandyan AD, Johnson GR, Barnes MP.Assessing motor deficits in neurological rehabilitation: Pat-terns of instrument usage. Neurorehabil Neural Repair. 2001;15(1):23–30. [PMID: 11527276]http://dx.doi.org/10.1177/154596830101500104
33. Fugl-Meyer AR, Jääskö L, Leyman I, Olsson S, Steglind S.The post-stroke hemiplegic patient. 1. A method for evalua-tion of physical performance. Scand J Rehabil Med. 1975;7(1):13–31. [PMID: 1135616]
34. Woodbury ML, Velozo CA, Richards LG, Duncan PW,Studenski S, Lai SM. Longitudinal stability of the Fugl-Meyer Assessment of the upper extremity. Arch Phys MedRehabil. 2008;89(8):1563–69. [PMID: 18674991]http://dx.doi.org/10.1016/j.apmr.2007.12.041
Submitted for publication October 20, 2010. Accepted inrevised form April 4, 2011.
This article and any supplementary material should becited as follows:Velozo CA, Woodbury ML. Translating measurementfindings into rehabilitation practice: An example usingFugl-Myer Assessment-Upper Extremity with patients fol-lowing stroke. J Rehabil Res Dev. 2011;48(10):1211–22.DOI:10.1682/JRRD.2010.10.0203
ResearcherID: Craig A. Velozo, PhD, OTR/L: G-4908-2011
